Embed Size (px)
Citation preview
ISO 50001 Energy Management System Case Study
Republic of China (Taiwan)
1
2020
Far EasTone Telecommunications The best practitioner for energy management--the energy consumption of the headquarter has decreased for 9 consecutive years, with a cumulative energy efficiency ratio of 48%.
Far EasTone Telecom Headquarters (Office/IDC)
Organization Profile & Business Case
Far EasTone (FET) is the third-largest
telecommunications company in Taiwan. It provides
high-quality mobile and fixed communication network
services and has about 7.177 million customers with a
market share of about 24.5%. Since its establishment,
FET has strived to close the gap between people to
achieve the objective of "Closing the Distance." To follow
the international sustainable trend and correspond to
the United Nations Sustainable Development Goals
(SDGs), FET establishes the "Sustainability Strategic
Blueprint for 2018-2025," aiming at strengthening social
tolerance and contributing to the environment and
sustainability with its advantages of information and
communications.
Energy Strategy - FET understands that in the course of
business operation, risks and opportunities to the
ecological environment and energy supply may be
brought. Therefore, we have introduced energy and
environmental management system, exerting industrial
influence from the perspective of the life cycle of
telecom services. Together with our customers, suppliers,
and contractors, we improve energy performance,
promote pollution prevention, reduce greenhouse gas
emissions, and slow or adapt to climate change.
As technology advances in each generation, the telecom
industry's power density has grown exponentially. Since
the release of ISO50001 in Y2011, we have quickly
integrated the existing energy management system
(EnMS) and set strategic goals to become the world's first
telecom company with headquarters and equipment
room both passing external verification. Also, we
expanded and updated the EnMS in 2016 and 2018
Case Study Snapshot
Industry Telecommunications
Product/Service Telecommunication products sales service, telecommunications and IDC (international data center) operation service and office operation.
Location Taiwan, R.O.C.
Energy management system ISO 50001
Energy performance improvement period, in years
9 years (Y2011~Y2019)
Energy Performance Improvement (%) over improvement period
11%
Total energy cost savings over improvement period
$USD 2,700,000
Cost to implement EnMS $USD 1,162,000
Total Energy Savings over improvement period
109,064 (GJ)
Total CO2-e emission reduction over improvement period
6,900 (Metric tons)
2
Global Energy Management System Implementation: Case Study
Republic of China (Taiwan)
2020
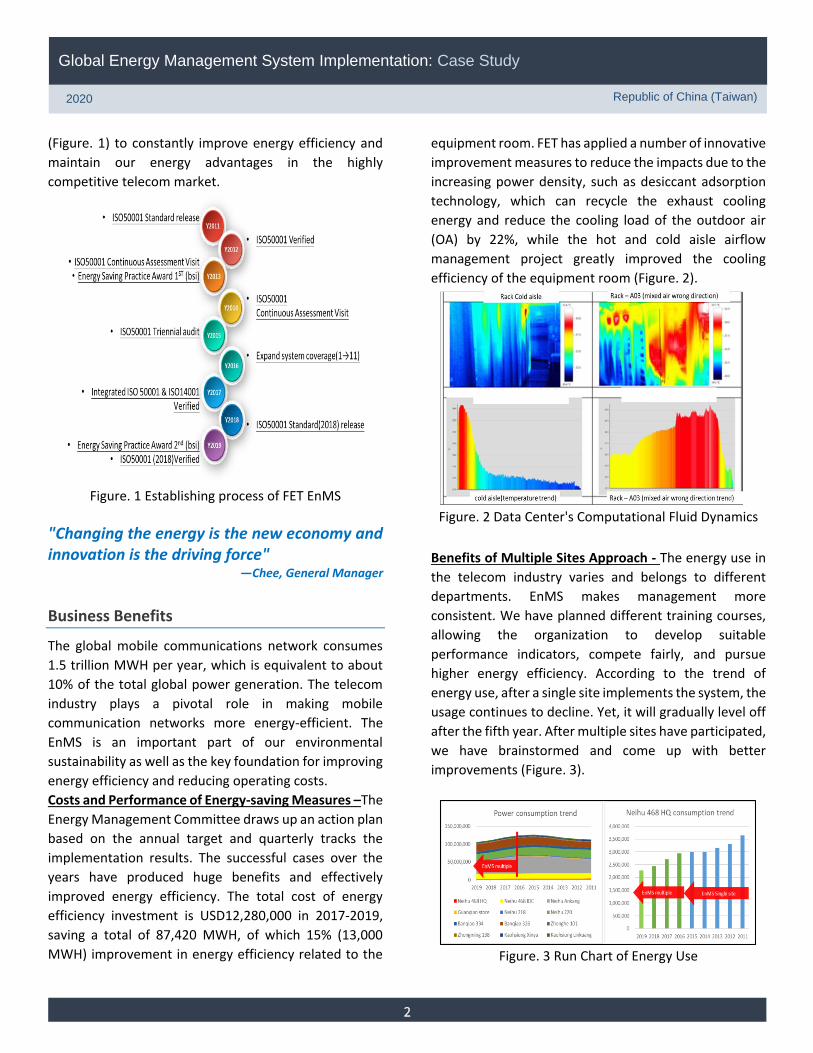
(Figure. 1) to constantly improve energy efficiency and
maintain our energy advantages in the highly
competitive telecom market.
Figure. 1 Establishing process of FET EnMS
"Changing the energy is the new economy and innovation is the driving force"
—Chee, General Manager
Business Benefits
The global mobile communications network consumes
1.5 trillion MWH per year, which is equivalent to about
10% of the total global power generation. The telecom
industry plays a pivotal role in making mobile
communication networks more energy-efficient. The
EnMS is an important part of our environmental
sustainability as well as the key foundation for improving
energy efficiency and reducing operating costs.
Costs and Performance of Energy-saving Measures –The
Energy Management Committee draws up an action plan
based on the annual target and quarterly tracks the
implementation results. The successful cases over the
years have produced huge benefits and effectively
improved energy efficiency. The total cost of energy
efficiency investment is USD12,280,000 in 2017-2019,
saving a total of 87,420 MWH, of which 15% (13,000
MWH) improvement in energy efficiency related to the
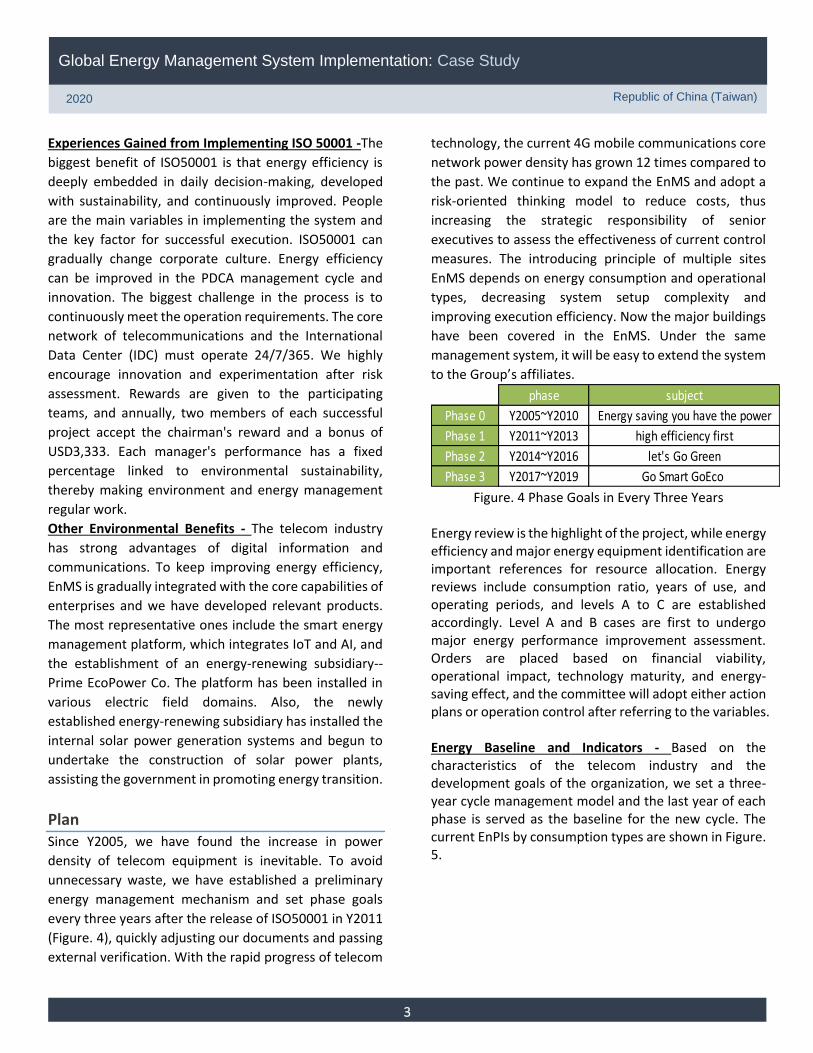
equipment room. FET has applied a number of innovative
improvement measures to reduce the impacts due to the
increasing power density, such as desiccant adsorption
technology, which can recycle the exhaust cooling
energy and reduce the cooling load of the outdoor air
(OA) by 22%, while the hot and cold aisle airflow
management project greatly improved the cooling
efficiency of the equipment room (Figure. 2).
Figure. 2 Data Center's Computational Fluid Dynamics
Benefits of Multiple Sites Approach - The energy use in
the telecom industry varies and belongs to different
departments. EnMS makes management more
consistent. We have planned different training courses,
allowing the organization to develop suitable
performance indicators, compete fairly, and pursue
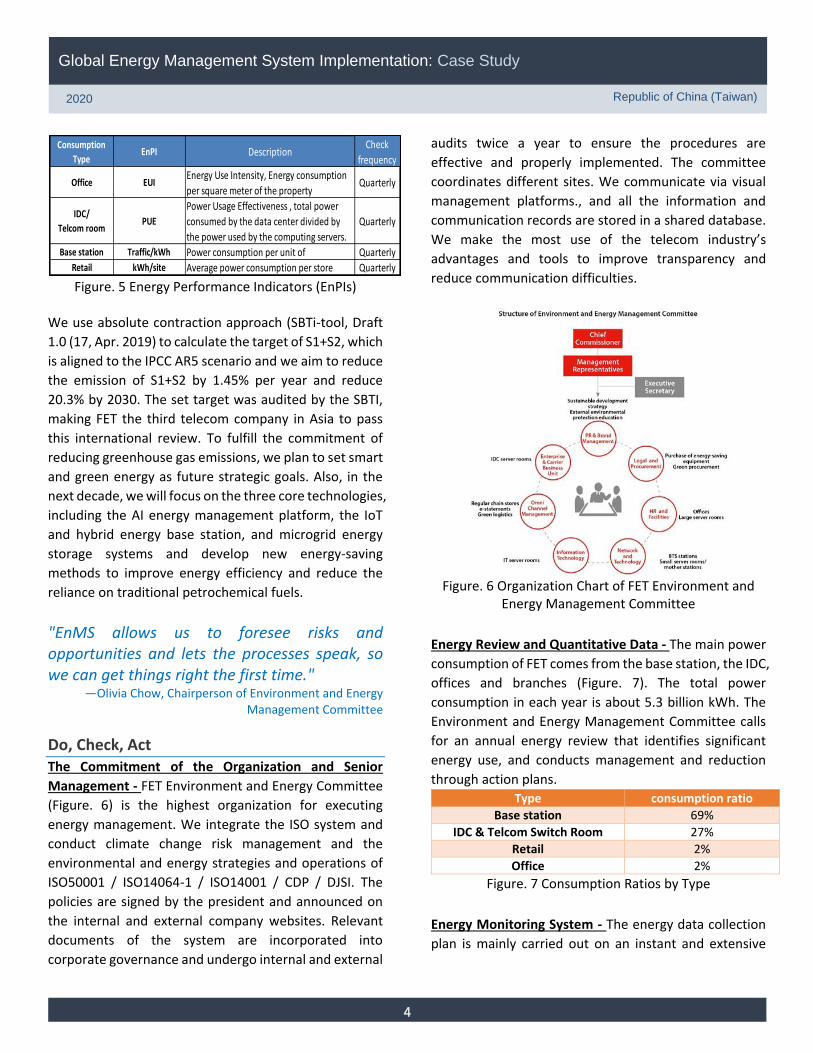
higher energy efficiency. According to the trend of
energy use, after a single site implements the system, the
usage continues to decline. Yet, it will gradually level off
after the fifth year. After multiple sites have participated,
we have brainstormed and come up with better
improvements (Figure. 3).
Figure. 3 Run Chart of Energy Use
3
Global Energy Management System Implementation: Case Study
Republic of China (Taiwan)
2020
Experiences Gained from Implementing ISO 50001 -The
biggest benefit of ISO50001 is that energy efficiency is
deeply embedded in daily decision-making, developed
with sustainability, and continuously improved. People
are the main variables in implementing the system and
the key factor for successful execution. ISO50001 can
gradually change corporate culture. Energy efficiency
can be improved in the PDCA management cycle and
innovation. The biggest challenge in the process is to
continuously meet the operation requirements. The core
network of telecommunications and the International
Data Center (IDC) must operate 24/7/365. We highly
encourage innovation and experimentation after risk
assessment. Rewards are given to the participating
teams, and annually, two members of each successful
project accept the chairman's reward and a bonus of
USD3,333. Each manager's performance has a fixed
percentage linked to environmental sustainability,
thereby making environment and energy management
regular work.
Other Environmental Benefits - The telecom industry
has strong advantages of digital information and
communications. To keep improving energy efficiency,
EnMS is gradually integrated with the core capabilities of
enterprises and we have developed relevant products.
The most representative ones include the smart energy
management platform, which integrates IoT and AI, and
the establishment of an energy-renewing subsidiary--
Prime EcoPower Co. The platform has been installed in
various electric field domains. Also, the newly
established energy-renewing subsidiary has installed the
internal solar power generation systems and begun to
undertake the construction of solar power plants,
assisting the government in promoting energy transition.
Plan Since Y2005, we have found the increase in power
density of telecom equipment is inevitable. To avoid
unnecessary waste, we have established a preliminary
energy management mechanism and set phase goals
every three years after the release of ISO50001 in Y2011
(Figure. 4), quickly adjusting our documents and passing
external verification. With the rapid progress of telecom
technology, the current 4G mobile communications core
network power density has grown 12 times compared to
the past. We continue to expand the EnMS and adopt a
risk-oriented thinking model to reduce costs, thus
increasing the strategic responsibility of senior
executives to assess the effectiveness of current control
measures. The introducing principle of multiple sites
EnMS depends on energy consumption and operational
types, decreasing system setup complexity and
improving execution efficiency. Now the major buildings
have been covered in the EnMS. Under the same
management system, it will be easy to extend the system
to the Group’s affiliates.
Figure. 4 Phase Goals in Every Three Years
Energy review is the highlight of the project, while energy efficiency and major energy equipment identification are important references for resource allocation. Energy reviews include consumption ratio, years of use, and operating periods, and levels A to C are established accordingly. Level A and B cases are first to undergo major energy performance improvement assessment. Orders are placed based on financial viability, operational impact, technology maturity, and energy-saving effect, and the committee will adopt either action plans or operation control after referring to the variables. Energy Baseline and Indicators - Based on the characteristics of the telecom industry and the development goals of the organization, we set a three-year cycle management model and the last year of each phase is served as the baseline for the new cycle. The current EnPIs by consumption types are shown in Figure. 5.
phase subject
Phase 0 Y2005~Y2010 Energy saving you have the power
Phase 1 Y2011~Y2013 high efficiency first
Phase 2 Y2014~Y2016 let's Go Green
Phase 3 Y2017~Y2019 Go Smart GoEco
4
Global Energy Management System Implementation: Case Study
Republic of China (Taiwan)
2020
Figure. 5 Energy Performance Indicators (EnPIs)
We use absolute contraction approach (SBTi-tool, Draft
1.0 (17, Apr. 2019) to calculate the target of S1+S2, which
is aligned to the IPCC AR5 scenario and we aim to reduce
the emission of S1+S2 by 1.45% per year and reduce
20.3% by 2030. The set target was audited by the SBTI,
making FET the third telecom company in Asia to pass
this international review. To fulfill the commitment of
reducing greenhouse gas emissions, we plan to set smart
and green energy as future strategic goals. Also, in the
next decade, we will focus on the three core technologies,
including the AI energy management platform, the IoT
and hybrid energy base station, and microgrid energy
storage systems and develop new energy-saving
methods to improve energy efficiency and reduce the
reliance on traditional petrochemical fuels.
"EnMS allows us to foresee risks and opportunities and lets the processes speak, so we can get things right the first time."
—Olivia Chow, Chairperson of Environment and Energy Management Committee
Do, Check, Act The Commitment of the Organization and Senior
Management - FET Environment and Energy Committee
(Figure. 6) is the highest organization for executing
energy management. We integrate the ISO system and
conduct climate change risk management and the
environmental and energy strategies and operations of
ISO50001 / ISO14064-1 / ISO14001 / CDP / DJSI. The
policies are signed by the president and announced on
the internal and external company websites. Relevant
documents of the system are incorporated into
corporate governance and undergo internal and external
audits twice a year to ensure the procedures are
effective and properly implemented. The committee
coordinates different sites. We communicate via visual
management platforms., and all the information and
communication records are stored in a shared database.
We make the most use of the telecom industry’s
advantages and tools to improve transparency and
reduce communication difficulties.
Figure. 6 Organization Chart of FET Environment and
Energy Management Committee
Energy Review and Quantitative Data - The main power
consumption of FET comes from the base station, the IDC,
offices and branches (Figure. 7). The total power
consumption in each year is about 5.3 billion kWh. The
Environment and Energy Management Committee calls
for an annual energy review that identifies significant
energy use, and conducts management and reduction
through action plans.
Type consumption ratio
Base station 69%
IDC & Telcom Switch Room 27%
Retail 2%
Office 2%
Figure. 7 Consumption Ratios by Type
Energy Monitoring System - The energy data collection
plan is mainly carried out on an instant and extensive
Consumption
TypeEnPI Description
Check
frequency
Office EUIEnergy Use Intensity, Energy consumption
per square meter of the propertyQuarterly
IDC/
Telcom roomPUE
Power Usage Effectiveness , total power
consumed by the data center divided by
the power used by the computing servers.
Quarterly
Base station Traffic/kWh Power consumption per unit of QuarterlyRetail kWh/site Average power consumption per store Quarterly

5
Global Energy Management System Implementation: Case Study
Republic of China (Taiwan)
2020
energy monitoring system platform, which can reduce
manpower and improve accuracy. In addition to data
collection, the platform also has implemented a
considerable degree of artificial intelligence. With the
parameter model obtained through data analysis, the
platform can actively control the air-conditioning
equipment to improve energy efficiency, as shown in
Figure. 8. Through the Open Platform Communications
interface, we can easily connect with supervisory
computers at different sites, access to requisite
information, and incorporate it into the headquarter’s
EnMS.
Figure. 8 Energy Monitoring System
Key Activities for Improving Energy Performance - FET
has invested in many energy efficiency improvement
programs over the years (Figure. 9). We analyze various
consumption types, determine priorities through energy
reviews, and make the most use of resources. One
particularly successful project - the decommissioned and
inefficient equipment cleaning action plan - won the best
case of the year in the Group. According to McKinsey and
Company, utilization of servers in business and
enterprise data centers “rarely exceeds 6%” (i.e., they
deliver no more than six percent of their maximum
computing output on average over the course of the year)
and up to 30% of servers are comatose– using electricity
but delivering no useful information services. The
Environment and Energy Management Committee
makes the action plans and formulates a clean-up project.
Through investigation, discussion, and implementation,
the clean-up of the equipment that delivers zero or low
services or that can be integrated but is in power
transmission is reduced by a total of 241 KW, saving 2.1
million kWh (21MWH) of electricity a year.
Figure. 9 Major Energy-saving Measures of FET by
Consumption Types
Implementation of Energy Performance Indicators -
With FET's improvement for 9 consecutive years, the
latest EnPI (Y2017-Y2019) shows that the four targets of
Office, IDC/ Telcom switch room/ base station, and Retail
have all been fulfilled, indicating that our system has very
significant effects on the improvement of energy
efficiency in various industries, as shown in Figure. 10.
Figure. 10 Implementation of EnPIs
Third-party Verification of Energy Performance
Improvement - We value the correctness of energy-
saving results and the variables, which are reviewed
yearly. When energy performance indicators deviate, the
project leader initiates changes. New indicators need to
undergo regression analysis and the review of its
normality, independence, and homoscedasticity. Also, it
can only be changed with the consent of the committee.
Relevant energy performance improvement data is
confirmed not only through internal audits but also
through annual external audits performed by third
parties. Important projects are entrusted to Taiwanese
consulting institutions such as Taiwan Green Productivity
Foundation for measurement and verification (M&V).
Communication and Training - FET value communication
with employees or relevant groups. Effective
communication can establish transparency in energy
management, promote successful operation of the
Consumption
Typemeasures
saving
benefits
Office1. AI Energy Management Platform
2.Adsorption dehumidification systemMedium
IDC/Telcom
room
1. Frequency Magnetic Centrifugal Chiller
2.Hot and cold aisle airflow projectHigh
Base station1.Free coling project
2.High efficiency power supply replacementHigh
Retail1.Automatic induction switch system
2.Smart Energy Management PlatformLow
Phase 0
2005~2010
Consumption
TypeEnPI saving 1% Target Actual Target Actual Target Actual
Office EUI v 15.00% 16.50% 5.00% 8.22% 4.50% 4.65%
IDC/
Telcom roomPUE v 4.50% 5.84% 5.00% 6.10% 3.00% 3.67%
Base station Traffic/kWh NA NA NA 1.50% -1.61% 10.00% 17.17%
Retail kWh/site NA NA NA 1.50% 1.78% 10.00% 15.98%
"+ "= saving EnPI renew
Phase 1 Phase 2 Phase 3
Y2011~Y2013 Y2014~Y2016 Y2017~Y2019
6
Global Energy Management System Implementation: Case Study
Republic of China (Taiwan)
2020
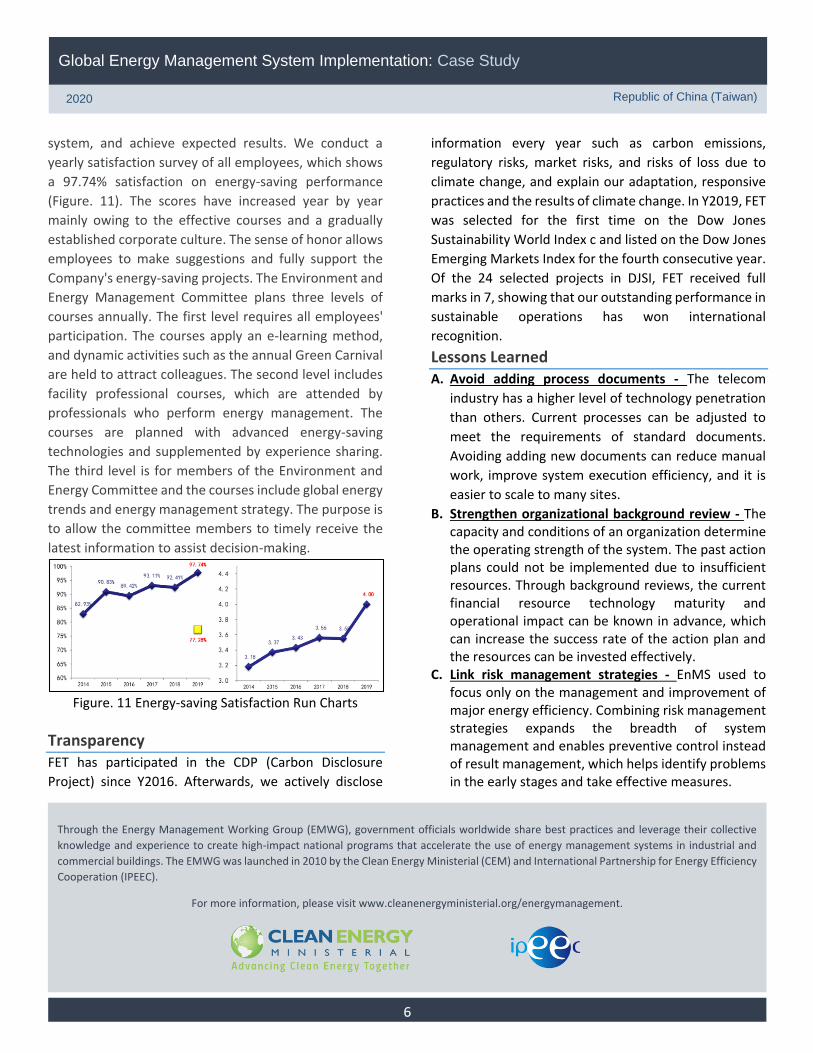
system, and achieve expected results. We conduct a
yearly satisfaction survey of all employees, which shows
a 97.74% satisfaction on energy-saving performance
(Figure. 11). The scores have increased year by year
mainly owing to the effective courses and a gradually
established corporate culture. The sense of honor allows
employees to make suggestions and fully support the
Company's energy-saving projects. The Environment and
Energy Management Committee plans three levels of
courses annually. The first level requires all employees'
participation. The courses apply an e-learning method,
and dynamic activities such as the annual Green Carnival
are held to attract colleagues. The second level includes
facility professional courses, which are attended by
professionals who perform energy management. The
courses are planned with advanced energy-saving
technologies and supplemented by experience sharing.
The third level is for members of the Environment and
Energy Committee and the courses include global energy
trends and energy management strategy. The purpose is
to allow the committee members to timely receive the
latest information to assist decision-making.
Figure. 11 Energy-saving Satisfaction Run Charts
Transparency FET has participated in the CDP (Carbon Disclosure
Project) since Y2016. Afterwards, we actively disclose
information every year such as carbon emissions,
regulatory risks, market risks, and risks of loss due to
climate change, and explain our adaptation, responsive
practices and the results of climate change. In Y2019, FET
was selected for the first time on the Dow Jones
Sustainability World Index c and listed on the Dow Jones
Emerging Markets Index for the fourth consecutive year.
Of the 24 selected projects in DJSI, FET received full
marks in 7, showing that our outstanding performance in
sustainable operations has won international
recognition.
Lessons Learned A. Avoid adding process documents - The telecom
industry has a higher level of technology penetration
than others. Current processes can be adjusted to
meet the requirements of standard documents.
Avoiding adding new documents can reduce manual
work, improve system execution efficiency, and it is
easier to scale to many sites.
B. Strengthen organizational background review - The capacity and conditions of an organization determine the operating strength of the system. The past action plans could not be implemented due to insufficient resources. Through background reviews, the current financial resource technology maturity and operational impact can be known in advance, which can increase the success rate of the action plan and the resources can be invested effectively.
C. Link risk management strategies - EnMS used to focus only on the management and improvement of major energy efficiency. Combining risk management strategies expands the breadth of system management and enables preventive control instead of result management, which helps identify problems in the early stages and take effective measures.
Through the Energy Management Working Group (EMWG), government officials worldwide share best practices and leverage their collective
knowledge and experience to create high-impact national programs that accelerate the use of energy management systems in industrial and
commercial buildings. The EMWG was launched in 2010 by the Clean Energy Ministerial (CEM) and International Partnership for Energy Efficiency
Cooperation (IPEEC).
For more information, please visit www.cleanenergyministerial.org/energymanagement.