Embed Size (px)
Citation preview
ED 441 383
AUTHORTITLEINSTITUTION
PUB DATENOTEAVAILABLE FROM
PUB TYPE
EDRS PRICEDESCRIPTORS
IDENTIFIERS
ABSTRACT
DOCUMENT RESUME
HE 032 860
Raudenbuh, Kathy; Tobin, DavidTuition and Fee Rates, 1999-2000: A National Comparison.Washington State Higher Education Coordinating Board,Olympia.2000-02-0049p.
State of Washington Higher Education Coordinating Board, 917Lakeridge Way, P.O. Box 43430, Olympia, WA 98504-3430. Tel:360-753-7800; Fax: 360-753-7808. For full text:http://www.hecb.wa.gov.Numerical/Quantitative Data (110) Reports Research(143)
MF01/PCO2 Plus Postage.Community Colleges; *Comparative. Analysis; Dental Schools;Graduate Study; Higher Education; In State Students; MedicalSchools; National Norms; Out of State Students; PeerInstitutions; Professional Education; Public Colleges;Student Costs; Tables (Data); *Tuition; Two Year Colleges;Undergraduate Study; Veterinary Medical Education*Washington
This 31st annual report of tuition and fees at publicinstitutions in the 50 states compiled by the Washington State HigherEducation Coordinating Board (HECB) examines tuition and fees at WashingtonState institutions compared to national averages. Generally, Washingtoninstitutions of higher education charge fees that: (1) are less than thenational average for resident undergraduate tuition and fees; (2) aresubstantially more than the national average for resident and nonresidentgraduate tuition and fees at research and comprehensive universities; and (3)are substantially more for nonresident undergraduate tuition and fees atcomprehensive universities and community colleges. Three appendixes comprisethe bulk of this report. The first discusses the national peer comparisongroups used as benchmarks for Washington institutions and provides tablesdisplaying the relationship of tuition and fees at Washington institutions tothose of their respective peer groups for the years 1995-96 to 1999-2000. Italso includes data on full-time tuition and fees for the first professionaldegree programs of medicine, dentistry, and veterinary medicine at theUniversity of Washington and Washington State University compared to theirrespective peer groups. Appendix 2 contains an overview of Washington Statetuition and fee policies and legislation since 1997; appendix 3 listsfour-year colleges and universities participating in the survey. (SM)
Reproductions supplied by EDRS are the best that can be madefrom the original document.
1999-2000
TUITION AND FEE RATES
A National Comparison
February 2000
Washington State Higher Education Coordinating Board
PERMISSION TO REPRODUCE ANDDISSEMINATE THIS MATERIAL HAS
BEEN GRANTED BY
TO THE EDUCATIONAL RESOURCESINFORMATION CENTER (ERIC)
1
, U.S. DEPARTMENT OF EDUCATIONOffice of Educational Research and Improvement
EDUCATIONAL RESOURCES INFORMATIONCENTER (ERIC)
This document has been reproduced asreceived from the person or organizationoriginating it.
Minor changes have been made toimprove reproduction quality.
Points of view or opinions stated in thisdocument do not necessarily representofficial OERI position or policy.
Washington State Higher Education Coordinating Board
Bob Craves, ChairmanIssaquah
Gay Selby, Vice Chair David Shaw, SecretaryKelso Pasco
Kristianne Blake Larry HansonSpokane Everett
Frank Brouillet Ann Ramsay-JenkinsPuyallup Seattle
James Faulstich Chang Mook SohnSeattle Olympia
Marcus S. GaspardExecutive Director
1999-2000 TUITION AND FEE RATES
A National Comparison
Overview
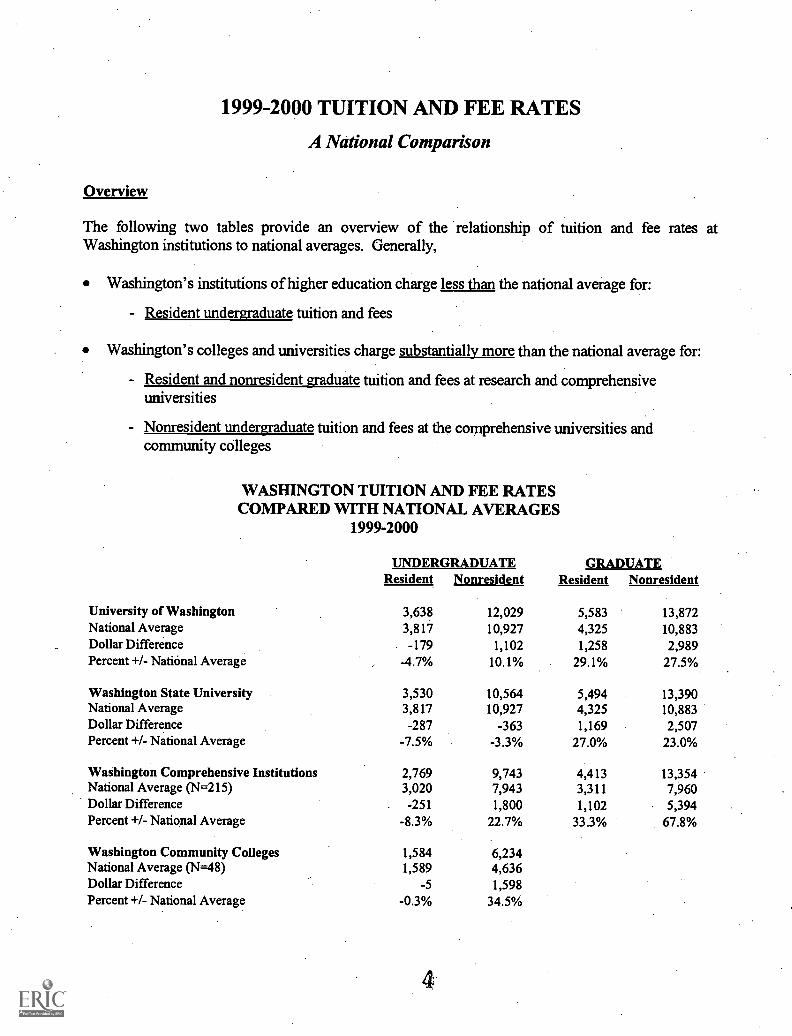
The following two tables provide an overview of the relationship of tuition and fee rates atWashington institutions to national averages. Generally,
Washington's institutions of higher education charge less than the national average for:
- Resident undergraduate tuition and fees
Washington's colleges and universities charge substantially more than the national average for:
- Resident and nonresident graduate tuition and fees at research and comprehensiveuniversities
- Nonresident undergraduate tuition and fees at the comprehensive universities andcommunity colleges
WASHINGTON TUITION AND FEE RATESCOMPARED WITH NATIONAL AVERAGES
1999-2000
UNDERGRADUATE GRADUATEResident Nonresident Resident Nonresident
University of Washington 3,638 12,029 5,583 13,872National Average 3,817 10,927 4,325 10,883Dollar Difference -179 1,102 1,258 2,989Percent +/- National Average , -4.7% 10.1% 29.1% 27.5%,
Washington State University 3,530 10,564 5,494 13,390National Average 3,817 10,927 4,325 10,883Dollar Difference -287 -363 1,169 2,507Percent +/- National Average -7.5% -3.3% 27.0% 23.0%
Washington Comprehensive Institutions 2,769 9,743 4,413 13,354National Average (N=215) 3,020 7,943 3,311 7,960Dollar Difference -251 1,800 1,102 5,394Percent +/- National Average -8.3% 22.7% 33.3% 67.8%
Washington Community Colleges 1,584 6,234National Average (N=48) 1,589 4,636Dollar Difference -5 1,598Percent +/- National Average -0.3% 34.5%
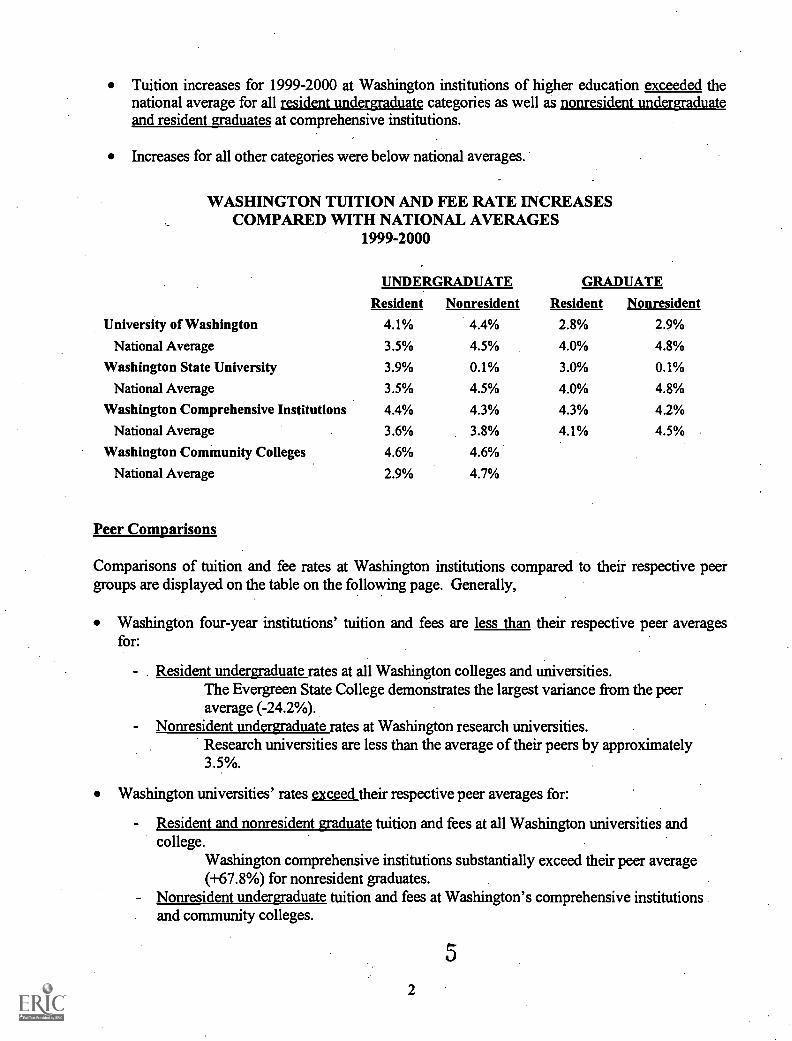
Tuition increases for 1999-2000 at Washington institutions of higher education exceeded thenational average for all resident undergraduate categories as well as nonresident undergraduateand resident graduates at comprehensive institutions.
Increases for all other categories were below national averages.
WASHINGTON TUITION AND FEE RATE INCREASESCOMPARED WITH NATIONAL AVERAGES
1999-2000
UNDERGRADUATE GRADUATE
Resident Nonresident Resident Nonresident
University of Washington 4.1% 4.4% 2.8% 2.9%
National Average 3.5% 4.5% 4.0% 4.8%
Washington State University 3.9% 0.1% 3.0% 0.1%
National Average 3.5% 4.5% 4.0% 4.8%
Washington Comprehensive Institutions 4.4% 4.3% 4.3% 4.2%
National Average 3.6% 3.8% 4.1% 4.5%
Washington Community Colleges 4.6% 4.6%
National Average 2.9% 4.7%
Peer Comparisons
Comparisons of tuition and fee rates at Washington institutions compared to their respective peergroups are displayed on the table on the following page. Generally,
Washington four-year institutions' tuition and fees are less than their respective peer averagesfor:
Resident undergraduate rates at all Washington colleges and universities.The Evergreen State College demonstrates the largest variance from the peeraverage (-24.2%).
Nonresident undergraduate rates at Washington research universities.Research universities are less than the average of their peers by approximately3.5%.
Washington universities' rates exceed their respective peer averages for:
Resident and nonresident graduate tuition and fees at all Washington universities andcollege.
Washington comprehensive institutions substantially exceed their peer average(+67.8%) for nonresident graduates.
Nonresident undergraduate tuition and fees at Washington's comprehensive institutionsand community colleges.
5
2
A COMPARISON OF TUITION AND FEE RATESAT WASHINGTON AND PEER INSTITUTIONS
1999-2000
UNDERGRADUATE GRADUATEMEDICAL/
DENTALVETERINARY MEDRes Nonres Res Nonres Res Nonres Res Nonres
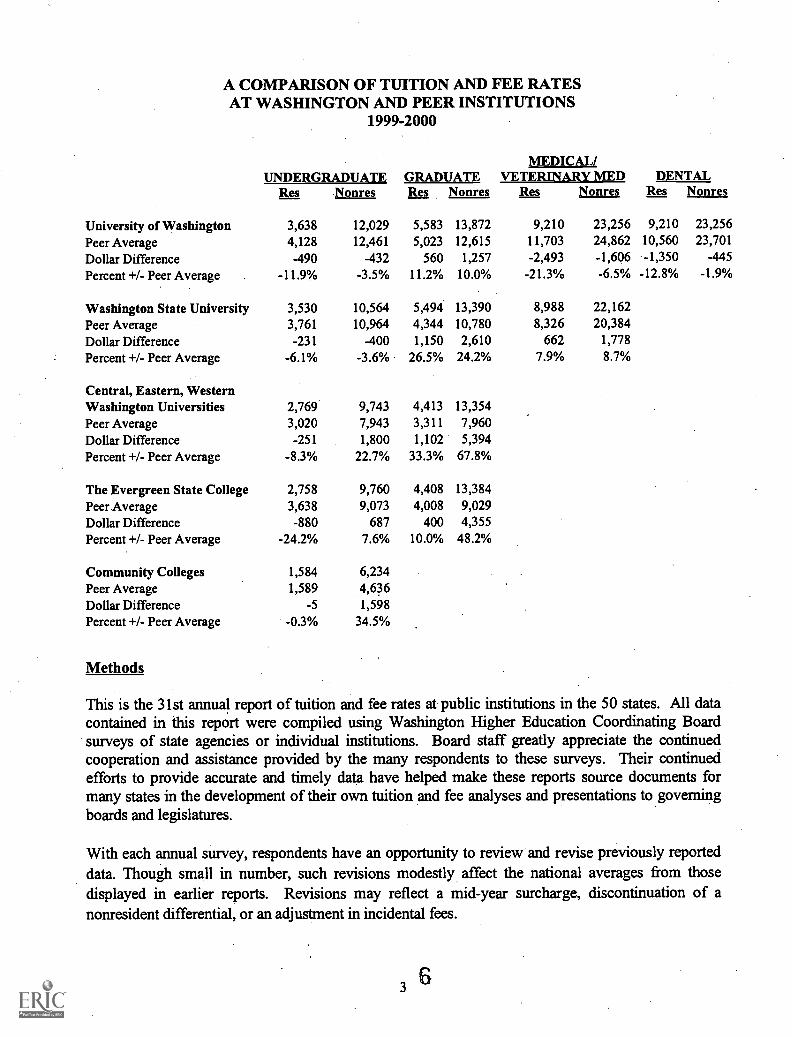
University of Washington 3,638 12,029 5,583 13,872 9,210 23,256 9,210 23,256
Peer Average 4,128 12,461 5,023 12,615 11,703 24,862 10,560 23,701
Dollar Difference -490 -432 560 1,257 -2,493 -1,606 -1,350 -445
Percent +/- Peer Average -11.9% -3.5% 11.2% 10.0% -21.3% -6.5% -12.8% -1.9%
Washington State University 3,530 10,564 5,494 13,390 8,988 22,162Peer Average 3,761 10,964 4,344 10,780 8,326 20,384Dollar Difference -231 -400 1,150 2,610 662 1,778
Percent +/- Peer Average -6.1% -3.6% 26.5% 24.2% 7.9% 8.7%
Central, Eastern, WesternWashington Universities 2,769 9,743 4,413 13,354Peer Average 3,020 7,943 3,311 7,960Dollar Difference -251 1,800 1,102 5,394Percent +/- Peer Average -8.3% 22.7% 33.3% 67.8%
The Evergreen State College 2,758 9,760 4,408 13,384Peer. Average 3,638 9,073 4,008 9,029Dollar Difference -880 687 400 4,355Percent +/- Peer Average -24.2% 7.6% 10.0% 48.2%
Community Colleges 1,584 6,234Peer Average 1,589 4,636Dollar Difference -5 1,598Percent +/- Peer Average -0.3% 34.5%
Methods
This is the 31st annual report of tuition and fee rates at public institutions in the 50 states. All datacontained in this report were compiled using Washington Higher Education Coordinating Boardsurveys of state agencies or individual institutions. Board staff greatly appreciate the continuedcooperation and assistance provided 'by the many respondents to these surveys. Their continuedefforts to provide accurate and timely data have helped make these reports source documents formany states in the development of their own tuition and fee analyses and presentations to governingboards and legislatures.
With each annual survey, respondents have an opportunity to review and revise previously reporteddata. Though small in number, such revisions modestly affect the national averages from thosedisplayed in earlier reports. Revisions may reflect a mid-year surcharge, discontinuation of anonresident differential, or an adjustment in incidental fees.
3
In addition, for the 1999-2000 report, we have made significant changes to the processing of thetuition and fee data. The most current six years of data (AY1994-1995 through 1999-2000) havenow been entered in a data base which we make available upon request. Early next year, we hope tobe able to offer users the ability to access the data directly from our web site.
Some respondents may note that minor adjustments have been made to prior-year data in addition tothose that you submitted. This was likely caused by the complete re-entering and verification of thelast six years of survey data, as well as verified calculations and changes in rounding of percentages.Please let us know if you have any questions or concerns related to your reported data.
Tables 1 through 10 on the following pages provide a national perspective on tuition and fee ratesand increases over the most recent five years. Tables 1 through 8 display historical and currentacademic year tuition and required fee rates for full-time resident and nonresident undergraduate andgraduate students at public four-year colleges and universities. Tables 9 and 10 display stateaverages for community colleges in each state. Each table also shows Washington State's rankingnationally. Tables also provide the one- and four-year percentage increases for each state.
Compilation of averages has been consistent over time and has dealt with the "university of eachstate and state averages of those public colleges and universities reported since 1968-69 in theseannual Board reports. Data on the state colleges and universities represent the average undergraduatecharges at 215 state public institutions and the average graduate charges at 195 of those that offergraduate programs. Although not all public institutions are included in this survey, the averages andchanges over time at the same set of institutions offer consistency and the large number ofinstitutions included provides a close approximation to state averages.
Users of the report should note that, for reporting comparability, 45 quarter hours or 30 semesterhours were used as the basis for full-time undergraduate students. Full-time graduate students werebased on 30 quarter hours or 20 semester hours.
Appendix A discusses the national peer groups used as benchmarks for Washington institutions andprovides tables displaying the relationship of tuition and fee rates at Washington institutions to thoseof their respective peer groups. It also includes data on full-time tuition and fee charges for the firstprofessional degree programs of medicine, dentistry, and veterinary medicine at the University ofWashington and Washington. State University compared to their respective peer groups.
Appendix B contains an overview of Washington tuition and fee policies and legislation since 1977.
Appendix C is a listing of four-year colleges and universities included in the survey.
4
Data Availability
Data contained in this report, as well as the historical data since 1972-73, are available upon request.The 1999-2000 report is also available on our web site at www.hecb.wa.gov. This report wasprepared by Kathy Raudenbush and David Tobin. For further information, please contact Ms.Raudenbush at (360) 753-7862 or e-mail [email protected].
5
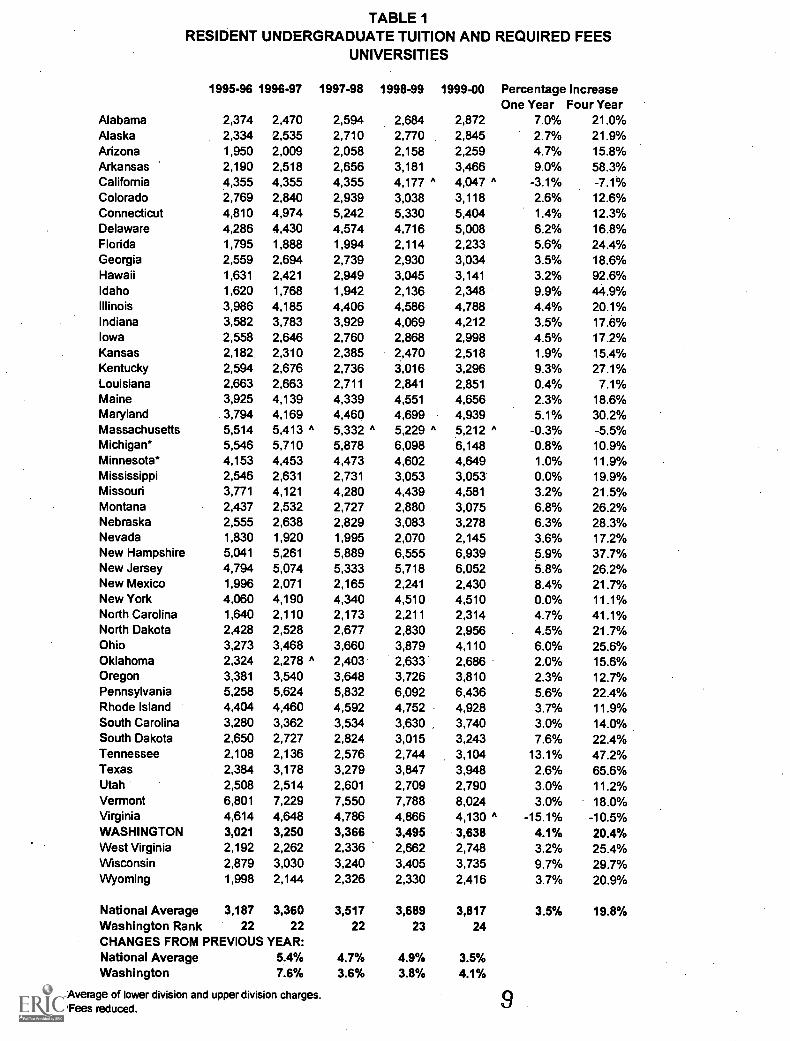
TABLE 1RESIDENT UNDERGRADUATE TUITION AND REQUIRED FEES
UNIVERSITIES
1995-96 1996-97 1997-98 1998-99 1999-00 Percentage IncreaseOne Year Four Year
Alabama 2,374 2,470 2,594 2,684 2,872 7.0% 21.0%Alaska 2,334 2,535 2,710 2,770 2,845 2.7% 21.9%Arizona 1,950 2,009 2,058 2,158 2,259 4.7% 15.8%Arkansas 2,190 2,518 2,656 3,181 3,466 9.0% 58.3%California 4,355 4,355 4,355 4,177 " 4,047 A -3.1% -7.1%Colorado 2,769 2,840 2,939 3,038 3,118 2.6% 12.6%Connecticut 4,810 4,974 5,242 5,330 5,404 1.4% 12.3%Delaware 4,286 4,430 4,574 4,716 5,008 6.2% 16.8%Florida 1,795 1,888 1,994 2,114 2,233 5.6% 24.4%Georgia 2,559 2,694 2,739 2,930 3,034 3.5% 18.6%Hawaii 1,631 2,421 2,949 3,045 3,141 3.2% 92.6%Idaho 1,620 1,768 1,942 2,136 2,348 9.9% 44.9%Illinois 3,986 4,185 4,406 4,586 4,788 4.4% 20.1%Indiana 3,582 3,783 3,929 4,069 4,212 3.5% 17.6%Iowa 2,558 2,646 2,760 2,868 2,998 4.5% 17.2%Kansas 2,182. 2,310 2,385 2,470 2,518 1.9% 15.4%Kentucky 2,594 2,676 2,736 3,016 3,296 9.3% 27.1%Louisiana 2,663 2,663 2,711 2,841 2,851 0.4% 7.1%Maine 3,925 4,139 4,339 4,551 4,656 2.3% 18.6%Maryland 3,794 4,169 4,460 4,699 4,939 5.1% 30.2%Massachusetts 5,514 5,413 A 5,332 A 5,229 A 5,212 A -0.3% -5.5%Michigan 5,546 5,710 5,878 6,098 6,148 0.8% 10.9%Minnesota* 4,153 4,453 4,473 4,602 4,649 1.0% 11.9%Mississippi 2,546 2,631 2,731 3,053 3,053 0.0% 19.9%Missouri 3,771 4,121 4,280 4,439 4,581 3.2% 21.5%Montana 2,437 2,532 2,727 2,880 3,075 6.8% 26.2%Nebraska 2,555 2,638 2,829 3,083 3,278 6.3% 28.3%Nevada 1,830 1,920 1,995 2,070 2,145 3.6% 17.2%New Hampshire 5,041 5,261 5,889 6,555 6,939 5.9% 37.7%New Jersey 4,794 5,074 5,333 5,718 6,052 5.8% 26.2%New Mexico 1,996 2,071 2,165 2,241 2,430 8.4% 21.7%New York 4,060 4,190 4,340 4,510 4,510 0.0% 11.1%North Carolina 1,640 2,110 2,173 2,211 2,314 4.7% 41.1%North Dakota 2,428 2,528 2,677 2,830 2,956 4.5% 21.7%Ohio 3,273 3,468 3,660 3,879 4,110 6.0% 25.6%Oklahoma 2,324 2,278 A 2,403 2,633' 2,686 2.0% 15.6%Oregon 3,381 3,540 3,648 3,726 3,810 2.3% 12.7%Pennsylvania 5,258 5,624 5,832 6,092 6,436 5.6% 22.4%Rhode Island 4,404 4,460 4,592 4,752 4,928 3.7% 11.9%South Carolina 3,280 3,362 3,534 3,630 , 3,740 3.0% 14.0%South Dakota 2,650 2,727 2,824 3,015 3,243 7.6% 22.4%Tennessee 2,108 2,136 2,576 2,744 3,104 13.1% 47.2%Texas 2,384 3,178 3,279 3,847 3,948 2.6% 65.6%Utah 2,508 2,514 2,601 2,709 2,790 3.0% 11.2%Vermont 6,801 7,229 7,550 7,788 8,024 3.0% 18.0%Virginia 4,614 4,648 4,786 4,866 4,130 A -15.1% -10.5%WASHINGTON 3,021 3,250 3,366 3,495 3,638 4.1% 20.4%West Virginia 2,192 2,262 2,336 2,662 2,748 3.2% 25.4%Wisconsin 2,879 3,030 3,240 3,405 3,735 9.7% 29.7%Wyoming 1,998 2,144 2,326 2,330 2,416 3.7% 20.9%
National Average 3,187 3,360 3,517 3,689 3,817 3.5% 19.8%Washington Rank 22 22 22 23 24CHANGES FROM PREVIOUS YEAR:National Average 5.4% 4.7% 4.9% 3.5%Washington 7.6% 3.6% 3.8% 4.1%
'Average of lower division and upper division charges."Fees reduced.
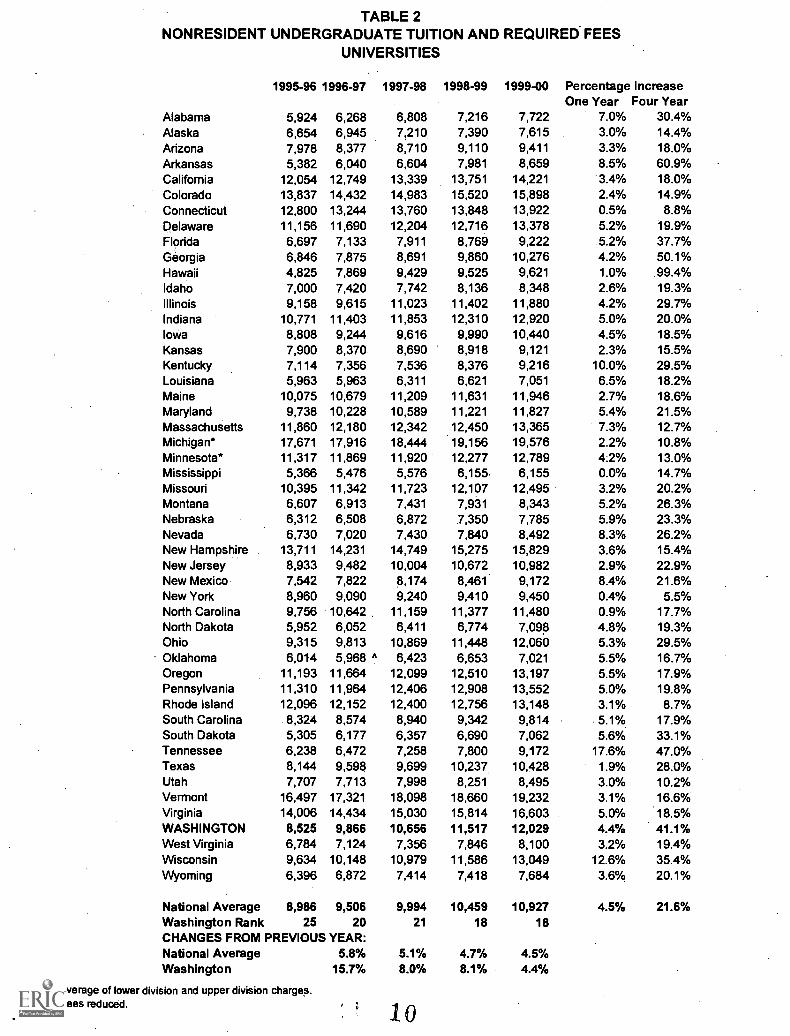
TABLE 2NONRESIDENT UNDERGRADUATE TUITION AND REQUIRED. FEES
UNIVERSITIES
1995-96 1996-97 1997-98 1998-99 1999-00 Percentage IncreaseOne Year Four Year
Alabama 5,924 6,268 6,808 7,216 7,722 7.0% 30.4%Alaska 6,654 6,945 7,210 7,390 7,615 3.0% 14.4%Arizona 7,978 8,377 8,710 9,110 9,411 3.3% 18.0%Arkansas 5,382 6,040 6,604 7,981 8,659 8.5% 60.9%California 12,054 12,749 13,339 13,751 14,221 3.4% 18.0%Colorado 13,837 14,432 14,983 15,520 15,898 2.4% 14.9%Connecticut 12,800 13,244 13,760 13,848 13,922 0.5% 8.8%Delaware 11,156 11,690 12,204 12,716 13,378 5.2% 19.9%Florida 6,697 7,133 7,911 8,769 9,222 5.2% 37.7%Georgia 6,846 7,875 8,691 9,860 10,276 4.2% 50.1%Hawaii 4,825 7,869 9,429 9,525 9,621 1.0% 99.4%Idaho 7,000 7,420 7,742 8,136 8,348 2.6% 19.3%Illinois 9,158 9,615 11,023 11,402 11,880 4.2% 29.7%Indiana 10,771 11,403 11,853 12,310 12,920 5.0% 20.0%Iowa 8,808 9,244 9,616 9,990 10,440 4.5% 18.5%Kansas 7,900 8,370 8,690 8,918 9,121 2.3% 15.5%Kentucky 7,114 7,356 7,536 8,376 9,216 10.0% 29.5%Louisiana 5,963 5,963 6,311 6,621 7,051 6.5% 18.2%Maine 10,075 10,679 11,209 11,631 11,946 2.7% 18.6%Maryland 9,738 10,228 10,589 11,221 11,827 5.4% 21.5%Massachusetts 11,860 12,180 12,342 12,450 13,365 7.3% 12.7%Michigan 17,671 17,916 18,444 19,156 19,576 2.2% 10.8%Minnesota* 11,317 11,869 11,920 12,277 12,789 4.2% 13.0%Mississippi 5,366 5,476 5,576 6,155. 6,155 0.0% 14.7%Missouri 10,395 11,342 11,723 12,107 12,495 3.2% 20.2%Montana 6,607 6,913 7,431 7,931 8,343 5.2% 26.3%Nebraska 6,312 6,508 6,872 7,350 7,785 5.9% 23.3%Nevada 6,730 7,020 7,430 7,840 8,492 8.3% 26.2%New Hampshire 13,711 14,231 14,749 15,275 15,829 3.6% 15.4%New Jersey 8,933 9,482 10,004 10,672 10,982 2.9% 22.9%New Mexico 7,542 7,822 8,174 8,461 9,172 8.4% 21.6%New York 8,960 9,090 9,240 9,410 9,450 0.4% 5.5%North Carolina 9,756 10,642 11,159 11,377 11,480 0.9% 17.7%North Dakota 5,952 6,052 6,411 6,774 7,098 4.8% 19.3%Ohio 9,315 9,813 10,869 11,448 12,060 5.3% 29.5%Oklahoma 6,014 5,968 " 6,423 6,653 7,021 5.5% 16.7%Oregon 11,193 11,664 12,099 12,510 13,197 5.5% 17.9%Pennsylvania 11,310 11,964 12,406 12,908 13,552 5.0% 19.8%Rhode Island 12,096 12,152 12,400 12,756 13,148 3.1% 8.7%South Carolina 8,324 8,574 8,940 9,342 9,814 5.1% 17.9%South Dakota 5,305 6,177 6,357 6,690 7,062 5.6% 33.1%Tennessee 6,238 6,472 7,258 7,800 9,172 17.6% 47.0%Texas 8,144 9,598 9,699 10,237 10,428 1.9% 28.0%Utah 7,707 7,713 7,998 8,251 8,495 3.0% 10.2%Vermont 16,497 17,321 18,098 18,660 19,232 3.1% 16.6%Virginia 14,006 14,434 15,030 15,814 16,603 5.0% 18.5%WASHINGTON 8,525 9,866 10,656 11,517 12,029 4.4% 41.1%West Virginia 6,784 7,124 7,356 7,846 8,100 3.2% 19.4%Wisconsin 9,634 10,148 10,979 11,586 13,049 12.6% 35.4%Wyoming 6,396 6,872 7,414 7,418 7,684 3.6% 20.1%
National Average 8,986 9,506 9,994 10,459 10,927 4.5% 21.6%Washington Rank 25 20 21 18 18CHANGES FROM PREVIOUS YEAR:National Average 5.8% 5.1% 4.7% 4.5%Washington 15.7% 8.0% 8.1% 4.4%
'Average of lower division and upper division charges."Fees reduced. 10

TABLE 3'RESIDENT GRADUATE TUITION AND REQUIRED FEES
UNIVERSITIES
1995-96 1996-97 1997-98 1998-99 1999-00 Percentage IncreaseOne Year Four Year
Alabama 2,374 2,470 2,594 2,684 2,872 7.0% 21.0%Alaska 3,174 3,390 3,620 3,700 3,800 2.7% 19.7%Arizona 1,950 2,009 2,058 2,158 2,259 4.7% 15.8%Arkansas 2,906 3,104 3,116 3,457 4,543 31.4% 56.3%California 4,395 4,395 4,395 4,409 4,269 A -3.2% -2:9%Colorado 3,513 3,602 3,693 3,822 3,920 2.6% 11.6%Connecticut 5,516 5,710 6,000 6,076 6,140 1.1% 11.3%Delaware 4,206 4,350 4,490 4,626 4,762 2.9% 13.2%Florida 2,240 2,375 2,631 2,801 2,951 5.4% 31.7%Georgia 2,244 2,439 2,568 3,290 3,516 6.9% 56.7%Hawaii 2,187 3,261 3,909 4,029 4,149 3.0% 89.7%Idaho 2,160 2,308 2,482 2,676 2,888 7.9% 33.7%Illinois 4,406 4,625 4,944 5,138 5,358 4.3% 21.6%Indiana 3,521 3,722 3,871 4,013 4,213 5.0% 19.7%Iowa 3,006 3,110 3,242 3,368 3,520 4.5% 17.1%Kansas 2,534 2,676 2,767 2,852 2,910 2.0% 14.8%Kentucky 2,814 2,916 2,976 3,276 3,596 9.8% 27.8%Louisiana 2,672 2,672 2,720 2,850 2,860 0.4% 7.0%Maine 3,690 3,912 4,102 4,258 4,348 2.1% 17.8%Maryland 5,013 5,453 5,927 5,440 A 5,440 0.0% 8.5%Massachusetts 5,543 5,553 5,496 A 5,802 5,642 A -2.8% 1.8%Michigan 9,054 9,500 9,816 10,192 10,316 1.2% 13.9%Minnesota 4,785 5,150 5,454 5,611 5,517 A -1.7% 15.3%Mississippi 2,546 2,631 2,731 3,053 3,053 0.0% 19.9%Missouri 3,085 4,132 4,284 4,439 4,580 3.2% 48.5%Montana 2,425 2,520 2,636 2,839 3,025 6.6% 24.7%Nebraska 2,297 2,373 2,537 2,766 2,940 6.3% 28.0%Nevada 1,680 1,740 1,800 1,860 1,930 3.8% 14.9%New Hampshire 4,889 5,083 5,689 6,308 6,647 5.4% 36.0%New Jersey 6,243 6,766 7,199 7,701 7,642 A -0.8% 22.4%New Mexico 2,196 2,279 2,381 2,474 2,682 8.4% 22.1%New York 5,612 5,742 5,792 5,670 A 5,970 5.3% 6.4%North Carolina* 1,631 2,100 2,164 2,202 2,354 6.9% 44.3%North Dakota 2,638 2,738 2,887 3,040 3,166 4.1% 20.0%Ohio 4,707 4,941 5,187 5,445 5,730 5.2% 21.7%Oklahoma 1,872 1,885 2,081 2,148 2,272 5.8% 21.4%Oregon 5,376 5,889 6,150 6,384 6,750 5.7% 25.6%Pennsylvania 5,872 6,268 6,502 6,786 7,160 5.5% 21.9%Rhode Island 4,394 4,442 4,572 4,722 4,892 3.6% 11.3%South Carolina .3,508 3,630 3,824 3,994 4,114 3.0% 17.3%South Dakota 2,359 2,425 2,443 2,592 2,627 1.3% 11.4%Tennessee 2,570 2,660 3,142 3,354 3,806 13.5% 48.1%Texas 1,589 2,118 2,672 2,858 3,112 8.9% 95.8%Utah 2,036 2,062 2,111 2,198 2,262 2.9% 11.1%Vermont 6,473 7,229 7,550 7,788 8,024 3.0% 24.0%Virginia 4,614 4,648 4,786 4,866 4,916 1.0% 6.5%WASHINGTON 4,747 5,044 5,232 5,433 5,583 2.8% 17.6%West Virginia 2,336 2,412 2,490 2,820 2,910 3.2% 24.6%Wisconsin 4,134 4,373 4,690 4,926 5,403 9.7% 30.7%Wyoming 2,418 2,591 2,812 2,816 2,920 3.7% 20.8%
National Average 3,563 3,788 3,984 4,160 4,325 4.0% 21.4%Washington Rank 12 12 12 13 11
CHANGES FROM PREVIOUS YEAR:National Average 6.3% 5.2% 4.4% 4.0%Washington 6.3% 3.7% 3.8% 2.8%
*Li of NC/Chapel Hill instituted a mandatory grad fee (AY99) at the Business School that is not included in the amount reported above."Fees reduced.
11
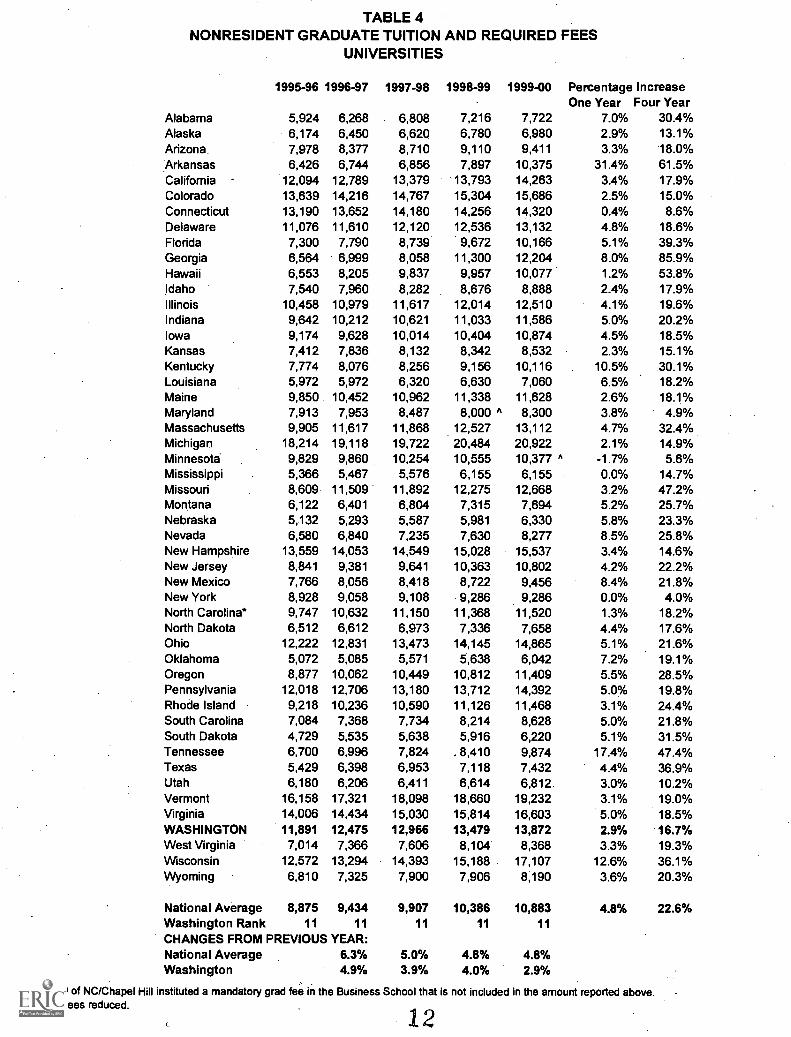
TABLE 4NONRESIDENT GRADUATE TUITION AND REQUIRED FEES
UNIVERSITIES
1995-96 1996-97 1997-98 1998-99 1999-00 Percentage IncreaseOne Year Four Year
Alabama 5,924 6,268 6,808 7,216 7,722 7.0% 30.4%Alaska 6,174 6,450 6,620 6,780 6,980 2.9% 13.1%Arizona. 7,978 8,377 8,710 9,110 9,411 3.3% 18.0%Arkansas 6,426 6,744 6,856 7,897 10,375 31.4% 61.5%California 12,094 12,789 13,379 13,793 14,263 3.4% 17.9%Colorado 13,639 14,216 14,767 15,304 15,686 2.5% 15.0%Connecticut 13,190 13,652 14,180 14,256 14,320 0.4% 8.6%Delaware 11,076 11,610 12,120 12,536 13,132 4.8% 18.6%Florida 7,300 7,790 8,739 9,672 10,166 5.1% 39.3%Georgia 6,564 6,999 8,058 11,300 12,204 8.0% 85.9%Hawaii 6,553 8,205 9,837 9,957 10,077 1.2% 53.8%Idaho 7,540 7,960 8,282 8,676 8,888 2.4% 17.9%Illinois 10,458 10,979 11,617 12,014 12,510 4.1% 19.6%Indiana 9,642 10,212 10,621 11,033 11,586 5.0% 20.2%Iowa 9,174 9,628 10,014 10,404 10,874 4.5% 18.5%Kansas 7,412 7,836 8,132 8,342 8,532 2.3% 15.1%Kentucky 7,774 8,076 8,256 9,156 10,116 10.5% 30.1%Louisiana 5,972 5,972 6,320 6,630 7,060 6.5% 18.2%Maine 9,850 10,452 10,962 11,338 11,628 2.6% 18.1%Maryland 7,913 7,953 8,487 8,000 A 8,300 3.8% 4.9%Massachusetts 9,905 11,617 11,868 12,527 13,112 4.7% 32.4%Michigan 18,214 19,118 19,722 20,484 20,922 2.1% 14.9%Minnesota 9,829 9,860 10,254 10,555 10,377 A -1.7% 5.6%Mississippi 5,366 5,467 5,576 6,155 6,155 0.0% 14.7%Missouri 8,609 11,509 11,892 12,275 12,668 3.2% 47.2%Montana 6,122 6,401 6,804 7,315 7,694 5.2% 25.7%Nebraska 5,132 5,293 5,587 5,981 6,330 5.8% 23.3%Nevada 6,580 6,840 7,235 7,630 8,277 8.5% 25.8%New Hampshire 13,559 14,053 14,549 15,028 15,537 3.4% 14.6%New Jersey 8,841 9,381 9,641 10,363 10,802 4.2% 22.2%New Mexico 7,766 8,056 8,418 8,722 9,456 8.4% 21.8%New York 8,928 9,058 9,108 9,286 9,286 0.0% 4.0%North Carolina* 9,747 10,632 11,150 11,368 11,520 1.3% 18.2%North Dakota 6,512 6,612 6,973 7,336 7,658 4.4% 17.6%Ohio 12,222 12,831 13,473 14,145 14,865 5.1% 21.6%Oklahoma 5,072 5,085 5,571 5,638 6,042 7.2% 19.1%Oregon 8,877 10,062 10,449 10,812 11,409 5.5% 28.5%Pennsylvania 12,018 12,706 13,180 13,712 14,392 5.0% 19.8%Rhode Island 9,218 10,236 10,590 11,126 11,468 3.1% 24.4%South Carolina 7,084 7,368 7,734 8,214 8,628 5.0% 21.8%South Dakota 4,729 5,535 5,638 5,916 6,220 5.1% 31.5%Tennessee 6,700 6,996 7,824 . 8,410 9,874 17.4% 47.4%Texas 5,429 6,398 6,953 7,118 7,432 4.4% 36.9%Utah 6,180 6,206 6,411 6,614 6,812. 3.0% 10.2%Vermont 16,158 17,321 18,098 18,660 19,232 3.1% 19.0%Virginia 14,006 14,434 15,030 15,814 16,603 5.0% 18.5%WASHINGTON 11,891 12,475 12,966 13,479 13,872 2.9% 16.7%West Virginia 7,014 7,366 7,606 8,104 8,368 3.3% 19.3%Wisconsin 12,572 13,294 14,393 15,188 17,107 12.6% 36.1%Wyoming 6,810 7,325 7,900 7,906 8,190 3.6% 20.3%
National Average 8,875 9,434 9,907 10,386 10,883 4.8% 22.6%Washington Rank 11 11 11 11 11
CHANGES FROM PREVIOUS YEAR:National Average 6.3% 5.0% 4.8% 4.8%Washington 4.9% 3.9% 4.0% 2.9%
*U of NC/Chapel Hill instituted a mandatory grad fee in the Business School that is not included in the amount reported above."Fees reduced.
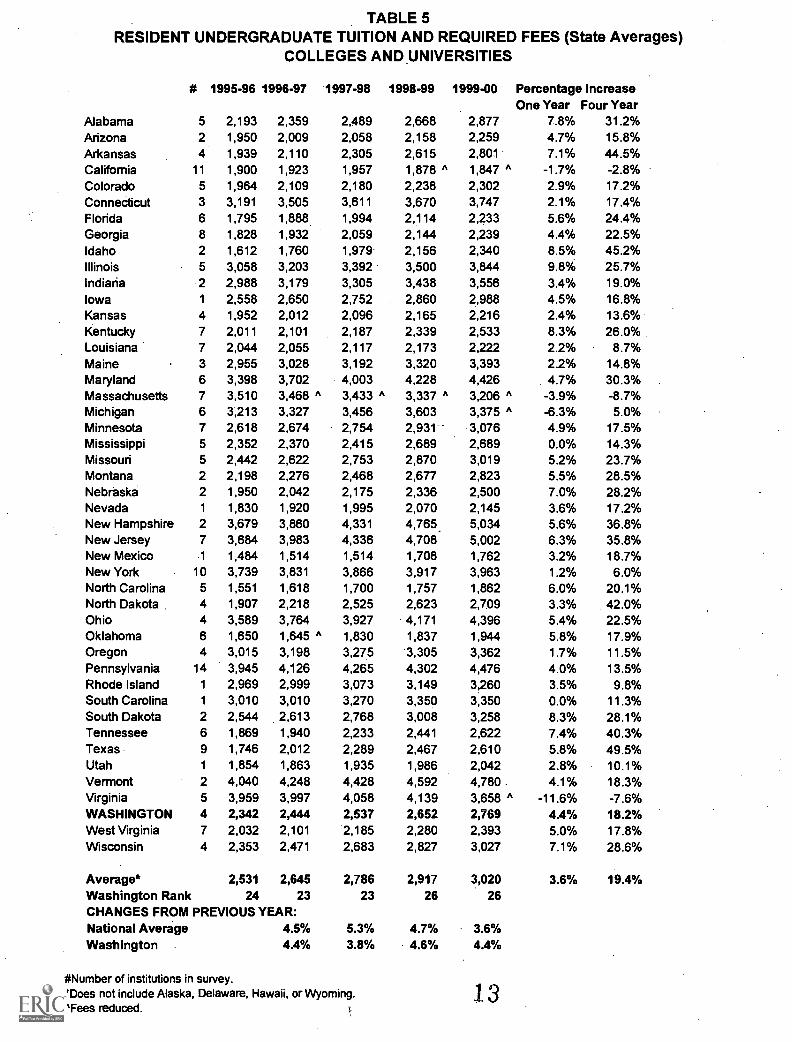
TABLE 5RESIDENT UNDERGRADUATE TUITION AND REQUIRED FEES (State Averages)
COLLEGES AND UNIVERSITIES
# 1995-96 1996-97 1997-98 1998-99 1999-00 Percentage IncreaseOne Year Four Year
Alabama 5 2,193 2,359 2,489 2,668 2,877 7.8% 31.2%Arizona 2 1,950 2,009 2,058 2,158 2,259 4.7% 15.8%Arkansas 4 1,939 2,110 2,305 2,615 2,801 7.1% 44.5%California 11 1,900 1,923 1,957 1,878 A 1,847 A -1.7% -2.8%Colorado 5 1,964 2,109 2,180 2,238 2,302 2.9% 17.2%Connecticut 3 3,191 3,505 3,611 3,670 3,747 2.1% 17.4%Florida 6 1,795 1,888 1,994 2,114 2,233 5.6% 24.4%Georgia 8 1,828 1,932 2,059 2,144 2,239 4.4% 22.5%Idaho 2 1,612 1,760 1,979 2,156 2,340 8.5% 45.2%Illinois 5 3,058 3,203 3,392 3,500 3,844 9.8% 25.7%Indiaria 2 2,988 3,179 3,305 3,438 3,556 3.4% 19.0%Iowa 1 2,558 2,650 2,752 2,860 2,988 4.5% 16.8%Kansas 4 1,952 2,012 2,096 2,165 2,216 2.4% 13.6%Kentucky 7 2,011 2,101 2,187 2,339 2,533 8.3% 26.0%Louisiana 7 2,044 2,055 2,117 2,173 2,222 2.2% 8.7%Maine 3 2,955 3,028 3,192 3,320 3,393 2.2% 14.8%Maryland 6 3,398 3,702 4,003 4,228 4,426 4.7% 30.3%Massachusetts 7 3,510 3,468 A 3,433 A 3,337 A 3,206 A -3.9% -8.7%Michigan 6 3,213 3,327 3,456 3,603 3,375 A -6.3% 5.0%Minnesota 7 2,618 2,674 2,754 2,931 3,076 4.9% 17.5%Mississippi 5 2,352 2,370 2,415 2,689 2,689 0.0% 14.3%Missouri 5 2,442 2,622 2,753 2,870 3,019 5.2% 23.7%Montana 2 2,198 2,276 2,468 2,677 2,823 5.5% 28.5%Nebraska 2 1,950 2,042 2,175 2,336 2,500 7.0% 28.2%Nevada 1 1,830 1,920 1,995 2,070 2,145 3.6% 17.2%New Hampshire 2 3,679 3,860 4,331 4,765, 5,034 5.6% 36.8%New Jersey 7 3,684 3,983 4,336 4,708 5,002 6.3% 35.8%New Mexico 1 1,484 1,514 1,514 1,708 1,762 3.2% 18.7%New York 10 3,739 3,831 3,866 3,917 3,963 1.2% 6.0%North Carolina 5 1,551 1,618 1,700 1,757 1,862 6.0% 20.1%North Dakota 4 1,907 2,218 2,525 2,623 2,709 3.3% 42.0%Ohio 4 3,589 3,764 3,927 4,171 4,396 5.4% 22.5%Oklahoma 6 1,650 1,645 A 1,830 1,837 1,944 5.8% 17.9%Oregon 4 3,015 3,198 3,275 3,305 3,362 1.7% 11.5%Pennsylvania 14 3,945 4,126 4,265 4,302 4,476 4.0% 13.5%Rhode Island 1 2,969 2,999 3,073 3,149 3,260 3.5% 9.8%South Carolina 1 3,010 3,010 3,270 3,350 3,350 0.0% 11.3%South Dakota 2 2,544 2,613 2,768 3,008 3,258 8.3% 28.1%Tennessee 6 1,869 1,940 2,233 2,441 2,622 7.4% 40.3%Texas 9 1,746 2,012 2,289 2,467 2,610 5.8% 49.5%Utah 1 1,854 1,863 1,935 1,986 2,042 2.8% 10.1%Vermont 2 4,040 4,248 4,428 4,592 4,780. 4.1% 18.3%Virginia 5 3,959 3,997 4,058 4,139 3,658 A -11.6% -7.6%WASHINGTON 4 2,342 2,444 2,537 2,652 2,769 4.4% 18.2%West Virginia 7 2,032 2,101 2,185 2,280 2,393 5.0% 17.8%Wisconsin 4 2,353 2,471 2,683 2,827 3,027 7.1% 28.6%
Average* 2,531 2,645 2,786 2,917 3,020 3.6% 19.4%Washington Rank 24 23 23 26 26CHANGES FROM PREVIOUS YEAR:National Average 4.5% 5.3% 4.7% 3.6%Washington 4.4% 3.8% 4.6% 4.4%
#Number of institutions in survey.*Does not include Alaska, Delaware, Hawaii, or Wyoming.^Fees reduced.
13
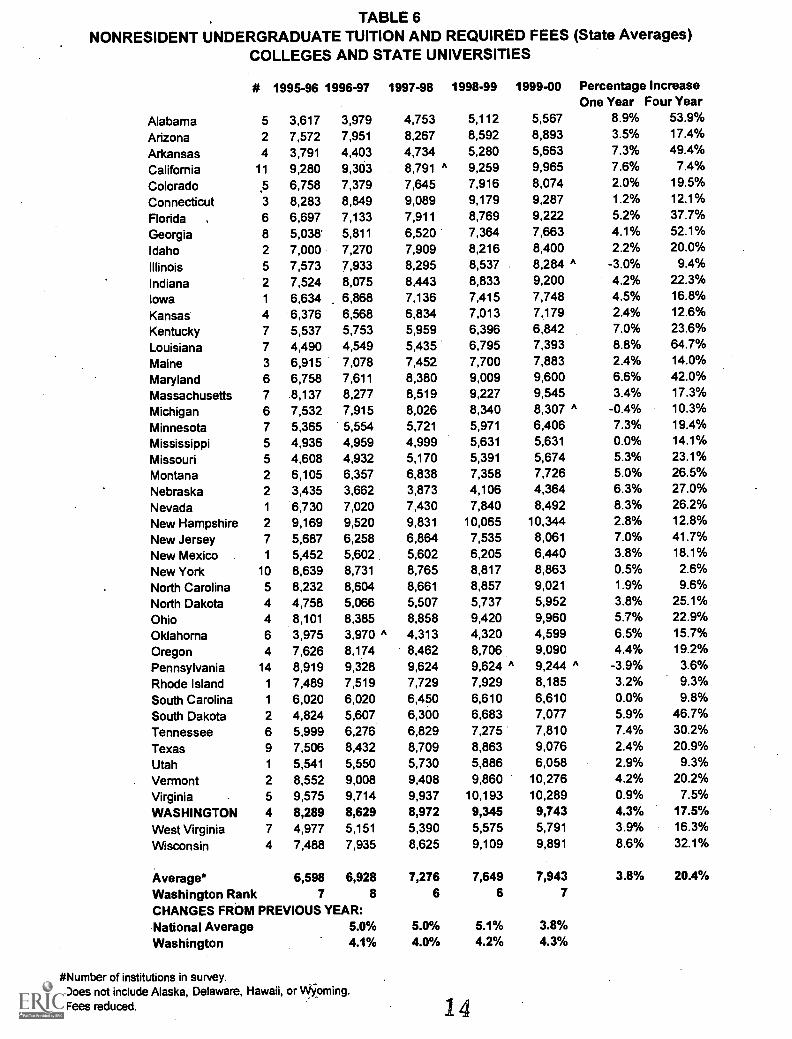
TABLE 6NONRESIDENT UNDERGRADUATE TUITION AND REQUIRED FEES (State Averages)
COLLEGES AND STATE UNIVERSITIES
# 1995-96 1996-97 1997-98 1998-99 1999-00 Percentage IncreaseOne Year Four Year
Alabama 5 3,617 3,979 4,753 5,112 5,567 8.9% 53.9%
Arizona 2 7,572 7,951 8,267 8,592 8,893 3.5% 17.4%
Arkansas 4 3,791 4,403 4,734 5,280 5,663 7.3% 49.4%
California 11 9,280 9,303 8,791 A 9,259 9,965 7.6% 7.4%
Colorado .5 6,758 7,379 7,645 7,916 8,074 2.0% 19.5%
Connecticut 3 8,283 8,849 9,089 9,179 9,287 1.2% 12.1%
Florida 6 6,697 7,133 7,911 8,769 9,222 5.2% 37.7%
Georgia 8 5,038' 5,811 6,520 7,364 7,663 4.1% 52.1%
Idaho 2 7,000 7,270 7,909 8,216 8,400 2.2% 20.0%
Illinois 5 7,573 7,933 8,295 8,537 8,284 A -3.0% 9.4%
Indiana 2 7,524 8,075 8,443 8,833 9,200 4.2% 22.3%
Iowa 1 6,634 6,868 7,136 7,415 7,748 4.5% 16.8%
Kansas 4 6,376 6,568 6,834 7,013 7,179 2.4% 12.6%
Kentucky 7 5,537 5,753 5,959 6,396 6,842 7.0% 23.6%
Louisiana 7 4,490 4,549 5,435 6,795 7,393 8.8% 64.7%
Maine 3 6,915 7,078 7,452 7,700 7,883 2.4% 14.0%
Maryland 6 6,758 7,611 8,380 9,009 9,600 6.6% 42.0%
Massachusetts 7 8,137 8,277 8,519 9,227 9,545 3.4% 17.3%
Michigan 6 7,532 7,915 8,026 8,340 8,307 A -0.4% 10.3%
Minnesota 7 5,365 5,554 5,721 5,971 6,406 7.3% 19.4%
Mississippi 5 4,936 4,959 4,999 5,631 5,631 0.0% 14.1%
Missouri 5 4,608 4,932 5,170 5,391 5,674 5.3% 23.1%
Montana 2 6,105 6,357 6,838 7,358 7,726 5.0% 26.5%
Nebraska 2 3,435 3,662 3,873 4,106 4,364 6.3% 27.0%
Nevada 1 6,730 7,020 7,430 7,840 8,492 8.3% 26.2%
New Hampshire 2 9,169 9,520 9,831 10,065 10,344 2.8% 12.8%
New Jersey 7 5,687 6,258 6,864 7,535 8,061 7.0% 41.7%
New Mexico 1 5,452 5,602 5,602 6,205 6,440 3.8% 18.1%
New York 10 8,639 8,731 8,765 8,817 8,863 0.5% 2.6%
North Carolina 5 8,232 8,604 8,661 8,857 9,021 1.9% 9.6%
North Dakota 4 4,758 5,066 5,507 5,737 5,952 3.8% 25.1%
Ohio 4 8,101 8,385 8,858 9,420 9,960 5.7% 22.9%
Oklahoma 6 3,975 3,970 A 4,313 4,320 4,599 6.5% 15.7%
Oregon 4 7,626 8,174 8,462 8,706 9,090 4.4% 19.2%
Pennsylvania 14 8,919 9,328 9,624 9,624 A A9,244 _3.9% 3.6%
Rhode Island 1 7,489 7,519 7,729 7,929 8,185 3.2% 9.3%
South Carolina 1 6,020 6,020 6,450 6,610 6,610 0.0% 9.8%
South Dakota 2 4,824 5,607 6,300 6,683 7,077 5.9% 46.7%
Tennessee 6 5,999 6,276 6,829 7,275 7,810 7.4% 30.2%
Texas 9 7,506 8,432 8,709 8,863 9,076 2.4% 20.9%
Utah 1 5,541 5,550 5,730 5,886 6,058 2.9% 9.3%
Vermont 2 8,552 9,008 9,408 9,860 10,276 4.2% 20.2%
Virginia 5 9,575 9,714 9,937 10,193 10,289 0.9% 7.5%
WASHINGTON 4 8,289 8,629 8,972 9,345 9,743 4.3% 17.5%
West Virginia 7 4,977 5,151 5,390 5,575 5,791 3.9% 16.3%
Wisconsin 4 7,488 7,935 8,625 9,109 9,891 8.6% 32.1%
Average* 6,598 6,928 7,276 7,649 7,943 3.8% 20.4%
Washington Rank 7 8 6 6 7
CHANGES FROM PREVIOUS YEAR:National Average 5.0% 5.0% 5.1% 3.8%
Washington 4.1% 4.0% 4.2% 4.3%
#Number of institutions in survey.*Does not include Alaska, Delaware, Hawaii, or Wyoming.^Fees reduced. 14
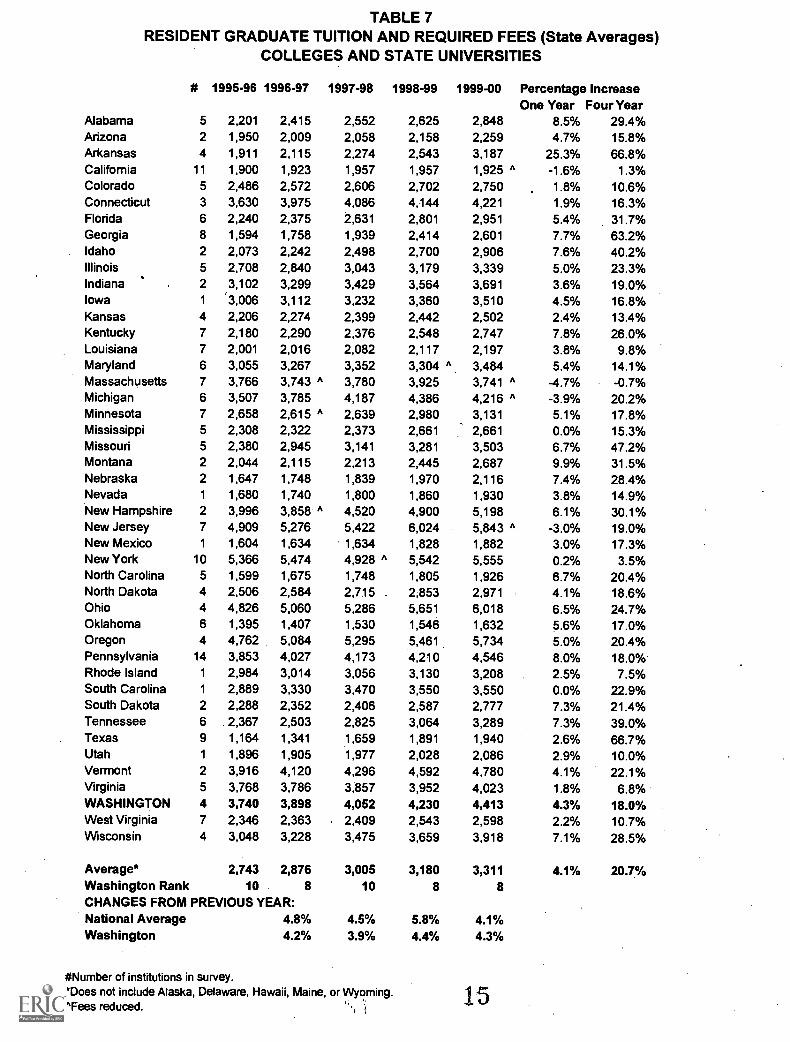
TABLE 7RESIDENT GRADUATE TUITION AND REQUIRED FEES (State Averages)
COLLEGES AND STATE UNIVERSITIES
# 1995-96 1996-97 1997-98 1998-99 1999-00 Percentage IncreaseOne Year Four Year
Alabama 5 2,201 2,415 2,552 2,625 2,848 8.5% 29.4%Arizona 2 1,950 2,009 2,058 2,158 2,259 4.7% 15.8%Arkansas 4 1,911 2,115 2,274 2,543 3,187 25.3% 66.8%California 11 1,900 1,923 1,957 1,957 1,925 A -1.6% 1.3%Colorado 5 2,486 2,572 2,606 2,702 2,750 1.8% 10.6%Connecticut 3 3,630 3,975 4,086 4,144 4,221 1.9% 16.3%Florida 6 2,240 2,375 2,631 2,801 2,951 5.4% 31.7%Georgia 8 1,594 1,758 1,939 2,414 2,601 7.7% 63.2%Idaho 2 2,073 2,242 2,498 2,700 2,906 7.6% 40.2%Illinois 5 2,708 2,840 3,043 3,179 3,339 5.0% 23.3%Indiana 2 3,102 3,299 3,429 3,564 3,691 3.6% 19.0%Iowa 1 3,006 3,112 3,232 3,360 3,510 4.5% 16.8%Kansas 4 2,206 2,274 2,399 2,442 2,502 2.4% 13.4%Kentucky 7 2,180 2,290 2,376 2,548 2,747 7.8% 26.0%Louisiana 7 2,001 2,016 2,082 2,117 2,197 3.8% 9.8%Maryland 6 3,055 3,267 3,352 3,304 A 3,484 5.4% 14.1%Massachusetts 7 3,766 3,743 ^ 3,780 3,925 A3,741 _4.7% -0.7%Michigan 6 3,507 3,785 4,187 4,386 A4,216 _3.9% 20.2%Minnesota 7 2,658 2,615 A 2,639 2,980 3,131 5.1% 17.8%Mississippi 5 2,308 2,322 2,373 2,661 2,661 0.0% 15.3%Missouri 5 2,380 2,945 3,141 3,281 3,503 6.7% 47.2%Montana 2 2,044 2,115 2,213 2,445 2,687 9.9% 31.5%Nebraska 2 1,647 1,748 1,839 1,970 2,116 7.4% 28.4%Nevada 1 1,680 1,740 1,800 1,860 1,930 3.8% 14.9%New Hampshire 2 3,996 3,858 A 4,520 4,900 5,198 6.1% 30.1%New Jersey 7 4,909 5,276 5,422 6,024 5,843 ^ -3.0% 19.0%New Mexico 1 1,604 1,634 1,634 1,828 1,882 3.0% 17.3%New York 10 5,366 5,474 4,928 A 5,542 5,555 0.2% 3.5%North Carolina 5 1,599 1,675 1,748 1,805 1,926 6.7% 20.4%North Dakota 4 2,506 2,584 2,7.15 2;853 2,971 4.1% 18.6%Ohio 4 4,826 5,060 5,286 5,651 6,018 6.5% 24.7%Oklahoma 6 1,395 1,407 1,530 1,546 1,632 5.6% 17.0%Oregon 4 4,762 5,084 5,295 5,461 5,734 5.0% 20.4%Pennsylvania 14 3,853 4,027 4,173 4,210 4,546 8.0% 18.0%Rhode Island 1 2,984 3,014 3,056 3,130 3,208 2.5% 7.5%South Carolina 1 2,889 3,330 3,470 3,550 3,550 0.0% 22.9%South Dakota 2 2,288 2,352 2,406 2,587 2,777 7.3% 21.4%Tennessee 6 2,367 2,503 2,825 3,064 3,289 7.3% 39.0%Texas 9 1,164 1,341 1,659 1,891 1,940 2.6% 66.7%Utah 1 1,896 1,905 1,977 2,028 2,086 2.9% 10.0%Vermont 2 3,916 4,120 4,296 4,592 4,780 4.1% 22.1%Virginia 5 3,768 3,786 3,857 3,952 4,023 1.8% 6.8%WASHINGTON 4 3,740 3,898 4,052 4,230 4,413 4.3% 18.0%West Virginia 7 2,346 2,363 2,409 2,543 2,598 2.2% 10.7%Wisconsin 4 3,048 3,228 3,475 3,659 3,918 7.1% 28.5%
Average* 2,743 2,876 3,005 3,180 3,311 4.1% 20.7%Washington Rank 10 8 10 8 8CHANGES FROM PREVIOUS YEAR:National Average 4.8% 4.5% 5.8% 4.1%Washington 4.2% 3.9% 4.4% 4.3%
#Number of institutions in survey.'Does not include Alaska, Delaware, Hawaii, Maine, or Wyoming.^Fees reduced.
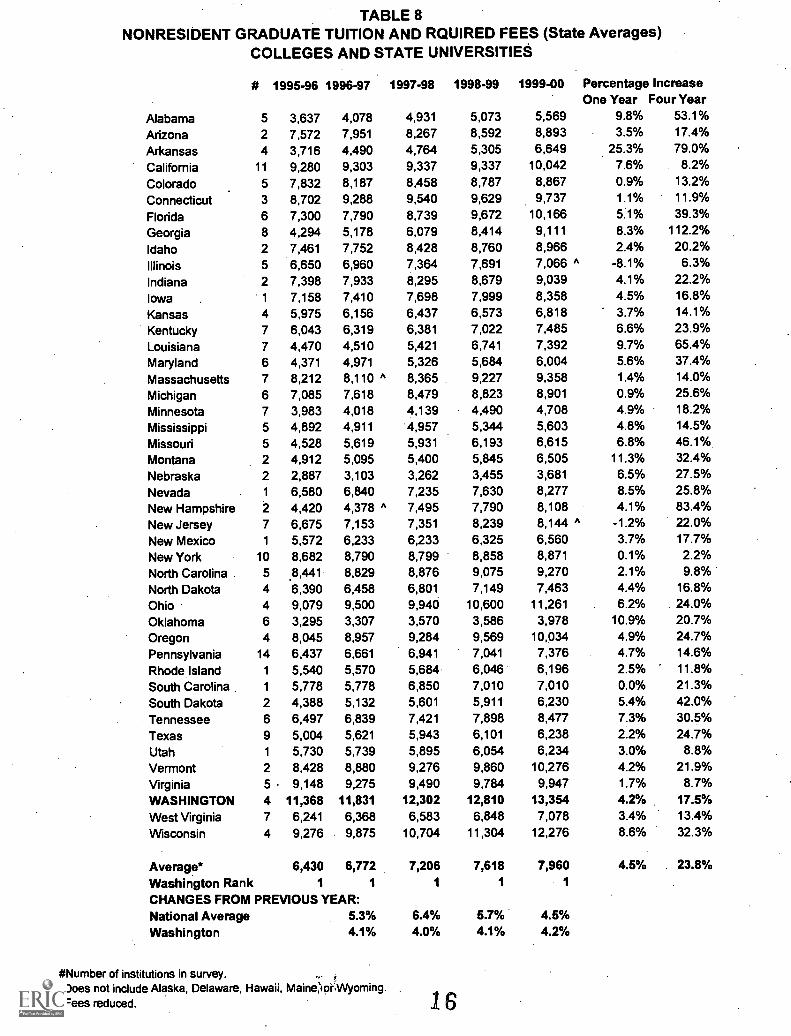
TABLE 8NONRESIDENT GRADUATE TUITION AND RQUIRED FEES (State Averages)
COLLEGES AND STATE UNIVERSITIES
# 1995-96 1996-97 1997-98 1998-99 1999-00 Percentage IncreaseOne Year Four Year
Alabama 5 3,637 4,078 4,931 5,073 5,569 9.8% 53.1%
Arizona 2 7,572 7,951 8,267 8,592 8,893 3.5% 17.4%
Arkansas 4 3,716 4,490 4,764 5,305 6,649 25.3% 79.0%
California 11 9,280 9,303 9,337 9,337 10,042 7.6% . 8.2%
Colorado 5 7,832 8,187 8,458 8,787 8,867 0.9% 13.2%
Connecticut 3 8,702 9,288 9,540 9,629 9,737 1.1% 11.9%
Florida 6 7,300 7,790 8,739 9,672 10,166 5:1% 39.3%
Georgia 8 4,294 5,178 6,079 8,414 9,111 8.3% 112.2%
Idaho 2 7,461 7,752 8,428 8,760 8,966 2.4% 20.2%
Illinois 5 6,650 6,960 7,364 7,691 7,066 A -8.1% 6.3%
Indiana 2 7,398 7,933 8,295 8,679 9,039 4.1% 22.2%
Iowa 1 7,158 7,410 7,698 7,999 8,358 4.5% 16.8%
Kansas 4 5,975 6,156 6,437 6,573 6,818 3.7% 14.1%
Kentucky 7 6,043 6,319 6,381 7,022 7,485 6.6% 23.9%
Louisiana 7 4,470 4,510 5,421 6,741 7,392 9.7% 65.4%
Maryland 6 4,371 4,971 5,326 5,684 6,004 5.6% 37.4%
Massachusetts 7 8,212 8,110 A 8,365 9,227 9,358 1.4% 14.0%
Michigan 6 7,085 7,618 8,479 8,823 8,901 0.9% 25.6%
Minnesota 7 3,983 4,018 4,139 4,490 4,708 4.9% 18.2%
Mississippi 5 4,892 4,911 4,957 5,344 5,603 4.8% 14.5%
Missouri 5 4,528 5,619 5,931 6,193 6,615 6.8% 46.1%,
Montana 2 4,912 5,095 5,400 5,845 6,505 11.3% 32.4%
Nebraska 2 2,887 3,103 3,262 3,455 3,681 6.5% 27.5%
Nevada 1 6,580 6,840 7,235 7,630 8,277 8.5% 25.8%
New Hampshire 2 4,420 4,378 A 7,495 7,790 8,108 4.1% 83.4%
New Jersey 7 6,675 7,153 7,351 8,239 8,144 A -1.2% 22.0%
New Mexico 1 5,572 6,233 6,233 6,325 6,560 3.7% 17.7%
New York 10 8,682 8,790 8,799 8,858 8,871 0.1% 2.2%
North Carolina 5 .8,441 8,829 8,876 9,075 9,270 2.1% 9.8%
North Dakota 4 6,390 6,458 6,801 7,149 7,463 4.4% 16.8%
Ohio 4 9,079 9,500 9,940 10,600 11,261 6.2% 24.0%
Oklahoma 6 3,295 3,307 3,570 3,586 3,978 10.9% 20.7%
Oregon 4 8,045 8,957 9,284 9,569 10,034 4.9% 24.7%
Pennsylvania 14 6,437 6,661 6,941 7,041 7,376 4.7% 14.6%
Rhode Island 1 5,540 5,570 5,684 6,046 6,196 2.5% 11.8%
South Carolina 1 5,778 5,778 6,850 7,010 7,010 0.0% 21.3%
South Dakota 2 4,388 5,132 5,601 5,911 6,230 5.4% 42.0%
Tennessee 6 6,497 6,839 7,421 7,898 8,477 7.3% 30.5%
Texas 9 5,004 5,621 5,943 6,101 6,238 2.2% 24.7%
Utah 1 5,730 5,739 5,895 6,054 6,234 3.0% 8.8%
Vermont 2 8,428 8,880 9,276 9,860 10,276 4.2% 21.9%
Virginia 5 9,148 9,275 9,490 9,784 9,947 1.7% 8.7%
WASHINGTON 4 11,368 11,831 12,302 12,810 13,354 4.2% 17.5%
West Virginia 7 6,241 6,368 6,583 6,848 7,078 3.4% 13.4%
Wisconsin 4 9,276 9,875 10,704 11,304 12,276 8.6% 32.3%
Average* 6,430 6,772 7,206 7,618 7,960 4.5% 23.8%
Washington Rank 1 1 1 1 1
CHANGES FROM PREVIOUS YEAR:National Average 5.3% 6.4% 5.7% 4.5%Washington 4.1% 4.0% 4.1% 4.2%
#Number of institutions in survey.*Does not include Alaska, Delaware, Hawaii, MainOorANyoming."Fees reduced. 16
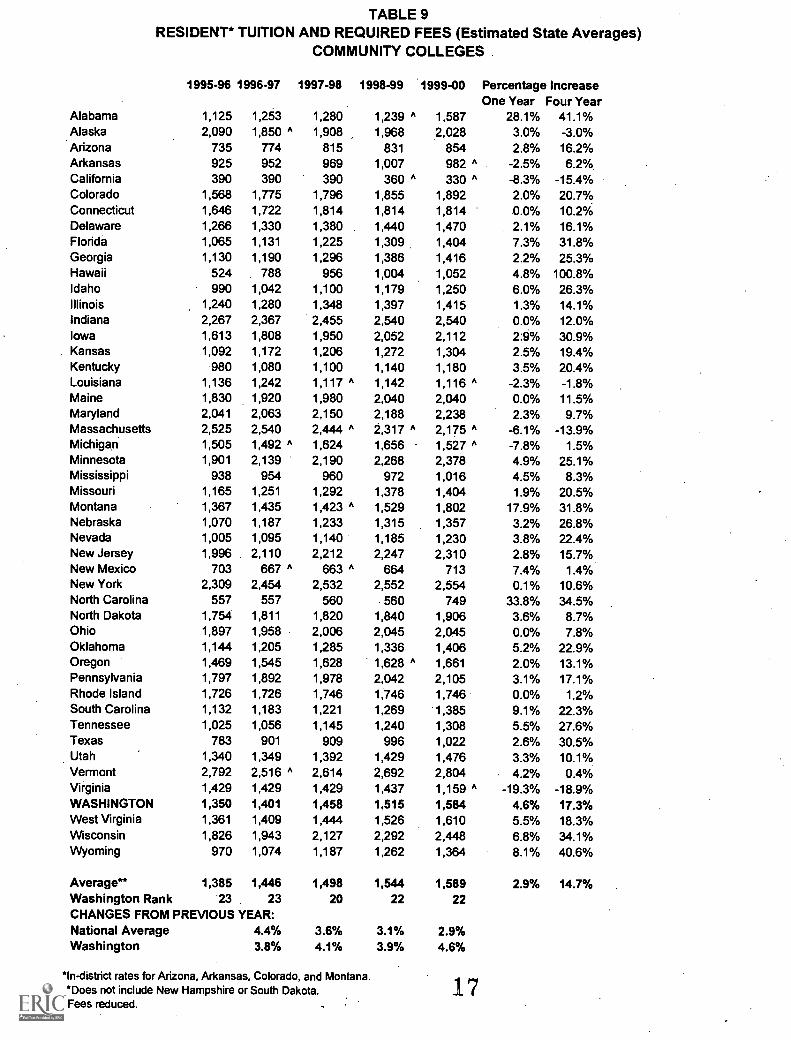
TABLE 9RESIDENT* TUITION AND REQUIRED FEES (Estimated State Averages)
COMMUNITY COLLEGES
1995-96 1996-97 1997-98 1998-99 1999-00 Percentage IncreaseOne Year Four Year
Alabama 1,125 1,253 1,280 1,239 A 1,587 28.1% 41.1%Alaska 2,090 A1,850 1,908 1,968 2,028 3.0% -3.0%Arizona 735 774 815 831 854 2.8% 16.2%Arkansas 925 952 969 1,007 A982 -2.5% 6.2%.California 390 390 390 360 A A330 -8.3% -15.4%Colorado 1,568 1,775 1,796 1,855 1,892 2.0% 20.7%Connecticut 1,646 1,722 1,814 1,814 1,814 .0.0% 10.2%Delaware 1,266 1,330 1,380 1,440 1,470 2.1% 16.1%Florida 1,065 1,131 1,225 1,309 1,404 7.3% 31.8%Georgia 1,130 1,190 1,296 1,386 1,416 2.2% 25.3%Hawaii 524 788 956 1,004 1,052 4.8% 100.8%Idaho 990 1,042 1,100 1,179 1,250 6.0% 26.3%Illinois 1,240 1,280 1,348 1,397 1,415 1.3% 14.1%Indiana 2,267 2,367 2,455 2,540 2,540 0.0% 12.0%Iowa 1,613 1,808 1,950 2,052 2,112 2.9% 30.9%Kansas 1,092 1,172 1,206 1,272 1,304 2.5% 19.4%Kentucky 980 1,080 1,100 1,140 1,180 3.5% 20.4%Louisiana 1,136 1,242 1,117 A 1,142 A1,116 -2.3% -1.8%Maine 1,830 1,920 1,980 2,040 2,040 0.0% 11.5%Maryland 2,041 2,063 2,150 2,188 2,238 2.3% 9.7%Massachusetts 2,525 2,540 2,444 A 2,317 A A2,175 -6.1% -13.9%Michigan 1,505 1,492 A 1,624 1,656 A1,527 -7.8% 1.5%Minnesota 1,901 2,139 2,190 2,268 2,378 4.9% 25.1%Mississippi 938 954 960 972 1,016 4.5% 8.3%Missouri 1,165 1,251 1,292 1,378 1,404 1.9% 20.5%Montana 1,367 1,435 1,423 A 1,529 1,802 17.9% 31.8%Nebraska 1,070 1,187 1,233 1,315 1,357 3.2% 26.8%Nevada 1,005 1,095 1,140 1,185 1,230 3.8% 22.4%New Jersey 1,996 2,110 2,212 2,247 2,310 2.8% 15.7%.New Mexico 703 667 A 663 A 664 713 7.4% 1.4%New York 2,309 2,454 2,532 2,552 2,554 0.1% 10.6%North Carolina 557 557 560 560 749 33.8% 34.5%North Dakota 1,754 1,811 1,820 1,840 1,906 3.6% 8.7%Ohio 1,897 1,958 2,006 2,045 2,045 0.0% 7.8%Oklahoma 1,144 1,205 1,285 1,336 1,406 5.2% 22.9%Oregon 1,469 1,545 1,628 A1,628 1,661 2.0% 13.1%Pennsylvania 1,797 1,892 1,978 2,042 2,105 3.1% 17.1%Rhode Island 1,726 1,726 1,746 1,746 1,746 0.0% 1.2%South Carolina 1,132 1,183 1,221 1,269 1,385 9.1% 22.3%Tennessee 1,025 1,056 1,145 1,240 1,308 5.5% 27.6%Texas 783 901 909 996 1,022 2.6% 30.5%Utah 1,340 1,349 1,392 1,429 1,476 3.3% 10.1%Vermont 2,792 2,516 A 2,614 2,692 2,804 4.2% 0.4%Virginia 1,429 1,429 1,429 1,437 1,159 A -19.3% -18.9%WASHINGTON 1,350 1,401 1,458 1.515 1,584 4.6% 17.3%West Virginia 1,361 1,409 1,444 1,526 1,610 5.5% 18.3%Wisconsin 1,826 1,943 2,127 2,292 2,448 6.8% 34.1%Wyoming 970 1,074 1,187 1,262 1,364 8.1% 40.6%
Average" 1,385 1,446 1,498 1,544 1,589 2.9% 14.7%Washington Rank 23 23 20 22 22CHANGES FROM PREVIOUS YEAR:National Average 4.4% 3.6% 3.1% 2.9%Washington 3.8% 4.1% 3.9% 4.6%
"In-district rates for Arizona, Arkansas, Colorado, and Montana.**Does not include New Hampshire or South Dakota.^Fees reduced.
17
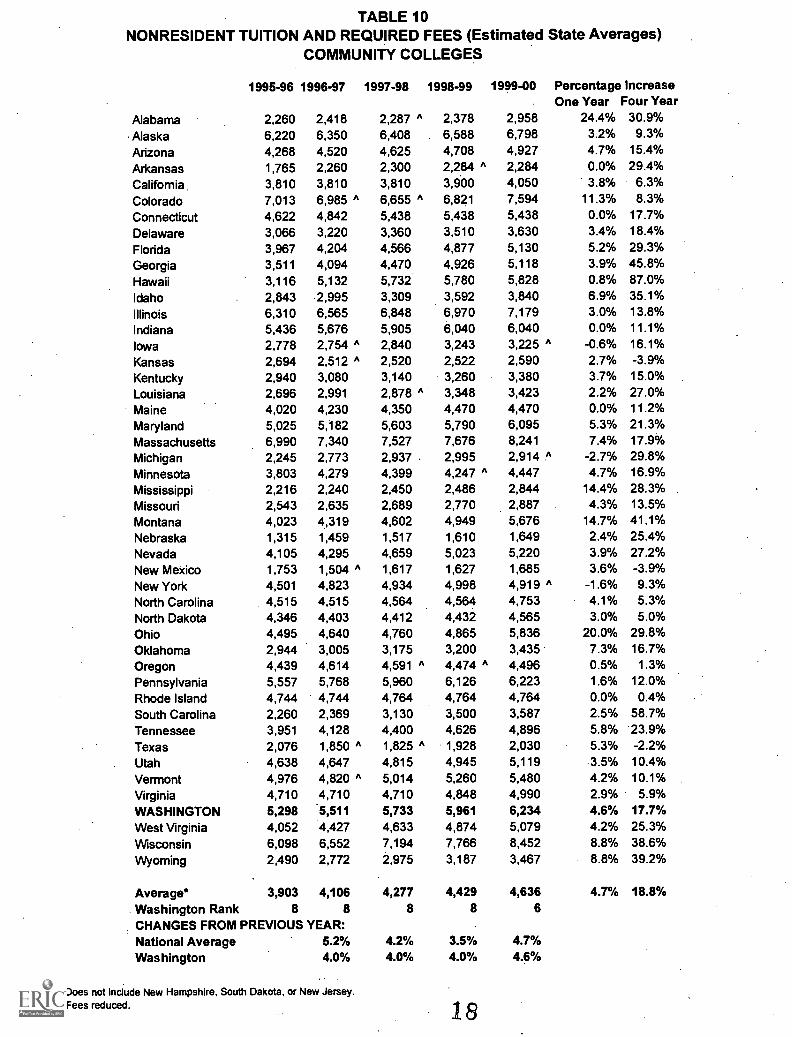
TABLE 10NONRESIDENT TUITION AND REQUIRED FEES (Estimated State Averages)
COMMUNITY COLLEGES
1995-96 1996-97 1997-98 1998-99 1999-00 Percentage IncreaseOne Year Four Year
Alabama 2,260 2,418 2,287 A 2,378 2,958 24.4% 30.9%
Alaska 6,220 6,350 6,408 6,588 6,798 3.2% 9.3%
Arizona 4,268 4,520 4,625 4,708 4,927 4.7% 15.4%
Arkansas 1,765 2,260 2,300 A2,284 2,284 0.0% 29.4%
California 3,810 3,810 3,810 3,900 4,050 3.8% 6.3%
Colorado 7,013 6,985 A 6,655 A 6,821 7,594 11.3% 8.3%
Connecticut 4,622 4,842 5,438 5,438 5,438 0.0% 17.7%
Delaware 3,066 3,220 3,360 3,510 3,630 3.4% 18.4%
Florida 3,967 4,204 4,566 4,877 5,130 5.2% 29.3%
Georgia 3,511 4,094 4,470 4,926 5,118 3.9% 45.8%
Hawaii 3,116 5,132 5,732 5,780 5,828 0.8% 87.0%
Idaho 2,843 2,995 3,309 3,592 3,840 6.9% 35.1%
Illinois 6,310 6,565 6,848 6,970 7,179 3.0% 13.8%
Indiana 5,436 5,676 5,905 6,040 6,040 0.0% 11.1%
Iowa 2,778 2,754 A 2,840 3,243 A3,225 -0.6% 16.1%
Kansas 2,694 2,512 A 2,520 2,522 2,590 2.7% -3.9%
Kentucky 2,940 3,080 3,140 3,260 3,380 3.7% 15.0%
Louisiana 2,696 2,991 2,878 A 3,348 3,423 2.2% 27.0%
Maine 4,020 4,230 4,350 4,470 4,470 0.0% 11.2%
Maryland 5,025 5,182 5,603 5,790 6,095 5.3% 21.3%
Massachusetts 6,990 7,340 7,527 7,676 8,241 7.4% 17.9%
Michigan 2,245 2,773 2,937 2,995 2,914 A -2.7% 29.8%
Minnesota 3,803 4,279 4,399 4,247 A 4,447 4.7% 16.9%
Mississippi 2,216 2,240 2,450 2,486 2,844 14.4% 28.3%
Missouri 2,543 2,635 2,689 2,770 2,887 4.3% 13.5%
Montana 4,023 4,319 4,602 4,949 5,676 14.7% 41.1%
Nebraska 1,315 1,459 1,517 1,610 1,649 2.4% 25.4%
Nevada 4,105 4,295 4,659 5,023 5,220 3.9% 27.2%
New Mexico 1,753 1,504 A 1,617 1,627 1,685 3.6% -3.9%
New York 4,501 4,823 4,934 4,998 4,919 A -1.6% 9.3%
North Carolina 4,515 4,515 4,564 4,564 4,753 4.1% 5.3%
North Dakota 4,346 4,403 4,412 4,432 4,565 3.0% 5.0%
Ohio 4,495 4,640 4,760 4,865 5,836 20.0% 29.8%Oklahoma 2,944 3,005 3,175 3,200 3,435 7.3% 16.7%
Oregon 4,439 4,614 4,591 A 4,474 A 4,496 0.5% 1.3%
Pennsylvania 5,557 5,768 5,960 6,126 6,223 1.6% 12.0%
Rhode Island 4,744 4,744 4,764 4,764 4,764 0.0% 0.4%
South Carolina 2,260 2,369 3,130 3,500 3,587 2.5% 58.7%Tennessee 3,951 4,128 4,400 4,626 4,896 5.8% 23.9%Texas 2,076 1,850 A 1,825 A 1,928 2,030 5.3% -2.2%
Utah 4,638 4,647 4,815 4,945 5,119 3.5% 10.4%
Vermont 4,976 4,820 A 5,014 5,260 5,480 4.2% 10.1%
Virginia 4,710 4,710 4,710 4,848 4,990 2.9% 5.9%
WASHINGTON 5,298 5,511 5,733 5,961 6,234 4.6% 17.7%
West Virginia 4,052 4,427 4,633 4,874 5,079 4.2% 25.3%
Wisconsin 6,098 6,552 7,194 7,766 8,452 8.8% 38.6%Wyoming 2,490 2,772 2,975 3,187 3,467 8.8% 39.2%
Average* 3,903 4,106 4,277 4,429 4,636 4.7% 18.8%
Washington Rank 8 8 8 8 6CHANGES FROM PREVIOUS YEAR:National Average 5.2% 4.2% 3.5% 4.7%Washington 4.0% 4.0% 4.0% 4.6%
*Does not include New Hampshire, South Dakota, or New Jersey."Fees reduced.
APPENDIX A
PEER COMPARISON GROUPS
19
PEER COMPARISON GROUPS
The development and use of peer institution comparison groups is a subject familiar to mostinstitutions and state coordinating and governing boards. Washington higher education,legislative, and executive staff have twice studied the role and selection of peer institutions inrecent years. In 1988, the Higher Education Coordinating Board undertook a study to developpeer groups reflecting a national perspective. Concurrently, a special joint legislative andexecutive study group was appointed to review the higher education master plan fundingrecommendations, with peer comparison groups identified as one of its areas of study. TheJoint Study Group and the Board worked together and adopted the following peer policies:
1. The Carnegie Commission's classification of institutions is used as the basisfor selecting comparison groups for Washington institutions of highereducation.
2. The national comparison group for the University of Washington is allpublic institutions in the Carnegie classification Research Universitiescategory 1 with medical schools.
3. The national comparison group for Washington State University is allpublic land grant universities in the Carnegie classification ResearchUniversities categories 1 and 2 with veterinary schools.
4. The national comparison group for Central, Eastern, and WesternWashington Universities is all public institutions in the Carnegieclassification Comprehensive Colleges and Universities category 1.
5. The national comparison group for the Washington community collegesystem is all state community college systems.
A peer group for The Evergreen State College was adopted by the Higher EducationCoordinating Board in 1990 using the Carnegie Commission classification of institutions. Acomposite category of public institutions in the Comprehensive I and Liberal Arts IIclassification was screened. Institutions were selected based on size, similarities of degreesawarded, and other characteristics common to The Evergreen State College.
A summary of Washington tuition and fee rates compared with those at peer institutions isshown on page 3. Detailed tables follow this narrative.
20
Although these groups, as herein defined, are not used in the development of Washington'stuition and fee policy, data on the adopted peer groups for the University of Washington andWashington State University are displayed in Tables Al through A8, respectively, as aresource for interested persons. Tables A9 through A14 display the tuition and fee charges forthe first professional degree programs of medicine, dentistry, and veterinary medicine for thesame institutions.
Data on the 215 state colleges and universities contained in Tables 5 through 8 provide areasonable perspective on the national group selected for comparison with Central, Eastern,and Western Washington Universities. Similarly, Tables 9 and 10 represent the nationalgroup selected for the Washington Community College System.
Data for The Evergreen State College peer group are reported in Tables A15 through A18.
21.
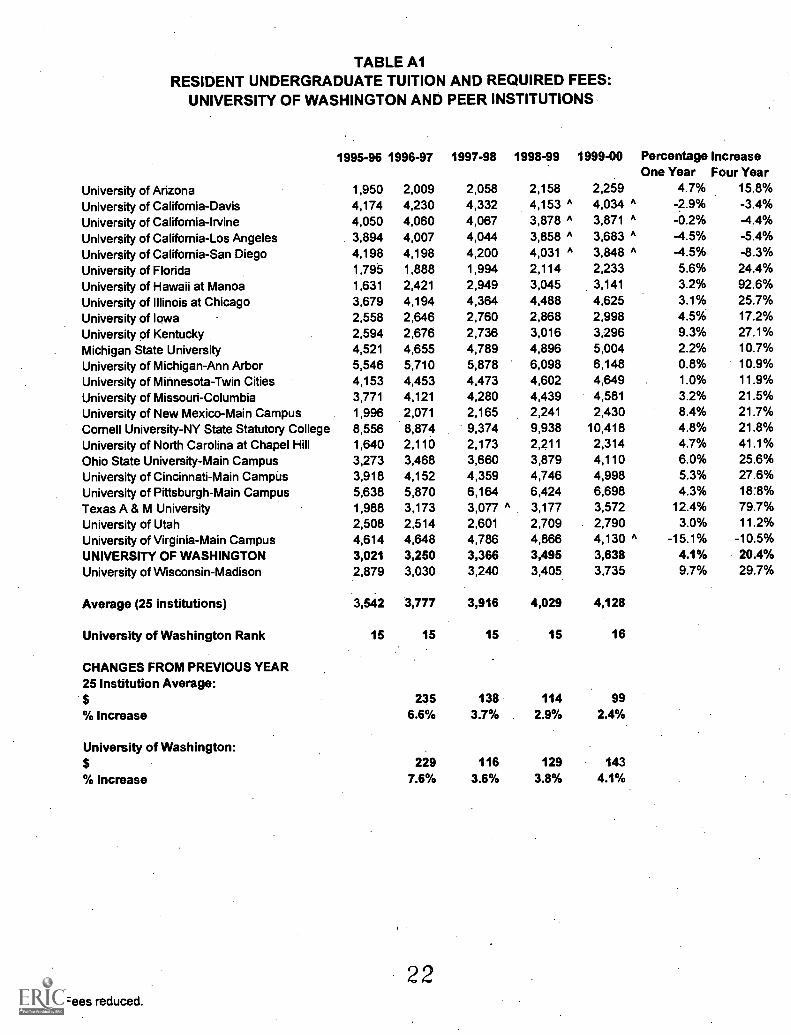
TABLE AlRESIDENT UNDERGRADUATE TUITION AND REQUIRED FEES:
UNIVERSITY OF WASHINGTON AND PEER INSTITUTIONS
1995-96 1996-97 1997-98 1998-99 1999-00 Percentage IncreaseOne Year Four Year
University of Arizona 1,950 2,009 2,058 2,158 2,259 4.7% 15.8%
University of California-Davis 4,174 4,230 4,332 4,153 ^ 4,034 ^ -2.9% -3.4%
University of California-Irvine 4,050 4,060 4,067 3,878 ^ 3,871 ^ -0.2% -4.4%
University of California-Los Angeles 3,894 4,007 4,044 3,858 ^ 3,683 ^ -4.5% -5A%University of California-San Diego 4,198 4,198 4,200 4,031 ^ 3,848 ^ -4.5% -8.3%
University of Florida 1,795 1,888 1,994 2,114 2,233 5.6% 24.4%
University of Hawaii at Manoa 1,631 2,421 2,949 3,045 3,141 3.2% 92.6%
University of Illinois at Chicago 3,679 4,194 4,364 4,488 4,625 3.1% 25.7%
University of Iowa 2,558 2,646 2,760 2,868 2,998 4.5% 17.2%
University of Kentucky 2,594 2,676 2,736 3,016 3,296 9.3% 27.1%
Michigan State University 4,521 4,655 4,789 4,896 5,004 2.2% 10.7%
University of Michigan-Ann Arbor 5,546 5,710 5,878 6,098 6,148 0.8% 10.9%
University of Minnesota-Twin Cities 4,153 4,453 4,473 4,602 4,649 1.0% 11.9%
University of Missouri-Columbia 3,771 4,121 4,280 4,439 4,581 3.2% 21.5%
University of New Mexico-Main Campus 1,996 2,071 2,165 2,241 2,430 8.4% 21.7%
Cornell University-NY State Statutory College 8,556 8,874 9,374 9,938 10,418 4.8% 21.8%
University of North Carolina at Chapel Hill 1,640 2,110 2,173 2,211 2,314 4.7% 41.1%
Ohio State University-Main Campus 3,273 3,468 3,660 3,879 4,110 6.0% 25.6%
University of Cincinnati-Main Campus 3,918 4,152 4,359 4,746 4,998 5.3% 27.6%
University of Pittsburgh-Main Campus 5,638 5,870 6,164 6,424 6,698 4.3% 18:8%
Texas A & M University 1,988 3,173 3,077 ^ 3,177 3,572 12.4% 79.7%
University of Utah 2,508 2,514 2,601 2,709 2,790 3.0% 11.2%
University of Virginia-Main Campus 4,614 4,648 4,786 4,866 4,130 ^ -15.1% -10.5%
UNIVERSITY OF WASHINGTON 3,021 3,250 3,366 3,495 3,638 4.1% 20.4%
University of Wisconsin-Madison 2,879 3,030 3,240 3,405 3,735 9.7% 29.7%
Average (25 institutions) 3,542 3,777 3,916 4,029 4,128
University of Washington Rank 15 15 15 15 16
CHANGES FROM PREVIOUS YEAR25 Institution Average:
235 138 114 99
% Increase 6.6% 3.7% 2.9% 2.4%
University of Washington:$ 229 116 129 143
% Increase 7.6% 3.6% 3.8% 4.1%
22^Fees reduced.

TABLE A2NONRESIDENT UNDERGRADUATE TUITION AND REQUIRED FEES:
UNIVERSITY OF WASHINGTON AND PEER INSTITUTIONS
1995-96 1996-97 1997-98 1998-99 1999-00 Percentage IncreaseOne Year Four Year
University of Arizona 7,978 8,377 8,710 9,110 9,411 3.3% 18.0%University of California-Davis 11,873 12,624 13,316 13,727 14,208 3.5% 19.7%University of California-Irvine 11,749 12,454 13,052 13,451 14,045 4.4% 19.5%University of California-Los Angeles 11,593 12,401 13,026 13,431 13,857 3.2% 19.5%University of Califomia-San-Diego 11,897 12,592 13,185 14,309 14,022 " -2.0% 17.9%University of Florida 6,697 7,133 7,911 8,769 9,222 5.2% 37.7%University of Hawaii at Manoa 4,825 7,869 9,429 9,525 9,621 1.0% 99.4%University of Illinois at Chicago 8,764 9,539 10,276 10,580 10,901 3.0% 24.4%University of Iowa 8,808 9,244 9,616 9,990 10,440 4.5% 18.5%University of Kentucky 7,114 7,356 7,536 8,376 9,216 10.0% 29.5%Michigan State University 11,377 11,720 11,854 12,126 12,406 2.3% 9.0%University of Michigan-Ann Arbor 17,671 17,916 18,444 19,156 19,576 2.2% 10.8%University of Minnesota-Twin Cities 11,317 11,869 11,920 12,277 12,789 4.2% 13.0%University of Missouri-Columbia 10,395 11,342 11,723 12,107 12,495 3.2% 20.2%University of New Mexico-Main Campus 7,542 7,822 8,174 8,461 9,172 8.4% 21.6%Cornell University-NY State Statutory Colleges 16,525 17,134 18,024 18,988 19,988 5.3% 21.0%University of North Carolina at Chapel Hill 9,756 10,642 11,159 11,377 11,480 0.9% 17.7%Ohio State University-Main Campus 9,315 9,813 10,869 11,448 12,060 5.3% 29.5%University of Cincinnati-Main Campus 9,873 10,464 10,986 12,252 12,379 1.0% 25.4%University of Pittsburgh-Main Campus 11,724 12,230 12,928 13,458 14,014 4.1% 19.5%Texas A & M University 7,748 9,593 9,497 A 9,567 10,052 5.1% 29.7%University of Utah 7,707 7,713 7,998 8,251 8,495 3.0% 10.2%University of Virginia-Main Campus 14,006 14,434 15,030 15,814 16,603 5.0% 18.5%UNIVERSITY OF WASHINGTON 8,525 9,866 10,656 11,517 12,029 4.4% 41.1%University of Wisconsin-Madison 9,634 10,148 10,979 11,586. 13,049 12.6% 35.4%
Average (25 institutions) 10,177 10,892 11,452 11,986 12,461
University of Washington Rank 18 15 16 14 15
CHANGES FROM PREVIOUS YEAR25 Institution Average:
715 560 534 475% Increase 7.0% 5.1% 4.7% 4.0%
University of Washington:$ 1,341 790 861 512% Increase 15.7% 8.0% 8.1% 4.4%
23
"Fees reduced.
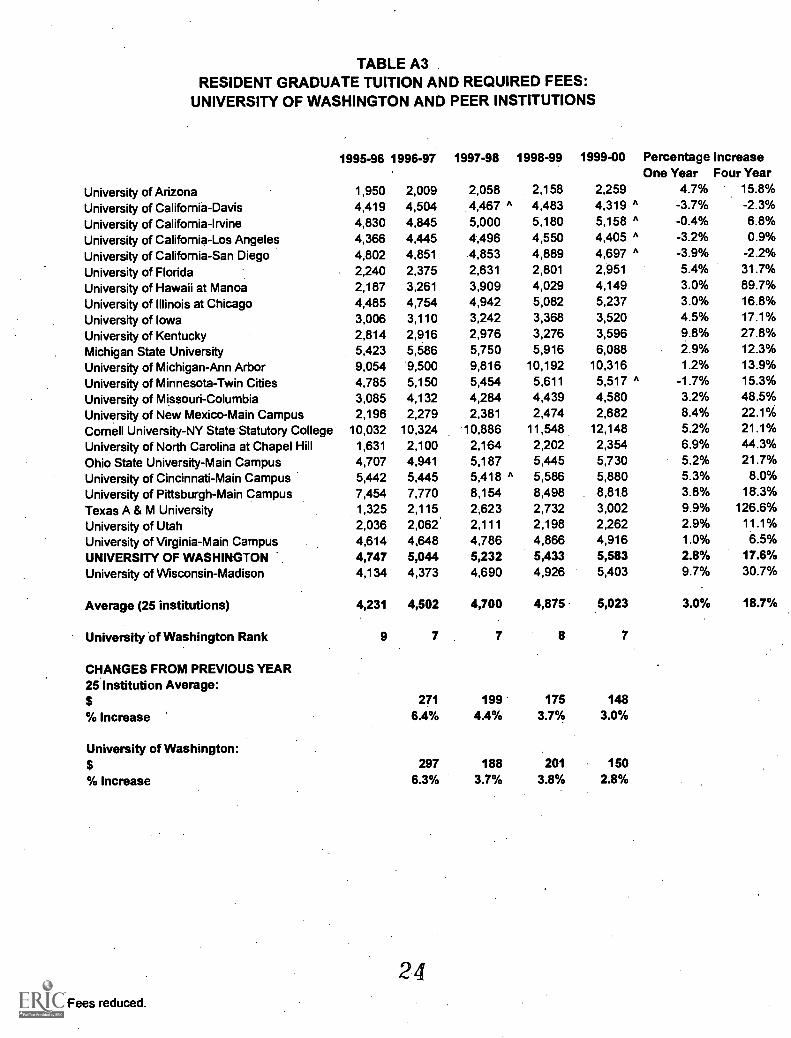
TABLE A3RESIDENT GRADUATE TUITION AND REQUIRED FEES:
UNIVERSITY OF WASHINGTON AND PEER INSTITUTIONS
1995-96 1996-97 1997-98 1998-99 1999-00 Percentage IncreaseOne Year Four Year
University of Arizona 1,950 2,009 2,058 2,158 2,259 4.7% 15.8%
University of California-Davis 4,419 4,504 4,467 ^ 4,483 A4,319 _3.7ok -2.3%
University of California-Irvine 4,830 4,845 5,000 5,180 A5,158 -0.4% 6.8%
University of California-Los Angeles 4,366 4,4.45 4,496 4,550 4,405 ^ -3.2% 0.9%
University of California-San Diego 4,802 4,851 4,853 4,889 A4,697 _3.9ok -2.2%
University of Florida 2,240 2,375 2,631 2,801 2,951 5.4% 31.7%
University of Hawaii at Manoa 2,187 3,261 3,909 4,029 4,149 3.0% 89.7%
University of Illinois at Chicago 4,485 4,754 4,942 5,082 5,237 3.0% 16.8%
University of Iowa 3,006 3,110 3,242 3,368 3,520 4.5% 17.1%
University of Kentucky 2,814 2,916 2,976 3,276 3,596 9.8% 27.8%
Michigan State University 5,423 5,586 5,750 5,916 6,088 2.9% 12.3%
University of Michigan-Ann Arbor 9,054 9,500 9,816 10,192 10,316 1.2% 13.9%
University of Minnesota-Twin Cities 4,785 5,150 5,454 5,611 5,517 A -1.7% 15.3%
University of Missouri-Columbia 3,085 4,132 4,284 4,439 4,580 3.2% 48.5%
University of New Mexico-Main Campus 2,196 2,279 2,381 2,474 2,682 8.4% 22.1%
Cornell University-NY State Statutory College 10,032 10,324 10,886 11,548 12,148 5.2% 21.1%
University of North Carolina at Chapel Hill 1,631 2,100 2,164 2,202 2,354 6.9% 44.3%
Ohio State University-Main Campus 4,707 4,941 5,187 5,445 5,730 5.2% 21.7%
University of Cincinnati-Main Campus 5,442 5,445 5,418 ^ 5,586 5,880 5.3% 8.0%
University of Pittsburgh-Main Campus 7,454 7,770 8,154 8,498 8,81.8 3.8% 18-.3%
Texas A & M University 1,325 2,115 2,623 2,732 3,002 9.9% 126.6%
University of Utah 2,036 2,062 2,111 2,198 2,262 2.9% 11.1%
University of Virginia-Main Campus 4,614 4,648 4,786 4,866 4,916 1.0% 6.5%
UNIVERSITY OF WASHINGTON 4,747 5,044 5,232 5,433 5,583 2.8% 17.6%
University of Wisconsin-Madison 4,134 4,373 4,690 4,926 5,403 9.7% 30.7%
Average (25 institutions) 4,231 4,502 4,700 4,875 5,023 3.0% 18.7%
University' of Washington Rank 9 7 7 8 7
CHANGES FROM PREVIOUS YEAR25 Institution Average:$ 271 199 175 148
% Increase 6.4% 4.4% 3.7% 3.0%
University of Washington:$ 297 188 201 150
% Increase 6.3% 3.7% 3.8% 2.8%
24^Fees reduced.
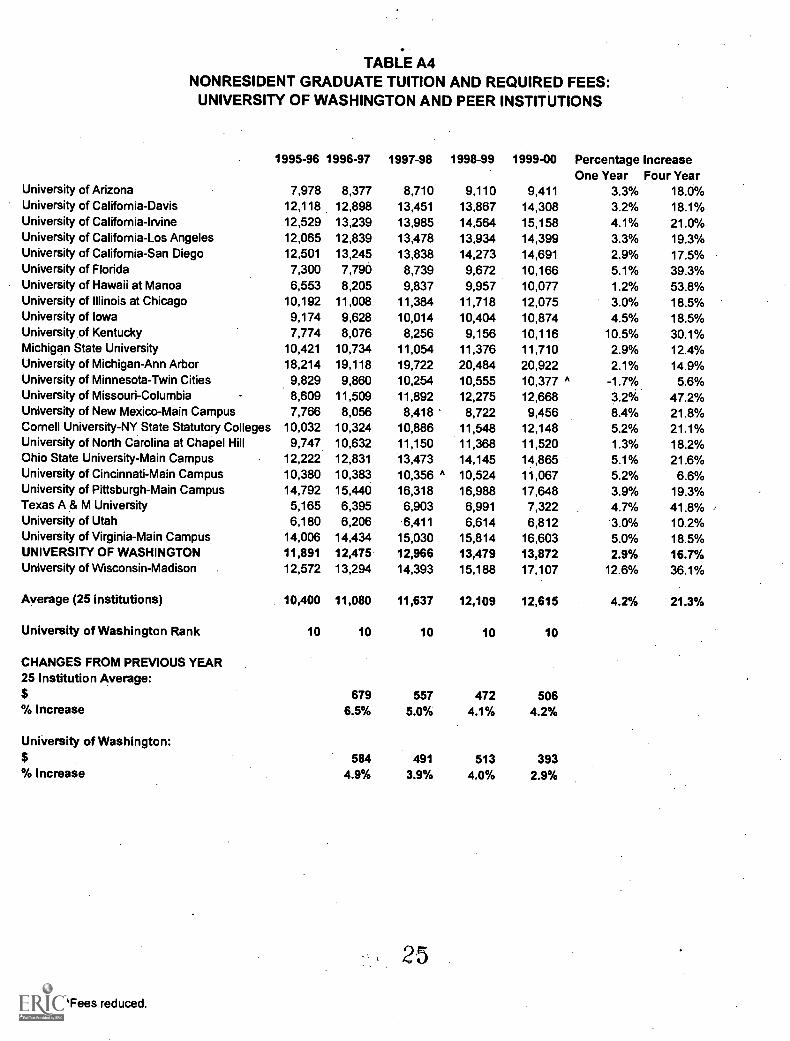
TABLE A4NONRESIDENT GRADUATE TUITION AND REQUIRED FEES:UNIVERSITY OF WASHINGTON AND PEER INSTITUTIONS
1995-96 1996-97 1997-98 1998-99 1999-00 Percentage IncreaseOne Year Four Year
University of Arizona 7,978 8,377 8,710 9,110 9,411 3.3% 18.0%University of California-Davis 12,118 12,898 13,451 13,867 14,308. 3.2% 18.1%University of California-Irvine 12,529 13,239 13,985 14,564 15,158 4.1% 21.0%University of California-Los Angeles 12,065 12,839 13,478 13,934 14,399 3.3% 19.3%University of California-San Diego 12,501 13,245 13,838 14,273 14,691 2.9% 17.5%University of Florida 7,300 7,790 8,739 9,672 10,166 5.1% 39.3%University of Hawaii at Manoa 6,553 8,205 9,837 9,957 10,077 1.2% 53.8%University of Illinois at Chicago 10,192 11,008 11,384 11,718 12,075 3.0% 18.5%University of Iowa 9,174 9,628 10,014 10,404 10,874 4.5% 18.5%University of Kentucky 7,774 8,076 8,256 9,156 10,116 10.5% 30.1%Michigan State University 10,421 10,734 11,054 11,376 11,710 2.9% 12.4%University of Michigan-Ann Arbor 18,214 19,118 19,722 20,484 20,922 2.1% 14.9%University of Minnesota-Twin Cities 9,829 9,860 10,254 10,555 10,377 A -1.7% 5.6%University of Missouri-Columbia 8,609 11,509 11,892 12,275 12,668 3.2% 47.2%University of New Mexico-Main Campus 7,766 8,056 8,418 8,722 9,456 8.4% 21.8%Cornell University-NY State Statutory Colleges 10,032 10,324 10,886 11,548 12,148 5.2% 21.1%University of North Carolina at Chapel Hill 9,747. 10,632 11,150 11,368 11,520 1.3% 18.2%Ohio State University-Main Campus 12,222 12,831 13,473 14,145 14,865 5.1% 21.6%University of Cincinnati-Main Campus 10,380 10,383 10,356 A 10,524 11,067 5.2% 6.6%University of Pittsburgh-Main Campus 14,792 15,440 16,318 16,988 17,648 3.9% 19.3%Texas A & M University 5,165 6,395 6,903 6,991 7,322 4.7% 41.8%University of Utah 6,180 6,206 6,411 6,614 6,812 3.0% 10.2%University of Virginia-Main Campus 14,006 14,434 15,030 15,814 16,603 5.0% 18.5%UNIVERSITY OF WASHINGTON 11,891 12,475 12,966 13,479 13,872 2.9% 16.7%University of Wisconsin-Madison 12,572 13,294 14,393 15,188 17,107 12.6% 36.1%
Average (25 institutions) 10,400 11,080 11,637 12,109 12,615 4.2% 21.3%
University of Washington Rank 10 10 10 10 10
CHANGES FROM PREVIOUS YEAR25 Institution Average:$ 679 557 472 506% Increase 6.5% 5.0% 4.1% 4.2%
University of Washington:$ 584 491 513 393% Increase 4.9% 3.9% 4.0% 2.9%
25
^Fees reduced.
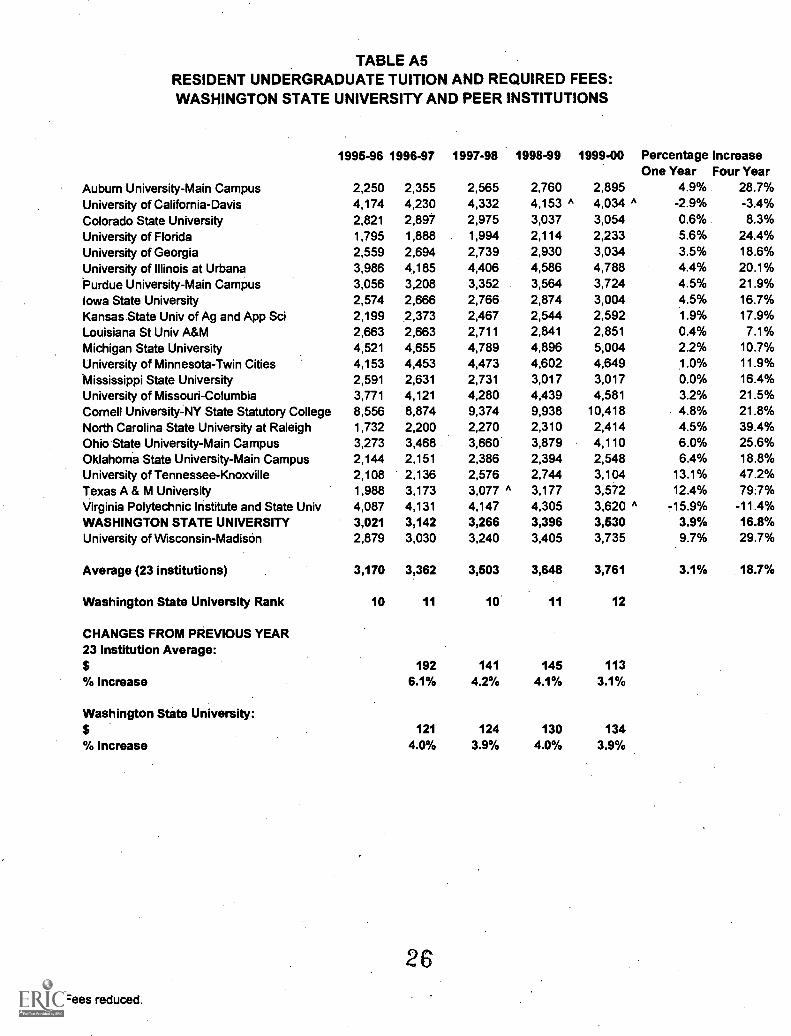
TABLE A5RESIDENT UNDERGRADUATE TUITION AND REQUIRED FEES:WASHINGTON STATE UNIVERSITY AND PEER INSTITUTIONS
1995-96 1996-97 1997-98 1998-99 1999-00 Percentage IncreaseOne Year Four Year
Auburn University-Main Campus 2,250 2,355 2,565 2,760 2,895 4.9% 28.7%
University of California-Davis 4,174 4,230 4,332 4,153 ^ 4,034 A -2.9% -3.4%
Colorado State University 2,821 2,897 2,975 3,037 3,054 0.6% 8.3%
University of Florida 1,795 1,888 1,994 2,114 2,233 5.6% 24.4%
University of Georgia 2,559 2,694 2,739 2,930 3,034 3.5% 18.6%
University of Illinois at Urbana 3,986 4,185 4,406 4,586 4,788 4.4% 20.1%Purdue University-Main Campus 3,056 3,208 3,352 3,564 3,724 4.5% 21.9%Iowa State University 2,574 2,666 2,766 2,874 3,004 4.5% 16.7%Kansas State Univ of Ag and App Sci 2,199 2,373 2,467 2,544 2,592 1.9% 17.9%
Louisiana St Univ A&M 2,663 2,663 2,711 2,841 2,851 0.4% 7.1%Michigan State University 4,521 4,655 4,789 4,896 5,004 2.2% 10.7%University of Minnesota-Twin Cities 4,153 4,453 4,473 4,602 4,649 1.0% 11.9%
Mississippi State University 2,591 2,631 2,731 3,017 3,017 0.0% 16.4%University of Missouri-Columbia 3,771 4,121 4,280 4,439 4,581 3.2% 21.5%Cornell University-NY State Statutory College 8,556 8,874 9,374 9,938 10,418 4.8% 21.8%North Carolina State University at Raleigh 1,732 2,200 2,270 2,310 2,414 4.5% 39.4%Ohio State University-Main Campus 3,273 3,468 3,660 3,879 4,110 6.0% 25.6%Oklahoma State University-Main Campus 2,144 2,151 2,386 2,394 2,548 6.4% 18.8%University of Tennessee-Knoxville 2,108 2,136 2,576 2,744 3,104 13.1% 47.2%Texas A & M University 1,988 3,173 3,077 ^ 3,177 3,572 12.4% 79:7%Virginia Polytechnic Institute and State Univ 4,087 4,131 4,147 4,305 3,620 ^ -15.9% -11.4%WASHINGTON STATE UNIVERSITY 3,021 3,142 3,266 3,396 3,530 3.9% 16.8%University of Wisconsin-Madison 2,879 3,030 3,240 3,405 3,735 9.7% 29.7%
Average (23 institutions) 3,170 3,362 3,503 3,648 3,761 3.1% 18.7%
Washington State University Rank 10 11 10 11 12
CHANGES FROM PREVIOUS YEAR23 Institution Average:
192 141 145 113% Increase 6.1% 4.2% 4.1% 3.1%
Washington State University:$ 121 124 130 134% Increase 4.0% 3.9% 4.0% 3.9%
26^Fees reduced.
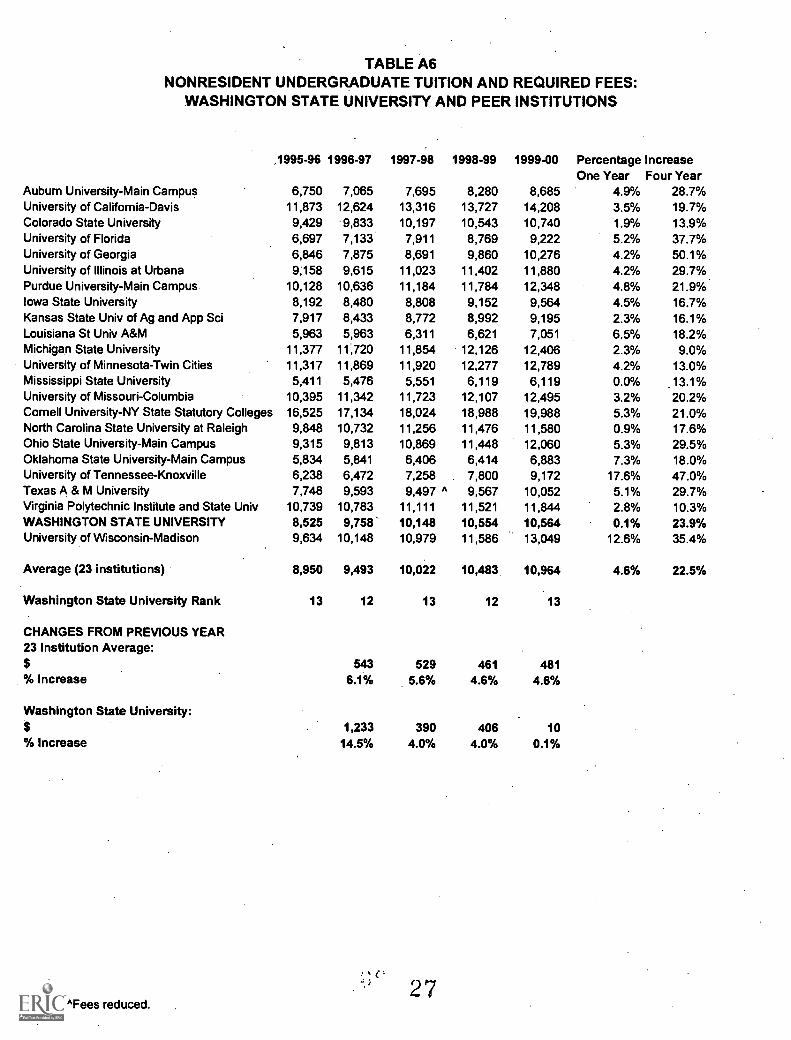
TABLE A6NONRESIDENT UNDERGRADUATE TUITION AND REQUIRED FEES:
WASHINGTON STATE UNIVERSITY AND PEER INSTITUTIONS
1995-96 1996-97 1997-98 1998-99 1999-00 Percentage IncreaseOne Year Four Year
Auburn University-Main Campus 6,750 7,065 7,695 8,280 8,685 4.9% 28.7%University of California-Davis 11,873 12,624 13,316 13,727 14,208 3.5% 19.7%Colorado State University 9,429 9,833 10,197 10,543 10,740 1.9% 13.9%University of Florida 6,697 7,133 7,911 8,769 9,222 5.2% 37.7%University of Georgia 6,846 7,875 8,691 9,860 10,276 4.2% 50.1%University of Illinois at Urbana 9;158 9,615 11,023 11,402 11,880 4.2% 29.7%.Purdue University-Main Campus 10,128 10,636 11,184 11,784 12,348 4.8% 21.9%Iowa State University 8,192 8,480 8,808 9,152 9,564 4.5% 16.7%Kansas State Univ of Ag and App Sci 7,917 8,433 8,772 8,992 9,195 2.3% 16.1%Louisiana St Univ A&M 5,963 5,963 6,311 6,621 7,051 6.5% 18.2%Michigan State University 11,377 11,720 11,854 12,126 12,406 2.3% 9.0%University of Minnesota-Twin Cities 11,317 11,869 11,920 12,277 12,789 4.2% 13.0%Mississippi State University 5,411 5,476 5,551 6,119 6,119 0.0% .13.1%University of Missouri-Columbia 10,395 11,342 11,723 12,107 12,495 3.2% 20.2%Cornell University-NY State Statutory Colleges 16,525 17,134 18,024 18,988 19,988 5.3% 21.0%North Carolina State University at Raleigh 9,848 10,732 11,256 11,476 11,580 0.9% 17.6%Ohio State University-Main Campus 9,315 9,813 10,869 11,448 12,060 5.3% 29.5%Oklahoma State University-Main Campus 5,834 5,841 6,406 6,414 6,883 7.3% 18.0%University of Tennessee-Knoxville 6,238 6,472 7,258 7,800 9,172 17.6% 47.0%Texas A & M University 7,748 9,593 9,497 ^ 9,567 10,052 5.1% 29.7%Virginia Polytechnic Institute and State Univ 10,739 10,783 11,111 11,521 11,844 2.8% 10.3%WASHINGTON STATE UNIVERSITY 8,525 9,758 10,148 10,554 10,564 0.1% 23.9%University of Wisconsin-Madison 9,634 10,148 10,979 11,586 13,049 12.6% 35.4%
Average (23 institutions) 8,950 9,493 10,022 10,483 10,964 4.6% 22.5%
Washington State University Rank 13 12 13 12 13
CHANGES FROM PREVIOUS YEAR23 Institution Average:
543 529 461 481% Increase 6.1% 5.6% 4.6% 4.6%
Washington State University:$ 1,233 390 406 10% Increase 14.5% 4.0% 4.0% 0.1%
27^Fees reduced.
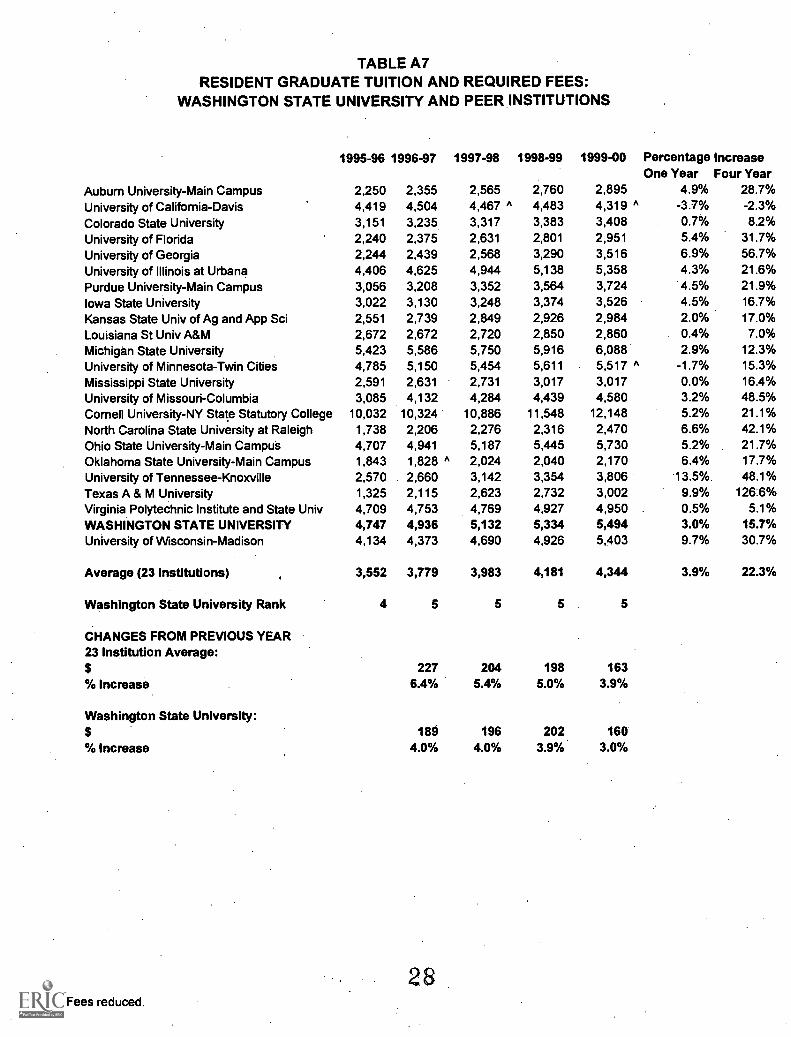
TABLE A7RESIDENT GRADUATE TUITION AND REQUIRED FEES:
WASHINGTON STATE UNIVERSITY AND PEER INSTITUTIONS
1995-96 1996-97 1997-98 1998-99 1999-00 Percentage IncreaseOne Year Four Year
Auburn University-Main Campus 2,250 2,355 2,565 2,760 2,895 4.9% 28.7%
University of California-Davis 4,419 4,504 4,467 ^ 4,483 4,319 ^ -3.7% -2.3%
Colorado State University 3,151 3,235 3,317 3,383 3,408 0.7% 8.2%
University of Florida 2,240 2,375 2,631 2,801 2,951 5.4% 31.7%
University of Georgia 2,244 2,439 2,568 3,290 3,516 6.9% 56.7%
University of Illinois at Urbana 4,406 4,625 4,944 5,138 5,358 4.3% 21.6%
Purdue University-Main Campus 3,056 3,208 3,352 3,564 3,724 4.5% 21.9%
Iowa State University 3,022 3,130 3,248 3,374 3,526 4.5% 16.7%
Kansas State Univ of Ag and App Sci 2,551 2,739 2,849 2,926 2,984 2.0% 17.0%
Louisiana St Univ A&M 2,672 2,672 2,720 2,850 2,860 0.4% 7.0%Michigan State University 5,423 5,586 5,750 5,916 6,088 2.9% 12.3%
University of Minnesota-Twin Cities 4,785 5,150 5,454 5,611 5,517 ^ -1.7% 15.3%
Mississippi State University 2,591 2,631 2,731 3,017 3,017 0.0% 16.4%
University of Missouri-Columbia 3,085 4,132 4,284 4,439 4,580 3.2% 48.5%Cornell University-NY State Statutory College 10,032 10,324 10,886 11,548 12,148 5.2% 21.1%North Carolina State University at Raleigh 1,738 2,206 2,276 2,316 2,470 6.6% 42.1%Ohio State University-Main Camput 4,707 4,941 5,187 5,445 5,730 5.2% 21.7%Oklahoma State University-Main Campus 1,843 1,828 ^ 2,024 2,040 2,170 6.4% 17.7%
University of Tennessee-Knoxville 2,570 2,660 3,142 3,354 3,806 '13.5 %. 48.1%Texas A & M University 1,325 2,115 2,623 2,732 3,002 9.9% 126:6%Virginia Polytechnic Institute and State Univ 4,709 4,753 4,769 4,927 4,950 0.5% 5.1%WASHINGTON STATE UNIVERSITY 4,747 4,936 5,132 5,334 5,494 3.0% 15.7%University of Wisconsin-Madison 4,134 4,373 4,690 4,926 5,403 9.7% 30.7%
Average (23 institutions) 3,552 3,779 3,983 4,181 4,344 3.9% 22.3%
Washington State University Rank 4 5 5 5. 5
CHANGES FROM PREVIOUS YEAR23 Institution Average:
227 204 198 163% Increase 6.4% 5.4% 5.0% 3.9%
Washington State University:189 196 202 160
% Increase 4.0% 4.0% 3.9% 3.0%
28^Fees reduced.

TABLE A8NONRESIDENT GRADUATE TUITION AND REQUIRED FEES:
WASHINGTON STATE UNIVERSITY AND PEER INSTITUTIONS
1995-96 1996-97 1997-98 1998-99 1999-00 Percentage IncreaseOne Year Four Year
Auburn University-Main Campus 6,750 7,065 7,695 8,280 8,685 4.9% 28.7%University of California-Davis 12,118 12,898 13,451 13,867 14,308 3.2% 18.1%Colorado State University 9,809 10,229 10,607 10,967 11,174 1.9% 13.9%University of Florida 7,300 7,790 8,739 9,672 10,166 5.1% 39.3%University of Georgia 6,564 6,999 8,058 11,300 12,204 8.0% 85.9%University of Illinois at Urbana 10,458 10,979 11,617 12,014 12,510 4.1% 19.6%Purdue University-Main Campus 10,128 10,636 11,184 11,784 12,348 4.8% 21.9%Iowa State University 8,532 8,832 9,174 9,532 9,962 4.5% 16.8%Kansas State Univ of Ag and App Sci 7,429 7,899 8,214 8,416 8,606 2.3% 15.8%Louisiana St Univ A&M 5,972 5,972 6,320 6,630 7,060 6.5 %. 18.2%Michigan State University 10,421 10,734 11,054 11,376 11,710 2.9% 12.4%University of Minnesota-Twin Cities 9,829 9,860 10,254 10,555 10,377 A -1.7% 5.6%Mississippi State University 5,411 5,476 5,551 6,119 6,119 0.0% 13.1%University of Missouri-Columbia 8,609 11,509 11,892 12,275 12,668 3.2% 47.2%Cornell University-NY State Statutory Colleges 10,032 10,324 10,886 11,548 12,148 5.2% 21.1%North Carolina State University at Raleigh 9,854 10,738 11,262 11,482 11,636 1.3% 18.1%Ohio State University-Main Campus 12,222 12,831 13,473 14,145 14,865 5.1% 21.6%Oklahoma State University-Main Campus 6,052 5,028 A 5,514 5,530 5,940 7.4% -1.9%University of Tennessee-Knoxville 6,700 6,996 7,824 8,410 9,874 17.4% 47.4%Texas A & M University 5,165 6,395 6,903 6,991 7,322 4.7% 41.8%Virginia Polytechnic Institute and State Univ 6,941 6,985 7,199 7,537 7,758 2.9% 11.8%WASHINGTON STATE UNIVERSITY 11,891 12,368 12,866 13,380 13,390 0.1% 12.6%University of Wisconsin-Madison 12,572 13,294 14,393 15,188 17,107 12.6% 36.1%
Average (23 institutions) 8,729 9,210 9,745 10,304 10,780 4.6% 23.5%
Washington State University Rank 4 4 4 4 4
CHANGES FROM PREVIOUS YEAR23 Institution Average:
482 534 559 476% Increase 5.5% 5.8% 5.7% 4.6%
Washington State University:$ 477 498 514 10% Increase 4.0% 4.0% 4.0% 0.1%
"Fees reduced.
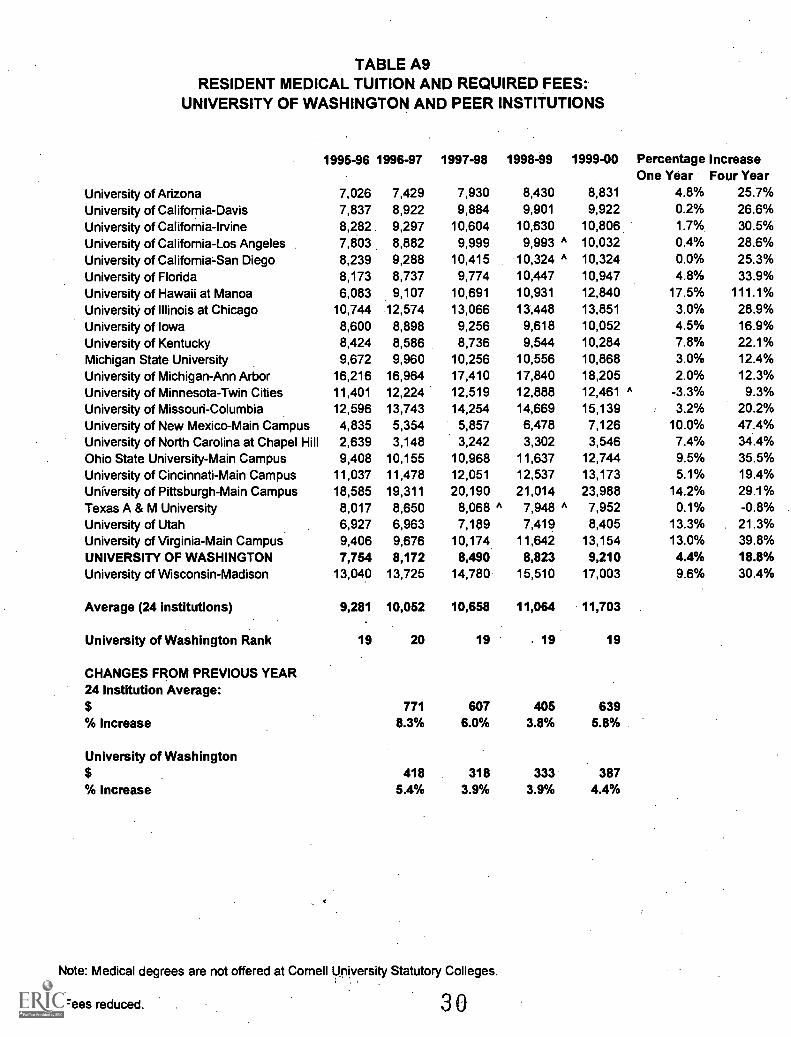
TABLE A9RESIDENT MEDICAL TUITION AND REQUIRED FEES:
UNIVERSITY OF WASHINGTON AND PEER INSTITUTIONS
1995-96 1996-97 1997-98 1998-99 1999-00 Percentage IncreaseOne Year Four Year
University of Arizona 7,026 7,429 7,930 8,430 8,831 4.8% 25.7%
University of California-Davis 7,837 8,922 9,884 9,901 9,922 0.2% 26.6%
University of California-Irvine 8,282. 9,297 10,604 10,630 10,806 1.7% 30.5%
University of California-Los Angeles 7,803 8,882 9,999 9,993 A 10,032 0.4% 28.6%University of California-San Diego 8,239 9,288 10,415 10,324 A 10,324 0.0% 25.3%University of Florida 8,173 8,737 9,774 10,447 10,947 4.8% 33.9%
University of Hawaii at Manoa 6,083 9,107 10,691 10,931 12,840 17.5% 111.1%
University of Illinois at Chicago 10,744 12,574 13,066 13,448 13,851 3.0% 28.9%University of Iowa 8,600 8,898 9,256 9,618 10,052 4.5% 16.9%
University of Kentucky 8,424 8,586 8,736 9,544 10,284 7.8% 22.1%Michigan State University 9,672 9,960 10,256 10,556 10,868 3.0% 12.4%University of Michigan-Ann Arbor 16,216 16,964 17,410 17,840 18,205 2.0% 12.3%
University of Minnesota-Twin Cities 11,401 12,224 12,519 12,888 12,461 A -3.3% 9.3%University of Missouri-Columbia 12,596 13,743 14,254 14,669 15,139 3.2% 20.2%University of New Mexico-Main Campus 4,835 5,354 5,857 6,478 7,126 10.0% 47.4%University of North Carolina at Chapel Hill 2,639 3,148 3,242 3,302 3,546 7.4% 34.4%Ohio State University-Main Campus 9,408 10,155 10,968 11,637 12,744 9.5% 35.5%University of Cincinnati-Main Campus 11,037 11,478 12,051 12,537 13,173 5.1% 19.4%
University of Pittsburgh-Main Campus 18,585 19,311 20,190 21,014 23,988 14.2% 29.1%Texas A & M University 8,017 8,650 8,068 A 7,948 A 7,952 0.1% -0.8%University of Utah 6,927 6,963 7,189 7,419 8,405 13.3% 21.3%University of Virginia-Main Campus 9,406 9,676 10,174 11,642 13,154 13.0% 39.8%UNIVERSITY OF WASHINGTON 7,754 8,172 8,490 8,823 9,210 4.4% 18.8%University of Wisconsin-Madison 13,040 13,725 14,780 15,510 17,003 9.6% 30.4%
Average (24 institutions) 9,281 10,052 10,658 11,064 11,703
University of Washington Rank 19 20 19 . 19 19
CHANGES FROM PREVIOUS YEAR24 Institution Average:
771 607 405 639% Increase 8.3% 6.0% 3.8% 5.8%
University of Washington$ 418 318 333 387% Increase 5.4% 3.9% 3.9% 4.4%
Note: Medical degrees are not offered at Cornell University Statutory Colleges.
"Fees reduced. 30
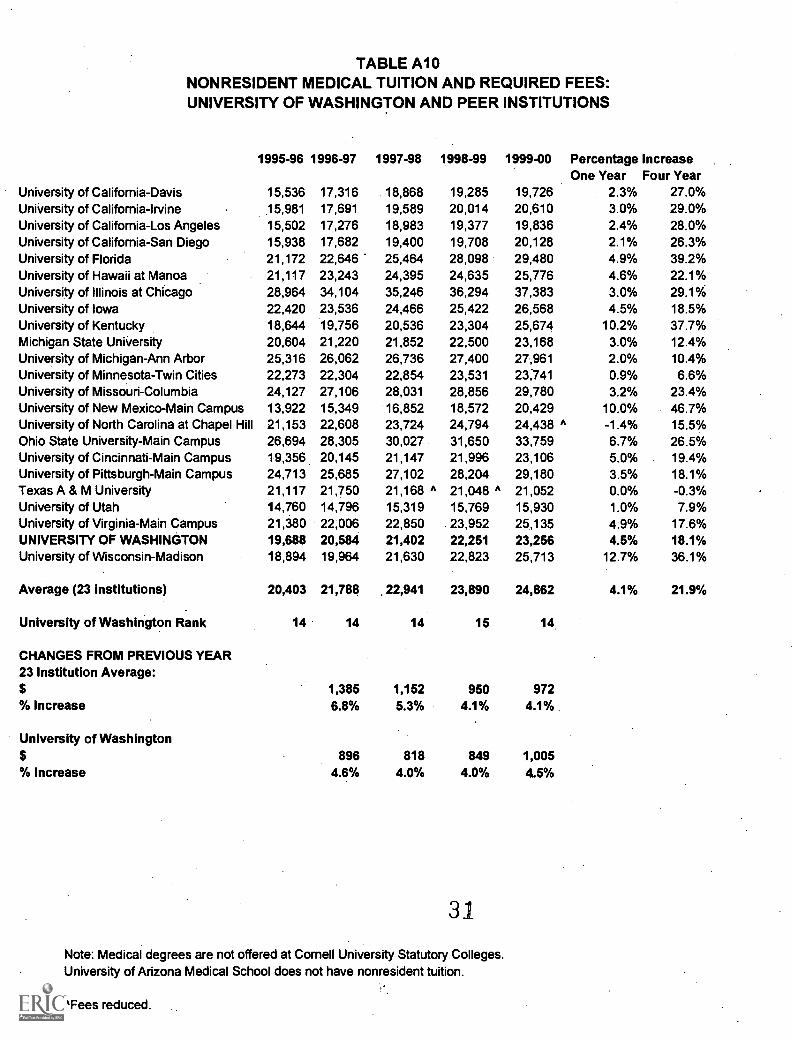
TABLE A10NONRESIDENT MEDICAL TUITION AND REQUIRED FEES:UNIVERSITY OF WASHINGTON AND PEER INSTITUTIONS
1995-96 1996-97 1997-98 1998-99 1999-00 Percentage IncreaseOne Year Four Year
University of California-Davis 15,536 17,316 18,868 19,285 19,726 2.3% 27.0%University of California-Irvine 15,981 17,691 19,589 20,014 20,610 3.0% 29.0%University of California-Los Angeles 15,502 17,276 18,983 19,377 19,836 2.4% 28.0%University of California-San Diego 15,938 17,682 19,400 19,708 20,128 2.1% 26.3%University of Florida 21,172 22,646 25,464 28,098 29,480 4.9% 39.2%University of Hawaii at Manoa 21,117 23,243 24,395 24,635 25,776 4.6% 22.1%University of Illinois at Chicago 28,964 34,104 35,246 36,294 37,383 3.0% 29.1%University of Iowa 22,420 23,536 24,466 25,422 26,568 4.5% 18.5%University of Kentucky 18,644 19,756 20,536 23,304 25,674 10.2% 37.7%Michigan State University 20,604 21,220 21,852 22,500 23,168 3.0% 12.4%University of Michigan-Ann Arbor 25,316 26,062 26,736 27,400 27,961 2.0% 10.4%University of Minnetota-Twin Cities 22,273 22,304 22,854 23,531 23,741 0.9% 6.6%University of Missouri-Columbia 24,127 27,106 28,031 28,856 29,780 3.2% 23.4%University of New Mexico-Main Campus 13,922 15,349 16,852 18,572 20,429 10.0% 46.7%University of North Carolina at Chapel Hill 21,153 22,608 23,724 24,794 24,438 ^ -1.4% 15.5%Ohio State University-Main Campus 26,694 28,305 30,027 31,650 33,759 6.7% 26.5%University of Cincinnati-Main Campus 19,356 20,145 21,147 21,996 23,106 5.0% 19.4%University of Pittsburgh-Main Campus 24,713 25,685 27,102 28,204 29,180 3.5% 18.1%Texas A & M University 21,117 21,750 21,168 ^ 21,048 ^ 21,052 0.0% -0.3%University of Utah 14,760 14,796 15,319 15,769 15,930 1.0% 7.9%University of Virginia-Main Campus 21,380 22,006 22,850 23,952 25,135 4:9% 17.6%UNIVERSITY OF WASHINGTON 19,688 20,584 21,402 22,251 23,256 4.5% 18.1%University of Wisconsin-Madison 18,894 19,964 21,630 22,823 25,713 12.7% 36.1%
Average (23 institutions) 20,403 21,788 22,941 23,890 24,862 4.1% 21.9%
University of Washington Rank 14 14 14 15 14.
CHANGES FROM PREVIOUS YEAR23 Institution Average:
1,385 1,152 950 972% Increase 6.8% 5.3% 4.1% 4.1%
University of Washington896 818 849 1,005
% Increase 4.6% 4.0% 4.0% 4.5%
31
Note: Medical degrees are not offered at Cornell University Statutory Colleges.University of Arizona Medical School does not have nonresident tuition.
^Fees reduced.
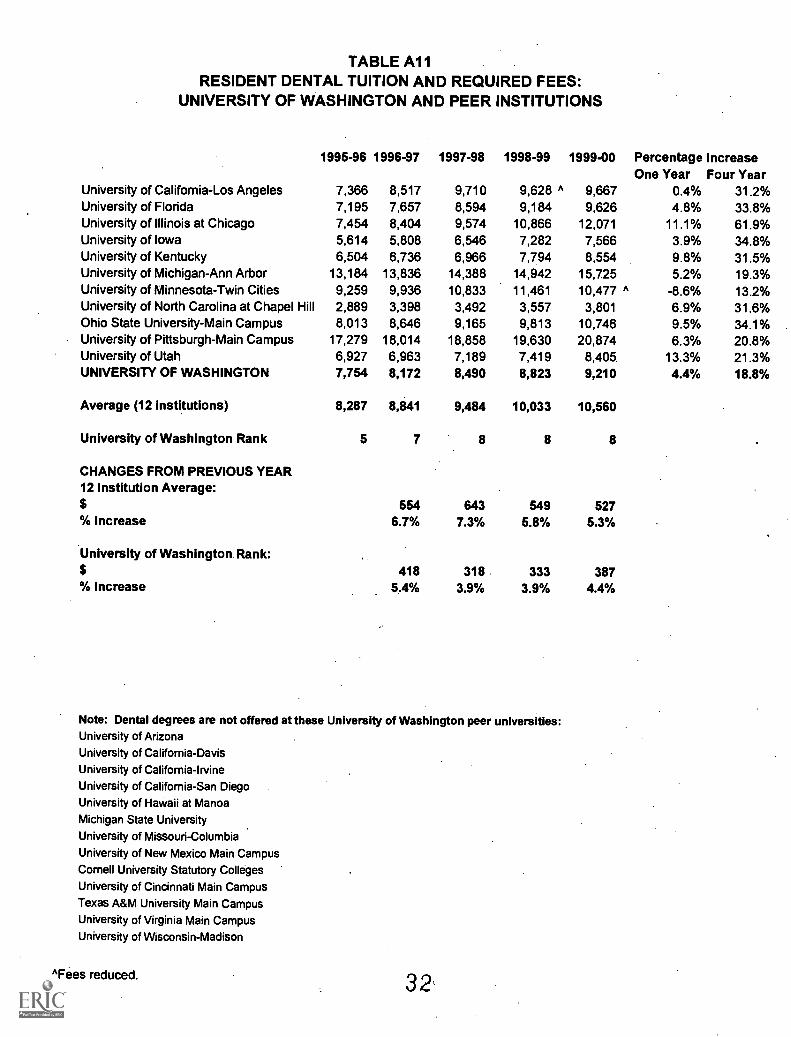
TABLE AllRESIDENT DENTAL TUITION AND REQUIRED FEES:
UNIVERSITY OF WASHINGTON AND PEER INSTITUTIONS
1995 -96 1996-97 1997-98 1998-99 1999-00 Percentage IncreaseOne Year Four Year
University of California-Los Angeles 7,366 8,517 9,710 9,628 A 9,667 0.4% 31.2%University of Florida 7,195 7,657 8,594 9,184 9,626 4.8% 33.8%University of Illinois at Chicago 7,454 8,404 9,574 10,866. 12,071 11.1% 61.9%University of Iowa 5,614 5,808 6,546 7,282 7,566 3.9% 34.8%University of Kentucky 6,504 6,736 6,966 7,794 8,554 9.8% 31.5%University of Michigan-Ann Arbor 13,184 13,836 14,388 14,942 15,725 5.2% 19.3%University of Minnesota-Twin Cities 9,259 9,936 10,833 11,461 10,477 ^ -8.6% 13.2%University of North Carolina at Chapel Hill 2,889 3,398 3,492 3,557 3,801 6.9% 31.6%Ohio State University-Main Campus 8,013 8,646 9,165 9,813 10,746 9.5% 34.1%University of Pittsburgh-Main Campus 17,279 18,014 18,858 19,630 20,874 6.3% 20.8%University of Utah 6,927 6,963 7,189 7,419 8,405. 13.3% 21.3%UNIVERSITY OF WASHINGTON 7,754 8,172 8,490 8,823 9,210 4.4% 18.8%
Average (12 institutions) 8,287 8,841 9,484 10,033 10,560
University of Washington Rank 5 7 8 8 8
CHANGES FROM PREVIOUS YEAR12 Institution Average:$ 554 643 549 527% increase 6.7% 7.3% 5.8% 5.3%
University of Washington. Rank:$ 418 318 333 387% Increase 5.4% 3.9% 3.9% 4.4%
Note: Dental degrees are not offered at these University of Washington peer universities:University of Arizona
University of California-Davis
University of California-Irvine
University of California-San Diego
University of Hawaii at Manoa
Michigan State University
University of Missouri-Columbia
University of New Mexico Main Campus
Cornell University Statutory Colleges
University of Cincinnati Main Campus
Texas A&M University Main Campus
University of Virginia Main Campus
University of Wisconsin-Madison
^Fees reduced. 32
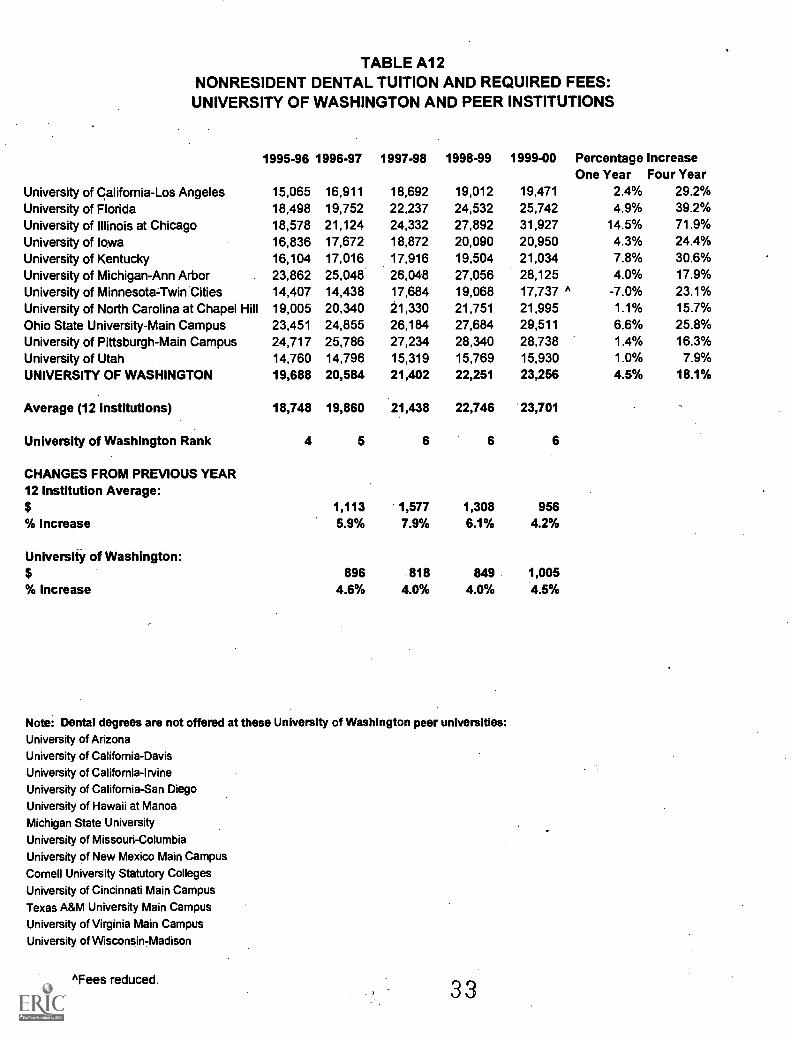
TABLE Al2NONRESIDENT DENTAL TUITION AND REQUIRED FEES:UNIVERSITY OF WASHINGTON AND PEER INSTITUTIONS
1995-96 1996-97 1997-98 1998-99 1999-00 Percentage IncreaseOne Year Four Year
University of California-Los Angeles 15,065 16,911 18,692 19,012 19,471 2.4% 29.2%
University of Florida 18,498 19,752 22,237 24,532 25,742 4.9% 39.2%
University of Illinois at Chicago 18,578 21,124 24,332 27,892 31,927 14.5% 71.9%
University of Iowa 16,836 17,672 18,872 20,090 20,950 4.3% 24.4%
University of Kentucky 16,104 17,016 17,916 19,504 21,034 7.8% 30.6%
University of Michigan-Ann Arbor 23,862 25,048 26,048 27,056 28,125 4.0% 17.9%
University of Minnesota-Twin Cities 14,407 14,438 17,684 19,068 17,737 -7.0% 23.1%University of North Carolina at Chapel Hill 19,005 20,340 21,330 21,751 21,995 1.1% 15.7%
Ohio State University-Main Campus 23,451 24,855 26,184 27,684 29,511 6.6% 25.8%University of Pittsburgh-Main Campus 24,717 25,786 27,234 28,340 28,738 1.4% 16.3%
University of Utah 14,760 14,796 15,319 15,769 15,930 1.0% 7.9%UNIVERSITY OF WASHINGTON 19,688 20,584 21,402 22,251 23,256 4.5% 18.1%
Average (12 institutions) 18,748 19,860 21,438 22,746 23,701
University of Washington Rank 4 5 6 6 6
CHANGES FROM PREVIOUS YEAR12 Institution Average:$ 1,113 1,577 1,308 956% Increase 5.9% 7.9% 6.1% 4.2%
University of Washington:$ 896 818 849 1,005% Increase 4.6% 4.0% 4.0% 4.5%
Note: Dental degrees are not offered at these University of Washington peer universities:University of Arizona
University of California-Davis
University of California-Irvine
University of California-San Diego
University of Hawaii at Manoa
Michigan State University
University of Missouri-Columbia
University of New Mexico Main Campus
Cornell University Statutory Colleges
University of Cincinnati Main Campus
Texas A&M University Main Campus
University of Virginia Main Campus
University of Wisconsin-Madison
"Fees reduced. 33
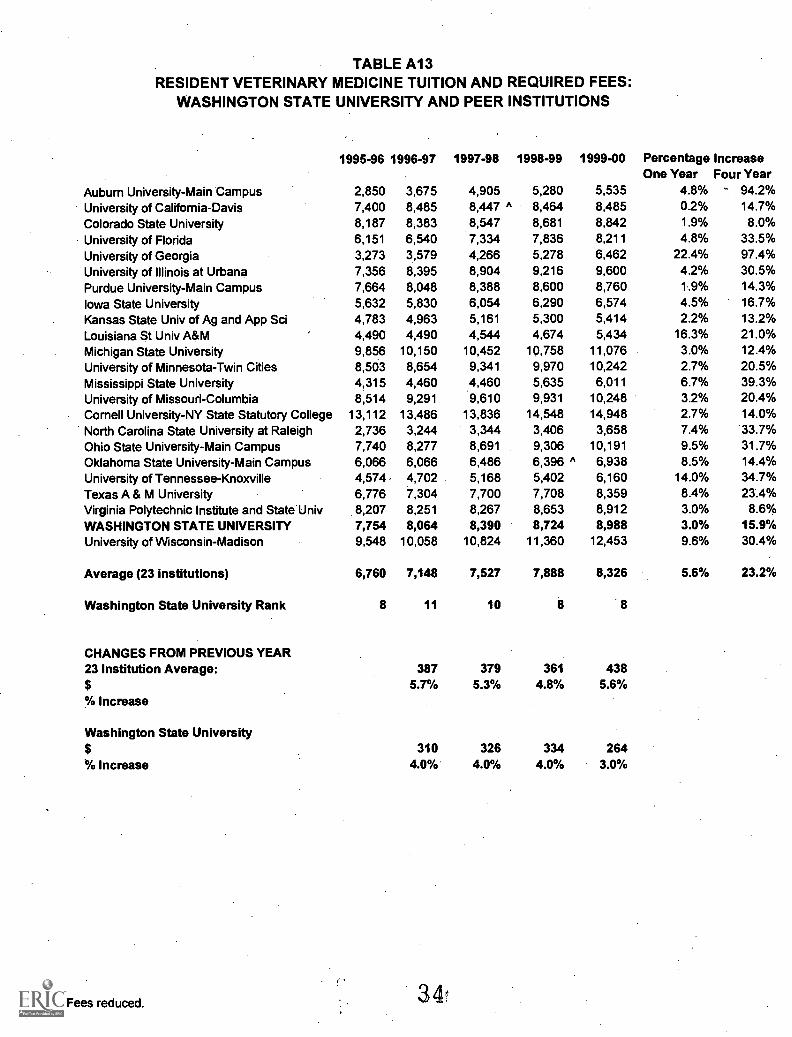
TABLE A13RESIDENT VETERINARY MEDICINE TUITION AND REQUIRED FEES:
WASHINGTON STATE UNIVERSITY AND PEER INSTITUTIONS
1995-96 1996-97 1997-98 1998-99 1999-00 Percentage IncreaseOne Year Four Year
Auburn University-Main Campus 2,850 3,675 4,905 5,280 5,535 4.8% 94.2%
University of California-Davis 7,400 8,485 8,447 A 8,464 8,485 0.2% 14.7%
Colorado State University 8,187 8,383 8,547 8,681 8,842 1.9% 8.0%
University of Florida 6;151 6,540 7,334 7,836 8,211 4.8% 33.5%
University of Georgia 3,273 3,579 4,266 5,278 6,462 22.4% 97.4%
University of Illinois at Urbana 7,356 8,395 8,904 9,216 9,600 4.2% 30.5%
Purdue University-Main Campus 7,664 8,048 8,388 8,600 8,760 1.9% 14.3%
Iowa State University 5,632 5,830 6,054 6,290 6,574 4.5% 16.7%
Kansas State Univ of Ag and App Sci 4,783 4,963 5,161 5,300 5,414 2.2% 13.2%
Louisiana St Univ A&M 4,490 4,490 4,544 4,674 5,434 16.3% 21.0%Michigan State University 9,856 10,150 10,452 10,758 11,076 3.0% 12.4%
University of Minnesota-Twin Cities 8,503 8,654 9,341 9,970 10,242 2.7% 20.5%
Mississippi State University 4,315 4,460 4,460 5,635 6,011 6.7% 39.3%
University of Missouri-Columbia 8,514 9,291 9,610 9,931 10,248 3.2% 20.4%Cornell University-NY State Statutory College 13,112 13,486 13,836 14,548 14,948 2.7% 14.0%
North Carolina State University at Raleigh 2,736 3,244 3,344 3,406 3,658 7.4% 33.7%Ohio State University-Main Campus 7,740 8,277 8,691 9,306 10,191 9.5% 31.7%Oklahoma State University-Main Campus 6,066 6,066 6,486 6,396 ^ 6,938 8.5% 14.4%University of Tennessee-Knoxville 4,574 4,702 5,168 5,402 6,160 14.0% 34.7%Texas A & M University 6,776 7,304 7,700 7,708 8,359 8.4% 23.4%Virginia Polytechnic Institute and State Univ 8,207 8,251 8,267 8,653 8,912 3.0% 8.6%WASHINGTON STATE UNIVERSITY 7,754 8,064 8,390 8,724 8,988 3.0% 15.9%University of Wisconsin-Madison 9,548 10,058 10,824 11,360 12,453 9.6% 30.4%
Average (23 institutions) 6,760 7,148 7,527 7,888 8,326 5.6% 23.2%
Washington State University Rank 8 11 10 8
CHANGES FROM PREVIOUS YEAR23 Institution Average: 387 379 361 438
5.7% 5.3% 4.8% 5.6%% Increase
Washington State University$ 310 326 334 264% Increase 4.0% 4.0% 4.0% 3.0%
^Fees reduced. 34
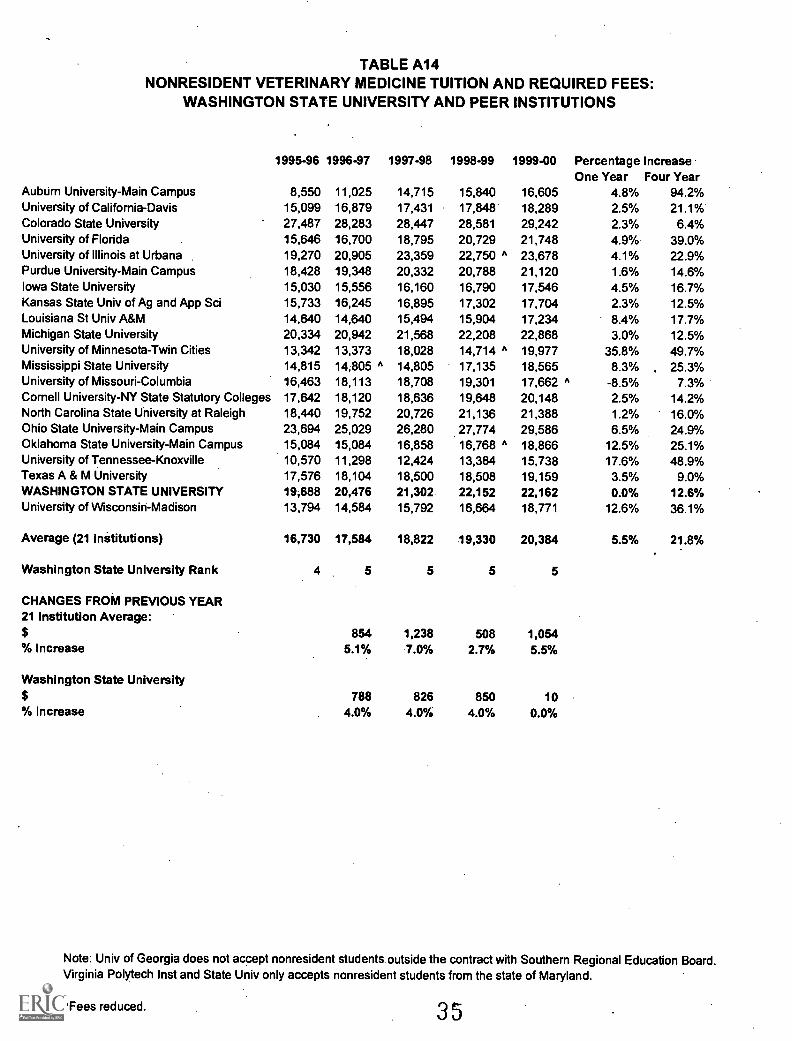
TABLE A14NONRESIDENT VETERINARY MEDICINE TUITION AND REQUIRED FEES:
WASHINGTON STATE UNIVERSITY AND PEER INSTITUTIONS
1995-96 1996-97 1997-98 1998-99 1999-00 Percentage IncreaseOne Year Four Year
Aubum University-Main Campus 8,550 11,025 14,715 15,840 16,605 4.8% 94.2%University of California-Davis 15,099 16,879 17,431 17,848 18,289 2.5% 21.1%Colorado State University 27,487 28,283 28,447 28,581 29,242 2.3% 6.4%University of Florida 15,646 16,700 18,795 20,729 21,748 4.9% 39.0%University of Illinois at Urbana 19,270 20,905 23,359 22,750 " 23,678 4.1% 22.9%Purdue University-Main Campus 18,428 19,348 20,332 20,788 21,120 1.6% 14.6%Iowa State University 15,030 15,556 16,160 16,790 17,546 4.5% 16.7%Kansas State Univ of Ag and App Sci 15,733 16,245 16,895 17,302 17,704 2.3% 12.5%Louisiana St Univ ABM 14,640 14,640 15,494 15,904 17,234 8.4% 17.7%Michigan State University 20,334 20,942 21,568 22,208 22,868 3.0% 12.5%University of Minnesota-Twin Cities 13,342 13,373 18,028 14,714 A 19,977 35.8% 49.7%Mississippi State University 14,815 14;805 A 14,805 17,135 18,565 8.3% , 25.3%University of Missouri-Columbia 16,463 18,113 18,708 19,301 17,662 A -8.5% 7.3%Cornell University-NY State Statutory Colleges 17,642 18,120 18,636 19,648 20,148 2.5% 14.2%North Carolina State University at Raleigh 18,440 19,752 20,726 21,136 21,388 1.2% 16.0%Ohio State University-Main Campus 23,694 25,029 26,280 27,774 29,586 6.5% 24.9%Oklahoma State University-Main Campus 15,084 15,084 16,858 16,768 A 18,866 12.5% 25.1%University of Tennessee-Knoxville 10,570 11,298 12,424 13,384 15,738 17.6% 48.9%Texas A & M University 17,576 18,104 18,500 18,508 19,159 3.5% 9.0%WASHINGTON STATE UNIVERSITY 19;688 20,476 21,302 22,152 22,162 0.0% 12.6%University of Wisconsin-Madison 13,794 14,584 15,792 16,664 18,771 12.6% 36.1%
Average (21 institutions) 16,730 17,584 18,822 19,330 20,384 5.5% 21.8%
Washington State University Rank 4 5 5 5 5
CHANGES FROM PREVIOUS YEAR21 Institution Average:
854 1,238 508 1,054% Increase 5.1% 7.0% 2.7% 5.5%
Washington State University$ 788 826 850 10% Increase 4.0% 4.0% 4.0% 0.0%
Note: Univ of Georgia does not accept nonresident students outside the contract with Southern Regional Education Board.Virginia Polytech Inst and State Univ only accepts nonresident students from the state of Maryland.
"Fees reduced. 35
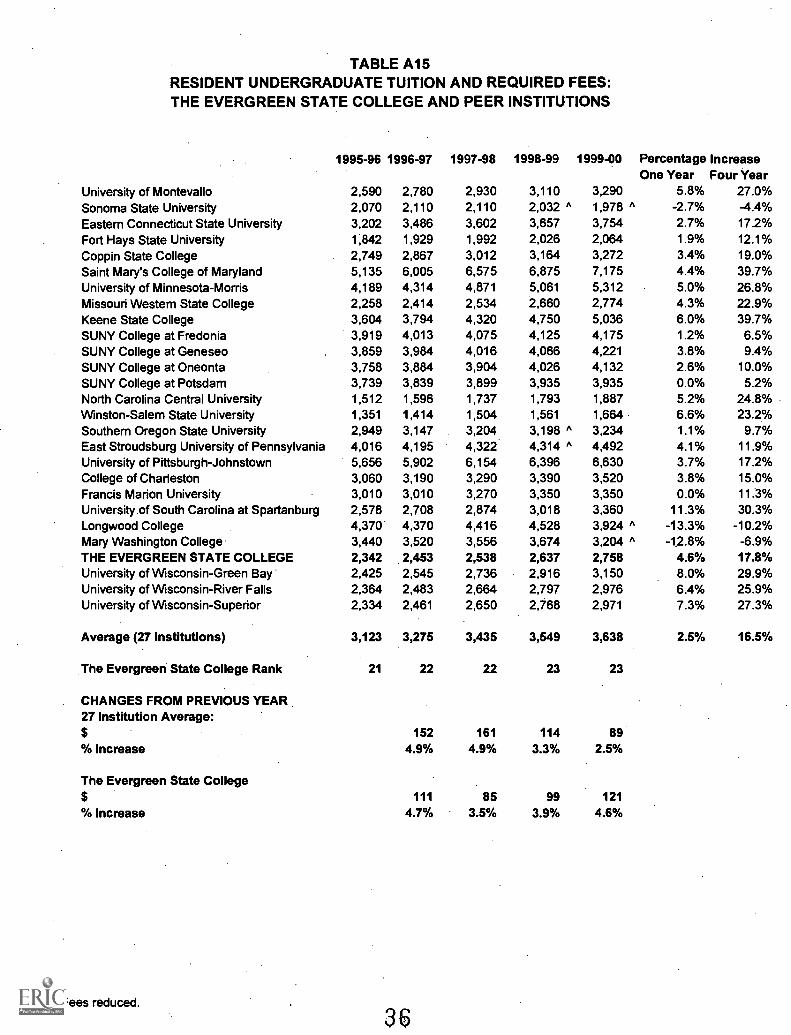
TABLE A15RESIDENT UNDERGRADUATE TUITION AND REQUIRED FEES:THE EVERGREEN STATE COLLEGE AND PEER INSTITUTIONS
1995-96 1996-97 1997-98 1998-99 1999-00 Percentage IncreaseOne Year Four Year
University of Montevallo 2,590 2,780 2,930 3,110 3,290 5.8% 27.0%Sonoma State University 2,070 2,110 2,110 2,032 A
A1,978 -2.7% -4.4%Eastern Connecticut State University 3,202 3,486 3,602 3,657 3,754 2.7% 17.2%
Fort Hays State University 1,842 1,929 1,992 2,026 2,064 1.9% 12.1%
Coppin State College 2,749 2,867 3,012 3,164 3,272 3.4% 19.0%Saint Mary's College of Maryland 5,135 6,005 6,575 6,875 7,175 4.4% 39.7%University of Minnesota-Morris 4,189 4,314 4,871 5,061 5,312 5.0% 26.8%Missouri Western State College 2,258 2,414 2,534 2,660 2,774 4.3% 22.9%Keene State College 3,604 3,794 4,320 4,750 5,036 6.0% 39.7%SUNY College at Fredonia 3,919 4,013 4,075 4,125 4,175 1.2% 6.5%SUNY College at Geneseo 3,859 3,984 4,016 4,066 4,221 3.8% 9.4%SUNY College at Oneonta 3,758 3,884 3,904 4,026 4,132 2.6% 10.0%SUNY College at Potsdam 3,739 3,839 3,899 3,935 3,935 0.0% 5.2%North Carolina Central University 1,512 1,596 1,737 1,793 1,887 5.2% 24.8%Winston-Salem State University 1,351 1,414 1,504 1,561 1,664 6.6% 23.2%Southern Oregon State University 2,949 3,147 3,204 3,198 ^ 3,234 1.1% 9.7%East Stroudsburg University of Pennsylvania 4,016 4,195 4,322 4,314 A 4,492 4.1% 11.9%University of Pittsburgh-Johnstown 5,656 5,902 6,154 6,396 6,630 3.7% 17.2%College of Charleston 3,060 3,190 3,290 3,390 3,520 3.8% 15.0%Francis Marion University 3,010 3,010 3,270 3,350 3,350 0.0% 11..3%
University of South Carolina at Spartanburg 2,578 2,708 2,874 3,018 3,360 11.3% 30.3%Longwood College 4,370 4,370 4,416 4,528 3,924 ^ -13.3% -10.2%Mary Washington College 3,440 3,520 3,556 3,674 3,204 ^ -1.2.8% -6.9%THE EVERGREEN STATE COLLEGE 2,342 2,453 2,538 2,637 2,758 4.6% 17.8%University of Wisconsin-Green Bay 2,425 2,545 2,736 2,916 3,150 8.0% 29.9%University of Wisconsin-River Falls 2,364 2,483 2,664 2,797 2,976 6.4% 25.9%University of Wisconsin-Superior 2,334 2,461 2,650 2,768 2,971 7.3% 27.3%
Average (27 institutions) 3,123 3,275 3,435 3,549 3,638 2.5% 16.5%
The Evergreen State College Rank 21 22 22 23 23
CHANGES FROM PREVIOUS YEAR27 Institution Average:$ 152 161 114 89% Increase 4.9% 4.9% 3.3% 2.5%
The Evergreen State College$ 111 85 99 121
% Increase 4.7% 3.5% 3.9% 4.6%
^Fees reduced.
36
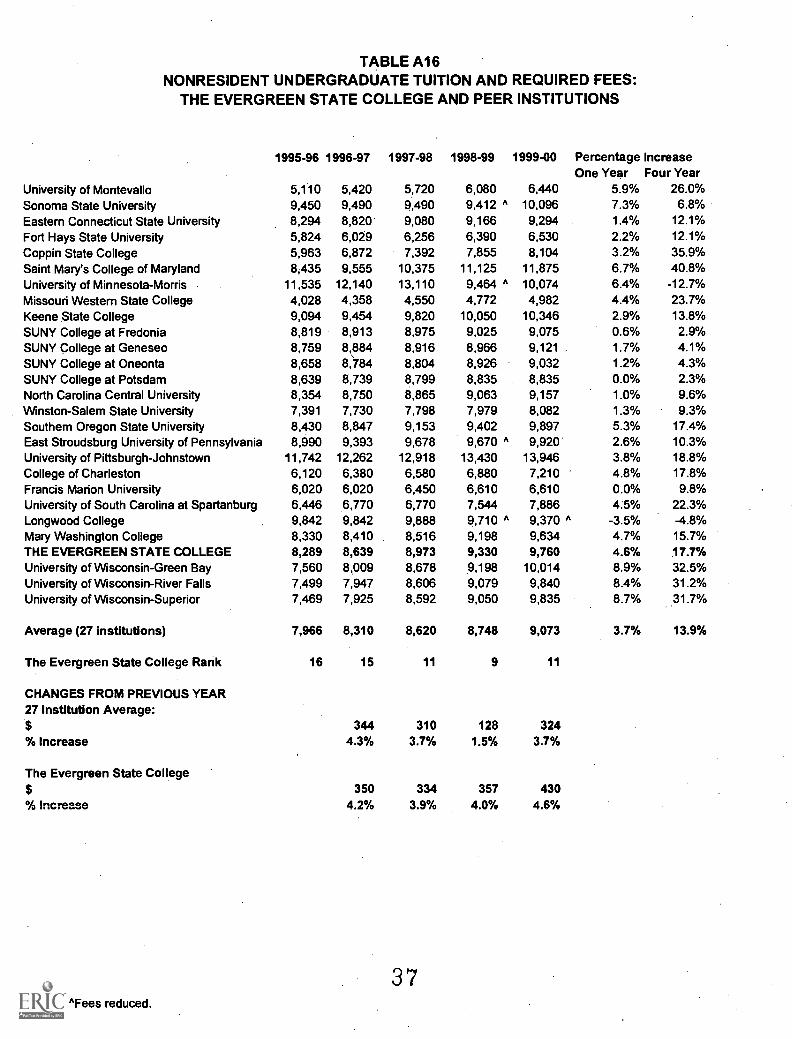
TABLE A16NONRESIDENT UNDERGRADUATE TUITION AND REQUIRED FEES:
THE EVERGREEN STATE COLLEGE AND PEER INSTITUTIONS
1995-96 1996-97 1997-98 1998-99 1999-00 Percentage IncreaseOne Year Four Year
University of Montevallo 5,110 5,420 5,720 6,080 6,440 5.9% 26.0%
Sonoma State University 9,450 9,490 9,490 9,412 A 10,096 7.3% 6.8%Eastern Connecticut State University 8,294 8,820' 9,080 9,166 9,294 1.4% 12.1%
Fort Hays State University 5,824 6,029 6,256 6,390 6,530 2.2% 12.1%
Coppin State College 5,963 6,872 7,392 7,855 8,104 3.2% 35.9%Saint Mary's College of Maryland 8,435 9,555 10,375 11,125 11,875 6.7% 40.8%University of Minnesota-Morris 11,535 12,140 13,110 9,464 A 10,074 6.4% -12.7%Missouri Western State College 4,028 4,358 4,550 4,772 4,982 4.4% 23.7%Keene State College 9,094 9,454 9,820 10,050 10,346 2.9% 13.8%
SUNY College at Fredonia 8,819 8,913 8,975 9,025 9,075 0.6% 2.9%SUNY College at Geneseo 8,759 8,884 8,916 8,966 9,121 1.7% 4.1%SUNY College at Oneonta 8,658 8,784 8,804 8,926 9,032 1.2% 4.3%SUNY College at Potsdam 8,639 8,739 8,799 8,835 8,835 0.0% 2.3%North Carolina Central University 8,354 8,750 8,865 9,063 9,157 1.0% 9.6%Winston-Salem State University 7,391 7,730 7,798 7,979 8,082 1.3% 9.3%Southern Oregon State University 8,430 8,847 9,153 9,402 9,897 5.3% 17.4%East Stroudsburg University of Pennsylvania 8,990 9,393 9,678 9,670 A 9,920 2.6% 10.3%University of Pittsburgh-Johnstown 11,742 12,262 12,918 13,430 13,946 3.8% 18.8%College of Charleston 6,120 6,380 6,580 6,880 7,210 4.8% 17.8%Francis Marion University 6,020 6,020 6,450 6,610 6,610 0.0% 9.8%University of South Carolina at Spartanburg 6,446 6,770 6,770 7,544 7,886 4.5% 22.3%Longwood College 9,842 9,842 9,888 9,710 A 9,370 A -3.5% -4.8%Mary Washington College 8,330 8,410 8,516 9,198 9,634 4.7% 15.7%THE EVERGREEN STATE COLLEGE 8,289 8,639 8,973 9,330 9,760 4.6% 17.7%University of Wisconsin-Green Bay 7,560 8,009 8,678 9,198 10,014 8.9% 32.5%University of Wisconsin-River Falls 7,499 7,947 8,606 9,079 9,840 8.4% 31.2%University of Wisconsin-Superior 7,469 7,925 8,592 9,050 9,835 8.7% 31.7%
Average (27 institutions) 7,966 8,310 8,620 8,748 9,073 3.7% 13.9%
The Evergreen State College Rank 16 15 11 9 11
CHANGES FROM PREVIOUS YEAR27 Institution Average:
344 310 128 324% Increase 4.3% 3.7% 1.5% 3.7%
The Evergreen State College$ 350 334 357 430% Increase 4.2% 3.9% 4.0% 4.6%
37"Fees reduced.
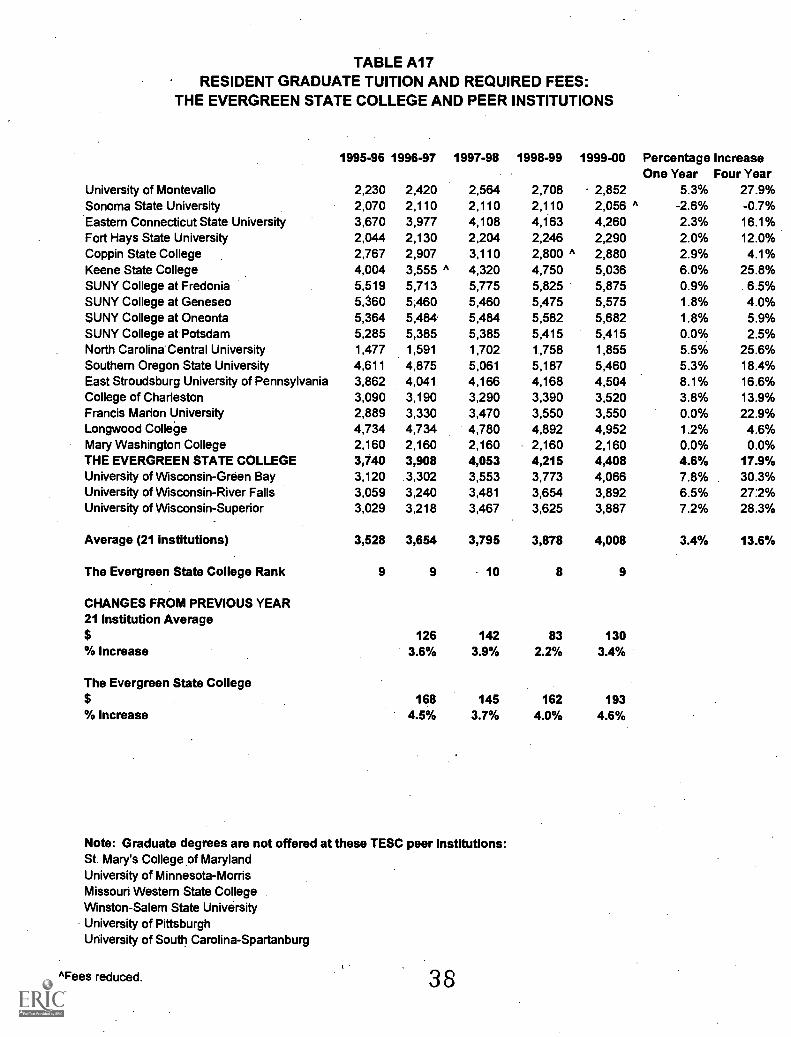
TABLE A17RESIDENT GRADUATE TUITION AND REQUIRED FEES:
THE EVERGREEN STATE COLLEGE AND PEER INSTITUTIONS
1995-96 1996-97 1997-98 1998-99 1999-00 Percentage IncreaseOne Year Four Year
University of Montevallo 2,230 2,420 2,564 2,708 2,852 5.3% 27.9%Sonoma State University 2,070 2,110 2,110 2,110 2,056 ^ -2.6% -0.7%Eastern Connecticut State University 3,670 3,977 4,108 4,163 4,260 2.3% 16.1%Fort Hays State University 2,044 2,130 2,204 2,246 2,290 2.0% 12.0%Coppin State College 2,767 2,907 3,110 2,800 ^ 2,880 2.9% 4.1%Keene State College 4,004 3,555 ^ 4,320 4,750 5,036 6.0% 25.8%SUNY College at Fredonia 5,519 5,713 5,775 5,825 5,875 0.9% 6.5%SUNY College at Geneseo 5,360 5;460 5,460 5,475 5,575 1.8% 4.0%SUNY College at Oneonta 5,364 5,484 5,484 5,582 5,682 1.8% 5.9%SUNY College at Potsdam 5,285 5,385 5,385 5,415 5,415 0.0% 2.5%North Carolina Central University 1,477 1,591 1,702 1,758 1,855 5.5% 25.6%Southern Oregon State University 4,611 4,875 5,061 5,187 5,460 5.3% 18.4%East Stroudsburg University of Pennsylvania 3,862 4,041 4,166 4,168 4,504 8.1% 16.6%College of Charleston 3,090 3,190 3,290 3,390 3,520 3.8% 13.9%Francis Marion University 2,889 3,330 3,470 3,550 3,550 0.0% 22.9%Longwood College 4,734 4,734 4,780 4,892 4,952 1.2% 4.6%Mary Washington College 2,160 2,160 2,160 2,160 2,160 0.0% 0.0%THE EVERGREEN STATE COLLEGE 3,740 3,908 4,053 4,215 4,408 4.6% 17.9%University of Wisconsin-Green Bay 3,120 3,302 3,553 3,773 4,066 7.8% 30.3%University of Wisconsin-River Falls 3,059 3,240 3,481 3,654 3,892 6.5% 27:2%University of Wisconsin-Superior 3,029 3,218 3,467 3,625 3,887 7.2% 28.3%
Average (21 institutions) 3,528 3,654 3,795 3,878 4,008 3.4% 13.6%
The Evergreen State College Rank 9 9 10 8 9
CHANGES FROM PREVIOUS YEAR21 Institution Average
126 142 83 130% Increase 3.6% 3.9% 2.2% 3.4%
The Evergreen State College$ 168 145 162 193% Increase 4.5% 3.7% 4.0% 4.6%
Note: Graduate degrees are not offered at these TESC peer institutions:St. Mary's College of MarylandUniversity of Minnesota-MorrisMissouri Western State CollegeWinston-Salem State UniversityUniversity of PittsburghUniversity of South Carolina-Spartanburg
^Fees reduced. 38
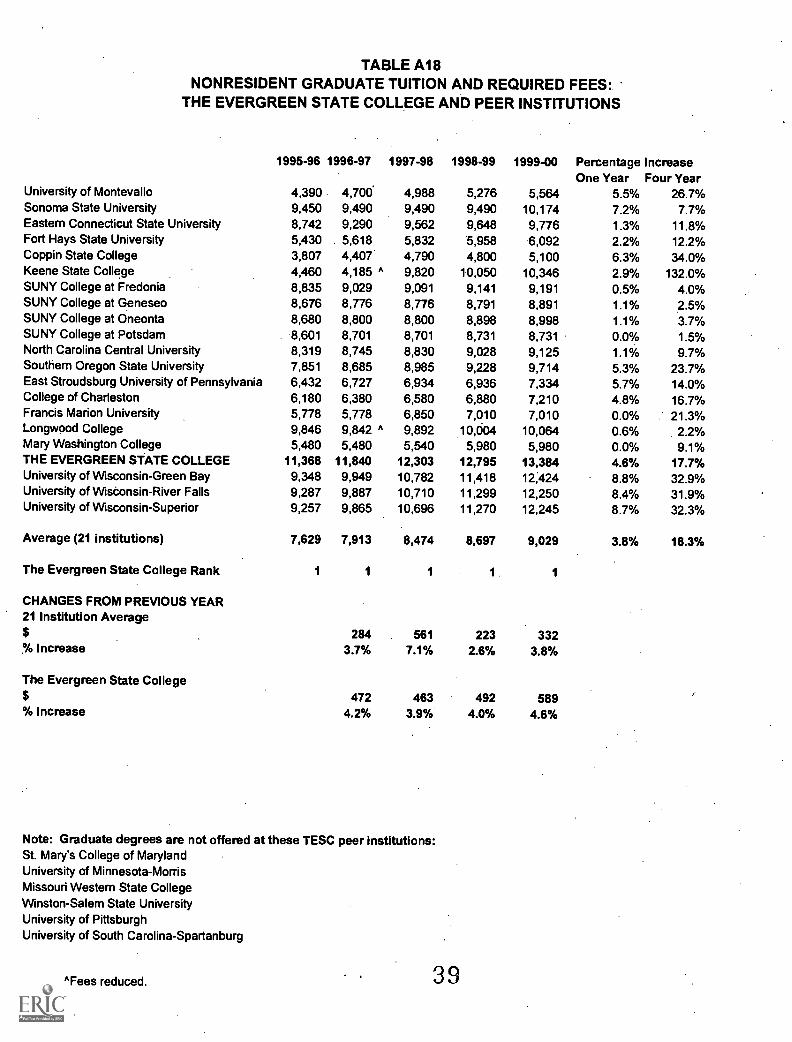
TABLE A18NONRESIDENT GRADUATE TUITION AND REQUIRED FEES:
THE EVERGREEN STATE COLLEGE AND PEER INSTITUTIONS
1995-96 1996-97 1997-98 1998-99 1999-00 Percentage IncreaseOne Year Four Year
University of Montevallo 4,390 4,700 4,988 5,276 5,564 5.5% 26.7%Sonoma State University 9,450 9,490 9,490 9,490 10,174 7.2% 7.7%Eastern Connecticut State University 8,742 9,290 9,562 9,648 9,776 1.3% 11.8%Fort Hays State University 5,430 5,618 5,832 5,958 6,092 2.2% 12.2%Coppin State College 3,807 4,407 4,790 4,800 5,100 6.3% 34.0%Keene State College 4,460 4,185 A 9,820 10,050 10,346 2.9% 132.0%SUNY College at Fredonia 8,835 9,029 9,091 9,141 9,191 0.5% 4.0%SUNY College at Geneseo 8,676 8,776 8,776 8,791 8,891 1.1% 2.5%SUNY College at Oneonta 8,680 8,800 8,800 8,898 8,998 1.1% 3.7%SUNY College at Potsdam 8,601 8,701 8,701 8,731 8,731 0.0% 1.5%North Carolina Central University 8,319 8,745 8,830 9,028 9,125 1.1% 9.7%Southern Oregon State University 7,851 8,685 8,985 9,228 9,714 5.3% 23.7%East Stroudsburg University of Pennsylvania 6,432 6,727 6,934 6,936 7,334 5.7% 14.0%College of Charleston 6,180 6,380 6,580 6,880 7,210 4.8% 16.7%Francis Marion University 5,778 5,778 6,850 7,010 7,010 0.0% 21.3%Longwood College 9,846 9,842 " 9,892 10,004 10,064 0.6% 2.2%Mary Washington College 5,480 5,480 5,540 5,980 5,980 0.0% 9.1%THE EVERGREEN STATE COLLEGE 11,368 11,840 12,303 12,795 13,384 4.6% 17.7%University of Wisconsin-Green Bay 9,348 9,949 10,782 11,418 12;424 8.8% 32.9%University of Wisconsin -River Falls 9,287 9,887 10,710 11,299 12,250 8.4% 31.9%University of Wisconsin-Superior 9,257 9,865 10,696 11,270 12,245 8.7% 32.3%
Average (21 institutions) 7,629 7,913 8,474 8,697 9,029 3.8% 18.3%
The Evergreen State College Rank 1
CHANGES FROM PREVIOUS YEAR21 Institution Average
284 561 223 332% Increase 3.7% 7.1% 2.6% 3.8%
The Evergreen State College472 463 492 589
% Increase 4.2% 3.9% 4.0% 4.6%
Note: Graduate degrees are not offered at these TESC peer institutions:St. Mary's College of MarylandUniversity of Minnesota-MorrisMissouri Western State CollegeWinston-Salem State UniversityUniversity of PittsburghUniversity of South Carolina-Spartanburg
^Fees reduced. 39
APPENDIX B
WASHINGTON STATE
TUITION AND FEE POLICIES
40
WASHINGTON STATE TUITION AND FEE POLICIES
In 1977, the Washington State Legislature amended the tuition and fee statutes to relate the
tuition and fee rates to fixed percentages of calculated cost of education. Percentages
established were to be used to calculate recommendations and were not binding on futurelegislatures. The increases recommended for the 1977-79 biennium were adopted by statuteand phased in over two years on a 75/25 percent basis; tuition and fees would equal 25 percent
of the calculated cost of education.
The Legislature chose to not increase tuition and fees in 1979, but in 1981 increased the
percentages of costs to be paid by students. At that time it adopted an automatic adjustment
feature, and again phased in the increases on a 75/25 basis. Additional increases in sometuition and fee categories were made by the Legislature in 1982. The 1981 and 1982legislation also provided that increases in tuition and fees would be made biennially based onthe education cost of the previous biennium. Since the legislation had no provision to phasein adjustments, the 1983 and 1985 increases took effect in the first year of each biennium.
Legislation passed in 1986 required that tuition and fees be established biennially andprovided for annual adjustments beginning with the 1987-88 academic year. The legislationalso required that the transition from the biennial tuition adjustment to annual adjustments notresult in reduced revenue to the state general fund.
In establishing the 1989-91 tuition and fee rates, the Legislature rejected the use of those costsnot developed through a faculty activity analysis and required that institutions not alreadydoing so would conduct such an analysis for the 1989-90 Education Cost Study.
Education Cost Studies conducted since 1989-90 were completed using a faculty, activityanalysis for all institutions as required by the Legislature. The 1989-90 study results wereused to establish the tuition and fee rates for the 1991-93 and 1993-95 biennia.
From 1981 until 1993, tuition rates reflected the proportion of education cost as indicated inthe first column of the following table. The second and third columns depict the proportion ofeducation costs on which tuition and fees were based for academic years 1994 and 1995.
The most recent Education Cost Study was completed by the Board using 1997-98 data.Under 1998 law, this study provided a direct link between the cost of education at Washingtoninstitutions and the tuition and fees paid by students at those institutions. This study is used todetermine cost distribution ratios for each institution. These relationships then provide thebasis for determining the educational cost on which subsequent tuition and fee levels mayreasonably be calculated.
41
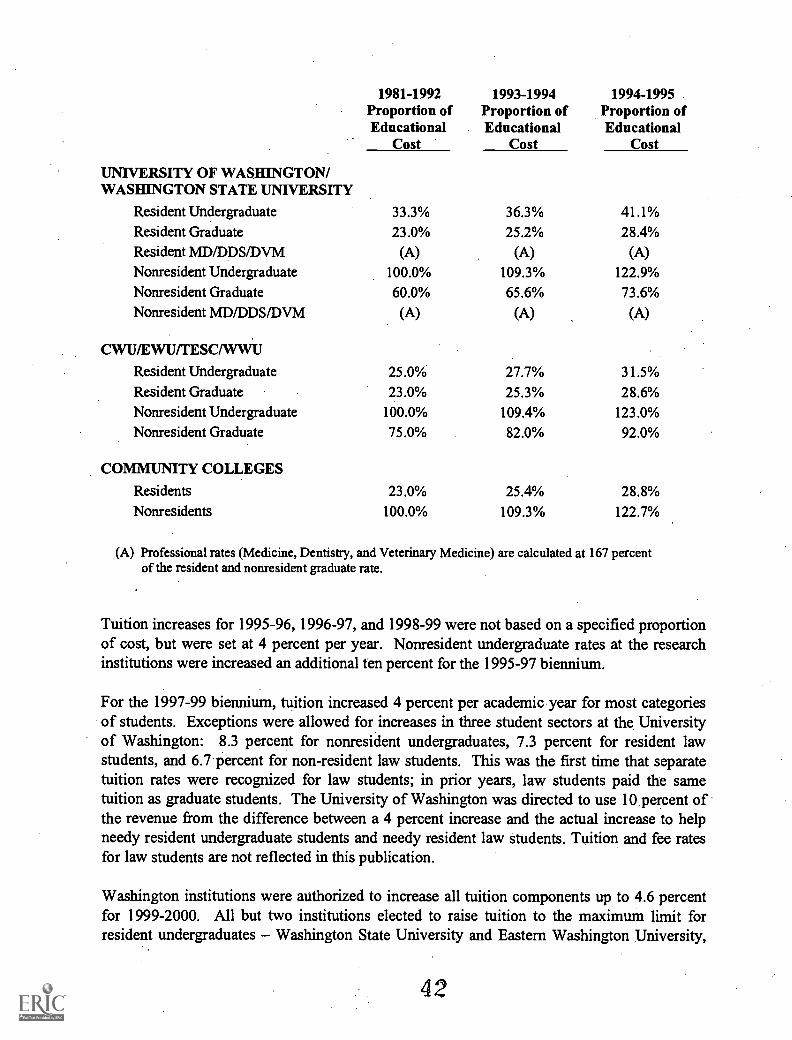
UNIVERSITY OF WASHINGTON/WASHINGTON STATE UNIVERSITY
1981-1992Proportion ofEducational
Cost
1993-1994Proportion ofEducational
Cost
1994-1995Proportion ofEducational
Cost
Resident Undergraduate 33.3% 36.3% 41.1%Resident Graduate 23.0% 25.2% 28.4%Resident MD/DDS/DVM (A) (A) (A)Nonresident Undergraduate 100.0% 109.3% 122.9%
Nonresident Graduate 60.0% 65.6% 73.6%Nonresident MD/DDS/DVM (A) (A) (A)
CWU/EWU/TESC/WWU
Resident Undergraduate 25.0% 27.7% 31.5%Resident Graduate 23.0% 25.3% 28.6%Nonresident Undergraduate 100.0% 109.4% 123.0%
Nonresident Graduate 75.0% 82.0% 92.0%
COMMUNITY COLLEGES
Residents 23.0% 25.4% 28.8%Nonresidents 100.0% 109.3% 122.7%
(A) Professional rates (Medicine, Dentistry, and Veterinary Medicine) are calculated at 167 percentof the resident and nonresident graduate rate.
Tuition increases for 1995-96, 1996-97, and 1998-99 were not based on a specified proportionof cost, but were set at 4 percent per year. Nonresident undergraduate rates at the researchinstitutions were increased an additional ten percent for the 1995-97 biennium.
For the 1997-99 biennium, tuition increased 4 percent per academic year for most categoriesof students. Exceptions were allowed for increases in three student sectors at the Universityof Washington: 8.3 percent for nonresident undergraduates, 7.3 percent for resident lawstudents, and 6.7 percent for non-resident law students. This was the first time that separatetuition rates were recognized for law students; in prior years, law students paid the sametuition as graduate students. The University of Washington was directed to use 10 percent ofthe revenue from the difference between a 4 percent increase and the actual increase to helpneedy resident undergraduate students and needy resident law students. Tuition and fee ratesfor law students are not reflected in this publication.
Washington institutions were authorized to increase all tuition components up to 4.6 percentfor 1999-2000. All but two institutions elected to raise tuition to the maximum limit forresident undergraduates - Washington State University and Eastern Washington University,
42
which held their increases to 4 percent and 3 percent, respectively. Resident graduate tuitionincreases were raised the maximum 4.6 percent at three institutions: Central WashingtonUniversity, The Evergreen State College, and Western Washington University. TheUniversity of Washington, Washington State University and Eastern Washington Universityheld theirs at 3 percent.
The community colleges raised both resident and nonresident rates the maximum 4.6 percent.
In 1996, the Legislature granted the four-year universities and The Evergreen State College,with the approval of their respective student government associations, authority to establish atechnology fee in addition to tuition and fees. The fee was limited to $120 per year for a full-time student. For the 1999-2000 academic year, the following four-year institutions haveinitiated mandatory technology fees as indicated:
University of Washington $120Central Washington University $ 75Eastern Washington University $ 36Western Washington University $ 30
Because these are mandatory charges, they are included in the tuition and fees reported forWashington institutions in this report. Washington State University and The Evergreen StateCollege have not assessed a technology fee.
43
APPENDIX C
INSTITUTIONS PARTICIPATINGIN TUITION AND FEE SURVEY
44
INSTITUTIONS PARTICIPATINGIN TUITION AND FEE SURVEY
ALABAMA
*University of Alabama/TuscaloosaAlabama State UniversityUniversity of North AlabamaLivingston UniversityUniversity of MontevalloUniversity of South Alabama
ALASKA
*University of Alaska, Fairbanks
ARIZONA
*University of ArizonaNorthern Arizona UniversityArizona State University
ARKANSAS
*University of Arkansas/FayettevilleArkansas Tech UniversityUniversity of Central ArkansasUniversity of Arkansas/MonticelloArkansas State University
CALIFORNIA
*University of California/BerkeleyCalifornia Poly State UniversityCalifornia State College/San BernadinoSonoma State UniversityCalifornia State University/ChicoCalifornia State University/FresnoCalifornia State University/FullertonCalifornia State University/NorthridgeCalifornia State University/Long BeachCalifornia State University/Los AngelesCalifornia State University/SacramentoHumboldt State University
COLORADO
*University of Colorado/BoulderAdams State CollegeFort Lewis State CollegeMetropolitan State CollegeUniversity of Northern ColoradoWestern State College of Colorado
CONNECTICUT
*University of Connecticut/StorrsCentral Connecticut State UniversitySouthern Connecticut State UniversityWestern Connecticut State University
DELAWARE
*University of Delaware
FLORIDA'
University of Florida/GainsvilleFlorida Atlantic UniversityFlorida International UniversityUniversity of North FloridaUniversity of South FloridaUniversity of West Florida
GEORGIA
*University of GeorgiaAlbany State UniversityArmstrong Atlantic State UniversityAugusta State UniversityColumbus State UniversityGeorgia College & State UniversityGeorgia Southern UniversityValdosta State UniversityState University of West
Georgia College
*Indicates the state university reflected in Tables 1, 2, 3, and 4; tuition and fee data from the other statecolleges and universities are averaged in Tables 5, 6, 7, and 8.
'In Florida, tuition and fee rates reflect the average of the following institutions in the state university system.
45
HAWAII
IDAHO
*University of Hawaii/Manoa
*University of IdahoIdaho State UniversityBoise State University
ILLINOIS
*University of Illinois/UrbanaEastern Illinois UniversityIllinois State UniversityNorthern Illinois UniversityNortheastern Illinois UniversityWestern Illinois University
INDIANA
IOWA
*Indiana University/BloomingtonBall State UniversityIndiana State University
*University of IowaUniversity of Northern Iowa
KANSAS
*University of Kansas/LawrenceFort Hays State UniversityPittsburg State UniversityEmporia State UniversityWichita State University
KENTUCKY
*University of Kentucky/LexingtonEastern Kentucky UniversityMorehead State UniversityMurray State UniversityNorthern Kentucky UniversityWestern Kentucky UniversityUniversity of LouisvilleKentucky State University
LOUISIANA
MAINE
*Louisiana State University/Baton Rouge
Louisiana Technical UniversityMcNeese State UniversityNicholls State UniversityNortheast Louisiana UniversityNorthwestern State UniversitySoutheastern Louisiana UniversityGrambling State University.
*University of MaineUniversity of Maine/MachiasUniversity of Maine/Fort KentUniversity of Maine/Presque Isle
MARYLAND
*University of Maryland/College ParkBowie State UniversityCoppiri State CollegeMorgan State UniversitySt. Mary's College of MarylandTowson State UniversityFrostburg State University
MASSACHUSETTS
*University of Massachusetts/AmherstFitchburg State CollegeFramingham State CollegeMassachusetts College of ArtMassachusetts College of Liberal ArtsUniversity'of Massachusetts/
DartmouthWorcester State CollegeSalem State College
MICHIGAN
*University of Michigan/Ann ArborCentral Michigan UniversityEastern Michigan UniversityGrand Valley State UniversityNorthern Michigan UniversityOakland UniversityWestern Michigan University
*Indicates the state university reflected in Tables 1, 2, 3, and 4; tuition and fee data from the other statecolleges and universities are averaged in Tables 5, 6, 7, and 8.
MINNESOTA
*University of Minnesota/Twin CitiesBemidji State UniversityMankato State UniversityMetropolitan State UniversityMoorhead State UniversitySaint Cloud State UniversitySouthwest State UniversityWinona State University
MISSISSIPPI
*University of Mississippi/OxfordAlcorn State UniversityJackson State UniversityMississippi University for WomenUniversity of Southern MississippiMississippi Valley State University
MISSOURI
*University of Missouri/ColumbiaCentral Missouri State UniversityMissouri Southern State CollegeMissouri Western State CollegeTruman State UniversitySouthwest Missouri State College
MONTANA
*University of Montana/MissoulaMontana State University/BillingsWestern Montana College/University
of Montana
NEBRASKA
*University of Nebraska/LincolnKearney State CollegeWayne State College
NEVADA
*University of Nevada/RenoUniversity of Nevada/Las Vegas
NEW HAMPSHIRE
*University of New Hampshire/DurhamKeene State CollegePlymouth State College
NEW JERSEY
*Rutgers/New BrunswickRowan UniversityJersey City UniversityMontclair State UniversityNew Jersey Institute of TechnologyRamapo College of New JerseyRichard Stockton College of NJThe College of New Jersey
NEW MEXICO
*University of New Mexico/Albuquerque
Western New Mexico University
NEW YORK
*State University of NY/BuffaloEmpire State CollegeState U of NY College/BrockportState U of NY College/BuffaloState U of NY College/FredoniaState U of NY College/GeneseoState U of NY College/0Id WestburyState U of NY College/New PaltzState U of NY College/OswegoState U of NY College/PlattsburghState U of NY College/Potsdam
NORTH CAROLINA
*University of North Carolina/Chapel Hill.Appalachian State UniversityEast Carolina UniversityNorth Carolina Central UniversityWestern Carolina UniversityWinston Salem State University
*Indicates the state university reflected in Tables 1, 2, 3, and 4; tuition and fee data from the other statecolleges and universities are averaged in Tables 5, 6, 7, and 8.
)
NORTH DAKOTA
OHIO
*University of N Dakota/Grand ForksDickinson State UniversityMayville State UniversityMinot State UniversityValley City State University
*Ohio State University/ColumbusBowling Green State UniversityUniversity of AkronUniversity of ToledoWright State University
OKLAHOMA
*University of Oklahoma/NormanUniversity of Central OklahomaEast Central UniversityNortheastern State UniversityNorthwestern OK State UniversitySoutheastern OK State UniversitySouthwestern OK State University
OREGON
*University of Oregon/EugeneEastern Oregon State UniversitySouthern Oregon State UniversityPortland State UniversityOregon Institute of Technology
PENNSYLVANIA
*PA State University/University ParkBloomsburg University of PACalifornia University of PACheyney University of PAClarion University of PAEast Stroudsburg University of PAEdinboro University of PAIndiana University of PAKutztown University of PALock Haven University of PAMansfield University of PAMillersville University of PASlippery Rock University of PAShippensburg University of PAWest Chester University of PA
RHODE ISLAND
*University of Rhode IslandRhode Island College
SOUTH CAROLINA
*University of South CarolinaFrancis Marion College
SOUTH DAKOTA
*University of S Dakota/VermillionBlack Hills State UniversityDakota State University
TENNESSEE
TEXAS
UTAH
*University of Tennessee/KnoxvilleAustin Peay State UniversityEast Tennessee State UniversityUniversity of MemphisMiddle Tennessee State UniversityUniversity of Tennessee/ChattanoogaUniversity of Tennessee/Martin
*University of Texas/AustinAngelo State UniversityEast Texas State UniversityMidwestern State UniversityNorth Texas State UniversitySam Houston. State UniversitySouthwest Texas State UniversityStephen F. Austin State UniversityTexas A & M/KingsvilleWest Texas State University
*University of UtahWeber State University
VERMONT
*University of VermontCastleton State CollegeLyndon State College
*Indicates the state university reflected in Tables 1, 2, 3, and 4; tuition and fee data from the other statecolleges and universities are averaged in Tables 5, 6, 7, and 8.
48
VIRGINIA
*University of Virginia/CharlottesvilleGeorge Mason UniversityLongwood CollegeJames Madison UniversityOld Dominion UniversityRadford University
WASHINGTON
*University of WashingtonCentral Washington UniversityEastern Washington UniversityThe Evergreen State CollegeWestern Washington University
WEST VIRGINIA
*West Virginia University/MorgantownBluefield State CollegeConcord CollegeFairmont State CollegeMarshall UniversityShepherd CollegeWest Liberty State CollegeWest Virginia Institute of Technology
WISCONSIN
*University of Wisconsin/MadisonUniversity of Wisconsin/Eau ClaireUniversity of Wisconsin/OshkoshUniversity of Wisconsin/River FallsUniversity of Wisconsin/Stevens Point
WYOMING
*University of Wyoming
*Indicates the state university reflected in Tables 1, 2, 3, and 4; tuition and fee data from the otherstate colleges and universities are averaged in Tables 5, 6, 7, and 8.
U.S. Department of EducationOffice of Educational Research and Improvement (OERI)
National Library of Education (NLE)Educational Resources Information Center (ERIC)
NOTICE
REPRODUCTION BASIS
IC
This document is covered by a signed "Reproduction Release(Blanket) form (on file within the ERIC system), encompassing allor classes of documents from its source organization and, therefore,does not require a "Specific Document" Release form.
This document is Federally-funded, or carries its own permission toreproduce, or is otherwise in the public domain and, therefore, maybe reproduced by ERIC without a signed Reproduction Release form(either "Specific Document" or "Blanket").
EFF-089 (9/97)