Embed Size (px)
Citation preview
Agenda Item 7 Higher Education Coordinating Board January 30, 2015
7-1
ANNUAL REPORT ON FIRST-YEAR STUDENT REMEDIATION
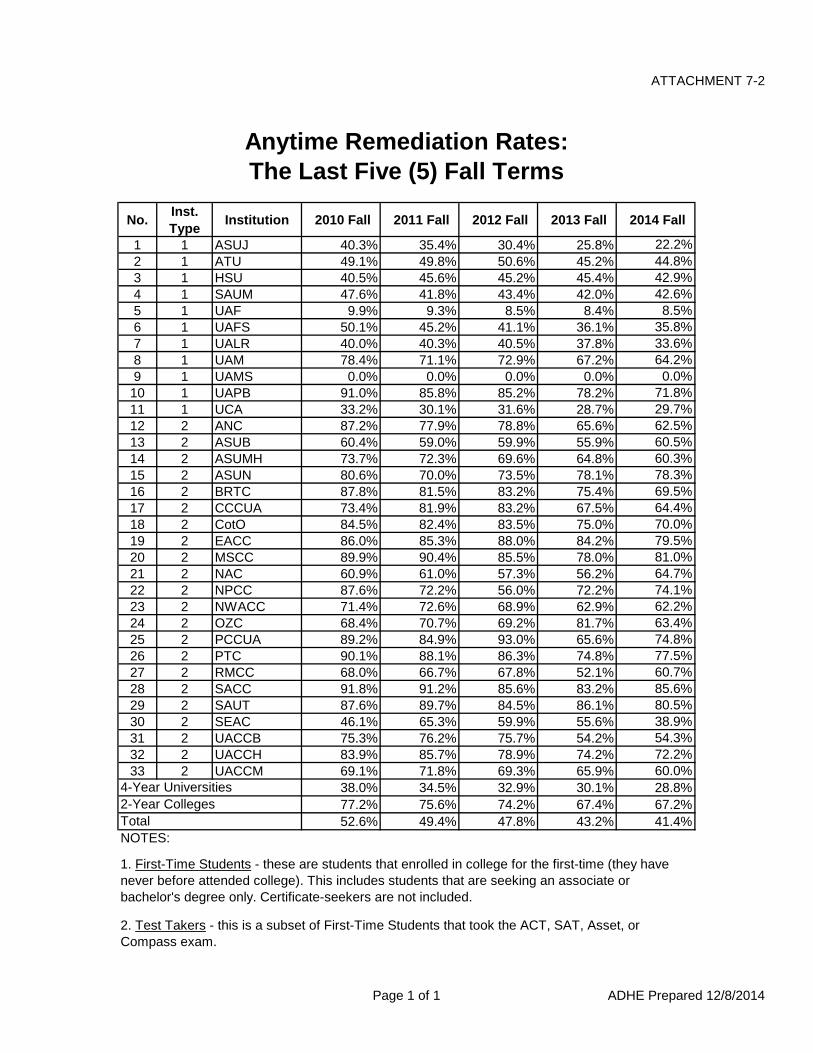
______________________________________ Attachments Attachment 7-1 Anytime Remediation Rates for the 2014 Fall Term Attachment 7-2 Anytime Remediation Rates by Year for Five (5) Fall Terms
(2010 Fall – 2014 Fall) Attachment 7-3 Anytime Remediation Rates for Math Attachment 7-4 Anytime Remediation Rates for English Attachment 7-5 Anytime Remediation Rates for Reading Attachment 7-6 Anytime Remediation Rates by Gender Attachment 7-7 Anytime Remediation Rates by Race/Ethnicity Attachment 7-8 Anytime Remediation Rates by Age Attachment 7-9 Anytime Remediation Rates by Attend Status Attachment 7-10 2-Year Remediation Rates Attachment 7-11 1-Year Remediation Rates Attachment 7-12 Remediation Rates by County of Residence (Anytime, 2-
Year, and 1-Year Rates) Attachment 7-13 Anytime Remediation Rates by High School District
(Anytime, 2-Year, and 1-Year Rates) Attachment 7-14 Act 970 Report on Remediation Rates of Students with High
School GPA of 3.00 or Higher Attachment 7-15 Remediation Attempts: How Many Times a Student was
Enrolled in a Remedial Course and Remediation Attempts: For Students that Passed, How Many Attempts Did It Take to Pass?
Since 1988, all entering first-year students seeking an associate degree or higher from an Arkansas public college or university must meet AHECB assessment and placement standards in the disciplines of English, mathematics, and reading. A cut-off subscore of 19 on the ACT exam (or the equivalent on the ASSET, SAT, or COMPASS tests) is used for each of the three subject areas. In all tables, remedial data are based on students who meet two criteria: (1) not meeting the board’s cut-off score; and (2) being assigned to enroll in developmental-level coursework (placement). The placement status of a student is determined by the institution based on the placement score and other relevant factors.

Agenda Item 7 January 30, 2015
7-2
Traditionally, ADHE has calculated remediation rates for any and all first-time entering students seeking an associate or higher credential. However, the legislature passed Act 970 in 2009 which required remediation rates to be calculated on students that had graduated high school within the past two years prior to entering college. In addition, the legislature conducted an interim study during 2010 in which ADHE was requested that remediation rates be calculated on students that had graduated high school in the previous 12 months. Therefore, ADHE is publishing remediation calculations using three slightly different methodologies:
1. Anytime Rates – rates in which the high school graduation date is ignored 2. 2-Year Rates – rates in which the student graduated high school in the
previous 2 years 3. 1-Year Rates – rates in which the student graduated high school in the
previous 1 year Based on the latest ACT data, some of the cutoff scores changed beginning with the 2013 Fall term. The change in cutoff scores that relate to the subject of mathematics are different based on students enrolling in one of the math courses required for the program major or degree: College Algebra, College Math, or Applied Technical Math. Generally, students majoring in CTE (Career Technical Education) fields are to take Applied Technical Math and students majoring in the STEM fields will take College Algebra. All others (not CTE or STEM/STEM-related majors) may take College Math. Therefore, the cutoff scores below use the major of the student (not enrollment in courses) and are as follows.
Test Type STEM Students Other Students CTE Students
Math English Reading Math English Reading Math English Reading 0 – ACT 19 19 19 19 19 19 16 19 19 1 – SAT 460 450 470 460 450 470 460 450 470 2 – Asset 39 45 43 39 45 43 31 45 43 3 - Compass 41 80 83 36 80 83 21 80 83
Comparing Remediation Rates As noted above, this report produces three different remediation rate calculations: Anytime, 2-Year, and 1-Year. These rates are compared as follows.

Agenda Item 7 January 30, 2015
7-3

Agenda Item 7 January 30, 2015
7-4
Statewide Overview In fall 2014, Arkansas’s public institutions enrolled 22,102 first-time degree-seeking students. 22,102 of those students were tested for placement purposes. Of the students who were tested, 9,119 students (41.4 percent) were
assigned to one or more remedial courses while the balance was placed in college-level coursework. This represents a decrease in the remediation rate of 1.8 percentage points from Fall 2013. Note that this is the lowest remediation rate in the last 5 fall terms and the total remediation rate has dropped every year since the 2010 Fall term.
Of the 9,119 students assigned to remediation, 4,270 (46.8 percent) were in the four-year sector and 4,849 (53.2 percent) were in the two-year sector.
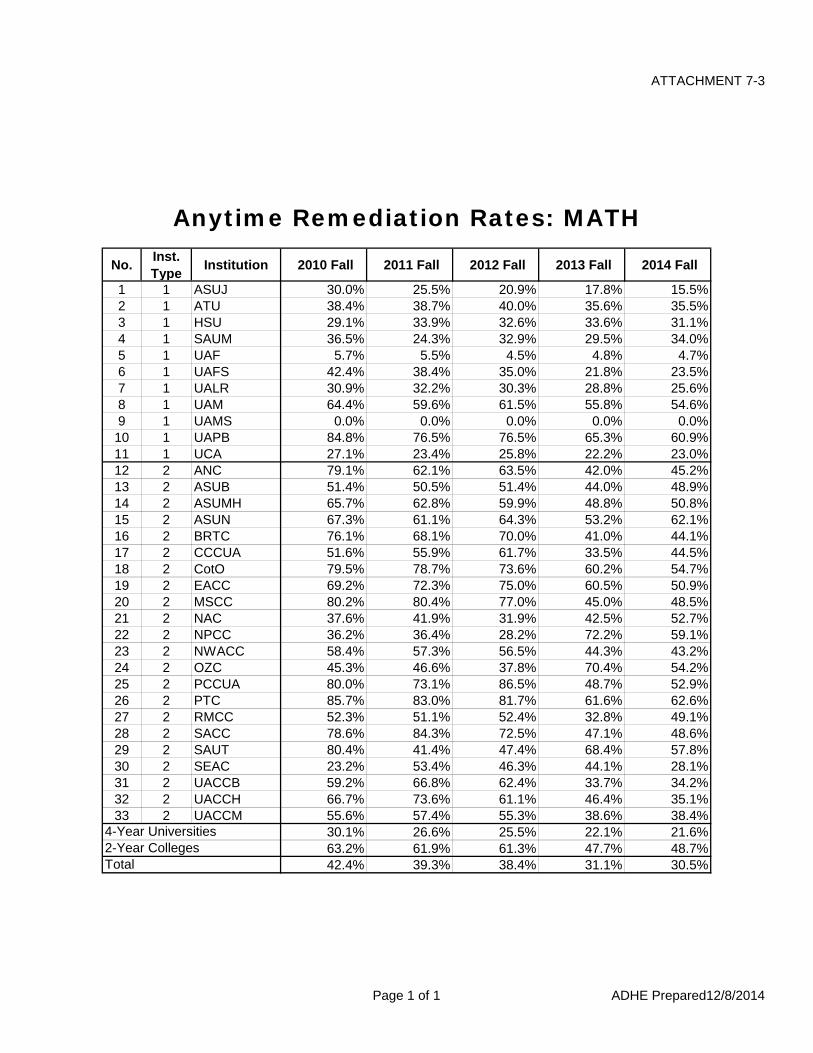
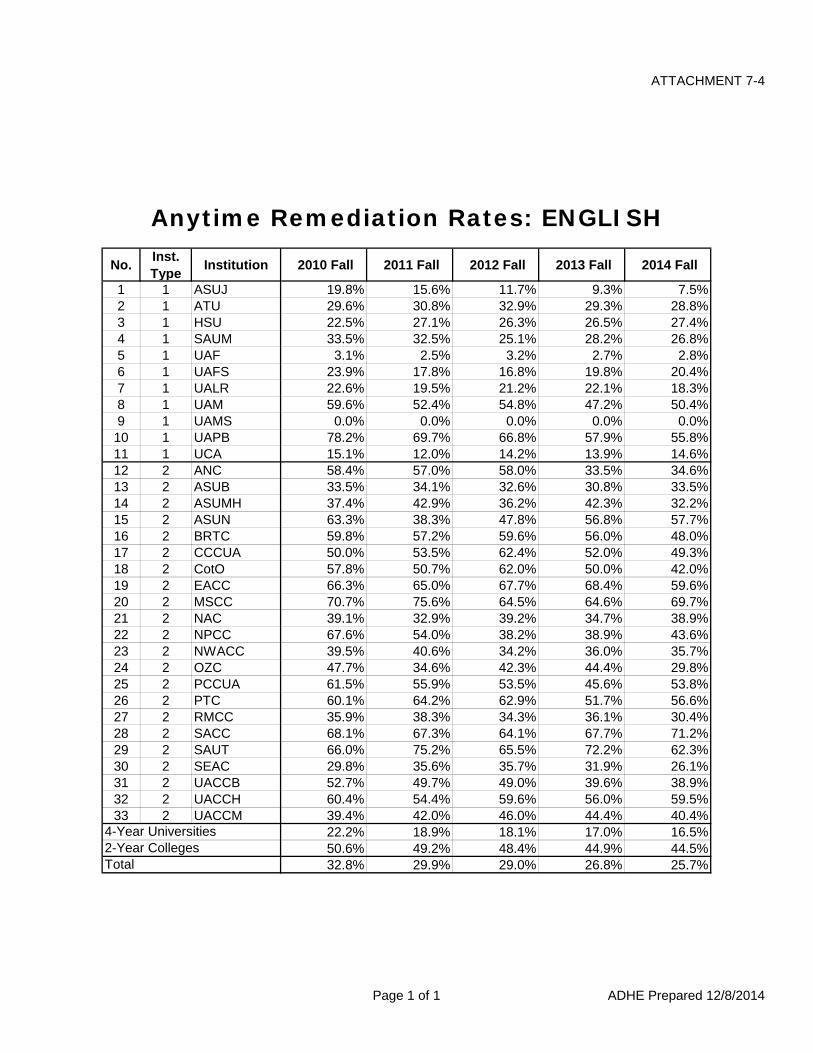
Remediation Rates by Subject Area From last year, the remediation rate for all three subject areas has decreased:
o Math – decrease of 0.6 percentage points; o English – decrease of 1.1 percentage points; and o Reading – decrease of 2.4 percentage points.

Agenda Item 7 January 30, 2015
7-5

Agenda Item 7 January 30, 2015
7-6
Remediation Rates by Student Type As noted previously, the new remediation cutoff scores relate to students enrolled in STEM, CTE, and other fields. This allows for a remediation rate calculation by student type.

Agenda Item 7 January 30, 2015
7-7
Remediation Rates by Demographics Gender: Remediation rates for males and females are very similar.
Agenda Item 7 January 30, 2015
7-8
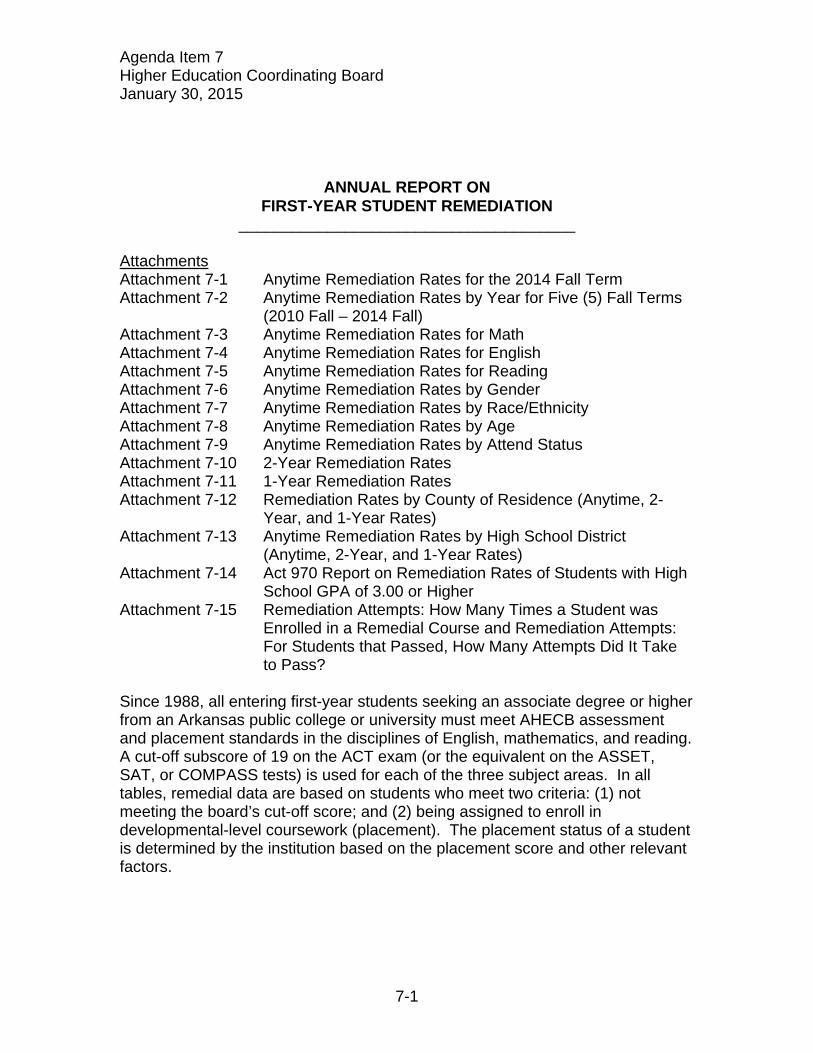
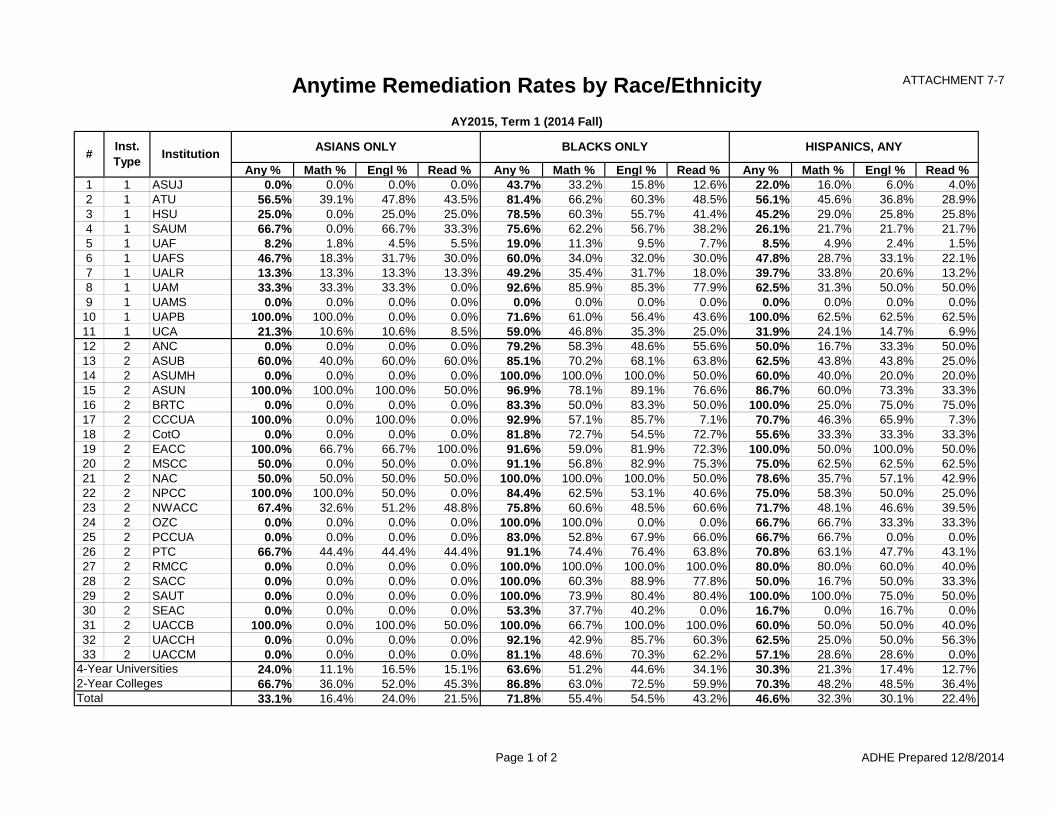
Race/Ethnicity: Regarding remediation rates by race and ethnicity, students of the White, Asian, and American Indian/Alaskan races have the lowest remediation rates. (Note that the race/ethnicities are actually defined as Asian Only, Black Only, Hispanic Any, American Indian and Alaskan Natives Only, White Only, and Hawaiian and Pacific Islanders Only.)
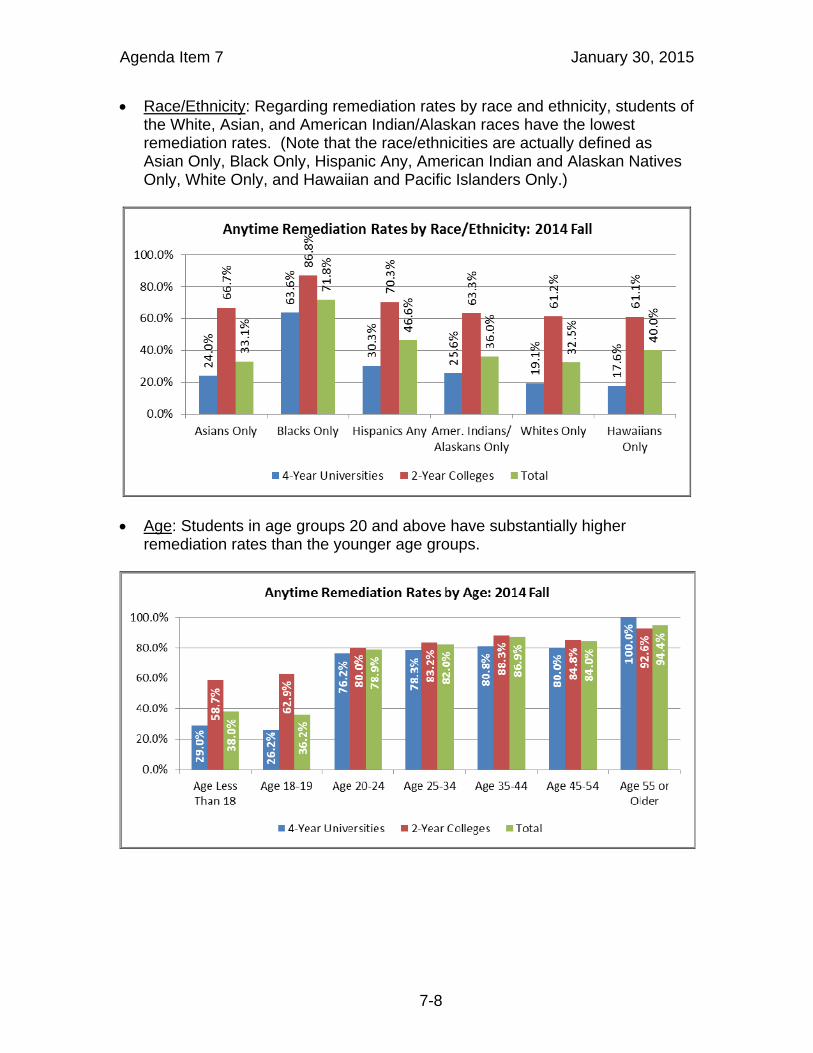
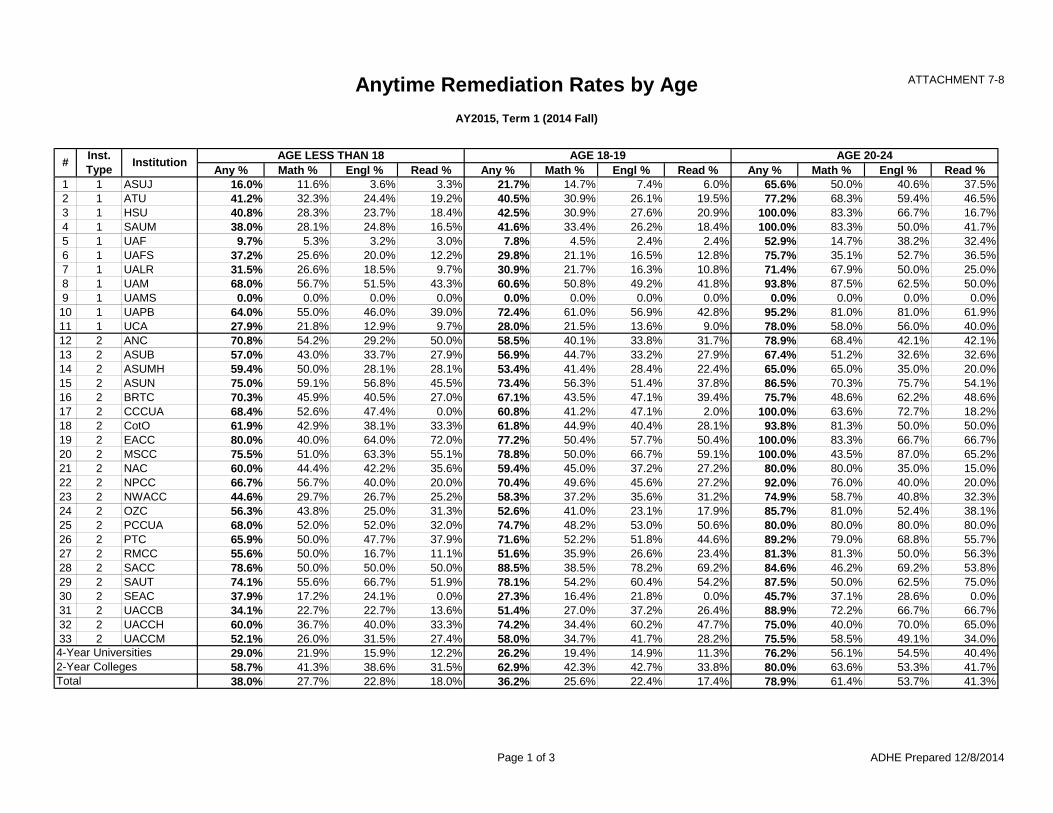
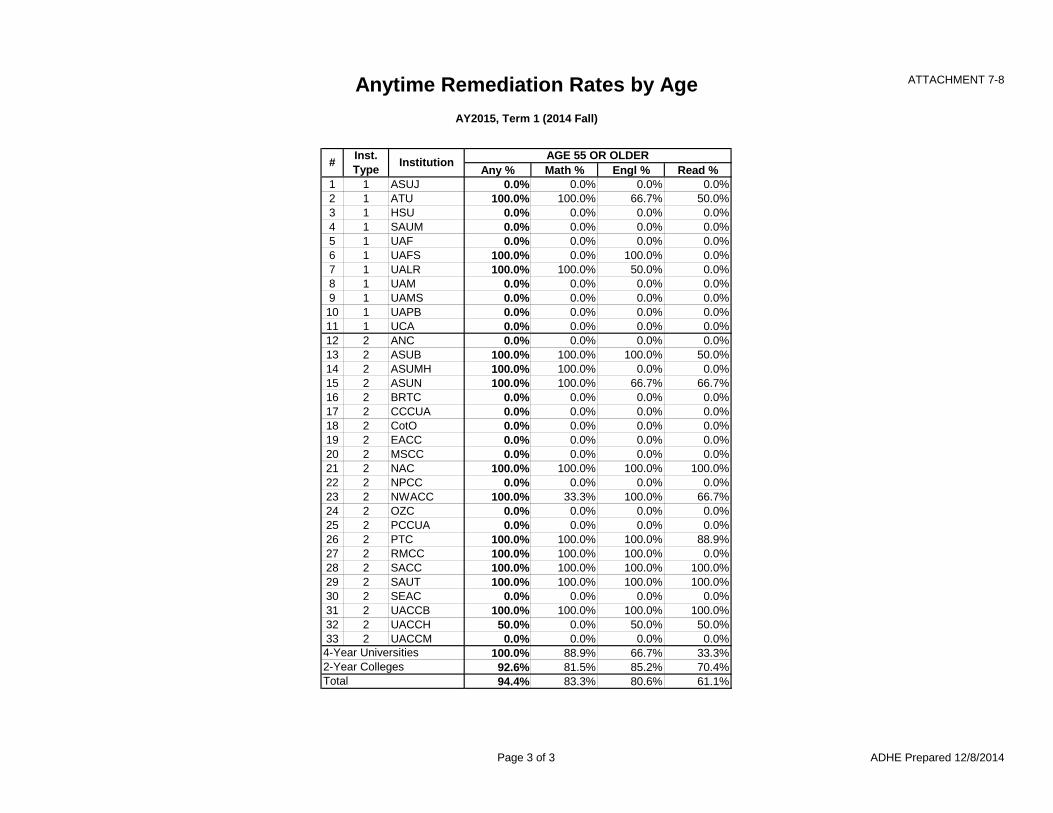
Age: Students in age groups 20 and above have substantially higher
remediation rates than the younger age groups.
Agenda Item 7 January 30, 2015
7-9
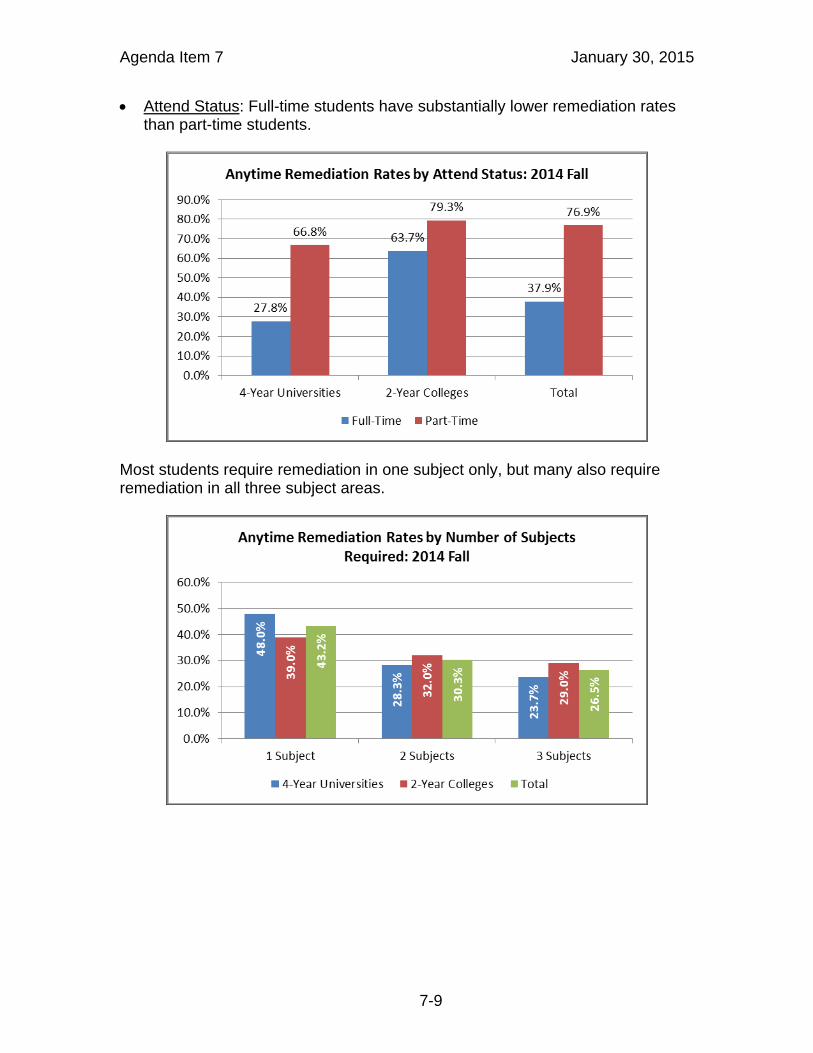
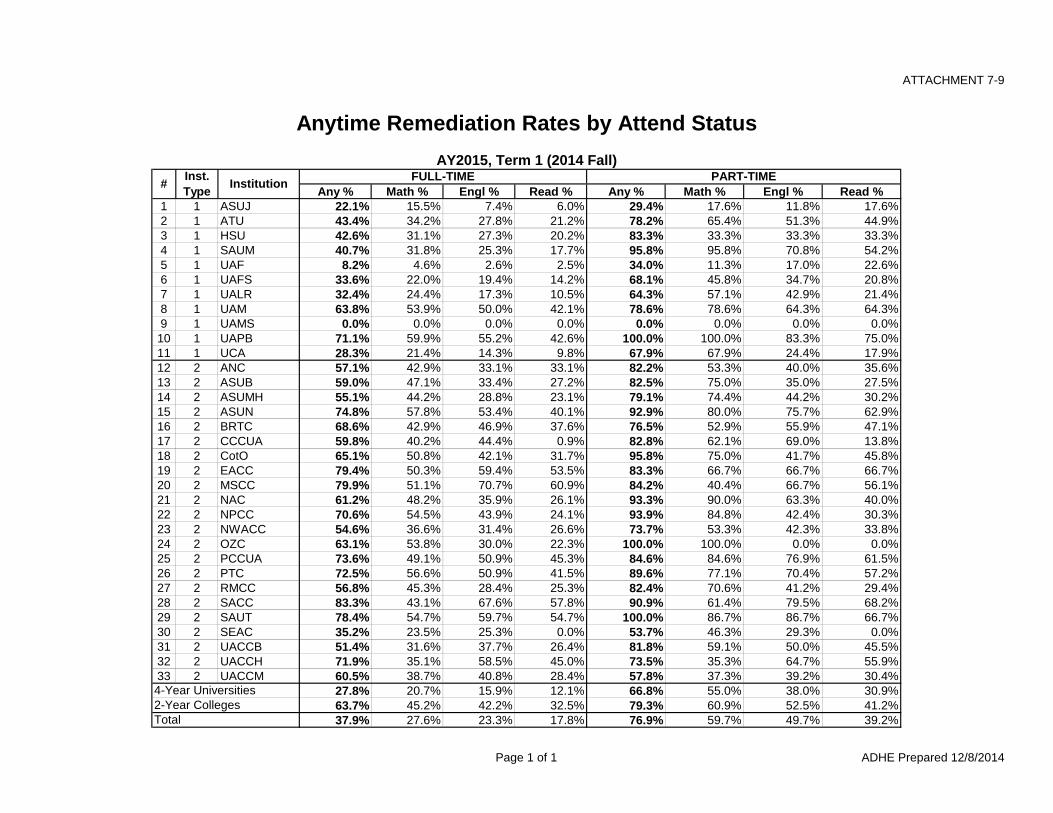
Attend Status: Full-time students have substantially lower remediation rates than part-time students.
Most students require remediation in one subject only, but many also require remediation in all three subject areas.

Agenda Item 7 January 30, 2015
7-10
The below chart shows the remediation rate of out-of-state students compared against the traditional anytime remediation rate.
Act 970 of 2009 required additional calculations regarding remediated students. (1) The first of these calculations is the remediation rate of recent high school students that graduated high school with a GPA (grade point average) of 3.00 or higher. (2) The second calculation is a determination of how many times it takes a student to pass a remedial course. The complete reports for these new calculations are shown in the attachments, whereas graphical summaries are shown below.

Agenda Item 7 January 30, 2015
7-11

ATTACHMENT 7-1
Anytime Remediation Rates
Academic Year = 2015, Term 1 (2014 Fall) and High School Graduation Year = Anytime
STEM CTE Other TOTAL1 1 ASUJ 13.0% 6.1% 25.0% 22.2%2 1 ATU 25.3% 76.3% 49.6% 44.8%3 1 HSU 30.2% 0.0% 46.8% 42.9%4 1 SAUM 28.8% 0.0% 45.6% 42.6%5 1 UAF 6.6% 0.0% 8.8% 8.5%6 1 UAFS 28.9% 42.6% 37.1% 35.8%7 1 UALR 13.5% 0.0% 37.0% 33.6%8 1 UAM 39.3% 0.0% 67.2% 64.2%9 1 UAMS 0.0% 0.0% 0.0% 0.0%10 1 UAPB 60.8% 0.0% 77.3% 71.8%11 1 UCA 2.3% 0.0% 33.9% 29.7%12 2 ANC 60.0% 55.6% 63.3% 62.5%13 2 ASUB 66.7% 49.0% 62.6% 60.5%14 2 ASUMH 83.3% 54.3% 60.8% 60.3%15 2 ASUN 75.0% 64.1% 80.1% 78.3%16 2 BRTC 0.0% 65.5% 72.4% 69.5%17 2 CCCUA 75.8% 47.5% 68.5% 64.4%18 2 CotO 62.5% 74.3% 69.2% 70.0%19 2 EACC 0.0% 82.6% 79.0% 79.5%20 2 MSCC 73.3% 85.1% 79.1% 81.0%21 2 NAC 73.7% 73.7% 63.3% 64.7%22 2 NPCC 55.6% 66.7% 78.1% 74.1%23 2 NWACC 62.7% 58.4% 62.9% 62.2%24 2 OZC 0.0% 77.1% 58.3% 63.4%25 2 PCCUA 0.0% 71.4% 77.1% 74.8%26 2 PTC 64.3% 76.8% 78.0% 77.5%27 2 RMCC 0.0% 52.2% 62.9% 60.7%28 2 SACC 100.0% 81.1% 93.2% 85.6%29 2 SAUT 76.7% 77.1% 87.0% 80.5%30 2 SEAC 42.9% 35.3% 46.7% 38.9%31 2 UACCB 0.0% 59.8% 51.0% 54.3%32 2 UACCH 100.0% 75.7% 69.2% 72.2%33 2 UACCM 68.5% 66.0% 57.9% 60.0%
19.5% 51.0% 30.5% 28.8%70.2% 65.0% 67.7% 67.2%25.0% 63.8% 41.8% 41.4%
4-Year Universities2-Year CollegesTotal
Percent Remediated#
Inst. Type
Institution
Page 1 of 1 ADHE Prepared 12/8/2014
ATTACHMENT 7-2
No.Inst. Type
Institution 2010 Fall 2011 Fall 2012 Fall 2013 Fall 2014 Fall
1 1 ASUJ 40.3% 35.4% 30.4% 25.8% 22.2%2 1 ATU 49.1% 49.8% 50.6% 45.2% 44.8%3 1 HSU 40.5% 45.6% 45.2% 45.4% 42.9%4 1 SAUM 47.6% 41.8% 43.4% 42.0% 42.6%5 1 UAF 9.9% 9.3% 8.5% 8.4% 8.5%6 1 UAFS 50.1% 45.2% 41.1% 36.1% 35.8%7 1 UALR 40.0% 40.3% 40.5% 37.8% 33.6%8 1 UAM 78.4% 71.1% 72.9% 67.2% 64.2%9 1 UAMS 0.0% 0.0% 0.0% 0.0% 0.0%10 1 UAPB 91.0% 85.8% 85.2% 78.2% 71.8%11 1 UCA 33.2% 30.1% 31.6% 28.7% 29.7%12 2 ANC 87.2% 77.9% 78.8% 65.6% 62.5%13 2 ASUB 60.4% 59.0% 59.9% 55.9% 60.5%14 2 ASUMH 73.7% 72.3% 69.6% 64.8% 60.3%15 2 ASUN 80.6% 70.0% 73.5% 78.1% 78.3%16 2 BRTC 87.8% 81.5% 83.2% 75.4% 69.5%17 2 CCCUA 73.4% 81.9% 83.2% 67.5% 64.4%18 2 CotO 84.5% 82.4% 83.5% 75.0% 70.0%19 2 EACC 86.0% 85.3% 88.0% 84.2% 79.5%20 2 MSCC 89.9% 90.4% 85.5% 78.0% 81.0%21 2 NAC 60.9% 61.0% 57.3% 56.2% 64.7%22 2 NPCC 87.6% 72.2% 56.0% 72.2% 74.1%23 2 NWACC 71.4% 72.6% 68.9% 62.9% 62.2%24 2 OZC 68.4% 70.7% 69.2% 81.7% 63.4%25 2 PCCUA 89.2% 84.9% 93.0% 65.6% 74.8%26 2 PTC 90.1% 88.1% 86.3% 74.8% 77.5%27 2 RMCC 68.0% 66.7% 67.8% 52.1% 60.7%28 2 SACC 91.8% 91.2% 85.6% 83.2% 85.6%29 2 SAUT 87.6% 89.7% 84.5% 86.1% 80.5%30 2 SEAC 46.1% 65.3% 59.9% 55.6% 38.9%31 2 UACCB 75.3% 76.2% 75.7% 54.2% 54.3%32 2 UACCH 83.9% 85.7% 78.9% 74.2% 72.2%33 2 UACCM 69.1% 71.8% 69.3% 65.9% 60.0%
38.0% 34.5% 32.9% 30.1% 28.8%77.2% 75.6% 74.2% 67.4% 67.2%52.6% 49.4% 47.8% 43.2% 41.4%
NOTES:
2. Test Takers - this is a subset of First-Time Students that took the ACT, SAT, Asset, or Compass exam.
Anytime Remediation Rates: The Last Five (5) Fall Terms
4-Year Universities2-Year CollegesTotal
1. First-Time Students - these are students that enrolled in college for the first-time (they have never before attended college). This includes students that are seeking an associate or bachelor's degree only. Certificate-seekers are not included.
Page 1 of 1 ADHE Prepared 12/8/2014
ATTACHMENT 7-3
No.Inst. Type
Institution 2010 Fall 2011 Fall 2012 Fall 2013 Fall 2014 Fall
1 1 ASUJ 30.0% 25.5% 20.9% 17.8% 15.5%2 1 ATU 38.4% 38.7% 40.0% 35.6% 35.5%3 1 HSU 29.1% 33.9% 32.6% 33.6% 31.1%4 1 SAUM 36.5% 24.3% 32.9% 29.5% 34.0%5 1 UAF 5.7% 5.5% 4.5% 4.8% 4.7%6 1 UAFS 42.4% 38.4% 35.0% 21.8% 23.5%7 1 UALR 30.9% 32.2% 30.3% 28.8% 25.6%8 1 UAM 64.4% 59.6% 61.5% 55.8% 54.6%9 1 UAMS 0.0% 0.0% 0.0% 0.0% 0.0%10 1 UAPB 84.8% 76.5% 76.5% 65.3% 60.9%11 1 UCA 27.1% 23.4% 25.8% 22.2% 23.0%12 2 ANC 79.1% 62.1% 63.5% 42.0% 45.2%13 2 ASUB 51.4% 50.5% 51.4% 44.0% 48.9%14 2 ASUMH 65.7% 62.8% 59.9% 48.8% 50.8%15 2 ASUN 67.3% 61.1% 64.3% 53.2% 62.1%16 2 BRTC 76.1% 68.1% 70.0% 41.0% 44.1%17 2 CCCUA 51.6% 55.9% 61.7% 33.5% 44.5%18 2 CotO 79.5% 78.7% 73.6% 60.2% 54.7%19 2 EACC 69.2% 72.3% 75.0% 60.5% 50.9%20 2 MSCC 80.2% 80.4% 77.0% 45.0% 48.5%21 2 NAC 37.6% 41.9% 31.9% 42.5% 52.7%22 2 NPCC 36.2% 36.4% 28.2% 72.2% 59.1%23 2 NWACC 58.4% 57.3% 56.5% 44.3% 43.2%24 2 OZC 45.3% 46.6% 37.8% 70.4% 54.2%25 2 PCCUA 80.0% 73.1% 86.5% 48.7% 52.9%26 2 PTC 85.7% 83.0% 81.7% 61.6% 62.6%27 2 RMCC 52.3% 51.1% 52.4% 32.8% 49.1%28 2 SACC 78.6% 84.3% 72.5% 47.1% 48.6%29 2 SAUT 80.4% 41.4% 47.4% 68.4% 57.8%30 2 SEAC 23.2% 53.4% 46.3% 44.1% 28.1%31 2 UACCB 59.2% 66.8% 62.4% 33.7% 34.2%32 2 UACCH 66.7% 73.6% 61.1% 46.4% 35.1%33 2 UACCM 55.6% 57.4% 55.3% 38.6% 38.4%
30.1% 26.6% 25.5% 22.1% 21.6%63.2% 61.9% 61.3% 47.7% 48.7%42.4% 39.3% 38.4% 31.1% 30.5%
4-Year Universities2-Year CollegesTotal
Anytime Remediation Rates: MATH
Page 1 of 1 ADHE Prepared12/8/2014
ATTACHMENT 7-4
No.Inst. Type
Institution 2010 Fall 2011 Fall 2012 Fall 2013 Fall 2014 Fall
1 1 ASUJ 19.8% 15.6% 11.7% 9.3% 7.5%2 1 ATU 29.6% 30.8% 32.9% 29.3% 28.8%3 1 HSU 22.5% 27.1% 26.3% 26.5% 27.4%4 1 SAUM 33.5% 32.5% 25.1% 28.2% 26.8%5 1 UAF 3.1% 2.5% 3.2% 2.7% 2.8%6 1 UAFS 23.9% 17.8% 16.8% 19.8% 20.4%7 1 UALR 22.6% 19.5% 21.2% 22.1% 18.3%8 1 UAM 59.6% 52.4% 54.8% 47.2% 50.4%9 1 UAMS 0.0% 0.0% 0.0% 0.0% 0.0%10 1 UAPB 78.2% 69.7% 66.8% 57.9% 55.8%11 1 UCA 15.1% 12.0% 14.2% 13.9% 14.6%12 2 ANC 58.4% 57.0% 58.0% 33.5% 34.6%13 2 ASUB 33.5% 34.1% 32.6% 30.8% 33.5%14 2 ASUMH 37.4% 42.9% 36.2% 42.3% 32.2%15 2 ASUN 63.3% 38.3% 47.8% 56.8% 57.7%16 2 BRTC 59.8% 57.2% 59.6% 56.0% 48.0%17 2 CCCUA 50.0% 53.5% 62.4% 52.0% 49.3%18 2 CotO 57.8% 50.7% 62.0% 50.0% 42.0%19 2 EACC 66.3% 65.0% 67.7% 68.4% 59.6%20 2 MSCC 70.7% 75.6% 64.5% 64.6% 69.7%21 2 NAC 39.1% 32.9% 39.2% 34.7% 38.9%22 2 NPCC 67.6% 54.0% 38.2% 38.9% 43.6%23 2 NWACC 39.5% 40.6% 34.2% 36.0% 35.7%24 2 OZC 47.7% 34.6% 42.3% 44.4% 29.8%25 2 PCCUA 61.5% 55.9% 53.5% 45.6% 53.8%26 2 PTC 60.1% 64.2% 62.9% 51.7% 56.6%27 2 RMCC 35.9% 38.3% 34.3% 36.1% 30.4%28 2 SACC 68.1% 67.3% 64.1% 67.7% 71.2%29 2 SAUT 66.0% 75.2% 65.5% 72.2% 62.3%30 2 SEAC 29.8% 35.6% 35.7% 31.9% 26.1%31 2 UACCB 52.7% 49.7% 49.0% 39.6% 38.9%32 2 UACCH 60.4% 54.4% 59.6% 56.0% 59.5%33 2 UACCM 39.4% 42.0% 46.0% 44.4% 40.4%
22.2% 18.9% 18.1% 17.0% 16.5%50.6% 49.2% 48.4% 44.9% 44.5%32.8% 29.9% 29.0% 26.8% 25.7%
4-Year Universities2-Year CollegesTotal
Anytime Remediation Rates: ENGLISH
Page 1 of 1 ADHE Prepared 12/8/2014

ATTACHMENT 7-5
No.Inst. Type
Institution 2010 Fall 2011 Fall 2012 Fall 2013 Fall 2014 Fall
1 1 ASUJ 16.8% 14.7% 10.9% 8.9% 6.1%2 1 ATU 23.1% 24.5% 26.5% 22.7% 22.2%3 1 HSU 20.8% 23.4% 23.9% 20.9% 20.3%4 1 SAUM 32.8% 29.0% 25.4% 20.5% 19.0%5 1 UAF 3.0% 2.8% 3.0% 2.7% 2.7%6 1 UAFS 16.1% 14.9% 13.2% 15.6% 14.6%7 1 UALR 18.3% 16.6% 19.8% 17.4% 10.9%8 1 UAM 55.4% 52.4% 50.3% 44.0% 42.7%9 1 UAMS 0.0% 0.0% 0.0% 0.0% 0.0%10 1 UAPB 75.9% 68.8% 65.4% 56.3% 43.3%11 1 UCA 11.5% 10.5% 11.6% 11.8% 10.1%12 2 ANC 56.4% 49.3% 52.2% 37.3% 33.7%13 2 ASUB 25.9% 24.1% 26.2% 23.5% 27.2%14 2 ASUMH 24.2% 37.7% 31.9% 31.0% 24.6%15 2 ASUN 55.6% 37.8% 38.3% 44.6% 44.5%16 2 BRTC 50.7% 38.7% 45.9% 44.3% 38.7%17 2 CCCUA 44.1% 45.7% 43.6% 49.5% 3.4%18 2 CotO 41.6% 27.9% 43.0% 32.0% 34.0%19 2 EACC 60.5% 62.7% 63.5% 65.3% 54.0%20 2 MSCC 66.8% 73.1% 63.5% 58.1% 59.7%21 2 NAC 32.4% 26.9% 31.9% 27.6% 27.6%22 2 NPCC 68.1% 44.0% 25.6% 22.2% 25.0%23 2 NWACC 31.3% 31.7% 30.7% 28.7% 29.4%24 2 OZC 40.4% 25.5% 35.3% 41.5% 22.1%25 2 PCCUA 64.1% 56.5% 53.0% 46.2% 47.1%26 2 PTC 52.0% 56.5% 54.5% 43.1% 46.1%27 2 RMCC 32.0% 36.9% 30.1% 30.3% 25.9%28 2 SACC 64.3% 69.2% 58.1% 60.0% 61.0%29 2 SAUT 62.9% 71.0% 62.9% 65.2% 55.8%30 2 SEAC 3.1% 0.0% 0.9% 0.0% 0.0%31 2 UACCB 37.0% 39.9% 38.1% 30.4% 28.2%32 2 UACCH 59.4% 51.1% 52.7% 47.8% 46.8%33 2 UACCM 33.5% 35.1% 36.4% 33.0% 28.8%
19.1% 17.1% 16.1% 14.4% 12.5%43.4% 40.3% 40.5% 36.3% 34.5%28.1% 25.5% 24.9% 22.1% 19.7%
4-Year Universities2-Year CollegesTotal
Anytime Remediation Rates: READING
Page 1 of 1 ADHE Prepared 12/8/2014

ATTACHMENT 7-6
Anytime Remediation Rates by Gender
AY2015, Term 1 (2014 Fall)
Any % Math % Engl % Read % Any % Math % Engl % Read %1 1 ASUJ 24.6% 14.8% 11.3% 9.1% 20.1% 16.1% 4.3% 3.7%2 1 ATU 42.5% 31.1% 30.1% 22.2% 46.9% 39.7% 27.5% 22.1%3 1 HSU 47.6% 31.5% 31.0% 23.8% 38.4% 30.8% 24.0% 16.9%4 1 SAUM 42.7% 32.8% 31.4% 21.8% 42.5% 35.2% 22.3% 16.2%5 1 UAF 8.3% 3.3% 3.5% 3.8% 8.6% 5.9% 2.1% 1.9%6 1 UAFS 35.9% 21.4% 22.6% 15.9% 35.7% 25.0% 18.7% 13.7%7 1 UALR 28.3% 20.2% 16.5% 10.1% 37.3% 29.4% 19.6% 11.4%8 1 UAM 61.0% 50.2% 51.0% 43.4% 67.2% 58.7% 49.8% 42.1%9 1 UAMS 0.0% 0.0% 0.0% 0.0% 0.0% 0.0% 0.0% 0.0%
10 1 UAPB 77.0% 63.2% 60.7% 47.7% 66.9% 58.8% 51.4% 39.3%11 1 UCA 30.7% 20.7% 17.5% 11.5% 29.0% 24.6% 12.6% 9.1%12 2 ANC 47.0% 31.8% 27.3% 21.2% 69.7% 51.4% 38.0% 39.4%13 2 ASUB 60.7% 45.4% 35.0% 24.6% 60.4% 51.8% 32.2% 29.3%14 2 ASUMH 56.7% 42.2% 31.1% 27.8% 63.3% 57.8% 33.0% 22.0%15 2 ASUN 77.2% 56.4% 62.4% 40.3% 79.1% 66.0% 54.4% 47.4%16 2 BRTC 68.8% 47.3% 54.8% 33.3% 69.9% 42.5% 44.6% 41.4%17 2 CCCUA 58.5% 35.8% 43.4% 1.9% 67.7% 49.5% 52.7% 4.3%18 2 CotO 71.6% 53.7% 43.3% 29.9% 68.7% 55.4% 41.0% 37.3%19 2 EACC 83.3% 43.9% 66.7% 54.5% 76.8% 55.8% 54.7% 53.7%20 2 MSCC 83.7% 51.0% 73.5% 65.3% 78.9% 46.6% 66.9% 55.6%21 2 NAC 63.1% 50.8% 43.8% 26.9% 66.2% 54.5% 34.5% 28.3%22 2 NPCC 74.5% 58.8% 49.0% 21.6% 73.7% 59.3% 39.0% 28.0%23 2 NWACC 62.2% 40.0% 39.1% 29.4% 62.2% 46.1% 32.7% 29.5%24 2 OZC 54.4% 42.1% 24.6% 17.5% 70.3% 63.5% 33.8% 25.7%25 2 PCCUA 77.4% 51.6% 61.3% 54.8% 73.9% 53.4% 51.1% 44.3%26 2 PTC 74.1% 54.6% 55.1% 40.1% 79.7% 67.7% 57.5% 49.9%27 2 RMCC 51.2% 31.7% 24.4% 19.5% 66.2% 59.2% 33.8% 29.6%28 2 SACC 84.0% 60.0% 72.0% 60.0% 86.5% 42.7% 70.8% 61.5%29 2 SAUT 79.8% 51.7% 62.9% 55.1% 81.5% 66.2% 61.5% 56.9%30 2 SEAC 40.8% 21.1% 32.9% 0.0% 37.8% 32.3% 22.0% 0.0%31 2 UACCB 62.5% 40.2% 47.3% 29.5% 46.7% 28.7% 31.1% 27.0%32 2 UACCH 70.5% 30.8% 62.8% 50.0% 73.2% 37.8% 57.5% 44.9%33 2 UACCM 58.6% 33.8% 41.9% 22.9% 61.0% 41.8% 39.4% 33.1%
29.3% 20.0% 18.8% 14.3% 28.4% 23.0% 14.6% 11.1%65.9% 44.6% 46.2% 32.1% 68.1% 51.8% 43.3% 36.2%40.8% 27.7% 27.4% 19.9% 41.9% 32.7% 24.3% 19.6%
FemalesMales
4-Year Universities2-Year CollegesTotal
#Inst. Type
Institution
Page 1 of 1 ADHE Prepared 12/8/2014
Anytime Remediation Rates by Race/Ethnicity
AY2015, Term 1 (2014 Fall)
ATTACHMENT 7-7
Any % Math % Engl % Read % Any % Math % Engl % Read % Any % Math % Engl % Read %1 1 ASUJ 0.0% 0.0% 0.0% 0.0% 43.7% 33.2% 15.8% 12.6% 22.0% 16.0% 6.0% 4.0%2 1 ATU 56.5% 39.1% 47.8% 43.5% 81.4% 66.2% 60.3% 48.5% 56.1% 45.6% 36.8% 28.9%3 1 HSU 25.0% 0.0% 25.0% 25.0% 78.5% 60.3% 55.7% 41.4% 45.2% 29.0% 25.8% 25.8%4 1 SAUM 66.7% 0.0% 66.7% 33.3% 75.6% 62.2% 56.7% 38.2% 26.1% 21.7% 21.7% 21.7%5 1 UAF 8.2% 1.8% 4.5% 5.5% 19.0% 11.3% 9.5% 7.7% 8.5% 4.9% 2.4% 1.5%6 1 UAFS 46.7% 18.3% 31.7% 30.0% 60.0% 34.0% 32.0% 30.0% 47.8% 28.7% 33.1% 22.1%7 1 UALR 13.3% 13.3% 13.3% 13.3% 49.2% 35.4% 31.7% 18.0% 39.7% 33.8% 20.6% 13.2%8 1 UAM 33.3% 33.3% 33.3% 0.0% 92.6% 85.9% 85.3% 77.9% 62.5% 31.3% 50.0% 50.0%9 1 UAMS 0.0% 0.0% 0.0% 0.0% 0.0% 0.0% 0.0% 0.0% 0.0% 0.0% 0.0% 0.0%
10 1 UAPB 100.0% 100.0% 0.0% 0.0% 71.6% 61.0% 56.4% 43.6% 100.0% 62.5% 62.5% 62.5%11 1 UCA 21.3% 10.6% 10.6% 8.5% 59.0% 46.8% 35.3% 25.0% 31.9% 24.1% 14.7% 6.9%12 2 ANC 0.0% 0.0% 0.0% 0.0% 79.2% 58.3% 48.6% 55.6% 50.0% 16.7% 33.3% 50.0%13 2 ASUB 60.0% 40.0% 60.0% 60.0% 85.1% 70.2% 68.1% 63.8% 62.5% 43.8% 43.8% 25.0%14 2 ASUMH 0.0% 0.0% 0.0% 0.0% 100.0% 100.0% 100.0% 50.0% 60.0% 40.0% 20.0% 20.0%15 2 ASUN 100.0% 100.0% 100.0% 50.0% 96.9% 78.1% 89.1% 76.6% 86.7% 60.0% 73.3% 33.3%16 2 BRTC 0.0% 0.0% 0.0% 0.0% 83.3% 50.0% 83.3% 50.0% 100.0% 25.0% 75.0% 75.0%17 2 CCCUA 100.0% 0.0% 100.0% 0.0% 92.9% 57.1% 85.7% 7.1% 70.7% 46.3% 65.9% 7.3%18 2 CotO 0.0% 0.0% 0.0% 0.0% 81.8% 72.7% 54.5% 72.7% 55.6% 33.3% 33.3% 33.3%19 2 EACC 100.0% 66.7% 66.7% 100.0% 91.6% 59.0% 81.9% 72.3% 100.0% 50.0% 100.0% 50.0%20 2 MSCC 50.0% 0.0% 50.0% 0.0% 91.1% 56.8% 82.9% 75.3% 75.0% 62.5% 62.5% 62.5%21 2 NAC 50.0% 50.0% 50.0% 50.0% 100.0% 100.0% 100.0% 50.0% 78.6% 35.7% 57.1% 42.9%22 2 NPCC 100.0% 100.0% 50.0% 0.0% 84.4% 62.5% 53.1% 40.6% 75.0% 58.3% 50.0% 25.0%23 2 NWACC 67.4% 32.6% 51.2% 48.8% 75.8% 60.6% 48.5% 60.6% 71.7% 48.1% 46.6% 39.5%24 2 OZC 0.0% 0.0% 0.0% 0.0% 100.0% 100.0% 0.0% 0.0% 66.7% 66.7% 33.3% 33.3%25 2 PCCUA 0.0% 0.0% 0.0% 0.0% 83.0% 52.8% 67.9% 66.0% 66.7% 66.7% 0.0% 0.0%26 2 PTC 66.7% 44.4% 44.4% 44.4% 91.1% 74.4% 76.4% 63.8% 70.8% 63.1% 47.7% 43.1%27 2 RMCC 0.0% 0.0% 0.0% 0.0% 100.0% 100.0% 100.0% 100.0% 80.0% 80.0% 60.0% 40.0%28 2 SACC 0.0% 0.0% 0.0% 0.0% 100.0% 60.3% 88.9% 77.8% 50.0% 16.7% 50.0% 33.3%29 2 SAUT 0.0% 0.0% 0.0% 0.0% 100.0% 73.9% 80.4% 80.4% 100.0% 100.0% 75.0% 50.0%30 2 SEAC 0.0% 0.0% 0.0% 0.0% 53.3% 37.7% 40.2% 0.0% 16.7% 0.0% 16.7% 0.0%31 2 UACCB 100.0% 0.0% 100.0% 50.0% 100.0% 66.7% 100.0% 100.0% 60.0% 50.0% 50.0% 40.0%32 2 UACCH 0.0% 0.0% 0.0% 0.0% 92.1% 42.9% 85.7% 60.3% 62.5% 25.0% 50.0% 56.3%33 2 UACCM 0.0% 0.0% 0.0% 0.0% 81.1% 48.6% 70.3% 62.2% 57.1% 28.6% 28.6% 0.0%
24.0% 11.1% 16.5% 15.1% 63.6% 51.2% 44.6% 34.1% 30.3% 21.3% 17.4% 12.7%66.7% 36.0% 52.0% 45.3% 86.8% 63.0% 72.5% 59.9% 70.3% 48.2% 48.5% 36.4%33.1% 16.4% 24.0% 21.5% 71.8% 55.4% 54.5% 43.2% 46.6% 32.3% 30.1% 22.4%
HISPANICS, ANYBLACKS ONLYASIANS ONLY
4-Year Universities2-Year CollegesTotal
#Inst. Type
Institution
Page 1 of 2 ADHE Prepared 12/8/2014

Anytime Remediation Rates by Race/Ethnicity
AY2015, Term 1 (2014 Fall)
ATTACHMENT 7-7
1 1 ASUJ2 1 ATU3 1 HSU4 1 SAUM5 1 UAF6 1 UAFS7 1 UALR8 1 UAM9 1 UAMS
10 1 UAPB11 1 UCA12 2 ANC13 2 ASUB14 2 ASUMH15 2 ASUN16 2 BRTC17 2 CCCUA18 2 CotO19 2 EACC20 2 MSCC21 2 NAC22 2 NPCC23 2 NWACC24 2 OZC25 2 PCCUA26 2 PTC27 2 RMCC28 2 SACC29 2 SAUT30 2 SEAC31 2 UACCB32 2 UACCH33 2 UACCM
4-Year Universities2-Year CollegesTotal
#Inst. Type
InstitutionAny % Math % Engl % Read % Any % Math % Engl % Read % Any % Math % Engl % Read %
21.7% 21.7% 8.7% 0.0% 16.3% 12.1% 3.5% 2.2% 12.5% 12.5% 12.5% 12.5%50.0% 50.0% 28.6% 42.9% 36.5% 29.0% 21.2% 15.1% 0.0% 0.0% 0.0% 0.0%
0.0% 0.0% 0.0% 0.0% 24.5% 17.0% 12.9% 8.4% 0.0% 0.0% 0.0% 0.0%100.0% 100.0% 0.0% 0.0% 26.8% 21.2% 12.7% 9.2% 0.0% 0.0% 0.0% 0.0%
17.5% 12.3% 3.5% 1.8% 6.7% 4.0% 1.6% 1.6% 14.3% 0.0% 0.0% 14.3%28.0% 20.0% 8.0% 8.0% 31.5% 22.2% 17.1% 11.0% 0.0% 0.0% 0.0% 0.0%
0.0% 0.0% 0.0% 0.0% 22.2% 18.0% 7.5% 4.6% 0.0% 0.0% 0.0% 0.0%0.0% 0.0% 0.0% 0.0% 47.7% 38.1% 30.5% 23.8% 0.0% 0.0% 0.0% 0.0%0.0% 0.0% 0.0% 0.0% 0.0% 0.0% 0.0% 0.0% 0.0% 0.0% 0.0% 0.0%0.0% 0.0% 0.0% 0.0% 40.0% 40.0% 20.0% 20.0% 0.0% 0.0% 0.0% 0.0%
42.9% 42.9% 14.3% 0.0% 17.0% 13.9% 5.4% 3.1% 50.0% 0.0% 50.0% 50.0%100.0% 100.0% 0.0% 100.0% 52.8% 37.8% 26.0% 19.7% 0.0% 0.0% 0.0% 0.0%
25.0% 25.0% 25.0% 0.0% 58.6% 48.0% 28.9% 23.5% 0.0% 0.0% 0.0% 0.0%100.0% 100.0% 0.0% 0.0% 60.2% 50.0% 31.3% 26.1% 0.0% 0.0% 0.0% 0.0%
0.0% 0.0% 0.0% 0.0% 72.6% 58.9% 49.0% 37.3% 0.0% 0.0% 0.0% 0.0%100.0% 100.0% 100.0% 100.0% 68.7% 44.0% 46.6% 37.7% 0.0% 0.0% 0.0% 0.0%100.0% 100.0% 0.0% 0.0% 55.6% 40.7% 34.6% 1.2% 0.0% 0.0% 0.0% 0.0%
0.0% 0.0% 0.0% 0.0% 68.5% 55.6% 40.3% 29.8% 0.0% 0.0% 0.0% 0.0%0.0% 0.0% 0.0% 0.0% 63.4% 40.8% 31.0% 29.6% 0.0% 0.0% 0.0% 0.0%
100.0% 100.0% 100.0% 100.0% 61.2% 31.3% 41.8% 32.8% 0.0% 0.0% 0.0% 0.0%75.0% 75.0% 75.0% 50.0% 62.6% 52.9% 34.9% 25.2% 100.0% 100.0% 100.0% 100.0%66.7% 66.7% 0.0% 0.0% 72.2% 58.6% 40.7% 22.8% 0.0% 0.0% 0.0% 0.0%59.3% 48.1% 33.3% 22.2% 57.9% 41.6% 29.1% 22.8% 69.2% 53.8% 61.5% 61.5%
0.0% 0.0% 0.0% 0.0% 63.0% 53.5% 29.9% 22.0% 0.0% 0.0% 0.0% 0.0%0.0% 0.0% 0.0% 0.0% 67.7% 51.6% 43.5% 32.3% 0.0% 0.0% 0.0% 0.0%
100.0% 100.0% 100.0% 0.0% 63.9% 50.2% 36.8% 28.5% 0.0% 0.0% 0.0% 0.0%0.0% 0.0% 0.0% 0.0% 60.8% 48.5% 29.9% 25.8% 0.0% 0.0% 0.0% 0.0%0.0% 0.0% 0.0% 0.0% 76.6% 41.6% 58.4% 49.4% 0.0% 0.0% 0.0% 0.0%0.0% 0.0% 0.0% 0.0% 73.0% 50.0% 55.0% 46.0% 0.0% 0.0% 0.0% 0.0%0.0% 0.0% 0.0% 0.0% 15.7% 12.9% 2.9% 0.0% 0.0% 0.0% 0.0% 0.0%
66.7% 33.3% 66.7% 33.3% 53.0% 33.7% 37.1% 25.7% 50.0% 50.0% 0.0% 50.0%100.0% 100.0% 0.0% 0.0% 63.2% 32.0% 48.0% 39.2% 0.0% 0.0% 0.0% 0.0%
0.0% 0.0% 0.0% 0.0% 57.1% 38.5% 36.5% 25.0% 0.0% 0.0% 0.0% 0.0%25.6% 21.7% 8.5% 7.0% 19.1% 14.3% 8.5% 6.0% 17.6% 5.9% 11.8% 17.6%63.3% 55.1% 36.7% 24.5% 61.2% 45.2% 35.5% 26.7% 61.1% 50.0% 50.0% 55.6%36.0% 30.9% 16.3% 11.8% 32.5% 24.1% 17.1% 12.6% 40.0% 28.6% 31.4% 37.1%
WHITES ONLYHAWAIIANS/PACIFIC
ISLANDERS ONLYAMERICAN INDIANS/
ALASKAN NATIVES ONLY
Page 2 of 2 ADHE Prepared 12/8/2014
Anytime Remediation Rates by Age
AY2015, Term 1 (2014 Fall)
ATTACHMENT 7-8
Any % Math % Engl % Read % Any % Math % Engl % Read % Any % Math % Engl % Read %1 1 ASUJ 16.0% 11.6% 3.6% 3.3% 21.7% 14.7% 7.4% 6.0% 65.6% 50.0% 40.6% 37.5%2 1 ATU 41.2% 32.3% 24.4% 19.2% 40.5% 30.9% 26.1% 19.5% 77.2% 68.3% 59.4% 46.5%3 1 HSU 40.8% 28.3% 23.7% 18.4% 42.5% 30.9% 27.6% 20.9% 100.0% 83.3% 66.7% 16.7%4 1 SAUM 38.0% 28.1% 24.8% 16.5% 41.6% 33.4% 26.2% 18.4% 100.0% 83.3% 50.0% 41.7%5 1 UAF 9.7% 5.3% 3.2% 3.0% 7.8% 4.5% 2.4% 2.4% 52.9% 14.7% 38.2% 32.4%6 1 UAFS 37.2% 25.6% 20.0% 12.2% 29.8% 21.1% 16.5% 12.8% 75.7% 35.1% 52.7% 36.5%7 1 UALR 31.5% 26.6% 18.5% 9.7% 30.9% 21.7% 16.3% 10.8% 71.4% 67.9% 50.0% 25.0%8 1 UAM 68.0% 56.7% 51.5% 43.3% 60.6% 50.8% 49.2% 41.8% 93.8% 87.5% 62.5% 50.0%9 1 UAMS 0.0% 0.0% 0.0% 0.0% 0.0% 0.0% 0.0% 0.0% 0.0% 0.0% 0.0% 0.0%10 1 UAPB 64.0% 55.0% 46.0% 39.0% 72.4% 61.0% 56.9% 42.8% 95.2% 81.0% 81.0% 61.9%11 1 UCA 27.9% 21.8% 12.9% 9.7% 28.0% 21.5% 13.6% 9.0% 78.0% 58.0% 56.0% 40.0%12 2 ANC 70.8% 54.2% 29.2% 50.0% 58.5% 40.1% 33.8% 31.7% 78.9% 68.4% 42.1% 42.1%13 2 ASUB 57.0% 43.0% 33.7% 27.9% 56.9% 44.7% 33.2% 27.9% 67.4% 51.2% 32.6% 32.6%14 2 ASUMH 59.4% 50.0% 28.1% 28.1% 53.4% 41.4% 28.4% 22.4% 65.0% 65.0% 35.0% 20.0%15 2 ASUN 75.0% 59.1% 56.8% 45.5% 73.4% 56.3% 51.4% 37.8% 86.5% 70.3% 75.7% 54.1%16 2 BRTC 70.3% 45.9% 40.5% 27.0% 67.1% 43.5% 47.1% 39.4% 75.7% 48.6% 62.2% 48.6%17 2 CCCUA 68.4% 52.6% 47.4% 0.0% 60.8% 41.2% 47.1% 2.0% 100.0% 63.6% 72.7% 18.2%18 2 CotO 61.9% 42.9% 38.1% 33.3% 61.8% 44.9% 40.4% 28.1% 93.8% 81.3% 50.0% 50.0%19 2 EACC 80.0% 40.0% 64.0% 72.0% 77.2% 50.4% 57.7% 50.4% 100.0% 83.3% 66.7% 66.7%20 2 MSCC 75.5% 51.0% 63.3% 55.1% 78.8% 50.0% 66.7% 59.1% 100.0% 43.5% 87.0% 65.2%21 2 NAC 60.0% 44.4% 42.2% 35.6% 59.4% 45.0% 37.2% 27.2% 80.0% 80.0% 35.0% 15.0%22 2 NPCC 66.7% 56.7% 40.0% 20.0% 70.4% 49.6% 45.6% 27.2% 92.0% 76.0% 40.0% 20.0%23 2 NWACC 44.6% 29.7% 26.7% 25.2% 58.3% 37.2% 35.6% 31.2% 74.9% 58.7% 40.8% 32.3%24 2 OZC 56.3% 43.8% 25.0% 31.3% 52.6% 41.0% 23.1% 17.9% 85.7% 81.0% 52.4% 38.1%25 2 PCCUA 68.0% 52.0% 52.0% 32.0% 74.7% 48.2% 53.0% 50.6% 80.0% 80.0% 80.0% 80.0%26 2 PTC 65.9% 50.0% 47.7% 37.9% 71.6% 52.2% 51.8% 44.6% 89.2% 79.0% 68.8% 55.7%27 2 RMCC 55.6% 50.0% 16.7% 11.1% 51.6% 35.9% 26.6% 23.4% 81.3% 81.3% 50.0% 56.3%28 2 SACC 78.6% 50.0% 50.0% 50.0% 88.5% 38.5% 78.2% 69.2% 84.6% 46.2% 69.2% 53.8%29 2 SAUT 74.1% 55.6% 66.7% 51.9% 78.1% 54.2% 60.4% 54.2% 87.5% 50.0% 62.5% 75.0%30 2 SEAC 37.9% 17.2% 24.1% 0.0% 27.3% 16.4% 21.8% 0.0% 45.7% 37.1% 28.6% 0.0%31 2 UACCB 34.1% 22.7% 22.7% 13.6% 51.4% 27.0% 37.2% 26.4% 88.9% 72.2% 66.7% 66.7%32 2 UACCH 60.0% 36.7% 40.0% 33.3% 74.2% 34.4% 60.2% 47.7% 75.0% 40.0% 70.0% 65.0%33 2 UACCM 52.1% 26.0% 31.5% 27.4% 58.0% 34.7% 41.7% 28.2% 75.5% 58.5% 49.1% 34.0%
29.0% 21.9% 15.9% 12.2% 26.2% 19.4% 14.9% 11.3% 76.2% 56.1% 54.5% 40.4%58.7% 41.3% 38.6% 31.5% 62.9% 42.3% 42.7% 33.8% 80.0% 63.6% 53.3% 41.7%38.0% 27.7% 22.8% 18.0% 36.2% 25.6% 22.4% 17.4% 78.9% 61.4% 53.7% 41.3%
AGE 20-24AGE 18-19AGE LESS THAN 18
4-Year Universities2-Year CollegesTotal
#Inst. Type
Institution
Page 1 of 3 ADHE Prepared 12/8/2014

Anytime Remediation Rates by Age
AY2015, Term 1 (2014 Fall)
ATTACHMENT 7-8
1 1 ASUJ2 1 ATU3 1 HSU4 1 SAUM5 1 UAF6 1 UAFS7 1 UALR8 1 UAM9 1 UAMS10 1 UAPB11 1 UCA12 2 ANC13 2 ASUB14 2 ASUMH15 2 ASUN16 2 BRTC17 2 CCCUA18 2 CotO19 2 EACC20 2 MSCC21 2 NAC22 2 NPCC23 2 NWACC24 2 OZC25 2 PCCUA26 2 PTC27 2 RMCC28 2 SACC29 2 SAUT30 2 SEAC31 2 UACCB32 2 UACCH33 2 UACCM4-Year Universities2-Year CollegesTotal
#Inst. Type
InstitutionAny % Math % Engl % Read % Any % Math % Engl % Read % Any % Math % Engl % Read %
85.7% 78.6% 21.4% 7.1% 33.3% 33.3% 0.0% 0.0% 100.0% 100.0% 0.0% 0.0%81.7% 73.3% 51.7% 51.7% 84.0% 76.0% 40.0% 28.0% 88.9% 88.9% 44.4% 33.3%
100.0% 100.0% 100.0% 0.0% 100.0% 100.0% 50.0% 0.0% 0.0% 0.0% 0.0% 0.0%100.0% 100.0% 80.0% 80.0% 100.0% 100.0% 100.0% 100.0% 100.0% 100.0% 0.0% 0.0%30.0% 30.0% 10.0% 10.0% 0.0% 0.0% 0.0% 0.0% 0.0% 0.0% 0.0% 0.0%73.5% 44.1% 35.3% 20.6% 87.5% 37.5% 62.5% 25.0% 60.0% 20.0% 40.0% 40.0%73.3% 73.3% 26.7% 0.0% 0.0% 0.0% 0.0% 0.0% 0.0% 0.0% 0.0% 0.0%90.9% 90.9% 63.6% 63.6% 85.7% 85.7% 42.9% 42.9% 100.0% 100.0% 66.7% 33.3%0.0% 0.0% 0.0% 0.0% 0.0% 0.0% 0.0% 0.0% 0.0% 0.0% 0.0% 0.0%
83.3% 83.3% 66.7% 83.3% 0.0% 0.0% 0.0% 0.0% 0.0% 0.0% 0.0% 0.0%83.3% 83.3% 22.2% 22.2% 100.0% 100.0% 75.0% 75.0% 0.0% 0.0% 0.0% 0.0%62.5% 50.0% 37.5% 18.8% 83.3% 50.0% 50.0% 33.3% 0.0% 0.0% 0.0% 0.0%81.3% 81.3% 34.4% 9.4% 100.0% 100.0% 31.6% 21.1% 100.0% 100.0% 50.0% 50.0%85.0% 75.0% 40.0% 35.0% 66.7% 66.7% 50.0% 33.3% 100.0% 100.0% 100.0% 25.0%92.3% 74.4% 69.2% 66.7% 93.3% 86.7% 66.7% 53.3% 100.0% 100.0% 100.0% 50.0%73.9% 30.4% 47.8% 39.1% 87.5% 62.5% 62.5% 50.0% 50.0% 50.0% 0.0% 0.0%40.0% 40.0% 40.0% 0.0% 66.7% 66.7% 50.0% 16.7% 66.7% 0.0% 66.7% 0.0%
100.0% 87.5% 56.3% 50.0% 66.7% 66.7% 16.7% 16.7% 100.0% 100.0% 50.0% 100.0%100.0% 80.0% 80.0% 60.0% 100.0% 50.0% 50.0% 0.0% 0.0% 0.0% 0.0% 0.0%92.3% 46.2% 92.3% 69.2% 81.8% 36.4% 72.7% 72.7% 100.0% 50.0% 100.0% 50.0%92.9% 92.9% 42.9% 21.4% 90.9% 90.9% 54.5% 36.4% 100.0% 100.0% 25.0% 0.0%80.0% 80.0% 40.0% 32.0% 88.9% 88.9% 55.6% 11.1% 66.7% 66.7% 33.3% 16.7%85.4% 68.6% 40.1% 22.6% 83.7% 69.8% 34.9% 20.9% 71.4% 64.3% 35.7% 14.3%
100.0% 100.0% 16.7% 16.7% 100.0% 100.0% 33.3% 0.0% 75.0% 75.0% 75.0% 25.0%100.0% 100.0% 0.0% 0.0% 100.0% 100.0% 66.7% 33.3% 100.0% 100.0% 50.0% 50.0%90.9% 87.9% 62.6% 45.5% 92.3% 87.2% 61.5% 38.5% 91.2% 76.5% 67.6% 50.0%81.8% 63.6% 36.4% 27.3% 100.0% 100.0% 50.0% 0.0% 0.0% 0.0% 0.0% 0.0%66.7% 66.7% 55.6% 44.4% 90.9% 81.8% 81.8% 45.5% 83.3% 83.3% 33.3% 50.0%
100.0% 100.0% 62.5% 62.5% 100.0% 83.3% 66.7% 33.3% 0.0% 0.0% 0.0% 0.0%66.7% 61.1% 50.0% 0.0% 85.7% 85.7% 28.6% 0.0% 100.0% 100.0% 25.0% 0.0%76.9% 61.5% 61.5% 38.5% 100.0% 85.7% 57.1% 42.9% 66.7% 66.7% 33.3% 0.0%66.7% 33.3% 60.0% 46.7% 83.3% 16.7% 83.3% 33.3% 100.0% 75.0% 100.0% 50.0%63.6% 57.6% 36.4% 27.3% 80.0% 80.0% 20.0% 30.0% 100.0% 50.0% 100.0% 50.0%78.3% 69.1% 41.1% 34.3% 80.8% 69.2% 44.2% 30.8% 80.0% 70.0% 40.0% 30.0%83.2% 71.0% 49.5% 33.9% 88.3% 77.4% 50.6% 31.4% 84.8% 74.3% 56.2% 33.3%82.0% 70.5% 47.5% 34.0% 86.9% 75.9% 49.5% 31.3% 84.0% 73.6% 53.6% 32.8%
AGE 35-44 AGE 45-54AGE 25-34
Page 2 of 3 ADHE Prepared 12/8/2014
Anytime Remediation Rates by Age
AY2015, Term 1 (2014 Fall)
ATTACHMENT 7-8
1 1 ASUJ2 1 ATU3 1 HSU4 1 SAUM5 1 UAF6 1 UAFS7 1 UALR8 1 UAM9 1 UAMS10 1 UAPB11 1 UCA12 2 ANC13 2 ASUB14 2 ASUMH15 2 ASUN16 2 BRTC17 2 CCCUA18 2 CotO19 2 EACC20 2 MSCC21 2 NAC22 2 NPCC23 2 NWACC24 2 OZC25 2 PCCUA26 2 PTC27 2 RMCC28 2 SACC29 2 SAUT30 2 SEAC31 2 UACCB32 2 UACCH33 2 UACCM4-Year Universities2-Year CollegesTotal
#Inst. Type
InstitutionAny % Math % Engl % Read %
0.0% 0.0% 0.0% 0.0%100.0% 100.0% 66.7% 50.0%
0.0% 0.0% 0.0% 0.0%0.0% 0.0% 0.0% 0.0%0.0% 0.0% 0.0% 0.0%
100.0% 0.0% 100.0% 0.0%100.0% 100.0% 50.0% 0.0%
0.0% 0.0% 0.0% 0.0%0.0% 0.0% 0.0% 0.0%0.0% 0.0% 0.0% 0.0%0.0% 0.0% 0.0% 0.0%0.0% 0.0% 0.0% 0.0%
100.0% 100.0% 100.0% 50.0%100.0% 100.0% 0.0% 0.0%100.0% 100.0% 66.7% 66.7%
0.0% 0.0% 0.0% 0.0%0.0% 0.0% 0.0% 0.0%0.0% 0.0% 0.0% 0.0%0.0% 0.0% 0.0% 0.0%0.0% 0.0% 0.0% 0.0%
100.0% 100.0% 100.0% 100.0%0.0% 0.0% 0.0% 0.0%
100.0% 33.3% 100.0% 66.7%0.0% 0.0% 0.0% 0.0%0.0% 0.0% 0.0% 0.0%
100.0% 100.0% 100.0% 88.9%100.0% 100.0% 100.0% 0.0%100.0% 100.0% 100.0% 100.0%100.0% 100.0% 100.0% 100.0%
0.0% 0.0% 0.0% 0.0%100.0% 100.0% 100.0% 100.0%50.0% 0.0% 50.0% 50.0%0.0% 0.0% 0.0% 0.0%
100.0% 88.9% 66.7% 33.3%92.6% 81.5% 85.2% 70.4%94.4% 83.3% 80.6% 61.1%
AGE 55 OR OLDER
Page 3 of 3 ADHE Prepared 12/8/2014
ATTACHMENT 7-9
Anytime Remediation Rates by Attend Status
AY2015, Term 1 (2014 Fall)
Any % Math % Engl % Read % Any % Math % Engl % Read %1 1 ASUJ 22.1% 15.5% 7.4% 6.0% 29.4% 17.6% 11.8% 17.6%2 1 ATU 43.4% 34.2% 27.8% 21.2% 78.2% 65.4% 51.3% 44.9%3 1 HSU 42.6% 31.1% 27.3% 20.2% 83.3% 33.3% 33.3% 33.3%4 1 SAUM 40.7% 31.8% 25.3% 17.7% 95.8% 95.8% 70.8% 54.2%5 1 UAF 8.2% 4.6% 2.6% 2.5% 34.0% 11.3% 17.0% 22.6%6 1 UAFS 33.6% 22.0% 19.4% 14.2% 68.1% 45.8% 34.7% 20.8%7 1 UALR 32.4% 24.4% 17.3% 10.5% 64.3% 57.1% 42.9% 21.4%8 1 UAM 63.8% 53.9% 50.0% 42.1% 78.6% 78.6% 64.3% 64.3%9 1 UAMS 0.0% 0.0% 0.0% 0.0% 0.0% 0.0% 0.0% 0.0%
10 1 UAPB 71.1% 59.9% 55.2% 42.6% 100.0% 100.0% 83.3% 75.0%11 1 UCA 28.3% 21.4% 14.3% 9.8% 67.9% 67.9% 24.4% 17.9%12 2 ANC 57.1% 42.9% 33.1% 33.1% 82.2% 53.3% 40.0% 35.6%13 2 ASUB 59.0% 47.1% 33.4% 27.2% 82.5% 75.0% 35.0% 27.5%14 2 ASUMH 55.1% 44.2% 28.8% 23.1% 79.1% 74.4% 44.2% 30.2%15 2 ASUN 74.8% 57.8% 53.4% 40.1% 92.9% 80.0% 75.7% 62.9%16 2 BRTC 68.6% 42.9% 46.9% 37.6% 76.5% 52.9% 55.9% 47.1%17 2 CCCUA 59.8% 40.2% 44.4% 0.9% 82.8% 62.1% 69.0% 13.8%18 2 CotO 65.1% 50.8% 42.1% 31.7% 95.8% 75.0% 41.7% 45.8%19 2 EACC 79.4% 50.3% 59.4% 53.5% 83.3% 66.7% 66.7% 66.7%20 2 MSCC 79.9% 51.1% 70.7% 60.9% 84.2% 40.4% 66.7% 56.1%21 2 NAC 61.2% 48.2% 35.9% 26.1% 93.3% 90.0% 63.3% 40.0%22 2 NPCC 70.6% 54.5% 43.9% 24.1% 93.9% 84.8% 42.4% 30.3%23 2 NWACC 54.6% 36.6% 31.4% 26.6% 73.7% 53.3% 42.3% 33.8%24 2 OZC 63.1% 53.8% 30.0% 22.3% 100.0% 100.0% 0.0% 0.0%25 2 PCCUA 73.6% 49.1% 50.9% 45.3% 84.6% 84.6% 76.9% 61.5%26 2 PTC 72.5% 56.6% 50.9% 41.5% 89.6% 77.1% 70.4% 57.2%27 2 RMCC 56.8% 45.3% 28.4% 25.3% 82.4% 70.6% 41.2% 29.4%28 2 SACC 83.3% 43.1% 67.6% 57.8% 90.9% 61.4% 79.5% 68.2%29 2 SAUT 78.4% 54.7% 59.7% 54.7% 100.0% 86.7% 86.7% 66.7%30 2 SEAC 35.2% 23.5% 25.3% 0.0% 53.7% 46.3% 29.3% 0.0%31 2 UACCB 51.4% 31.6% 37.7% 26.4% 81.8% 59.1% 50.0% 45.5%32 2 UACCH 71.9% 35.1% 58.5% 45.0% 73.5% 35.3% 64.7% 55.9%33 2 UACCM 60.5% 38.7% 40.8% 28.4% 57.8% 37.3% 39.2% 30.4%
27.8% 20.7% 15.9% 12.1% 66.8% 55.0% 38.0% 30.9%63.7% 45.2% 42.2% 32.5% 79.3% 60.9% 52.5% 41.2%37.9% 27.6% 23.3% 17.8% 76.9% 59.7% 49.7% 39.2%
PART-TIMEFULL-TIME
4-Year Universities2-Year CollegesTotal
#Inst. Type
Institution
Page 1 of 1 ADHE Prepared 12/8/2014

ATTACHMENT 7-10
Academic Year = 2015, Term 1 (2014 Fall) and High School Graduation Year = Anytime
STEM CTE Other TOTAL1 1 ASUJ 10.0% 3.2% 23.9% 20.8%2 1 ATU 22.5% 85.1% 46.2% 41.3%3 1 HSU 30.0% 0.0% 46.3% 42.5%4 1 SAUM 27.0% 0.0% 44.3% 41.2%5 1 UAF 6.3% 0.0% 8.1% 7.9%6 1 UAFS 24.3% 28.6% 33.4% 31.5%7 1 UALR 11.0% 0.0% 34.5% 31.0%8 1 UAM 40.0% 0.0% 65.3% 62.5%9 1 UAMS 0.0% 0.0% 0.0% 0.0%10 1 UAPB 59.1% 0.0% 76.7% 70.8%11 1 UCA 1.7% 0.0% 32.0% 27.9%12 2 ANC 42.9% 64.3% 61.8% 61.3%13 2 ASUB 62.5% 46.0% 59.4% 57.4%14 2 ASUMH 80.0% 44.4% 55.8% 55.3%15 2 ASUN 66.7% 50.0% 76.5% 74.3%16 2 BRTC 0.0% 67.1% 68.9% 68.3%17 2 CCCUA 72.4% 50.0% 63.5% 62.1%18 2 CotO 57.1% 58.8% 64.8% 63.5%19 2 EACC 0.0% 81.0% 78.3% 78.7%20 2 MSCC 66.7% 82.6% 77.7% 78.9%21 2 NAC 68.8% 70.0% 59.3% 60.4%22 2 NPCC 50.0% 62.9% 73.3% 70.1%23 2 NWACC 57.6% 54.5% 57.3% 56.9%24 2 OZC 0.0% 65.0% 49.4% 52.6%25 2 PCCUA 0.0% 71.1% 75.4% 73.6%26 2 PTC 60.0% 75.8% 72.7% 73.2%27 2 RMCC 0.0% 30.8% 56.9% 52.9%28 2 SACC 100.0% 83.1% 92.9% 86.6%29 2 SAUT 75.0% 75.0% 84.4% 78.3%30 2 SEAC 25.0% 31.4% 35.1% 32.2%31 2 UACCB 0.0% 52.3% 46.2% 48.2%32 2 UACCH 100.0% 80.0% 68.9% 71.9%33 2 UACCM 67.4% 72.5% 55.3% 58.3%
17.7% 44.7% 28.6% 26.8%66.5% 62.0% 63.5% 63.3%22.0% 60.4% 37.9% 37.2%
4-Year Universities2-Year CollegesTotal
Percent Remediated
2-Year Remediation Rates
#Inst. Type
Institution
Page 1 of 1 ADHE Prepared 12/8/2014
ATTACHMENT 7-11
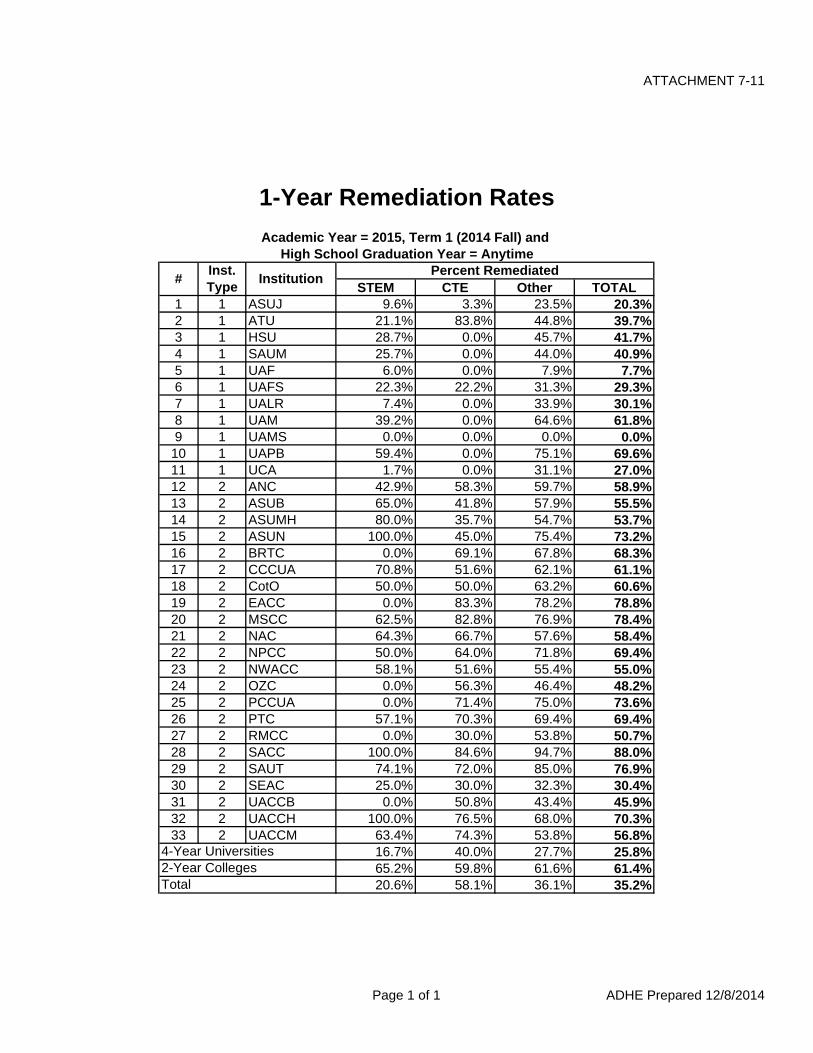
Academic Year = 2015, Term 1 (2014 Fall) and High School Graduation Year = Anytime
STEM CTE Other TOTAL1 1 ASUJ 9.6% 3.3% 23.5% 20.3%2 1 ATU 21.1% 83.8% 44.8% 39.7%3 1 HSU 28.7% 0.0% 45.7% 41.7%4 1 SAUM 25.7% 0.0% 44.0% 40.9%5 1 UAF 6.0% 0.0% 7.9% 7.7%6 1 UAFS 22.3% 22.2% 31.3% 29.3%7 1 UALR 7.4% 0.0% 33.9% 30.1%8 1 UAM 39.2% 0.0% 64.6% 61.8%9 1 UAMS 0.0% 0.0% 0.0% 0.0%
10 1 UAPB 59.4% 0.0% 75.1% 69.6%11 1 UCA 1.7% 0.0% 31.1% 27.0%12 2 ANC 42.9% 58.3% 59.7% 58.9%13 2 ASUB 65.0% 41.8% 57.9% 55.5%14 2 ASUMH 80.0% 35.7% 54.7% 53.7%15 2 ASUN 100.0% 45.0% 75.4% 73.2%16 2 BRTC 0.0% 69.1% 67.8% 68.3%17 2 CCCUA 70.8% 51.6% 62.1% 61.1%18 2 CotO 50.0% 50.0% 63.2% 60.6%19 2 EACC 0.0% 83.3% 78.2% 78.8%20 2 MSCC 62.5% 82.8% 76.9% 78.4%21 2 NAC 64.3% 66.7% 57.6% 58.4%22 2 NPCC 50.0% 64.0% 71.8% 69.4%23 2 NWACC 58.1% 51.6% 55.4% 55.0%24 2 OZC 0.0% 56.3% 46.4% 48.2%25 2 PCCUA 0.0% 71.4% 75.0% 73.6%26 2 PTC 57.1% 70.3% 69.4% 69.4%27 2 RMCC 0.0% 30.0% 53.8% 50.7%28 2 SACC 100.0% 84.6% 94.7% 88.0%29 2 SAUT 74.1% 72.0% 85.0% 76.9%30 2 SEAC 25.0% 30.0% 32.3% 30.4%31 2 UACCB 0.0% 50.8% 43.4% 45.9%32 2 UACCH 100.0% 76.5% 68.0% 70.3%33 2 UACCM 63.4% 74.3% 53.8% 56.8%
16.7% 40.0% 27.7% 25.8%65.2% 59.8% 61.6% 61.4%20.6% 58.1% 36.1% 35.2%
4-Year Universities2-Year CollegesTotal
Percent Remediated
1-Year Remediation Rates
#Inst. Type
Institution
Page 1 of 1 ADHE Prepared 12/8/2014

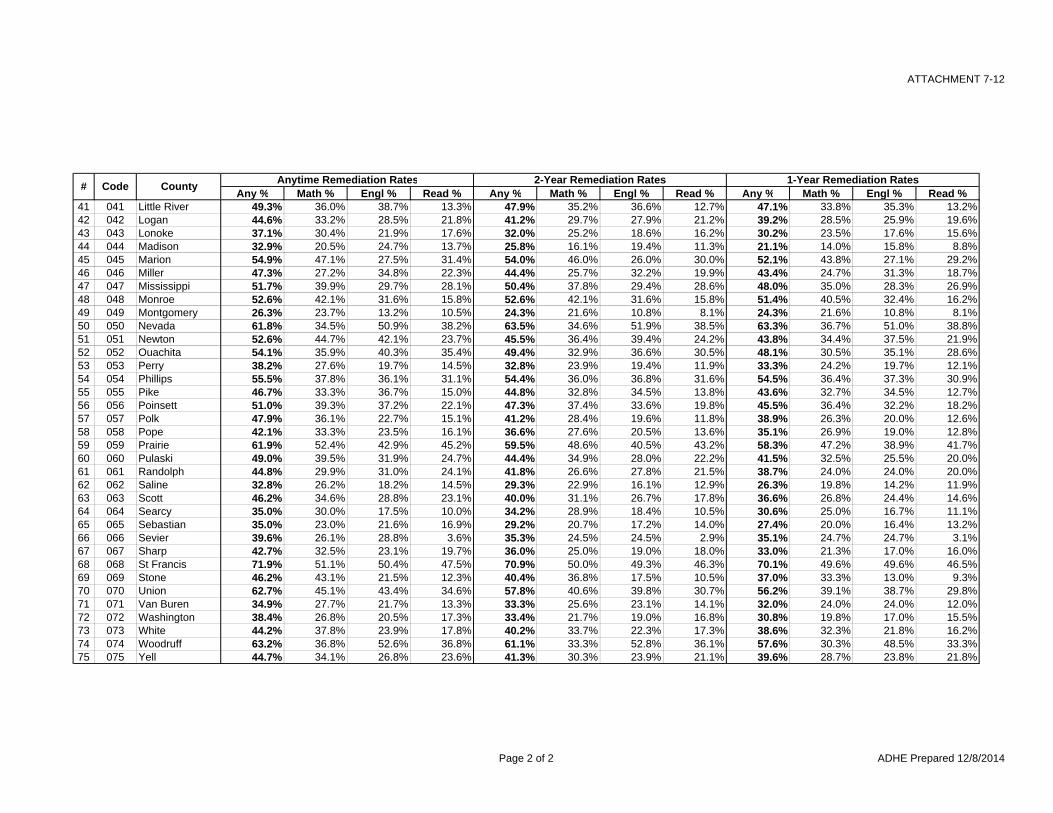
ATTACHMENT 7-12
Any % Math % Engl % Read % Any % Math % Engl % Read % Any % Math % Engl % Read %1 001 Arkansas 57.9% 42.7% 42.7% 36.0% 55.6% 40.2% 40.8% 34.9% 55.3% 39.8% 41.6% 35.4%2 002 Ashley 62.9% 50.0% 38.7% 29.0% 60.3% 46.6% 37.1% 29.3% 59.3% 45.4% 35.2% 27.8%3 003 Baxter 42.0% 35.2% 21.8% 15.5% 33.5% 25.8% 17.4% 13.5% 31.0% 23.9% 15.5% 12.0%4 004 Benton 38.6% 27.2% 20.9% 16.1% 32.7% 21.8% 18.5% 15.1% 31.1% 20.7% 17.7% 14.4%5 005 Boone 46.7% 41.1% 23.4% 18.3% 40.9% 35.1% 20.5% 15.2% 38.9% 32.7% 19.1% 14.8%6 006 Bradley 60.9% 51.6% 50.0% 37.5% 59.6% 50.9% 50.9% 36.8% 59.3% 50.0% 51.9% 38.9%7 007 Calhoun 60.0% 50.0% 33.3% 23.3% 55.6% 44.4% 33.3% 25.9% 52.0% 40.0% 28.0% 20.0%8 008 Carroll 42.2% 26.7% 22.4% 15.5% 36.5% 19.2% 21.2% 14.4% 35.6% 18.8% 20.8% 13.9%9 009 Chicot 66.7% 56.9% 51.0% 39.2% 63.8% 53.2% 46.8% 36.2% 65.2% 54.3% 47.8% 37.0%
10 010 Clark 45.3% 38.7% 31.4% 26.3% 43.7% 38.1% 29.4% 26.2% 41.3% 36.4% 27.3% 24.0%11 011 Clay 40.7% 29.6% 18.5% 17.3% 34.3% 25.7% 12.9% 15.7% 33.8% 25.0% 13.2% 16.2%12 012 Cleburne 43.5% 32.1% 26.0% 15.3% 37.2% 25.7% 23.9% 14.2% 31.3% 20.2% 21.2% 13.1%13 013 Cleveland 29.0% 24.2% 17.7% 6.5% 29.3% 24.1% 19.0% 6.9% 29.3% 24.1% 19.0% 6.9%14 014 Columbia 51.7% 40.8% 36.7% 30.6% 48.1% 37.0% 33.3% 28.1% 45.7% 35.7% 31.0% 25.6%15 015 Conway 47.6% 33.8% 29.0% 26.2% 44.5% 31.3% 25.8% 23.4% 41.7% 28.3% 23.3% 21.7%16 016 Craighead 41.1% 31.0% 21.5% 17.4% 35.5% 26.6% 18.1% 14.4% 34.3% 25.8% 17.1% 13.5%17 017 Crawford 35.0% 24.3% 20.4% 14.6% 30.5% 20.8% 17.3% 13.0% 28.2% 19.1% 15.4% 12.3%18 018 Crittenden 58.2% 35.9% 44.6% 37.3% 55.5% 36.3% 42.0% 34.7% 54.8% 36.6% 41.3% 34.0%19 019 Cross 45.0% 25.7% 32.1% 22.9% 43.6% 24.8% 30.7% 22.8% 41.7% 22.9% 29.2% 21.9%20 020 Dallas 63.6% 50.9% 32.7% 23.6% 60.0% 46.0% 32.0% 26.0% 58.3% 43.8% 29.2% 22.9%21 021 Desha 57.1% 54.0% 38.1% 31.7% 55.0% 51.7% 36.7% 31.7% 53.4% 50.0% 34.5% 29.3%22 022 Drew 53.8% 45.3% 43.4% 35.8% 49.0% 39.6% 41.7% 34.4% 46.7% 36.7% 38.9% 31.1%23 023 Faulkner 34.9% 26.1% 19.7% 12.4% 30.9% 21.9% 17.7% 12.2% 29.4% 20.4% 17.2% 11.5%24 024 Franklin 44.1% 33.6% 30.9% 20.4% 39.1% 26.6% 28.1% 17.2% 35.8% 23.3% 25.0% 15.0%25 025 Fulton 38.9% 29.6% 25.9% 18.5% 29.8% 19.1% 23.4% 17.0% 29.8% 19.1% 23.4% 17.0%26 026 Garland 43.2% 33.8% 23.0% 13.4% 37.2% 27.4% 20.5% 12.3% 35.7% 26.4% 19.5% 12.1%27 027 Grant 33.0% 21.1% 19.3% 21.1% 29.6% 17.3% 21.4% 19.4% 24.7% 12.4% 18.0% 15.7%28 028 Greene 37.6% 28.8% 18.8% 14.4% 34.3% 26.4% 16.5% 12.4% 33.5% 26.0% 15.9% 11.9%29 029 Hempstead 57.3% 36.6% 39.7% 37.4% 55.8% 36.7% 36.7% 35.0% 53.9% 37.4% 34.8% 33.0%30 030 Hot Spring 41.1% 33.8% 20.3% 16.9% 34.0% 26.6% 18.2% 14.3% 31.2% 23.8% 17.5% 12.2%31 031 Howard 43.3% 30.9% 30.9% 13.4% 40.7% 28.6% 28.6% 12.1% 40.0% 28.9% 27.8% 11.1%32 032 Independence 45.6% 31.0% 30.6% 22.2% 40.1% 25.2% 26.6% 18.5% 38.4% 24.2% 25.1% 17.1%33 033 Izard 48.5% 39.4% 16.7% 10.6% 40.4% 31.6% 10.5% 8.8% 40.0% 30.9% 10.9% 7.3%34 034 Jackson 64.2% 53.7% 50.4% 42.3% 52.3% 40.9% 36.4% 28.4% 50.6% 42.0% 34.6% 28.4%35 035 Jefferson 49.5% 39.0% 35.9% 19.5% 46.9% 35.7% 33.9% 19.7% 47.6% 36.1% 35.3% 20.9%36 036 Johnson 44.1% 37.9% 27.6% 24.8% 36.8% 30.7% 22.8% 21.9% 32.7% 26.9% 19.2% 18.3%37 037 Lafayette 76.2% 57.1% 61.9% 45.2% 73.7% 55.3% 57.9% 39.5% 72.2% 55.6% 55.6% 38.9%38 038 Lawrence 55.0% 28.8% 35.1% 26.1% 52.6% 26.8% 32.0% 25.8% 52.1% 26.6% 31.9% 24.5%39 039 Lee 69.2% 46.2% 56.4% 48.7% 68.4% 44.7% 55.3% 47.4% 67.6% 45.9% 54.1% 45.9%40 040 Lincoln 50.8% 37.7% 32.8% 31.1% 51.7% 37.9% 34.5% 32.8% 49.1% 35.8% 34.0% 30.2%
1-Year Remediation RatesAY2015, Term 1 (2014 Fall)
Remediation Rates by County
2-Year Remediation RatesAnytime Remediation Rates# Code County
Page 1 of 2 ADHE Prepared 12/8/2014
ATTACHMENT 7-12
Any % Math % Engl % Read % Any % Math % Engl % Read % Any % Math % Engl % Read %1-Year Remediation Rates2-Year Remediation RatesAnytime Remediation Rates
# Code County
41 041 Little River 49.3% 36.0% 38.7% 13.3% 47.9% 35.2% 36.6% 12.7% 47.1% 33.8% 35.3% 13.2%42 042 Logan 44.6% 33.2% 28.5% 21.8% 41.2% 29.7% 27.9% 21.2% 39.2% 28.5% 25.9% 19.6%43 043 Lonoke 37.1% 30.4% 21.9% 17.6% 32.0% 25.2% 18.6% 16.2% 30.2% 23.5% 17.6% 15.6%44 044 Madison 32.9% 20.5% 24.7% 13.7% 25.8% 16.1% 19.4% 11.3% 21.1% 14.0% 15.8% 8.8%45 045 Marion 54.9% 47.1% 27.5% 31.4% 54.0% 46.0% 26.0% 30.0% 52.1% 43.8% 27.1% 29.2%46 046 Miller 47.3% 27.2% 34.8% 22.3% 44.4% 25.7% 32.2% 19.9% 43.4% 24.7% 31.3% 18.7%47 047 Mississippi 51.7% 39.9% 29.7% 28.1% 50.4% 37.8% 29.4% 28.6% 48.0% 35.0% 28.3% 26.9%48 048 Monroe 52.6% 42.1% 31.6% 15.8% 52.6% 42.1% 31.6% 15.8% 51.4% 40.5% 32.4% 16.2%49 049 Montgomery 26.3% 23.7% 13.2% 10.5% 24.3% 21.6% 10.8% 8.1% 24.3% 21.6% 10.8% 8.1%50 050 Nevada 61.8% 34.5% 50.9% 38.2% 63.5% 34.6% 51.9% 38.5% 63.3% 36.7% 51.0% 38.8%51 051 Newton 52.6% 44.7% 42.1% 23.7% 45.5% 36.4% 39.4% 24.2% 43.8% 34.4% 37.5% 21.9%52 052 Ouachita 54.1% 35.9% 40.3% 35.4% 49.4% 32.9% 36.6% 30.5% 48.1% 30.5% 35.1% 28.6%53 053 Perry 38.2% 27.6% 19.7% 14.5% 32.8% 23.9% 19.4% 11.9% 33.3% 24.2% 19.7% 12.1%54 054 Phillips 55.5% 37.8% 36.1% 31.1% 54.4% 36.0% 36.8% 31.6% 54.5% 36.4% 37.3% 30.9%55 055 Pike 46.7% 33.3% 36.7% 15.0% 44.8% 32.8% 34.5% 13.8% 43.6% 32.7% 34.5% 12.7%56 056 Poinsett 51.0% 39.3% 37.2% 22.1% 47.3% 37.4% 33.6% 19.8% 45.5% 36.4% 32.2% 18.2%57 057 Polk 47.9% 36.1% 22.7% 15.1% 41.2% 28.4% 19.6% 11.8% 38.9% 26.3% 20.0% 12.6%58 058 Pope 42.1% 33.3% 23.5% 16.1% 36.6% 27.6% 20.5% 13.6% 35.1% 26.9% 19.0% 12.8%59 059 Prairie 61.9% 52.4% 42.9% 45.2% 59.5% 48.6% 40.5% 43.2% 58.3% 47.2% 38.9% 41.7%60 060 Pulaski 49.0% 39.5% 31.9% 24.7% 44.4% 34.9% 28.0% 22.2% 41.5% 32.5% 25.5% 20.0%61 061 Randolph 44.8% 29.9% 31.0% 24.1% 41.8% 26.6% 27.8% 21.5% 38.7% 24.0% 24.0% 20.0%62 062 Saline 32.8% 26.2% 18.2% 14.5% 29.3% 22.9% 16.1% 12.9% 26.3% 19.8% 14.2% 11.9%63 063 Scott 46.2% 34.6% 28.8% 23.1% 40.0% 31.1% 26.7% 17.8% 36.6% 26.8% 24.4% 14.6%64 064 Searcy 35.0% 30.0% 17.5% 10.0% 34.2% 28.9% 18.4% 10.5% 30.6% 25.0% 16.7% 11.1%65 065 Sebastian 35.0% 23.0% 21.6% 16.9% 29.2% 20.7% 17.2% 14.0% 27.4% 20.0% 16.4% 13.2%66 066 Sevier 39.6% 26.1% 28.8% 3.6% 35.3% 24.5% 24.5% 2.9% 35.1% 24.7% 24.7% 3.1%67 067 Sharp 42.7% 32.5% 23.1% 19.7% 36.0% 25.0% 19.0% 18.0% 33.0% 21.3% 17.0% 16.0%68 068 St Francis 71.9% 51.1% 50.4% 47.5% 70.9% 50.0% 49.3% 46.3% 70.1% 49.6% 49.6% 46.5%69 069 Stone 46.2% 43.1% 21.5% 12.3% 40.4% 36.8% 17.5% 10.5% 37.0% 33.3% 13.0% 9.3%70 070 Union 62.7% 45.1% 43.4% 34.6% 57.8% 40.6% 39.8% 30.7% 56.2% 39.1% 38.7% 29.8%71 071 Van Buren 34.9% 27.7% 21.7% 13.3% 33.3% 25.6% 23.1% 14.1% 32.0% 24.0% 24.0% 12.0%72 072 Washington 38.4% 26.8% 20.5% 17.3% 33.4% 21.7% 19.0% 16.8% 30.8% 19.8% 17.0% 15.5%73 073 White 44.2% 37.8% 23.9% 17.8% 40.2% 33.7% 22.3% 17.3% 38.6% 32.3% 21.8% 16.2%74 074 Woodruff 63.2% 36.8% 52.6% 36.8% 61.1% 33.3% 52.8% 36.1% 57.6% 30.3% 48.5% 33.3%75 075 Yell 44.7% 34.1% 26.8% 23.6% 41.3% 30.3% 23.9% 21.1% 39.6% 28.7% 23.8% 21.8%
Page 2 of 2 ADHE Prepared 12/8/2014

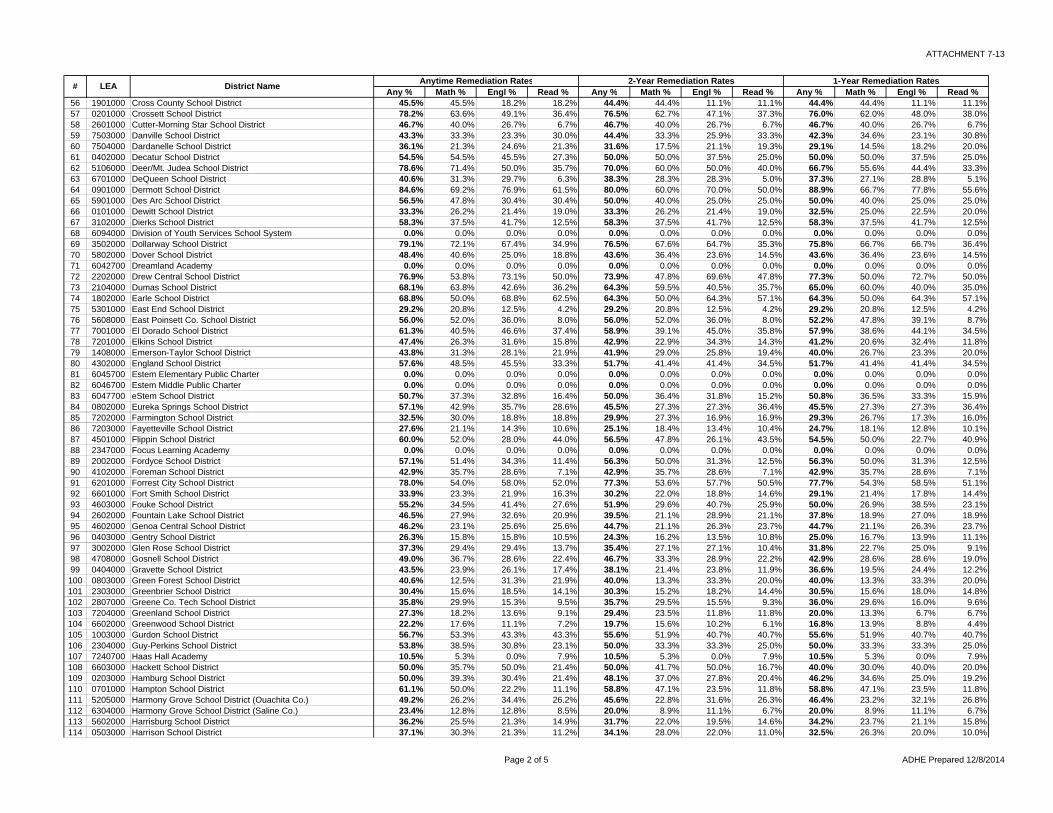
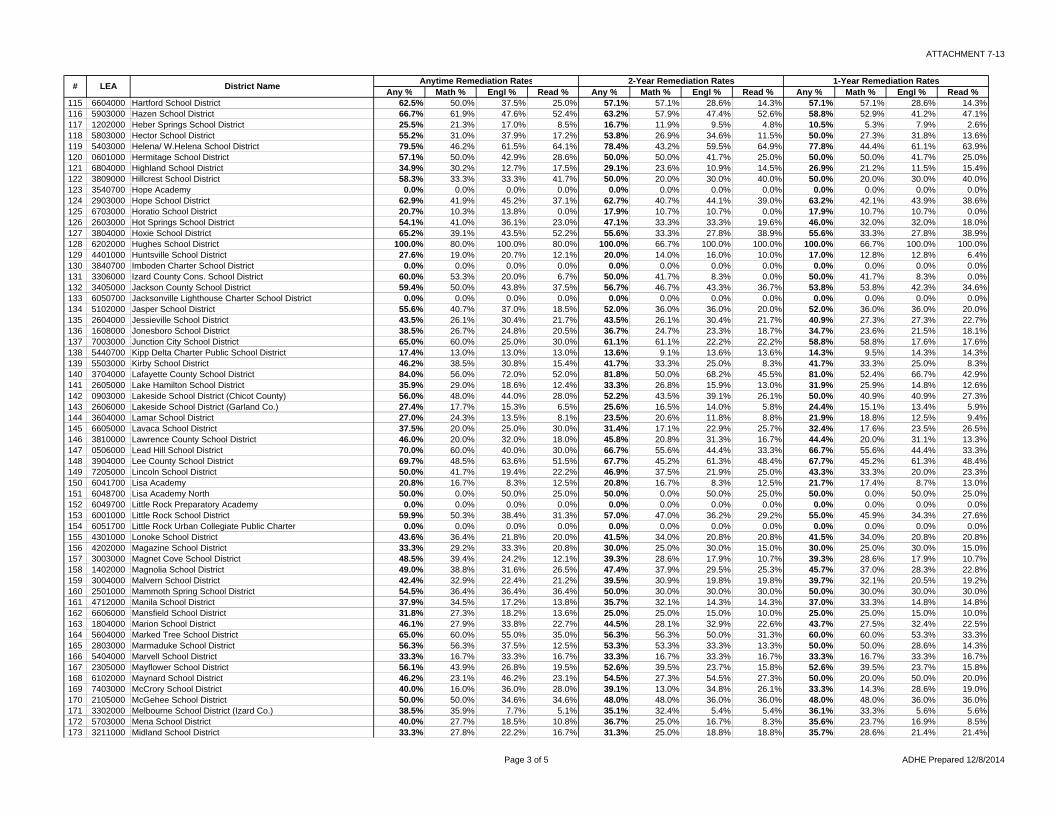
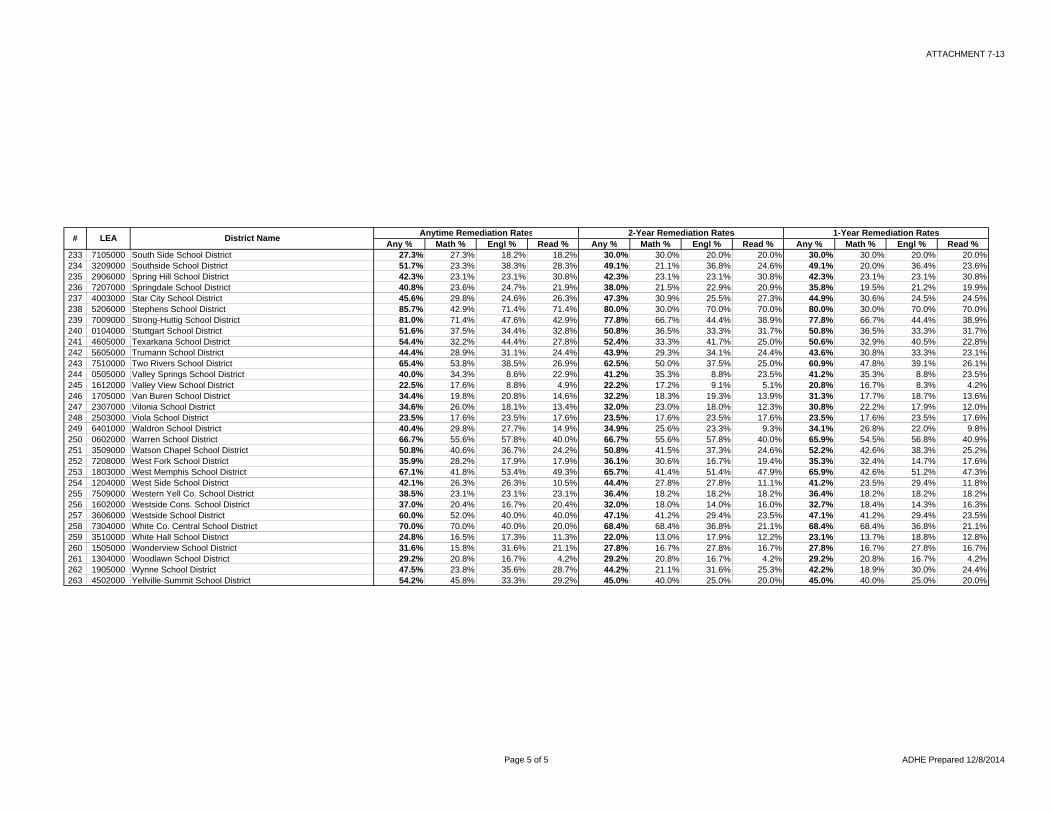
ATTACHMENT 7-13
Any % Math % Engl % Read % Any % Math % Engl % Read % Any % Math % Engl % Read %1 6040700 Academics Plus School District 56.3% 43.8% 18.8% 25.0% 56.3% 43.8% 18.8% 25.0% 56.3% 43.8% 18.8% 25.0%2 1701000 Alma School District 32.9% 24.2% 14.8% 12.1% 28.5% 21.2% 12.4% 12.4% 26.0% 19.8% 10.7% 10.7%3 0501000 Alpena School District 33.3% 20.0% 26.7% 6.7% 28.6% 14.3% 21.4% 0.0% 25.0% 16.7% 16.7% 0.0%4 2240700 Arise Charter 0.0% 0.0% 0.0% 0.0% 0.0% 0.0% 0.0% 0.0% 0.0% 0.0% 0.0% 0.0%5 1002000 Arkadelphia School District 38.1% 32.1% 26.2% 20.2% 37.0% 32.1% 27.2% 19.8% 34.6% 30.8% 24.4% 16.7%6 6091000 Arkansas School For Blind 0.0% 0.0% 0.0% 0.0% 0.0% 0.0% 0.0% 0.0% 0.0% 0.0% 0.0% 0.0%7 6092000 Arkansas School For Deaf 100.0% 66.7% 100.0% 66.7% 100.0% 100.0% 100.0% 100.0% 100.0% 100.0% 100.0% 100.0%8 8099000 Arkansas School Math & Sciences 0.0% 0.0% 0.0% 0.0% 0.0% 0.0% 0.0% 0.0% 0.0% 0.0% 0.0% 0.0%9 6043700 Arkansas Virtual Academy 0.0% 0.0% 0.0% 0.0% 0.0% 0.0% 0.0% 0.0% 0.0% 0.0% 0.0% 0.0%
10 4701000 Armorel School District 20.8% 20.8% 4.2% 4.2% 21.7% 21.7% 4.3% 4.3% 18.2% 18.2% 4.5% 4.5%11 4101000 Ashdown School District 52.8% 37.7% 45.3% 18.9% 47.9% 33.3% 39.6% 14.6% 47.9% 33.3% 39.6% 14.6%12 5801000 Atkins School District 45.7% 37.1% 37.1% 14.3% 42.4% 33.3% 33.3% 12.1% 38.7% 29.0% 32.3% 12.9%13 7401000 Augusta School District 76.9% 61.5% 69.2% 30.8% 76.9% 61.5% 69.2% 30.8% 75.0% 58.3% 66.7% 33.3%14 7301000 Bald Knob School District 46.7% 43.3% 23.3% 13.3% 40.0% 36.0% 28.0% 16.0% 40.0% 36.0% 28.0% 16.0%15 5401000 Barton-Lexa School District 73.3% 56.7% 50.0% 26.7% 73.3% 56.7% 50.0% 26.7% 73.3% 56.7% 50.0% 26.7%16 3201000 Batesville School District 36.7% 26.6% 24.8% 16.5% 32.4% 22.5% 21.6% 12.7% 31.3% 22.2% 21.2% 13.1%17 6301000 Bauxite School District 33.9% 22.0% 22.0% 15.3% 33.9% 22.0% 22.0% 15.3% 33.3% 21.1% 21.1% 15.8%18 1601000 Bay School District 47.4% 42.1% 31.6% 15.8% 37.5% 31.3% 31.3% 12.5% 33.3% 26.7% 26.7% 13.3%19 5201000 Bearden School District 50.0% 32.1% 35.7% 28.6% 50.0% 32.1% 35.7% 28.6% 50.0% 32.1% 35.7% 28.6%20 7302000 Beebe School District 51.8% 44.7% 31.8% 21.2% 49.4% 42.9% 31.2% 23.4% 45.7% 38.6% 30.0% 22.9%21 0440700 Benton County School of Arts 21.9% 15.6% 6.3% 6.3% 22.6% 16.1% 6.5% 6.5% 22.6% 16.1% 6.5% 6.5%22 6302000 Benton School District 22.1% 16.0% 8.6% 11.0% 19.4% 14.2% 7.7% 10.3% 19.0% 14.3% 6.8% 10.2%23 0401000 Bentonville School District 30.3% 19.9% 15.1% 12.9% 27.4% 16.8% 14.1% 12.6% 26.8% 17.0% 13.7% 12.2%24 0502000 Bergman School District 21.1% 21.1% 15.8% 15.8% 16.7% 16.7% 11.1% 11.1% 16.7% 16.7% 11.1% 11.1%25 0801000 Berryville School District 35.7% 25.0% 14.3% 14.3% 28.0% 16.0% 12.0% 12.0% 29.2% 16.7% 12.5% 12.5%26 3001000 Bismarck School District 23.1% 20.5% 10.3% 7.7% 23.1% 20.5% 10.3% 7.7% 19.4% 16.7% 8.3% 2.8%27 2901000 Blevins School District 76.2% 61.9% 42.9% 42.9% 76.2% 61.9% 42.9% 42.9% 76.2% 61.9% 42.9% 42.9%28 4702000 Blytheville School District 70.6% 51.5% 48.5% 38.2% 70.0% 51.7% 50.0% 40.0% 69.0% 50.0% 50.0% 39.7%29 4201000 Booneville School District 44.4% 35.2% 31.5% 18.5% 41.7% 33.3% 29.2% 14.6% 39.1% 30.4% 26.1% 15.2%30 7303000 Bradford School District 84.6% 76.9% 15.4% 23.1% 84.6% 76.9% 15.4% 23.1% 84.6% 76.9% 15.4% 23.1%31 4801000 Brinkley School District 58.3% 50.0% 41.7% 16.7% 58.3% 50.0% 41.7% 16.7% 54.5% 45.5% 45.5% 18.2%32 1603000 Brookland School District 49.1% 38.6% 21.1% 24.6% 48.1% 40.7% 18.5% 24.1% 47.2% 39.6% 18.9% 22.6%33 6303000 Bryant School District 31.1% 24.6% 15.3% 14.4% 30.2% 23.8% 14.8% 13.9% 28.6% 21.9% 13.7% 12.7%34 1605000 Buffalo Island Central School District 9.1% 9.1% 0.0% 0.0% 9.1% 9.1% 0.0% 0.0% 9.1% 9.1% 0.0% 0.0%35 4304000 Cabot School District 30.1% 23.3% 16.2% 14.2% 26.4% 20.1% 14.2% 13.2% 25.7% 19.1% 14.3% 12.9%36 4901000 Caddo Hills School District 22.7% 22.7% 18.2% 9.1% 22.7% 22.7% 18.2% 9.1% 15.8% 15.8% 15.8% 10.5%37 3301000 Calico Rock School District 45.5% 36.4% 27.3% 18.2% 25.0% 25.0% 12.5% 0.0% 25.0% 25.0% 12.5% 0.0%38 5204000 Camden Fairview School District 57.8% 47.8% 44.4% 38.9% 53.1% 43.2% 42.0% 35.8% 50.7% 40.0% 38.7% 32.0%39 4303000 Carlisle School District 33.3% 30.3% 15.2% 15.2% 32.3% 29.0% 12.9% 16.1% 33.3% 30.0% 13.3% 16.7%40 6802000 Cave City School District 39.6% 22.9% 22.9% 14.6% 36.4% 20.5% 22.7% 13.6% 36.4% 20.5% 22.7% 13.6%41 3212000 Cedar Ridge School District 72.4% 55.2% 37.9% 27.6% 69.2% 50.0% 34.6% 23.1% 68.0% 52.0% 32.0% 24.0%42 1702000 Cedarville School District 42.9% 28.6% 32.1% 21.4% 42.3% 30.8% 30.8% 19.2% 42.3% 30.8% 30.8% 19.2%43 5502000 Centerpoint School District 44.4% 30.6% 36.1% 19.4% 41.2% 29.4% 32.4% 20.6% 39.4% 30.3% 30.3% 18.2%44 2402000 Charleston School District 29.2% 18.8% 16.7% 12.5% 29.8% 19.1% 17.0% 12.8% 28.3% 17.4% 15.2% 13.0%45 4802000 Clarendon School District 60.0% 45.0% 40.0% 20.0% 57.9% 42.1% 36.8% 21.1% 57.9% 42.1% 36.8% 21.1%46 3601000 Clarksville School District 38.0% 29.6% 25.4% 23.9% 32.8% 23.0% 21.3% 21.3% 31.0% 20.7% 19.0% 20.7%47 1305000 Cleveland County School District 26.5% 20.6% 20.6% 11.8% 27.3% 21.2% 21.2% 12.1% 27.3% 21.2% 21.2% 12.1%48 7102000 Clinton School District 32.7% 21.2% 23.1% 13.5% 32.0% 20.0% 24.0% 14.0% 30.4% 17.4% 23.9% 10.9%49 1201000 Concord School District 47.4% 31.6% 42.1% 26.3% 50.0% 31.3% 43.8% 31.3% 50.0% 31.3% 43.8% 31.3%50 2301000 Conway School District 32.0% 21.3% 21.1% 12.9% 29.6% 19.6% 19.3% 12.1% 28.1% 18.8% 18.4% 11.6%51 1101000 Corning School District 46.2% 33.3% 20.5% 25.6% 44.1% 32.4% 14.7% 26.5% 43.8% 31.3% 15.6% 28.1%52 5707000 Cossatot River School District 47.1% 29.4% 26.5% 14.7% 50.0% 30.0% 30.0% 16.7% 51.7% 31.0% 31.0% 17.2%53 0302000 Cotter School District 58.8% 52.9% 35.3% 23.5% 56.3% 50.0% 37.5% 25.0% 56.3% 50.0% 37.5% 25.0%54 2403000 County Line School District 35.3% 23.5% 29.4% 17.6% 31.3% 18.8% 31.3% 18.8% 31.3% 18.8% 31.3% 18.8%55 6044700 Covenant Keepers Charter School 0.0% 0.0% 0.0% 0.0% 0.0% 0.0% 0.0% 0.0% 0.0% 0.0% 0.0% 0.0%
1-Year Remediation Rates
Remediation Rates by High School District
AY2015, Term 1 (2014 Fall)2-Year Remediation RatesAnytime Remediation Rates
# LEA District Name
Page 1 of 5 ADHE Prepared 12/8/2014
ATTACHMENT 7-13
Any % Math % Engl % Read % Any % Math % Engl % Read % Any % Math % Engl % Read %1-Year Remediation Rates2-Year Remediation RatesAnytime Remediation Rates
# LEA District Name
56 1901000 Cross County School District 45.5% 45.5% 18.2% 18.2% 44.4% 44.4% 11.1% 11.1% 44.4% 44.4% 11.1% 11.1%57 0201000 Crossett School District 78.2% 63.6% 49.1% 36.4% 76.5% 62.7% 47.1% 37.3% 76.0% 62.0% 48.0% 38.0%58 2601000 Cutter-Morning Star School District 46.7% 40.0% 26.7% 6.7% 46.7% 40.0% 26.7% 6.7% 46.7% 40.0% 26.7% 6.7%59 7503000 Danville School District 43.3% 33.3% 23.3% 30.0% 44.4% 33.3% 25.9% 33.3% 42.3% 34.6% 23.1% 30.8%60 7504000 Dardanelle School District 36.1% 21.3% 24.6% 21.3% 31.6% 17.5% 21.1% 19.3% 29.1% 14.5% 18.2% 20.0%61 0402000 Decatur School District 54.5% 54.5% 45.5% 27.3% 50.0% 50.0% 37.5% 25.0% 50.0% 50.0% 37.5% 25.0%62 5106000 Deer/Mt. Judea School District 78.6% 71.4% 50.0% 35.7% 70.0% 60.0% 50.0% 40.0% 66.7% 55.6% 44.4% 33.3%63 6701000 DeQueen School District 40.6% 31.3% 29.7% 6.3% 38.3% 28.3% 28.3% 5.0% 37.3% 27.1% 28.8% 5.1%64 0901000 Dermott School District 84.6% 69.2% 76.9% 61.5% 80.0% 60.0% 70.0% 50.0% 88.9% 66.7% 77.8% 55.6%65 5901000 Des Arc School District 56.5% 47.8% 30.4% 30.4% 50.0% 40.0% 25.0% 25.0% 50.0% 40.0% 25.0% 25.0%66 0101000 Dewitt School District 33.3% 26.2% 21.4% 19.0% 33.3% 26.2% 21.4% 19.0% 32.5% 25.0% 22.5% 20.0%67 3102000 Dierks School District 58.3% 37.5% 41.7% 12.5% 58.3% 37.5% 41.7% 12.5% 58.3% 37.5% 41.7% 12.5%68 6094000 Division of Youth Services School System 0.0% 0.0% 0.0% 0.0% 0.0% 0.0% 0.0% 0.0% 0.0% 0.0% 0.0% 0.0%69 3502000 Dollarway School District 79.1% 72.1% 67.4% 34.9% 76.5% 67.6% 64.7% 35.3% 75.8% 66.7% 66.7% 36.4%70 5802000 Dover School District 48.4% 40.6% 25.0% 18.8% 43.6% 36.4% 23.6% 14.5% 43.6% 36.4% 23.6% 14.5%71 6042700 Dreamland Academy 0.0% 0.0% 0.0% 0.0% 0.0% 0.0% 0.0% 0.0% 0.0% 0.0% 0.0% 0.0%72 2202000 Drew Central School District 76.9% 53.8% 73.1% 50.0% 73.9% 47.8% 69.6% 47.8% 77.3% 50.0% 72.7% 50.0%73 2104000 Dumas School District 68.1% 63.8% 42.6% 36.2% 64.3% 59.5% 40.5% 35.7% 65.0% 60.0% 40.0% 35.0%74 1802000 Earle School District 68.8% 50.0% 68.8% 62.5% 64.3% 50.0% 64.3% 57.1% 64.3% 50.0% 64.3% 57.1%75 5301000 East End School District 29.2% 20.8% 12.5% 4.2% 29.2% 20.8% 12.5% 4.2% 29.2% 20.8% 12.5% 4.2%76 5608000 East Poinsett Co. School District 56.0% 52.0% 36.0% 8.0% 56.0% 52.0% 36.0% 8.0% 52.2% 47.8% 39.1% 8.7%77 7001000 El Dorado School District 61.3% 40.5% 46.6% 37.4% 58.9% 39.1% 45.0% 35.8% 57.9% 38.6% 44.1% 34.5%78 7201000 Elkins School District 47.4% 26.3% 31.6% 15.8% 42.9% 22.9% 34.3% 14.3% 41.2% 20.6% 32.4% 11.8%79 1408000 Emerson-Taylor School District 43.8% 31.3% 28.1% 21.9% 41.9% 29.0% 25.8% 19.4% 40.0% 26.7% 23.3% 20.0%80 4302000 England School District 57.6% 48.5% 45.5% 33.3% 51.7% 41.4% 41.4% 34.5% 51.7% 41.4% 41.4% 34.5%81 6045700 Estem Elementary Public Charter 0.0% 0.0% 0.0% 0.0% 0.0% 0.0% 0.0% 0.0% 0.0% 0.0% 0.0% 0.0%82 6046700 Estem Middle Public Charter 0.0% 0.0% 0.0% 0.0% 0.0% 0.0% 0.0% 0.0% 0.0% 0.0% 0.0% 0.0%83 6047700 eStem School District 50.7% 37.3% 32.8% 16.4% 50.0% 36.4% 31.8% 15.2% 50.8% 36.5% 33.3% 15.9%84 0802000 Eureka Springs School District 57.1% 42.9% 35.7% 28.6% 45.5% 27.3% 27.3% 36.4% 45.5% 27.3% 27.3% 36.4%85 7202000 Farmington School District 32.5% 30.0% 18.8% 18.8% 29.9% 27.3% 16.9% 16.9% 29.3% 26.7% 17.3% 16.0%86 7203000 Fayetteville School District 27.6% 21.1% 14.3% 10.6% 25.1% 18.4% 13.4% 10.4% 24.7% 18.1% 12.8% 10.1%87 4501000 Flippin School District 60.0% 52.0% 28.0% 44.0% 56.5% 47.8% 26.1% 43.5% 54.5% 50.0% 22.7% 40.9%88 2347000 Focus Learning Academy 0.0% 0.0% 0.0% 0.0% 0.0% 0.0% 0.0% 0.0% 0.0% 0.0% 0.0% 0.0%89 2002000 Fordyce School District 57.1% 51.4% 34.3% 11.4% 56.3% 50.0% 31.3% 12.5% 56.3% 50.0% 31.3% 12.5%90 4102000 Foreman School District 42.9% 35.7% 28.6% 7.1% 42.9% 35.7% 28.6% 7.1% 42.9% 35.7% 28.6% 7.1%91 6201000 Forrest City School District 78.0% 54.0% 58.0% 52.0% 77.3% 53.6% 57.7% 50.5% 77.7% 54.3% 58.5% 51.1%92 6601000 Fort Smith School District 33.9% 23.3% 21.9% 16.3% 30.2% 22.0% 18.8% 14.6% 29.1% 21.4% 17.8% 14.4%93 4603000 Fouke School District 55.2% 34.5% 41.4% 27.6% 51.9% 29.6% 40.7% 25.9% 50.0% 26.9% 38.5% 23.1%94 2602000 Fountain Lake School District 46.5% 27.9% 32.6% 20.9% 39.5% 21.1% 28.9% 21.1% 37.8% 18.9% 27.0% 18.9%95 4602000 Genoa Central School District 46.2% 23.1% 25.6% 25.6% 44.7% 21.1% 26.3% 23.7% 44.7% 21.1% 26.3% 23.7%96 0403000 Gentry School District 26.3% 15.8% 15.8% 10.5% 24.3% 16.2% 13.5% 10.8% 25.0% 16.7% 13.9% 11.1%97 3002000 Glen Rose School District 37.3% 29.4% 29.4% 13.7% 35.4% 27.1% 27.1% 10.4% 31.8% 22.7% 25.0% 9.1%98 4708000 Gosnell School District 49.0% 36.7% 28.6% 22.4% 46.7% 33.3% 28.9% 22.2% 42.9% 28.6% 28.6% 19.0%99 0404000 Gravette School District 43.5% 23.9% 26.1% 17.4% 38.1% 21.4% 23.8% 11.9% 36.6% 19.5% 24.4% 12.2%100 0803000 Green Forest School District 40.6% 12.5% 31.3% 21.9% 40.0% 13.3% 33.3% 20.0% 40.0% 13.3% 33.3% 20.0%101 2303000 Greenbrier School District 30.4% 15.6% 18.5% 14.1% 30.3% 15.2% 18.2% 14.4% 30.5% 15.6% 18.0% 14.8%102 2807000 Greene Co. Tech School District 35.8% 29.9% 15.3% 9.5% 35.7% 29.5% 15.5% 9.3% 36.0% 29.6% 16.0% 9.6%103 7204000 Greenland School District 27.3% 18.2% 13.6% 9.1% 29.4% 23.5% 11.8% 11.8% 20.0% 13.3% 6.7% 6.7%104 6602000 Greenwood School District 22.2% 17.6% 11.1% 7.2% 19.7% 15.6% 10.2% 6.1% 16.8% 13.9% 8.8% 4.4%105 1003000 Gurdon School District 56.7% 53.3% 43.3% 43.3% 55.6% 51.9% 40.7% 40.7% 55.6% 51.9% 40.7% 40.7%106 2304000 Guy-Perkins School District 53.8% 38.5% 30.8% 23.1% 50.0% 33.3% 33.3% 25.0% 50.0% 33.3% 33.3% 25.0%107 7240700 Haas Hall Academy 10.5% 5.3% 0.0% 7.9% 10.5% 5.3% 0.0% 7.9% 10.5% 5.3% 0.0% 7.9%108 6603000 Hackett School District 50.0% 35.7% 50.0% 21.4% 50.0% 41.7% 50.0% 16.7% 40.0% 30.0% 40.0% 20.0%109 0203000 Hamburg School District 50.0% 39.3% 30.4% 21.4% 48.1% 37.0% 27.8% 20.4% 46.2% 34.6% 25.0% 19.2%110 0701000 Hampton School District 61.1% 50.0% 22.2% 11.1% 58.8% 47.1% 23.5% 11.8% 58.8% 47.1% 23.5% 11.8%111 5205000 Harmony Grove School District (Ouachita Co.) 49.2% 26.2% 34.4% 26.2% 45.6% 22.8% 31.6% 26.3% 46.4% 23.2% 32.1% 26.8%112 6304000 Harmony Grove School District (Saline Co.) 23.4% 12.8% 12.8% 8.5% 20.0% 8.9% 11.1% 6.7% 20.0% 8.9% 11.1% 6.7%113 5602000 Harrisburg School District 36.2% 25.5% 21.3% 14.9% 31.7% 22.0% 19.5% 14.6% 34.2% 23.7% 21.1% 15.8%114 0503000 Harrison School District 37.1% 30.3% 21.3% 11.2% 34.1% 28.0% 22.0% 11.0% 32.5% 26.3% 20.0% 10.0%
Page 2 of 5 ADHE Prepared 12/8/2014
ATTACHMENT 7-13
Any % Math % Engl % Read % Any % Math % Engl % Read % Any % Math % Engl % Read %1-Year Remediation Rates2-Year Remediation RatesAnytime Remediation Rates
# LEA District Name
115 6604000 Hartford School District 62.5% 50.0% 37.5% 25.0% 57.1% 57.1% 28.6% 14.3% 57.1% 57.1% 28.6% 14.3%116 5903000 Hazen School District 66.7% 61.9% 47.6% 52.4% 63.2% 57.9% 47.4% 52.6% 58.8% 52.9% 41.2% 47.1%117 1202000 Heber Springs School District 25.5% 21.3% 17.0% 8.5% 16.7% 11.9% 9.5% 4.8% 10.5% 5.3% 7.9% 2.6%118 5803000 Hector School District 55.2% 31.0% 37.9% 17.2% 53.8% 26.9% 34.6% 11.5% 50.0% 27.3% 31.8% 13.6%119 5403000 Helena/ W.Helena School District 79.5% 46.2% 61.5% 64.1% 78.4% 43.2% 59.5% 64.9% 77.8% 44.4% 61.1% 63.9%120 0601000 Hermitage School District 57.1% 50.0% 42.9% 28.6% 50.0% 50.0% 41.7% 25.0% 50.0% 50.0% 41.7% 25.0%121 6804000 Highland School District 34.9% 30.2% 12.7% 17.5% 29.1% 23.6% 10.9% 14.5% 26.9% 21.2% 11.5% 15.4%122 3809000 Hillcrest School District 58.3% 33.3% 33.3% 41.7% 50.0% 20.0% 30.0% 40.0% 50.0% 20.0% 30.0% 40.0%123 3540700 Hope Academy 0.0% 0.0% 0.0% 0.0% 0.0% 0.0% 0.0% 0.0% 0.0% 0.0% 0.0% 0.0%124 2903000 Hope School District 62.9% 41.9% 45.2% 37.1% 62.7% 40.7% 44.1% 39.0% 63.2% 42.1% 43.9% 38.6%125 6703000 Horatio School District 20.7% 10.3% 13.8% 0.0% 17.9% 10.7% 10.7% 0.0% 17.9% 10.7% 10.7% 0.0%126 2603000 Hot Springs School District 54.1% 41.0% 36.1% 23.0% 47.1% 33.3% 33.3% 19.6% 46.0% 32.0% 32.0% 18.0%127 3804000 Hoxie School District 65.2% 39.1% 43.5% 52.2% 55.6% 33.3% 27.8% 38.9% 55.6% 33.3% 27.8% 38.9%128 6202000 Hughes School District 100.0% 80.0% 100.0% 80.0% 100.0% 66.7% 100.0% 100.0% 100.0% 66.7% 100.0% 100.0%129 4401000 Huntsville School District 27.6% 19.0% 20.7% 12.1% 20.0% 14.0% 16.0% 10.0% 17.0% 12.8% 12.8% 6.4%130 3840700 Imboden Charter School District 0.0% 0.0% 0.0% 0.0% 0.0% 0.0% 0.0% 0.0% 0.0% 0.0% 0.0% 0.0%131 3306000 Izard County Cons. School District 60.0% 53.3% 20.0% 6.7% 50.0% 41.7% 8.3% 0.0% 50.0% 41.7% 8.3% 0.0%132 3405000 Jackson County School District 59.4% 50.0% 43.8% 37.5% 56.7% 46.7% 43.3% 36.7% 53.8% 53.8% 42.3% 34.6%133 6050700 Jacksonville Lighthouse Charter School District 0.0% 0.0% 0.0% 0.0% 0.0% 0.0% 0.0% 0.0% 0.0% 0.0% 0.0% 0.0%134 5102000 Jasper School District 55.6% 40.7% 37.0% 18.5% 52.0% 36.0% 36.0% 20.0% 52.0% 36.0% 36.0% 20.0%135 2604000 Jessieville School District 43.5% 26.1% 30.4% 21.7% 43.5% 26.1% 30.4% 21.7% 40.9% 27.3% 27.3% 22.7%136 1608000 Jonesboro School District 38.5% 26.7% 24.8% 20.5% 36.7% 24.7% 23.3% 18.7% 34.7% 23.6% 21.5% 18.1%137 7003000 Junction City School District 65.0% 60.0% 25.0% 30.0% 61.1% 61.1% 22.2% 22.2% 58.8% 58.8% 17.6% 17.6%138 5440700 Kipp Delta Charter Public School District 17.4% 13.0% 13.0% 13.0% 13.6% 9.1% 13.6% 13.6% 14.3% 9.5% 14.3% 14.3%139 5503000 Kirby School District 46.2% 38.5% 30.8% 15.4% 41.7% 33.3% 25.0% 8.3% 41.7% 33.3% 25.0% 8.3%140 3704000 Lafayette County School District 84.0% 56.0% 72.0% 52.0% 81.8% 50.0% 68.2% 45.5% 81.0% 52.4% 66.7% 42.9%141 2605000 Lake Hamilton School District 35.9% 29.0% 18.6% 12.4% 33.3% 26.8% 15.9% 13.0% 31.9% 25.9% 14.8% 12.6%142 0903000 Lakeside School District (Chicot County) 56.0% 48.0% 44.0% 28.0% 52.2% 43.5% 39.1% 26.1% 50.0% 40.9% 40.9% 27.3%143 2606000 Lakeside School District (Garland Co.) 27.4% 17.7% 15.3% 6.5% 25.6% 16.5% 14.0% 5.8% 24.4% 15.1% 13.4% 5.9%144 3604000 Lamar School District 27.0% 24.3% 13.5% 8.1% 23.5% 20.6% 11.8% 8.8% 21.9% 18.8% 12.5% 9.4%145 6605000 Lavaca School District 37.5% 20.0% 25.0% 30.0% 31.4% 17.1% 22.9% 25.7% 32.4% 17.6% 23.5% 26.5%146 3810000 Lawrence County School District 46.0% 20.0% 32.0% 18.0% 45.8% 20.8% 31.3% 16.7% 44.4% 20.0% 31.1% 13.3%147 0506000 Lead Hill School District 70.0% 60.0% 40.0% 30.0% 66.7% 55.6% 44.4% 33.3% 66.7% 55.6% 44.4% 33.3%148 3904000 Lee County School District 69.7% 48.5% 63.6% 51.5% 67.7% 45.2% 61.3% 48.4% 67.7% 45.2% 61.3% 48.4%149 7205000 Lincoln School District 50.0% 41.7% 19.4% 22.2% 46.9% 37.5% 21.9% 25.0% 43.3% 33.3% 20.0% 23.3%150 6041700 Lisa Academy 20.8% 16.7% 8.3% 12.5% 20.8% 16.7% 8.3% 12.5% 21.7% 17.4% 8.7% 13.0%151 6048700 Lisa Academy North 50.0% 0.0% 50.0% 25.0% 50.0% 0.0% 50.0% 25.0% 50.0% 0.0% 50.0% 25.0%152 6049700 Little Rock Preparatory Academy 0.0% 0.0% 0.0% 0.0% 0.0% 0.0% 0.0% 0.0% 0.0% 0.0% 0.0% 0.0%153 6001000 Little Rock School District 59.9% 50.3% 38.4% 31.3% 57.0% 47.0% 36.2% 29.2% 55.0% 45.9% 34.3% 27.6%154 6051700 Little Rock Urban Collegiate Public Charter 0.0% 0.0% 0.0% 0.0% 0.0% 0.0% 0.0% 0.0% 0.0% 0.0% 0.0% 0.0%155 4301000 Lonoke School District 43.6% 36.4% 21.8% 20.0% 41.5% 34.0% 20.8% 20.8% 41.5% 34.0% 20.8% 20.8%156 4202000 Magazine School District 33.3% 29.2% 33.3% 20.8% 30.0% 25.0% 30.0% 15.0% 30.0% 25.0% 30.0% 15.0%157 3003000 Magnet Cove School District 48.5% 39.4% 24.2% 12.1% 39.3% 28.6% 17.9% 10.7% 39.3% 28.6% 17.9% 10.7%158 1402000 Magnolia School District 49.0% 38.8% 31.6% 26.5% 47.4% 37.9% 29.5% 25.3% 45.7% 37.0% 28.3% 22.8%159 3004000 Malvern School District 42.4% 32.9% 22.4% 21.2% 39.5% 30.9% 19.8% 19.8% 39.7% 32.1% 20.5% 19.2%160 2501000 Mammoth Spring School District 54.5% 36.4% 36.4% 36.4% 50.0% 30.0% 30.0% 30.0% 50.0% 30.0% 30.0% 30.0%161 4712000 Manila School District 37.9% 34.5% 17.2% 13.8% 35.7% 32.1% 14.3% 14.3% 37.0% 33.3% 14.8% 14.8%162 6606000 Mansfield School District 31.8% 27.3% 18.2% 13.6% 25.0% 25.0% 15.0% 10.0% 25.0% 25.0% 15.0% 10.0%163 1804000 Marion School District 46.1% 27.9% 33.8% 22.7% 44.5% 28.1% 32.9% 22.6% 43.7% 27.5% 32.4% 22.5%164 5604000 Marked Tree School District 65.0% 60.0% 55.0% 35.0% 56.3% 56.3% 50.0% 31.3% 60.0% 60.0% 53.3% 33.3%165 2803000 Marmaduke School District 56.3% 56.3% 37.5% 12.5% 53.3% 53.3% 33.3% 13.3% 50.0% 50.0% 28.6% 14.3%166 5404000 Marvell School District 33.3% 16.7% 33.3% 16.7% 33.3% 16.7% 33.3% 16.7% 33.3% 16.7% 33.3% 16.7%167 2305000 Mayflower School District 56.1% 43.9% 26.8% 19.5% 52.6% 39.5% 23.7% 15.8% 52.6% 39.5% 23.7% 15.8%168 6102000 Maynard School District 46.2% 23.1% 46.2% 23.1% 54.5% 27.3% 54.5% 27.3% 50.0% 20.0% 50.0% 20.0%169 7403000 McCrory School District 40.0% 16.0% 36.0% 28.0% 39.1% 13.0% 34.8% 26.1% 33.3% 14.3% 28.6% 19.0%170 2105000 McGehee School District 50.0% 50.0% 34.6% 34.6% 48.0% 48.0% 36.0% 36.0% 48.0% 48.0% 36.0% 36.0%171 3302000 Melbourne School District (Izard Co.) 38.5% 35.9% 7.7% 5.1% 35.1% 32.4% 5.4% 5.4% 36.1% 33.3% 5.6% 5.6%172 5703000 Mena School District 40.0% 27.7% 18.5% 10.8% 36.7% 25.0% 16.7% 8.3% 35.6% 23.7% 16.9% 8.5%173 3211000 Midland School District 33.3% 27.8% 22.2% 16.7% 31.3% 25.0% 18.8% 18.8% 35.7% 28.6% 21.4% 21.4%
Page 3 of 5 ADHE Prepared 12/8/2014

ATTACHMENT 7-13
Any % Math % Engl % Read % Any % Math % Engl % Read % Any % Math % Engl % Read %1-Year Remediation Rates2-Year Remediation RatesAnytime Remediation Rates
# LEA District Name
174 3104000 Mineral Springs School District 88.9% 55.6% 77.8% 55.6% 85.7% 57.1% 71.4% 42.9% 83.3% 66.7% 66.7% 33.3%175 2203000 Monticello School District 41.5% 36.9% 32.3% 30.8% 38.3% 33.3% 30.0% 28.3% 35.1% 29.8% 26.3% 24.6%176 4902000 Mount Ida School District 26.7% 20.0% 13.3% 13.3% 26.7% 20.0% 13.3% 13.3% 26.7% 20.0% 13.3% 13.3%177 0303000 Mountain Home School District 32.3% 26.9% 18.5% 13.1% 29.1% 23.1% 14.5% 10.3% 27.4% 21.2% 13.3% 9.7%178 2607000 Mountain Pine School District 33.3% 8.3% 25.0% 0.0% 25.0% 12.5% 12.5% 0.0% 28.6% 14.3% 14.3% 0.0%179 6901000 Mountain View School District 38.6% 36.8% 12.3% 10.5% 34.6% 32.7% 11.5% 9.6% 34.6% 32.7% 11.5% 9.6%180 1703000 Mountainburg School District 15.4% 15.4% 7.7% 3.8% 12.0% 12.0% 4.0% 4.0% 12.0% 12.0% 4.0% 4.0%181 2306000 Mt. Vernon/Enola School District 27.8% 11.1% 16.7% 11.1% 18.8% 0.0% 12.5% 12.5% 18.8% 0.0% 12.5% 12.5%182 1704000 Mulberry/Pleasant View Bi-County School District 42.9% 28.6% 42.9% 42.9% 33.3% 16.7% 33.3% 33.3% 33.3% 16.7% 33.3% 33.3%183 3105000 Nashville School District 33.8% 25.4% 22.5% 9.9% 33.3% 24.6% 23.2% 10.1% 33.3% 24.6% 23.2% 10.1%184 1503000 Nemo Vista School District 55.6% 44.4% 16.7% 16.7% 55.6% 44.4% 16.7% 16.7% 55.6% 44.4% 16.7% 16.7%185 1611000 Nettleton School District 41.0% 31.1% 23.8% 18.9% 39.1% 29.6% 22.6% 18.3% 39.5% 29.8% 22.8% 18.4%186 5008000 Nevada School District 66.7% 46.7% 53.3% 40.0% 69.2% 53.8% 53.8% 38.5% 69.2% 53.8% 53.8% 38.5%187 3403000 Newport School District 48.9% 33.3% 37.8% 28.9% 47.7% 34.1% 36.4% 27.3% 45.2% 33.3% 35.7% 28.6%188 0304000 Norfork School District 40.0% 20.0% 30.0% 10.0% 40.0% 20.0% 30.0% 10.0% 44.4% 22.2% 33.3% 11.1%189 6002000 North Little Rock School District 40.3% 26.8% 28.5% 19.5% 38.1% 24.6% 26.7% 17.8% 33.9% 21.3% 23.2% 14.2%190 0441700 Northwest Arkansas Academy of Fine Arts 0.0% 0.0% 0.0% 0.0% 0.0% 0.0% 0.0% 0.0% 0.0% 0.0% 0.0% 0.0%191 0504000 Omaha School District 44.4% 33.3% 11.1% 22.2% 44.4% 33.3% 11.1% 22.2% 44.4% 33.3% 11.1% 22.2%192 4740700 Osceola (OCABS) Comm Arts-Business Charter School 0.0% 0.0% 0.0% 0.0% 0.0% 0.0% 0.0% 0.0% 0.0% 0.0% 0.0% 0.0%193 4713000 Osceola School District 62.2% 43.2% 40.5% 37.8% 60.0% 40.0% 37.1% 34.3% 59.4% 37.5% 37.5% 31.3%194 5706000 Ouachita River School District 30.8% 30.8% 15.4% 15.4% 30.8% 30.8% 15.4% 15.4% 30.8% 30.8% 15.4% 15.4%195 3005000 Ouachita School District 30.0% 25.0% 20.0% 20.0% 26.3% 21.1% 21.1% 15.8% 26.3% 21.1% 21.1% 15.8%196 6505000 Ozark Mountain School District 73.3% 66.7% 33.3% 13.3% 69.2% 61.5% 30.8% 7.7% 66.7% 58.3% 33.3% 8.3%197 2404000 Ozark School District 44.4% 33.3% 33.3% 20.6% 41.8% 29.1% 32.7% 18.2% 41.5% 30.2% 32.1% 18.9%198 6205000 Palestine-Wheatley School District 40.0% 40.0% 6.7% 6.7% 40.0% 40.0% 6.7% 6.7% 40.0% 40.0% 6.7% 6.7%199 7309000 Pangburn School District 47.8% 39.1% 17.4% 21.7% 42.9% 33.3% 9.5% 19.0% 40.0% 30.0% 5.0% 15.0%200 2808000 Paragould School District 29.9% 18.4% 12.6% 12.6% 29.3% 18.3% 11.0% 12.2% 29.1% 19.0% 10.1% 12.7%201 4203000 Paris School District 38.0% 28.0% 22.0% 24.0% 37.8% 26.7% 22.2% 24.4% 37.2% 25.6% 23.3% 23.3%202 7007000 Parkers Chapel School District 42.9% 28.6% 28.6% 21.4% 33.3% 25.0% 16.7% 8.3% 27.3% 18.2% 18.2% 9.1%203 0407000 Pea Ridge School District 32.8% 20.9% 16.4% 16.4% 24.6% 14.0% 10.5% 12.3% 25.0% 14.3% 10.7% 12.5%204 5303000 Perryville School District 51.1% 36.2% 29.8% 21.3% 47.6% 33.3% 28.6% 19.0% 48.8% 34.1% 29.3% 19.5%205 1104000 Piggott School District 23.8% 14.3% 14.3% 4.8% 25.0% 15.0% 15.0% 5.0% 21.1% 10.5% 10.5% 5.3%206 3505000 Pine Bluff School District 63.7% 47.9% 43.2% 25.3% 63.1% 46.2% 43.8% 26.2% 63.5% 46.8% 43.7% 27.0%207 6103000 Pocahontas School District 39.0% 28.8% 25.4% 23.7% 30.8% 21.2% 15.4% 17.3% 30.8% 21.2% 15.4% 17.3%208 5804000 Pottsville School District 37.7% 26.1% 18.8% 14.5% 36.9% 26.2% 18.5% 15.4% 36.5% 25.4% 19.0% 15.9%209 2703000 Poyen School District 16.7% 11.1% 11.1% 11.1% 11.8% 5.9% 5.9% 11.8% 12.5% 6.3% 6.3% 12.5%210 7206000 Prairie Grove School District 26.9% 16.4% 14.9% 10.4% 20.0% 10.0% 11.7% 6.7% 17.2% 8.6% 10.3% 6.9%211 5006000 Prescott School District 54.5% 27.3% 45.5% 27.3% 55.8% 27.9% 46.5% 27.9% 53.7% 29.3% 43.9% 26.8%212 6003000 Pulaski County Special School District 54.6% 42.3% 37.6% 29.5% 49.9% 36.9% 32.9% 26.7% 48.3% 35.7% 30.8% 25.1%213 1203000 Quitman School District 38.5% 30.8% 11.5% 3.8% 41.7% 33.3% 12.5% 4.2% 42.9% 38.1% 9.5% 4.8%214 1106000 Rector School District 33.3% 28.6% 14.3% 9.5% 26.3% 21.1% 10.5% 10.5% 26.3% 21.1% 10.5% 10.5%215 1613000 Riverside School District 42.4% 30.3% 24.2% 9.1% 40.0% 26.7% 26.7% 10.0% 40.0% 26.7% 26.7% 10.0%216 7307000 Riverview School District 41.9% 35.5% 29.0% 16.1% 40.0% 32.0% 28.0% 12.0% 37.5% 33.3% 25.0% 12.5%217 0405000 Rogers School District 38.9% 27.3% 25.0% 18.7% 36.4% 25.3% 24.0% 18.3% 34.6% 24.0% 22.6% 16.9%218 7310000 Rose Bud School District 35.7% 21.4% 25.0% 14.3% 37.0% 22.2% 25.9% 14.8% 34.6% 19.2% 23.1% 11.5%219 5805000 Russellville School District 35.3% 28.4% 18.1% 13.7% 31.8% 24.5% 16.7% 13.0% 30.3% 24.3% 15.7% 11.9%220 2502000 Salem School District 32.1% 17.9% 17.9% 7.1% 26.9% 11.5% 19.2% 7.7% 26.9% 11.5% 19.2% 7.7%221 0140700 School of Excellence Charter 0.0% 0.0% 0.0% 0.0% 0.0% 0.0% 0.0% 0.0% 0.0% 0.0% 0.0% 0.0%222 4204000 Scranton School District 48.1% 29.6% 33.3% 25.9% 46.2% 26.9% 30.8% 23.1% 41.7% 29.2% 25.0% 16.7%223 6502000 Searcy County School District 35.5% 29.0% 16.1% 12.9% 32.1% 25.0% 17.9% 14.3% 32.1% 25.0% 17.9% 14.3%224 7311000 Searcy School District 26.7% 18.8% 13.9% 12.9% 24.7% 17.5% 12.4% 12.4% 21.7% 16.3% 10.9% 8.7%225 2705000 Sheridan School District 28.1% 17.0% 18.5% 15.6% 24.8% 14.0% 19.0% 14.0% 23.5% 12.2% 18.3% 12.2%226 7104000 Shirley School District 46.7% 40.0% 33.3% 26.7% 46.7% 40.0% 33.3% 26.7% 46.7% 40.0% 33.3% 26.7%227 0406000 Siloam Springs School District 42.1% 26.3% 26.3% 24.6% 37.8% 20.4% 24.5% 22.4% 37.8% 20.4% 24.5% 22.4%228 3806000 Sloan-Hendrix School District 50.0% 16.7% 27.8% 16.7% 50.0% 16.7% 27.8% 16.7% 50.0% 16.7% 27.8% 16.7%229 7008000 Smackover School District 46.3% 34.1% 29.3% 22.0% 36.4% 24.2% 18.2% 15.2% 36.4% 24.2% 18.2% 15.2%230 1507000 South Conway Co. School District 51.4% 41.7% 31.9% 31.9% 48.5% 37.9% 30.3% 31.8% 46.0% 34.9% 28.6% 30.2%231 4706000 South Mississippi County School District 51.4% 42.9% 28.6% 37.1% 50.0% 40.0% 23.3% 33.3% 50.0% 40.0% 23.3% 33.3%232 5504000 South Pike County School District 50.0% 44.4% 33.3% 5.6% 50.0% 44.4% 33.3% 5.6% 47.1% 41.2% 35.3% 5.9%
Page 4 of 5 ADHE Prepared 12/8/2014
ATTACHMENT 7-13
Any % Math % Engl % Read % Any % Math % Engl % Read % Any % Math % Engl % Read %1-Year Remediation Rates2-Year Remediation RatesAnytime Remediation Rates
# LEA District Name
233 7105000 South Side School District 27.3% 27.3% 18.2% 18.2% 30.0% 30.0% 20.0% 20.0% 30.0% 30.0% 20.0% 20.0%234 3209000 Southside School District 51.7% 23.3% 38.3% 28.3% 49.1% 21.1% 36.8% 24.6% 49.1% 20.0% 36.4% 23.6%235 2906000 Spring Hill School District 42.3% 23.1% 23.1% 30.8% 42.3% 23.1% 23.1% 30.8% 42.3% 23.1% 23.1% 30.8%236 7207000 Springdale School District 40.8% 23.6% 24.7% 21.9% 38.0% 21.5% 22.9% 20.9% 35.8% 19.5% 21.2% 19.9%237 4003000 Star City School District 45.6% 29.8% 24.6% 26.3% 47.3% 30.9% 25.5% 27.3% 44.9% 30.6% 24.5% 24.5%238 5206000 Stephens School District 85.7% 42.9% 71.4% 71.4% 80.0% 30.0% 70.0% 70.0% 80.0% 30.0% 70.0% 70.0%239 7009000 Strong-Huttig School District 81.0% 71.4% 47.6% 42.9% 77.8% 66.7% 44.4% 38.9% 77.8% 66.7% 44.4% 38.9%240 0104000 Stuttgart School District 51.6% 37.5% 34.4% 32.8% 50.8% 36.5% 33.3% 31.7% 50.8% 36.5% 33.3% 31.7%241 4605000 Texarkana School District 54.4% 32.2% 44.4% 27.8% 52.4% 33.3% 41.7% 25.0% 50.6% 32.9% 40.5% 22.8%242 5605000 Trumann School District 44.4% 28.9% 31.1% 24.4% 43.9% 29.3% 34.1% 24.4% 43.6% 30.8% 33.3% 23.1%243 7510000 Two Rivers School District 65.4% 53.8% 38.5% 26.9% 62.5% 50.0% 37.5% 25.0% 60.9% 47.8% 39.1% 26.1%244 0505000 Valley Springs School District 40.0% 34.3% 8.6% 22.9% 41.2% 35.3% 8.8% 23.5% 41.2% 35.3% 8.8% 23.5%245 1612000 Valley View School District 22.5% 17.6% 8.8% 4.9% 22.2% 17.2% 9.1% 5.1% 20.8% 16.7% 8.3% 4.2%246 1705000 Van Buren School District 34.4% 19.8% 20.8% 14.6% 32.2% 18.3% 19.3% 13.9% 31.3% 17.7% 18.7% 13.6%247 2307000 Vilonia School District 34.6% 26.0% 18.1% 13.4% 32.0% 23.0% 18.0% 12.3% 30.8% 22.2% 17.9% 12.0%248 2503000 Viola School District 23.5% 17.6% 23.5% 17.6% 23.5% 17.6% 23.5% 17.6% 23.5% 17.6% 23.5% 17.6%249 6401000 Waldron School District 40.4% 29.8% 27.7% 14.9% 34.9% 25.6% 23.3% 9.3% 34.1% 26.8% 22.0% 9.8%250 0602000 Warren School District 66.7% 55.6% 57.8% 40.0% 66.7% 55.6% 57.8% 40.0% 65.9% 54.5% 56.8% 40.9%251 3509000 Watson Chapel School District 50.8% 40.6% 36.7% 24.2% 50.8% 41.5% 37.3% 24.6% 52.2% 42.6% 38.3% 25.2%252 7208000 West Fork School District 35.9% 28.2% 17.9% 17.9% 36.1% 30.6% 16.7% 19.4% 35.3% 32.4% 14.7% 17.6%253 1803000 West Memphis School District 67.1% 41.8% 53.4% 49.3% 65.7% 41.4% 51.4% 47.9% 65.9% 42.6% 51.2% 47.3%254 1204000 West Side School District 42.1% 26.3% 26.3% 10.5% 44.4% 27.8% 27.8% 11.1% 41.2% 23.5% 29.4% 11.8%255 7509000 Western Yell Co. School District 38.5% 23.1% 23.1% 23.1% 36.4% 18.2% 18.2% 18.2% 36.4% 18.2% 18.2% 18.2%256 1602000 Westside Cons. School District 37.0% 20.4% 16.7% 20.4% 32.0% 18.0% 14.0% 16.0% 32.7% 18.4% 14.3% 16.3%257 3606000 Westside School District 60.0% 52.0% 40.0% 40.0% 47.1% 41.2% 29.4% 23.5% 47.1% 41.2% 29.4% 23.5%258 7304000 White Co. Central School District 70.0% 70.0% 40.0% 20.0% 68.4% 68.4% 36.8% 21.1% 68.4% 68.4% 36.8% 21.1%259 3510000 White Hall School District 24.8% 16.5% 17.3% 11.3% 22.0% 13.0% 17.9% 12.2% 23.1% 13.7% 18.8% 12.8%260 1505000 Wonderview School District 31.6% 15.8% 31.6% 21.1% 27.8% 16.7% 27.8% 16.7% 27.8% 16.7% 27.8% 16.7%261 1304000 Woodlawn School District 29.2% 20.8% 16.7% 4.2% 29.2% 20.8% 16.7% 4.2% 29.2% 20.8% 16.7% 4.2%262 1905000 Wynne School District 47.5% 23.8% 35.6% 28.7% 44.2% 21.1% 31.6% 25.3% 42.2% 18.9% 30.0% 24.4%263 4502000 Yellville-Summit School District 54.2% 45.8% 33.3% 29.2% 45.0% 40.0% 25.0% 20.0% 45.0% 40.0% 25.0% 20.0%
Page 5 of 5 ADHE Prepared 12/8/2014

ATTACHMENT 7-14
#Inst. Type
Institution Any % Math % Engl % Read %
1 1 ASUJ 13.6% 10.2% 2.9% 2.4%2 1 ATU 23.1% 16.7% 12.7% 9.2%3 1 HSU 25.3% 16.6% 14.2% 8.9%4 1 SAUM 28.6% 21.1% 13.9% 10.5%5 1 UAF 7.3% 4.0% 2.2% 2.4%6 1 UAFS 19.1% 13.7% 9.8% 6.3%7 1 UALR 21.2% 14.0% 10.4% 8.1%8 1 UAM 37.2% 25.1% 23.4% 18.8%9 1 UAMS 0.0% 0.0% 0.0% 0.0%10 1 UAPB 51.8% 39.7% 33.7% 20.6%11 1 UCA 16.8% 12.2% 7.3% 5.2%12 2 ANC 45.8% 29.2% 24.0% 26.0%13 2 ASUB 40.5% 30.7% 17.9% 17.9%14 2 ASUMH 32.9% 26.3% 17.1% 13.2%15 2 ASUN 59.1% 42.6% 36.5% 30.4%16 2 BRTC 59.7% 36.8% 36.8% 33.3%17 2 CCCUA 47.8% 26.1% 37.7% 2.9%18 2 CotO 38.5% 25.0% 25.0% 15.4%19 2 EACC 52.2% 32.6% 23.9% 30.4%20 2 MSCC 58.5% 29.2% 43.1% 29.2%21 2 NAC 43.9% 29.5% 18.9% 15.9%22 2 NPCC 53.8% 32.7% 26.9% 15.4%23 2 NWACC 41.0% 24.1% 19.8% 21.2%24 2 OZC 43.5% 34.8% 15.2% 15.2%25 2 PCCUA 53.7% 37.0% 29.6% 24.1%26 2 PTC 53.4% 38.5% 34.8% 27.6%27 2 RMCC 38.6% 25.0% 27.3% 22.7%28 2 SACC 73.1% 19.2% 53.8% 50.0%29 2 SAUT 65.0% 41.7% 45.0% 30.0%30 2 SEAC 27.0% 23.8% 12.7% 0.0%31 2 UACCB 24.3% 8.7% 17.5% 7.8%32 2 UACCH 59.6% 24.7% 43.8% 31.5%33 2 UACCM 40.1% 21.3% 26.7% 16.3%
15.7% 10.8% 7.1% 5.4%45.6% 28.6% 26.2% 21.2%21.5% 14.2% 10.8% 8.4%
4-Year Universities2-Year CollegesTotal
Anytime Remediation Rates for High School Students with 3.00 GPA or Higher
Academic Year = 2015 (2014 Fall)
Page 1 of 1 ADHE Prepared 12/8/2014

ATTACHMENT 7-15
Remediation Attempts
Academic Year = 2014 for students enrolled in AY2010 - AY2014 for All Remedial CoursesNOTE: This does not take into account whether or not the student(s) passed the remedial course, but is only the number of times the course was taken.
No. IT InstitutionRemed.
Registrations
1 Attempt Only
1 Attempt Percent
2 Attempts Only
2 Attempts Percent
3 Attempts Only
3 Attempts Percent
4 Attempts Only
4 Attempts Percent
5 or More Attempts
5 or More Attempts Percent
1 1 ASUJ 9,156 7,942 86.7% 993 10.8% 173 1.9% 39 0.4% 9 0.1%2 1 ATU 11,811 9,563 81.0% 1,770 15.0% 360 3.0% 91 0.8% 27 0.2%3 1 HSU 3,389 2,647 78.1% 657 19.4% 64 1.9% 15 0.4% 6 0.2%4 1 SAUM 5,049 4,126 81.7% 689 13.6% 161 3.2% 58 1.1% 15 0.3%5 1 UAF 2,651 2,279 86.0% 279 10.5% 76 2.9% 12 0.5% 5 0.2%6 1 UAFS 13,149 10,334 78.6% 2,202 16.7% 489 3.7% 105 0.8% 19 0.1%7 1 UALR 7,296 6,078 83.3% 1,044 14.3% 150 2.1% 19 0.3% 5 0.1%8 1 UAM 7,266 5,528 76.1% 1,460 20.1% 212 2.9% 44 0.6% 22 0.3%9 1 UAMS 0 0 0.0% 0 0.0% 0 0.0% 0 0.0% 0 0.0%
10 1 UAPB 9,525 7,448 78.2% 1,779 18.7% 258 2.7% 36 0.4% 4 0.0%11 1 UCA 7,438 6,338 85.2% 953 12.8% 134 1.8% 13 0.2% 0 0.0%12 2 ANC 6,418 6,252 97.4% 159 2.5% 7 0.1% 0 0.0% 0 0.0%13 2 ASUB 9,879 8,500 86.0% 1,177 11.9% 165 1.7% 30 0.3% 7 0.1%14 2 ASUMH 4,530 3,951 87.2% 480 10.6% 84 1.9% 13 0.3% 2 0.0%15 2 ASUN 2,555 2,409 94.3% 135 5.3% 7 0.3% 4 0.2% 0 0.0%16 2 BRTC 10,322 8,838 85.6% 1,205 11.7% 226 2.2% 38 0.4% 15 0.1%17 2 CCCUA 3,239 2,693 83.1% 434 13.4% 83 2.6% 22 0.7% 7 0.2%18 2 CotO 3,541 3,156 89.1% 337 9.5% 42 1.2% 5 0.1% 1 0.0%19 2 EACC 6,015 4,950 82.3% 904 15.0% 133 2.2% 20 0.3% 8 0.1%20 2 MSCC 14,752 12,962 87.9% 1,590 10.8% 173 1.2% 25 0.2% 2 0.0%21 2 NAC 7,730 6,802 88.0% 772 10.0% 119 1.5% 31 0.4% 6 0.1%22 2 NPCC 10,703 9,516 88.9% 1,025 9.6% 127 1.2% 29 0.3% 6 0.1%23 2 NWACC 23,047 19,574 84.9% 2,808 12.2% 514 2.2% 110 0.5% 41 0.2%24 2 OZC 4,515 4,076 90.3% 393 8.7% 42 0.9% 4 0.1% 0 0.0%25 2 PCCUA 10,794 9,241 85.6% 1,322 12.2% 186 1.7% 39 0.4% 6 0.1%26 2 PTC 49,913 41,151 82.4% 7,319 14.7% 1,148 2.3% 235 0.5% 60 0.1%27 2 RMCC 2,383 2,227 93.5% 132 5.5% 21 0.9% 2 0.1% 1 0.0%28 2 SACC 7,749 6,578 84.9% 978 12.6% 144 1.9% 33 0.4% 16 0.2%29 2 SAUT 4,260 3,500 82.2% 616 14.5% 120 2.8% 18 0.4% 6 0.1%30 2 SEAC 9,684 8,551 88.3% 994 10.3% 115 1.2% 21 0.2% 3 0.0%31 2 UACCB 5,458 4,653 85.3% 650 11.9% 124 2.3% 26 0.5% 5 0.1%32 2 UACCH 5,122 4,322 84.4% 662 12.9% 115 2.2% 20 0.4% 3 0.1%33 2 UACCM 8,374 7,444 88.9% 820 9.8% 99 1.2% 10 0.1% 1 0.0%
76,730 62,283 81.2% 11,826 15.4% 2,077 2.7% 432 0.6% 112 0.1%210,983 181,346 86.0% 24,912 11.8% 3,794 1.8% 735 0.3% 196 0.1%287,713 243,629 84.7% 36,738 12.8% 5,871 2.0% 1,167 0.4% 308 0.1%
4-Year Universities2-Year CollegesTotals
NOTE: Counts of 10 or less are not shown due to FERPA. Page 1 of 2 ADHE Prepared 12/8/2014

ATTACHMENT 7-15
Remediation Attempts: Passing
Remedial Students that Pass in Academic Year = 2014 for All Remedial CoursesThe time period used for determine attempts are from AY2010 - 2014.NOTE: This only counts students that pass their remedial course in AY2014 and includes the grades of A, B, C, S (satisfactory), and CR (credit awarded).
No. IT Institution Remed. Students Passing
1 Attempt Only
2 Attempts Only
3 Attempts Only
4 Attempts Only
5 or More Attempts
PERCENT - 1 Attempt
PERCENT - 2 Attempts
PERCENT - 3 Attempts or
More1 1 ASUJ 766 674 73 16 2 1 88.0% 9.5% 2.5%2 1 ATU 1,521 981 385 101 43 11 64.5% 25.3% 10.2%3 1 HSU 390 306 78 3 1 2 78.5% 20.0% 1.5%4 1 SAUM 723 644 54 22 2 1 89.1% 7.5% 3.5%5 1 UAF 322 278 33 10 - 1 86.3% 10.2% 3.4%6 1 UAFS 1,295 1,047 185 48 15 - 80.8% 14.3% 4.9%7 1 UALR 748 681 58 9 - - 91.0% 7.8% 1.2%8 1 UAM 629 477 110 30 5 7 75.8% 17.5% 6.7%9 1 UAMS - - - - - - 0.0% 0.0% 0.0%
10 1 UAPB 674 613 52 7 2 - 90.9% 7.7% 1.3%11 1 UCA 1,015 930 71 11 3 - 91.6% 7.0% 1.4%12 2 ANC 462 444 18 - - - 96.1% 3.9% 0.0%13 2 ASUB 957 832 101 22 2 - 86.9% 10.6% 2.5%14 2 ASUMH 604 553 40 10 1 - 91.6% 6.6% 1.8%15 2 ASUN 398 362 33 - 3 - 91.0% 8.3% 0.8%16 2 BRTC 1,157 1,000 111 37 6 3 86.4% 9.6% 4.0%17 2 CCCUA 270 207 43 12 7 1 76.7% 15.9% 7.4%18 2 CotO 348 291 55 2 - - 83.6% 15.8% 0.6%19 2 EACC 394 336 51 7 - - 85.3% 12.9% 1.8%20 2 MSCC 1,888 1,772 110 6 - - 93.9% 5.8% 0.3%21 2 NAC 374 354 13 5 2 - 94.7% 3.5% 1.9%22 2 NPCC 985 933 50 2 - - 94.7% 5.1% 0.2%23 2 NWACC 2,590 2,157 331 79 13 10 83.3% 12.8% 3.9%24 2 OZC 263 176 73 12 2 - 66.9% 27.8% 5.3%25 2 PCCUA 1,045 986 58 1 - - 94.4% 5.6% 0.1%26 2 PTC 5,300 4,355 748 141 48 8 82.2% 14.1% 3.7%27 2 RMCC 223 216 4 2 - 1 96.9% 1.8% 1.3%28 2 SACC 680 605 68 6 1 - 89.0% 10.0% 1.0%29 2 SAUT 285 201 52 27 5 - 70.5% 18.2% 11.2%30 2 SEAC 920 805 103 11 1 - 87.5% 11.2% 1.3%31 2 UACCB 460 382 58 13 4 3 83.0% 12.6% 4.3%32 2 UACCH 508 439 48 17 3 1 86.4% 9.4% 4.1%33 2 UACCM 780 699 67 11 2 1 89.6% 8.6% 1.8%
8,083 6,631 1,099 257 73 23 82.0% 13.6% 4.4%20,891 18,105 2,235 423 100 28 86.7% 10.7% 2.6%28,974 24,736 3,334 680 173 51 85.4% 11.5% 3.1%
4-Year Universities2-Year CollegesTotal
NOTE: Counts of 10 or less are not shown due to FERPA. Page 2 of 2 ADHE Prepared 12/8/2014