Embed Size (px)
Citation preview

… Understanding what you desire
DELTA Venlighedsvej 4
2970 Hørsholm
Denmark
Tel. +45 72 19 40 00
Fax +45 72 19 40 01
www.delta.dk
VAT No. 12275110
Report
White paper on external warning sounds for electric cars - Recommendations and guidelines Financed by Danish Sound Technology Network AV 1224/10 Project no.: A520040 Page 1 of 65 incl. 11 appendices 28 March 2011
Contributors:
DELTA SenseLab madebydelta.com/senselab Torben Holm Pedersen
EC tunes ectunes.com Thomas Gadegaard
Sonic Minds sonicminds.dk Karsten Kjems
iCapture icapture.dk Ulrik Skov
The report must not be reproduced, except in ful l, without the written approval of DELTA.

AV 1224/10 Page 2 of 65
work
Title White paper on external warning sounds for electric cars - Recommendations and guidelines
Journal no. Project no. Our ref. AV 1224/10 A520040 THP/SVL/ilk
Client Danish Sound Technology Net
Client ref.
Summary This report addresses external warning sounds for hybrid and electric vehicles. The purpose of adding external sound at low speeds is to minimise the risk from these quiet vehicles for pedes-trians, cyclist and blind persons. The main perspective of the report is to describe signals and systems that minimises the risk and causes as low noise pollution and annoyance as possible.
Based on background information about the hearing, sound propagation and the masking effect of the background noise, recommendations are given for the characteristics (levels, frequencies etc.) for optimal warning sounds. Four types of warning sounds and their usage are defined. Besides these recommendations a design guide for the warning sounds is given.
Recommendations are given for external sound generation systems. It is found that such sys-tem needs to be based on at least two loudspeakers one pointing forward and one backward to minimize noise pollution and to make the signals audible in the driving direction.
The warning sounds need to be optimized for audibility, suitability and annoyance. Listening test methods for this optimisation are described. The method for audibility defines the concept of dBALICE, i.e. the A-weighted sound pressure level of a warning sound that gives the same audibility level as a reference internal combustion engine sound.
Instrumental measuring methods for documentation of signals and systems are defined.
It is concluded that optimal warning sounds and good sound systems will make it possible to generate sufficient warning sounds with much less noise pollution than from vehicles with in-ternal combustion engines.
DELTA, 28 March 2011
Torben Holm Pedersen
SenseLab

AV 1224/10 Page 3 of 65
Contents
1. Motivation and scope ...................................................................................................6
2. Definitions .....................................................................................................................7
3. Background information .............................................................................................8 3.1 Hearing thresholds ..................................................................................................8 3.2 Masking effect of background noise.......................................................................8 3.3 Sound propagation ..................................................................................................9 3.4 Sound insulation .....................................................................................................9 3.5 Optimal frequency range for warning sounds.........................................................9 3.6 Noise emissions from cars ......................................................................................9
4. Recommendations and design guide for warning sounds.......................................10
5. Recommendations for external sound systems........................................................11
6. Measurement methods...............................................................................................11 6.1 Audibility ..............................................................................................................11 6.2 Suitability and annoyance.....................................................................................12 6.3 Sound level measurements....................................................................................12
7. How much less noise is possible by optimal warning sounds .................................13
8. References ...................................................................................................................14
9. Appendix 1 – Hearing thresholds .............................................................................16 9.1 Normal hearing thresholds....................................................................................16 9.2 Age-related hearing loss .......................................................................................17 9.3 Noise-related hearing loss.....................................................................................18
10. Appendix 2 - Background noise ................................................................................19 10.1 Measurements of background noise .....................................................................19 10.2 A simplified background noise spectrum .............................................................21
11. Appendix 3 – Sound propagation .............................................................................23 11.1 Short range sound propagation .............................................................................23 11.2 Long range sound propagation .............................................................................24
12. Appendix 4 - Sound insulation of facades ................................................................25
13. Appendix 5 – ICE vehicle noise characteristics.......................................................26 13.1 Danish measurements ...........................................................................................26

AV 1224/10 Page 4 of 65
13.1.1 Measurement method and objects ................................................26 13.1.2 Results ..........................................................................................27
13.2 Japanese measurements ........................................................................................33 13.3 Other measurements .............................................................................................35 13.4 Conclusions...........................................................................................................36
14. Appendix 6 - Measuring methods for sound characteristics..................................37 14.1 Directivity of the external sound generation system.............................................38 14.2 Driving mode measurements ................................................................................39
14.2.1 Simulated driving .........................................................................39 14.2.2 Real driving with microphone mounted at the car .......................39
14.3 Analysis ................................................................................................................39
15. Appendix 7 – Warning sound recommendations ....................................................40 15.1 Signal types...........................................................................................................40 15.2 Warning sound specifications...............................................................................41
15.2.1 Levels and level changes..............................................................42 15.3 Signal frequency range and pitch shift..................................................................42 15.4 Driver controls ......................................................................................................44
15.4.1 Pause Switch ................................................................................44 15.4.2 Pedestrian horn.............................................................................44
15.5 Signal characteristics ............................................................................................44
16. Appendix 8 - Signal design guide..............................................................................46 16.1 Purpose of external warning sounds .....................................................................46 16.2 Types of sounds ....................................................................................................46 16.3 Main Characteristics .............................................................................................47
16.3.1 Recognition and localisation ........................................................47 16.3.2 Start sound....................................................................................47 16.3.3 Idle and drive sound .....................................................................48 16.3.4 Reverse sound ..............................................................................48
16.4 General characteristics ..........................................................................................49
17. Appendix 9 - Sound system recommendations ........................................................50 17.1 Drive mode information........................................................................................50 17.2 Recommendations.................................................................................................50 17.3 Optional characteristics.........................................................................................51
18. Appendix 10 – Determination of Equal audibility as ICE motor sounds..............52 18.1 Scope.....................................................................................................................52 18.2 Purpose of the listening test ..................................................................................52

AV 1224/10 Page 5 of 65
18.3 Test signals and samples.......................................................................................53 18.4 Listeners................................................................................................................53 18.5 Presentation of the sound samples ........................................................................54 18.6 Test design ............................................................................................................54 18.7 Data analysis .........................................................................................................55 18.8 Test results ............................................................................................................57 18.9 Reporting ..............................................................................................................58 18.10 Simplified background noise ......................................................................59
19. Appendix 11 – Measuring method for annoyance and suitability .........................60 19.1 Purpose of the listening test ..................................................................................60 19.2 Test signals and samples.......................................................................................60 19.3 Listeners................................................................................................................61 19.4 Presentation of the sound samples ........................................................................61 19.5 Suitability measurements ......................................................................................62 19.6 Annoyance measurements ....................................................................................63 19.7 Data analysis .........................................................................................................64 19.8 Test results ............................................................................................................64 19.9 Reporting ..............................................................................................................65

AV 1224/10 Page 6 of 65
1. Motivation and scope This report addresses external warning sounds for electric vehicles. The report specifies substantiated recommendations and guidelines for design and measurements of such sounds for passenger cars and vans (vehicle categories M1 and N1). Similar guidelines may be appropriate for other types of vehicles, such as trucks and busses but these are not considered in detail in this paper.
Recent research has shown an increased rate of accidents involving pedestrian and cyclists for electrical and hybrid cars in electrical mode at low speeds when tyre noise is insuffi-cient for the car to be heard [12]. Anecdotal information from drivers of electric cars con-firms that observation. This indicates that the need for methods that conveys information about the vehicle and its manoeuvres is essential for pedestrians and cyclists [22]. It is found [13] that warning sounds with similar characteristics as engine sounds are the best countermeasures against these risks’.
It is a paradox that the most obvious solution for this problem is to add an artificial “motor sound” or other suitable warning sounds when one of the appreciated advantages of elec-tric vehicles is less noise pollution [23]. It should be noted that there has been criticism of the need for external warning sounds [21]. It is shown that also ICE vehicles may be so quiet that they are not audible in noisy cities and it claimed that that has not been a specific problem. In reference [13] it is found that blind persons only rely on their hearing, when they are not in noisy surroundings. From this it can be concluded that warning sounds will help minimising the risk even if they are not more audible than ICE vehicles and that the warning sounds do not need to be so loud that hey are audible under all circumstances.
The important challenge is to optimize the signals for maximum pedestrian and cyclist safety with minimal environmental noise and annoyance. One of the tools for minimizing annoyance is to send out noise in the relevant direction (e.g. mainly forward or backward) only. Another tool is to turn down the sound at speeds above 20-30 km/h where the tyre noise is sufficient and finally not to make the signals louder than necessary.
It is not required that the signals shall be audible under all circumstances, but as a first step they shall be as audible as the noise from ordinary (with internal combustion engines) cars. The tyre noise is the same for electrical vehicles and ordinary cars, so the signals shall ba-sically be as audible as the noise from the combustion engine. A next and more intelligent step will be to optimize the signals by making them adaptive to the background noise and/or making them adaptive situation to the surroundings (e.g. only turned on where ve-hicles, pedestrians and other road users are co-mingled). This will at the same time de-crease the noise pollution and make the signals audible when needed.
When estimating the audibility it shall be taken into account that different signals may have very different audibility in background noise for the same A-weighted sound pressure level. Therefore a measure of audibility (in background noise) is more relevant that the

AV 1224/10 Page 7 of 65
actual sound pressure levels. This may also be used for minimizing the environmental noise levels.
When designing the signals the hearing ability of all road users (both young and elderly people, hearing impaired, blind etc.) shall be taken into account as well as the masking effect from the background noise. Furthermore signals should be intuitively recognisable as coming from vehicles, they should also be easy to localize with a minimum of annoying characteristics.
A part of the paper is dedicated to measuring methods that can verify if the recommenda-tions are followed.
The specific information about the different topics is given in appendices that are intended for independent reading. Therefore some repetitions of information will occur.
2. Definitions dBALICE: The A-weighted sound pressure level of a warning sound, with the same audibil-ity as a reference Internal Combustion Engine sound in a specified background noise.(see Appendix 10 – Determination of Equal audibility as ICE motor sounds). The sound pressure level from a selected ICE reference car at 10 km/h is LAeq = 60 dB. The A-weighted sound pressure levels, dBALICE for warning sounds with the same audibil-ity, may be 5-10 dB lower.
Electric Vehicles (EV): Vehicles powered by electric motors only
External Sound Generation (ESG) System: Audio system with external speakers which provides warning sounds, to the external environment of the vehicle in addition to the noise generated by the vehicle itself. Also called Audible vehicle system (AV-System or AVS)
Hybrid Electric Vehicles (HEV): Vehicles with both electric motor(s) and an internal combustion engine
ICE: Internal Combustion Engine
Internal combustion engine vehicles (ICEV): Vehicles powered by an internal combus-tion engine.
Reference engine sound: The noise from a Mitsubishi Colt 2010 Clear tech 1.3 with a 1332 cm3 petrol engine at 1160 RPM (corresponding to a speed of 10 km/h -1’rst gear) measured in position FC (see Appendix 6 - Measuring methods for sound characteristics). The reference car sound can be downloaded from www.madebydelta.com/senselab.
AV 1224/10 Page 8 of 65
Simplified background noise: A pink noise signal with a frequency weighting so the spectrum is similar to average background noise spectra – see Appendix 2 - Background noise
Warning sound: An external (continuous) sound emitted from a quiet vehicle for the pur-pose of warning pedestrians and cyclist about the presence of a moving vehicle nearby. The sound is intended for quiet vehicles such as electric and hybrid electric vehicles with-out an internal combustion engine running. The warning sounds are also called “Ap-proaching Vehicle Alert signals”, “Pedestrian warning signals”, “Approach warning sig-nals” and “Vehicle Sound for Pedestrians”
3. Background information
3.1 Hearing thresholds The main components of the warning sounds should be within the sensitive range of the hearing. The audibility of the signals is dependant on the hearing ability of the involved persons. This is described in more details in Appendix 1 – Hearing thresholds.
When taking into account the sensitivity of hearing for normal hearing persons, the signals could be in the range 200-7000 Hz. But when also taking into account the age related hear-ing loss and any noise induced hearing loss it can be concluded that the main components of the warning sounds shall be in the frequency range 200-1000 Hz.
3.2 Masking effect of background noise The background noise usually from traffic will cause a more or less masking of the sounds from a nearby vehicle. In suburb and urban environments the masking from the traffic is in general are of higher significance than the hearing thresholds mentioned in section 3.1. The masking effect can not be predicted from the overall A-weighted sound pressure lev-els of signals and the background noise, because it depends on the signal to noise ratio in the frequency bands, the so called critical bands, that contains the frequency components of the warning sounds.
This means that we have a frequency dependant masking effect from the background noise. In general the masking effect of the background noise is less in frequency ranges where the background noise levels are low.
In “Appendix 2 - Background noise” the results from measurements of the background noise at a number of locations at parking lots in Copenhagen and its suburbs are shown. From these measurements (see e.g. Figure 4) it can be seen that the background noise lev-els are generally essential higher below 200 Hz than at higher frequencies. Therefore it can

AV 1224/10 Page 9 of 65
be concluded, that for optimum audibility the main components of the warning sounds should not be below approximately 200 Hz.
3.3 Sound propagation
The sound propagation is relevant from two perspectives: At short distances the signals should clearly heard by pedestrians and cyclists, and at large distances the environmental noise impact should be minimized.
From Appendix 3 it can be seen that with hard terrain (asphalt) and distances up to 25 m frequencies below 1-2 kHz are optimal for good audibility
For longer distances (200 m) it is seen that low frequencies propagate well even over noise barriers. This can also be recognised from the background noise spectre in Appendix 2. For minimizing noise annoyance at neighbouring residences and leisure areas signal fre-quencies below 100-200 Hz should be avoided.
3.4 Sound insulation
In general, the sound insulation of facades increases with frequency above 100-200 Hz. Therefore frequencies below that range should be avoided to obtain the least indoor noise from the warning sounds. More details on that topic can be found in Appendix 4
3.5 Optimal frequency range for warning sounds
From sections 3.1-3.4 it can be concluded that the optimal frequency range for the warning sounds is the range 100-2000 Hz. The most important range is 200-1000 Hz so the main components should be in that range. Signals below 100 Hz should not be allowed as these frequencies spread widely both outdoor and indoor and are therefore potential sources for noise annoyance.
3.6 Noise emissions from cars There are three main sources of noise from vehicles with internal combustion engines: The tyres, the engine and at high speeds the wind noise.
In Appendix 5 the noise characteristics from ICE vehicles are shown from a number of measurements. It is seen that above 25 km/h the tyre noise is dominating over the engine noise. As the tyre noise is the same for ICE vehicles as for electric vehicles, this means that no added sound is needed above 25 km/h.
From the measurements also the level change of the engine noise with speed is found. This is the basis for the recommendation for the level changes of the external sounds from elec-tric cars.

AV 1224/10 Page 10 of 65
4. Recommendations and design guide for warning sounds On the basis of the background information given in section 3 it is possible to deduce mo-tivated recommendations for warning sounds and external sound generation systems.
The optimal warning sounds should intuitively be recognized as sounds coming from a vehicle, it should be possible to localize the vehicle and the sound should indicate vehicle manoeuvres (speed and speed changes). The sounds should not have annoying characteris-tics and should be equal audible as the internal combustion engines.
Four types of sounds may be relevant: A starting sound, an idle sound, a driving sound and a reverse sound. (And the reverse sound should not be the unintelligent annoying and hard to localize beeper sound known from trucks.)
The starting sound should be a short (1-2 sec.) sound indicating that the car is preparing to drive. Basically the drive sounds should be “engine like” in a broad sense. The sound vol-ume and frequency should vary with the speed e.g. as shown in graphs. Above 25 km/h no sound is needed. Many sounds will be “engine like” when they are changed with speed. The reverse sound is a sound added to the drive sound when reversing. The sounds should only be sent out in the direction of driving.
The main frequencies of the warning sounds should be within 200-1000 Hz and no sound should be emitted below 100 Hz.
The level of the sounds should be such that they are equal audible in background noise as an ICE sound. For many warning sounds that mean that the A-weighted levels should be 5-10 dB lower than the levels of the engine sounds.
More specific recommendations on frequency range, pitch shift with speed, sound pressure levels and level changes with speed can be found in Appendix 7.
In general the added external sounds from electrical vehicles should mimic the engine sound. Many continuous sounds will sound engine-like when their frequency and ampli-tude are modulated with the speed. A number of inappropriate sounds are mentioned.
The high frequencies should not be emphasized. They tend to be annoying and elderly people don’t hear them. Don’t use low frequencies. They are hard to localize, they will drown in the background noise unless they are so loud that they annoy the neighbours’ and they penetrate windows of buildings quite well.
To ensure good localization the sounds should be of broad band nature, it could be shaped noise with a mix of a number of distributed frequencies or tones. Combustion like impul-sive characteristics may also be included. Such characteristics would give recognisability and still allow for sound branding of the different car makes and models.
In Appendix 8 a detailed design guide for the warning sounds is given.

AV 1224/10 Page 11 of 65
5. Recommendations for external sound systems From the recommendations for the warning sounds the requirements for the external sound generation system with regard to frequency range and sound pressure levels can be de-duced.
The sound signal from the sound generator, which receives driving mode information from the vehicle, should be fed to at least two loudspeakers, one pointing forward and one pointing backward.
The detailed recommendations for the sound system including the directional properties of the sound radiation can be found in Appendix 9.
To be able to reproduce the warning sounds and their changes in amplitude and frequency with speed, the system presumably need to be based on loudspeakers. Piezo beepers, horns or buzzers will probably not be able to fulfil the recommendations.
6. Measurement methods Three main characteristics of the warning sounds should be optimized: Audibility, suitabil-ity and annoyance.
6.1 Audibility
Objective measuring methods for the audibility of different signal characteristics in back-ground noise exist1, but the warning sounds for electrical vehicles may be rather complex so therefore the most reliable method is to test the audibility by listening tests.
The audibility of the warning sounds in traffic noise should be the same as the audibility of the sound from internal combustion engines. But that does not mean that the A-weighted sound levels should be the same. Many of the potential warning sounds are more audible than ICE sounds at the same levels. This means that they should have a lower level to be perceived as equal audible. This can be measured by listening tests where a number of lis-teners compare the sounds in background noise. The listening tests can be performed ac-
1 Measuring methods for thresholds and audibility of tones and impulses in noise are described in ISO 1996-2 Annex C, [2] and Nordtest NT ACOU 112, [15]) and in a project on the audibility of wind turbine noise in natural (noise from the vegetation in the wind) it was found that the wind turbine noise (broad band noise type with tones) was completely masked by the background noise it was is more than 4 dB below the critical band levels of the background noise, [16].

AV 1224/10 Page 12 of 65
cording to a standard method by using headphones and a specified background noise. A method for such listening tests is described in Appendix 10
6.2 Suitability and annoyance
Field testing of the suitability and annoyance of alternative sounds for a specific vehicle is to be preferred but in the first phases these “attributes” can also be tested by “indoor” lis-tening test. The suitability test ideally uses consumer representatives and the annoyance test of the sounds should use average people as representatives for neighbours to roads and parking lots.
A method for such listening tests is described in Appendix 11
6.3 Sound level measurements The international Standards Organisation (ISO) and the Society for Automotive Engineers (SAE) are presently working on standards for the measurements of minimum noise emit-ted by road vehicles. Drafts exist that describes measurement conditions, procedures, posi-tions etc, see reference [8].
For the purpose of measuring the directional characteristics of the external sound genera-tion system a number of additional measuring positions are proposed. Furthermore meth-ods for measuring and analyzing level and pitch shifts of the warning sounds are proposed.
The measuring methods are described in Appendix 6

AV 1224/10 Page 13 of 65
7. How much less noise is possible by optimal warning sounds In reference [23] it is calculated that a complete replacement of ICE vehicles with electric vehicles will reduce the noise levels in cities with 3-4 dB. It is important that we optimize the warning sounds so we don’t waste this environmental benefit.
If the signals are optimised for audibility (see Appendix 10), suitability and annoyance (Appendix 11) and are emitted from a good sound system fulfilling the requirements (Ap-pendix 9) there are the following benefits compared to the ICE vehicles:
− Only sound radiation in the direction of driving
− The sound level of the drive sound is decreasing above 20km/h unlike the motor sound from ICE vehicles.
− No idle sound when speeder is not pressed
− Sound levels of the warning sounds are limited to same audibility as ICE motor sounds instead of a specified A-weighted sound pressure level (meaning 5-10 dB lower levels)
− No sound components below 100 Hz
These issues mean that the noise pollution with the specified warning sounds and a good sound system is considerably less than from the ICE vehicles.
It has been suggested that the need for warning sounds only will exist in a transition pe-riod. Therefore this need should be investigated again when a large part of the vehicles are electric.

AV 1224/10 Page 14 of 65
8. References [1] ISO 226 Acoustics - Normal equal-loudness-level contours.
2003
[2] ISO 1996-2 Acoustics -- Description, measurement and assessment of envi-ronmental noise -- Part 2: Determination of environmental noise levels Annex C: Audibility of tones. 2007.
[3] ISO 1999 Acoustics -- Determination of occupational noise exposure and es-timation of noise-induced hearing impairment. 1990.
[4] ISO 4120 Sensory analysis -- Methodology -- Triangle test. 2004
[5] ISO 7029 Acoustics - Statistical distribution of hearing thresholds as a func-tion of age. 2000.
[6] ISO 7731 Ergonomics - Danger signals for public and work areas - Auditory danger signals. 2008
[7] ISO 15 666 Acoustics -- Assessment of noise annoyance by means of social and socio-acoustic surveys. 2003
[8] ISO/TC 43/SC1.ISO/CD draft N1798. Measurement of minimum noise emit-ted by road vehicles, 2010-01-11.
[9] ITI-R BS 1534-1. MUSHRA test…
[10] JASIC A Study on Approach Warning Systems for hybrid vehicle in electric motor mode - 1. Japan Automobile Internationalization Centre, JAPAN, 2009
[11] Japanese Director General, Engineering and Safety Department, Land Trans-port Bureau, MLIT Guideline on Low-noise Measures for HEV, etc January , 2010
[12] National Highway Traffic Safety Administration Incidence of Pedestrian and Bicyclist Crashes by Hybrid Electric Passenger Vehicles. Technical report. September 2009.
[13] National Highway Traffic Safety Administration Quieter Cars and the Safety of Blind Pedestrians: Phase I Report DOT HS 811 304. April 2010.

AV 1224/10 Page 15 of 65
[14] NoiseLab A software recording and analysis package for making Type 1 Precision measurements according to international standards. http://www.madebydelta.com/noiselab
[15] Nordtest NT ACOU 112, Prominence of impulsive sounds and for adjustment of LAeq. 2002
[16] Næs, T., Brockhoff, P. B. and Tomic, o. Statistics for sensory and consumer science, p.79-94. Wiley, 2010.
[17] Pedersen, Torben Holm Low Frequency Noise from Large Wind Turbines – A procedure for evalua-tion of the audibility for low frequency sound and a literature study. AV 1098/08. DELTA April 2008
[18] Pedersen, D. B, Pedersen, T. H., and Kvist, P. Physical and psychoacoustic metrics for the reduction of indoor traffic noise annoyance by windows. Euronoise 2006.
[19] Perr, J. Basic acoustics and Signal Processing http://www.ibiblio.org/pub/linux/docs/LDP/linuxfocus/English/March2003/article271.shtml
[20] Plovsing, B Proposal for Nordtest Method: Nord2000 Prediction of Outdoor Sound Propagation. DELTA report AV 1106/07 2007. Can be downloaded from: www.madebydelta.com/nord2000
[21] Sandberg, U., Goubert, L.and Mioduszewski, P. Are vehicles driven in electric mode so quiet that they need acoustic warning signals? International Congres on Acoustics (ICA) 2010.
[22] The Senate of the United States. Pedestrian Safety Enhancement Act of 2009. April 21, 2009.
[23] Verheijen, E. N. G.,Jabben, J. Effects of electric cars on traffic noise and safety National Institute for Public Health and the Environment. Report 6800300009/2010.

AV 1224/10 Page 16 of 65
9. Appendix 1 – Hearing thresholds
9.1 Normal hearing thresholds
The hearing threshold and the equal loudness contours of normal hearing young per-sons are shown in Figure 1. Each equal loudness contour indicates combinations of levels and frequencies that are perceived as equal loud for pure tones. Almost simi-lar curves exist for narrow band noise.
Figure 1 Normal hearing thresholds and equal loudness curves from ISO 226 [2].
From the figure it can be seen that at 1000 Hz the hearing threshold, the lowest curve in the figure, is close to 0 dB. It can also be seen that at higher and lower fre-quencies much higher levels are needed for the sound to be heard. At a sound pres-sure level of 60 dB at 1000 Hz other frequencies within the range 200-7000 Hz are

AV 1224/10 Page 17 of 65
perceived as equally loud within a tolerance of 10 dB. At lower frequencies higher levels are needed.
9.2 Age-related hearing loss
As we grow older our hearing gets less sensitive especially at the high frequencies. We get an age-related hearing loss, presbycusis. The average age related hearing losses are described in the ISO standard 7029 [5], see Figure 2.
-40
-35
-30
-25
-20
-15
-10
-5
0
125 250 500 1000 2000 4000 8000
Frequency, Hz
Hea
ring
loss
, dB
30 years
50 years
70 years
Figure 2 Average hearing thresholds for different age groups (males) according to ISO 7029.
From Figure 2 it can be seen that if elderly people should hear the signals, the essen-tial frequency components should be lower than 1-2 kHz.

AV 1224/10 Page 18 of 65
9.3 Noise-related hearing loss
If we are exposed to loud noise at work our hearing will suffer. Noise-induced hear-ing losses are shown in Figure 3.
Figure 3 Development of noise induced hearing loss. The curves are for different years of exposure.
From Figure 3 it can be seen that noise leads to an essential decrease of hearing sen-sitivity around 4 kHz and in severe cases even at lower frequencies. It can be con-cluded that the signals should contain essential components below 1 kHz

AV 1224/10 Page 19 of 65
10. Appendix 2 - Background noise
10.1 Measurements of background noise
Measurements of background noise have been performed in Copenhagen, the sub-urbs and a small village some distance from Copenhagen. The measurements were made in the morning rush-hour except for measurements at the village which were made in the evening. The measurements were made under calm weather and dry road conditions. The microphone position was in practical free field 1.5 m above the ground. The distance to the nearest lane was 25-60 m, in one of the sites this was screened by a building, see Figure 5 for details.
The measured spectra and A-weighted sound pressure levels are shown in Figure 4.
10
20
30
40
50
60
70
80
12.5 16 20 25
31.5 40 50 63 80 100
125
160
200
250
315
400
500
630
800 1k
1.25
k1.
6k 2k2.
5k3.
15k 4k 5k
6.3k 8k 10k
12.5
k16
k20
k
Frequency, Hz
Sou
nd p
ress
ure
leve
l, d
B re
20
µPa
Central Copenhagen 64 dB(A)Suburb 1, north of Cph. 60 dB(A)Eastern outskirts of Cph, 55 dB(A)Suburb 2, north of Cph. 50 dB(A)Village 35 dB(A)
Figure 4 Background noise spectra (third octave bands, Leq, 1-5 minutes) from different loca-tions in and around Copenhagen.

AV 1224/11 Page 20 of 65
Su
burb
1 n
orth
of C
open
hage
n: C
oord
inat
es 5
5°45
.245
’ N
12°3
4.31
0’E
(Jæ
gers
borg
Allé
/Fre
dens
vej)
Su
burb
2 n
orth
of C
open
hage
n: C
oord
inat
es 5
5°45
.751
’ N
12°3
1.49
0’E.
(Jæ
gers
borg
vej/S
mak
kegå
rdsv
ej)
C
entra
l Cop
enha
gen:
Coo
rdin
ates
55°
40.7
08’ N
12°
33.9
52’E
(J
arm
ers P
lads
)
Ea
ster
n ou
tski
rts o
f Cop
enha
gen:
Coo
rdin
ates
55°
38.4
60’ N
12°3
6,59
0’E
(Gyl
denr
isve
j) F
igur
e 5
Mea
suri
ng si
tes f
or b
ackg
roun
d no
ise.
The
mea
suri
ng p
ositi
ons w
ere
plac
ed a
t the
par
king
lots
in th
e m
iddl
e of
the
pict
ures
.

AV 1224/10 Page 21 of 65
10.2 A simplified background noise spectrum
From Figure 4 it is seen that except for the village all the spectra are of similar shape al-though the differences in the A-weighted levels are up to 14 dB.
In Figure 6 the average of the topmost 4 spectra from Figure 4 is shown together with a simplified approximation to this average spectrum. The simplified spectrum has the main characteristics of the average with small deviations.
10
20
30
40
50
60
70
20 25
31.5 40 50 63 80 100
125
160
200
250
315
400
500
630
800 1k
1.25
k
1.6k 2k
2.5k
3.15
k 4k 5k
6.3k 8k 10k
12.5
k
16k
Frequency, Hz
Soun
d pr
essu
re le
vel,
dB
re 2
0 µP
a
Average background noise spectrum
Simplified background noise spectrum
Figure 6 Average and simplified background noise spectra. The average spectrum is the average of the topmost 4 spectre of Figure 4.
Figure 7 shows the simplified spectrum normalized so that the maximum is 0 dB. This curve represents the frequency weighting that can be applied to a pink noise signal to ob-tain a simplified background noise for testing purposes.

AV 1224/10 Page 22 of 65
Simplified background noise spectrum, max = 0 dB
-50
-40
-30
-20
-10
0
1020 25
31.5 40 50 63 80 100
125
160
200
250
315
400
500
630
800 1k
1.25
k
1.6k 2k
2.5k
3.15
k 4k 5k
6.3k 8k 10k
12.5
k
16k
Frequency, Hz
Soun
d pr
essu
re le
vel,
dB
re 2
0 µP
a
Figure 7 Simplified background noise spectrum, normalized to a maximum at 0 dB.
The values of the weighting curve are given in Table 1.
Hz dB Hz dB Hz dB
20 -7,5 200 -12,5 2k -20
25 -5 250 -15 2.5k -22,5
31.5 -2,5 315 -15 3.15k -25
40 0 400 -15 4k -27,5
50 0 500 -15 5k -30
63 0 630 -15 6.3k -32,5
80 -2,5 800 -15 8k -35
100 -5 1k -15 10k -37,5
125 -7,5 1.25k -15 12.5k -40
160 -10 1.6k -17,5 16k -42,5
Table 1 Attenuation values for generation of the simplified background noise from pink noise (same attenuations as shown in Figure 7).

AV 1224/10 Page 23 of 65
11. Appendix 3 – Sound propagation Knowledge about the sound propagation is relevant at short distances to ensure that the signals could be clearly heard, and at large distances because of the environmental noise impact at neighbouring residents.
All frequencies are attenuated according to the distance law saying that the sound pressure level decreases with 6 dB per distance doubling. But there are a number of additional ef-fects caused by the meteorology, the terrain and screening objects that gives extra attenua-tions which are frequency dependent. Below, the excess sound attenuation is calculated for a number of scenarios with the Nord2000 computation model, see reference [20].
11.1 Short range sound propagation
The graphs in Figure 3 show the excess attenuation from air and terrain relative to the fre-quency independent attenuation with distance (6 dB per distance doubling) for a short dis-tance, 25 m.
32 63 125 250 500 1k 2k 4k 8k
10
5
0
-5
-10
-15
-20
-25
p
32 63 125 250 500 1k 2k 4k 8k
10
5
0
-5
-10
-15
-20
-25
Figure 8 Flat terrain. X-axis: Frequency. Y-axis: Excess attenuation in dB. Source height 0,4m, Re-ceiver height: 1,5m. Distance 25 m. Upper curves: Downwind, Lower curve: Upwind. Wind velocity (10 m height): 5 m/s Left figure: Hard terrain (asphalt). Right figure: Soft terrain (grass).
Usually the roads are paved with asphalt so the hard terrain situation (left figure) is the most relevant). It is seen that frequencies below 1 (2) kHz propagates well at 25 m (and shorter distances).

AV 1224/10 Page 24 of 65
11.2 Long range sound propagation
The graphs in Figure 9 and Figure 10 show the excess attenuation at a larger distance which is relevant for the annoyance of the neighbours.
p
32 63 125 250 500 1k 2k 4k 8k
10
5
0
-5
-10
-15
-20
-25
32 63 125 250 500 1k 2k 4k 8k
10
5
0
-5
-10
-15
-20
-25
Figure 9 Hard flat terrain without (left) and with (right) a sound barrier. X-axis: Frequency. Y-axis: Excess attenuation in dB. Source height 0,4 m, Receiver height: 1,5 m. Distance 200 m. Upper curves: Downwind, Lower curve: Upwind. Wind velocity (10 m height): 5 m/s Left figure: No Screen. Right figure: With noise barrier. 3 m height, 10 m from source.
p
32 63 125 250 500 1k 2k 4k 8k
10
5
0
-5
-10
-15
-20
-25
32 63 125 250 500 1k 2k 4k 8k
10
5
0
-5
-10
-15
-20
-25
Figure 10 Soft (grass) flat terrain without (left) and with (right) a sound barrier. X-axis: Freq. Y-axis: Excess attenuation in dB. Source height 0,4 m, Receiver height: 1,5 m. Distance 200 m. Upper curves: Downwind, Lower curve: Upwind. Wind velocity (10 m height): 5 m/s Left figure: No Screen. Right figure: With noise barrier. 3 m height, 10 m from source.
In general frequencies below 100-200 Hz should be avoided due to poor attenuation with distance.

AV 1224/10 Page 25 of 65
12. Appendix 4 - Sound insulation of facades The weak points in the sound insulation of facades are the windows so sound insulation of facades usually means the sound insulation of the windows. Idealized curves for the fre-quency dependency of the sound insulation of the five window types are shown in Figure 11. The curves are relative - the absolute values should not be compared.
Idealized sound reduction index
10
15
20
25
30
35
40
45
50
55
60
Hz
dB
I II III IV V
Figure 11 Idealized sound reduction indices for different types of window constructions: I: Old window with 3-4 mm panes (one layer only) II: New window with 4-15-4 mm IGU’s (insulating glass units) III: Fixed frame with laminated panes IV: Coupled sashes with sound insulating IGU’s on one side V: Deep window with separate sashes and sound absorbing lining in between.
It is seen, that for most window types the sound insulation increases with frequency above 100-200 Hz. Therefore frequencies below that range should be avoided to obtain the least noise from the warning sounds indoors.
AV 1224/10 Page 26 of 65
13. Appendix 5 – ICE vehicle noise characteristics For illustration of the noise characteristics of vehicles and the variation with speed, a few measurements have been performed on one selected car (“Danish measurements”). As ve-hicle noise depends on many variables such as vehicle make and type, driving style, tyre type, pavement type, temperature etc. the measurements does not give a complete picture of these issues. The car chosen for the measurements may be regarded as representative for a small modern car and may as such be used as a preliminary reference.
Other measurements have been performed in other countries. Some of these are more comprehensive and accurate than the measurements reported below and should therefore be taken into account when defining final reference levels for warning sounds.
13.1 Danish measurements
As mentioned, the data given here for ICE vehicles should ideally be more general and conclusive for average modern car makes, models and driving situations. This was not possible in the present project, so it has been chosen to give few examples instead. We have chosen a new Mitshubishi Colt as a reference car for these measurements. A few supplementary measurements have also been made on an older Skoda Fabia.
13.1.1 Measurement method and objects
The measurements were performed in measurement positions as described in “Appendix 6 - Measuring methods for sound characteristics” and Figure 12. Only the right hand side positions were used.
The reference car was a new Mitsubishi Colt 2010 Clear tech 1.3 with a 1332 cm3 petrol engine. A few additional measurements were made on an eight years old Skoda Fabia Combi 1,4 Classic with a 1397 cm3 petrol engine.
The asphalt on the measurement stretch was an older concrete asphalt (presumable AV8 T or similar type) see the inserted picture in Figure 12.
Brüel & Kjær measurement equipment (microphones, windscreen, preamplifiers and mi-crophone power supply) was used and the measurements were recorded and analysed with a NoiseLab measuring software, see reference [14]. The whole system was calibrated with an acoustic calibrator before and after the measurements. Vehicle speed was read with one decimal on a Garmin GPS navigator in the car. Engine rotation speed was read on the un-calibrated built-in revolution counter of the vehicles.

AV 1224/10 Page 27 of 65
Figure 12 Measuring site and setup for the “Danish measurements”.
13.1.2 Results
The A-weighted sound pressure levels of the unloaded motor sound measured in the FC position (see Appendix 6 - Measuring methods for sound characteristics) 2 m in front of the vehicles are shown in Figure 13.
It is seen from the figure that the noise levels from the engine increase with the rotational speed. It is also seen that the noise levels from the new Mitsubishi Colt are 2-7 dB lower than the levels from the eight years old Skoda Fabia. The sound levels from the starter mo-tors are also shown in the figure. They are 10-15 dB louder than the engine idle noise.

AV 1224/10 Page 28 of 65
y = -2E-06x2 + 0,0155x + 43,083
50
55
60
65
70
75
0 500 1000 1500 2000 2500 3000 3500
Rotations pre minute, PRPM
Soun
d Pr
essu
re le
vel,
dB(A
)
Skoda Fabia 2003Mitsubishi Colt 2010Skoda Fabia StarterMitsubishi Colt StarterPoly. (Mitsubishi Colt 2010)
Figure 13 Starter sounds and engine noise measured at the centreline 2 m in front of the cars (FC position). A-weighted sound pressure levels (LAeq) as function of the engine rotations per minute.
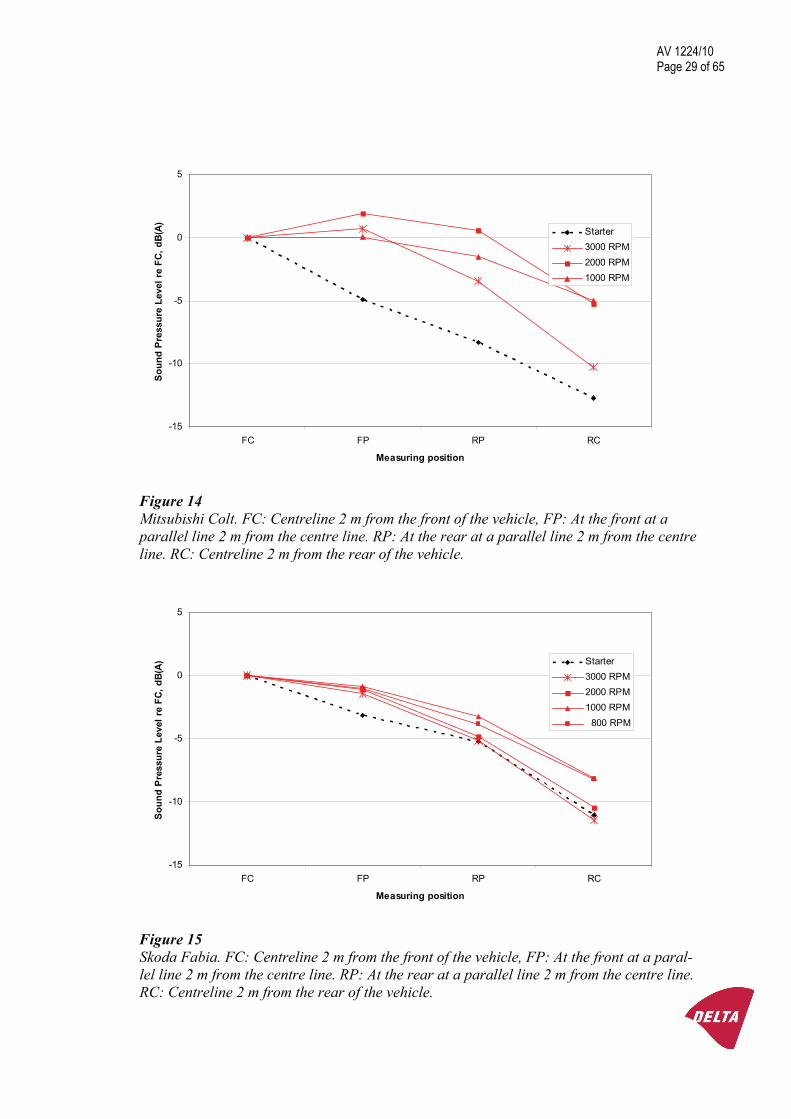
Figure 14 and Figure 15 show the sound level differences in the various measuring posi-tions. Due to the short measuring distances the results are not to be regarded as a directiv-ity pattern as the different distances to the sound sources account partly for the measured sound pressure levels.
Except for the starter noise it is seen that the noise levels in the front side positions are al-most the same as the front position levels and it is seen that the rear levels are less. For warning sound systems a more pronounced directivity can be obtained.
AV 1224/10 Page 29 of 65
-15
-10
-5
0
5
FC FP RP RC
Measuring position
Soun
d Pr
essu
re L
evel
re F
C, d
B(A) Starter
3000 RPM2000 RPM1000 RPM
Figure 14 Mitsubishi Colt. FC: Centreline 2 m from the front of the vehicle, FP: At the front at a parallel line 2 m from the centre line. RP: At the rear at a parallel line 2 m from the centre line. RC: Centreline 2 m from the rear of the vehicle.
-15
-10
-5
0
5
FC FP RP RC
Measuring position
Sou
nd P
ress
ure
Leve
l re
FC, d
B(A
) Starter3000 RPM2000 RPM1000 RPM 800 RPM
Figure 15 Skoda Fabia. FC: Centreline 2 m from the front of the vehicle, FP: At the front at a paral-lel line 2 m from the centre line. RP: At the rear at a parallel line 2 m from the centre line. RC: Centreline 2 m from the rear of the vehicle.
AV 1224/10 Page 30 of 65
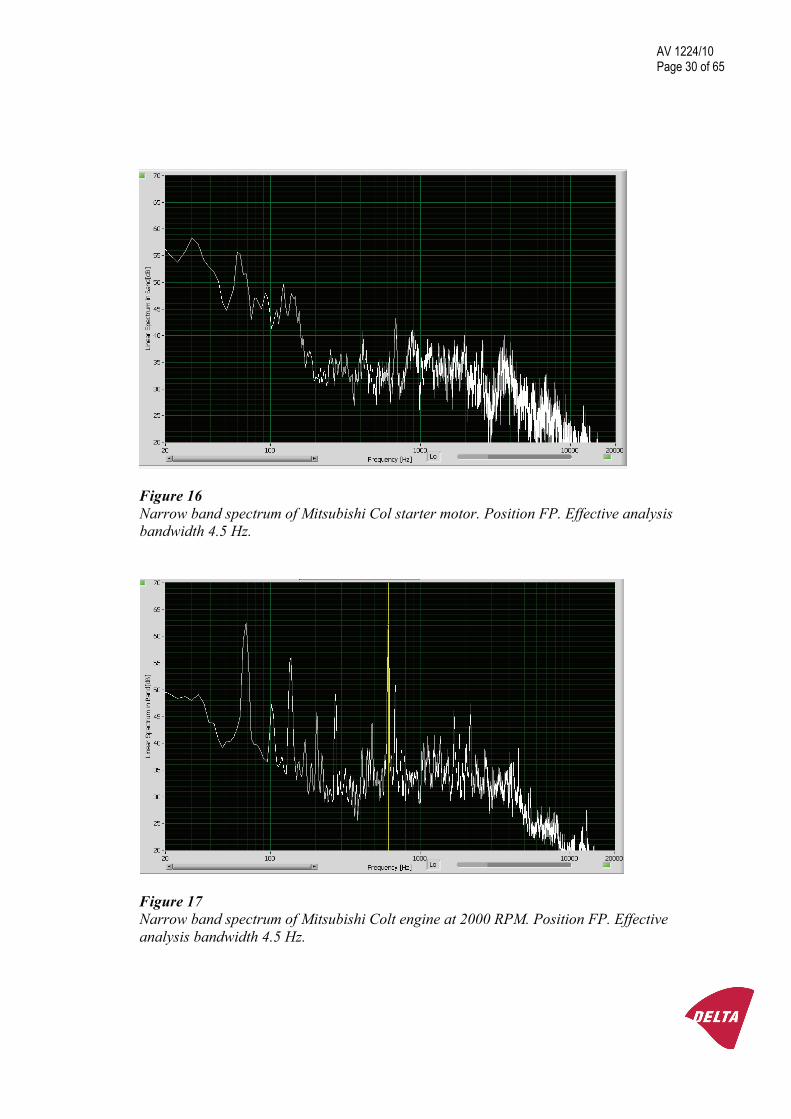
Figure 16 Narrow band spectrum of Mitsubishi Col starter motor. Position FP. Effective analysis bandwidth 4.5 Hz.
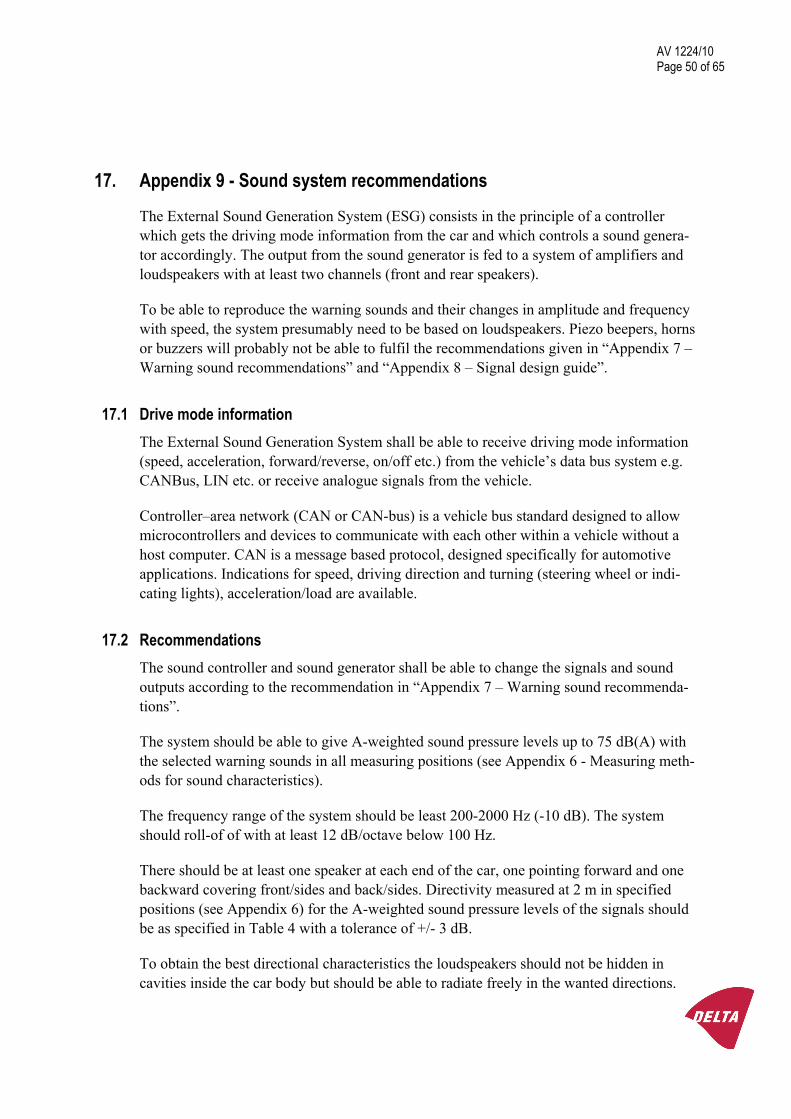
Figure 17 Narrow band spectrum of Mitsubishi Colt engine at 2000 RPM. Position FP. Effective analysis bandwidth 4.5 Hz.

AV 1224/10 Page 31 of 65
Figure 18 Narrow band spectrum of background noise. Position FP. Effective analysis bandwidth 4.5 Hz.
Figure 19 Mitsubishi Colt engine sound at 2000 rpm. Same spectrum as Figure 17 but tones accord-ing to ISO 1996-2, reference 14, are coloured red.

AV 1224/10 Page 32 of 65
40
50
60
70
80
0 5 10 15 20 25 30 35 40 45Speed, km/h
Soun
d Pr
essu
re L
evel
, dB
(A)
Total vehicle noiseEngine noise calc. from RPMEngine noise calc. from SPL diff.Tyre noise
1. gear 2. gear 3. gear
Figure 20 Pass by noise. Maximum A-weighted sound pressure levels with time weighting F meas-ured in position FP, 2 m to the side from the centreline of the vehicle.
40
50
60
70
80
0 10 20 30 4Speed, km/h
Sou
nd P
ress
ure
Leve
l, dB
(A)
0
Total vehicle noiseTyre noiseEngine noise
1. gear 2. gear3. gear
Figure 21 Same data as Figure 20 but now the engine sound is the average of the two blue curves.

AV 1224/10 Page 33 of 65
From the spectra in Figure 16 to Figure 19 it can be seen that the starter motor in Figure 16 has a different spectrum with more pronounced broad band characteristics than the engine sound shown in Figure 17. For both spectre components below approximately 50 Hz shall be disregarded as it is caused by background noise, see Figure 18.
Figure 19 shows that the engine sound is dominated by a number of tones on a background of broad band noise from the engine.
Figure 20 and Figure 21 show the vehicle pass by noise. A silent driving mode, with a shift to 2’nd gear above 20 km/h is chosen. In Figure 20 two curves for the engine noise is shown. One curve is based on the measurements of the unloaded engine noise as shown in Figure 13 and the other curve is calculated from the difference between the total vehicle noise and the tyre noise. There are some uncertainties in both methods so the average as shown in Figure 21 may be more accurate.
It is seen, that up to 20 km/h the engine noise is dominating and above 25 km/h the tyre noise is dominating. This means that the tyre noise, which is common for both ICE vehi-cles and electric vehicles is sufficient above this speed, so no extra sound is needed for the electric vehicles at higher speeds.
Actually the purpose of the warning sound is to make the electric vehicles as audible as ICE vehicles, which basically means that the warning sound should be as audible as the internal combustion engine.
It is seen form Figure 21 the level of the engine noise increases 6 dB per 5 km/h in the range 5-20 km/h.
13.2 Japanese measurements
A set of Japanese measurements are reported in reference [10]. The measuring setup is shown in Figure 22 and some of the results are shown in Figure 23.

AV 1224/10 Page 34 of 65
Figure 22 Measuring setup for the Japanese measurements.
20
30
40
50
60
70
0 10 20 3
km/h
Sou
nd p
ress
ure
leve
l, dB
(A)
0
HV (EV Mode)ICEV Total Av.ICE-motor onlyPoly. (ICEV Total Av.)Poly. (HV (EV Mode))Linear (ICE-motor only)
Figure 23 Japanese results as read from one of the graphs in reference [10]. The total noise is the average of two ICE vehicles measured. The tyre noise is the noise from an electric vehicle and the motor noise for the ICE is calculated on basis of the difference of these two re-sults.

AV 1224/10 Page 35 of 65
40
50
60
70
80
0 5 10 15 20 25 30 35 40Speed, km/h
Soun
d Pr
essu
re L
evel
, dB
(A)
Total vehicle noiseEngine noise calc. from RPMTyre noiseTotal ECEV noise (Japan)ICE motor only (Japan)EV (tyre) noise (Japan)Poly. (ICE motor only (Japan))Poly. (Total ECEV noise (Japan))
Figure 24 Comparison of Danish (full line) and Japanese (dashed line) results.
From the picture in Figure 22 it looks like one of the vehicles is a Lexus 403 which is a very quiet vehicle with internal combustion engine. The results from the Japanese and the Danish measurements can be compared directly as the measuring distances are the same. The comparison is shown in Figure 24.
It is seen that the tyre noise in the two measurement series are alike, but that the engine noise levels are considerably lower in the Japanese measurements, which confirms that these comes from a rather quiet vehicle. For that vehicle the tyre noise is dominating al-ready above 20 km/h.
13.3 Other measurements
Two other series of more comprehensive and probably also more accurate results should be mentioned here.
In reference [21] from 2010 the authors present previously unpublished data on noise emission levels for road vehicles which may be considered as "quiet". Special concern is given to noise at speeds below 20 km/h where it is expected that the problem might be the worst and where data were missing previously.

AV 1224/10 Page 36 of 65
Reference [13] documents the overall sound levels and general spectral content for a selec-tion of hybrid-electric and internal combustion vehicles in different operating conditions, evaluates vehicle detectability for two ambient sound levels, and considers countermeasure concepts that are categorized as vehicle-based, infrastructure-based, and systems requiring, vehicle-pedestrian communications. The study concludes that a warning sound that emu-lates the ICE vehicles is the most optimal countermeasure, which meets the need for in-formation about vehicle position, speed and rate of change in speed.
13.4 Conclusions
We have seen results with higher noise levels (the old Skoda Fabia) and results with lower noise levels (the Japanese results) than the selected reference car. Even if this is a rather sparse basis it indicates that the chosen reference car for the Danish measurements is rea-sonable.
Therefore we take the Danish results as a preliminary reference.
Other more comprehensive measurements of vehicle noise exist. Those should be taking into account at a later stage.
We have found that the tyre noise is dominating compared to the engine sound at speeds above 20-25 km/h. Therefore a warning sound, making electric vehicles equal audible as the internal combustion engine, emitted from an external sound generation system need only be active below that speed range.
Also the engine noise level changes with speed have been described. This is relevant in-formation for the design of pedestrian warning sounds.

AV 1224/10 Page 37 of 65
14. Appendix 6 - Measuring methods for sound characteristics The international Standards Organisation (ISO technical committee ISO/TC 43/SC 1/WG 42) and the Society for Automotive Engineers (SAE committee TEITSSHF1 on Vehicle Sound for Pedestrians) are presently working on standards for the measurements of mini-mum noise emitted by road vehicles. For the time being (March 2011) drafts exist that de-scribes measurement conditions, procedures, positions etc, see reference [8].
The measuring methods proposed in this Appendix are intended to be supplementary to the above mentioned methods.
For the purpose of measuring the directional characteristics as recommended in “Appendix 9 - Sound system recommendations” of an external sound generation system a number of additional (relative to the ISO proposal) measuring positions are proposed. These are marked in red in Figure 25.
RP’
FC RC
FP RP
FP’ RP’
FC RC
FP RP
FP’ RP’
FC RC
FP RP
FP’
Figure 25 Measuring positions for documentation of the sound emissions. The microphones are posi-tioned 1.2 m above the road surface. Extra positions relative to the ISO draft proposal in reference [8] are coloured red.
The measuring positions are meant to be used as stated in Table 2 with the external sound generation system installed. For the stand measurements the idle sound shall be measured

AV 1224/10 Page 38 of 65
and if it is possible to give input to the ESG system to simulate driving also the warning sound at 10 km/h should be measured.
ICE vehicle Electric vehicle
FC FP FP’
RP RP’ RC FC FP
FP’ RP RP’ RC
Start sound x x x x x x x x
Idle, Forward x x x x x x x x
Idle, Reverse - - - - x x x x
Drive, Forward - x - - (x) x x (x)
Drive, Reverse - - - - (x) x x (x)
Table 2 Measuring positions for different drive modes and warning sounds (see Sound pressure levels.
When dBALICE is determined for the signals (see Appendix 10 – Determination of Equal audibility as ICE motor sounds) it should be verified that the specified A-weighted sound pressure levels of the warning sounds are obtained within +/- 3 dB in the FC position for the drive sound and in the RC position for the drive plus reverse sound. The sound pres-sure levels for the drive and reverse sounds should be measured with a signal correspond-ing to 10 km/h.
14.1 Directivity of the external sound generation system
With the idle forward sound (and with the driving sound at 10 km/h if it is possible to simulate driving) it is controlled from the measurements if the recommendation in Table 4 is fulfilled for the A-weighted sound pressure levels (LAeq) of the signals with a tolerance of +/- 3 dB.

AV 1224/10 Page 39 of 65
14.2 Driving mode measurements
Signal characteristics (sound pressure levels and frequencies as specified in Appendix 7 – Warning sound recommendations) shall be verified at least for the speeds 5, 10, 15, 20 and 25 km/h.
For the driving mode measurements two possibilities exist:
14.2.1 Simulated driving
If the controller of the sound system makes it possible to generate signals corresponding to driving at the specified speeds without driving, then the measurements can then be per-formed as stand measurements.
If this is not possible the following possibility may be used.
14.2.2 Real driving with microphone mounted at the car
For the purpose of verifying the frequency and level changes during driving, a microphone may be mounted at the car in front of a speaker of the external sound generation system in a distance of 10-20 cm. The difference in sound pressure levels between this car-mounted microphone and the FC position shall be measured in the stand measurements. This differ-ence shall be used to correct the measurements during driving to the FC and RC positions
14.3 Analysis
From the measurements it shall be verified if the relation the relation between the A-weighted sound pressure levels and the speed is in accordance with the recommendation in section 15.2, Figure 26, with a tolerance of +/- 3 dB.
The warning sounds from each of the driving speeds shall be analyzed with a FFT-analysis with an analysis bandwidth of 2-4 Hz at least in the range 20 Hz-10 kHz. An averaging time of 30-60 sec for each measurement shall be used to ensure sufficient accuracy.
The main components (the frequency bands with the highest levels) in the range 200-1000 Hz shall be identified in the spectra corresponding to each driving speed and it shall be verified that the pitch shift, i.e. the relation between speed and frequency is in accor-dance with the recommendation in section 15.2, Figure 27, with a tolerance of +/- 3%1.
1 A 6% change of frequency corresponds in musical terms to a semitone.

AV 1224/10 Page 40 of 65
15. Appendix 7 – Warning sound recommendations
15.1 Signal types This section aims to provide guidelines for suitable warning sounds, i.e. signals with suffi-cient audibility, good localisation and recognition of vehicles and their manoeuvres with minimum sound pressure levels and annoyance for the surroundings.
In order to be recognisable and useful the sound should give information similar to the in-formation pedestrians receive from sounds emitted by vehicles with internal combustion engines. The audibility in background noise of the warning sounds should be similar to the sound from an internal combustion engine.
The following types of sounds are relevant:
− Start sound: A short (1-2 sec) omni-directional sound indicating that the car is prepar-ing to drive. An “attention catcher”. It may be a separate sound or the idle sound with a level increase of 10-15 dB.
− Idle sound: A stationary sound with constant frequency/pulse rate indicating that the car may move any moment or is moving slowly. The idle sound is the same as the drive sound at its lowest frequency.
− Drive sound: The same as the idle sound, but modulated with the speed. The sound pressure level shall vary with speed as specified in section 15.2. The Frequency of characteristic components (frequency of any tones, pulse rate for impulsive compo-nents or prominent frequency bands for broad band sounds) shall vary with speed (see section 15.2). Additional sound characteristics may be added (e.g. the mimicking the sound from tyres on ravel with increasing average pulse rate with random fluctua-tions).
− Reverse sound: A sound or a sound characteristic that is added to the driving sound indicating that the vehicle is driving backwards. The sound shall be easy to localise i.e. with broad band characteristics, multi-tones, pulses etc. The single frequency beepers known from trucks and vans are not recommended. They are difficult to lo-calize, often to loud and many find them annoying.

AV 1224/10 Page 41 of 65
15.2 Warning sound specifications
The usage of the different warning sounds is specified in further details in Table 3.
Sound Driving mode Speakers Duration Level Message
Start sound
Turning power on Front + rear Max
2 sec
dBALICE ≅ 61-66 dB(A)
ICE
Active car near by
Idle sound
When speeder is activated.
Front when “gear” in forward.
Rear when “gear” in reverse
Speed 0-5 km/h
dBALICE ≅ 51 dB(A) ICE
Car beginning to drive
Drive sound
Speed above 5 km/h
Front when “gear” in forward.
Rear when “gear” in reverse
Speed 5-30 km/h
See Figure 26
Driving car
Reverse sound
When speeder is activated
Rear when “gear” in reverse
Speed 0-30 km/h
See Figure 26* Backing car
Table 3 Warning sounds for the external sound generation system and their usage. dBALICE is the A-weighted sound pressure level needed for a warning sound, to give same audibility as a reference Internal Combustion Engine sound with the stated levels. *When the reverse sound is added to the drive sound the level increase shall be less than 3 dB(A).

AV 1224/10 Page 42 of 65
15.2.1 Levels and level changes
40
50
60
70
80
0 10 20 30 4
Speed, km/h
Leve
l, dB
ALI
CE
0
Figure 26 The level of the external sound as function of speed in measuring positions FC and RC (see Appendix 6 - Measuring methods for sound characteristics). dBALICE is the sound pressure level of a warning sound, with the same audibility as a reference Internal Com-bustion Engine sound with A-weighted sound pressure levels as indicated in the figure - in a specified background noise (see Appendix 10 – Determination of Equal audibility as ICE motor sounds).
The recommended level changes will be recognized by comparison with Figure 21 in Appendix 5 – ICE vehicle noise characteristics.
The sound pressure level from the ICE reference car at 10 km/h is LAeq = 60 dB. For some warning sounds with the same audibility, the A-weighted sound pressure levels, dBALICE, may be 5-10 dB lower than for the reference car.
15.3 Signal frequency range and pitch shift
The following recommendations apply:
− The essential frequency components shall be in the range 200-1000 Hz. For the driving sound this applies in the speed range 5-20 km/h
− Other components are allowed in the range from 100 Hz and up.
− No signal components are allowed below 100 Hz.

AV 1224/10 Page 43 of 65
The frequency f of characteristic components (frequency of any tones, pulse rate for im-pulsive components or the amplitude modulation frequency, prominent frequency bands for broad band sounds) shall vary with speed as indicated below:
0-5 km/h: Stationary frequency Idleff =
Above 5 km/h: 5Idlefvf ⋅=
This is illustrated for tones in Figure 27. From the figure it is seen that if the main compo-nent lies between the two green curves, then their frequencies will be within the recom-mended range 200-1000 Hz in the speed range 5-20 km/h. The lowest blue curve does not satisfy this and need a higher harmonic component. The upper blue curves do not fulfil the recommendation either and needs a lower component.
Figure 27 Recommended frequency variation of essential signal components with speed.

AV 1224/10 Page 44 of 65
As an option the sound character may indicate the motor load during acceleration and or deceleration.
15.4 Driver controls
15.4.1 Pause Switch
In accordance with reference [11] the following is recommended:
Devices for Approaching Vehicle Alert may be equipped with a mechanism to temporarily halt the operation of the device (hereinafter, the “Pause Switch”). However, when a Pause Switch is installed, an indicator showing to the driver that the Device for Approaching Ve-hicle Alert is suspended shall be installed.
Furthermore, even when a Device for Approaching Vehicle Alert is suspended by the Pause Switch, a setup shall be provided so that the Device will not remain suspended.
Further, the Pause Switch shall be easily recognized and operated by the driver in a normal position.
15.4.2 Pedestrian horn
A device may be provided that momentarily allows the driver to increase the emitted sound by 10 dB. The purpose is to create attention from inattentive pedestrians in a more “polite” way than using the horn.
15.5 Signal characteristics The sounds generated shall be sounds that people intuitively will recognize as coming from a vehicle. The driving sound should possess the same characteristics i.e. increasing frequency and level with increasing speed as the ICE motor. It may be ICE sounds, more futuristic vehicle sounds etc.
The sound may contain impulses and tones but it should not be musical sounds. Any tones or prominent frequencies not modulated by the speed should be at standard musical fre-quencies.
The kinds of sounds listed below or similar sounds shall in accordance with reference [11] be deemed inappropriate:
− Siren, chime, bells or melody
− Horn sound
− Sound generated by animals and/or insects such as birdsongs, etc

AV 1224/10 Page 45 of 65
− Sound of natural phenomenon such as wave, wind, river current, etc
− Any other sound that cannot be conceived as being generated by motor vehicles based on a common sense
− Sounds that can be confused with warning sounds from emergency vehicles or other types of warning sirens or alarms.
The start sound and the reverse sound may contain a limited number of successive tones.

AV 1224/10 Page 46 of 65
16. Appendix 8 - Signal design guide
16.1 Purpose of external warning sounds
The purpose of the sounds is to give pedestrians and cyclists acoustic cues from vehicles to get information about vehicle presence, vehicle position, vehicle direction of travel, speed and vehicle rate of acceleration.
For ICE vehicles at low speeds these cues comes from the engine sound which is dominat-ing below approximately 20 km/h. The external sound generation system for electric cars should give similar cues as the engine sound. The sound should mimic (some of) the char-acteristics of an engine sound.
It is not the intension that the sounds should be audible under all background noise condi-tions. The audibility should be the same as for an average ICE car. For that purpose a ref-erence ICE car engine sound is defined.
16.2 Types of sounds
This part gives guidelines on signal design. There are a number of important objectives for good signals, they should:
− be suitable and intuitively recognisable as vehicle sounds.
− give minimum annoyance and environmental noise.
− be audible under specified background noise situations with good localisation.
− give information of vehicle driving direction (forward/reverse), speed and speed changes.
In order to be recognisable and useful the sound should give information similar to the in-formation pedestrians receive from sound emitted by vehicles that use internal combustion engines.
The sounds should be optimized for audibility, suitability and annoyance as described in “Appendix 10 – Determination of Equal audibility as ICE motor sounds” and “Appendix 11 – Measuring method for annoyance and suitability”.

AV 1224/10 Page 47 of 65
As described in “Appendix 7 – Warning sound recommendations” four types of sounds may be relevant:
− A start sound
− An idle sound
− A driving sound
− A reverse sound.
The driving sound is the same as the idle sound but modulated with the speed above 5 km/h. Additional sound characteristics (e.g. simulating tyres on ravel) may be added to the driving sound. The usage of these sounds is described in section 15.2.
Sounds coming from the same vehicle should be perceived as similar and as coming from the same source to avoid confusion if several cars are operating nearby.
16.3 Main Characteristics
The sounds should fulfil the recommendations to amplitudes and frequencies as specified in “Appendix 7 – Warning sound recommendations”.
16.3.1 Recognition and localisation
The sound generated shall be sounds that people intuitively will recognize as coming from a vehicle. Many sounds will fulfil this requirement when they are amplitude and frequency modulated with speed as described in “Appendix 7 – Warning sound recommendations”, bee aware of the list of inappropriate sounds listed in section 15.5.
The sounds should be easy to localize. This is obtained by:
− Broad band characteristics
− Multiple-tones
− Short or impulsive sound elements (sudden/sharp onsets and/or offsets)
Besides that, each of the sound types should have special characteristics specified below.
16.3.2 Start sound
The purpose is to catch attention. The sound should give the same connotations as the starter motor of an ICE vehicle. It is indicating that there is an “active” car near you that is preparing to drive. It is a short sound (max 2 sec) that on one side may be used for brand-

AV 1224/10 Page 48 of 65
ing purposes but on the other side shall be intuitively perceived as a car (start) sound. The idle sound with a 10-15 dB level increase may be used.
16.3.3 Idle and drive sound
The idle and drive sounds are identical below 5 km/h where the sound has a (nearly) con-stant amplitude and frequency. Small random variations may be introduced to give a less monotonic and more “organic” impression.
The drive sound should posses the same characteristics i.e. increasing frequency and level with increasing speed as the ICE motor sounds. It may be ICE sounds, more futuristic ve-hicle sounds etc. The sound may contain impulses and tones but it should not be musical sounds.
The characteristics of ICE vehicle sounds are:
− Changing frequency/pulse rate with speed
− Increasing level with speed
− Change of timbre with motor load
Sounds which at first hand may be considered inappropriate may turn out be useful when they are modulated according to the above mentioned principles.
The frequency of characteristic components (frequency of any tones, pulse rate for impul-sive components or the amplitude modulation frequency, prominent frequency bands for broad band sounds) shall vary with speed as indicated in section 15.2.
16.3.4 Reverse sound
The reverse sound is meant to be sound characteristics or separate sounds indicating re-verse driving that are added to the drive sound. It may be
− Characteristics similar to the hauling of the reverse gear
− Pings or similar sounds, short tone sequences etc with a repeat rate of 0.5 to 1 per sec-ond.
The single frequency beepers known from trucks and vans are not recommended.

AV 1224/10 Page 49 of 65
16.4 General characteristics
The sounds should not be a “clear out” or “scram” type of sounds but a more polite “Here is an electric vehicle, please pay attention” type of sound.
The sounds shall be suitable for frequency changes with speed (“pitch shift”) or change of pulse rate with speed or both.
By varying pitch, timbre, intensity and envelope may different sound can be created.
The sounds should not be monotonous: Sounds coming from a signal generator giving constant frequency and levels or looped signals with short repetition rate is perceived as a very monotonic and artificial. Superposition of small random variations will make it less monotonous and acceptable. These variations may also be generated from dynamic vehi-cles parameters (like speed, steering angle, gear etc.) to form a more “organic” sound.
Recorded sounds from some sort of electric vehicle, from electric motors may be useful either direct or in a modified/edited version.
The sound may consist of (combinations of) tones, repetitive impulses, prominent fre-quency bands and broad band sounds. The sound should be concentrated on e limited number recognisable and characteristic elements so it not confused with other vehicles nearby.
The drive sound should contain some continuous elements. If it is only “Staccato”-elements the sound will be perceived as chopped into pieces.
The sounds may be composed from a number of tones which may contain natural harmon-ics. A fundamental frequency and a tone at 1.5 times that frequency (the fifth) may be per-ceived with a pitch one octave lower than the fundamental (a virtual fundamental). A combination of a fundamental and a tone at 2.5 times that frequency (an interval of the oc-tave plus the major third) may be perceived as pleasant.
Addition of noise e.g. shaped to specified “keyed in” frequency bands will help to recog-nize the sound as coming from a vehicle and localize its position.
The sound itself should not contain reverberation or echoes to prevent confusion.
AV 1224/10 Page 50 of 65
17. Appendix 9 - Sound system recommendations The External Sound Generation System (ESG) consists in the principle of a controller which gets the driving mode information from the car and which controls a sound genera-tor accordingly. The output from the sound generator is fed to a system of amplifiers and loudspeakers with at least two channels (front and rear speakers).
To be able to reproduce the warning sounds and their changes in amplitude and frequency with speed, the system presumably need to be based on loudspeakers. Piezo beepers, horns or buzzers will probably not be able to fulfil the recommendations given in “Appendix 7 – Warning sound recommendations” and “Appendix 8 – Signal design guide”.
17.1 Drive mode information The External Sound Generation System shall be able to receive driving mode information (speed, acceleration, forward/reverse, on/off etc.) from the vehicle’s data bus system e.g. CANBus, LIN etc. or receive analogue signals from the vehicle.
Controller–area network (CAN or CAN-bus) is a vehicle bus standard designed to allow microcontrollers and devices to communicate with each other within a vehicle without a host computer. CAN is a message based protocol, designed specifically for automotive applications. Indications for speed, driving direction and turning (steering wheel or indi-cating lights), acceleration/load are available.
17.2 Recommendations The sound controller and sound generator shall be able to change the signals and sound outputs according to the recommendation in “Appendix 7 – Warning sound recommenda-tions”.
The system should be able to give A-weighted sound pressure levels up to 75 dB(A) with the selected warning sounds in all measuring positions (see Appendix 6 - Measuring meth-ods for sound characteristics).
The frequency range of the system should be least 200-2000 Hz (-10 dB). The system should roll-of of with at least 12 dB/octave below 100 Hz.
There should be at least one speaker at each end of the car, one pointing forward and one backward covering front/sides and back/sides. Directivity measured at 2 m in specified positions (see Appendix 6) for the A-weighted sound pressure levels of the signals should be as specified in Table 4 with a tolerance of +/- 3 dB.
To obtain the best directional characteristics the loudspeakers should not be hidden in cavities inside the car body but should be able to radiate freely in the wanted directions.

AV 1224/10 Page 51 of 65
Relative dB FC FP/FP’ RP/RP’ RC
Front speaker(s) 0 -3 -8 <-12
Rear speaker(s) <-12 -8 -3 0
Table 4 Directivity recommendations. At least two speakers one pointing forward and one pointing backward are necessary1. For measuring positions see Appendix 6.
The acoustic output from the external sound generation system should be independent of battery voltage within a tolerance of +/- 1 dB.
17.3 Optional characteristics − One speaker may be installed at each “corner” of the car, covering front/side and
back/side. If the car is turning only the relevant right/left speaker is could be sound-ing.
− Short term driver suppression of sound as described in section 15.4.
− Pedestrian horn as described in section 15.4.
− Beamforming techniques for the sound combined with pedestrian/cyclist detection.
− Level dependence of signals based on background noise levels and spectra.
− Input from pedestrian/cyclist detection system, could change the signal characteristics and volume in accordance with the vehicle's distance from pedestrians, crowd density and surrounding noise.
1 The company iCapture, www.icapture.dk has verified by modelling of speakers built into the bumpers
of a car that these recommendations can be met.

AV 1224/10 Page 52 of 65
18. Appendix 10 – Determination of Equal audibility as ICE motor sounds In this Appendix a listening test method for finding the equal Audibility Level as an Inter-nal Combustion Engine, dBALICE, for a warning sound is described.
18.1 Scope
At low speeds electric vehicles are significantly more silent than vehicles with an internal combustion engine (ICE) due to the absence of the motor sound. To warn pedestrians and cyclists the electric vehicles may be equipped with an acoustic warning signal. This should have the same audibility as the motor sound from ICE vehicles. It should not be more au-dible due to environmental noise considerations. As for the motor sounds the warning sounds will not be audible under all circumstances.
It is found that signals with the same audibility in background noise may have A-weighted sound pressure levels that differ more than 10 dB. If the intensity of the signals is guided by the A-weighted sound pressure levels only, this imposes the risk of the signals either being insufficient audible or being unnecessary annoying in the environment. Therefore a test that establishes equal audibility levels in background noise is needed.
This test described here is a listening test method following the main principles defined in ISO 4120, triangle test. It is a robust test method that requires only simple instructions and training of the test persons.
18.2 Purpose of the listening test
The purpose of the listening test is to find the A-weighted detection threshold sound pres-sure level for a signal in a simplified background noise. The detection threshold is defined as the signal level where there is 50 % probability for detection of the signal. The thresh-old level for the signal can then be compared to the threshold level of the reference ICE vehicle noise (low pass filtered at 2 kHz1) to define the A-weighted sound pressure level of the signal that has the same audibility as the ICE reference car noise.
1 To prevent that the reference car sound and the warning signals are detected by frequencies that may
not be heard by elderly persons and persons with noise induced hearing loses, the signals shall be low pass filtered with a sharp (more than 48 dB/octave) low pass filter at 2 kHz.
The low pass filtering at 2 kHz of all sounds in this audibility test means that field tests performed with normal hearing persons will give other results with comparison with a real reference car, as the sound from the real car cannot be low pass filtered.
AV 1224/10 Page 53 of 65
18.3 Test signals and samples
The signals to be used for the test are:
− A simplified background noise (i.e. pink noise which is frequency weighted as speci-fied in section 18.10 Simplified background noise). The noise is played back at an A-weighted sound pressure level of 55 dB.
− The signal under test, i.e. the external sound signal either recorded from the external car speakers or the signal from the warning signal generator frequency weighted according to the frequency characteristic of the sound system measured at the FC position (see Appendix 6 - Measuring methods for sound characteristics). The test signal shall be the signal emitted at a constant speed of 10 km/h low pass filtered at 2 kHz.
− A reference ICE car sound. (Pt. the reference sound is a recording in the FC position, see Figure 25 of a Mitsubishi Colt ClearTec 1.31 internal combustion engine at 1160 rmp corresponding to a speed of 10 km/h -1’rst gear). The reference ICE car sound shall be low pass filtered at 2 kHz.
For a start a preliminary threshold level LAeq signal(preliminary Pd50%) for the signal in the simplified background noise should be found by adjusting the level of the signal so it is deemed just audible by a person with normal hearing.
A number of sample sounds (besides the simplified background noise alone) should then be prepared by mixing the simplified background noise with the signal at 7 different levels of +9, +6, +3, 0, -3, -6 and -9 dB relative to the preliminary threshold level for the signal.
Each sample should have duration of at least 5 seconds. Each sample may be looped dur-ing the presentation.
18.4 Listeners
10 normal hearing listeners should be recruited for the listening test.
Prior to the test the listeners shall be instructed and trained in the test methodology.
1 This car was chosen for pragmatic reasons: It is a modern gasoline car of a size similar to many elec-
tric vehicles and it was available during the project. See A. Further considerations on the reference ICE motor sound should be made.
ppendix 5 – ICE vehicle noise characteris-tics

AV 1224/10 Page 54 of 65
18.5 Presentation of the sound samples
The sound samples should be presented monaural over calibrated headphones in a silent environment without disturbances.
18.6 Test design
For each signal to be tested the listening session is divided into a number of test rounds. Each test round consists of a block of signals with the same signal level. In each block the following six combinations (triads) of samples should be presented:
A B B B A B B B A B A A A B A A A B
Where sample A consist of the signal plus simplified background noise and sample B is the simplified background noise only. The listener’s task is to identify the sample in each triad that is different from the two other signals. The order of presentation of the triads above shall be randomized from block to block and from one listener to another.
The first block shall be performed with the loudest signal (+9 dB re the preliminary threshold, see clause 18.3) and the succeeding test rounds shall be with decreasing signal levels.
Score sheets on paper or computer interfaces may be used for collecting the answers. A computer graphical user interface as shown in Figure 28 may be used.
Figure 28 Example of a graphical user interface for a triangle test. The A, B, and C buttons are play-buttons and the answer is given by a mark in the field below. Pressing a play button will stop the present sound and a play the sound corresponding to the button pressed. The Save button bring you to the next triad of samples.

AV 1224/10 Page 55 of 65
The test duration per signal and per test person is estimated to approximately 10 minutes.
One of the signals should be the reference car sound that can be downloaded from www.madebydelta.com/senselab.
18.7 Data analysis
For each of the signals the analysis is performed as described in this section. If several sig-nals are under test, the analysis shall be repeated for each signal under test.
At first, the correct answers for each listener, i, in each block (i.e. each signal level, j) are counted. From the number of correct answers, the percentage of correct answers Pci,j in a block is calculated with the following general formula:
Pci,j = (Number of correct answers ij / 6)*100
where 6 is the number of combinations in each block.
From the percentage correct answers the detection probability for each signal level and for each listener can be estimated as:
Pdij = 1.5⋅Pcij – 50
Due to random variations negative numbers may appear.
The average values, Pdaverage, j for all 10 listeners per signal level are calculated (unless there are good reasons to define some of the individual results as outliers).
The relationship between the signal level and the probability of detection Pdaverage, j is as-sumed to be logistic, see Figure 29.

AV 1224/10 Page 56 of 65
0
20
40
60
80
100
-15 -10 -5 0 5 10 15
Level re. prelim. threshold, dB
Det
ectio
n pr
ecen
tage
Figure 29 Theoretical example of a result of a listening test. The relative level for 50 % detection, ΔL(Pd50%) is shown with arrows.
The sound pressure level relative to the preliminary threshold level ΔL(Pd50%) may be read directly from the graph or the level may be calculated from a transformation of the graph as described below.
The results may be linearized by transforming them with the logit function:
Logit(Pdij)=ln(Pdij /(100- Pdij))
The result of the transformation is shown in Figure 30.

AV 1224/10 Page 57 of 65
y = 0,362x + 0,305
-4
-3
-2
-1
0
1
2
3
4
5
-15 -10 -5 0 5 10 15
Level re. prelim. threshold, dB
Logi
t (D
etec
tion
perc
enta
ge)
Figure 30 The same data as in Figure 29 but transformed with the logit function. The level for 50 % detection is shown with arrows.
The equation for the best linear fit (found by linear regression) is shown in Figure 30.
The level ΔL(Pd50%) for the 50 % detection threshold Pd50% can be found by:
ΔL(Pd50%) = - b/a [dB relative to the preliminary threshold level]
where a and b are the constants for the line y=ax+b as shown in Figure 30.
18.8 Test results
The A-weighted level for 50% detection of a signal in the simplified background noise is found from:
LAeq signal(Pd50%) = LAeq signal(preliminary Pd50%)+ΔL(Pd50%)
The A-weighted levels needed in practice to give the same audibility as the real reference car, i.e. the equal Audibility Level as an Internal Combustion Engine, dBALICE, can be cal-culated from:
dBALICE = LAeq reference car – (LAeq reference car (Pd50%)- LAeq signal(Pd50%))

AV 1224/10 Page 58 of 65
where LAeq reference car is the LAeq of the reference ICE car motor noise corresponding to a speed of 10 km/h measured at position FC (see Appendix 6 - Measuring methods for sound characteristics).
LAeq reference car = 60 dB for the Mitsubishi Colt ClearTec 1.3 internal combustion engine (ICE) reference car at 1160 rpm (corresponding to a speed of 10 km/h in 1’rst gear).
Example on results from a listening test is shown in Table 5.
The measurement uncertainty is estimated to be of the magnitude +/-2 dB.
Signal
Preliminary Threshold
LAeq, dB
Triangle test Results
ΔL(Pd50%) dB
Threshold level
LAeq signal(Pd50%) LAeq, dB
Same audibility as real reference car
dBALICE
LAeq, dB
Jet4low 43,2 -6,8 36,4 54 Low friction 37,7 -1,2 36,5 54 Mitsu 1160 rpm 44,1 -1,7 42,4 60 Natural hum 40,3 -2,5 37,8 56 Q4noise 43,8 -3,3 40,5 58 Rev Electro bell 32,5 -0,5 32,0 50
Table 5 Example on results from the listening test.
18.9 Reporting
The test report should include:
− A description of the test method
− The equipment and software used for the test
− Demographics of the listening test panel
− Identification of the test signals and the preconditioning for the test
− Test scheme
− Data analysis and results
− The estimated uncertainty of the test.

AV 1224/10 Page 59 of 65
18.10 Simplified background noise
The simplified background noise is a pink noise signal which is frequency weighted ac-cording to Figure 7. The weighting curve is constructed to the best simple fit to the aver-age spectrum of the measured background noise in a number of parking lots in city and suburb environments. For further specifications of the simplified background noise see Appendix 2 - Background noise
p g p ,
-50
-40
-30
-20
-10
0
10
20 25
31.5 40 50 63 80 100
125
160
200
250
315
400
500
630
800 1k
1.25
k
1.6k 2k
2.5k
3.15
k 4k 5k
6.3k 8k 10k
12.5
k
16k
Frequency, Hz
Soun
d pr
essu
re le
vel,
dB
re 2
0 µP
a
Figure 31 Simplified background noise spectrum, normalized to a maximum of 0 dB.

AV 1224/10 Page 60 of 65
19. Appendix 11 – Measuring method for annoyance and suitability Three main characteristics of the warning sounds should be optimized: Audibility, suitabil-ity and annoyance. A test for audibility –an objective listening test- is described in “Appendix 10 – Determination of Equal audibility as ICE motor sounds”.
Field testing of the suitability and annoyance of potential sounds for a specific vehicle is preferable, but in the first phases these “attributes” can be tested by “indoor” listening tests. The suitability test should ideally be performed with consumer representatives and the annoyance test should be tested as heard by neighbours to roads and parking lots by “average people”.
19.1 Purpose of the listening test
The purpose of the listening test is to get comparative assessments of suitability and an-noyance for a number of potential warning sounds.
19.2 Test signals and samples
The signals to be used for the test are:
− The warning sounds for testing, i.e. the external sound signals either recorded from the external loudspeakers or the signal from the warning signal generator, frequency weighted according to the frequency characteristic of the sound system measured at the FC position (see Appendix 6 - Measuring methods for sound characteristics). The test signal may be the signal emitted at a constant speed of 10 km/h or it may simulate other driving modes. It is suggested that the signals are presented to the listeners at the dBALICE levels (see Appendix 10 – Determination of Equal audibility as ICE motor sounds).
− The reference ICE car sound may be included in the test. (Pt. the reference sound is a recording in the FC position, see Figure 25, of a Mitsubishi Colt ClearTec 1.3 internal combustion engine at 1160 RPM corresponding to a speed of 10 km/h -1’rst gear). The reference car sound can be downloaded from www.madebydelta.com/senselab.
− A simplified background noise (i.e. pink noise which is frequency weighted as speci-fied in section 18.10Simplified background noise). The noise is played back at an A-weighted sound pressure level of 55 dB
− Simplified background noise) may be included. The noise should be played back at an A-weighted sound pressure level of 55 dB. Alternative background noise scenarios may be used.

AV 1224/10 Page 61 of 65
Each sample should have duration of at least 15 seconds. The samples may be looped dur-ing the presentation.
19.3 Listeners
Ideally listeners for the suitability test should be selected among the potential consumers for the actual vehicle at relevant markets, as demographic and cultural differences in pref-erence may exist.
Correspondingly average persons from a relevant culture or country should be selected for the annoyance test.
As these tests are subjective a larger number of listeners than for the audibility test is re-quired. At least 20 selected listeners in each group are recommended to get reliable mean values and small confidence intervals. As clusters of persons with different preferences and reactions to noise may exist a larger number of test persons is preferred.
The usage of a larger number (50-100) of panellists will make it possible to perform a clustering of the resultant data. The aim of a clustering is to find groups of panellists. Within the clusters the assessments are more congruent because the panellists are sharing the same preferences. The analysis of demographic information for the clusters can show if panellists are sharing more aspects than only their preference.
Unless otherwise specifically is intended, normal hearing listeners should be recruited for the listening test.
Despite that the ideal selection criteria with a large number of listeners are optimal for ob-taining reliable and scalable results, survey measurements with smaller group of persons (10-20 persons) may give valuable survey results in the first phases of a development process. An example with 12 listeners is shown later in this Appendix.
Prior to the test the listeners shall be instructed in the test methodology.
19.4 Presentation of the sound samples
The sound samples could be presented over calibrated headphones in a silent environment without disturbances. The presentation may be monaural or stereophonic. Calibrated sce-narios of traffic noise including the warning sounds under test may also be simulated by stereo or surround sound set-up with loudspeakers.
The order of presentation of the warning sounds should be randomized individually for each listener.

AV 1224/10 Page 62 of 65
19.5 Suitability measurements
The principles for this test are very like the principles for the MUSHRA test (without ref-erence and anchor sound) as described in reference [9]. When assessing the suitability it is important that the listeners know the vehicle, the context and the purpose of the warning sound. It is recommended to have pictures of the vehicle at hand during the listening tests.
The instruction for the listeners could be:
“Your task is to assess how suitable the sounds are for an electric car. Assess the suitability of the sounds for the car on the picture when driving for-ward/backward, i.e. give your opinion on how well the sound fits the car shown in the picture. The sounds you will be listening to are constant, but when the real car is driving, the sounds will vary as the engine sound from ”normal cars”.
A five category verbal suitability scale with the categories: Excellent – Good – Fair – Poor – Bad should be used together with a continuous 0-10 numeric scale. An example on a graphical user interface is shown in Figure 32.
Excellent
Good
Fair
Poor
Bad
How suitable is the sound?
Excellent
Good
Fair
Poor
Bad
How suitable is the sound?
Figure 32 Example on a graphical user interface for a suitability test. There is a play button for each sound and assessments are given by setting the sliders above.

AV 1224/10 Page 63 of 65
19.6 Annoyance measurements
Real annoyance measurement should be made as field surveys in the real context. In the laboratory (and in field experiments) only relative annoyance assessments (i.e. the annoy-ance potential) can be obtained, but that serves the purpose of finding the least annoying warning sound.
The principles for this test method are very like the principles for the MUSHRA test as described in reference [9]. When assessing the annoyance it is important that the listeners know and imagine the context where they may be annoyed or disturbed by the sound.
The instruction to the listeners may be:
“Your task is to assess the annoyance of the sounds. Imagine that you hear these sounds at home as part of the traffic noise. The sounds are neither more nor less prominent than the motor sound from the ”normal” cars. The sounds you will be listening to are constant, but when the real car is driving, the sounds will vary as the motor sound from ”normal” cars.”
A five category verbal annoyance scale with the categories: Extremely – Very – Moder-ately – Slightly - Not at all should be used together with a continuous 0-10 numeric scale. The annoyance scale in accordance with ISO 15 666, reference [7].
An example on a graphical user interface is shown in Figure 33.
Extremely
Very
Moderately
Slightly
Not at all.
How annoying is the sound?
Extremely
Very
Moderately
Slightly
Not at all.
How annoying is the sound?
Figure 33 Example on a graphical user interface for an assessing the annoyance potential of the warning sounds. There is a play button for each sound and assessments are given by set-ting the sliders above.

AV 1224/10 Page 64 of 65
19.7 Data analysis
The mean values and confidence intervals shall be computed for the suitability and annoy-ance test, for an example see Figure 34.
The warning sounds1 for this test was intended as drive sounds and were presentet as con-stant sounds representing a speed of 10 km/h. The “Mitsu 1156 rpm” sound is the sound from the reference car.
Figure 34 Example of results from a suitability and annoyance test with 9 warning sounds (along the x-axis) and 12 listeners (the same listeners for both the suitability and the annoyance test). In the graphs, the mean values and the 95% confidence intervals are shown. To the left of each graph the 0-10 numerical assessment scale is shown and to the right the verbal cate-gories.
19.8 Test results
The difference between the suitability and the annoyance assessments is used as the final test results. These differences are calculated for each listener before calculating the mean values and the confidence intervals, see Figure 35.
1 The company Sonic Minds, www.sonicminds.dk, have composed some of the warning sounds that
were used for the testing.

AV 1224/10 Page 65 of 65
Figure 35 Example of the final results from a suitability and annoyance test with 9 warning sounds (along the x-axis) and 12 listeners (the same listeners for both the suitability and the an-noyance test). The Y-axis is the suitability minus the annoyance assessment (scale -10 to +10). In the graph, the mean values and the 95% confidence intervals are shown. The sounds with the highest scores are the most optimal.
As a rule of thumb: The differences between the mean values are statistically significant if the confidence intervals do not overlap.
19.9 Reporting The test report should include: − A description of the test method − The equipment and software used for the test − Presentation mode and background noise during the test − Demographics of the listening test panel − Identification of the warning sounds under test − Test scheme − Data analysis and results − The estimated uncertainty of the test.