Embed Size (px)
Citation preview

WATER MANAGEMENT PLAN
REPORT TO THE UNITED STATES BUREAU OF RECLAMATION ON CCWD’s WATER CONSERVATION
PROGRAM AND ACTIVITIES
FINAL DRAFT

This page left intentionally blank

Water Management Plan
REPORT TO THE UNITED STATES BUREAU OF RECLAMATION ON CONTRA COSTA WATER
DISTRICT’S WATER CONSERVATION PROGRAM AND ACTIVITIES
FINAL DRAFT
Board of Directors
Lisa M. Borba, President Connstance Holdaway, Vice President
Ernesto A. Avila Bette Boatmun John A. Burgh
General Manager Jerry Brown

This page left intentionally blank

Water Management Plan
i
EXECUTIVE SUMMARY ............................................................................................................................. 1
Contra Costa Water District Mission and Goals .................................................................................... 2 Central Valley Project Supply ............................................................................................................................ 3 Los Vaqueros Water Rights ............................................................................................................................... 3 Mallard Slough Supply....................................................................................................................................... 3
SECTION 1: DESCRIPTION OF THE DISTRICT .............................................................................................. 7
A. HISTORY ................................................................................................................................................... 7 1. Date CCWD Formed and Original Size .............................................................................................. 7 2. Current Size, Population and Irrigated Acres ................................................................................... 9 3. Water Supplies Received in Current Year ....................................................................................... 10 4. Annual Entitlement under Each Right and/or Contract.................................................................. 11 5. Anticipated Land Use Changes ....................................................................................................... 12 6. Cropping Patterns (DNA) ................................................................................................................ 13 7. Major Irrigation Methods (by acreage) (DNA) ............................................................................... 13
B. LOCATION AND FACILITIES .......................................................................................................................... 14 1. Incoming Flow Locations and Measurement Methods .................................................................. 14 2. Current Year Untreated Water Conveyance System ...................................................................... 16 3. Current Year Treated Water Distribution System ........................................................................... 17 4. Storage Facilities ............................................................................................................................ 17 5. Outflow Locations and Measurement Methods (DNA) .................................................................. 18 6. Agricultural Spill Recovery System (DNA) ....................................................................................... 18 7. Agricultural Delivery System Operation (DNA) ............................................................................... 18 8. Restrictions on Water Source(s) ..................................................................................................... 18 9. Proposed Changes or Additions to Facilities and Operations for the Next 5 Years ........................ 20
C. TOPOGRAPHY AND SOILS ............................................................................................................................ 20 1. Topography and its Impact on Water Operations and Management ............................................ 20 2. District’s Soil Associations (DNA) .................................................................................................... 21 3. Limitation Resulting from Soil Problems (DNA) .............................................................................. 21
D. CLIMATE ................................................................................................................................................. 21 1. General Climate of the District Service Area .................................................................................. 21 2. Impact of Microclimates on Water Management within the District ............................................ 22
E. NATURAL AND CULTURAL RESOURCES ........................................................................................................... 22 1. Natural Resources Areas within the District ................................................................................... 22 2. Description of District Management of the Resources in the Past or Present ................................ 24 3. Recreational Areas within the Service Area ................................................................................... 24
F. OPERATING RULES AND REGULATIONS .......................................................................................................... 25 1. District’s Operating Rules and Regulations ..................................................................................... 25 2. District’s Agricultural Water Allocation Policy (DNA) ...................................................................... 25 3. Official and Actual Lead Times Necessary for Water Orders and Shut Off (DNA) ........................... 25 4. District’s Policies Regarding Surface and Subsurface Drainage from Farms (DNA) ........................ 25 5. Policies on Water Transfers by the District to its Customers ........................................................... 25
G. WATER MEASUREMENT, PRICING, AND BILLING ............................................................................................. 25 1. District’s Current Year Water Charges ........................................................................................... 28 2. Annual Charges Collected from Customers .................................................................................... 29 3. Water-Use Data Accounting Procedures ........................................................................................ 29
H. WATER SHORTAGE ALLOCATION POLICIES ..................................................................................................... 29 1. Current Year Water Shortage Policies ............................................................................................ 29 2. Policies that Address Wasteful Use of Water and Enforcement Methods ..................................... 30
SECTION 2: INVENTORY OF WATER RESOURCES................................................................................... 311
A. SURFACE WATER SUPPLY ......................................................................................................................... 311 1. Amount of Surface Water Delivered to the District by each of the District’s Sources .................. 344
B. GROUND WATER SUPPLY ......................................................................................................................... 355 1. Acre-foot Amounts of Groundwater Pumped and Delivered by the District ................................ 366

Water Management Plan
ii
2. Groundwater Basin(s) that Underlies the Service Area ................................................................ 366 3. Contractor Operated Wells and Managed Groundwater Recharge Areas ................................... 366 4. Description of Conjunctive Use of Surface and Groundwater ...................................................... 377 5. Groundwater Management Plan ................................................................................................. 378 6. Groundwater Banking Plan .......................................................................................................... 378
C. OTHER WATER SUPPLIES .......................................................................................................................... 388 1. “Other” water used as part of the water supply ........................................................................... 388
D. SOURCE WATER QUALITY MONITORING PRACTICES ...................................................................................... 388 1. Potable Water Quality (Urban only) ............................................................................................. 389 2. Agricultural Districts (DNA) ............................................................................................................ 39 3. Water Quality Testing Program and Role of Each Participant in the Program .............................. 39 4. Current Year Water Quality Monitoring Programs ........................................................................ 39
E. WATER USES WITHIN THE DISTRICT ............................................................................................................ 411 1. Agricultural (DNA) ........................................................................................................................ 411 2. Irrigation Systems Used for Each Crop (DNA)............................................................................... 411 4. Urban Wastewater Collection and Treatment Systems Serving the District Service Area ........... 422 5. Groundwater Recharge/Management/Banking .......................................................................... 433 6. Transfers and Exchanges .............................................................................................................. 433 7. Trades, wheeling, wet/dry year exchanges or other transactions ............................................... 444
F. OUTFLOW FROM THE DISTRICT (AGRICULTURAL ONLY) (DNA) ......................................................................... 444 G. WATER ACCOUNTING (INVENTORY) ........................................................................................................... 444
1. Overall Water Inventory ................................................................................................................. 44
SECTION 3: BEST MANAGEMENT PRACTICES (BMPS) FOR AGRICULTURAL CONTRACTORS .................. 477
THIS SECTION DOES NOT APPLY TO CCWD ...................................................................................................... 477
SECTION 4: BEST MANAGEMENT PRACTICES FOR URBAN CONTRACTORS ............................................. 49
A. PROGRAM DESCRIPTION ............................................................................................................................ 49 B. FOUNDATIONAL BMPS .............................................................................................................................. 10 C. PROGRAMMATIC BMPS ............................................................................................................................. 10 D. PROGRAM ACCOMPLISHMENTS ................................................................................................................... 10
DNA - DOES NOT APPLY

Water Management Plan
iii
APPENDIX A U.S. BUREAU OF RECLAMATION, MID‐PACIFIC REGION CRITERIA FOR
EVALUATING WATER MANAGEMENT PLANS 2014 APPENDIX B CCWD MAJOR FACILITIES APPENDIX C CCWD CODE OF REGULATIONS – SECTIONS 5.04.070‐080, 5.12, 5.20.010‐060, 5.70 APPENDIX D RECLAMATION APPROVAL LETTER APPENDIX E ORDINANCE 15‐01, ESTABLISHING A DROUGHT MANAGEMENT PLAN AS MANDATED BY
EXECUTIVE ORDER B‐29‐15; RESOLUTION 16‐12, THE BOARD OF DIRECTORS OF CONTRA COSTA WATER DISTRICT ADOPTING THE URBAN WATER MANAGEMENT PLAN, AND WATER SHORTAGE CONTINGENCY PLAN
APPENDIX F RESOLUTION NO. 16‐01, WATER WASTE PROHIBITION WITH THE AREA SERVED BY THE DISTRICT APPENDIX G CCWD ANNUAL WATER QUALITY REPORT (2015) APPENDIX H CCWD BMP REPORTS (FY14, FY15 AND 10‐YEAR) APPENDIX I EXAMPLES OF PUBLIC INFORMATION AND SCHOOL EDUCATION PROGRAMS APPENDIX J RESOLUTION NO. 17‐013, A RESOLUTION OF THE BOARD OF DIRECTORS OF THE CONTRA
COSTA WATER DISTRICT AUTHORIZING APPROVAL OF THE CONTRA COSTA WATER DISTRICT WATER MANAGEMENT PLAN AS REQUIRED BY THE UNITED STATES BUREAU OF RECLAMATION

Water Management Plan
iv
This page left intentionally blank

Water Management Plan
CONTRA COSTA WATER DISTRICT 1
Executive Summary This Water Management Plan (Plan) was prepared according to the United States Bureau of Reclamation’s Mid-Pacific Region 2014 Standard Criteria. The Plan must be updated every five years and submitted to the U.S. Bureau of Reclamation (Reclamation) in accordance with Contra Costa Water District’s (CCWD or District) Long-Term Renewal Contract for water service from the Central Valley Project (CVP). Information on CCWD’s water supply sources and water use is provided in this Plan. This Plan also provides information on CCWD’s customer base, water system facilities, and the status of CCWD’s water conservation programs. Background The Reclamation Reform Act of 1982 expanded Reclamation’s responsibilities from building and managing waterworks to also ensuring federal water is put to reasonable and beneficial use. Section 210 of the Reclamation Reform Act (RRA) requires CVP contractors to prepare and submit Water Management Plans with definite goals, appropriate water conservation measures, and timetables every five years. The Central Valley Project Improvement Act of 1992 (CVPIA) mandated Reclamation develop criteria for assessing the adequacy of these plans. The CVPIA further requires contractors to have adequate plans on file in order to obtain certain benefits or at such time as they renew their contracts. Service Area Description The Contra Costa County Water District was approved by the voters in 1936 as the legal entity to contract, purchase, and distribute water provided by Reclamation through the Contra Costa Canal. In 1981, "County" was dropped from the name, leaving Contra Costa Water District. The 48-mile Contra Costa Canal conveys water from the Sacramento-San Joaquin Delta (Delta), through Rock Slough, Old River and Middle River, to eastern and central Contra Costa County (County). CCWD’s service area encompasses most of central and northeastern Contra Costa County, a total area of more than 140,000 acres (including the Los Vaqueros watershed area of approximately 19,100 acres). Water is provided to a combination of municipal, residential, commercial, industrial, landscape irrigation, and agricultural customers. Major municipal customers include the Diablo Water District (Oakley) and the Cities of Antioch, Pittsburg, Golden State Water Company (Bay Point) and Martinez, each of which distribute water to their retail customers. Treated water is distributed to individual customers living in the following communities in the Treated Water Service Area: Clayton, Clyde, Concord, Pacheco, Port Costa, and parts of Martinez, Pleasant Hill, and Walnut Creek. In addition, CCWD delivers water to the Diablo Water District, City of Brentwood, Golden State Water Company (Bay Point) and the City of Antioch. Antioch, Pittsburg and Martinez operate their own water treatment plants. For the first 25 years of its existence, CCWD’s main responsibility was the purchase and distribution of untreated water through the Contra Costa Canal. The cities and other water utilities within CCWD were responsible for treating water used by their customers. However, in the late 1950s, many citizens and public officials became concerned about the quality and cost of water in the central County area. To solve this problem, CCWD purchased the California Water Service

Water Management Plan
CONTRA COSTA WATER DISTRICT 2
Company's Concord-area treatment, pumping, storage, and distribution facilities. In 1968, CCWD replaced the old treatment facilities with the construction of its own Ralph D. Bollman Water Treatment Plant in Concord. In 1992, CCWD completed the Randall-Bold Water Treatment Plant in Oakley that is jointly owned with the Diablo Water District (DWD). The Randall-Bold plant provides treated water to DWD, and by contract, to the Cities of Brentwood and Antioch and the Golden State Water Company (Bay Point). Additionally, the Multi-Purpose Pipeline, constructed in 2003, allows CCWD to serve new customers in the central County Treated Water Service Area (TWSA) from the Randall-Bold plant. Combined, the Bollman and Randall-Bold water treatment plants provide treated water to approximately 200,000 people in the central County area. CCWD’s service area also includes a large industrial base that includes oil refineries, steel mills, and chemical manufacturing facilities. Large industrial water use accounts for approximately one-third of total water use within CCWD. In 2004, CCWD entered into an agreement to treat water for a major new customer, the City of Brentwood. Under the agreement, CCWD constructed and is operating a 16.5 million gallons per day (mgd) treatment plant adjacent to the Randall-Bold Water Treatment Plant.
Contra Costa Water District Mission and Goals CCWD’s mission is to strategically provide a reliable supply of high quality water at the lowest cost possible, in an environmentally responsible manner. To fulfill that mission, CCWD’s Board of Directors (Board) established the following CCWD goals:
1. Ensure that the District delivers high quality and reliable water supplies for current and future needs.
2. Provide excellent customer service and high levels of customer satisfaction. 3. Plan, design, and construct high quality facilities consistent with District needs and
industry standards. 4. Effectively manage the District’s financial resources in conformance with Board policies. 5. Ensure that all District activities surpass all applicable laws and regulations. 6. Operate, maintain, and protect District facilities in a safe and cost-effective manner. 7. Provide leadership in water affairs. 8. Actively enhance effective community relations and public information. 9. Create and maintain a work environment that fosters teamwork and individual
excellence. 10. Manage and maintain Reclamation and District natural and recreation resources, and
protect public safety and water quality. Water Supply Sources CCWD is almost entirely dependent on the Sacramento-San Joaquin Delta for its water supply; with Reclamation’s CVP as the primary water source. CVP water includes unregulated and regulated flows from storage releases from Shasta, Folsom, and Clair Engle reservoirs into the Sacramento River. Other sources include the San Joaquin River, Mallard Slough (on the San Joaquin River), recycled water, a minor amount of local well water, and water transfers.

Water Management Plan
CONTRA COSTA WATER DISTRICT 3
Central Valley Project Supply CCWD’s long-term CVP contract was renewed in May 2005 and has a term of 40 years (contract No. 175r-3401a-LTR1). The contract with Reclamation provides for a maximum delivery of 195,000 acre-feet per year (af/yr) from the CVP, with a reduction in deliveries during water shortages including regulatory restrictions and drought. The Municipal and Industrial (M&I) Water Shortage Policy defines the reliability of CCWD’s CVP supply and was developed by Reclamation to establish CVP water supply levels that would sustain urban areas during severe or continuing droughts and provide for minimum health and safety. The M&I Water Shortage Policy provides for a minimum allocation of 75 percent of adjusted historical use until irrigation allocations fall below 25 percent. Los Vaqueros Water Rights CCWD obtained additional water rights for surplus Delta flows as part of the Los Vaqueros Project. Up to 95,980 acre-feet may be diverted for storage in Los Vaqueros Reservoir from November 1 of each year to June 30 of the succeeding year under Water Rights Permit No. 20749. The Los Vaqueros Water Rights supply can be used in lieu of the CVP supply. When Los Vaqueros Water Rights water is used, CVP supplies are reduced by an equivalent amount. Combined deliveries of Los Vaqueros Water Rights water and CVP water are limited to 195,000 af/yr. Little or no Los Vaqueros Water Rights water is available for diversion to storage in dry years. Construction of CCWD’s Los Vaqueros Expansion (LVE) Project was completed in 2012. The LVE Project expanded the existing Los Vaqueros Reservoir capacity from 100,000 acre-feet to 160,000 acre-feet, providing additional water supply reliability and water quality benefits. Mallard Slough Supply CCWD has additional water rights at Mallard Slough for a maximum diversion of Delta water of up to 26,780 af/yr. Diversions from Mallard Slough are unreliable due to frequently poor water quality in the San Joaquin River at this point of diversion. Water quality conditions have restricted diversions from Mallard Slough to approximately 3,100 af/yr (on average) with no availability in dry years. When Mallard Slough supplies are used, CVP diversions are reduced by an equivalent amount. East Contra Costa Irrigation District CCWD entered into an agreement with the East Contra Costa Irrigation District (ECCID) in 2000 to purchase surplus irrigation water for M&I purposes in ECCID’s service area. Only a portion of ECCID is within the existing CCWD service area (estimated current demand of 6,000 af/yr). The current ECCID agreement allows CCWD to purchase up to 8,200 af/yr for service in the areas common to both districts. The agreement also includes an option for up to 4,000 af/yr of groundwater (by exchange) when the CVP is in a shortage situation. The groundwater exchange water was utilized during the 2007-2009 drought, and the 2013-2015 drought. This exchange

Water Management Plan
CONTRA COSTA WATER DISTRICT 4
water can be used anywhere within CCWD’s service area. Water delivered by CCWD to the City of Brentwood is purchased by the City from ECCID under a separate contract. CCWD Water Conservation Program CCWD has actively and consistently implemented a variety of effective water conservation programs since 1988. CCWD is a signatory to the Memorandum of Understanding Regarding Urban Water Conservation in California (MOU) developed by the California Urban Water Conservation Council (CUWCC). The District implements Best Management Practices (BMPs), as prescribed in the MOU and as required in the Standard Criteria for Evaluating Water Management Plans. CCWD’s Water Conservation Program fulfills the mission of the District by reducing long-term water demand in an environmentally responsible and cost effective manner. The long-term water savings goal for the Conservation Program is to reduce demand by five percent of what it would be in 2050 without District-implemented conservation measures. This equates to approximately 10,000 acre-feet in the year 2050. This amount is in addition to expected conservation savings from natural fixture replacement and other non-District conservation activities. CCWD is on track to meet this goal. In November of 2009 the historic Senate Bill (SB) X7-7 (20% by 2020) was enacted to increase water use efficiency. The legislation sets an overall requirement of reducing per capita urban water use 20% by December 31, 2020. The reduction requirements apply to CCWD’s wholesale customers as well. Specific water use targets to meet the SBX7-7 requirements for CCWD were evaluated in CCWD’s 2010 and 2015 Urban Water Management Plans. A detailed discussion of current water conservation activities and their status is provided in Section 4. The elements of CCWD’s current conservation program include both Foundational and Programmatic BMPs. Report Format The 2014 Standard Criteria (Appendix A) provide a recommended format for Water Management Plans. Calendar year 2015 was selected as the reference reporting year for submittal of this Plan. The recommended Water Management Plan consists of four sections. Sections 1 and 2 include descriptive information about CCWD including land use, customer characteristics, and descriptions of the physical system and water resources. Sections 3 and 4 present the agricultural (not applicable to CCWD) and Municipal & Industrial (M&I) BMPs, including the California Urban Water Best Management Practices described in the MOU signed by CCWD in September 1991. Appendices to this plan provide detailed information as specified in the Reclamation Guidebook. The CVPIA Criteria is included as Appendix A, and a District Facilities Map can be found in Appendix B. Appendices C contains relevant sections of CCWD’s Code of Regulations regarding water supply and rates. Appendix E contains the 2015 Drought Management Plan and the Water Shortage Contingency Plan. Additional appendices include the Reclamation approval letter

Water Management Plan
CONTRA COSTA WATER DISTRICT 5
(Appendix D), the Board Resolution prohibiting water waste (Appendix F), the 2015 CCWD Annual Water Quality Report (Appendix G), the annual CCWD BMP reports (Appendix H), examples of Public Outreach programs (Appendix I), and the Board Resolution adopting the Water Management Plan (Appendix J).

Water Management Plan
CONTRA COSTA WATER DISTRICT 6
This page left intentionally blank

Water Management Plan
CONTRA COSTA WATER DISTRICT 7
SECTION 1: Description of the District This chapter addresses Section 1 of the Central Valley Project Improvement Act of 1992 (CVPIA) Criteria (2014 Criteria; see Appendix A) and provides a historical overview of the Contra Costa Water District (CCWD or District). District Name: Contra Costa Water District
Contact Name: Jeff Quimby
Title: Planning Director
Telephone: (925) 688-8310
E-mail: [email protected]
Web Address: http://www.ccwater.com/
A. History This section provides a historical overview of CCWD, including significant historical events and trends that appear likely to influence CCWD’s future. Also included is a brief discussion of the original water users and water development within the vicinity of the current CCWD service area, formation of CCWD, issues affecting the decision to contract with the United States Bureau of Reclamation (Reclamation) and others, and changes in irrigated acreage and water supplies. Table 1-1 displays the contract history between Reclamation and CCWD.
1. Date CCWD Formed and Original Size Date District Formed: May 5, 1936 Date of First Reclamation Contract: 1941 Original Size (acres): 48,000 Current Year (Basis of Water Management Plan): 2015 CCWD serves approximately 500,000 people throughout north, central, and east Contra Costa County (County). Its customers also include 10 major industries, 36 smaller industries, and approximately 25 agricultural water users. CCWD operates and maintains a complex system of water transmission, treatment, and storage facilities to supply both treated and untreated water to its customers. The Contra Costa County Water District was approved by voters in 1936 as the legal entity to contract, purchase, and distribute water provided by Reclamation through the Contra Costa Canal. (In 1981 "County" was removed from the name, leaving Contra Costa Water District.) The 48-mile canal conveys water from the Sacramento-San Joaquin Delta, through Rock Slough, Old River and Middle River, to CCWD customers. For the first 25 years of its existence, CCWD’s main responsibility was the purchase and distribution of untreated water through the Contra Costa Canal. The cities and other water utilities within CCWD were responsible for treating water used

Water Management Plan
CONTRA COSTA WATER DISTRICT 8
by their customers. However, in the late 1950s, many citizens and public officials became concerned about the quality and cost of the water in the central County area. To solve this problem, CCWD purchased the California Water Service Company's Concord-area treatment, pumping, storage, and distribution facilities. In 1968, CCWD replaced the old treatment facilities with the construction of its own Ralph D. Bollman Water Treatment Plant in Concord. In 1992, CCWD completed the Randall-Bold Water Treatment Plant in Oakley that is jointly owned with the Diablo Water District (DWD). The Randall-Bold plant provides treated water to DWD, and by contract, to the Cities of Brentwood and Antioch and the Golden State Water Company (Bay Point). Additionally, the Multi-Purpose Pipeline, constructed in 2003, allows CCWD to serve new customers in the central County Treated Water Service Area (TWSA) from the Randall-Bold plant. Combined, the Bollman and Randall-Bold water treatment plants provide treated water to approximately 200,000 people in the central County area. CCWD’s service area also includes a large industrial base that includes oil refineries, steel mills, and chemical manufacturing facilities. Large industrial water use accounts for approximately one-third of total water use within CCWD. In 2004, CCWD entered into an agreement to treat water for a major new customer, the City of Brentwood. Under the agreement, CCWD constructed and is operating a 16.5 million gallons per day (mgd) treatment plant adjacent to the Randall-Bold Water Treatment Plant. CCWD’s service area encompasses most of central and northeastern Contra Costa County, a total area of more than 140,000 acres (including the Los Vaqueros watershed area of approximately 19,100 acres). Water is provided to a combination of municipal, residential, commercial, industrial, landscape irrigation, and agricultural customers. Municipal customers include the Diablo Water District (Oakley) and the Cities of Antioch, Pittsburg, Golden State Water Company (Bay Point) and Martinez, each of which distribute water to their retail customers. Treated water is distributed to individual customers living in the following communities in CCWD’s Treated Water Service Area: Clayton, Clyde, Concord, Pacheco, Port Costa, and parts of Martinez, Pleasant Hill, and Walnut Creek. In addition, CCWD delivers water to the Diablo Water District, City of Brentwood, Golden State Water Company (Bay Point), and the City of Antioch. Antioch, Pittsburg and Martinez have their own treatment plants. Appendix B shows the CCWD service area boundary with the smaller interior Treated Water Service Area boundary. The CCWD CVP contract with Reclamation was renewed in May 2005. Under the updated contract (Contract No. 175r-3401a-LTR1), CCWD is identified as a municipal and industrial water supplier because less than one percent of CCWD's water demand is irrigated agriculture. Therefore, sections of the CVPIA Criteria pertaining to agricultural water suppliers are not included in this report. Non-CVP supplies are used to meet agricultural demands within CCWD’s service area.

Water Management Plan
CONTRA COSTA WATER DISTRICT 9
TABLE 1-1. RECLAMATION CONTRACT HISTORY
Date Acres(a) Classes(b) Acre-feet/year (af/yr)
Interim Contracts(c) 1941 to 1948 None identified None identified 13 to 10,500 Contract Amendment 1949 to 1951 None identified None identified No quantity
specified Contract Amendment (Reclaimed Water Amend.) (LV Amendment) (Shortage Provision Amend.) (Shortage Provision Amend.)
1970 1973 1994 1999 2000
None identified None identified 195,000 195,000 195,000 195,000 195,000
Long-Term Renewal 2005 None identified None identified 195,000 (a) The contracts do not state the acreage within CCWD's service area. (b) CCWD does not have Class I or Class II water identified in its contract with Reclamation. The classes are used for agricultural contractors and are generally used to define reliability or firmness of supply for blocks of water; Class I is most reliable and Class II is more discretionary (i.e., is not available during dry periods). (c) Source: Reclamation Region 2, Factual Report Contra Costa Water District, November 1950. (d) Operating limitations that apply to CCWD’s CVP contract are outlined in Table 1-10.
2. Current Size, Population and Irrigated Acres This information is provided in Table 1-2.
TABLE 1-2. CURRENT SIZE, POPULATION, AND IRRIGATED ACRES
Size (acres) 140,787 Population Served(a) 500,000 Irrigated Acres 385
(a) Includes Retail and Wholesale service areas.

Water Management Plan
CONTRA COSTA WATER DISTRICT 10
3. Water Supplies Received in Current Year Information on amount of water received by CCWD during calendar year 2015 is provided in Table 1-3.
TABLE 1-3. WATER SUPPLIES RECEIVED IN CALENDAR YEAR 2015(a)
District Supplies Received AF Federal urban water (Reclamation’s CVP) 54,806 Federal agricultural water 0 State water 0 Other Wholesaler (define) 0 Local surface water
Los Vaqueros Water Right 3,199 Mallard Slough 0 East Contra Costa Irrigation District
(ECCID)(b) 9,238
Upslope drain water 0 Total District Supplies 67,243
Non-District Supplies Received AF Groundwater(c) 3,000 Transferred water 0 Recycled water(d) 8,087 City of Brentwood (ECCID)(e) 4,335 City of Antioch (Pre-1914) 1,255
Total Non-District Supplies 16,675 TOTAL WATER SUPPLIES 83,918
(a) This table does not include water previously stored in Los Vaqueros Reservoir and released to meet demands in 2015.
(b) Includes CCWD/ECCID overlap and Brentwood use inside CCWD service area. (c) CCWD does not manage groundwater, but estimates total use within CCWD boundaries at approximately 3,000 af/yr. (d) Does not include in-plant or wildlife habitat enhancement and wetland uses. (e) ECCID water wheeled for City of Brentwood customers outside of CCWD service area. (f) This table does not include industries that hold rights to water from the San Joaquin River.

Water Management Plan
CONTRA COSTA WATER DISTRICT 11
4. Annual Entitlement under Each Right and/or Contract Table 1-4 describes the nature and quantity of each of CCWD’s surface water rights and contracts and the restrictions on the time of diversion. Table 1-5 describes the nature and quantity of non-CCWD supplies utilized in the service area.
TABLE 1-4. ANNUAL ENTITLEMENT UNDER EACH RIGHT AND/OR CONTRACT
Source AF Contract/Water Right Contract Restrictions
Central Valley Project 195,000 Contract No. 175r-3401a-LTR1
Contract renewed in May 2005 for 40-year term; Reduction in deliveries during water shortages including regulatory restrictions and drought.
Los Vaqueros Water Right 95,980 Permit No. 20749
Water may be diverted for storage between November 1 of each year, to June 30 of the succeeding year. Combined customer deliveries of Los Vaqueros and CVP water shall not exceed 195,000 af/yr of diversions. Water must be stored for 30 days prior to use.
Kellogg Creek 9,640 Permit No. 20750
Shall not exceed 115 cubic feet per second (cfs) by direct diversion and 9,640 af/yr by storage from January 1 through December 31.
Mallard Slough 14,880
License for Diversion and Use of Water #10514
(August 12, 1975, application filed November
19, 1928)
Total diversion rate from Mallard Slough is limited to 39.3 cfs. Limited by water quality.
Mallard Slough 11,900
Permit for Diversion and Use of Water #19856 (July 3, 1986, application filed
September 28, 1983)
Total diversion rate from Mallard Slough is limited to 39.3 cfs. Diversion only August 1 through December 31. No diversions permitted when CVP and SWP are making releases to meet in-basin requirements. Limited by water quality.
ECCID
8,200 (normal) 12,200
(drought)
Water Sales Agreement – Pre 1914 Water Rights
Agreement allows CCWD to purchase up to 8,200 AFY for service in the areas common to both districts. The agreement also includes an option for up to 4,000 AFY of groundwater (by exchange) when the CVP is in a shortage situation.
Water Management Plan
CONTRA COSTA WATER DISTRICT 12
TABLE 1-5. NON-CCWD SUPPLIES UTILIZED IN THE SERVICE AREA
Source AF Contract/Water Right Contract Restrictions
City of Antioch 25,340 Pre-1914 Water Right
The City of Antioch holds two pre-1914 water rights. Water can only be diverted when water quality is sufficient, and at a combined rate of 35 cfs.
East Contra Costa Irrigation District
(ECCID) 50,000 Pre-1914 Water Right
ECCID has a pre-1914 right and an agreement with DWR guaranteeing 50,000 af/yr.
Inland Container (formerly Gaylord
Container Corporation) 28,000 Permit No. 019418 Point of diversion is the San Joaquin River.
Tesoro (formerly Tosco) Corporation 16,650 Appropriative water right Point of diversion is Hastings Slough on the
San Joaquin River.
Dupont 1,405 Appropriative water right (license #000674)
Groundwater 3,000-4,500 NA
Undetermined number of wells in Ygnacio, Clayton, Oakley, and Pittsburg/Antioch Areas.
Central Contra Costa Sanitary District
(CCCSD) 1,600 Project Specific Agreement
in 1995
Recycled water used for industrial purposes, urban landscape, and golf course irrigation.
Delta Diablo Sanitation District (DDSD) 10,250 Agreements in 2000 and
2004
Recycled water used for industrial purposes, urban landscape, and golf course irrigation.
5. Anticipated Land Use Changes Concord Naval Weapons Station – City of Concord In February 2010, the City of Concord adopted a Reuse Plan proposing to redevelop approximately 5,000 acres of the Concord Naval Weapons Station (CNWS), which is located within CCWD’s Treated Water Service Area. CCWD staff worked with the City of Concord throughout the planning process to incorporate significant water conservation measures, low water demand development, and recycled water standards into the CNWS Reuse Plan. These standards have reduced the project’s potable water demand projections by more than 50 percent. It is estimated that the project will utilize recycled water in an amount equal to or greater than the net potable water demand. Phase One of the project includes the development of 500 acres as mixed-use buildings with retail located near the North Concord BART station, and is projected to have a fifteen-year buildout window. Site development is currently estimated to begin in 2020 or later. Hotchkiss Tract and Bethel Island – City of Oakley and Contra Costa County There are numerous major residential subdivisions developments proposed in the area including Delta Coves on Bethel Island (partially constructed, but no constructed homes as of November 2016). On Hotchkiss Tract, proposed housing developments within Contra Costa County includes Spinnaker Cove (partially constructed, but not occupied), and within the City of Oakley

Water Management Plan
CONTRA COSTA WATER DISTRICT 13
Summer Lakes South and North (South nearly 100 percent constructed, North pending), Emerson Ranch under construction, Cypress Preserve (seeking permits), Baldocchi, and Gilbert. Spinnaker Cove, Gilbert and the Cypress Preserve require CVP Inclusion review approval before CCWD and DWD can provide water service. The estimated development timeline for the above homes is between 2016 and 2030. The Cypress Preserve and Emerson Ranch project include some commercial development. Two public schools are planned within the Cypress Preserve Project area. Some of the major residential subdivisions on the Hotchkiss Tract and Bethel Island include: Delta Coves on Bethel Island (560 homes), Summer Lakes North (813 homes), Summer Lake South (630 homes), Emerson Ranch (576 homes), Cypress Preserve (2,400 homes), Gilbert Parcels (506 homes), Spinnaker Cove (91 homes), and Baldocchi Parcels (100 homes). City of Antioch In the City of Antioch, future growth is anticipated to occur south of Lone Tree Way, in the Sand Creek area. A portion of the Sand Creek area, known as Higgins Ranch, is currently outside of the CCWD service area and may not be developed. Development within the Sand Creek Project Area when implemented could result in approximately 2,000 to 4,000 new residential units on 2,700 acres. In 2016 the city of Antioch approved the 650 unit Vineyards project on the northeastern portion of the Sand Creek Specific Plan area. While construction of the Vineyards subdivision can be expected within the next five years the balance of the Sand Creek Specific plan development is expected to unfold very slowly given public concerns with further housing developments in this area. City of Pittsburg The City of Pittsburg’s urban limit line expansion was approved by voters in 2005. The expanded urban limit area is approximately 2,200 acres. It is estimated that approximately 2,000 homes may be constructed in these areas. CCWD is working on three annexations and CVP Inclusions within Pittsburg including the Montreaux (approx. 356 homes), the Tuscany Meadows (approx. 1,282 homes), and the Sky Ranch (approx. 415 homes) subdivisions. Montreux and Tuscany Meadows both require CCWD annexation and Reclamation CVP Inclusion Review. Sky Ranch has been annexed but has yet to complete CVP inclusion review. Build out for these subdivisions is expected to be over the next 10 years.
6. Cropping Patterns (DNA) This section does not apply to CCWD.
7. Major Irrigation Methods (by acreage) (DNA) This section does not apply to CCWD.

Water Management Plan
CONTRA COSTA WATER DISTRICT 14
B. Location and Facilities This section describes CCWD facilities, including measurement locations, conveyance system, and storage facilities. See Appendix B for points of delivery, turnouts (internal flow), measurement locations, conveyance system, and storage facilities.
1. Incoming Flow Locations and Measurement Methods The location of diversion facilities operated and maintained by CCWD are shown in Appendix B and described in Table 1-6.

Water Management Plan
CONTRA COSTA WATER DISTRICT 15
TABLE 1-6. INCOMING MEASUREMENT METHODS AND LOCATIONS
Location Name
Physical Locations – District Supplies
Type of Measurement Device Accuracy
Rock Slough Intake
The Contra Costa Canal begins at the west end of Rock Slough, a dead end channel in the Southwest portion of the Sacramento-San Joaquin Delta, and ends at the Martinez Reservoir. The permitted capacity of Rock Slough is 350 cubic feet per second (cfs). The diversion is equipped with a state-of-the-art fish screen.
Flow through Rock Slough is measured using an Acoustic Velocity Meter (AVM) installed downstream of the first pumping plant in a chain of four pumping plants that lifts the water to its highest delivery elevation.
The AVM accuracy is verified two times per year by USGS staff. The accuracy determination is made by comparing AVM readings to measurements made using an AA Current Meter.
Old River Pumping Plant
The Old River Intake, completed as part of the Los Vaqueros Project, is located just south of the intersection of Old River and Highway 4. The diversion is equipped with a state-of-the-art fish screen. The intake capacity is 250 cfs.
Flow through the Old River Intake is measured and metered by an insertion type Doppler flow meter in a full pipe discharge flow.
The flow meter includes built in diagnostic testing that is monitored regularly. The meter accuracy is verified as necessary by comparison of the Doppler meter to a temporarily installed external ultrasonic flow meter.
Middle River Pumping Plant
In 2010, CCWD completed construction of the Middle River pumping plant, with an intake capacity of 250 cfs. The diversion is equipped with a state-of-the-art fish screen.
Flow through the Middle River Intake is measured and metered by an insertion type ultrasonic/ Doppler flow meter in a full pipe discharge flow.
The flow meter includes built in diagnostic testing that is monitored regularly. The meter accuracy is verified as necessary by comparison to flows measured at Old River.
Mallard Slough
Pumping Plant
A dredged channel off of the Sacramento River in the unincorporated community of Bay Point (West Pittsburg). A new pump station was constructed to replace the existing pump station in January 2003. The new pump station is equipped with a state-of-the-art fish screen. The intake capacity is 62 cfs.
Flow through the Mallard Slough intake is metered using a magnetic flow (MAG) meter on the discharge header of the pump station.
Meter accuracy for MAG meters is set at the factory at time of installation. This meter is checked for proper operation once per year.

Water Management Plan
CONTRA COSTA WATER DISTRICT 16
2. Current Year Untreated Water Conveyance System Table 1-7 provides information on the current untreated water conveyance system.
TABLE 1-7. UNTREATED WATER CONVEYANCE SYSTEM
Miles Unlined - Canal Miles Lined - Canal(a) Miles Piped(b) Miles - Other 3.4 49 34 NA
(a) The length of lined portions of the Contra Costa Canal and the Ygnacio Canal. (b) The length of the Mallard pipeline, the Shortcut pipeline, the Los Vaqueros pipeline, and 7,500 feet (1.4 miles) of the Unlined Canal that was encased in 2009 and 2015. The primary conveyance facility for CCWD's untreated water supply is the Contra Costa Canal (Canal), which carries water from Rock Slough for deliveries throughout CCWD's service area. The Canal also conveys water from the Old and Middle River intakes via the Los Vaqueros Pipeline. The Canal is approximately 48 miles long, with the major deliveries within the first 19 miles, which runs from Rock Slough to the Shortcut Pipeline near the Bollman Water Treatment Plant. The first 4 miles of the Canal have been historically unlined and run from Rock Slough to Pumping Plant 1. In 2015, CCWD completed Phase 2 of the Canal Replacement Project, enclosing approximately 5,500 feet of the unlined Canal in a pipe, extending east from Marsh Creek. Phase 1 of the Canal Replacement Project was completed in 2009, which enclosed 2,000 feet of unlined Canal from Pumping Plant 1 east to Marsh Creek. Starting at Pumping Plant 1 the remaining Canal reaches are concrete lined, with capacities ranging from approximately 22 cubic feet per second (cfs) to 350 cfs. Four pumping plants within the first 7.1 miles of the Canal lift water 124 feet to flow the remaining length of the main Canal by gravity. The Ygnacio Re-lift Pump Station diverts water from the main Canal into the 5-mile Ygnacio Loop in the City of Walnut Creek. The Canal has several in-line siphons, culverts, and check structures, as well as a 1/4-mile long tunnel. The Shortcut Pipeline conveys untreated water from the Canal to the Bollman Water Treatment Plant, the City of Martinez, Shell Oil Company, as well as some smaller industrial customers. The figure in Appendix B indicates the major existing facilities along the Contra Costa Canal. The Los Vaqueros Project included a new point of diversion (at Old River south of the Highway 4 crossing) that operates in conjunction with the Rock Slough Intake, associated water transmission facilities, pumping plants, and other facilities. The pumping plant is at the Old River intake and has an installed capacity of 250 cfs. Diversion from the Old River intake for delivery to CCWD's service area began in the summer of 1997. In 2010, CCWD completed construction of a second pumping plant on Victoria Canal near Middle River that also has an installed capacity of 250 cfs. Both the Middle River and Old River pumping plants pump water to the 4 million gallon Transfer Reservoir. From the Transfer Reservoir water can either flow by gravity to the Canal or is pumped up to the Los Vaqueros Reservoir by the Transfer Pump Station. Water stored in the Los Vaqueros Reservoir is conveyed to the Canal by gravity. The Transfer Pump Station has an installed capacity of 200 cfs. A key to successful performance of the Los Vaqueros Project is CCWD’s ability to fill and continue to refill the reservoir from Old and Middle River with high quality water, and to use

Water Management Plan
CONTRA COSTA WATER DISTRICT 17
that water for blending when salinity at CCWD’s Delta intakes exceed CCWD’s water quality objectives.
3. Current Year Treated Water Distribution System CCWD's Treated Water Service Area (TWSA) distribution system serves retail customers in central Contra Costa County communities with ground elevations ranging from between 0 and 1,000 feet above mean sea level. The distribution system consists of approximately 809 miles of pipelines ranging in diameter from 2 to 66 inches.
TABLE 1-8. TREATED WATER CONVEYANCE SYSTEM Miles Asbestos Cement Pipe Miles Steel Pipe Miles Cast Iron
Pipe Miles Polyvinyl
Chloride Miles – Other(a)
505 22 17 172 93 (a) Other materials include ductile iron (9 miles), cement mortar lined, coated steel pipe and other materials (83 miles).
4. Storage Facilities CCWD's untreated water storage reservoirs are Mallard, Contra Loma, Martinez and Los Vaqueros Reservoirs. The figure in Appendix B shows the locations of these untreated water reservoirs, the Los Vaqueros Reservoir watershed boundary, and the Antioch Reservoir, which is owned by the City of Antioch. Mallard Reservoir is used as a storage facility for emergency use, flow regulation, and serves as a forebay to the Bollman Water Treatment Plant. Mallard Reservoir has a capacity of about 3,069 acre-feet, approximately two weeks of supply for CCWD’s Treated Water Service Area customers. The Contra Loma Reservoir, which is located near Canal Milepost 12, is used primarily as a regulating reservoir for peak demands and short term (1 to 7 days) supplies and for emergency storage for CCWD customers. Contra Loma Reservoir has a capacity of about 2,087 acre-feet. The Martinez Reservoir, located in the City of Martinez, is at the terminus of the Contra Costa Canal and the Shortcut Pipeline and provides regulating storage to capture flows from canal operations. The Martinez Reservoir has a capacity of about 276 acre-feet. The Los Vaqueros Reservoir was completed in 1997 and the initial filling began in 1998. The reservoir is located eight miles south of the City of Brentwood. The reservoir stores higher quality Delta water for blending with the Delta supply during dry periods when sodium and chloride levels typically increase. Besides improving water quality for CCWD's approximately 500,000 customers, the reservoir stores water for emergency supply and for operational flexibility to protect Delta fisheries. In 2011, CCWD started construction on a project to increase the capacity of the Los Vaqueros Reservoir from the initial size of 100,000 acre-feet to 160,000 acre-feet. Completion of the Los Vaqueros Reservoir Expansion project was completed in 2012, and it now provides CCWD customers with improved water supply reliability during extended droughts and emergencies.

Water Management Plan
CONTRA COSTA WATER DISTRICT 18
CCWD also has about 221 acre-feet of treated water storage capacity throughout its treated water distribution system, available for operations, emergency and fire suppression.
TABLE 1-9. STORAGE FACILITIES
Name Type Capacity (AF) Los Vaqueros Reservoir Untreated Water 160,000(a)
Mallard Reservoir Untreated Water 3,069 Contra Loma Reservoir Untreated Water 2,087
Martinez Reservoir Untreated Water 276 40 Treated Water
Reservoirs Treated Water 221
WTP Clearwells Treated Water 46 (a) Following the completion of the expansion project in 2012.
5. Outflow Locations and Measurement Methods (DNA) This section does not apply to CCWD.
6. Agricultural Spill Recovery System (DNA) This section does not apply to CCWD.
7. Agricultural Delivery System Operation (DNA) This section does not apply to CCWD.
8. Restrictions on Water Source(s) All of CCWD’s source water is from surface water diversions from the Sacramento-San Joaquin River Delta. A summary of the restrictions on these water sources is provided in the following table.

Water Management Plan
CONTRA COSTA WATER DISTRICT 19
TABLE 1-10. RESTRICTIONS ON WATER SOURCES
Restriction Cause of Restriction Effect on Operations
No-Diversion Period: Cease diversions for 30 days each spring
State and Federal fishery
agencies
CCWD must use the Los Vaqueros Reservoir for its water supply during the 30 days. If CCWD cannot refill the Reservoir in the same year, the restriction could affect the ability of the Reservoir to deliver high quality water.
No-Fill Period: Avoid filling for 75 days each spring and in some months can only fill when Delta outflow is high enough to maintain “X2” west of either Chipps Island or Collinsville
State and Federal fishery
agencies
CCWD cannot refill Los Vaqueros Reservoir between March 15 and May 31 or at times when outflow is low and "X2" could restrict filling, all of which could limit the water quality performance of the Los Vaqueros Project.
Additional No-Fill Days: February no-fill requirement; if Los Vaqueros (LV) Reservoir storage is greater or equal to 70,000 AF, CCWD cannot fill for 15 days between February 14 and 28. Similarly if LV storage is greater or equal to 80,000 AF, CCWD cannot fill for 10 days between February 19 and 28. If LV storage is greater or equal to 90,000 AF, CCWD cannot fill for 5 days between February 24 and 28.
California Department of Fish and
Game
These combined restrictions could limit the water quality performance of the Los Vaqueros Project.
Total CVP/LV Quantity: Annual water customer deliveries through the CVP and LV water right shall not exceed 177,000 AF and the total diversion annually under all water rights shall not exceed 222,000 acre feet.
California Department of Fish and
Game
System demands must be managed within the specified diversion limits.
Diversion Rate: Rock Slough permitted capacity is 350 cfs. Pumping at Old and Middle River is limited to 250 cfs individually and 320 cfs combined. The maximum instantaneous diversion rate at all points shall not exceed: 540 cfs for the months of June, July, August, September and October; 450 cfs for the months of November, December, January, February and March; and 470 cfs for April and May.
SWRCB and California
Department of Fish and
Game
CCWD cannot expand facilities without new SWRCB permits and CDFG approval.
CVP Quantity: CCWD pumps CVP water at the Rock Slough, Old and Middle River intakes according to schedules filed with Reclamation. Deficiencies are imposed as necessary by Reclamation according to the M&I Water Shortage Policy.
Reclamation
In years when there are deficiencies, CCWD may choose to supplement its water supply such as through water transfers. If there are severe restrictions, CCWD may implement voluntary or mandatory water rationing.
Water Rights: Seawater intrusion at CCWD's Mallard Slough restricts diversions to periods when water is of suitable quality. Diversion at Mallard Slough under Permit # 19856 is limited to August 1 – December 31. No diversion is allowed under Permit # 19856 when release of supplemental CVP and SWP project water is required to meet in basin entitlements (SWRCB Term 91). Instantaneous diversions at Mallard Slough Pump Station are limited to 39.3 cfs under License #10514 and 39.3 cfs under Permit #19856.
SWRCB
When diversions at Mallard Slough are unavailable, CCWD relies completely on diversions from Rock Slough, Old and Middle River into the Contra Costa Canal and during blending periods, releases from Los Vaqueros Reservoir.

Water Management Plan
CONTRA COSTA WATER DISTRICT 20
9. Proposed Changes or Additions to Facilities and Operations for the Next 5 Years Rock Slough Fish Screen In 2011, Reclamation completed construction of a state-of-the-art fish screen at the Rock Slough intake to the Contra Costa Canal. The fish screen was required by the Central Valley Project Improvement Act (CVPIA) and the U.S. Fish and Wildlife Service’s Los Vaqueros Project Biological Opinion on Delta Smelt. Reclamation began work on the project in 1996, but suspended the effort in 1998 due to lack of funding from the CVPIA cost sharing agencies. In FY10, the District and Reclamation acquired funding from the American Recovery and Reinvestment Act for project construction. Although initial construction has been completed, the facility has experienced repeated mechanical failures, releases of hydraulic fluid, and excessive maintenance. Given the ongoing operating and mechanical issues with the new screen, the District has yet to assume the long term maintenance and operation of the Fish Screen under its contract with Reclamation. In June 2013, the District entered into an Assistance Agreement under which Reclamation agreed to reimburse the District for efforts to prevent fish capture, complete outstanding land transactions, and identify modifications needed to increase the reliability and safety of the facility with the understanding that additional funding would be needed to implement the identified modifications. The District changed operations to prevent sensitive species capture, installed a prototype fish screen rake, and completed a comprehensive assessment of needed improvements. The District is in the process of implementing the improvements needed to enable the District to operate and maintain the facility safely, effectively, and efficiently. Improvements include construction of an access deck to facilitate repairs, rake head and hydraulic system upgrades and a boat launch and ramp to support removal of aquatic weeds. Canal Replacement Project CCWD is also implementing the Canal Replacement Project which consists of lining or encasement of approximately four miles of the Contra Costa Canal from the Rock Slough Intake to Pumping Plant No. 1. The purpose of the project is to improve source water quality at the Rock Slough Intake by hydraulically isolating the high saline groundwater from the Canal. The project will also increase public safety and flood control. Construction of the approximately 2,000-foot initial phase was completed in 2010. Phase 2, which encased an additional 5,500 feet in a pipe was completed in 2015. Phases 3 and 4 are in the preliminary planning and design stages, with construction scheduled to begin in 2018. The project is being completed in phases, with each phase of the project spanning a specific reach of the Canal with unique project partners, funding sources, and benefits. C. Topography and Soils This section describes the topography and soil types within the CCWD service area and their impact on the operation of the untreated and treated water systems. The impact of soil on the use of water within CCWD's service area is also discussed.
1. Topography and its Impact on Water Operations and Management CCWD's service area consists of two general physiographic regions: the Diablo Range and the Sacramento-San Joaquin Delta. The Diablo Range within the CCWD service area consists of

Water Management Plan
CONTRA COSTA WATER DISTRICT 21
smooth rolling hills in central and northern portions of the service area to fairly rugged mountains along Marsh Creek Road. The eastern part of the service area is characterized by level floodplains along with gently rolling hills, with large areas of windblown sands developed on the level flood plains (US Soil Conservation Service, Soil Survey of Contra Costa County, September 1977). Within CCWD's existing TWSA boundary, most of the growth projected is in the higher elevations on the surrounding hillsides. The terrain and soils in these locations are not expected to cause a per capita water use significantly different from the rest of CCWD’s TWSA. Elevations within CCWD's TWSA vary from 0 feet to over 1,000 feet above sea level. Eight water pressure zones maintain adequate pressures in the CCWD's TWSA. A higher per capita demand in the eastern portion of the service area has been partly attributed to the high permeability of sandy soils in the vicinity of the City of Oakley.
2. District’s Soil Associations (DNA) This section does not apply to CCWD.
3. Limitation Resulting from Soil Problems (DNA) This section does not apply to CCWD. D. Climate This section describes the general climate within CCWD's service area including average precipitation, maximum and minimum temperatures, wind velocities and annual number of frost-free days. The topic of microclimates and their effect on water management and operations is addressed.
1. General Climate of the District Service Area CCWD's service area generally has hot, dry summers and cool and wet winters. In summer, a steady marine wind blows through the Golden Gate and up the Carquinez Strait. Velocities of 15 to 25 knots or more are common late in the afternoon and in the evening, generally 10 knots or less in the morning. The jet of air sweeping eastward through the straits curls northward and southward in the vicinity of Antioch. In December and January, tule fog is common and may last for several days. Frequently this fog drifts into the small inland valleys. Average annual precipitation ranges from approximately 13 inches in Brentwood to 22 inches in Walnut Creek. The differences reflect proximity to the coast and elevation. Tables 1-11 and 1-12 show the average monthly and annual evapotranspiration, precipitation and temperature for Brentwood and Concord, representing East County and Central County conditions, respectively.

Water Management Plan
CONTRA COSTA WATER DISTRICT 22
TABLE 1-11. GENERAL CLIMATE OF THE DISTRICT SERVICE AREA (EAST COUNTY)
Brentwood CIMIS Station (ID =047), Data Period 1986-2015 Jan Feb Mar Apr May Jun Jul Aug Sep Oct Nov Dec Annual
Avg Total Precip. (in.) 2.39 2.39 1.37 0.77 0.58 0.30 0.11 0.13 0.26 0.74 1.22 2.40 12.65 Avg Temp.(F) 47 51 56 59 65 70 74 73 70 63 53 46 60
Avg Max. Temp. (F) 56 61 67 72 78 85 91 90 86 77 65 55 74 Avg Min. Temp. (F) 38 42 45 46 50 55 56 56 54 49 42 37 47
Monthly Avg Eto (in) 1.16 1.93 3.76 5.40 7.13 8.00 8.38 7.26 5.69 3.87 1.97 1.19 55.70
TABLE 1-12. GENERAL CLIMATE OF THE DISTRICT SERVICE AREA (CENTRAL COUNTY)
Concord CIMIS Station (ID =170), Data Period 2001-2015 Jan Feb Mar Apr May Jun Jul Aug Sep Oct Nov Dec Annual
Avg Total Precip. (in.) 1.93 2.45 1.80 1.25 0.59 0.20 0.05 0.01 0.04 0.73 1.33 3.67 14.06 Avg Temp.(F) 46 51 54 57 62 67 69 68 67 61 52 46 58
Avg Max. Temp. (F) 66 76 76 74 85 85 90 87 86 82 68 60 78 Avg Min. Temp. (F) 31 34 40 42 46 52 55 54 52 44 36 29 43
Monthly Avg Eto (in) 1.29 1.88 3.42 4.62 6.33 7.15 7.47 6.68 5.06 3.32 1.76 1.09 50.06
Average wind velocity: 7.4 mph Average annual frost-free days: 250-330 Average wind velocity is from the Western Regional Climate Center database for the Concord Buchanan Field station. Number of frost-free days is from the Survey of Contra Costa County, California, United States Department of Agriculture Soil Conservation Service, 1977.
2. Impact of Microclimates on Water Management within the District The per capita demands are similar for all areas except the areas in East County, which have a higher per capita demand. The higher per capita demand is likely a result of several factors, including slightly higher temperatures, the rapid housing growth and resultant new landscaping, and increased watering rates due to the high permeability of sandy soils. E. Natural and Cultural Resources This section contains a description of the known water-dependent environmental and recreational resources within the CCWD service area. The improvement or management of these resources by CCWD or other agencies is indicated.
1. Natural Resources Areas within the District Responsibility for improvement or management of most of the environmental resources identified within CCWD's service area is reflected by Contra Costa County’s classification of areas as either

Water Management Plan
CONTRA COSTA WATER DISTRICT 23
a significant Ecological Resource Area or as Open Space. CCWD manages only the lands that it owns. The Los Vaqueros watershed is owned by CCWD and is managed to protect water quality and enhance the area's natural resources.
TABLE 1-13. NATURAL RESOURCE AREAS WITHIN THE SERVICE AREA
Name Estimated Acres
Description
Martinez Regional Shoreline 344
Preserve with a mix of uses for recreation and wildlife habitat management(a) Tidal marsh supports salt marsh harvest mouse, California clapper rail and possibly California black rail. Ornate shrew, black-shouldered kite and Suisun song sparrow also occur here.(b)
Point Edith State Wildlife Area 760
The Tidal Marsh consists of numerous water channels and tiny ponds and is managed by the California Department of Fish and Game.(c) Tidal marsh supports salt marsh harvest mouse, California clapper rail and possibly California black rail. Ornate shrew, black-shouldered kite and Suisun song sparrow also occur here. (b)
Big Break Regional Shoreline
40 Home to 70 species of birds and several species of mammals. Twenty-seven special-status wildlife species have the potential to occur; six special-status wildlife species are known to occur. Nesting is confirmed for black rails, northern harriers, white-tailed kites, and yellow-breasted chats.(d)
Bay Point Regional Shoreline
150 This marsh area is habitat for salt marsh harvest mouse and the California black rail.(e)
Lime Ridge Open Space
1,150 Supports Mt Diablo Manzanita, and a buckwheat subspecies which is endemic to Lime Ridge.(b)
Antioch Dunes National Wildlife
Refuge
70 Small and only remaining remnants of riverine dunes. The remaining dunes support rare and/or endangered plants, at least six endangered and/or endemic insects and the California legless lizard.(b)
John Muir National Historic Site – Mt.
Wanda
325 Preserve encompassing Mount Wanda, an oak woodland and grassland area within the John Muir National Historic Site.(f)
Los Vaqueros Watershed
18,500 Isolated areas associated with vernal pools, wetlands, and native bunchgrasses. Protected and managed by CCWD to enhance area’s natural resources. Portions of the area are of biological importance because of the presence of historical eagle nests and other outstanding natural features. This area provides habitat for the following species: San Joaquin kit fox, Alameda whipsnake, tri-colored blackbird, California red-legged frog, California tiger salamander, western pond turtles and freshwater shrimp. Alkali Meadows and Northern Claypan Vernal Pools, both of which are considered to be rare statewide, occur in isolated area.
(a) http://www.ebparks.org/parks/martinez (b) Source: 2005 Contra Costa County General Plan (c) http://www.dfg.ca.gov/lands/wa/region3/pointedith.html (d) http://www.ebparks.org/parks/big_break (e) http://www.ebparks.org/files/Bay_Point_text.pdf (f) http://www.nps.gov/jomu/index.htm

Water Management Plan
CONTRA COSTA WATER DISTRICT 24
2. Description of District Management of the Resources in the Past or Present CCWD does not deliver water to or manage any of the listed natural resources in the above Table 1-13, with the exception of Los Vaqueros Watershed. Description of CCWD management of Los Vaqueros Watershed is provided in the following section.
3. Recreational Areas within the Service Area Contra Loma Reservoir The Contra Loma Reservoir is a regional 771-acre park jointly managed by CCWD, Reclamation, and the East Bay Regional Park District (EBRPD). The reservoir currently allows the water related recreational activities of fishing, canoeing, limited swimming, and windsurfing. CCWD has constructed a separate swim lagoon facility to isolate body contact activities from this drinking water supply. Contra Costa Canal Regional Trail The Contra Costa Canal Regional Trail is a 12.82-mile greenbelt established along the Contra Costa Canal linking Concord, Pleasant Hill, Walnut Creek, and Pacheco. The trail was constructed by the EBRPD and is operated by the EBRPD under a license agreement with CCWD. The trail has a paved pathway for walkers, joggers, and bicyclists, with room alongside for equestrians.
Delta DeAnza Regional Trail The EBRPD also operates the Delta De Anza Regional Trail within CCWD’s Service Area. The paved, multi-use hiking, bicycling and equestrian trail currently spans over 15 miles of its planned 25-mile length. When completed, it will generally follow the alignment of the Contra Costa Canal. The trail intersects Antioch's Mokelumne Trail and the Marsh Creek Regional Trail in Oakley. It connects the cities of Concord, Bay Point, Pittsburg, Antioch and Oakley and provides access to Contra Loma Regional Park (and Black Diamond Mines Regional Preserve) through Antioch Community Park.
Los Vaqueros Watershed The Los Vaqueros watershed is located about 8 miles south of the city of Brentwood. It consists of 18,500 acres of protected open space surrounding the Los Vaqueros Reservoir, which holds 160,000 acre-feet of stored drinking water. The project's primary purpose is to improve water quality, but the watershed is also open year-round to the public for recreational uses. The watershed offers hiking and multi-use trails, picnic facilities, restrooms and three staging areas. Additional recreational facilities include a marina recreation area with fishing piers, rental boats, bait sales, a dock, fish cleaning stations, an interpretive center with museum displays, and a group picnic area. 4. National Register of Historic Places within the District The United States Bureau of Reclamation (Reclamation) Contra Costa Canal (Canal) has been determined eligible for listing in the National Register of Historic Places at the state level for its association with the construction and operation of the Central Valley Project (CVP), and at the
Water Management Plan
CONTRA COSTA WATER DISTRICT 25
local level for its association with the economic development of eastern Contra Costa County. When working with Reclamation on projects that impact the Canal or CVP Inclusion reviews for developments seeking new water service from CCWD or its wholesale customers, the District prepares and submits projects documents for review pursuant to Sections 106 of the National Historic Preservation Act (NHPA), which requires agencies to initiate consultation with the State Historic Preservation Officer (SHPO) as part of the Section 106 review process. F. Operating Rules and Regulations This section references CCWD's Code of Regulations related to water allocation and water transfer policies. Relevant sections of CCWD's Code of Regulations are included in Appendix C.
1. District’s Operating Rules and Regulations See Appendix C for the District Code of Regulations sections related to operating rules and regulations.
2. District’s Agricultural Water Allocation Policy (DNA) No Ag; this section does not apply to CCWD.
3. Official and Actual Lead Times Necessary for Water Orders and Shut Off (DNA) No Ag; this section does not apply to CCWD.
4. District’s Policies Regarding Surface and Subsurface Drainage from Farms (DNA) No Ag; this section does not apply to CCWD.
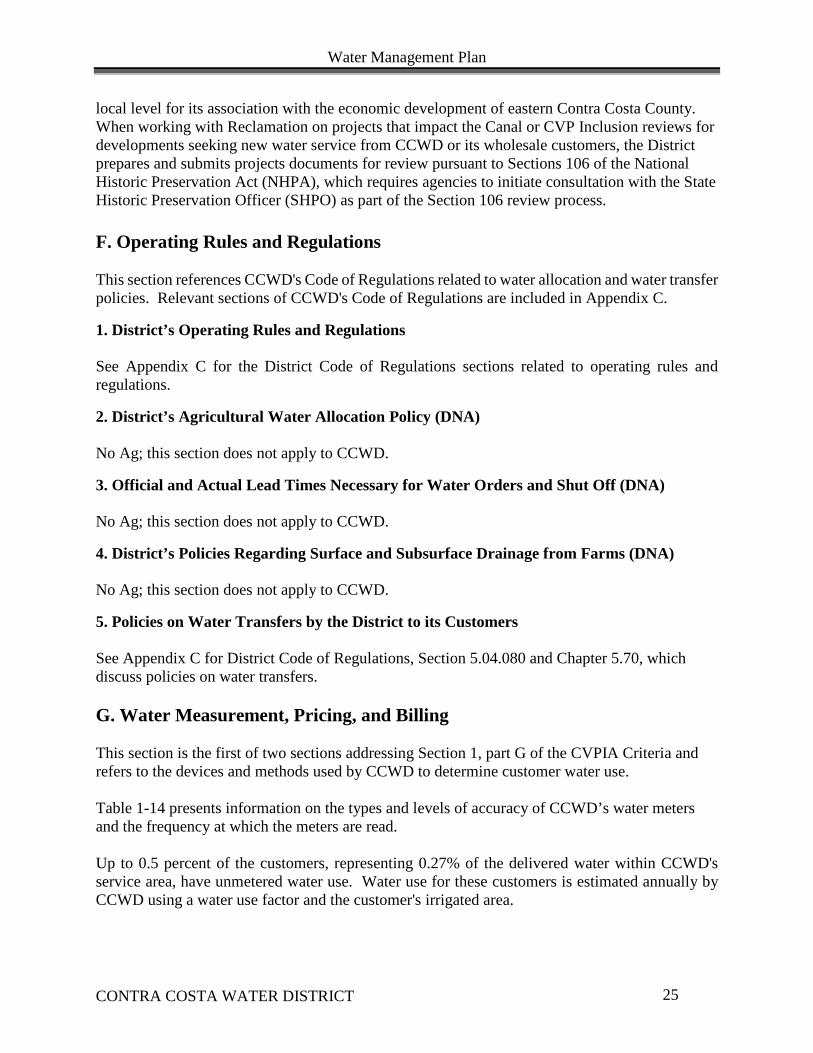
5. Policies on Water Transfers by the District to its Customers See Appendix C for District Code of Regulations, Section 5.04.080 and Chapter 5.70, which discuss policies on water transfers. G. Water Measurement, Pricing, and Billing This section is the first of two sections addressing Section 1, part G of the CVPIA Criteria and refers to the devices and methods used by CCWD to determine customer water use. Table 1-14 presents information on the types and levels of accuracy of CCWD’s water meters and the frequency at which the meters are read. Up to 0.5 percent of the customers, representing 0.27% of the delivered water within CCWD's service area, have unmetered water use. Water use for these customers is estimated annually by CCWD using a water use factor and the customer's irrigated area.
Water Management Plan
CONTRA COSTA WATER DISTRICT 26
Water delivery measurement requirements are also contained in the “Long-Term Contract between the United States and Contra Costa Water District Providing for Project Water Service and for Facilities Repayment”. In November 1994, CCWD submitted a Customer Measurement Report to comply with the contract requirements. Reclamation provided a letter in July 1995 indicating that CCWD’s water measurement practices are in substantial compliance with the terms of the amendatory contract and BMPs. A copy of the Reclamation approval letter is provided as Appendix D. CCWD flat rate (billed by acreage) customer accounts are primarily used for landscape irrigation and receive untreated water from the Contra Costa Canal. The domestic (potable) service to residences that have flat rate accounts is metered by CCWD or one of its wholesale customers. CCWD has taken the following actions with respect to the flat rate customers: • CCWD does not allow any new flat rate customers. • CCWD does not allow a flat rate service to continue when a residence changes ownership.
The flat rate account is closed and all new services must be metered and billed volumetrically.
• CCWD has been proactive in metering accounts when technically or economically feasible and has been successful in obtaining grants from the Bureau of Reclamation to enhance efforts to bill all accounts by quantity.
In the year 2000, there were 476 flat rate customer accounts. There are currently 278 flat rate customer accounts, which amount to less than 0.27% (194 acre-feet) of the water delivered by CCWD. During the next five years, CCWD will continue to evaluate opportunities to reduce the number of remaining flat rate accounts.
(a) Calibration and maintenance procedures vary by meter size. See Table 1-15 and 1-16. If a line shutdown is performed, calibration and maintenance occur within three days after service is restored.
TABLE 1-14. WATER MEASUREMENT DEVICES FOR WATER DELIVERIES TO CCWD CUSTOMERS(a)
Type Accuracy Calibration (months)
Maintenance (months)
Venturi ±2% 6-12 6-12 Impeller ±2% 6-12 6-12 Propeller ±2% 6-12 6-12 Tube Meters ±2% 6-12 6-12 Disc Meter ±2% 6-12 6-12 Compound Meter ±2% 6-12 6-12

Water Management Plan
CONTRA COSTA WATER DISTRICT 27
Urban Customers This section provides information on the number of connections and measurement devices used to assess the quantity, timing, and location of water use in calendar year 2015. A1. Total number of treated water connections 61,312 A2. Total number of untreated water connections 405 B. Total number of metered connections (treated and untreated water) 61,437 C. Total number of connections not billed by quantity 305 D. Percentage of water that was measured at customer delivery point 99.7 Calculated as one minus the total unmetered water deliveries, divided by the total canal
deliveries. E. Percentage of delivered water that was billed by quantity 91.1 Calculated as one minus the unaccounted water estimate, divided by the total water
supply plus the change in Los Vaqueros Storage. F. Tables 1-15 and 1-16 provide information on CCWD’s measurement devices for both treated and untreated water customers.

Water Management Plan
CONTRA COSTA WATER DISTRICT 28
TABLE 1-15. MEASUREMENT DEVICE TABLE TREATED WATER FOR URBAN CUSTOMERS
Meter Size and Type
Number Accuracy (+/-percentage)
Reading Frequency
(Days)
Calibration Frequency (Months)
Maintenance Frequency (Months)
5/8-3/4" 54,486 2 60 As needed As needed 1" 2,950 2 60 As needed As needed 1 ½" 1,441 2 60 As needed As needed 2" 1,059 2 60 As needed As needed 3" 135 2 60 Annually Annually 4" 271 2 60 Annually Annually 6" 563 2 60 Annually Annually 8" 252 2 60 Annually Annually 10" 17 2 60 Annually Annually 12” 4 2 60 Annually Annually Compound(a) 134 2 60 As needed As needed Total 61,312
(a) Compound meters include Dual 1-1/2” and Dual 2” meters.
TABLE 1-16. MEASUREMENT DEVICE TABLE UNTREATED WATER
Meter Size and Type
Number Accuracy (+/-percentage)
Reading Frequency
(Days)
Calibration Frequency (Months)
Maintenance Frequency (Months)
1" 20 2 30 As needed As needed 2" 52 2 30 As needed As needed 3" 16 2 30 As needed As needed 4" 21 2 30 As needed As needed 6" 19 2 30 As needed As needed 8" 5 2 30 6 6 10” 1 2 30 6 6 12” 2 2 30 6 6 14” 1 2 30 6 6 18” 1 2 30 6 6 20” 3 2 30 6 6 24” 2 2 30 6 6 30” 2 2 30 6 6 48” 2 2 30 6 6 Total 146
(a) This table does not include landscape estimated usage meters.
1. District’s Current Year Water Charges See Appendix C for Sections 5.20.010 through 5.20.060 and Chapter 5.12 of CCWD's Code of Regulations, which discuss CCWD’s municipal and industrial water charges, including the rate structure, billing frequency, and assessments.

Water Management Plan
CONTRA COSTA WATER DISTRICT 29
2. Annual Charges Collected from Customers Annual charges include fixed and volumetric components. See Appendix C for Sections 5.20.010 through 5.20.060 and Chapter 5.12 of CCWD's Code of Regulations, which discuss CCWD’s municipal and industrial water charges.
3. Water-Use Data Accounting Procedures Untreated water billing history is available in hard copy from 1982. Five years of billing history for untreated (monthly) and treated water customers (bimonthly) is maintained in CCWD’s customer service database. This information is available to customers upon request. The bimonthly billings of the CCWD's treated water customers provide comparative consumption figures (in gallons per day) for the current period and the same period in the prior year. H. Water Shortage Allocation Policies CCWD’s primary supply is a contract with Reclamation for CVP water. The contract provides for a maximum CVP delivery of 195,000 af/yr, with a reduction in deliveries during water shortages including regulatory restrictions and drought. The M&I Water Shortage Policy defines the reliability of CCWD’s CVP supply and was developed by Reclamation to establish CVP water supply levels that would sustain urban areas during severe or continuing droughts. The M&I Water Shortage policy provides for a minimum allocation of 75 percent of adjusted historical use until irrigation allocations fall below 25 percent. In addition, Reclamation will deliver CVP water to CCWD at not less than a public health and safety water supply level, provided CVP water is available, if the Governor declares an emergency due to water shortage or if an emergency exists due to water shortage. CCWD’s has estimated its minimum public health and safety level as 65% of demand. The Long-Term Renewal Contract included a review of CCWD’s historical use and determined for the purpose of the Municipal & Industrial (M&I) Water Shortage Policy implementation that CCWD’s historical use was 170,000 acre-feet (Exhibit B of the contract). This section describes CCWD’s water shortage allocation policies for its retail and municipal customers including wasteful use prohibitions and enforcement methods.
1. Current Year Water Shortage Policies The Urban Water Management Planning Act was amended in 1991 to require urban water suppliers to have an Urban Water Shortage Contingency Plan (Shortage Plan) as part of the Urban Water Management Plan. Appendix E contains CCWD's most recent Shortage Plan, adopted by CCWD in June 2016. The Shortage Plan addresses the short-term or emergency management issues that occur during a drought or other water shortage condition. To manage a water supply shortfall condition, four demand reduction stages have been defined. The Shortage Plan will help CCWD anticipate drought conditions and to mitigate impacts including a supply shortfall and financial hardships on both the community and CCWD. In response to severe drought conditions in 2015, the Governor of California issued Executive Order B-29-15, which mandated a Statewide conservation target of 25% below the baseline year

Water Management Plan
CONTRA COSTA WATER DISTRICT 30
of 2013, which varied by agency. CCWD’s mandated conservation target was 28% below 2013 levels. Resolution15-01 establishing the 2015 Drought Management Plan is also included in Appendix E. CCWD has since transitioned to a voluntary water conservation program.
2. Policies that Address Wasteful Use of Water and Enforcement Methods See Appendix F - Resolution No. 16-01 - Water Waste Prohibitions within the Area Served by the District. See also CCWD Code of Regulations Section 5.44.010 for general policies regarding the practice of water waste (Appendix C). I. Evaluate Policies of Regulatory Agencies Affecting the Contractor and Identify Policies that Inhibit Good Water Management California has experienced severe drought conditions beginning in 2013 that have continued into the present. The State of California has taken steps to mitigate water shortages throughout the state by use of emergency executive orders issued by the governor. In June 2015, Executive Order B-29-15 included emergency drought regulations that called for state-wide water use reductions of 25%, as compared to water usage in 2013. CCWD’s local water use reduction target was set by the State at 28%. Many agencies, including CCWD, have expressed concerns to the State in using the current water reduction targets as the primary conservation method, especially in areas where water supplies have not been severely impacted and/or where investments have been made to ensure supplies during water shortage events. The State continues to discuss and evaluate conservation implementation.

Water Management Plan
CONTRA COSTA WATER DISTRICT 31
SECTION 2: Inventory of Water Resources A. Surface Water Supply CCWD is almost entirely dependent on the Delta for its water supply. CCWD's primary source is the United States Bureau of Reclamation's (Reclamation) Central Valley Project (CVP). CVP water consists of unregulated and regulated flows from storage releases primarily from Shasta, Folsom, and Clair Engle reservoirs into the Sacramento River. Other CCWD sources include the San Joaquin River, Mallard Slough, recycled water, a minor amount of local well water, and water transfers. DISTRICT SUPPLIES Central Valley Project Supply CCWD’s long-term CVP contract was renewed in May 2005 and has a term of 40 years (contract No. 175r-3401a-LTR1). The contract with the Reclamation provides for a maximum delivery of 195,000 af/yr from the CVP, with a reduction in deliveries during water shortages including regulatory restrictions and drought. The M&I Water Shortage Policy defines the reliability of CCWD’s CVP supply and was developed by Reclamation to (1) define water shortage terms and conditions applicable to all CVP M&I contractors, as appropriate; (2) establish CVP water supply levels that would sustain urban areas during droughts, and during severe or continuing droughts would assist the M&I contractors in their efforts to protect public health and safety; and (3) provide information to M&I contractors for development of drought contingency plans. The current M&I Water Shortage Policy provides for a minimum shortage allocation of 75 percent of adjusted historical use until irrigation allocations fall below 25 percent. In addition, Reclamation will deliver CVP water to CCWD at not less than a public health and safety water supply level, provided CVP water is available, if the Governor declares an emergency due to water shortage or if an emergency exists due to water shortage. In 2015, in response to the Governor-declared drought emergency, CVP only delivered public health and safety supply to CCWD. Los Vaqueros Water Rights CCWD obtained additional water rights for surplus Delta flows as part of the Los Vaqueros Project. Under Water Rights Permit No. 20749, up to 95,980 acre-feet may be diverted for storage in Los Vaqueros between November 1 of each year and June 30 of the succeeding year. The Los Vaqueros Water Right supply can be used in lieu of the CVP supply. When the Los Vaqueros water right is used, CVP supplies are reduced by an identical amount. Combined deliveries of Los Vaqueros Water Rights water and CVP water are limited to 195,000 acre-feet/year. Little or no Los Vaqueros Water Rights water is available for diversion to storage in dry years.

Water Management Plan
CONTRA COSTA WATER DISTRICT 32
Mallard Slough Supply CCWD has additional water rights at Mallard Slough for a maximum diversion of up to 26,780 af/yr of Delta water. Diversions from Mallard Slough are unreliable due to frequently poor water quality in the San Joaquin River at this point of diversion. Water quality conditions have restricted diversions from Mallard Slough to approximately 3,100 acre-feet per year (on average from 1968 to present) with none available in dry years. When Mallard Slough supplies are used, CVP diversions are reduced by an equivalent amount. East Contra Costa Irrigation District CCWD entered into an agreement with the East Contra Costa Irrigation District (ECCID) in 2000 to purchase surplus irrigation water for M&I purposes within ECCID’s service area. Only a portion of ECCID is within the existing CCWD service area (estimated current demand of 6,000 af/yr). The current ECCID agreement allows CCWD to purchase up to 8,200 af/yr for service in the overlap area with ECCID. The agreement also includes an option for CCWD to purchase up to 4,000 af/yr of groundwater (by exchanges) when the CVP is in a shortage situation. This exchange water can be used anywhere within CCWD’s service area. NON-DISTRICT SUPPLIES City of Brentwood The City of Brentwood has an agreement with ECCID to receive up to 14,800 af/yr of surplus irrigation water to use for M&I purposes within Brentwood’s city limits. CCWD wheels water for City of Brentwood customers located inside and outside of the CCWD service area. City of Antioch The City of Antioch has rights to water from the San Joaquin River and can currently divert water at a rate of up to 35 cfs. Actual diversions from the river are limited due to poor water quality that often exists in the San Joaquin River. When supplies from the San Joaquin are unavailable, Antioch relies on untreated water deliveries from CCWD to meet remaining customer demand. Recycled Water Water recycling is a component of CCWD’s long-term sustainable water supply strategy and CCWD cooperates with local wastewater agencies proposing to provide recycled water for appropriate designated uses. Over 10,000 acre-feet per year, or approximately 10% of CCWD’s total water deliveries, was recycled wastewater used within CCWD’s service area. The four wastewater treatment plants within CCWD’s service area comprise the total potential sources of recycled water; the Central Contra Costa Sanitary District (CCCSD), Mountain View Sanitary District (MVSD), Delta Diablo Sanitation District (DDSD), and Ironhouse Sanitary District (ISD). CCWD has agreements with CCCSD and DDSD regarding specific projects that provide recycled water supplies for industrial uses and landscape irrigation.

Water Management Plan
CONTRA COSTA WATER DISTRICT 33
In November 1995, CCCSD and CCWD reached a project specific agreement for CCCSD to purvey recycled water to areas of Concord and Pleasant Hill. Sixty-one customers were identified in the agreement as potential recycled water users. CCCSD purveys about 200 million gallons per year of recycled water for landscape irrigation to over 30 of these CCWD customers which include golf courses, school ball fields, parks and medians, a concrete recycling and batch plant, a woodchip and topsoil farm, a truck washing facility, and the Contra Costa County Animal Shelter where recycled water is used outside for both landscape irrigation and inside the buildings for kennel wash-down. The animal shelter is the first dual plumbed facility in the CCWD service area. Average day demand for recycled water identified in the project specific agreement is approximately 1,680 af/yr (1.5 mgd) with max day demands of 3,135 af/yr (2.8 mgd). CCCSD also uses almost 400 million gallons per year (1,225 af/yr or 1 mgd) of recycled water internally at its own facilities for process water at its wastewater treatment plant and for landscape irrigation. In 2004, CCCSD and CCWD established a maintenance services agreement under which CCWD provides maintenance and repair services for CCCSD’s recycled water pipeline distribution system. In 2000, DDSD and CCWD reached an agreement for DDSD to purvey recycled water to the Delta Energy Center and the Los Medanos Energy Center (DEC/LMEC). Tertiary-treated wastewater from DDSD is used for turbine cooling and make-up water in cooling towers at the energy facilities. Additional treatment of the tertiary treated wastewater, to comply with the requirements of the Department of Public Health, is done onsite with a 12.8 mgd DDSD reclamation plant. CCWD provides DEC/LMEC with up to a 10 mgd backup water supply and water for steam production and domestic uses. The recycled water facilities were operational by June 2001, and the energy centers were operational by 2002. DDSD has recently completed a filter loading evaluation and is seeking approval to increase the permitted capacity of this facility to 16.4 mgd. DDSD also provides recycled water to a number of irrigation customers and the Dow wetlands as part of the DEC/LMEC agreement. The total demand for these additional customers is approximately 80 af/yr. In 2004, DDSD and CCWD reached a General Agreement allowing DDSD to provide recycled water to additional users who were not included in the April 2000 agreement. DDSD and the City of Pittsburg completed a facilities plan in January 2005, which focused on developing additional recycled water facilities to provide irrigation supply for municipal parks and the Delta View Golf Course. In 2006, DDSD completed a facilities plan for the City of Antioch that proposed extending recycled water service to provide landscape irrigation to sites in Antioch, including the Lone Tree Golf Course and at parks, playing fields, medians and other green spaces in Antioch. The project was dedicated in 2010 and is expected to be operational in 2011. In the 5 years from 2005 to 2009 DDSD supplied an average of 7,400 af/yr (6.6 mgd) of recycled water deliveries to DEC/LMEC and for irrigation to local public parks and median landscapes in the City of Pittsburg. A description of each of CCWD’s water supply sources is also provided in Tables 1-4 and 1-5 in Section 1.A.4.

Water Management Plan
CONTRA COSTA WATER DISTRICT 34
1. Amount of Surface Water Delivered to the District by each of the District’s Sources The amount of surface water diverted by CCWD by each of the CCWD sources in 2015 is displayed in Table 2-1. Information on water delivered to CCWD for the past 10 years is presented in Table 2-2.
TABLE 2-1. 2015 SURFACE WATER SUPPLY
DISTRICT SUPPLY NON-DISTRICT SUPPLY
2015 Month
Federal Urban Water (CVP) (AF)
Federal Agric. Water (AF)
Los Vaqueros
Water Rights (AF)
Mallard Water Rights (AF)
ECCID(a) (AF)
City of Brentwood
(AF)
City of Antioch
(AF)
Recycled Water(b)
(AF) Total(c) (AF)
January 3,317 0 0 0 220 35 463 612 4,647 February 2,161 0 0 0 235 191 596 315 3,498 March 11,352 0 3,199 0 375 296 196 356 15,774 April 5,788 0 0 0 700 400 0 511 7,399 May 1,737 0 0 0 1,295 539 0 519 4,090 June 2,537 0 0 0 1,624 486 0 876 5,523 July 4,840 0 0 0 1,305 404 0 888 7,438 August 5,197 0 0 0 1,115 397 0 911 7,621 September 5,857 0 0 0 856 392 0 923 8,029 October 4,864 0 0 0 931 554 0 931 7,281 November 3,718 0 0 0 333 364 0 628 5,044 December 3,438 0 0 0 245 278 0 618 4,580 TOTAL 54,806 0 3,199 0 9,238 4,335 1,255 8,087 80,918 (a) Includes CCWD/ECCID and City of Brentwood inside CCWD (b) Does not include in-plant or wildlife habitat enhancement and wetland uses. (c) Does not include groundwater use or temporary water transfers to/from other parties.

Water Management Plan
CONTRA COSTA WATER DISTRICT 35
TABLE 2-2. ANNUAL WATER QUANTITIES RECEIVED UNDER EACH RIGHT OR CONTRACT (PAST 10 YEARS)
D I S T R I C T N O N – D I S T R I C T
Year
Federal Urban Water (CVP)
Federal Agricultural
Water
Los Vaqueros
Water Rights
Mallard Water Rights ECCID(a)
Water Transfers(b)
City of Brentwood
City of Antioch
Recycled Water(c) Totald)
(AF) (AF) (AF) (AF) (AF) (AF) (AF) (AF) (AF) (AF) 2006 91,971 0 20,448 1,788 3,974 0 3,680 7,958 7,584 137,404 2007 90,886 0 5,115 0 8,721 0 6,486 4,810 8,675 124,693 2008 92,814 0 18,878 0 10,654 0 6,797 5,477 7,558 142,177 2009 90,773 0 4,242 576 11,739 0 6,114 5,144 7,968 126,557 2010 67,112 0 0 1,736 9,000 0 5,761 7,617 6,750 97,975 2011 76,251 0 11,020 3,773 7,752 0 6,638 10,977 6,967 123,378 2012 130,335 0 5,180 0 7,779 0 7,261 5,166 9,500 165,222 2013 120,660 0 20,113 0 7,779 1,999 6,037 4,755 9,575 170,917 2014 79,878 0 0 0 7,779 0 5,234 1,601 8,569 103,061 2015 54,806 0 3,199 0 9,238 0 4,333 1,255 8,087 80,918
Total 895,486 0 88,196 7,873 84,415 1,999 58,339 54,760 81,233 1,272,302 Average 89,549 0 8,820 787 8,442 200 5,834 5,476 8,123 127,230 (a) Includes CCWD/ECCID overlap and City of Brentwood inside CCWD.
(b) Includes transfer in 2013 from WID (1,999 AF). (c) Does not include in-plant or wildlife habitat enhancement and wetland uses. (d) Does not include groundwater use or water transferred from CCWD to other parties.
B. Ground Water Supply This section describes the general characteristics of the groundwater basins that underlie CCWD's service area. CCWD does not overlie a usable groundwater basin, as locations with groundwater are small and generally unconnected. CCWD relies upon surface water for its supply. Historical evaluations of local groundwater supplies show them to be marginal based on both quality and availability. Local groundwater resources have low to moderate potential for additional development. As a result of the geologic formations and proximity to the sea, groundwater resources are often poor in terms of M&I water quality requirements and low in yield. Currently, the City of Brentwood, ECCID, DWD, GSWC, and the City of Pittsburg utilize groundwater wells to supplement surface supplies and to increase reliability. The estimated total use of groundwater within CCWD boundaries in 2015 is 3,000 AF. CCWD does not directly use or manage groundwater, but is currently coordinating with City of Antioch, City of Brentwood, Byron-Bethany Irrigation District, Contra Costa County, Diablo Water District, East Contra Costa Irrigation District, and Town of Discovery Bay to form a Groundwater Sustainability Agency for the Contra Costa portion of the Tracy groundwater sub-basin. The GSA is being formed in response to the Sustainable Groundwater Management Act, which became effective January 1, 2015 and established a framework of priorities and requirements to facilitate sustainable groundwater management throughout the State.

Water Management Plan
CONTRA COSTA WATER DISTRICT 36
Additional information on local groundwater resources can be found in the following sources: California Department of Water Resources. California's Ground Water. Bulletin No. 118-75. (September 1975). Camp, Dresser and McKee Inc.; Kenneth R. Henneman. Ground Water Assessment Study. (October 1980). Kenneth R. Henneman, City of Brentwood. Initial Ground Water Evaluation. (October 1990). Luhdorff & Scalmanini. Investigation of Ground-Water Resources in the East Contra Costa Area. (March 1999) Luhdorff & Scalmanini Consulting Engineers, Inc. Diablo Water District Groundwater Management Plan for AB 3030. (May 2007) Tolman, C.F.; B.C. Hyde; C. Killingworth. Stanford University. Ground Water Supply and Saline Contamination of Pittsburg and Adjacent Area, Contra Costa County, California. (February 1931). U.S. Bureau of Reclamation. Factual Report: Contra Costa Water District. (November 1950).
1. Acre-foot Amounts of Groundwater Pumped and Delivered by the District CCWD does not manage groundwater, but estimates total use within CCWD boundaries at approximately 3,000 af/yr.
2. Groundwater Basin(s) that Underlies the Service Area Based on basin characteristics summarized in this section, local use of groundwater resources is low and not expected to significantly increase. The CCWD Treated Water Service Area overlies the Clayton Valley Groundwater Basin. The Bay Point/Pittsburg area overlies the Pittsburg Plain Groundwater Basin, while the Antioch, Brentwood and Oakley area overlies a portion of the Tracy Groundwater Subbasin, within the San Joaquin Valley Groundwater Basin.
3. Contractor Operated Wells and Managed Groundwater Recharge Areas CCWD does not currently operate any groundwater recharge areas. The only wells owned and operated by CCWD are immediately adjacent to Mallard Reservoir. The Mallard Wells were installed in 1977-1978 to provide an alternative source of water during drought periods. The wells do not augment CCWD's long-term water supplies and only have limited use (less than 1,000 af/yr) as an alternative short-term supply. Table 2-3 lists information about the CCWD wells.

Water Management Plan
CONTRA COSTA WATER DISTRICT 37
TABLE 2-3. CCWD OPERATED WELLS
Name (State ID #) (T, R & S)(a) Pumping
capacity Spring depth(b)
(ft) Fall depth (b)
(ft) RD-1 (#36419) T2N, R2W,
S14 500 gpm 13.8 34.0
RD-4 (#36423) T2N, R2W, S14
650 gpm 20.0 26.0
RD-7 (#36427) T2N, R2W, S14
650 gpm 15.0 30.2
RD-8 (#36424) T2N, R2W, S14
300 gpm 6.3 21.0
(a) Township, Range, and Section. (b) The well depths are static water levels (i.e. the pumps are off) for spring and fall months for the period from July 1992 to July 1993.
4. Description of Conjunctive Use of Surface and Groundwater CCWD does not currently have a conjunctive use program.
5. Groundwater Management Plan The groundwater basins underlying the CCWD Service Area are not adjudicated and are not reportedly overdrafted. A description of the groundwater basin for the Eastern portion of the service area is contained in the “Investigation of Groundwater Resources in East Contra Costa County” (March 1999). DWD completed a Groundwater Management Plan in May 2007, according to the procedures outlined in the Groundwater Management Planning Act [Sections 10750-10546 of the California Water Code AB 3030]. The purpose of the DWD Groundwater Management Plan is to provide a management framework for maintaining a high quality, reliable, and sustainable supply of groundwater from the Tracy Groundwater Subbasin within DWD’s sphere of influence (May 2007). The CCWD boundary overlays portions of the Tracy groundwater Sub-Basin in East Contra Costa County. A GSA for the Tracy Sub-Basin must be formed by June 2017, and a Groundwater Sustainability Plan must be completed by January 2022. The District has been collaborating on the approach to comply with SGMA with several local agencies that overlay the portion of the Tracy Sub-Basin within Contra Costa County. The participating agencies are CCWD, Byron-Bethany Irrigation District, Cities of Antioch and Brentwood, Diablo Water District, ECCID, Town of Discovery Bay, and Contra Costa County.
6. Groundwater Banking Plan There is no groundwater banking plan.

Water Management Plan
CONTRA COSTA WATER DISTRICT 38
C. Other Water Supplies
1. “Other” water used as part of the water supply This information is provided in Tables 2-1 and 2-2 in Section 2.A. D. Source Water Quality Monitoring Practices CCWD’s mission is to “strategically provide a reliable supply of high-quality water at the lowest cost possible, in an environmentally responsible manner.” CCWD obtains its water supply exclusively from the Sacramento-San Joaquin Delta and serves treated and untreated water to approximately 500,000 people in central and eastern Contra Costa County. CCWD’s Board of Directors (Board) has adopted water quality objectives in order to keep constituents of major health concern at the lowest levels that are technically feasible and provide its customers with a consistent supply of aesthetically-pleasing, high-quality water. Water quality in the Delta at CCWD’s existing intakes currently does not meet CCWD’s Board-adopted water quality objectives for extended periods each year, requiring CCWD to use the higher-quality water stored in Los Vaqueros Reservoir to blend with the directly diverted Delta water to meet CCWD’s water quality objectives. However, even with the blending benefits of the Los Vaqueros Reservoir, CCWD expects to not meet its water quality objectives during extended periods of high salinity in the Delta and expects these periods to occur more frequently in the future as statewide demands on the Delta increase. In addition, Federal and State drinking water regulations are becoming more stringent. To ensure that regulatory requirements and its water quality objectives can be met now and in the future, CCWD must take action to improve the quality of both its source and delivered water. Improving Delta water quality is the link to protecting people, the environment, and fish. CCWD is implementing a comprehensive water quality strategy to protect and improve source and treated water quality for its customers. CCWD’s multi-pronged approach includes seeking improved water quality sources, reducing impacts of Delta agricultural drainage on source water quality, participating in collaborative research on advanced water treatment of Delta water, and supporting regulatory and legislative initiatives for improving drinking water quality and source water protection.
1. Potable Water Quality (Urban only) Each year, CCWD completes an Annual Water Quality Report, in accordance with the California Department of Health Services and U.S. Environmental Protection Agency requirements. A copy of the 2015 Annual Water Quality Report showing current water quality sampling results is provided in Appendix G.

Water Management Plan
CONTRA COSTA WATER DISTRICT 39
2. Agricultural Districts (DNA) This section does not apply to CCWD.
3. Water Quality Testing Program and Role of Each Participant in the Program CCWD’s Water Quality Testing Program is discussed in the Annual Water Quality Report. The program includes testing for microbial contaminants, inorganic contaminants, pesticides, organic chemical contaminants, and radioactive contaminants. Results are included in the Annual Water Quality Report (Appendix G).
4. Current Year Water Quality Monitoring Programs Table 2-4 describes CCWD's surface water quality monitoring programs. CCWD has a regular monitoring program to measure water quality of all its untreated water sources, including stored water. Additionally, CCWD contributes to the State Department of Water Resources program entitled the "Municipal Water Quality Investigations Program (MWQI)" that monitors the Sacramento-San Joaquin Delta water quality. In addition to monitoring water quality in the Delta, the MWQI program conducts studies and activities regarding source water improvement and management.
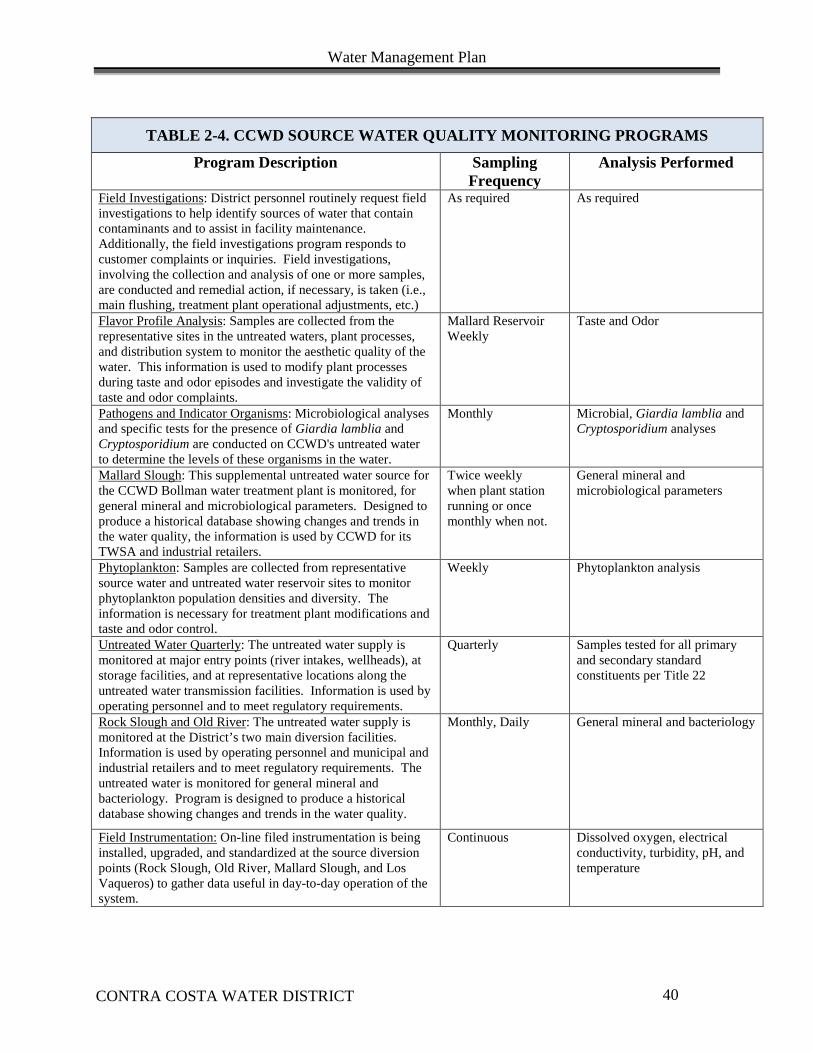
Water Management Plan
CONTRA COSTA WATER DISTRICT 40
TABLE 2-4. CCWD SOURCE WATER QUALITY MONITORING PROGRAMS
Program Description Sampling Frequency
Analysis Performed
Field Investigations: District personnel routinely request field investigations to help identify sources of water that contain contaminants and to assist in facility maintenance. Additionally, the field investigations program responds to customer complaints or inquiries. Field investigations, involving the collection and analysis of one or more samples, are conducted and remedial action, if necessary, is taken (i.e., main flushing, treatment plant operational adjustments, etc.)
As required As required
Flavor Profile Analysis: Samples are collected from the representative sites in the untreated waters, plant processes, and distribution system to monitor the aesthetic quality of the water. This information is used to modify plant processes during taste and odor episodes and investigate the validity of taste and odor complaints.
Mallard Reservoir Weekly
Taste and Odor
Pathogens and Indicator Organisms: Microbiological analyses and specific tests for the presence of Giardia lamblia and Cryptosporidium are conducted on CCWD's untreated water to determine the levels of these organisms in the water.
Monthly Microbial, Giardia lamblia and Cryptosporidium analyses
Mallard Slough: This supplemental untreated water source for the CCWD Bollman water treatment plant is monitored, for general mineral and microbiological parameters. Designed to produce a historical database showing changes and trends in the water quality, the information is used by CCWD for its TWSA and industrial retailers.
Twice weekly when plant station running or once monthly when not.
General mineral and microbiological parameters
Phytoplankton: Samples are collected from representative source water and untreated water reservoir sites to monitor phytoplankton population densities and diversity. The information is necessary for treatment plant modifications and taste and odor control.
Weekly Phytoplankton analysis
Untreated Water Quarterly: The untreated water supply is monitored at major entry points (river intakes, wellheads), at storage facilities, and at representative locations along the untreated water transmission facilities. Information is used by operating personnel and to meet regulatory requirements.
Quarterly Samples tested for all primary and secondary standard constituents per Title 22
Rock Slough and Old River: The untreated water supply is monitored at the District’s two main diversion facilities. Information is used by operating personnel and municipal and industrial retailers and to meet regulatory requirements. The untreated water is monitored for general mineral and bacteriology. Program is designed to produce a historical database showing changes and trends in the water quality.
Monthly, Daily
General mineral and bacteriology
Field Instrumentation: On-line filed instrumentation is being installed, upgraded, and standardized at the source diversion points (Rock Slough, Old River, Mallard Slough, and Los Vaqueros) to gather data useful in day-to-day operation of the system.
Continuous Dissolved oxygen, electrical conductivity, turbidity, pH, and temperature

Water Management Plan
CONTRA COSTA WATER DISTRICT 41
E. Water Uses within the District This section describes municipal and industrial water uses within CCWD's service area. CVPIA sections related to groundwater recharge, management, and banking and transfers and exchanges were not included as these sections do not apply to CCWD.
1. Agricultural (DNA) This section does not apply to CCWD.
2. Irrigation Systems Used for Each Crop (DNA) This section does not apply to CCWD. 3. Urban Tables 2-5 and 2-6 present the treated and untreated water use, by customer type, within CCWD's service area. Table 2-5 shows CCWD’s treated water use, delivered to individual customers in Concord, Clayton, and parts of Pleasant Hill, Walnut Creek and Martinez. In addition, it shows water treated by CCWD and delivered to the Diablo Water District, Antioch, Golden State Water Company (Bay Point) and Brentwood who then distribute it to their customers.
TABLE 2-5. TREATED WATER USE BY CUSTOMER TYPE IN 2015
Customer Type Number of Connections
2015 use (AF)
Single-family 53,344 12,720 Multi-family 2,512 4,630 Commercial 2,753 3,255 Industrial 4 75 Irrigation(a) 1,312 2,113 Private Fire Protection System 1,091 0 Temporary Service 91 38 Service to Public Authorities 233 767 Wholesale Municipal (b) 6 7,145 Total 61,346 30,744 (a) Irrigation includes residential, commercial and industrial, and public authority landscape irrigation service. (b) Wholesale Municipal includes Antioch Treated Water deliveries (24 AF), Brentwood supplies from Randall-Bold (1,767 AF), DWD (3,842 AF) and Golden State Water Company Treated Water deliveries (1,512 AF).

Water Management Plan
CONTRA COSTA WATER DISTRICT 42
Table 2-6 shows untreated water delivered by CCWD to industrial, municipal and other customers. The municipal water supplies delivered to Antioch, Pittsburg and Martinez are treated by those cities and delivered to their customers.
TABLE 2-6. UNTREATED WATER USE BY CUSTOMER TYPE IN 2015
Customer Type Number of Connections
2015 use (AF)
District Use Industrial 19 26,489 Wholesale Municipal(a) 6 22,489 Landscape(b) 342 1,017 Temporary 2 0 Agricultural(c) 25 28 Flushing/Fire NA 2 District Sub-Total 394 50,025 Non-District Use Groundwater(e) NA(d) 3,000 Recycled Water(f) NA(d) 8,087 City of Brentwood(g) NA(d) 4,333 City of Antioch Surface Water(h) NA(d) 1,255
Non-District Subtotal NA(d) 16,675 TOTAL 394 68,443 (a) Includes the cities of Antioch (12,014 AF), Pittsburg (6,969 AF), and Martinez (3,506 AF) who treat and deliver to their customers. (b) Includes Landscape Metered service connections. (c) CCWD agricultural customers receive additional water supplies from alternative sources. (d) Information on number of connections for Non-District usage is not available. (e) CCWD does not manage groundwater, but estimates total use within CCWD boundaries at approximately 3,000 af/yr. (f) Does not include recycled water use within CCCSD’s wastewater treatment facility or use for wildlife habitat enhancement and wetlands. (g) Water wheeled for City of Brentwood customers outside of CCWD service area. (h) City of Antioch diverts its own supply (when water quality allows use), treats and delivers to their customers.

Water Management Plan
CONTRA COSTA WATER DISTRICT 43
4. Urban Wastewater Collection and Treatment Systems Serving the District Service Area Table 2-7 lists the wastewater collection and treatment systems serving the CCWD service area. Included in the table is 2015 information on the level of treatment, quantity of water treated, and place of disposal for the treated water.
TABLE 2-7. URBAN WASTEWATER COLLECTION/TREATMENT SYSTEMS SERVING THE SERVICE AREA
Wastewater Agency
Treatment Level
Plant Capacity
Average Flow
Meets Recycled
Water Standard
(AFY) Non Recycled Disposal to:
(1,2,3) (AFY) (AFY)
Ironhouse Sanitary District (ISD) 2 4,800(a) 2,900 2,900
Evaporation, Percolation Areas, and San Joaquin
River(g) Delta Diablo Sanitation District 2 & 3 (b) 18,500 15,900 14,300 (b) New York Slough
Central Contra Costa 2 & 3 (d) 60,300(e) 43,800 4,300 Suisun Bay Sanitary District (c)
Mt. View Sanitary District 2 3,600(f) 2,200 Peyton Slough; wetlands
TOTAL 85,400 68,400 21,500
(a) Based on capacity of 4.3 mgd and ultimate capacity of 6.8 mgd (b) Capability up to 12.8 mgd (14,300 AFY) exists for level 3 treatment. (c) Sewage flows tributary to the CCCSD’s wastewater treatment plant include CCWD's TWSA and a portion of EBMUD's service area. (d) CCCSD Recycled Water Plant was originally designed for 30 MGD of tertiary capacity. Current permitted capacity is 3.8 MGD. (e) Based on dry weather permitted discharge capacity of 53.8 mgd. (f) Based on dry weather permitted discharge capacity of 3.2 mgd. (g) ISD constructed a San Joaquin River outfall in 2011 that discharges into the Delta near Jersey Island.
5. Groundwater Recharge/Management/Banking CCWD does not manage groundwater.
6. Transfers and Exchanges In the months of August and September 2015, CCWD transferred 500 AF of previously stored Los Vaqueros Water Right supply to Byron-Bethany Irrigation District (BBID) through an exchange of CCWD CVP water. BBID diverted CCWD CVP supply at their Delta point of diversion, and CCWD then released an equal amount (500 AF) of Los Vaqueros Water Right supply to the CCWD service area to complete the exchange. CCWD made similar transfers of

Water Management Plan
CONTRA COSTA WATER DISTRICT 44
previously stored Los Vaqueros Water Right supply through the exchange of CCWD’s CVP water in 2014 to both BBID (1,656 AF), and Alameda County Water District (5,000 AF). In 2013, CCWD purchased 2,000 AF from Woodbridge Irrigation District. This transfer water was delivered to CCWD through EBMUD’s Mokelumne Aqueducts, and then through the CCWD-EBMUD Intertie.
7. Trades, wheeling, wet/dry year exchanges or other transactions CCWD’s agreement with ECCID includes an option for CCWD to purchase up to 4,000 acre-feet of groundwater per year, by exchange with ECCID surface water, when the CVP is in shortage. The groundwater exchange was utilized during the 2013 - 2015 drought. In 2015, CCWD, wheeled and treated for the City of Brentwood approximately 6,200 acre-feet of water that the City of Brentwood purchased from ECCID for service in the City of Brentwood for municipal use both inside and outside the CCWD service area.
TABLE 2-8. SUMMARY OF 2015 WHEELING
From Whom To Whom AF Use East Contra Costa Irrigation District City of Brentwood 6,202 Municipal
8. Any Other Uses of Water In 1974, Mt. View Sanitary District (MVSD) constructed wetlands as a water reclamation project in response to the Clean Water Act. As plants flows increased, the original acreage of wetlands increased to 151 acres of constructed and natural marshland providing wastewater disposal. The marsh complex is an important stop over along the Pacific Flyway and a number of species use the wetlands as nesting habitat. All of MVSD’s effluent is directed through the marsh system providing a beneficial use through wildlife and wetland enhancement. F. Outflow from the District (Agricultural only) (DNA) This section does not apply to CCWD. G. Water Accounting (Inventory)
1. Overall Water Inventory The 2015 District Water Inventory is presented in Table 2-9.

Water Management Plan
CONTRA COSTA WATER DISTRICT 45
TABLE 2-9. 2015 DISTRICT WATER INVENTORY (AF)
Water Supply (Untreated Water)(a) 67,243 Environmental Consumptive Use 0 Groundwater Recharge 0 Water Exchanges or Transfers 0 Flushing/Fire -2
Distribution System Leaks & Breaks See
footnote (b).
Municipal Customer Sales(c) -22,489 Untreated Retail Sales (Industrial, Irrigation, Temporary) -27,506 Net use of Los Vaqueros System Storage(d) 21,452 Non-Urban (Agricultural) Deliveries -28
Total Water Available 88,695 Total Untreated Water Sales -50,025
Water Supply Available for TWSA Sale 38,670 Actual M&I Treated Water Sales -30,744 Inside Use (TWSA) (Feb use x12)(e) 18,204 Landscape/Outside Use (TWSA) 12,540
Unaccounted for Water(f) 7,925 (a) Includes water supplies from CVP, Los Vaqueros and Mallard Slough water rights, and ECCID (CCWD and City of Brentwood). (b) Canal and treated water distribution losses are included in Unaccounted for Water. Does not include Los Vaqueros evaporative losses. (c) Includes water wheeled for City of Brentwood and water served to DWD from Randall-Bold WTP. (d) Represents net water supply stored in Los Vaqueros and Contra Loma Reservoirs and released for use in 2015. (e) Inside Use is defined as the water billed as M&I during the month of February multiplied by 12. Outside water use during February is assumed to be minimal and provides an estimate of water use inside homes and businesses. (f) Unaccounted for Water includes both untreated and treated water losses due to evaporation, seepage, conveyance/distribution and water treatment plant processes.

Water Management Plan
CONTRA COSTA WATER DISTRICT 46
This page left intentionally blank

Water Management Plan
CONTRA COSTA WATER DISTRICT
SECTION 3: Best Management Practices (BMPs) for Agricultural Contractors This Section does not apply to CCWD

Water Management Plan
CONTRA COSTA WATER DISTRICT 48
This page left intentionally blank

Water Management Plan
CONTRA COSTA WATER DISTRICT
SECTION 4: Best Management Practices for Urban Contractors CCWD is a signatory to the Memorandum of Understanding Regarding Urban Water Conservation in California (MOU) developed by the California Urban Water Conservation Council (CUWCC). The District implements the Best Management Practices (BMPs), as prescribed in the MOU and as required in the Standard Criteria for Evaluating Water Management Plans. CCWD submits annual reports to the CUWCC in accordance with the requirements of the MOU. CCWD consistently meets or exceeds all of the BMP requirements. CCWD’s annual reports for FY14-FY15 and the CUWCC Ten-Year BMP Coverage Report are included in Appendix H. A. Program Description CCWD’s Water Conservation Program fulfills the mission of the District by reducing long-term water demand in an environmentally responsible and cost effective manner. The long-term water savings goal for the Conservation Program is to reduce demand by five percent of what it would be in 2050 without District-implemented conservation measures. This equates to approximately 10,000 acre-feet in the year 2050. This amount is in addition to expected conservation savings from natural fixture replacement and other non-District conservation activities. CCWD is on track to meet this goal. CCWD offers water conservation programs throughout its retail and wholesale water service area. Activities in the retail service area are included in the Retail BMP Report, and activities in the wholesale service area are included in the Wholesale BMP Report. The programs listed below are offered by CCWD to both retail and wholesale service area customers. Since CCWD started its Water Conservation Program in 1988, the program has evolved considerably. In its early years, the program consisted of single-family surveys and showerhead distribution. Starting in 1994, the District provided rebates for Ultra Low Flow Toilets (ULFTs) which flush at 1.6 gallons, and then in 2007, the program was replaced with a High Efficiency Toilet (HET) Rebate Program for toilets that flush 1.28 gallons. In 2000, the District initiated a successful High Efficiency Clothes Washer Rebate program, and in 2012, the District initiated a Lawn to garden Rebate Program which has become very popular. The Conservation Program has a budget of approximately $2.5 million, and includes surveys for all customer classes, numerous rebate programs, water budgets for dedicated irrigation customers, coupon programs, device giveaways, and educational programs.

Water Management Plan
CONTRA COSTA WATER DISTRICT
B. Foundational BMPs Please refer to Appendix H for information on Foundational BMPs in CCWD’s FY14-FY15 annual reports and the CUWCC Ten-Year BMP Coverage Report. C. Programmatic BMPs Please refer to Appendix H for information on Programmatic BMPs in CCWD’s FY14-FY15 annual reports and the CUWCC Ten-Year BMP Coverage Report. D. Five-Year Conservation Budget The five-year budget for the Conservation Program, including the cost to implement all BMP’s is provided in Table 4-1.
TABLE 4-1. CCWD CONSERVATION BUDGET SUMMARY FY15 Actual FY16 FY17 FY18 FY19
Programs (Operating)
Operating Salary and Benefits
$629,868 $925,614 $778,900 $702,267 $723,335
Public Outreach $220,000 $224,400 $228,888 $233,466 $238,135 Education Program $198,535 $202,506 $206,556 $210,687 $214,901
Purchased Goods $52,360 $122,442 $66,000 $66,000 $66,000 Outside Services $8,893 $39,404 $30,500 $30,500 $30,500 Other Operating
Expenses $17,214 $28,325 $28,850 $28,850 $28,850
Total Programs $1,126,870 $1,542,691 $1,339,694 $1,271,770 $1,301,721 Rebates and Incentives (Capital)
Capital Salary and Benefits
$317,975 $189,000 $284,850 $393,396 $405,197
Capital Outside Services
$117,848 $136,000 $165,000 $150,000 $150,000
Rebates (other Capital
expenditures)
$1,023,410 $1,120,000 $1,076,000 $1,000,000 $1,000,000
Total Rebates and Incentives $1,459,233 $1,445,000 $1,525,850 $1,543,396 $1,555,197
Total Budget for Conservation BMPs $2,586,103 $2,987,691 $2,865,544 $2,815,165 $2,856,918

Water Management Plan
APPENDIX A
U.S. Bureau of Reclamation, Mid-Pacific Region Criteria
for Evaluating Water Management Plans 2014

THIS PAGE INTENTIONALLY LEFT BLANK
Standard Criteria | WATER MANAGEMENT PLANNER, 2014 2-1
Mid-Pacific Region
2014 Standard Criteria
U.S. Department of the Interior Bureau of Reclamation Mid-Pacific Region

2-2 Standard Criteria | WATER MANAGEMENT PLANNER, 2014
The Standard Criteria (Criteria) were developed by the Bureau of Reclamation (Reclamation) in response to the Central Valley Project Improvement Act of 1992 (CVPIA) (Public Law 102-575) and in accordance with the Reclamation Reform Act of 1982 (RRA) (Public Law 97-293).
Who Must Use These Criteria
The Criteria apply to any Water Management Plan (Plan) submitted to Reclamation as required by applicable Central Valley Project (CVP) water service contracts, repayment contracts, Settlement Contracts, or any contract that specifically invokes the Criteria.
Exceptions
The following are exempted from preparing a Plan using the Criteria:
• All contractors that receive only irrigation water from any Federal Reclamation project, and deliver water to less than a current five-year average of 2,000 acres of land.
• All contractors that receive less than a five-year average of 2,000 acre-feet per year (AFY) of only municipal and industrial (urban) water from any Federal Reclamation project.
• All contractors that receive any combination of irrigation and/or urban water amounting to less than a current five-year average of 2,000 acre-feet from any Federal Reclamation project.
For new Plans and if data called for in the Criteria are not available, the contractor shall include in their Plan how they (the contractor) will gather the data and make it available for the next Plan revision.
Where to Submit Plans
Contractors shall submit Plans in electronic format to the local Area Office for review. For Area Office representatives and contact information, please visit http://www.usbr.gov/mp/watershare/contacts.html. After Plans are reviewed by the Area and Regional Offices and deemed adequate, the Board of Directors is required to pass a resolution adopting the Plan.

Standard Criteria | WATER MANAGEMENT PLANNER, 2014 2-3
CRITERIA CONTENTS
INTRODUCTION .................................................................................................................... 2-5 Background and General Information ................................................................................ 2-5
GLOSSARY............................................................................................................................ 2-7PLAN EVALUATION, IMPLEMENTATION, AND COMPLIANCE ......................................... 2-9
Flexibility and Coordination ................................................................................................ 2-9Review Process ................................................................................................................. 2-9Annual BMP Updates ........................................................................................................ 2-9Five-Year Plan Revision Procedure ................................................................................. 2-10Consequences of Non-Compliance ................................................................................. 2-10Verification ....................................................................................................................... 2-10
PLAN CONTENTS ............................................................................................................... 2-11Section 1 - Description of The District ............................................................................. 2-11Section II - Inventory of Water Resources ....................................................................... 2-12Section III - BMPs for Agricultural Contractors ................................................................ 2-14Section IV - BMPs For Urban Contractors ....................................................................... 2-16
ADDENDUM A: EXEMPTION PROCESS ........................................................................... 2-17Intent ............................................................................................................................... 2-17Evaluation ....................................................................................................................... 2-17Detail Expected in an Adequate BMP Exemption ........................................................... 2-17
ADDENDUM B: APPLICABILITY PROCESS ..................................................................... 2-19Exemptible BMPs for Agricultural Contractors ................................................................ 2-19
ADDENDUM C: INFORMATION REQUIRED OF CONTRACTORS LOCATED IN DRAINAGE PROBLEM AREA ........................................................................................... 2-21

2-4 Standard Criteria | WATER MANAGEMENT PLANNER, 2014
This page intentionally left blank

Standard Criteria | WATER MANAGEMENT PLANNER, 2014 2-5
Background and General Information
The purpose of the Criteria is to promote, using the best available cost-effective technology and Best Management Practices (BMPs), the highest level of delivery water management achievable by contractors, along with the implementation of water-use efficiency measures reasonably achievable by their customers.
Section 210 of the RRA requires contractors to prepare and submit Plans every five years with definite goals, appropriate water conservation measures, and timetables.
INTRODUCTION
Section 3405 (e) of the CVPIA requires that the Secretary of the Interior establish Criteria to evaluate CVP Plans by April 30, 1993. The Criteria shall be reviewed at least every three years and revised, if necessary.
The CVPIA specifies that the Criteria identify BMPs including, but not limited to, efficient water management practices being developed pursuant to California State law or reasonable alternatives.
Reclamation developed and distributed a Water Management Planner detailing the type of information required by the Criteria. The Water Management Planner will be updated to conform to the revised Criteria.

2-6 Standard Criteria | WATER MANAGEMENT PLANNER, 2014
This page intentionally left blank

Standard Criteria | WATER MANAGEMENT PLANNER, 2014 2-7
GLOSSARY
For the purposes of the Criteria only, the following definitions will be used:
Agricultural Water Management Council (AWMC) – A consortium of agricultural water agencies and public interest groups working together to implement water conservation practices in California. This effort was formalized in a Memorandum of Understanding (MOU) signed in 1996. Signatory water suppliers agree to develop and implement comprehensive conservation efficient water management practices using sound economic criteria. AWMC is going through a transitional phase. Reclamation will continue with the management of the agricultural annual BMP reporting database and will notify contractors of any changes in the future.
Best Management Practice (BMP) – A policy, program, practice, rule, regulation and/or ordinance, or the use of devices, equipment, or facilities that meet either of the following:
• An established and generally accepted practice among contractors that results in more efficient use, conservation/management of water;
• A practice for which sufficient data are available from existing water management projects to indicate that significant efficiency improvements or management-related benefits can be achieved; that the practice is technically and economically reasonable and not socially or environmentally unacceptable; and that the practice is not otherwise unreasonable for most contractors to carry out.
California Urban Water Conservation Council (CUWCC) – A consortium of urban water agencies and public interest groups working together to develop water best management practices in California. This effort was formalized in a MOU. Signatory water suppliers agree to develop and implement comprehensive conservation BMPs using sound economic criteria.
Class 1 Water – The Friant Division of the Central Valley Project employs a “Class 1/Class 2” water contracting system. Class 1 Water is the supply of water stored in or flowing through Millerton Lake which will be available for delivery from Millerton Lake and the Friant-Kern and Madera Canals as a dependable water supply during the year.
Class 2 Water – The supply of water which can be made available for delivery from Millerton Lake and the Friant-Kern and Madera Canals in addition to the supply of Class 1 Water. Because of its uncertainty as to availability and time of occurrence, such water will be undependable in character and will be furnished only if, as, and when it can be made available as determined by the Contracting Officer.
Conjunctive Use – The planned and coordinated use of surface and groundwater supplies to increase water supply reliability, as may be included in a groundwater management plan or banking program.
Contractor – Entities that contract with Reclamation for urban and/or agricultural water.
Customer type (urban) – Urban customer types may include: single-family, multi-family, commercial, industrial, institutional, landscape irrigation, wholesale, or recycled.
District – The physical boundaries of the contractor’s service area.
Five-Year Plan Revision – The revision of a Plan using the most recently adopted Criteria. Under the RRA, contractors are required to submit an updated Plan to Reclamation every five years, using the previous water year’s data. If it is not a normal water year and the District would like to use a different year’s data, please see Section II – Inventory of Water Resources.

2-8 Standard Criteria | WATER MANAGEMENT PLANNER, 2014
Frost Free Days – According to National Oceanic and Atmospheric Administration (NOAA), frost free days are days with temperatures greater than 28 degrees Fahrenheit.
Groundwater Banking Program – The intentional storage of water supplies in subsurface aquifers with plan for retrieval and beneficial use. Groundwater banking usually involves keeping an account of water input and the subsequent use by predetermined or specified parties. Groundwater recharge alone is not a groundwater management plan or banking program. An acceptable groundwater management plan or groundwater banking program must have a reasonable rationale of how the contractor or customers will retrieve such water for beneficial use.
Groundwater Management Plan – A set of practices and management actions that improve groundwater conditions (with the intent of protecting and/or increasing benefits, including the sustainability of groundwater aquifers).
Groundwater Recharge – Infiltration of water into the saturation zone can occur by one of the following processes:
• Natural recharge - recharge of a groundwater basin due to precipitation and stream flow;
• Planned recharge - intentional recharge of a groundwater basin via percolation ponds or injection wells; or
• Incidental recharge - recharge resulting from canal seepage or deep percolation from excess irrigation
Implementation – Achieving and maintaining the staffing, funding, and the priority levels necessary to achieve the level of activity called for in the descriptions of the various BMPs. Also, to satisfy the commitment by the contractor to
use good-faith efforts to optimize benefits from implementing BMPs.
Inflow – Water that enters the district boundaries, which also enters the district distribution system.
MOU – Memorandum of Understanding.
Outflow – Water from the distribution or drainage system that leaves the district boundaries.
Subcontractor – A contractor who purchases water from a Wholesaler and sells all water directly to the end user. A subcontractor may also be referred to as a retailer or retail agency in the urban sector.
Riparian Evapotranspiration (ET) – ET from non-crop vegetation that usually grows along the banks of water conveyance and storage facilities.
Water Conservation/Water Management – Use of less water to accomplish the same purpose(s) or the use of the same amount of water to accomplish additional benefits. An example of the latter is implementation of a BMP that results in increased total crop production using the same amount of water. Water management that results in the increased benefits of water can be achieved through the implementation of BMPs identified in these Criteria. For the purpose of these Criteria, water conservation is considered the same as water management.
Water Inventory – An approach used in the Plan that identifies and quantifies all inflows, outflows, and other uses of water by the contractor in order to identify areas of potential improved water management.
Wholesaler – A contractor who sells water to the subcontractor who then resell the water, usually to multiple end users.

Standard Criteria | WATER MANAGEMENT PLANNER, 2014 2-9
PLAN EVALUATION, IMPLEMENTATION, AND COMPLIANCEWater management and water management planning are on-going processes that begin with the preparation of a comprehensive Plan. The purpose of preparing a Plan is for the contractor to implement the programs developed during the planning process. Implementation of programs identified in the Plan is critical to the success of water management within a district. The Criteria focuses not only on what constitutes an adequate Plan, but also on the implementation of the programs described in that Plan.
The Plan should be prepared using the Plan Format identified in the guidebook. Plans shall include description of the district, inventory of water resources, and BMPs.
Flexibility and Coordination
The Criteria recognizes the differences between contractors and are flexible enough to allow each contractor to develop and implement the types of programs that will best accomplish improved water management within their boundaries. In some cases, the contractors may choose to pool their resources and implement joint programs. The Criteria allows and encourages joint efforts toward program implementation.
Wholesalers are responsible for their subcontractor’s water conservation compliance. Wholesalers may include subcontractors in a single Plan containing data on each subcontractor or require each retailer to prepare their own Plans. If retailers prepare their own Plan, the wholesaler should be involved to the extent necessary to ensure it is found to meet the Criteria. These wholesalers and subcontractors have been notified to adjust their Plan due date to align the submittal of the subcontractors’ Plans to the year prior of when the wholesaler’s Plan is due. For those wholesalers that include their subcontractors’ information such as supplies, demographics, and water conservation Plan and activities; no adjustment is needed.
Review Process
Contractors are required to submit draft Plans to the Area Office for review. Once forwarded to the Regional Office, contractors will receive notification of Reclamation’s acceptance or request for modification. Following notification by Reclamation that the Plan conditionally meets the requirements of the Criteria, contractors submit an electronic copy of the complete Plan. A resolution by the contractor’s Board of Directors formally adopting the Plan must also be submitted. A “Notice of Availability” regarding your Plan will be published in the Federal Register.
Congress established the Federal Register publication system as a method of informing the public of the regulations affecting them. The official agency actions published in the Federal Register are available to the public and subject to the Freedom of Information Act. The Federal Register and archives can be accessed at http://www.gpo.gov/fdsys/browse/collection.action?collectionCode=FR. Once published in the Federal Register, the public is given 30 days in which to view and comment on the Plan. If no significant comments are received within 30 days, the review process is officially completed and the Plan will be posted on the Reclamation WaterShare web site: http://www.usbr.gov/mp/watershare/. If public comments are received, additional changes to the Plan may be required. For planning purposes, it is anticipated that a Federal Register will be processed around the Spring and Fall of each year.
Annual BMP Updates
Pursuant to water service, repayment, and settlement contract terms, most contractors must report on Plan implementation annually. Consistent with the provision of the water service contract, the Contractor shall include a summary of all its surface water deliveries in the annual BMP reporting.

2-10 Standard Criteria | WATER MANAGEMENT PLANNER, 2014
Agricultural contractors complete annual updates by filling in the information for BMPs on the Agricultural Water Management Council (AWMC) web site at http://www.agwatercouncil.org.
Urban contractors complete annual updates by filling in the information for Urban BMPs on the CUWCC web site at http://www.cuwcc.org.
For clarification, Urban and Agricultural Annual BMP Updates are due April 30th of each year unless specified in writing by Reclamation. Annual BMP Updates are also due the year the Plan is due. If a Plan takes longer than a year to complete, this would create a gap in the BMP information.
Five-Year Plan Revision Procedure
Pursuant to water service and settlement contract terms, most contractors are required to submit an updated Plan every five years. Contractors must use the most recently adopted Criteria for an updated Plan. Contractor’s Plan are due every five years, independent of when the last Plan was completed or approved. For example, if a Plan was due in 2015 and it took four years to get approved, in 2019, the next Plan will be due the following year in 2020.
Deadline date for a final Plan is Dec. 31st of the year the Plan is due. This is a final Plan that has gone through the Federal Register, not the initial submittal of a Plan. It is recommended that a draft Plan be submitted in January or February of the year the your plan is due, if not earlier, to allow time for review and processing through the Federal Register.
The contractor must continue to file an annual update every year to report implementation actions taken.
Consequences of Non-Compliance
Consistent with provisions of the water service contract, continued project water delivery is dependent upon the contractor implementing an approved water conservation program. Water deliveries will occur providing the contractor cooperates with Reclamation in determining that its water conservation plan meets Federal conservation and efficiency criteria. It is important that an adequate Plan be deemed acceptable through the Federal Register process by Reclamation before Reclamation approves certain discretionary contract actions such as, benefits of financial and technical assistance and the following examples:
• Reclamation grant program requests • Rescheduling requests• Water banking requests• Water transfer or exchange requests• Inclusion and exclusion requests
Multiple noncompliance letters could impact Reclamation’s contract renewals in future years.
Verification
All information is subject to verification and Reclamation may review plan implementation in coordination with the contractor.

Standard Criteria | WATER MANAGEMENT PLANNER, 2014 2-11
PLAN CONTENTS
Section I. Description of the District
IntentTo describe general physical information about the district so that a basis can be formed to evaluate improvements by and within the district, as well as provide the reader with information about the district’s physical aspects that may affect the potential for improved water management.
A. HistoryGive a historical overview of the district. Provide a timeline that includes the formation of the district, date the district was formed, population served, original size, water supplies, contract information with Reclamation and others, and changes in land use. For agricultural districts describe the changes in irrigated acreages, cropping patterns, and evolving irrigation methods.
B. Location and FacilitiesDescribe the district’s incoming flow measurement method and locations, water conveyance and delivery system (unlined canals, lined canals, pipelines, etc.), and storage facilities (reservoirs, regulating reservoirs, etc.). Agricultural contractors should describe district outflow points, spill recovery systems, and whether the delivery system is on-demand (e.g. no lead time or scheduling necessary); scheduled (e.g. water order 24 hours in advance); rotation (e.g. farmer receives water every ten days); or other. Describe any restrictions on the contractor’s water source(s) and proposed changes that will be implemented during the next five years.
C. Topography and SoilsDescribe the topography and terrain of the district (e.g. hilly, flat, sloping to a water course, etc.). Discuss the effect of topography on water operations and management within the district. Describe major soil classifications and corresponding acreages within the district that affect the use of water (e.g. salinity or high-water table, high or low infiltration rates, etc.).
D. ClimateDescribe the general climate of the district. Include average precipitation, maximum and minimum temperatures, and frost-free days. If there are areas within the district known to have significantly different microclimates, describe how these affect water management decisions and operations. Also include climate data source(s).
E. Natural and Cultural ResourcesDescribe any known natural resources (wetlands, rivers, streams, lakes, etc.) within the district. Indicate if any of these resources were managed (past or present) by the contractor. Describe any known recreational and/or cultural resources (specifically structures on the National Register of Historic Places) within the district.
F. Operating Rules and RegulationsAttach a copy of the contractor’s operating rules and regulations which describe information on water allocation policies, lead time necessary for water orders and water shut-off, policies regarding return flows and outflow leaving the district, and policies related to water transfers into or out of the district (by farmer and contractor).
G. Water Measurement, Pricing, and BillingList the total number of connections/turn-outs, the number currently measured, and the percentage of measured water deliveries. List the types and quantity of measurement devices (meters, calibrated gates, weirs, etc.), level of accuracy (along with documentation verifying the accuracy of the devices), frequency of calibration, and maintenance and reading schedule.
Describe the basis for water charges for agricultural and urban uses. If details are complex, provide an overview and reference the page of the contractor’s written operating rules and regulations that provides additional detail. Be sure the following information can be easily found: basis of charges for agricultural water (by quantity, acre, crop, land assessment, other charges, etc.)

2-12 Standard Criteria | WATER MANAGEMENT PLANNER, 2014
and/or for urban (by customer class, quantity, flat rate, etc.).
For water use billed by quantity, describe the rate structure (e.g. declining, uniform or increasing block rate, etc.). Include the billing frequency (e.g. monthly, bimonthly, annually, etc.), a sample of each type of bill, and a description of the record management system.
H. Water Shortage Allocation PoliciesAttach a copy of the contractor’s agricultural and/or urban water shortage plan.
Describe how reduced water supplies, including hardship water, are allocated. Describe the contractor’s policies that address wasteful use of water and describe enforcement methods.
I. Evaluate Policies of Regulatory Agencies Affecting the Contractor and Identify Policies that Inhibit Good Water ManagementEvaluate policies of agencies that provide the contractor with water. Discuss possible modifications to policies and solutions for improved water management.
Section II. Inventory of Water Resources
IntentThis section shall include a description of contractor’s surface water supply, groundwater supply, other water supplies, source water quality monitoring programs, water uses within the district, outflow from the district, urban waste-water disposal, and water budget. Provide this information for either the last complete calendar year or the last complete water year prior to preparation of each five-year Plan update. Indicate which data set(s) are used for preparing the Plan.
In addition to the data set(s), the contractor may choose to submit data from a different year, or a combination of different years, that better represent average water conditions. This may be necessary if the conditions in the district in the year preceding the five-year Plan update were a deviation from the norm (i.e., the district received either below or above normal precipitation). These data are intended for planning purposes.
For new Plan elements, if data are not available during the preparation of this Plan, the contractor shall describe how the information will be obtained for the next Plan update.
A. Surface Water SupplyDescribe the acre-foot amounts delivered to the contractor by each of the contractor’s surface sources (includes local/water rights water) for the specified years. Describe any water quality limitations or management concerns associated with the identified water sources. Provide the amount of water received for each of the last ten years.
B. Groundwater SupplyDescribe the general characteristics of the groundwater basin(s) that underlie the district. Provide a map that includes contractor-operated water wells, and managed groundwater recharge areas. Describe groundwater recharge programs (direct, indirect, or in lieu), groundwater banking programs, surface water storage programs, and other similar programs detailing the amount of CVP and non-CVP water utilized annually for such programs. If there is conjunctive use of surface and groundwater, describe it. Attach a copy of the contractor’s groundwater management plan or a description of the contractor’s groundwater banking program.
C. Other Water SuppliesIdentify any long-term water supplies not described above (drainage from upstream contractors, reclaimed urban waste water, transfer agreements, etc.).
D. Source Water Quality Monitoring PracticesDescribe current water quality testing program (frequency of measuring and analyses performed) and which agencies conducted the water testing. Also, describe the contractor’s role in the program.
E. Water Uses within the DistrictAgriculturalDescribe the type and acreage of crops grown in the district; include seasonal ET amounts, water required for cultural practices, and the leaching requirement for each crop. List the types of irrigation systems used for each crop.
Standard Criteria | WATER MANAGEMENT PLANNER, 2014 2-13
UrbanDescribe the urban water use, by customer type, within the district. Describe where applicable, the waste water collection and treatment systems, recycled water uses, and methods of disposal.
Groundwater Management Plan/Banking ProgramsList the quantity of water used for planned groundwater recharge, including method of recharge and retrieval. Do not include incidental recharge, such as canal seepage or deep percolation due to excess irrigation unless the quantity recharged and the method of retrieval is specified.
Transfers, Exchanges, Rescheduling, Purchases, or SalesDescribe the source and quantity of water in any transfer, exchange, reschedule, purchase or sale in or out of the district, and for what uses. Describe any other water transactions, such as trades, wheeling, wet year/dry year exchanges, etc.
OtherDescribe any other water uses.
F. Outflow from the DistrictIdentify where outflow leaves the district, how it is measured, the measurement accuracy, and where the outflow goes. Describe any water quality monitoring programs for outflow water (frequency of measuring and analyses performed). Identify any constituents (selenium, pesticides, salinity, etc.) that limit reuse of the outflow water and how. Also provide a brief discussion of the contractor’s involvement in Central Valley Regional Water Quality Control Board programs or requirements for remediating or monitoring any contaminants that would significantly degrade water quality in the receiving surface waters.
Section 3405 of the CVPIA states that all new, amended, and renewed CVP contracts after October 31, 1992, requires that the contractor or agency be responsible for compliance with all State and Federal water quality standards applicable to surface and subsurface agricultural drainage discharge generated within its boundaries. Contractors included in the drainage problem area, as identified in “A Management
Plan for Agricultural Subsurface Drainage and Related Problems on the Westside San Joaquin Valley (September 1990),” should also complete Addendum C.
G. Water AccountingDevelop a water inventory for the contractor based on the last calendar year or the last water year prior to preparation of each five-year Plan revision. Indicate which dataset(s) is used for the inventory. If a contractor so chooses, a representative water supply year can also be included. The inventory should include the following:
1. Quantify Contractors’ Water Suppliesa. Surface water supplies, imported and
originating within the district, by month
b. Groundwater extracted by the district, by month
c. Estimated annual groundwater extracted by non-district parties (if records are not available, provide an estimate and basis for estimation)
d. Recycled water by month (water originating from a municipal waste-water treatment plant)
e. Other supplies by month
2. Quantify Water Useda. Conveyance losses, including
seepage, evaporation, and operational spills
b. Consumptive use by riparian vegetation
c. Applied irrigation water, crop ET, water used for leaching and cultural practices (frost protection, soil reclamation, etc.)
d. Urban water usee. Groundwater rechargef. Water exchanges, transfers and
bankingg. Estimated deep percolation within the
districth. Flows to perched water table or saline
sinki. Outflow water leaving the districtj. Other

2-14 Standard Criteria | WATER MANAGEMENT PLANNER, 2014
3. Overall Water Inventory. Compare total water estimated to be available for sale within the district with the total water actually sold by the contractor.
Section III: BMPs for Agricultural Contractors
IntentTo develop an implementation plan for agricultural BMPs that is proven to accomplish improved (more efficient) water management.
For the purposes of the Criteria, the Plan needs to describe the program that the contractor determines will best accomplish each BMP. The success of some of the practices will depend on cooperative work with other entities. There may be constraints to successful implementation of planned programs. Monitoring and updating will allow the contractor to modify planned programs that do not accomplish the BMP as designed.
A. Critical BMPs for Agricultural ContractorsThis section lists the BMPs that all contractors are to implement. Provide a description of how the BMP is being implemented and include time schedules, budgets, monitoring, and maintenance data for each BMP. The contractor must include the current year actual expenditures and a projected budget for the cost of implementing the BMPs for the five years following the Plan update.
Water MeasurementMeasure the volume of water delivered by the contractor to each customer. Measurement is not required if a contractor receives only Class 2 water. Measure flows with devices that are operated and maintained to a reasonable degree of accuracy, under most conditions, to +/- 6 percent by volume. Three typical categories of measurement devices include: devices with totalizers, standard flow measurement devices, and non-standard but calibrated devices. Include frequency and date of last calibration.
Designate the Water Conservation CoordinatorProvide the job description and minimum qualifications. Job duties should include five-year Plan preparation, implementation and annual updates. Include the coordinator’s title, business address, business phone number, and business email address.
Provide or Support the Availability of Water Management Services to Water UsersDevelop and conduct individual programs or cooperative programs with other contractors in regional programs. Some contractors may want to contract or arrange program delivery through consulting firms, cooperative extension, or others. Services required include, but are not limited to:
1. On-farm evaluationsa. On-farm irrigation and drainage
system evaluations using a mobile lab type assessment, and/or
b. Timely field and crop specific water use information to the water user.
2. Normal year and real-time irrigation scheduling and crop ET information (e.g., California Irrigation Management Information System (CIMIS)).
3. Surface, ground, and drainage water quantity and quality data.
3. Agricultural water management educational programs and materials for farmers and staff, and the public (e.g., soil moisture and salinity monitoring; in-school awareness programs; Agwater software; efficient irrigation techniques, crop water budget and other approaches; program delivery via workshops, seminars, newsletters, field days and demonstrations, websites, etc.)
4. Other - provide details
Pricing StructureAdopt a water pricing structure based (at least in part) on the measured quantity delivered.
Evaluate and Improve Efficiencies of Contractor’s PumpsMany contractors operate booster pumps or groundwater pumps as part of their delivery facilities. A program to evaluate and improve the efficiencies of such pumps can result in energy savings or peak load reductions, or reveal capacity limitations due to inefficient facilities. Over the long term, the contractor can reduce operational costs and improve operational efficiency.
B. Exemptible BMPs for Agricultural ContractorsProvide a description of how the BMP is being implemented and include time schedules, budgets, and monitoring results. Each contractor shall

Standard Criteria | WATER MANAGEMENT PLANNER, 2014 2-15
implement the following BMPs, unless the contractor has an approved exemption from Reclamation. The contractor is required to follow the exemption process (see Addendum A) to justify exemptions. Refer to Addendum B for example justifications for each exemptible BMP. Document the exemption in this section.
Facilitate Alternative Land UseFacilitate alternative uses (voluntary or compensated) for lands with exceptionally poor production potential or whose irrigation contributes to significant problems such as drainage.
Facilitate Use of Available Recycled Water that Otherwise Would Not be Used Beneficially, Meets all Health and Safety Criteria, and Does Not Cause Harm to Crops or SoilsThe use of recycled urban waste water for agricultural irrigation provides an opportunity for reuse of an available water supply. Reuse of urban waste water can be an important element in overall water management.
Facilitate the Financing of Capital Improvements for On-Farm Irrigation SystemsFinancial aid to farmers may include cataloging available funding sources and procedures and/or obtaining funding, administering the program, and providing low-interest loans.
Incentive PricingImplement a pricing structure that promotes one or more of the following goals:
1. More efficient water use at the farm level2. Conjunctive use of groundwater3. Appropriate increase of groundwater
recharge3. Reduction in problem drainage3. Improved management of environmental
resources4. Effective management of all water sources
throughout the season by adjusting seasonal rates based on current conditions
Canal Lining/Piping and Regulatory Reservoirs
1. Line or pipe distribution systems to increase distribution system flexibility and capacity, decrease maintenance, and reduce seepage
2. Construct regulatory reservoirs to improve distribution system delivery flexibility
Increase Flexibility in Water Ordering By, and Delivery To, Water Users (within Operational Limits)Modify distribution facilities and controls to increase the reliability, consistency, and flexibility of water deliveries.
Construct and Operate Contractor Spill and Tailwater Recovery SystemsConstruct facilities to capture and reuse district operational spills.
Plan to Measure OutflowMeasure the volume outflow with methods or devices that are operated and maintained to a reasonable degree of accuracy, under most conditions, to +/- 20 percent. Identify spill locations, prioritize spill locations by quantity of spill, and determine best measurement method/cost. If outflow measurement has not yet been completed, submit funding proposal and provide the estimated cost and milestone schedule.
Optimize Conjunctive UseIncrease planned conjunctive use of surface and groundwater within the district. Conjunctive use usually includes a groundwater management Plan or banking program.
Automate Distribution and/or Drainage System StructuresAutomation of distribution and/or drainage system structures may increase flexibility in water deliveries and increase the contractor’s control over its water supplies, thus providing the opportunity to improve the efficiency of water use.
Facilitate or Promote Water User Pump Testing and Evaluation Describe the program and number of pumps evaluated.
MappingDevelop Geographic Information System (GIS) maps of the district’s distribution system and drainage system. A comprehensive GIS database should include GPS locations of district facilities, inflow/outflow points, conveyance system, etc. as well as base datasets such as soils and hydrography. If digital mapping has not yet

2-16 Standard Criteria | WATER MANAGEMENT PLANNER, 2014
been completed, include the estimated cost and milestone schedule for implementing this BMP.
C. Provide a 5-Year BudgetProvide current year actual expenditures and a projected budget for the 4 years following the Plan implementation for the cost of implementing the BMPs.
Section IV: BMPs for Urban Contractors
IntentTo develop an implementation plan for urban BMPs proven to accomplish improved (more efficient) water management. These Criteria require contractors to implement BMPs under the CUWCC 2011 MOU.
This part of the Plan identifies contractor-specific programs to accomplish the BMPs. It is understood that programs developed by wholesale agencies may not be implemented at the retail customer level, except within the contractor’s retail service area. For the purposes of the Criteria, the Plan needs to describe the program that best accomplishes the BMP.
The success of some of the practices will depend on cooperative work with other entities. It is recognized that there may be constraints to successful implementation of planned programs. Monitoring and updating will allow the contractor to modify any planned programs that do not accomplish the BMP as designed.
A. BMPs for Urban ContractorsThis section lists the BMPs that contractors may implement. Refer to the CUWCC MOU for more information on the compliance options. Provide a description of which compliance option will be implemented (e.g. Traditional, Flex Track or GPCD). Describe how the BMP is being
implemented and include time schedules, budgets and monitoring, and maintenance data for each BMP. Descriptions of the BMP targets and program designs are available at the CUWCC web site.
Foundational BMPs1. Utility Operations Programs
a. Operations Practicesi. Conservation Coordinatorii. Water waste preventioniii. Wholesale agency assistance
programs b. Water Loss Control
i. Metering with Commodity Rates for All New Connections and Retrofit of Existing Connections
ii. Retail Conservation Pricing2. Education Programs
i. Public Information Programsii. School Education Programs
Programmatic BMPs1. Residential
a. Residential assistance programb. Landscape water surveyc. High-efficiency clothes washers
(HECWs)d. WaterSense Specification (WSS)
toiletse. WaterSense Specifications for
residential development2. Commercial, Industrial, and Institutional
(CII)3. Landscape
Provide a 5-Year BudgetProvide current year actual expenditures and a projected budget for the 4 years following the Plan implementation for the cost of implementing the BMPs.

Standard Criteria | WATER MANAGEMENT PLANNER, 2014 2-17
ADDENDUM A - EXEMPTION PROCESS
Intent
To demonstrate in a clear and concise manner that a BMP is not cost-effective, not financially feasible, and not legally or environmentally possible for a contractor to implement. Only the BMPs in Section III.B. are exemptible for agricultural contractors. For urban contractors, Foundational BMP 1.3 is the only non-exemptible BMP.
Evaluation
Some BMPs are not appropriate or possible for a contractor to implement. To document an exemption, the basis, rationale, and details for excluding a BMP must be provided. Such documentation must address, as appropriate, cost-effectiveness, financial feasibility, and environmental or legal constraints to BMP implementation. Urban BMP exemption requests should use the CUWCC exemption process. All urban and agricultural exemption requests will be reviewed for completeness, accuracy, and appropriateness by either Reclamation or an independent contractor.
Detail Expected in an Adequate BMP Exemption
Legal ConstraintsDue to legal constraints, the following must be detailed in order to justify a BMP exemption:
1. A list of any known laws, regulations, court decisions, or other legal constraints that make it illegal for the contractor to implement the BMP.
2. A list of the steps required to remove these constraints.
3. A description of what steps the contractor has taken to remove these constraints.
4. Documentation of efforts by the contractor to work with other entities that have
the legal authority to carry out the BMP within the contractor’s service area.
Environmental ConstraintsIn order to justify an exemption due to known adverse environmental impacts, the Plan must document critical environmental issues and known (qualitative and/or quantitative) negative impacts of the BMP, and an explanation of why effective mitigation of these impacts is not possible. If mitigation of the environmental impacts is possible, the practice must be implemented unless it can be exempted by another exemption category. For example, if the mitigation costs make the project economically infeasible, a discussion of the mitigation plan and necessary mitigation costs should be included as part of the economic analysis.
Financial ConstraintsIn order to adequately justify an exemption due to financial constraints, the Plan must clearly document the following:
1. The contractor’s funding needed to implement the BMP.
2. A discussion regarding why the contractor cannot finance the BMP through rate adjustments, assessments, etc.
3. A discussion of the contractor’s reasonable efforts to secure funding from other entities that include, but are not limited to, lending institutions and bonding authorities, and an explanation of why these entities would not provide funding.
4. The required amount of a grant or subsidy necessary to feasibly implement the BMP if financing or partnerships could not be obtained. A benefit-cost analysis that demonstrates the costs to the contractor outweigh the benefits to the contractor over the life of the measure. The contractor must perform the analysis by comparing the present value of all benefits to the present value of all costs.

2-18 Standard Criteria | WATER MANAGEMENT PLANNER, 2014
Document the projected/estimated benefits and costs and the methodology for analysis (benefits and costs should be quantified to the extent possible). The analysis performed for each excluded BMP (from the contractor’s perspective) must include, but is not limited to, the following benefits and costs:
Benefits1. All capital costs avoided by the contractor
which include, but are not limited to, the costs associated with the development of new supplies (studies, construction, labor, etc.), transportation, the required increase in storage, distribution capacity, wastewater facilities and treatment capacity, etc.
2. Operation and maintenance (O&M) costs associated with the decrease in the production and distribution of water or the treatment and disposal of wastewater that include, but are not limited to, energy, labor, treatment, storage, drainage treatment and disposal, etc.
3. Water purchases avoided by the contractor.3. Environmental costs avoided by the
contractor.3. Environmental enhancements.3. Revenues from other entities that include,
but are not limited to, revenue from the sale of water made available by the BMP, financial incentives received from other entities, etc.
4. Other benefits to the contractor customers that include, but are not limited to, hydropower, improved crop yields, improved crop quality, labor savings, fertilizer savings, increased farm income, etc.
Costs1. Capital expenditures incurred by the
contractor for implementation of the BMP that include, but are not limited to, equipment, supplies, materials, construction, etc.
2. O&M costs to plan, design, implement, enforce, and evaluate the practice.
3. Financial incentives to customers.3. Costs to the environment (describe the
nature of the negative impact(s) and potential losses to the environment).
3. Other costs to the contractor. Several accepted benefit-cost analysis methodologies exist (e.g., California Energy Commission’s Integrated Resource Planning Methodology, Generally Accepted Accounting Principles, AWMC’s Net Benefit Analysis, etc.). A contractor is considered to be the best suited to evaluate their own economic situation with an appropriate methodology.
3. A discussion and quantification, to the extent possible, of other benefits associated with the implementation of the BMP that may be of interest to potential partners, but are not the direct, sole responsibility of the contractor.

Standard Criteria | WATER MANAGEMENT PLANNER, 2014 2-19
ADDENDUM B - APPLICABILITY PROCESS
To establish that a BMP is not applicable (NA) to the contractor, the Plan should explain why the BMP does not apply to the contractor. This justification must be consistent with Section I: Description of the District. Example justifications for each exemptible BMP are listed below. This list is not all inclusive.
Exemptible BMPs for Agricultural Contractors
1. Facilitate alternative land use - NA could include contractors without irrigable lands that have exceptionally high water duties or whose irrigation does not contribute to significant problems.
2. Facilitate use of available recycled water that otherwise would not be used beneficially, meets all health and safety criteria, and does not cause harm to crops or soils - NA could include completely piped systems that do not have delivery constraints.
3. Facilitate the financing of capital improvements for on-farm irrigation systems - None identified.
3. Incentive pricing - Contractor that receives only Class 2 water.
3. Canal lining/piping and regulatory reservoirs - NA could include completely
piped systems, unlined canal systems, sections which are used as part of a planned conjunctive use program, or completely piped systems that do not have delivery constraints.
3. Increase flexibility in water ordering by, and delivery to, the water users within operational limits - None identified.
3. Construct and operate contractor spill and tailwater recovery systems - NA could include completely piped systems that do not have delivery constraints.
3. Plan to measure outflow - NA could include no spill or tailwater leaves the district.
3. Optimize conjunctive use - NA could include contractors who do not overlie a useable groundwater basin and thus neither the contractor nor their customers pump or use groundwater, and the contractor has no water supplies other than the contract supply.
3. Automate canal structures - NA could include completely piped systems which do not have delivery constraints.
3. Facilitate or promote water user pump testing and evaluation - NA could include districts that have no groundwater, lift or diversion pumps.
3. Mapping - None identified

2-20 Standard Criteria | WATER MANAGEMENT PLANNER, 2014
This page intentionally left blank

Standard Criteria | WATER MANAGEMENT PLANNER, 2014 2-21
ADDENDUM C - INFORMATION REQUIRED OF CONTRACTORS LOCATED IN DRAINAGE PROBLEM AREAThe contractors included in the drainage problem area, as identified in “A Management Plan for Agricultural Subsurface Drainage and Related Problems on the Westside San Joaquin Valley (September 1990),” are listed by subarea below. If future editions of the drainage report revise the boundaries of a drainage problem area, or other factors used to determine which contractors are in a drainage problem area, Reclamation will revise Addendum C to conform to the current drainage report.
1. Reclamation contractors in the Grasslands Subarea: Central California Irrigation District, Del Puerto Water District, Firebaugh Canal Water District, Mercy Springs Water District, Pacheco Water District, Panoche Water District, San Luis Canal Company, and San Luis Water District.
2. Reclamation contractors in the Westlands Subarea: James Irrigation District, Tranquillity Irrigation District, and Westlands Water District.
3. Reclamation contractors in the Tulare Subarea: Alpaugh Irrigation District, Atwell Island Water District, Lower Tule River Irrigation District, and Pixley Irrigation District.
4. Reclamation contractors in the Kern Subarea: Alpaugh Irrigation District.
The contractors listed above shall describe which recommendations prescribed in “A Management Plan for Agricultural Subsurface Drainage and Related Problems on the Westside San Joaquin Valley (September 1990)” have been incorporated in their water conservation programs to improve conditions in drainage problem areas. These recommendations include:
• Source Control• Land Retirement• Drainage Water Treatment• Drainage Water Reuse• Shallow Groundwater Pumping• Evaporation Ponds
Provide a description and level of expenditure for each activity designed to address the recommendations of the San Joaquin Valley Drainage Program. Identify how implementation of the recommendations has or will substantially reduce deep percolation on drainage problem lands. Describe which recommendations have not been implemented and why.

2-22 Standard Criteria | WATER MANAGEMENT PLANNER, 2014
This page intentionally left blank

Water Management Plan
APPENDIX B
CCWD Major Facilities

THIS PAGE INTENTIONALLY LEFT BLANK
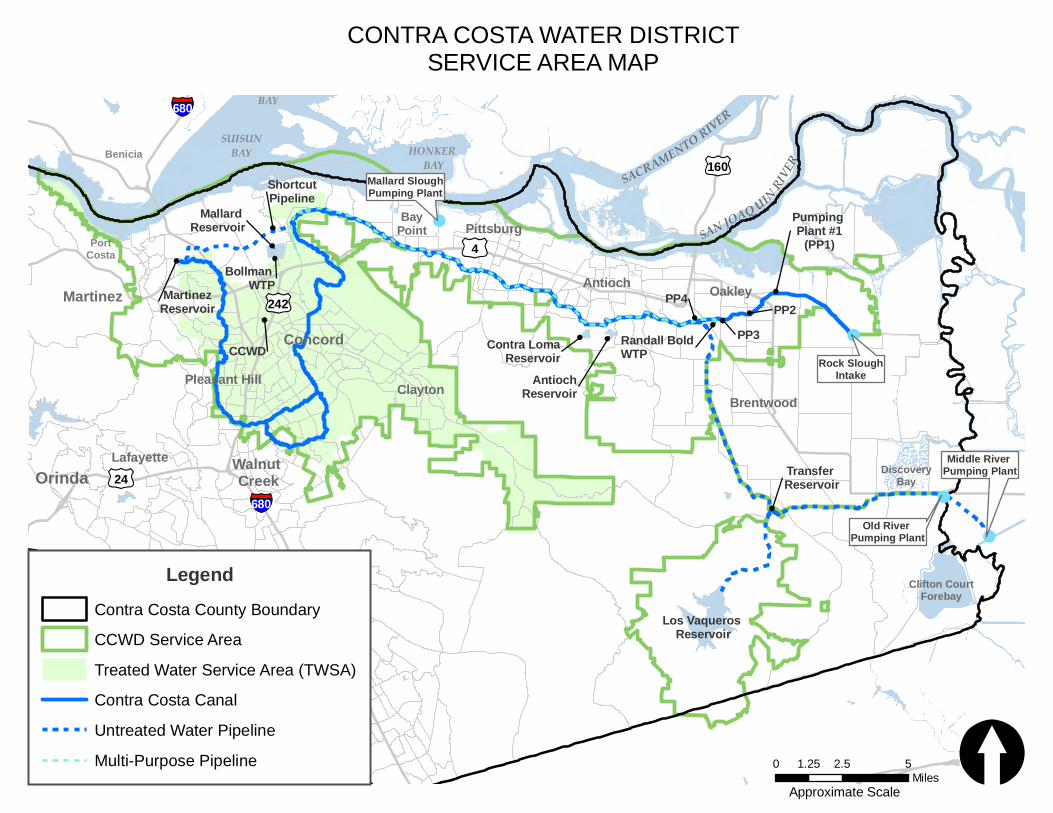
!
!
!
!
Los Vaqueros Reservoir
DiscoveryBay
Clifton CourtForebay
Old River Pumping Plant
Middle River Pumping Plant
Rock SloughIntake
Mallard SloughPumping Plant
SACRAMENTO RIVER
SAN JOAQ UIN RIVERBenicia
GRIZZLY BAY
HONKER BAY
SUISUNBAY
§¦680
Mallard Reservoir
PortCosta
Bollman WTP
Contra LomaReservoirCCWD
ShortcutPipeline
BayPoint
Randall BoldWTP
§¦680
MartinezReservoir
Transfer Reservoir
Pumping Plant #1
(PP1)
PP2PP3
PP4
AntiochReservoir
§¦680
§¦80 £¤160
£¤242
£¤24
£¤4
Antioch
Concord
Oakley
Pittsburg
Orinda
Martinez
Brentwood
Moraga
Lafayette Walnut Creek
Pleasant Hill Clayton
CONTRA COSTA WATER DISTRICTSERVICE AREA MAP
LegendContra Costa County Boundary
CCWD Service Area
Treated Water Service Area (TWSA)
Contra Costa Canal
Untreated Water Pipeline
Multi-Purpose Pipeline 0 2.5 51.25Miles [
Approximate Scale

THIS PAGE INTENTIONALLY LEFT BLANK

Water Management Plan
APPENDIX C
CCWD Code of Regulations – Sections 5.04.070-080, 5.12, 5.20.010-060, 5.44.010, 5.70

THIS PAGE INTENTIONALLY LEFT BLANK

5.04
Title 5‐3 CCWD Code of Regulations (2‐13)
to any person by reason of any shortage, reduction, interruption, or discontinuance of water service or the increase or decrease of water pressure, when the same is caused by an act of God, drought, an unavoidable accident, a shutdown, a disturbance or condition of any kind beyond the reasonable control of the District or when the same is reasonably necessary for the repair, maintenance, alteration, or extension of any facility of the District or of the Contra Costa Canal System of the United States Bureau of Reclamation. (Res. 90-84 Exh. A (part): Reg. 1(F)) 5.04.070 Water Shortages. The District reserves the right to fix the time and rate of flow of all deliveries of water to each of its customers and, in the event of shortage, to allocate between its customers the water supply from time to time available to the District and to establish such priorities to the available supply as the District shall consider necessary and in the public interest. (Res. 90-84 Exh. A (part): Reg. 1(G)) 5.04.075 Provision of Service for Affordable
Housing In accordance with Water Code section 10631.1 and Government Code section 65589.7, it is the policy of the District to provide water service on to all applicants who comply with these Regulations and pay all requisite fees. In the event that new service connections are restricted by the Board of Directors, priority shall be given to applicants for water service to residential properties which include housing units affordable to lower income households, pursuant to administrative procedures developed and implemented by the General Manager. Restrictions on provision of new water service connections may be due to a declaration of a water shortage emergency condition under Water Code section 350 et seq., a determination by the Board of Directors based on the District’s Urban Water Management Plan that sufficient water supply is not available to support the granting of all requests for new service, as provided in Government Code section 66473.7, a determination by the Board of Directors based on a written engineering report that the District does not have sufficient water treatment and/or distribution capacity to serve the needs of proposed development, or the imposition of a compliance order by the Department of Health Service prohibiting new connections. (Res. 06-18 Exh. A (part)) 5.04.080 Place of Use of Water. Except with the prior consent of the Board of Directors of the District ("the Board") and on such terms and conditions as the Board shall prescribe, all water furnished shall be used within the territory of the District and on land described in the application for service. (Res. 90-84 Exh. A (part): Reg. 1(H)) 5.04.090 Access to Facilities. By applying for or receiving water service from the District, the applicant, on behalf of the applicant and the
owners, tenants and occupants of the land where the water is to be used, grants to the District, its employees and representatives, permission to enter said land at reasonable times for the purpose of installing, reading, inspecting, testing, maintaining, repairing or replacing any meter, meter box, pipe, valve, back-flow prevention device or other District facility on said land that is reasonably necessary to provide water service to said land. The owners and occupants of the land and the water users thereon shall have the duty to remove or cause to be removed any plant, structure or thing that obstructs or impairs said access. If after reasonable notice to the occupant of the land the obstruction is not removed, the District shall have the right in its discretion to remove it and to charge the costs thereby incurred and District overhead to the responsible customer of the District. (Res. 90-84 Exh. A (part): Reg. 1(I)) 5.04.100 Restrictions on Resale of Water. No water furnished by the District shall be resold, except: A. Untreated (raw) water supplied to public or private water utilities under Section 5.20.010 for resale within the utility’s jurisdictional boundary; or B. Treated water supplied to public or private water utilities for resale within the utility’s jurisdictional boundary. C. Untreated (raw) water supplied to groups of property owners under Sections 5.20.030; or 5.20.040; or D. Treated water that has been packaged in containers of five gallons or less; or E. With the prior written authorization of the District. (Res. 13-02 Exh. A (part); Res. 90-83 Exh. A (part): Reg. 1(J)) 5.04.110 Unauthorized Use of Water. Anyone using water without having made application to the District for water service shall be held liable for the service from the date of any previous meter reading that most nearly coincides with the actual date the service was first used by such customer. (Res. 90-84 Exh. A (part)) 5.04.120 Annexation of Land to the District and
Provision of Water Service to Annexed Lands.
The annexation of lands to the District is governed by the provisions of the Cortese/Knox Local Government Reorganization Act of 1985 (California Government Code Section 56000 et seq., herein cited as the "Act"). This regulation supplements the provisions of the Act. In the event of any conflict between the provisions of the Act and this regulation, the former shall control. The provision of water service to annexed land is governed by this regulation. Part A contains the processes for annexation of lands to the District. Part B contains the processes for obtaining water service for annexed lands from either the District or from one of its wholesale municipal customers and applies to lands that are inside or

5.12
Title 5‐10 CCWD Code of Regulations (2‐13)
Chapter 5.12
CHARGES AND RATES-TREATED (POTABLE) WATER SERVICE
Sections:
5.12.010 Residential Single-Unit Service. 5.12.020 Residential Multiple-Unit Service. 5.12.030 Commercial Service. 5.12.040 Industrial Service. 5.12.050 Public Authority Service. 5.12.060 Residential Irrigation Service. 5.12.070 Commercial and Industrial
Irrigation Service. 5.12.080 Public Authority Irrigation Service. 5.12.090 Private Fire Protection Service. 5.12.100 Temporary Service. 5.12.110 Wholesale Treated Water.
5.12.010 Residential Single-Unit Service. A. Applicable Service Connections.
1. A service connection shall be classified as residential single unit when any portion of the water from the connection is used to furnish treated water to a single-family dwelling (premise) unit for domestic purposes and the full service is recorded through one meter. A premise is determined per Section 5.32.020 Connections Subsection A. B. Service and Demand Charge.
1. A charge for water service, irrespective of the quantity used, shall be applied to all residential single-unit connections to the District's treated water distribution system as follows:
Meter Size Charge Per Day 5/8 inch $0.5822
¾ inch 0.8733 *¾ inch 0.6229
1 inch 1.4555 *1 inch 0.6288
1½ inch 2.9109 2 inch 4.6574 3 inch 9.3149 4 inch 14.5545
* Single Family Residential unit with inside sprinkler system required by local fire District. Necessity of sprinkler systems requires written confirmation from the local fire District.
Lifeline Rates Meter Size Charge Per Day
5/8 inch $0.2911 ¾ inch 0.4367
*¾ inch 0.3115 1 inch 0.7278
*1 inch 0.3144
* Single Family Residential unit with inside sprinkler system required by local fire District. Necessity of sprinkler systems requires written confirmation from the local fire District. (Effective 3-17-93)
2. he applicable normal rate shall be charged for all connections unless the person in whose name the service is registered applies for lifeline rates and meets all the following requirements:
a. The applicant is not less than sixty-two years of age or is receiving disability insurance benefits from the Social Security Administration; and
b. The total annual income of the applicant's household is below the very low income level for Contra Costa County as established by the Department of Housing and Urban Development; and
c. The meter size is not greater than one inch. 3. Applications for lifeline rates shall be on
forms provided by the District and shall be submitted to the District's finance office. Eligibility for lifeline rates shall be conclusively determined by the Director of Finance or his/her designee.
C. Quantity Charge. For all water delivered, a charge of $3.6081 per hundred cubic feet shall be applied.
D. Energy Surcharge. A surcharge for energy shall be applied to all water delivered through each residential single-unit meter connection to the District's treated water distribution system as follows:
Zone in Which Service Connection is Located Hundred Cubic Feet
Zone No. 1 $ 0.0767 Zone No. 2 0.1514 Zone No. 3 0.2120 Zone No. 4 0.2763 Zone No. 5 0.3889 Zone No. 6 0.4497 Zone No. 5E 0.5614 Zone No. 6E 0.5614 Zone No. 7 0.5614 Zone No. 8 0.7545
E. Public Fire Protection Surcharge. A surcharge for public fire protection to defray the cost of furnishing water for fire protection shall be applied to each connection to the District's treated water distribution system as follows:
Meter Size Surcharge Per Day 5/8 inch $ 0.0323
¾ inch 0.0323 1 inch 0.0323
1½ inch 0.1615 2 inch 0.2585 3 inch 0.5169 4 inch 0.8077
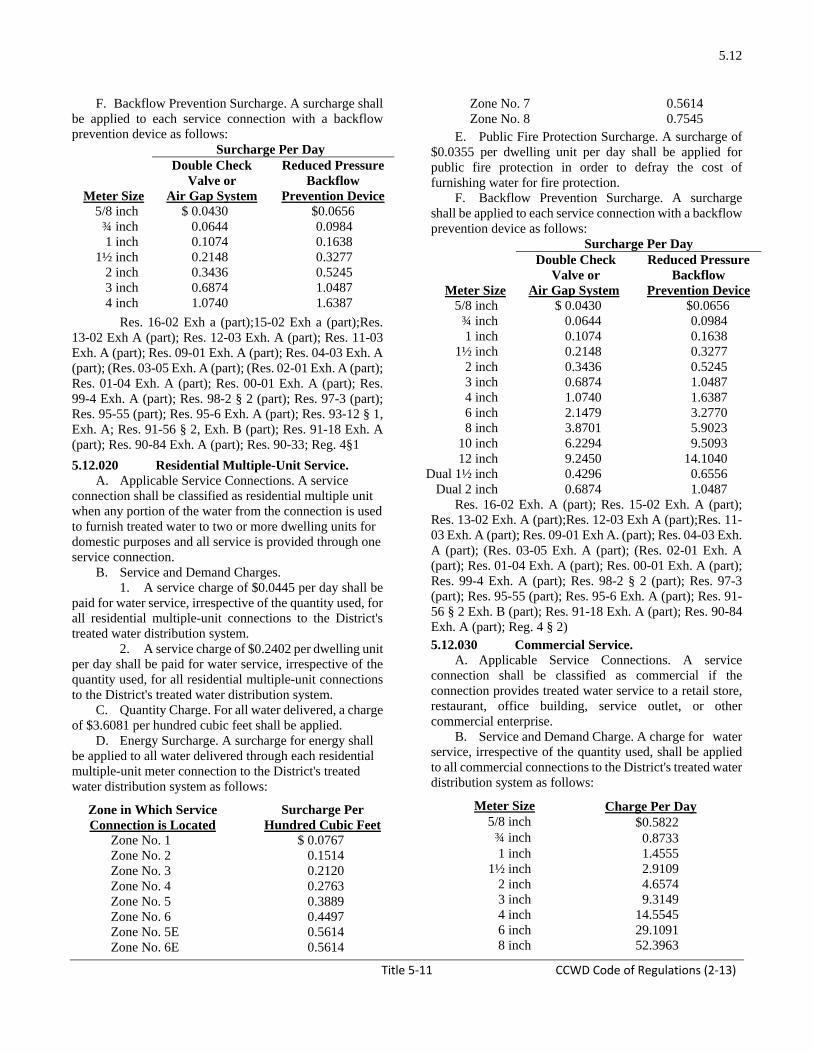
5.12
Title 5‐11 CCWD Code of Regulations (2‐13)
F. Backflow Prevention Surcharge. A surcharge shall be applied to each service connection with a backflow prevention device as follows:
Surcharge Per Day Meter Size
Double Check Valve or
Air Gap System
Reduced Pressure Backflow
Prevention Device 5/8 inch $ 0.0430 $0.0656
¾ inch 0.0644 0.0984 1 inch 0.1074 0.1638
1½ inch 0.2148 0.3277 2 inch 0.3436 0.5245 3 inch 0.6874 1.0487 4 inch 1.0740 1.6387
Res. 16-02 Exh a (part);15-02 Exh a (part);Res. 13-02 Exh A (part); Res. 12-03 Exh. A (part); Res. 11-03 Exh. A (part); Res. 09-01 Exh. A (part); Res. 04-03 Exh. A (part); (Res. 03-05 Exh. A (part); (Res. 02-01 Exh. A (part); Res. 01-04 Exh. A (part); Res. 00-01 Exh. A (part); Res. 99-4 Exh. A (part); Res. 98-2 § 2 (part); Res. 97-3 (part); Res. 95-55 (part); Res. 95-6 Exh. A (part); Res. 93-12 § 1, Exh. A; Res. 91-56 § 2, Exh. B (part); Res. 91-18 Exh. A (part); Res. 90-84 Exh. A (part); Res. 90-33; Reg. 4§1 5.12.020 Residential Multiple-Unit Service. A. Applicable Service Connections. A service connection shall be classified as residential multiple unit when any portion of the water from the connection is used to furnish treated water to two or more dwelling units for domestic purposes and all service is provided through one service connection.
B. Service and Demand Charges. 1. A service charge of $0.0445 per day shall be
paid for water service, irrespective of the quantity used, for all residential multiple-unit connections to the District's treated water distribution system.
2. A service charge of $0.2402 per dwelling unit per day shall be paid for water service, irrespective of the quantity used, for all residential multiple-unit connections to the District's treated water distribution system.
C. Quantity Charge. For all water delivered, a charge of $3.6081 per hundred cubic feet shall be applied.
D. Energy Surcharge. A surcharge for energy shall be applied to all water delivered through each residential multiple-unit meter connection to the District's treated water distribution system as follows:
Zone in Which Service Connection is Located
Surcharge Per Hundred Cubic Feet
Zone No. 1 $ 0.0767 Zone No. 2 0.1514 Zone No. 3 0.2120 Zone No. 4 0.2763 Zone No. 5 0.3889 Zone No. 6 0.4497 Zone No. 5E 0.5614 Zone No. 6E 0.5614
Zone No. 7 0.5614 Zone No. 8 0.7545
E. Public Fire Protection Surcharge. A surcharge of $0.0355 per dwelling unit per day shall be applied for public fire protection in order to defray the cost of furnishing water for fire protection.
F. Backflow Prevention Surcharge. A surcharge shall be applied to each service connection with a backflow prevention device as follows:
Surcharge Per Day Meter Size
Double Check Valve or
Air Gap System
Reduced Pressure Backflow
Prevention Device 5/8 inch $ 0.0430 $0.0656
¾ inch 0.0644 0.0984 1 inch 0.1074 0.1638
1½ inch 0.2148 0.3277 2 inch 0.3436 0.5245 3 inch 0.6874 1.0487 4 inch 1.0740 1.6387 6 inch 2.1479 3.2770 8 inch 3.8701 5.9023
10 inch 6.2294 9.5093 12 inch 9.2450 14.1040
Dual 1½ inch 0.4296 0.6556 Dual 2 inch 0.6874 1.0487
Res. 16-02 Exh. A (part); Res. 15-02 Exh. A (part); Res. 13-02 Exh. A (part);Res. 12-03 Exh A (part);Res. 11-03 Exh. A (part); Res. 09-01 Exh A. (part); Res. 04-03 Exh. A (part); (Res. 03-05 Exh. A (part); (Res. 02-01 Exh. A (part); Res. 01-04 Exh. A (part); Res. 00-01 Exh. A (part); Res. 99-4 Exh. A (part); Res. 98-2 § 2 (part); Res. 97-3 (part); Res. 95-55 (part); Res. 95-6 Exh. A (part); Res. 91-56 § 2 Exh. B (part); Res. 91-18 Exh. A (part); Res. 90-84 Exh. A (part); Reg. 4 § 2) 5.12.030 Commercial Service.
A. Applicable Service Connections. A service connection shall be classified as commercial if the connection provides treated water service to a retail store, restaurant, office building, service outlet, or other commercial enterprise.
B. Service and Demand Charge. A charge for water service, irrespective of the quantity used, shall be applied to all commercial connections to the District's treated water distribution system as follows:
Meter Size Charge Per Day 5/8 inch $0.5822
¾ inch 0.8733 1 inch 1.4555
1½ inch 2.9109 2 inch 4.6574 3 inch 9.3149 4 inch 14.5545 6 inch 29.1091 8 inch 52.3963

5.12
Title 5‐12 CCWD Code of Regulations (2‐13)
10 inch 84.4163 12 inch 125.1690
Dual 1½ inch 5.8218 Dual 2 inch 9.3149
C. Quantity Charge. For all water delivered, a charge
of $3.6081 per hundred cubic feet shall be applied. D. Energy Surcharge. A surcharge for energy shall
be applied for all water delivered through each commercial meter connection to the District's treated water distribution system as follows:
Zone in Which Service Connection is Located
Surcharge Per Hundred Cubic Feet
Zone No. 1 $ 0.0767 Zone No. 2 0.1514 Zone No. 3 0.2120 Zone No. 4 0.2763 Zone No. 5 0.3889 Zone No. 6 0.4497 Zone No. 5E 0.5614 Zone No. 6E 0.5614 Zone No. 7 0.5614 Zone No. 8 0.7545
E. Public Fire Protection Surcharge. A surcharge for public fire protection to defray the cost of furnishing water for fire protection shall be applied to each connection to the District's treated water distribution system as follows:
Meter Size Surcharge Per Day 5/8 inch $ 0.0323
¾ inch 0.0485 1 inch 0.0808
1½ inch 0.1615 2 inch 0.2585 3 inch 0.5169 4 inch 0.8077 6 inch 1.6154 8 inch 2.9070
10 inch 4.6848 12 inch 6.9445
Dual 1½ inch 0.3231 Dual 2 inch 0.5169
F. Backflow Prevention Surcharge. A surcharge
shall be applied to each service connection with a backflow prevention device as follows:
Meter Size
Double Check Valve or
Air Gap System
Reduced Pressure Backflow
Prevention 5/8 inch $ 0.0430 $0.0656
¾ inch 0.0644 0.0984 1 inch 0.1074 0.1638
1½ inch 0.2148 0.3277 2 inch 0.3436 0.5245
3 inch 0.6874 1.0487 4 inch 1.0740 1.6387 6 inch 2.1479 3.2770 8 inch 3.8701 5.9023
10 inch 6.2294 9.5093 12 inch 9.2450 14.1040
Dual 1½ inch 0.4296 0.6556 Dual 2 inch 0.6874 1.0487
(Res. 16-02 Exh. A (part); Res. 15-02 Exh. A (part); Res. 13-02 Exh. A (part); Res. 12-03 Exh. A (part);Res. 11-03 Exh. A (part); Res. 09-01 Exh. A (part); Res. 04-03 Exh. A (part); (Res. 03-05 Exh. A (part); (Res. 02-01 Exh. A (part); Res. 01-04 Exh. A (part); Res. 00-01 Exh. A (part); Res. 99-4 Exh. A (part); Res. 98-2 § 2 (part); Res. 97-3 (part); Res. 95-55 (part); Res. 95-6 Exh. A (part); Res. 91-56 § 2 Exh. B (part); Res. 91-18 Exh. A (part); Res. 90-84 Exh. A (part); Reg. 4 § 3) 5.12.040 Industrial Service.
A. Applicable Service Connections. A service connection shall be classified as industrial if the connection provides treated water service to a manufacturing or processing operation with a demonstrated average water use greater than 500 hundred cubic feet per month.
B. Service and Demand Charge. A charge for water service, irrespective of the quantity used, shall be applied to all industrial connections to the District’s treated water distribution system as follows:
Meter Size Surcharge Per Day 5/8 inch $0.5822
¾ inch 0.8733 1 inch 1.4555
1½ inch 2.9109 2 inch 4.6574 3 inch 9.3149 4 inch 14.5545 6 inch 29.1091 8 inch 52.3963
10 inch 84.4163 12 inch 125.1690
Dual 1½ inch 5.8218 Dual 2 inch 9.3149
C. Quantity Charge. For all water delivered, a charge of $3.6081per hundred cubic feet shall be applied.
D. Energy Surcharge. A surcharge for energy shall be applied to all water delivered through each commercial meter connection to the District’s treated water distribution system as follows:
Zone in Which Service Surcharge Per Connection is Located Hundred Cubic Feet
Zone No. 1 $ 0.0767 Zone No. 2 0.1514 Zone No. 3 0.2120 Zone No. 4 0.2763

5.12
Title 5‐13 CCWD Code of Regulations (2‐13)
Zone No. 5 0.3889 Zone No. 6 0.4497 Zone No. 5E 0.5614 Zone No. 6E 0.5614 Zone No. 7 0.5614 Zone No. 8 0.7545
E. Public Fire Protection Surcharge. A surcharge for public fire protection to defray the cost of furnishing water for fire protection shall be applied to each connection to the District’s treated water distribution system as follows:
Meter Size Surcharge Per Day 5/8 inch $ 0.0323
¾ inch 0.0485 1 inch 0.0808
1½ inch 0.1615 2 inch 0.2585 3 inch 0.5169 4 inch 0.8077 6 inch 1.6154 8 inch 2.9070
10 inch 4.6848 12 inch 6.9445
Dual 1½ inch 0.3231 Dual 2 inch 0.5169
F. Backflow Prevention Surcharge. A surcharge shall be applied to each service connection with a backflow prevention device as follows: Surcharge Per Day
Meter Size
Double Check Valve or
Air Gap System
Reduced Pressure Backflow
Prevention Device 5/8 inch $ 0.0430 $0.0656
¾ inch 0.0644 0.0984 1 inch 0.1074 0.1638
1½ inch 0.2148 0.3277 2 inch 0.3436 0.5245 3 inch 0.6874 1.0487 4 inch 1.0740 1.6387 6 inch 2.1479 3.2770 8 inch 3.8701 5.9023
10 inch 6.2294 9.5093 12 inch 9.2450 14.1040
Dual 1½ inch 0.4296 0.6556 Dual 2 inch 0.6874 1.0487
(Res. 16-02 Exh. A (part); Res.15-02 Exh. A (part); Res. 13-02 Exh. A (part); Res. 12-03 Exh A. (part); Res. 11-03 Exh. A(part); Res. 09-01 Exh. A (part); Res. 04-03 Exh. A (part); (Res. 03-05 Exh. A (part); (Res. 02-01 Exh. A (part); Res. 01-04 Exh. A (part); Res. 00-01 Exh. A (part); Res. 99-4 Exh. A (part); Res. 98-2 § 2 (part); Res. 97-3 (part); Res. 95-55 (part); Res. 95-6 Exh. A (part); Res. 91-56 § 2 Exh. B (part); Res. 91-18 Exh. A (part); Res. 90-84 Exh. A (part); Reg. 4 § 4)
5.12.050 Public Authority Service
A. Applicable Service Connections. A service connection shall be classified as public authority if the connection provides treated water service to a building or structure owned and operated by a federal, state, county, city, or other local public authority. This includes water service to the public fire department, public libraries, and military agencies.
B. Service and Demand Charge. A charge for water service, irrespective of the quantity used, shall be applied to all public authority connections to the District’s treated water distribution system as follows:
Meter Size Charge Per Day 5/8 inch $0.5822
¾ inch 0.8733 1 inch 1.4555
1½ inch 2.9109 2 inch 4.6574 3 inch 9.3149 4 inch 14.5545 6 inch 29.1091 8 inch 52.3963
10 inch 84.4163 12 inch 125.1690
Dual 1½ inch 5.8218 Dual 2 inch 9.3149
C. Quantity Charge. For all water delivered, a charge of $3.6081 per hundred cubic feet shall be applied.
A. Energy Surcharge. A surcharge for energy shall be applied to all water delivered through each public authority meter connection to the District’s treated water distribution system as follows:
Zone in Which Service Connection is Located
Surcharge Per Hundred Cubic Feet
Zone No. 1 $ 0.0767 Zone No. 2 0.1514 Zone No. 3 0.2120 Zone No. 4 0.2763 Zone No. 5 0.3889 Zone No. 6 0.4497 Zone No. 5E 0.5614 Zone No. 6E 0.5614 Zone No. 7 0.5614 Zone No. 8 0.7545
E. Public Fire Protection Surcharge. A surcharge for public fire protection to defray the cost of furnishing water for fire protection shall be applied to each connection to the District’s treated water distribution system as follows:
Meter Size Surcharge Per Day 5/8 inch $ 0.0323
¾ inch 0.0485 1 inch 0.0808
1½ inch 0.1615 2 inch 0.2585 3 inch 0.5169 4 inch 0.8077

5.12
Title 5‐14 CCWD Code of Regulations (2‐13)
6 inch 1.6154 8 inch 2.9070
10 inch 4.6848 12 inch 6.9445
Dual 1½ inch 0.3231 Dual 2 inch 0.5169 F. Backflow Prevention Surcharge. A surcharge
shall be applied to each service connection with a backflow prevention device as follows:
Surcharge Per Day
Meter Size
Double Check Valve or
Air Gap System
Reduced Pressure Backflow
Prevention Device 5/8 inch $ 0.0430 $0.0656
¾ inch 0.0644 0.0984 1 inch 0.1074 0.1638
1½ inch 0.2148 0.3277 2 inch 0.3436 0.5245 3 inch 0.6874 1.0487 4 inch 1.0740 1.6387 6 inch 2.1479 3.2770 8 inch 3.8701 5.9023
10 inch 6.2294 9.5093 12 inch 9.2450 14.1040
Dual 1½ inch 0.4296 0.6556 Dual 2 inch 0.6874 1.0487
G. Educational Entities or State Agencies. Educational entities or state agencies will be charged the same nondiscriminatory rates, fees and charges as comparable nonpublic users pursuant to Government Code section 54999.1(f). Upon a request of an educational entity or state agency for a determination of whether any rate, fee or charge complies with Government Code section 54999.1(f), such determination shall be made by the General Manager. Should the General Manager determine that a rate, fee or charge should be adjusted, the amount of adjustment shall also be negotiated on behalf of the District by the General Manager, who shall recommend that the Board adopt an adjustment to such rate, fee or charge for the requesting educational entity or state agency that complies with the provisions of Government Code 54999.3. (Res. 16-02 Exh. A (part); Res. 15-02 Exh. A (part); Res. 12-03 Exh. A (part); Res. 11-03 Exh. A (part);Res. 09-01 Exh. A (part); Res. 04-03 Exh. A (part); (Res. 03-05 Exh. A (part); (Res. 02-01 Exh. A (part); Res. 01-04 Exh. A (part); Res. 00-01 Exh. A (part); Res. 99-4 Exh. A (part); Res. 98-2 § 2 (part); Res. 97-3 (part); Res. 95-55 (part); Res. 95-6 Exh. A (part); Res. 91-56 § 2 Exh. B (part); Res. 91-18 Exh. A (part); Res. 90-84 Exh. A (part); Reg. 4 § 5); Res 06-02 Exh. A (part)
5.12.060 Residential Irrigation Service.
A. Applicable Service Connections. A service connection shall be classified as residential irrigation if the
connection is used solely for treated water irrigation purposes on parcels of land with one or more residential dwelling units.
B. Service and Demand Charge. A charge for water service, irrespective of the quantity used, shall be applied to all residential irrigation connections to the District’s treated water distribution system as follows:
Meter Size Charge Per Day
5/8 inch $0.5822 ¾ inch 0.8733 1 inch 1.4555
1½ inch 2.9109 2 inch 4.6574 3 inch 9.3149 4 inch 14.5545 6 inch 29.1091 8 inch 52.3963
10 inch 84.4163 12 inch 125.1690
Dual 1½ inch 5.8218 Dual 2 inch 9.3149
C. Quantity Charge. For all water delivered, a charge of $3.6081 per hundred cubic feet shall be applied.
D. Energy Surcharge. A surcharge for energy shall be applied to all water delivered through each residential single-unit meter connection to the District’s treated water distribution system as follows:
Zone in Which Service Connection is Located
Surcharge Per Hundred Cubic Feet
Zone No. 1 $ 0.0767 Zone No. 2 0.1514 Zone No. 3 0.2120 Zone No. 4 0.2763 Zone No. 5 0.3889 Zone No. 6 0.4497 Zone No. 5E 0.5614 Zone No. 6E 0.5614 Zone No. 7 0.5614 Zone No. 8 0.7545
B. Backflow Prevention Surcharge. A surcharge shall be applied to each service connection with a backflow prevention device as follows:
Surcharge Per Day
eter Size
Double Check Valve or
Air Gap System
Reduced Pressure Backflow
Prevention Device 5/8 inch $ 0.0430 $ 0.0656
¾ inch 0.0644 0.0984 1 inch 0.1074 0.1638
1½ inch 0.2148 0.3277 2 inch 0.3436 0.5245 3 inch 0.6874 1.0487

5.12
Title 5‐15 CCWD Code of Regulations (2‐13)
4 inch 1.0740 1.6387 6 inch 2.1479 3.2770 8 inch 3.8701 5.9023
10 inch 6.2294 9.5093 12 inch 9.2450 14.1040
Dual 1½ inch 0.4296 0.6556 Dual 2 inch 0.6874 1.0487
(Res. 16-02 Exh. A (part); Res. 15-02 Exh. A (part);Res. 13-02 Exh. A (part); Res. 12-03 Exh. A (part);Res. 11-03 Exh. A (part); Res. 09-01 Exh A (part); Res. 04-03 Exh. A (part); (Res. 03-05 Exh. A (part); (Res. 02-01 Exh. A (part); Res. 01-04 Exh. A (part); Res. 00-01 Exh. A (part); Res. 99-4 Exh. A (part); Res. 98-2 § 2 (part); Res. 97-3 (part); Res. 95-55 (part); Res. 95-6 Exh. A (part); Res. 91-56 § 2 Exh. B (part); Res. 91-18 Exh. A (part); Res. 90-84 Exh. A (part); Reg. 4 § 6)
5.12.070 Commercial and Industrial Irrigation
Service. A. Applicable Service Connections. A service
connection shall be classified as commercial or industrial irrigation if the connection is used solely for treated water irrigation purposes on parcels with commercial or industrial enterprises.
B. Service and Demand Charge. A charge for water service, irrespective of the quantity used, shall be applied to all commercial or industrial irrigation connections to the District’s treated water distribution system as follows:
Meter Size Charge Per Day 5/8 inch $0.5822
¾ inch 0.8733 1 inch 1.4555
1½ inch 2.9109 2 inch 4.6574 3 inch 9.3149 4 inch 14.5545 6 inch 29.1091 8 inch 52.3963
10 inch 84.4163 12 inch 125.1690
Dual 1½ inch 5.8218 Dual 2 inch 9.3149
C. Quantity Charge. For all water delivered, a charge
of $3.6081 per hundred cubic feet shall be applied. D. Energy Surcharge. A surcharge for energy shall
be applied to all water delivered through each residential single-unit meter connection to the District’s treated water distribution system as follows:
Zone in Which Service Connection is Located
Surcharge Per Hundred Cubic Feet
Zone No. 1 $ 0.0767 Zone No. 2 0.1514 Zone No. 3 0.2120
Zone No. 4 0.2763 Zone No. 5 0.3889 Zone No. 6 0.4497 Zone No. 5E 0.5614 Zone No. 6E 0.5614 Zone No. 7 0.5614 Zone No. 8 0.7545
E. Backflow Prevention Surcharge. A surcharge shall be applied to each service connection with a backflow prevention device as follows:
Surcharge Per Day
Meter Size
Double Check Valve or
Air Gap System
Reduced Pressure Backflow
Prevention Device 5/8 inch $ 0.0430 $ 0.0656
¾ inch 0.0644 0.0984 1 inch 0.1074 0.1638
1½ inch 0.2148 0.3277 2 inch 0.3436 0.5245 3 inch 0.6874 1.0487 4 inch 1.0740 1.6387 6 inch 2.1479 3.2770 8 inch 3.8701 5.9023
10 inch 6.2294 9.5093 12 inch 9.2450 14.1040
Dual 1½ inch 0.4296 0.6556 Dual 2 inch 0.6874 1.0487
(Res. 16-02 Exh A (part);Res. 15-02 Exh A (part);Res. 13-02 Exh. A (part); Res. 12-03 Exh. A (part);Res. 11-03 Exh A (part); Res. 09-01 Exh A (part); Res. 04-03 Exh. A (part); Res. 03-05 Exh. A (part); Res. 02-01 Exh. A (part); Res. 01-04 Exh. A (part); Res. 00-01 Exh. A (part); Res. 99-4 Exh. A (part); Res. 98-2 § 2 (part); Res. 97-3 (part); Res. 95-55 (part); Res. 95-6 Exh. A (part); Res. 91-56 § 2 Exh. B (part); Res. 91-18 Exh. A (part); Res. 90-84 Exh. A (part); Reg. 4 § 7) 5.12.080 Public Authority Irrigation Service.
A. Applicable Service Connections. A service connection shall be classified as public authority irrigation if the connection is used solely for treated water irrigation purposes on federal, state, city and other local government or public agency properties. Public water service to parks, playgrounds, and street medians shall be included in this class of service.
B. Service and Demand Charge. A charge for water service, irrespective of the quantity used, shall be applied to all commercial or industrial irrigation connections to the District’s treated water distribution system as follows:
Meter Size Charge Per Day 5/8 inch $0.5822
¾ inch 0.8733 1 inch 1.4555
1½ inch 2.9109

5.12
Title 5‐16 CCWD Code of Regulations (2‐13)
2 inch 4.6574 3 inch 9.3149 4 inch 14.5545 6 inch 29.1091 8 inch 52.3963
10 inch 84.4163 12 inch 125.1690
Dual 1½ inch 5.8218 Dual 2 inch 9.3149
C. Quantity Charge. For all water delivered, a charge
of $3.6081 per hundred cubic feet shall be applied. D. Energy Surcharge. A surcharge for energy shall
be applied to all water delivered through each residential single-unit meter connection to the District’s treated water distribution system as follows:
Zone in Which Service Surcharge Per Connection is Located Hundred Cubic Feet
Zone No. 1 $ 0.0767 Zone No. 2 0.1514 Zone No. 3 0.2120 Zone No. 4 0.2763 Zone No. 5 0.3889 Zone No. 6 0.4497 Zone No. 5E 0.5614 Zone No. 6E 0.5614 Zone No. 7 0.5614 Zone No. 8 0.7545
E. Backflow Prevention Surcharge. A surcharge shall be applied to each service connection with a backflow prevention device as follows:
Surcharge Per Day
Meter Size
Double Check Valve or
Air Gap System
Reduced Pressure Backflow
Prevention Device 5/8 inch $ 0.0430 $0.0656
¾ inch 0.0644 0.0984 1 inch 0.1074 0.1638
1½ inch 0.2148 0.3277 2 inch 0.3436 0.5245 3 inch 0.6874 1.0487 4 inch 1.0740 1.6387 6 inch 2.1479 3.2770 8 inch 3.8701 5.9023
10 inch 6.2294 9.5093 12 inch 9.2450 14.1040
Dual 1½ inch 0.4296 0.6556 Dual 2 inch 0.6874 1.0487
F. Educational Entities or State Agencies. Educational entities or state agencies will be charged the same nondiscriminatory rates, fees and charges as comparable nonpublic users pursuant to Government Code section 54999.1(f). Upon a request of an educational entity or state agency for a determination of whether any rate, fee
or charge complies with Government Code section 54999.1(f), such determination shall be made by the General Manager. Should the General Manager determine that a rate, fee or charge should be adjusted, the amount of adjustment shall also be negotiated on behalf of the District by the General Manager, who shall recommend that the Board adopt an adjustment to such rate, fee or charge for the requesting educational entity or state agency that complies with the provisions of Government Code 54999.3. (Res. 16-02 Exh. A (part);Res 15-02 Exh. A (part); Res. 13-02 Exh A (part); (Res. 12-02 Exh A (part); Res. 11-03 Exh A (part); (Res. 06-02 Exh A (part)Res. 04-03 Exh. A (part); (Res. 03-05 Exh. A (part); (Res. 02-01 Exh. A (part); Res. 01-04 Exh. A (part); Res. 00-01 Exh. A (part); Res. 99-4 Exh. A (part); Res. 98-2 § 2 (part); Res. 97-3 (part); Res. 95-55 (part); Res. 95-6 Exh. A (part); Res. 91-56 § 2 Exh. B (part); Res. 91-18 Exh. A (part); Res. 90-84 Exh. A (part); Reg. 4 § 8) 5.12.090 Private Fire Protection Service.
A. Applicable Service Connections. A service connection shall be classified as private fire protection if the connection is used solely for standby service for a privately owned fire protection system.
B. Service and Demand Charge. A charge for water availability and emergency service shall be applied to all private fire system connections to the District’s treated water distribution system as follows:
Detector Size Charge Per Day 2 inch $0.0232 3 inch 0.0459 4 inch 0.0718 6 inch 0.1434 8 inch 0.2580
10 inch 0.4163 12 inch 0.6036
C. Backflow Prevention Surcharge. A flat rate surcharge of $0.6874 per day shall be applied to each service connection with a double check valve backflow prevention device and $1.0487 per day shall be applied to each service with a reduced pressure backflow prevention device.. (Res. 16-02 Exh. A. (part); Res. 13-02 Exh A. (part); Res. 12-03 Exh A. (Part); Res. 11-03 Exh. A (part); (Res. 09-01 Exh. A (part); Res. 03-05 Exh. A (part); (Res. 02-01 Exh. A (part); Res. 01-04 Exh. A (part); Res. 00-01 Exh. A (part); Res. 99-4 Exh. A (part); Res. 98-2 § 2 (part); Res. 97-3 (part); Res. 95-55 (part); Res. 95-6 Exh. A (part); Res. 91-56 § 2 Exh. B (part); Res. 91-18 Exh. A (part); Res. 90-84 Exh. A (part); Reg. 4 § 9)
5.12.100 Hydrant Service and Temporary Service.
A. Applicable Service Connections and Considerations. A service connection shall be classified as temporary if the connection is made to a District fire

5.12
Title 5‐17 CCWD Code of Regulations (2‐13)
hydrant or other temporary point of access and is determined by the District to be for temporary purposes. For this purpose, temporary service shall be defined as any anticipated or actual use with a duration of less than one year, whether continuous or intermittent.
1. Facilities Reserve Charges. a. When the District determines that the
duration of a proposed service will be temporary, it may furnish service on a temporary basis without payment of a Facilities Reserve Charge.
b. The Facilities Reserve Charge shall be paid for human consumption, domestic or livestock use with an anticipated or actual duration of more than one year, whether continuous or intermittent. The Facilities Reserve Charge will be based on the District’s estimate of the normal meter size of the place where the water is used.
c. If such service is discontinued within one year, the Facilities Reserve Charge will be refunded without interest.
d. If the service is continued for longer than one year, the Facilities Reserve Charge may be credited to any Facilities Reserve Charge thereafter imposed on the place where the water is used.
2. Installation and Removal Charges-Security Deposits. Applicants for temporary service will pay the District’s estimate of the cost of installing and removing the service connection and a reasonable security deposit for the meter.
B. Service Through Fire Hydrants. 1. Conditions of Service. Service will be
furnished through fire hydrants only if the District finds that circumstances exist, which make it impractical to furnish service through a normal connection. The District may designate the particular hydrant or hydrants at which service will be furnished. Water will be furnished for use outside Improvement District No. 1 only on specific authorization of the Board of Directors for reasons of public health or safety or cases involving severe economic hardship.
2. Service for Human and Domestic Use. Water for human, domestic, or livestock use will be delivered from fire hydrants only for use at locations to which it is not feasible to extend the District’s distribution system. Feasibility shall be determined prior to establishing service and will be reviewed and determined by the District annually. Each person transporting water from fire hydrants for human consumption shall furnish proof that such person holds all required licenses and permits and is in compliance with all health regulations of all federal, state, and local governmental agencies having jurisdiction.
3. Metering. Portable meters furnished by the District will measure all water delivered through fire hydrants.
4. Applications. Applications for service from fire hydrants shall be made on forms furnished by the District.
C. Service and Demand Charge. 1. A charge for water service, irrespective of the
quantity used, shall be applied to temporary connections to the District’s treated water distribution system as follows:
Meter Size
Charge Per Day
5/8 inch $ 0.5822 ¾ inch 0.8733 1 inch 1.455
1½ inch 2.9109 2 inch 4.6574 3 inch 9.3149 4 inch 14.5545 6 inch 29.1091 8 inch 52.3963
10 inch 84.4163 12 inch 125.1690
Dual 1½ inch 5.8218 Dual 2 inch 9.3149
* Service used exclusively for residential human consumption and domestic use shall be billed at the 5/8-inch meter size rate. D. Quantity Charge. For all water delivered, a charge of $3.6081 per hundred cubic feet shall be applied.
E. Energy Surcharge. A surcharge of $0.5614 per hundred cubic feet for energy shall be applied to all water delivered through each temporary connection to the District’s treated water distribution system irrespective of the zone in which the temporary service connection is located.
F. Public Fire Protection Surcharge. A surcharge for public fire protection to defray the cost of furnishing water for fire protection shall be applied to each connection to the District’s treated water distribution system as follows:
Meter Size Surcharge Per Day 5/8 inch $ 0.0323
¾ inch 0.0485 1 inch 0.0808
1 ½ inch 0.1615 2 inch 0.2585 3 inch 0.5169 4 inch 0.8077 6 inch 1.6154 8 inch 2.9070
10 inch 4.6848 12 inch 6.9445
Dual 1½ inch 0.3231 Dual 2 inch 0.5169
* Service used exclusively for residential human consumption and domestic use shall be billed at the 5/8-inch meter size rate.
G. Backflow Prevention Surcharge. A surcharge shall be applied to each temporary service connection with a backflow prevention device as follows:

5.12
Title 5‐18 CCWD Code of Regulations (2‐13)
Surcharge Per Day
eter Size
Double Check Valve or
Air Gap System
Reduced Pressure Backflow
Prevention Device* 5/8 inch $ 0.0430 $ 0.0656
¾ inch 0.0644 0.0984 1 inch 0.1074 0.1638
1½ inch 0.2148 0.3277 2 inch 0.3436 0.5245 3 inch 0.6874 1.0487 4 inch 1.0740 1.6387 6 inch 2.1479 3.2770 8 inch 3.8701 5.9023
10 inch 6.2294 9.5093 12 inch 9.2450 14.1040
Dual 1½ inch 0.4296 0.6556 Dual 2 inch 0.6874 1.0487
* Service used exclusively for residential human consumption and domestic use shall be billed at the 5/8-inch meter size rate. Res. 16-02 Exh. A (part); Res. 15-02 Exh. A (part); Res. 13-02 Exh. A (part) Res. 12-03 Exh. A (part); Res. 11-03 Exh. A (part); Res. 09-01 Exh. A (part); Res. 04-03 Exh. A (part); (Res. 03-05 Exh. A (part); (Res. 02-01 Exh. A (part); Res. 01-04 Exh. A (part); Res. 00-01 Exh. A (part); Res. 99-4 Exh. A (part); Res. 98-2 § 2 (part); Res. 97-3 (part); Res. 95-55 (part); Res. 95-6 Exh. A (part); Res. 91-56 § 2 Exh. B (part); Res. 91-18 Exh. A (part); Res. 90-84 Exh. A (part); Reg. 4 § 10) 5.12.110 Wholesale Treated (potable) Water
Service. A. Applicable Service Connections: A service
connection shall be classified as wholesale treated water service if the connection provides treated (potable) water service to a publicly owned or investor-owned utility, or to another person, for resale purposes.
B. Wholesale Treated (potable) Water Charges and Rates: Notwithstanding the provisions of this Chapter set forth above (consisting of Sections 5.12.010 through and including 5.12.100), the District may, from time to time, enter into agreements with publicly owned or investor-owned utilities, or with other persons, for the sale of wholesale treated (potable) water. The methodology and calculation of wholesale treated water charges and rates shall be set forth in each such agreement, and shall, to the degree feasible, use the same cost components and criteria as those used to compute charges and rates for retail treated (potable) water service. (Res. 98-2 § 2 (part))
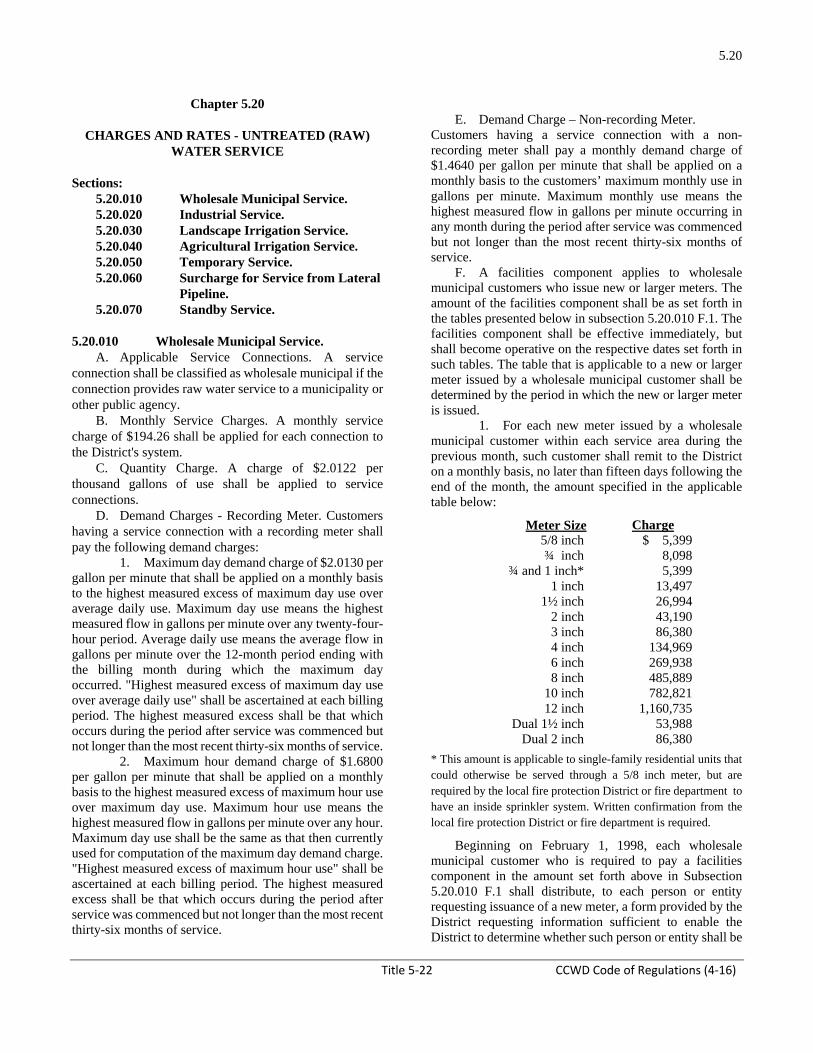
5.20
Title 5‐22 CCWD Code of Regulations (4‐16)
Chapter 5.20
CHARGES AND RATES - UNTREATED (RAW) WATER SERVICE
Sections:
5.20.010 Wholesale Municipal Service. 5.20.020 Industrial Service. 5.20.030 Landscape Irrigation Service. 5.20.040 Agricultural Irrigation Service. 5.20.050 Temporary Service. 5.20.060 Surcharge for Service from Lateral
Pipeline. 5.20.070 Standby Service.
5.20.010 Wholesale Municipal Service. A. Applicable Service Connections. A service
connection shall be classified as wholesale municipal if the connection provides raw water service to a municipality or other public agency.
B. Monthly Service Charges. A monthly service charge of $194.26 shall be applied for each connection to the District's system.
C. Quantity Charge. A charge of $2.0122 per thousand gallons of use shall be applied to service connections.
D. Demand Charges - Recording Meter. Customers having a service connection with a recording meter shall pay the following demand charges:
1. Maximum day demand charge of $2.0130 per gallon per minute that shall be applied on a monthly basis to the highest measured excess of maximum day use over average daily use. Maximum day use means the highest measured flow in gallons per minute over any twenty-four-hour period. Average daily use means the average flow in gallons per minute over the 12-month period ending with the billing month during which the maximum day occurred. "Highest measured excess of maximum day use over average daily use" shall be ascertained at each billing period. The highest measured excess shall be that which occurs during the period after service was commenced but not longer than the most recent thirty-six months of service.
2. Maximum hour demand charge of $1.6800 per gallon per minute that shall be applied on a monthly basis to the highest measured excess of maximum hour use over maximum day use. Maximum hour use means the highest measured flow in gallons per minute over any hour. Maximum day use shall be the same as that then currently used for computation of the maximum day demand charge. "Highest measured excess of maximum hour use" shall be ascertained at each billing period. The highest measured excess shall be that which occurs during the period after service was commenced but not longer than the most recent thirty-six months of service.
E. Demand Charge – Non-recording Meter.
Customers having a service connection with a non-recording meter shall pay a monthly demand charge of $1.4640 per gallon per minute that shall be applied on a monthly basis to the customers’ maximum monthly use in gallons per minute. Maximum monthly use means the highest measured flow in gallons per minute occurring in any month during the period after service was commenced but not longer than the most recent thirty-six months of service.
F. A facilities component applies to wholesale municipal customers who issue new or larger meters. The amount of the facilities component shall be as set forth in the tables presented below in subsection 5.20.010 F.1. The facilities component shall be effective immediately, but shall become operative on the respective dates set forth in such tables. The table that is applicable to a new or larger meter issued by a wholesale municipal customer shall be determined by the period in which the new or larger meter is issued.
1. For each new meter issued by a wholesale municipal customer within each service area during the previous month, such customer shall remit to the District on a monthly basis, no later than fifteen days following the end of the month, the amount specified in the applicable table below:
Meter Size Charge 5/8 inch $ 5,399 ¾ inch 8,098
¾ and 1 inch* 5,399 1 inch 13,497
1½ inch 26,994 2 inch 43,190 3 inch 86,380 4 inch 134,969 6 inch 269,938 8 inch 485,889
10 inch 782,821 12 inch 1,160,735
Dual 1½ inch 53,988 Dual 2 inch 86,380
* This amount is applicable to single-family residential units that could otherwise be served through a 5/8 inch meter, but are required by the local fire protection District or fire department to have an inside sprinkler system. Written confirmation from the local fire protection District or fire department is required.
Beginning on February 1, 1998, each wholesale municipal customer who is required to pay a facilities component in the amount set forth above in Subsection 5.20.010 F.1 shall distribute, to each person or entity requesting issuance of a new meter, a form provided by the District requesting information sufficient to enable the District to determine whether such person or entity shall be
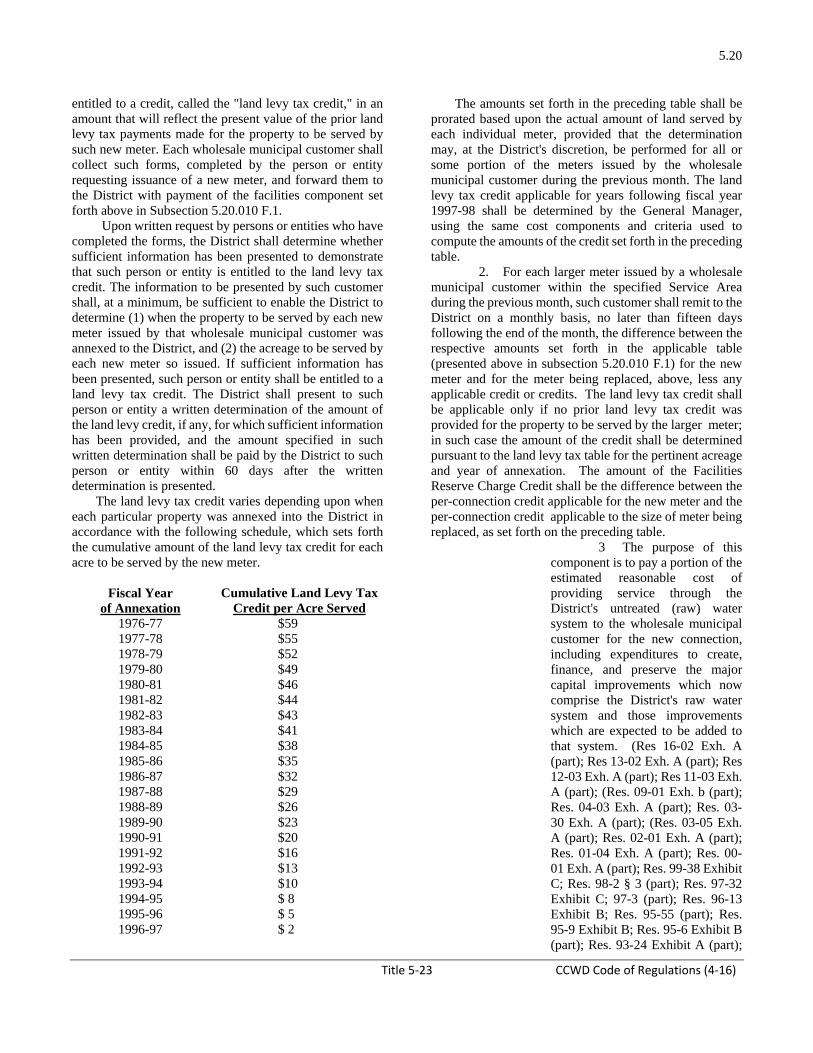
5.20
Title 5‐23 CCWD Code of Regulations (4‐16)
entitled to a credit, called the "land levy tax credit," in an amount that will reflect the present value of the prior land levy tax payments made for the property to be served by such new meter. Each wholesale municipal customer shall collect such forms, completed by the person or entity requesting issuance of a new meter, and forward them to the District with payment of the facilities component set forth above in Subsection 5.20.010 F.1. Upon written request by persons or entities who have completed the forms, the District shall determine whether sufficient information has been presented to demonstrate that such person or entity is entitled to the land levy tax credit. The information to be presented by such customer shall, at a minimum, be sufficient to enable the District to determine (1) when the property to be served by each new meter issued by that wholesale municipal customer was annexed to the District, and (2) the acreage to be served by each new meter so issued. If sufficient information has been presented, such person or entity shall be entitled to a land levy tax credit. The District shall present to such person or entity a written determination of the amount of the land levy credit, if any, for which sufficient information has been provided, and the amount specified in such written determination shall be paid by the District to such person or entity within 60 days after the written determination is presented. The land levy tax credit varies depending upon when each particular property was annexed into the District in accordance with the following schedule, which sets forth the cumulative amount of the land levy tax credit for each acre to be served by the new meter.
Fiscal Year of Annexation
Cumulative Land Levy Tax Credit per Acre Served
1976-77 $59 1977-78 $55 1978-79 $52 1979-80 $49 1980-81 $46 1981-82 $44 1982-83 $43 1983-84 $41 1984-85 $38 1985-86 $35 1986-87 $32 1987-88 $29 1988-89 $26 1989-90 $23 1990-91 $20 1991-92 $16 1992-93 $13 1993-94 $10 1994-95 $ 8 1995-96 $ 5 1996-97 $ 2
The amounts set forth in the preceding table shall be prorated based upon the actual amount of land served by each individual meter, provided that the determination may, at the District's discretion, be performed for all or some portion of the meters issued by the wholesale municipal customer during the previous month. The land levy tax credit applicable for years following fiscal year 1997-98 shall be determined by the General Manager, using the same cost components and criteria used to compute the amounts of the credit set forth in the preceding table.
2. For each larger meter issued by a wholesale municipal customer within the specified Service Area during the previous month, such customer shall remit to the District on a monthly basis, no later than fifteen days following the end of the month, the difference between the respective amounts set forth in the applicable table (presented above in subsection 5.20.010 F.1) for the new meter and for the meter being replaced, above, less any applicable credit or credits. The land levy tax credit shall be applicable only if no prior land levy tax credit was provided for the property to be served by the larger meter; in such case the amount of the credit shall be determined pursuant to the land levy tax table for the pertinent acreage and year of annexation. The amount of the Facilities Reserve Charge Credit shall be the difference between the per-connection credit applicable for the new meter and the per-connection credit applicable to the size of meter being replaced, as set forth on the preceding table.
3 The purpose of this component is to pay a portion of the estimated reasonable cost of providing service through the District's untreated (raw) water system to the wholesale municipal customer for the new connection, including expenditures to create, finance, and preserve the major capital improvements which now comprise the District's raw water system and those improvements which are expected to be added to that system. (Res 16-02 Exh. A (part); Res 13-02 Exh. A (part); Res 12-03 Exh. A (part); Res 11-03 Exh. A (part); (Res. 09-01 Exh. b (part); Res. 04-03 Exh. A (part); Res. 03-30 Exh. A (part); (Res. 03-05 Exh. A (part); Res. 02-01 Exh. A (part); Res. 01-04 Exh. A (part); Res. 00-01 Exh. A (part); Res. 99-38 Exhibit C; Res. 98-2 § 3 (part); Res. 97-32 Exhibit C; 97-3 (part); Res. 96-13 Exhibit B; Res. 95-55 (part); Res. 95-9 Exhibit B; Res. 95-6 Exhibit B (part); Res. 93-24 Exhibit A (part);
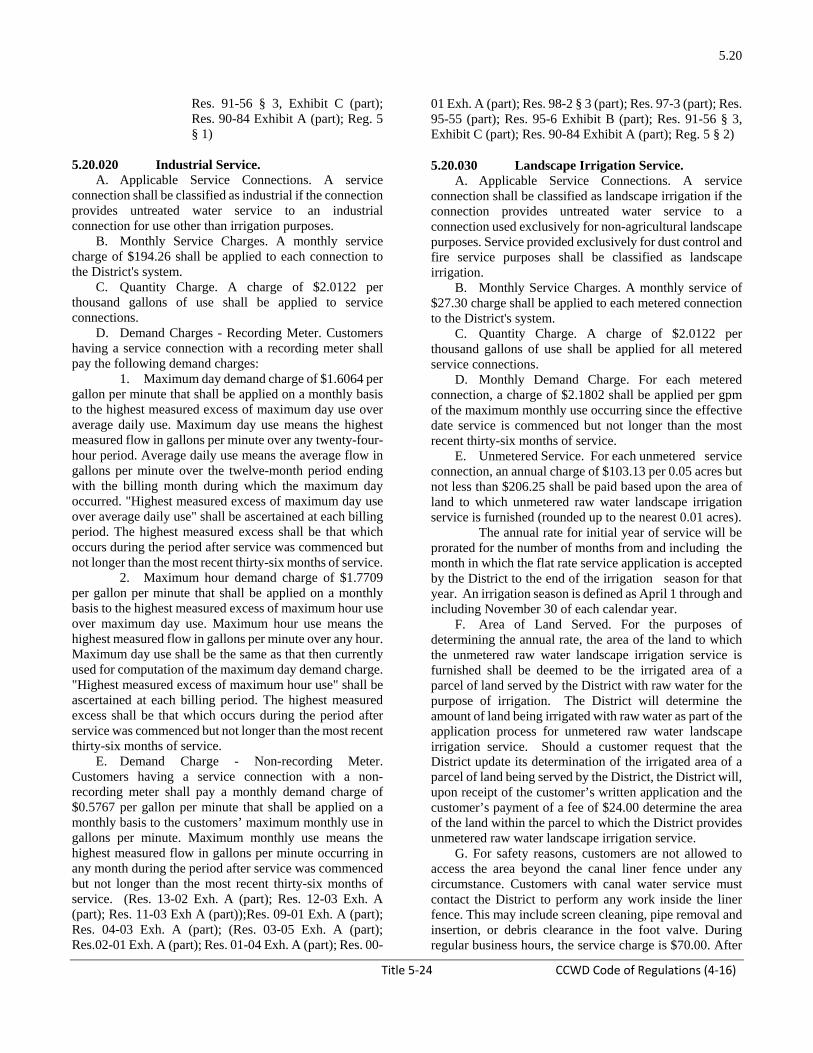
5.20
Title 5‐24 CCWD Code of Regulations (4‐16)
Res. 91-56 § 3, Exhibit C (part); Res. 90-84 Exhibit A (part); Reg. 5 § 1)
5.20.020 Industrial Service.
A. Applicable Service Connections. A service connection shall be classified as industrial if the connection provides untreated water service to an industrial connection for use other than irrigation purposes.
B. Monthly Service Charges. A monthly service charge of $194.26 shall be applied to each connection to the District's system.
C. Quantity Charge. A charge of $2.0122 per thousand gallons of use shall be applied to service connections.
D. Demand Charges - Recording Meter. Customers having a service connection with a recording meter shall pay the following demand charges:
1. Maximum day demand charge of $1.6064 per gallon per minute that shall be applied on a monthly basis to the highest measured excess of maximum day use over average daily use. Maximum day use means the highest measured flow in gallons per minute over any twenty-four-hour period. Average daily use means the average flow in gallons per minute over the twelve-month period ending with the billing month during which the maximum day occurred. "Highest measured excess of maximum day use over average daily use" shall be ascertained at each billing period. The highest measured excess shall be that which occurs during the period after service was commenced but not longer than the most recent thirty-six months of service.
2. Maximum hour demand charge of $1.7709 per gallon per minute that shall be applied on a monthly basis to the highest measured excess of maximum hour use over maximum day use. Maximum hour use means the highest measured flow in gallons per minute over any hour. Maximum day use shall be the same as that then currently used for computation of the maximum day demand charge. "Highest measured excess of maximum hour use" shall be ascertained at each billing period. The highest measured excess shall be that which occurs during the period after service was commenced but not longer than the most recent thirty-six months of service.
E. Demand Charge - Non-recording Meter. Customers having a service connection with a non-recording meter shall pay a monthly demand charge of $0.5767 per gallon per minute that shall be applied on a monthly basis to the customers’ maximum monthly use in gallons per minute. Maximum monthly use means the highest measured flow in gallons per minute occurring in any month during the period after service was commenced but not longer than the most recent thirty-six months of service. (Res. 13-02 Exh. A (part); Res. 12-03 Exh. A (part); Res. 11-03 Exh A (part));Res. 09-01 Exh. A (part); Res. 04-03 Exh. A (part); (Res. 03-05 Exh. A (part); Res.02-01 Exh. A (part); Res. 01-04 Exh. A (part); Res. 00-
01 Exh. A (part); Res. 98-2 § 3 (part); Res. 97-3 (part); Res. 95-55 (part); Res. 95-6 Exhibit B (part); Res. 91-56 § 3, Exhibit C (part); Res. 90-84 Exhibit A (part); Reg. 5 § 2) 5.20.030 Landscape Irrigation Service.
A. Applicable Service Connections. A service connection shall be classified as landscape irrigation if the connection provides untreated water service to a connection used exclusively for non-agricultural landscape purposes. Service provided exclusively for dust control and fire service purposes shall be classified as landscape irrigation.
B. Monthly Service Charges. A monthly service of $27.30 charge shall be applied to each metered connection to the District's system.
C. Quantity Charge. A charge of $2.0122 per thousand gallons of use shall be applied for all metered service connections.
D. Monthly Demand Charge. For each metered connection, a charge of $2.1802 shall be applied per gpm of the maximum monthly use occurring since the effective date service is commenced but not longer than the most recent thirty-six months of service.
E. Unmetered Service. For each unmetered service connection, an annual charge of $103.13 per 0.05 acres but not less than $206.25 shall be paid based upon the area of land to which unmetered raw water landscape irrigation service is furnished (rounded up to the nearest 0.01 acres).
The annual rate for initial year of service will be prorated for the number of months from and including the month in which the flat rate service application is accepted by the District to the end of the irrigation season for that year. An irrigation season is defined as April 1 through and including November 30 of each calendar year.
F. Area of Land Served. For the purposes of determining the annual rate, the area of the land to which the unmetered raw water landscape irrigation service is furnished shall be deemed to be the irrigated area of a parcel of land served by the District with raw water for the purpose of irrigation. The District will determine the amount of land being irrigated with raw water as part of the application process for unmetered raw water landscape irrigation service. Should a customer request that the District update its determination of the irrigated area of a parcel of land being served by the District, the District will, upon receipt of the customer’s written application and the customer’s payment of a fee of $24.00 determine the area of the land within the parcel to which the District provides unmetered raw water landscape irrigation service.
G. For safety reasons, customers are not allowed to access the area beyond the canal liner fence under any circumstance. Customers with canal water service must contact the District to perform any work inside the liner fence. This may include screen cleaning, pipe removal and insertion, or debris clearance in the foot valve. During regular business hours, the service charge is $70.00. After

5.20
Title 5‐25 CCWD Code of Regulations (4‐16)
hours, recognized as after 3:30 p.m. on Monday through Friday, on weekends or on holidays, the service charge is $180.00. (Res. 16-02 Exh A (part); Res. 15-02 Exh. A (part); Res. 13-02 Exh. A (part); Res. 12-03 Exh. A (part); Res. 11-03 Exh. A (part); Res. 09-01 Exh. A (part); Res. 04-03 Exh. A (part); Res 03-10 Exh. A (part); (Res. 03-05 Exh. A (part); Res. 02-01 Exh. A (part); Res. 01-04 Exh. A (part); Res. 00-01 Exh. A (part); Res. 98-2 § 3 (part); Res. 97-3 (part); Res. 95-8 Exhibit A; Res. 91-56 § 3, Exhibit C (part); Res. 90-84 Exhibit A (part); Reg. 5 § 3) 5.20.040 Agricultural Irrigation Service.
A. Applicable Service Connections. A service connection shall be classified as agricultural irrigation if the connection provides untreated water service to a connection used exclusively for commercial production of food or fiber crops or watering livestock on a parcel of land not less than two acres in area.
B. Annual Service Charges. For service connections used exclusively for livestock purposes, an annual charge of $61.76 shall be applied. For service connections used for agricultural irrigation purposes, an annual service charge of $23.29 shall be applied per acre or fraction thereof irrigated, but not less than $60.30.
C. Quantity Charge. A charge of $111.18 per acre-foot of use shall be applied for all water delivered. If the quantity is not metered, it shall be estimated by the District.
D. For safety reasons, customers are not allowed to access the area beyond the canal liner fence under any circumstance. Customers with canal water service must contact the District to perform any work inside the liner fence. This may include screen cleaning, pipe removal and insertion, or debris clearance in the foot valve. During regular business hours, the service charge is $70.00. After hours, recognized as after 3:30 p.m. on Monday through Friday, on weekends or on holidays, the service charge is $180.00.
(Res. 13-02 Exh. A (part); Res. 12-03 Exh. A (part); Res. 11-03 Exh A. (part) Res. 09-01 Exh A. (part); Res. 04-03 Exh. A (part); (Res. 03-05 Exh. A (part); Res. 02-01 Exh. A (part); Res. 01-04 Exh. A (part); Res. 00-01 Exh. A (part); Res. 91-56 § 3, Exhibit C (part); Res. 90-84 Exhibit A (part); Reg. 5 § 4) 5.20.050 Temporary Service.
A. Applicable Service Connections. A service connection shall be classified as temporary service if the connection provides untreated water service to a connection determined by the District to be temporary in nature.
B. Monthly Service Charges. A monthly service charge of $26.95 shall be applied for each connection to the District's system.
C. Quantity Charge. A charge of $2.0122 per thousand gallons of use shall be applied for all service connections.
D. Monthly Demand Charge. For each connection, a charge of $0.6104 shall be applied for each gallon per minute of maximum monthly use occurring since the effective date service is commenced but not longer than the most recent thirty-six months of service and not less than 10 gpm.
E. Payment. Charges for temporary service shall be paid in advance on the basis of the District's estimate of the quantity to be used. Water used in excess of such estimate shall be paid for on receipt of invoice. Should it be determined by the District on termination of service that actual use was less than estimated, the District shall refund the amount paid for such difference.
F. For safety reasons, customers are not allowed to access the area beyond the canal liner fence under any circumstance. Customers with canal water service must contact the District to perform any work inside the liner fence. This may include screen cleaning, pipe removal and insertion, or debris clearance in the foot valve. During regular business hours, the service charge is $70.00. After hours, recognized as after 3:30 p.m. on Monday through Friday, on weekends or on holidays, the service charge is $180.00. (Res 16-02 Exh. A (part); Res 15-02 Exh. A (part);Res. 13-02 Exh. A (part); Res. 12-03 Exh. A (part); Res.11-03 Exh. A (part); (Res. 09-01 Exh. A (part); Res. 04-03 Exh. A (part); (Res. 03-05 Exh. A (part); Res. 02-01 Exh. A (part); Res. 01-04 Exh. A (part); Res. 00-01 Exh. A (part); Res. 98-2 § 3 (part); Res. 97-3 (part); Res. 95-55 (part); Res. 95-6 Exhibit B (part); Res. 91-56 § 3, Exhibit C (part); Res. 90-84 Exhibit A (part); Reg. 5 § 5)
5.20.060 Surcharge for Service from Lateral Pipeline
A. An annual surcharge in addition to the charges imposed by Sections 5.20.010 through 5.20.040 shall be applied to each service through a lateral pipeline from the Contra Costa Canal operated by the District for the purpose of recovering a portion of the capital cost thereof reimbursable to the United States Bureau of Reclamation. The surcharge shall be based on the design capacity of the customer's turnout as determined by the District and expressed in tenths of a cubic foot per second multiplied by the amount for each lateral as set forth below:
Lateral at Milepost (Amount per 1/10 cu. ft./sec)
Amount Per Tenth of a Cubic Foot (Per Second)
Milepost 5.3 $ 31.00 Milepost 6.2 23.00 Milepost 7.1 40.00 Milepost 7.3 21.00 Milepost 9.1 14.00 Milepost 14.0 90.00 Milepost 25.6 47.00 Milepost 36.6 24.00 Milepost Y-2.6 27.00

5.20
Title 5‐26 CCWD Code of Regulations (4‐16)
B. In addition, all above laterals will have a minimum annual charge of three dollars. (Res. 02-04 Exh. A (part); Res. 95-6 Exh. B (part); Res. 91-56 § 3, Exh. C (part); Res. 90-84 Exh. A (part); Reg 5 §6) 5.20.070 Standby Service.
A. Applicable Service Connections. A service connection shall be classified as standby service if the connection provides untreated water as a standby or water availability service for uses that do not regularly recur such as firefighting.
B. Annual Service Charge. An annual charge based on the area of land to which service is furnished of $274.68 per acre or fraction thereof shall be applied for standby service. (Res. 15-02 Exh. A (part); Res. 13-02 Exh. A (part); Res. 12-03 Exh. A (part); Res. 11-03 Exh. A (part); Res. 91-56 § 3, Exhibit C (part); Res. 90-84 Exhibit A (part); Res. 90-36 Reg. 5 § 7)

5.48
Title 5‐36 CCWD Code
of Regulations (5‐16)
Chapter 5.44
WATER CONSERVATION Sections:
5.44.010 Prevention of Waste. 5.44.020 Encouraged. 5.44.030 Conservation Program – Rules and
Regulations
5.44.010 Prevention of Waste. The District may find, at its sole reasonable discretion, that a customer is wasting District-furnished water, which may include one or more of the following:
a) failing to repair a leak in the customer’s water system;
b) permitting excessive water run-off from the customer’s premises;
c) watering outdoor landscapes in a manner that causes excessive runoff such that water flows onto adjacent property, non-irrigated areas, private and public walkways, roadways, parking lots, or structures;
d) watering of outdoor landscapes during and up to 48 hours after measurable rainfall;
e) watering outdoor landscapes between the hours of 9:00 a.m. and 5:00 p.m.;
f) using of a hose to wash a motor vehicle, except where the hose is fitted with a shut-off nozzle or device attached to it that causes it to cease dispensing water when not in use;
g) washing driveways, sidewalks, parking areas, patios or other outdoor area, unless the failure to do so would create a hazard to the health and safety of any individual or the public;
h) using potable water for non-recirculating fountains or other non-recirculating decorative water features;
i) irrigating ornamental turf in public street medians with potable water;
j) irrigating landscapes outside of newly constructed homes and buildings in a manner inconsistent with regulations or other requirements established by the California Building Standards Commission and the Department of Housing and Community Development;
k) or otherwise failing to put water received from the District to reasonable and beneficial use.
The General Manager of the District is authorized, without further action of the Board, to supplement the water use prohibitions detailed in Section 5.44.010, or to suspend enforcement of any prohibition, depending on existing water supply conditions or actions of the Governor, State Water Resources Control Board, or as may be necessary to
prevent the waste or unreasonable use of District water supplies.
Violation of any of the aforementioned prohibitions shall be subject to punishment by an administrative fine of not more than two hundred fifty dollars ($250) for a first offense, and five hundred dollars ($500) for a second offense; each administrative fine to be accompanied by an additional penalty of up to $10 per unit of water used or applied, in an amount to be determined in the District’s sole discretion. Each and every day such a violation exists, constitutes a separate and distinct offense for which an administrative fine and penalty may be assessed. The District, in its sole discretion, may choose to provide a warning to alleged violators requesting that they immediately cease the waste prior to imposing administrative fines or penalties, which warning shall not in itself constitute a violation of the rules and regulations. Imposition of administrative fines may be suspended by the Board of Directors by ordinance or resolution and subsequently reinstated in the same manner as the suspension was enacted. If the customer fails to take prompt, reasonable action to stop the waste, the District may at its discretion suspend delivery of water to the customer or install a device to restrict the flow of water to the customer until the District determines, at its sole reasonable discretion, that there will be no further waste of water by the customer. District determinations made pursuant to this section may be appealed in writing to the District’s General Manager or his designee, whose decision shall be final and binding. (Res. 90-84 Exh. A (part): Reg. 11(A)) Written applications for exceptions to, or waivers from, the aforementioned prohibitions shall be submitted to the District and may be granted in any case where the District determines, in its sole reasonable discretion, that the applicable restriction or prohibition would cause undue hardship, including but not limited to, adverse economic impacts (such as loss of production or jobs) or would prevent compliance with a term or condition within a permit issued by a state or federal agency. Denial of an application for exception or waiver may be appealed in writing to the District’s General Manager or his designee, whose decision shall be final and binding. 5.44.020 Encouraged. The District encourages the installation of water-conserving landscaping and water-saving devices in plumbing and water-using appliances. (Res. 90-84 Exh. A (part): Reg. 11(B))

5.48
Title 5‐37 CCWD Code
of Regulations (5‐16)
5.44.030 Conservation Program – Rules and Regulations A. Purpose and intent – The purpose of this program is to conserve the water supply of the Contra Costa Water District (“District) for the greatest public benefit with particular regard to public health, fire protection, industrial and domestic use, to conserve water by reducing waste, to maintain water use at or below historical levels to ensure that the available supply is sufficient to meet the water needs of the District’s customers, and to ensure that water supplies are sufficient in the event of conditions that restrict the District’s available water supply. B. Effective Period – These Regulations shall remain in effect until such date that they are amended, terminated, or superseded by action of the Board of Directors. C. Allocation of Untreated Water – To ensure that the available supply is sufficient to meet domestic, municipal, and industrial water needs of the District’s customers, each user of untreated water furnished by the District is strongly urged to not exceed their historical use. A customer’s historical use is based on the quantity of water furnished by the District and used during the corresponding period in 2013. D. Allocation of Treated Water – To ensure that the available supply is sufficient to meet domestic, municipal, and industrial water needs of the District’s customers, each user of treated water furnished by CCWD is strongly urged to not exceed their historical use. A customer’s historical use is based on the quantity of water furnished by the District and used during the corresponding period in 2013. E. Excess Use Charges – If a District customer uses water in excess of the applicable water usage thresholds enumerated below during any billing period, they will be subject to an excess use charge as follows: 1. During any billing period, any Single Family Residential, Multi-Family Residential, Irrigation and/or Agricultural customer with historical water usage of 1,000 gallons per day or less, that exceeds 1,000 gallons per day will be charged an Excess Use Charge equal to two times the current quantity charge for the customer class for the quantity of water used in excess of 1,000 gallons per day. 2. During any billing period, any Single Family Residential, Multi-Family Residential, Irrigation and/or Agricultural customer with historical water usage greater than 1,000 gallons per day, that exceeds their historical water usage will be charged an Excess Use Charge equal to two times the current quantity charge for the customer class for the quantity of water used in excess of their historical use. Historical water usage is based on the water use for the same billing period during the corresponding period in 2013. F. Exceptions and Waivers – Written applications for exceptions to, or waivers from, any provision of the Conservation Program Rules and Regulations shall be
granted in any case where the District determines, at its sole reasonable discretion, that the water budget, restriction, or prohibition may create a hazard to the health and safety of any individual or the public, or would cause undue hardship, including but not limited to, adverse economic impacts such as loss of production or jobs. Denial of an application may be appealed in writing to the District’s General Manager or his designee, whose decision shall be final and binding. Any customer whose account does not have consumption history for all, or any portion, of the base period (2013) used under these Conservation Rules and Regulations to establish the basis for their historical use, may apply for an exception so that an adjusted water budget may be established. Exceptions become effective on the date of approval and are not applied retroactively. G. If any provision of the Conservation Program Rules and Regulations, or any part thereof, is for any reason held to be ultra vires, invalid, unenforceable, or unconstitutional, the remaining provisions shall not be affected, but shall remain in full force and effect, and to this end the provisions of these Conservation Rules and Regulations are severable. (Ord 16-01 Exh. A (part)

5.70
Title 5-44 CCWD Code of Regulations (1-04)
Chapter 5.70
WHEELING OF WATER THROUGH DISTRICT FACILITIES
Sections:
5.70.010 General. 5.70.020 Requests for Use of Unused
Conveyance Capacity. 5.70.030 General Manager’s Report and
Recommendation and Board Findings.
5.70.040 Contract Terms and Conditions. 5.70.050 Wheeling to Assist in Times of
Emergency.
5.70.010 General. Under the provisions of Section 1810 et seq. Of California Water Code, a bona fide transferor of water may use water facilities of a local agency which have unused capacity, for the period of time when such capacity is available, if fair compensation is paid for that use and if statutorily specified conditions are met. This chapter is intended to set forth the terms and conditions under which the District will consider entering into contracts for individual wheeling transactions in response to requests from persons or public agencies seeking to use the unused capacity of all or a portion of the Contra Costa Water District’s conveyance system (conveyance system), including but not limited to pumping plants, canals, pipelines, reservoirs and appurtenant facilities, for the transfer of water. (Res. 99-2 Exh. A (part)) 5.70.020 Requests for Use of Unused
Conveyance Capacity. Any person or any public agency (meaning any city, county, district, other local authority, or public body of or within this state) which has a contract for the sale or purchase of water which is conditioned upon the acquisition of conveyance facility capacity to convey that water may request the right to use up to seventy percent of the unused capacity of the conveyance system. All requests for the right to use the conveyance system shall be considered by the District’s Board of Directors. In order to be considered by the District, each such request shall be in writing and shall include: A. A copy of the agreement or contract for the
transfer of water for which unused conveyance system capacity is required. The request shall specify the source and the amount of water sought to be conveyed, with the volume expressed in acre-feet and the rate expressed in cubic feet per second on an annual, monthly, and daily average and peak basis, and on an hourly peak basis. The time period or periods for which permission to use conveyance system capacity is sought shall also be expressed in detail. If the request is for use of less than the entire conveyance system and all of its related facilities, the
request shall specify the portion or portions of the conveyance system it seeks to use. If District approval of the request would require the construction or installation of any facilities, these shall be described in detail, including the purpose, nature, and location of such facilities. B. A detailed description of the quality of the water sought to be conveyed. If the requesting party believes that treatment of the transferred water will be required to avoid diminution of the quality of the water which would otherwise be in the conveyance system, the request shall include details of the nature and location of the proposed treatment techniques or methodologies which it proposes to employ to protect the water quality interests of the District. If the requesting party will treat the transferred water before it is put to beneficial use, the location and capacity of the treatment facilities, and the treatment technology to be used, shall be described in detail in the request. C. An acknowledgment by the requesting party that unused conveyance system capacity will be available only at those times and in those amounts which the District, in its sole discretion, determines. The request shall include the further acknowledgment that because of the manner in which the District’s conveyance system and the Los Vaqueros Reservoir have been integrated in District water supply operations, the availability of unused conveyance systems capacity at any time may be a function of the periodic operational considerations for both facilities, as well as for the District’s Bollman Treatment Plant and the Randall Bold Treatment Plant.
D. An acknowledgment that the paramount purpose for which the conveyance system is to be used is for the District to convey water to its present and future wholesale and retail water customers. The request shall also specifically acknowledge that any permission which may be granted for the right to use the conveyance shall be expressly subject and subordinate to the right of the District to fully utilize the conveyance system capacity for the benefit of its customers if required for District water system purposes or in the event of an emergency, as defined in Water Code Sec. 1811 (b), and which includes a sudden occurrence such as a storm, flood, fire, or an unexpected equipment outage impairing the ability of the District or its customers to make or receive water deliveries. (Res. 99-2 Exh. A (part)) 5.70.030 General Manager’s Report and
Recommendation and Board Findings. The District’s Board of Directors shall receive and consider a written report and recommendation from the General Manager regarding the request, including all engineering, economic, environmental and other relevant factors. Prior to authorizing District staff to negotiate with the requesting party regarding terms and conditions of a contract for the requested use of the District’s conveyance system, and based upon its consideration of the request, of appropriate environmental documentation provided by the

5.70
Title 5-45 CCWD Code of Regulations (1-04)
requesting party, and of the General Manager’s report and recommendation, the board shall find and determine: A. That the commingling of the water proposed to be transferred will not result in a diminution of the beneficial uses of the conveyance system and related facilities for District purposes; B. That there will be no diminution of the quality of water in the District’s conveyance system as a result of the transfer, and that if necessary and in order to prevent any such diminution, the transferor shall, as a condition of its contract with the District and at its sole expense, provide for treatment of the water to be transferred in order to guarantee that the quality of the transferred water will be substantially the same quality as that which would be in the conveyance system if no transfer occurred, so that there will be no diminution in the quality of raw or treated water served to customers by the District; C. That the requesting party has provided adequate assurance to the District, including determinations by the appropriate regulatory agencies, that the proposed use of the District’s conveyance system can be made without injuring any legal user of water, and without unreasonably affecting fish, wildlife, or other instream beneficial uses, and without unreasonably affecting the overall economy or the environment of the county from which the water is being transferred; and D. That the proposed transfer will not adversely affect the water supply, water quality, water service, or economic interests of present and future District wholesale and retail customers, for whose benefit the District retains the paramount right to use of the District’s entire conveyance system for water transmission and distribution purposes. (Res. 99-2 Exh. A (part)) 5.70.040 Contract Terms and Conditions. Any contract for use of the unused capacity of the District’s conveyance system shall include the following terms and conditions: A. A detailed description of the purpose and place of the use or uses to which the transferred water will be put, and identification of the source or sources of water for these uses if or when transferred water or conveyance system capacity are not available.
1. If the request is by a wholesale municipal customer of the District, the contract shall describe the area to be served, the present and future customers intended to be served with transferred water, and present and anticipated water demands. The contract shall also include the requesting party’s plan for serving water to this area and these customers in the event that sufficient transferred water or unused conveyance system capacity are not available for any period of time, including but not limited to the use of capacity by the District to meet the increased water demands of its current and future customers. To the extent that the requesting party’s plan includes reliance on the District for all or any portion of the water which will be required to meet all or any portion of the requesting party’s
present or future demands, the contract shall include the requesting party’s specific acknowledgment of and agreement to pay the transfer capacity availability charge described in Section 5.70.040(B)(3), as well as all other reasonable costs related to the wheeling transaction.
2. If the request is by any person or public agency other than a wholesale municipal raw water customer, including a raw water customer of the District, or a person or entity which is not a District customer, the contract shall describe the area to be served, the purpose of the beneficial use or uses proposed to be made with the transferred water, the current and historic source or sources of water used to serve these uses, and the anticipated water demand during the period of the transfer. The contract shall also include the requesting party’s plan for obtaining water to serve the area and the use or uses in question in the event that sufficient transferred water or unused District conveyance system capacity are not available for any period of time, including but not limited to the use of capacity by the District to meet the increased water demands of its current and future customers. To the extent that the requesting party’s plan includes reliance on the District for all or any portion of the water required to meet all or any portion of the requesting party’s demands, the contract shall include the requesting party’s specific acknowledgment of and agreement to pay the transfer capacity availability charge described in Section 5.70.040(B)(3), as well as all other reasonable costs related to the wheeling transaction. B. The charges to be paid by any party whose request to use available unused District conveyance system capacity is approved by the District shall include the following:
1. The reasonable costs incurred by the District related to the wheeling transaction, including the actual cost of all staff time and the costs of consultants or counsel for analysis of, assistance with, or administration of the transaction, and all costs related to the environmental documentation and any permits or approvals required for or in connection with the wheeling transaction.
2. An allocated share of reasonable capital, operations, maintenance, and replacement costs of the District’s conveyance system, including power costs, which are reasonably related to the wheeling transaction. Because unused conveyance system capacity is a direct function of the manner in which Los Vaqueros Reservoir and the conveyance system are operationally integrated, the reasonable costs shall include an appropriate allocated share of Los Vaqueros Project debt service, capital, operations, maintenance, and replacement costs.
3. If the requesting party will rely on the District for water in the event transferred water or unused conveyance system capacity is not available, the contract will provide for the payment of a transfer capacity availability charge, which shall represent the reasonable cost to the District to maintain the capacity to provide water to make up for the transferred water when it is not available

5.70
Title 5-46 CCWD Code of Regulations (1-04)
for any other reason. This capacity charge shall consist of an allocated share of reasonable capital, maintenance and replacement costs of the facilities in which capacity has been constructed and must be maintained by the District to meet the demand which will be created when transferred water or unused District conveyance system capacity are not available to the requesting party, and which capacity therefore will not be available for use by the District to meet the needs of other District customers. C. All environmental documentation, permits, and approvals for the proposed wheeling transaction shall be the responsibility of the party making the request for the right to use available unused District conveyance system capacity. If the wheeling transaction is part of a larger project for which another public agency is the lead agency under the California Environmental Quality Act (CEQA), the District shall serve as a responsible agency for environmental documentation regarding the decision of the board of directors on the request and as to the availability of unused District conveyance system capacity. If the party making the request to the District is a public agency, then the requesting party shall be the lead agency regarding CEQA. If the requesting party is a private entity, and the wheeling transaction is not part of a larger project for which CEQA compliance is required, the District will be lead agency. Any permits or approvals required from other governmental agencies, including consideration by the United States Bureau of Reclamation, review or consultation under the Federal or the California Endangered Species Act, or processing by the State Water Resources Control Board shall be the responsibility of the requesting party. (Res. 99-2 Exh. A (part)) 5.70.050 Wheeling to Assist in Times of Emergency. In the event of an emergency, as defined in Water Code Section 1811 (b), which is declared by an appropriate governmental agency and which can be wholly or partially alleviated by making temporary use of the conveyance system to transfer water, the General Manager may make the findings and determinations set forth in Section 5.70.030 and may thereafter approve a request for temporary use of the conveyance system for up to forty-five days. Permission to use the conveyance system due to an emergency for more than forty-five days may only be granted by the Board of Directors. Prior to approval of temporary use, the General Manager shall review and consider all of the factors described in Section 5.70.040(A). An agreement shall be required, and shall provide for the District to receive fair compensation for the temporary use, including the elements set forth in Section 5.70.040(B). Regulatory approvals required for the temporary use shall be the responsibility of the party requesting the right to use the conveyance system. (Res. 99-2 Exh. A (part))
***

Water Management Plan
APPENDIX D
Reclamation Approval Letter

THIS PAGE INTENTIONALLY LEFT BLANK


THIS PAGE INTENTIONALLY LEFT BLANK
Water Management Plan
APPENDIX E
Ordinance 15-01, Ordinance Establishing a Drought Management Program as Mandated by Executive Order B-29-15;
Resolution 16-12, the Board of Directors of Contra Costa Water District Adopting the
Urban Water Management Plan and the Water Shortage Contingency Plan
THIS PAGE INTENTIONALLY LEFT BLANK


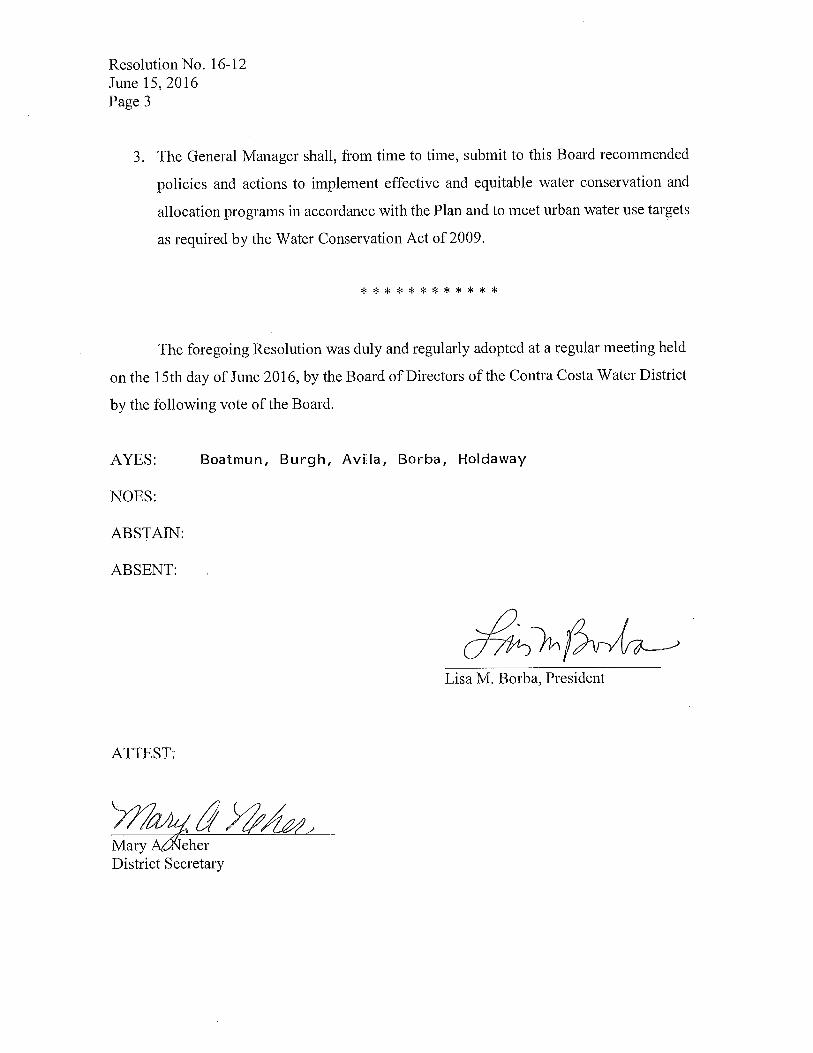

2015 Urban Water Management Plan
for the
Contra Costa Water District
June 2016

CONTRA COSTA WATER DISTRICT
URBAN WATER MANAGEMENT PLAN
June 2016
BOARD OF DIRECTORS Lisa M. Borba, President
John A. Burgh, Vice President Ernesto A. Avila Bette Boatmun
Connstance Holdaway
GENERAL MANAGER Jerry Brown
CONTRIBUTING STAFF
Kimberly Lin, Senior Engineer Chris Dundon, Water Conservation Supervisor
Maureen Martin, Senior Water Resources Specialist Celia Cheung, Rate and Financial Analyst
Desiree Castello, Director of Finance Jeff Quimby, Director of Planning
Cristina Estrella, Assistant Engineer
Contra Costa Water District 2015 Urban Water Management Plan
June 2016 i
Contents
1. EXECUTIVE SUMMARY ............................................................................................... 1-1
1.1. District Background ...................................................................................................... 1-1
1.2. Current and Future Water Demand ............................................................................... 1-3
1.3. Current and Planned Supplies ....................................................................................... 1-7
1.4. Water Supply Reliability Assessment ......................................................................... 1-13
1.5. Water Demand Management Measures ...................................................................... 1-17
1.6. Recycled Water Opportunities .................................................................................... 1-19
1.7. Senate Bill X7-7 .......................................................................................................... 1-21
1.8. Water Shortage Contingency Plan .............................................................................. 1-22
1.9. Report Contents .......................................................................................................... 1-23
2. PLAN PREPARATION .................................................................................................... 2-1
2.1 Basis for Preparing a Plan ............................................................................................. 2-1
2.2 Regional Planning ......................................................................................................... 2-3
2.3 Individual or Regional Planning and Compliance ........................................................ 2-3
2.4 Fiscal or Calendar Year and Units of Measure ............................................................. 2-4
2.5 Coordination and Outreach ........................................................................................... 2-4
3. SYSTEM DESCRIPTION ................................................................................................ 3-1
3.1. General Description ...................................................................................................... 3-1
3.2. Service Area Boundary Map ......................................................................................... 3-2
3.3. Service Area Climate .................................................................................................... 3-6
3.4. Service Area Population and Demographics ................................................................ 3-7
4. SYSTEM WATER USE .................................................................................................... 4-1
4.1. Recycled versus Potable and Raw Water Demand ....................................................... 4-1
4.2. Water Uses by Sector .................................................................................................... 4-1
4.3. Distribution System Water Losses ................................................................................ 4-7
4.4. Future Water Savings and Water Use for Lower Income Households ......................... 4-8
4.5. Climate Change ........................................................................................................... 4-10
Contra Costa Water District 2015 Urban Water Management Plan
June 2016 ii
5. SB X7-7 BASELINES AND TARGETS .......................................................................... 5-1
5.1. Determine Base Daily Per Capita Water Use ............................................................... 5-2
5.2. Determine 2020 Urban Water Use Target .................................................................... 5-7
5.3. Determine Interim 2015 Water Use Target .................................................................. 5-7
5.4. Compliance with 2015 Water Use Target ..................................................................... 5-8
5.5. Regional Alliance.......................................................................................................... 5-8
5.6. Measures, Programs, and Policies to Achieve SB X7-7 Water Use Reduction ........... 5-9
6. SYSTEM SUPPLIES ......................................................................................................... 6-1
6.1. Purchased or Imported Water ....................................................................................... 6-1
6.2. Groundwater ................................................................................................................. 6-1
6.3. Surface Water................................................................................................................ 6-2
6.4. Stormwater .................................................................................................................... 6-4
6.5. Wastewater and Recycled Water .................................................................................. 6-4
6.6. Desalinated Water Opportunities ................................................................................ 6-24
6.7. Exchanges or Transfers ............................................................................................... 6-25
6.8. Future Water Projects ................................................................................................. 6-28
6.9. Summary of Existing and Planned Sources of Water ................................................. 6-31
6.10. Climate Change Impacts to Supply............................................................................. 6-36
7. WATER SUPPLY RELIABILITY ASSESSMENT ....................................................... 7-1
7.1. Constraints on Water Sources ....................................................................................... 7-1
7.2. Reliability by Type of Year .......................................................................................... 7-4
7.3. Supply and Demand Assessment .................................................................................. 7-8
7.4. Regional Supply Reliability ........................................................................................ 7-11
8. WATER SHORTAGE CONTINGENCY PLANNING ................................................. 8-1
8.1. Stages of Action ............................................................................................................ 8-2
8.2. Prohibitions on End Uses .............................................................................................. 8-4
8.3. Penalties, Charges, Other Enforcement of Prohibitions ............................................... 8-7
8.4. Consumption Reduction Methods................................................................................. 8-8
8.5. Revenue and Expenditure Impacts.............................................................................. 8-15
8.6. Resolution or Ordinance ............................................................................................. 8-18

Contra Costa Water District 2015 Urban Water Management Plan
June 2016 iii
8.7. Catastrophic Supply Interruption ................................................................................ 8-19
8.8. Minimum Supply Next Three Years ........................................................................... 8-22
9. DEMAND MANAGEMENT MEASURES ..................................................................... 9-1
10. PLAN ADOPTION, SUBMITTAL, AND IMPLEMENTATION .......................... 10-1
10.1. Inclusion of All 2015 Data .......................................................................................... 10-2
10.2. Notice of Public Hearing ............................................................................................ 10-2
10.3. Public Hearing and Adoption...................................................................................... 10-4
10.4. Plan Submittal ............................................................................................................. 10-4
10.5. Public Availability ...................................................................................................... 10-4
10.6. Amending an Adopted UWMP ................................................................................... 10-5
11. REFERENCES ............................................................................................................. 11-1

Contra Costa Water District 2015 Urban Water Management Plan
June 2016 8-1
8. Water Shortage Contingency Planning
CWC 10632 (a) The plan shall provide an urban water shortage contingency analysis that includes each of the following elements that are within the authority of the urban water supplier: (1) Stages of action to be undertaken by the urban water supplier in response to water supply shortages, including up to a 50 percent reduction in water supply, and an outline of specific water supply conditions that are applicable to each stage. (2) An estimate of the minimum water supply available during each of the next three water years based on the driest three-year historic sequence for the agency's water supply. (3) Actions to be undertaken by the urban water supplier to prepare for, and implement during, a catastrophic interruption of water supplies including, but not limited to, a regional power outage, an earthquake, or other disaster. (4) Additional, mandatory prohibitions against specific water use practices during water shortages, including, but not limited to, prohibiting the use of potable water for street cleaning. (5) Consumption reduction methods in the most restrictive stages. Each urban water supplier may use any type of consumption reduction methods in its water shortage contingency analysis that would reduce water use, are appropriate for its area, and have the ability to achieve a water use reduction consistent with up to a 50 percent reduction in water supply. (6) Penalties or charges for excessive use, where applicable. (7) An analysis of the impacts of each of the actions and conditions described in paragraphs (1) to (6), inclusive, on the revenues and expenditures of the urban water supplier, and proposed measures to overcome those impacts, such as the development of reserves and rate adjustments. (8) A draft water shortage contingency resolution or ordinance. (9) A mechanism for determining actual reductions in water use pursuant to the urban water shortage contingency analysis. (b) Commencing with the urban water management plan update due July 1, 2016, for purposes of developing the water shortage contingency analysis pursuant to subdivision (a), the urban water supplier shall analyze and define water features that are artificially supplied with water, including ponds, lakes, waterfalls, and fountains, separately from swimming pools and spas, as defined in subdivision (a) of Section 115921 of the Health and Safety Code. Health and Safety Code Section 115921 As used in this article the following terms have the following meanings: (a) “Swimming pool” or “pool” means any structure intended for swimming or recreational bathing that contains water over 18 inches deep. “Swimming pool” includes in-ground and aboveground structures and includes, but is not limited to, hot tubs, spas, portable spas, and non-portable wading pools. This chapter contains CCWD's Water Shortage Contingency Plan (Shortage Plan) that addresses the water management practices required during a drought or other interruption of water supplies. The Shortage Plan helps CCWD consider impacts of short-term supply deficiency including financial hardship on both the community and CCWD, and deterioration of customer relations. CCWD uses shortage planning to anticipate drought conditions and to prepare for catastrophic interruptions in water supply.

Contra Costa Water District 2015 Urban Water Management Plan
June 2016 8-2
Water supply shortage is the difference between demand and the sum of the reduced CVP allocation and additional secure sources of supply. The District’s CVP allocation is defined in the CVP water service contract and the M&I Water Shortage Policy. The M&I Water Shortage Policy was developed by Reclamation to (1) define water shortage terms and conditions applicable to all CVP M&I contractors, as appropriate; (2) establish CVP water supply levels that would sustain urban areas during droughts, and during severe or continuing droughts would assist the M&I contractors in their efforts to protect public health and safety; and (3) provide information to M&I contractors for development of drought contingency plans. The current M&I Water Shortage Policy provides for a minimum shortage allocation of 75 percent of adjusted historical use until irrigation allocations fall below 25 percent. In addition, Reclamation will deliver CVP water to CCWD at not less than a public health and safety water supply level, provided CVP water is available, if the Governor declares an emergency due to water shortage or if an emergency exists due to water shortage. CCWD’s CVP allocation during a minimum public health and safety condition shall be sufficient to satisfy public health and safety requirements, which is estimated to be 60 percent of normal demand.
8.1. Stages of Action
This section discusses the projected supply shortfall as it is used to trigger the adoption of a stage appropriate to the severity of the water shortage. To manage a water supply shortfall condition, four demand reduction stages have been defined. The total demand reduction goal for each stage increases from less than 10 percent to up to 50 percent of normal demand from Stage I to Stage IV. Stages I and II involve voluntary customer demand reduction measures and Stages III and IV impose mandatory measures including allotments and temporary drought charges. The water supply reliability goal adopted in the FWSS is to meet 100 percent of demand in normal years, and at least 85 percent of demand during a drought condition in which persistent dry weather conditions leads to water-related problems such as water supply shortages. Stages I and II may be implemented in response to drought conditions to obtain up to a 20 percent reduction in demand. Stages III and IV are expected to be implemented in response to emergency regulations or a catastrophic interruption in supply such as an earthquake or other emergency. Table 8-1W and Table 8-1R summarize the four stages.

Contra Costa Water District 2015 Urban Water Management Plan
June 2016 8-3
Table 8-1W: Stages of Water Shortage Contingency Plan
Stage Complete Both Supply Reduction(b) Water Supply Condition
I Up to 10% CCWD’s total supply is
able to meet at least 90% of anticipated demands
II 10 – 20% CCWD’s total supply is
able to meet at least 80% of anticipated demands
III 20 – 40% CCWD’s total supply is
able to meet at least 60% of anticipated demands
IV 40 – 50% CCWD’s total supply is
able to meet at least 50% of anticipated demands
NOTES: (a) CCWD’s WSCP applies to both its retail and wholesale service areas. (b) “Supply reduction” refers to the percentage of overall demand reduction that would be required for the each stage.
Table 8-1R: Stages of Water Shortage Contingency Plan
Stage Complete Both
Percent Supply Reduction(b) Water Supply Condition
I Up to 10% CCWD’s total supply is
able to meet at least 90% of anticipated demands
II 10 – 20% CCWD’s total supply is
able to meet at least 80% of anticipated demands
III 20 – 40% CCWD’s total supply is
able to meet at least 60% of anticipated demands
IV 40 – 50% CCWD’s total supply is
able to meet at least 50% of anticipated demands
NOTES: (a) CCWD’s WSCP applies to both its retail and wholesale service areas. (b) “Percent supply reduction” refers to the percentage of overall demand reduction that would be required for the each stage.

Contra Costa Water District 2015 Urban Water Management Plan
June 2016 8-4
A water reduction stage is implemented if a water supply shortfall is forecasted for the upcoming year. The estimate of the supply shortfall is only a rough guess, even as late in the water year as March. Although criteria are described in CCWD’s water supply contract to determine CCWD’s water allotment, these criteria define CCWD’s water supply allotment relative to a historical use. Historical use is defined by the M&I Water Shortage Policy as the average quantity of CVP water put to beneficial use within the service area during the last three years of water deliveries, unconstrained by the availability of CVP water. The M&I Water Shortage Policy also recognizes that certain circumstances may require adjustment of the historical use such as growth, extraordinary water conservation measures, or use of non-CVP water supplies. The level of supply shortfall is expressed as a percent of the normally occurring demand that would need to be reduced to meet the available supplies. Available supplies include CVP, ECCID, and other dry-year purchases. This percent reduction is matched to the total reduction goal shown in Table 8-1W and Table 8-1R to select the appropriate stage. Additional factors to be considered in implementing a water reduction stage include the following:
• Time and circumstances permitting, the stages should be stepped through without skipping stages. This avoids drastic and sometimes unnecessary actions that may cause problems for CCWD including loss of customer confidence, financial shortfall, and difficulties implementing the emergency water reduction program.
• Customer response to the current stage may either require CCWD to implement the next stage or remain at a current stage. The stages allow CCWD to note the customer’s response to less severe stages before implementing the stricter stages.
• Predictions of demand and supply are not always accurate. To help determine if the water reduction program is achieving expected results, demands should be monitored no more often than monthly during Stage I, weekly during Stage II, and daily during Stages III and IV.
Again, the estimate of the water supply shortage is rough and a contingency should be made to err on the side of achieving a more than adequate water reduction level.
8.2. Prohibitions on End Uses
This section describes CCWD’s policies and prohibitions against specific water use practices during water shortages. 8.2.1.1. Ongoing Water Waste Prohibitions Board Resolution No. 93-23 - Water Waste Prohibitions within the Area Served by the District includes prohibitions on wasteful water uses such as prohibiting the use of potable water for street cleaning, washing paved or hard-surfaced areas, using single pass cooling systems in new connections, and failure to repair a controllable leak of water. A general policy regarding the practice of waste is also included in CCWD Code of Regulations Section 5.44.010. A summary of Board Resolutions and a list of CCWD Regulations regarding water waste are provided in Appendix F.

Contra Costa Water District 2015 Urban Water Management Plan
June 2016 8-5
Specific prohibited uses of District-furnished water, including one enacted during the 2015 Drought Management Program, are summarized in Table 8-2R below.
Table 8-2R: Restrictions and Prohibitions on End Uses
Stage Restrictions and
Prohibitions on End Uses
Additional Explanation or Reference
Penalty, Charge, or
Other Enforce-ment?
I, II Landscape - Restrict or prohibit runoff from landscape irrigation
No watering of outdoor landscapes in a manner that causes excessive runoff such that water flows onto adjacent property, non-irrigated area, private and public walkways, roadways, parking lots, or structures
No
I, II Landscape - Limit landscape irrigation to specific times
No watering of outdoor landscapes during the daylight hours of 9 am - 5 pm No
I, II Other - Require automatic shut of hoses
No washing of a vehicle, trailer, or boat using a hose without a shutoff nozzle No
III, IV Landscape - Restrict or prohibit runoff from landscape irrigation
No watering of outdoor landscapes in a manner that causes excessive runoff such that water flows onto adjacent property, non-irrigated area, private and public walkways, roadways, parking lots, or structures
Yes
III, IV Landscape - Limit landscape irrigation to specific times
No watering of outdoor landscapes during the daylight hours of 9 am - 5 pm Yes
III, IV Landscape - Limit landscape irrigation to specific days
No watering of outdoor landscapes more than two days per week Yes
III, IV Landscape - Prohibit certain types of landscape irrigation
No watering of ornamental turf on public street medians Yes
II, III, IV
Landscape - Other landscape restriction or prohibition
No watering of outdoor landscapes during and up to 48 hours after measurable rainfall (No penalty for Stage II)
Yes

Contra Costa Water District 2015 Urban Water Management Plan
June 2016 8-6
Table 8-2R: Restrictions and Prohibitions on End Uses
Stage Restrictions and
Prohibitions on End Uses
Additional Explanation or Reference
Penalty, Charge, or
Other Enforce-ment?
II, III, IV
Landscape - Other landscape restriction or prohibition
No watering of landscape of newly constructed homes and buildings in a manner inconsistent with regulations or other requirements established by the California Building Standards Commission and the Department of Housing and Community Development (No penalty for Stage II)
Yes
II, III, IV
CII - Lodging establishment must offer opt out of linen service
Operators of hotels and motels shall provide guests with the option of choosing not to have towel and linens laundered daily. A notice shall be prominently displayed in each bathroom (No penalty for Stage II)
Yes
II, III, IV
CII - Restaurants may only serve water upon request
Serving of drinking water other than upon request in eating or drinking establishments, including but not limited to restaurants, hotels, cafes, cafeterias, bars, or other public places where food or drink are served and/or purchased (No penalty for Stage II)
Yes
I, II, III, IV
CII - Other CII restriction or prohibition
Prohibit the use of non-recirculating systems in all new conveyer car wash and commercial laundry systems.
No
I, II, III, IV
Water Features - Restrict water use for decorative water features, such as fountains
Prohibit the use of decorative fountains, or filling decorative lakes or ponds (No penalty for Stages I and II.)
Yes
III, IV Other - Require automatic shut of hoses
No washing of a vehicle, trailer, or boat using a hose without a shutoff nozzle Yes
I, II, III, IV
Other - Prohibit use of potable water for construction and dust control
Recycled water must be used for construction and dust control unless not available (No penalty for Stages I and II.)
Yes
I, II, III, IV
Other - Prohibit use of potable water for washing hard surfaces
Prohibit washing paved or other hard-surfaced areas, including sidewalks, walkways, driveways, patios, and parking areas (No penalty for Stages I and II)
Yes

Contra Costa Water District 2015 Urban Water Management Plan
June 2016 8-7
Table 8-2R: Restrictions and Prohibitions on End Uses
Stage Restrictions and
Prohibitions on End Uses
Additional Explanation or Reference
Penalty, Charge, or
Other Enforce-ment?
III, IV Other Prohibit irrigation through any new connection to the Contra Costa Canal and Laterals system
Yes
I, II, III, IV Other
Prohibit flushing sewers or hydrants, testing fire systems or washing streets, except when deemed necessary by the District for emergencies, essential operations, or for public health and safety purposes (No penalty for Stages I and II.)
Yes
I, II, III, IV
Other
Prohibit the use of single pass cooling systems in new connections No
I, II, III, IV
Other
Failure to repair a controllable leak of water is prohibited. No
IV Other Prohibit new water service connections Yes
8.3. Penalties, Charges, Other Enforcement of Prohibitions Excessive Use Penalties
To encourage efficient water use and/or to penalize excessive water use, the District may consider using excess use charges or temporary drought charges. The amount of these charges may vary depending on the severity of the drought. In the 2009 Drought Management Program, CCWD charged 4 times the unit price for water use in excess of the customer’s historical use or 1,000 gallons per day (whichever is greater). In the 2015 Drought Management Program, the District instituted a temporary drought charge for all water use greater than 200 gallons per day.
Enforcement of Prohibitions
After the publication of any ordinance, or other restrictions or prohibitions on water use contained in the District Code of Regulations, administrative fines or penalties may be imposed consistent with the authority provided in the California Government Code section 53069.4, or by additional authority approved by the Governor pursuant to the California Emergency Services Act or Executive Order, or by action of the California Legislature. The purpose of the administrative fines and penalties is to assure compliance by customers by creating a meaningful disincentive to commit future violations of the rules or regulations. Violations are subject to administrative fines and penalties until the ordinance has been repealed, or the declared statewide emergency has ended.

Contra Costa Water District 2015 Urban Water Management Plan
June 2016 8-8
8.4. Consumption Reduction Methods
Consumption reduction methods are actions taken by CCWD to reduce water demand within its service area, whereas prohibitions, addressed in Section 8.2, limit specific uses of water. A summary of the consumption reduction methods that may be utilized by CCWD during a water shortage emergency are summarized in Table 8-3R.
Table 8-3R: Stages of WSCP – Consumption Reduction Methods
Stage Consumption Reduction Methods by Water Supplier
Additional Explanation or Reference
All stages Expand Public Information Campaign
All stages Offer Water Use Surveys or assistance
All stages Provide Plumbing Fixtures and Devices
All stages Provide Rebates for Landscape Irrigation Efficiency
All stages Provide Rebates for Turf Replacement
III, IV Decrease Line Flushing III, IV Increase Water Waste Patrols
IV Moratorium or Net Zero Demand Increase on New Connections
II, III, IV Implement or Modify Drought Rate Structure or Surcharge
All stages Other Implement percentage reduction goal set by customer type
III, IV Other
Implement the use of flow restriction devices for customers that have repeated water use prohibition violations
IV Other Implement allotment by customer type (see sections below)
Water Allotment Methods
This section presents suggested water allotment methods for each customer type. A key element of this step is involvement of the public in order to create a program that the community understands, contributes to, and supports. Water allotments are not required for Stage I since it is voluntary. Stage II may require the use of allotments depending on the overall reduction goal, and Stages III and IV will require water allotments.

Contra Costa Water District 2015 Urban Water Management Plan
June 2016 8-9
The allotment methods discussed here, except the flat allocation, use “base-year consumption” for each user to calculate each customer’s water allotment. The base-year consumption is an estimate of a customer’s normal, non-drought water consumption for each billing period. Previous years’ consumption may not reflect current demand because of previous drought and economic conditions; therefore, base-year consumption may be determined using the water use from the prior year or an average water use from several years prior. The more accurate the base-year consumption is, the more equitable the drought water allotments will be.
Single Family and Multi-Family Residential Accounts
The three allocation methods to be considered to achieve a 10 to 50 percent mandatory reduction are:
• Percent reduction • Flat allocation • Hybrid flat allocation/percent reduction

Contra Costa Water District 2015 Urban Water Management Plan
June 2016 8-10
The following Figure 8-1 provides a summary of the advantages and disadvantages of the three allocation method options for single and multi-family residential customers.
Figure 8-1: Allotment Method Options for Single-Family and Multi-Family Residential Accounts
Allotment Method Advantages Disadvantages
Percent Reduction
• Easy to determine and administer
• Penalizes conservers and rewards water wasters
• May not provide health and safety requirements in
extreme shortages • Undermines water conservation efforts and
encourages water wasting during non-shortage periods • Base bi-monthly
consumption must be determined for each
customer • Choosing base year is
especially difficult after multiple drought years
Flat Allotment
• Easy to determine and administer
• Effective for periods of extreme shortage
(Stage IV) • Base-year
consumption for each customer is not needed
• Does not penalize conservers
• Not equitable for larger properties or families
• Does not recognize customer water use
characteristics

Contra Costa Water District 2015 Urban Water Management Plan
June 2016 8-11
Figure 8-1: Allotment Method Options for Single-Family and Multi-Family Residential Accounts
Allotment Method Advantages Disadvantages
Hybrid Percent Reduction/Flat
Allotment
• More equitable to customers than percent
reduction and flat allotment as it only reduces non-health
and safety water use • Flexible – suitable for
all stages • Provides customers
greatest control • May minimize customer complaints
and appeals
• More complicated to develop and program into
billing system than the simple percent reduction.
• More complicated to explain to customers
• Base bi-monthly consumption must be determined for each
customer
8.4.2.1. Percent Reduction The allocation is calculated by reducing the user’s base-year water use for each billing period by a specific percentage. The percentage reduction is the same for all the users within the customer class. Advantages of this method include the ease of its administration and understanding and its effectiveness in reducing water use in a water crisis (Stage IV). The method has several disadvantages, including the potential to penalize conservers. The percent reduction can also undermine the District’s water conservation efforts by encouraging customers to waste water during non-drought times in order to have a higher base-year. In addition, it is difficult to determine a base year after multiple drought years. Because this method has the potential to penalize conservers and benefit inefficient water users, it may be an inequitable method for the residential user class. 8.4.2.2. Flat Allocation The flat allocation method provides the same allotment of water to all residential customers, regardless of past water use. The advantages are that it is simple to understand and administer, and it ensures that health and safety requirements are met. Also, base-year water use for each customer is not required. This method may be appropriate for late Stage III and for Stage IV drought plans because it evenly allocates the minimal amount of water available to all of the users. The major disadvantage of the flat allocation method is that it can abruptly impose severe reductions on households with four or more people and/or homes with substantial landscaping while residences with three or fewer people and/or homes with small landscapes are relatively unaffected. This inequity causes public complaints that can potentially overburden District staff. This method may not be appropriate for late Stage II or early Stage III plans because of the inappropriately severe reductions imposed on a substantial portion of the user class.

Contra Costa Water District 2015 Urban Water Management Plan
June 2016 8-12
8.4.2.3. Hybrid Flat Allotment/Percent Reduction The “hybrid” method provides health and safety water equally for all customers and then reduces non-essential water on a fixed or sliding scale. Customers who historically use very high amounts of water would be asked to reduce more than those that use less historically. Advantages of the hybrid method are that it provides health and safety water to all customers and appears to be the most equitable between large and small water users. The major disadvantage of the hybrid method is that it is difficult to explain to customers and is more difficult to program into the water billing system.
Dedicated Irrigation Accounts
The customer classes that exclusively use water for irrigation are the treated water Residential, Commercial and Public Authority dedicated irrigation accounts, and the untreated water metered and un-metered irrigation accounts. For the metered accounts, the two water allocation method options that may be considered for the irrigation user classes are:
• Percent Reduction
• Water Budget Based Allocation
8.4.3.1. Percent Reduction A water allocation is calculated by reducing the user’s base-year water use, for each billing period, by a specific percentage. The percentage reduction is the same for all the customers in this customer class. The advantages stem from its simplicity: the method is easy to administer and understand. The major disadvantage of the percent reduction is it penalizes conservers and benefits water wasters. The percent reduction can undermine the District’s water conservation efforts by encouraging customers to waste water during non-drought times. Properties that historically manage their landscape water efficiently are unable to maintain their landscapes without damage, whereas historically wasteful customers will reduce and have little impact to their landscape quality. 8.4.3.2. Water Budget Based Allocation Accounts with dedicated irrigation meters are provided individual water allocations that are determined by a calculation using the property’s landscape acreage and local historical weather data. The weather data comes from the California Irrigation Management Information System (CIMIS) weather data service, and the landscape acreage information comes from the District’s existing Landscape Water Budget Conservation Program. By utilizing this existing information, the District can develop site-specific allocations for each account. The primary advantage of this method is that it is equitable between all properties. This method is fair to those properties that have historically managed their water efficiently. Sites that have historically wasted water will be required to reduce more to stay within their allocation. The disadvantage of this method is it is more difficult to explain to customers. However, many landscape professionals prefer this method as it is more equitable.

Contra Costa Water District 2015 Urban Water Management Plan
June 2016 8-13
Flat Rate Irrigation Accounts
During Stage II, flat rate irrigation accounts could be required to cut a specific percentage or be required to water only on specific days of the week. Alternatively, for Stage III and IV all flat rate irrigation services could be suspended.
Commercial Accounts
Commercial businesses are a significant source of jobs and revenue for Contra Costa County. Therefore, the required reductions for commercial accounts are less than for residential and landscape accounts to minimize impacts to the local economy. However, some reduction is required under each stage. The commercial customer class covers a variety of water users. The users vary from laundries and linen supplies to restaurants and health care facilities, and from car washes to hotels and retail stores. Each user has significantly different quantities and uses of water. Therefore, because of this large variation, the percent reduction appears to be the most viable water allocation method. In addition to the percent reduction, commercial customers can be required to demonstrate they are using water efficiently before they are allowed an increase to their allotment. Older commercial properties often have landscape water that is supplied by the same water meter as the building. Reducing this landscape water would not pose a hardship on their business. Therefore, including day of the week watering restrictions is one way to get additional savings out of the commercial sector, without affecting business. Every effort must be made by CCWD to help the various businesses reduce their water use and minimize economic hardship. There exists an essential water use for each business that, when not met, creates undue economic hardship for that business. CCWD must attempt to assess a business’s essential water use when reviewing an appeal. In a Stage III response, a business’s essential water use may be considered as similar to the health and safety requirement for residential users. However, in a Stage IV (water crisis), a business’s essential water use is secondary to the residential health and safety requirement. Educational materials are available from the State Department of Water Resources for the Commercial Service customers to help them reduce their water use. There are also private sector companies that support commercial businesses in their efforts to conserve. Note that, to appeal for more water, the business must show proof of an attempt to reduce their water use before their appeal can be considered. This may be effective in eliminating the number of “casual” appeals and ensuring that an effort has been made to reduce water use.
Industrial Accounts
Industries account for approximately one-third of CCWD’s total water use. The vast majority of industrial water use is for process. The industries served by CCWD are a significant source of jobs and revenue for Contra Costa County and the State of California. Driven by the incentives to reduce costs and the risks of production losses, some industries have aggressively pursued water use efficiency practices for over twenty years. As a result, significant water conservation has been achieved and further water reduction may be more difficult and much more expensive. A Stage II

Contra Costa Water District 2015 Urban Water Management Plan
June 2016 8-14
reduction (10 to 20 percent overall) may be achievable by applying a 0 to 5 percent reduction to the industrial users and imposing larger reductions on other user classes. However, overall reductions for Stage III and IV (20 to 50 percent) may require industries to reduce use by more than 10 percent and risk production shutdown. A percent allocation calculated on a case-by-case basis may be the most equitable allocation method and is feasible because of the small number of industrial customers. As an option to installing costly additional conservation upgrades or loss of production, industries may be charged a fee to help reduce water use in other user classes. This “reliability fee” may be used by CCWD to implement conservation programs and other drought actions. An effective program would set each fee sufficient to reduce water use in other classes by the amount allocated to a given industrial customer.
Public Authority
The Public Authority user class includes schools and public and government buildings. The percent reduction allocation method is the only method considered here because of the customers’ varied water uses.
Municipal
CCWD provides untreated and treated water to six municipal customers. The percent reduction method is the only method considered here because of the varied water uses within the municipal customers’ service areas. Each municipal customer has its own shortage plan and will determine how the overall supply shortage is to be accommodated by its various customer classes.
Agricultural
The agricultural user class could be dealt with in two ways: their allocation could be in proportion to the CVP Agricultural Water allocation (which is likely to considerably less than the M&I level) or they can be treated as any other customer class. It is proposed that this class be allocated water in the same proportion as municipal customers. Overall agricultural water use within CCWD is small (typically less than 100 AFY) and would mean only a minor change in allocations to others.
Water Allotment Appeals
A committee is formed to assess, approve, or deny appeals to water allotments provided under the District’s Drought Management Program. The allotment appeal process that was distributed to all customers during the 2015 Drought Management Program included four acceptable reasons for variance:
• Medical requirements • Health and safety • Number of household members increased from base years • Any irrigation/landscape circumstance changes from base years
CCWD provides wholesale untreated and treated water to six municipal customers. As described in Section 8.4.8, CCWD would implement the percent reduction method on the municipal

Contra Costa Water District 2015 Urban Water Management Plan
June 2016 8-15
customers’ total water use and provide the flexibility for the municipal customer to determine how best to reduce consumption in their service areas. Each of CCWD’s municipal customers is required to prepare its own water shortage contingency plan, which describes how the overall water supply shortage would be accommodated by each of its customer classes. Determining Water Shortage Reductions CWC 10632 (a)(9) A mechanism for determining actual reductions in water use pursuant to the urban water shortage contingency analysis. Demands must be monitored frequently during emergency water shortages to enable CCWD to effectively manage the balance between supply and demand. In general, CCWD will use production and pumping records to determine if reduction goals are being met. In normal water supply conditions, production and pumping amounts are recorded daily and monthly totals are reported to the Finance Department. During a Stage I or II water shortage, weekly production and pumping amounts are forwarded to the Finance Department. The Finance Department compares the weekly data to the reduction targets to verify that the goal is being met. In addition, monthly reports are provided to CCWD’s Board of Directors. If reduction goals are not met, the General Manager will notify the Board so that corrective action can be taken. During a Stage III or IV water shortage, the same procedure will be followed; if deemed necessary, a daily production and pumping report will be provided to the Director of Finance.
8.5. Revenue and Expenditure Impacts
This section describes the potential impacts to CCWD’s revenue resulting from implementation of temporary consumption reduction actions and measures to overcome those impacts. Normalized water sales, unaffected by drought and economic impacts, are used as an example of a normal revenue pattern. Figure 8-2 shows the normal untreated and treated water use levels and the reduced levels associated with each stage (assuming a given stage is in effect for one year).
Figure 8-2: Example Water Sales by Stage
Water Sales(a) (AFY)
Current Use
Stage 1 Up to 10%
Stage II 10-20%
Stage III 20-40%
Stage IV 40-50%
Maximum Reduction
50%
Untreated Water 86,100 77,490 68,880 60,270 51,660 43,050 Treated Water 36,700 33,030 29,360 25,690 22,020 18,350
Total 122,800 110,520 98,240 85,960 73,680 61,400 NOTES: (a) Water sales are estimated based on current normalized water sales, not affected by drought water shortages or economic impacts. Totals do not include deliveries from other sources, such as groundwater or customers’ own surface water supplies.

Contra Costa Water District 2015 Urban Water Management Plan
June 2016 8-16
To estimate the impact of each stage on revenues, current commodity rates and charges (as of March 2016) are applied to the water use levels in Figure 8-2. These revenue reductions are combined with estimated increased expenses resulting from managing the supply shortfall to derive the net revenue shortfalls shown in Figure 8-3. To simplify the analysis, only CCWD’s revenue most sensitive to variation in annual water use and expenses significantly altered by the managing of a water shortage is included in the tables. The net change from the “normal” water supply condition is identified for the revenue and expense items and represents the total estimated revenue impact.

Contra Costa Water District 2015 Urban Water Management Plan
June 2016 8-17
Figure 8-3: Example Revenue Impact of Reduced Customer Sales
Revenue/Expenses
2016 Revenue (x1,000)
Stage I 5% (a)
(x1,000)
Stage II 15%(a)
(x1,000)
Stage III 25%(a)
(x1,000)
Stage IV 40%(a)
(x1,000)
Max. Reduction
50%(a) (x1,000)
Revenue Impacted by Shortage Treated Water Variable(b) $60,700 $54,600 $48,600 $42,500 $36,400 $30,300
Untreated Water Variable(b) $57,600 $51,800 $46,100 $40,300 $34,500 $28,800 TW Facilities Reserve
Charge(c) $4,340 $4,340 $4,340 $4,340 $- $-
Subtotal $122,640 $110,740 $99,040 $87,140 $70,900 $59,100 Net Revenue Change $- ($11,900) ($23,600) ($35,500) ($51,740) ($63,540)
Operating Expenses Extra Administrative(d) $400 $400 $400 $400 CVP Supply Costs(e) $- ($730) ($1,450) ($2,180) ($2,900) ($3,630)
Net Expense Change $- ($730) ($1,050) ($1,780) ($2,500) ($3,230) Estimated Surplus or
(Deficiency) $- ($11,170) ($22,550) ($33,720) ($49,240) ($60,310)
NOTES: (a) The overall reduction goal is shown for each stage, however, these reductions may differ from the projected reductions for specific customer classes. (b) Based on treated and untreated water rates effective March 2016 and a weighted average of the treated water energy zone surcharge. (c) Revenue from the treated water facilities reserve charge is not expected to be affected by a shortage unless a new connection moratorium is imposed under extreme shortage conditions (Stage IV). (d) Stages II, III, and IV costs reflect hiring the equivalent of four temporary staff and increased costs to administer and implement a customer communication effort. (e) Cost savings for supply computed as the variable cost of CVP water ($59.13/AF), effective March 2016, multiplied by the difference between the normal year sales and the shortage condition sales.

Contra Costa Water District 2015 Urban Water Management Plan
June 2016 8-18
CCWD updates its Ten-Year Capital Improvement Program (CIP) annually based on historical and projected revenue and expenditures. The CIP provides a comprehensive view of the asset investments required over the next ten years to ensure adequate water resources, maintain high quality water, and meet the service needs of present and future customers. The CIP allows CCWD to prioritize its investments, manage cash flows, and project revenue requirements and long-term rate impacts to fund the proposed projects and anticipated operating costs. The revenue sources available to CCWD include water sales, system connection fees, interest income, property taxes, applicant funds, reserves, and other non-operating revenues including new funds from regional partnerships and various grants. CCWD’s annual CIP update provides the means to address the revenue impacts of reduced customer sales resulting from drought. Actions that may be taken in the CIP include use of reserves, reductions or deferrals in capital expenditures, and rate adjustments. The District maintains a specific reserve fund (Drought Relief Fund) to help mitigate the revenue impacts of a prolonged drought. There may be additional outside funding sources made available to water agencies under a water emergency situation (Stage IV). During drought conditions variable water production costs may be lower, including water purchases and energy costs due to limited water supplies available for purchase. These lower variable costs partially offset reduced water sales revenues. Additionally, the District may enact a drought surcharge or temporary drought charge that would provide additional revenue to offset some of the lost revenue from reduced water sales. The District’s 2015 Drought Management Program, as established under Ordinance 15-01, included the implementation of a Temporary Conservation Pricing increase of $0.50 per unit (748 gallons) in the treated water quantity charge, and of $0.25 per 1,000 gallons in the untreated water quantity charge. The intent of the pricing adjustment was first, to encourage conservation, and second, to recover up to half of the lost revenue from reduced sales. More information on the District’s demand management measures is included in Chapter 9.
8.6. Resolution or Ordinance
In order to adopt a water shortage contingency ordinance, CCWD will first develop an Emergency Water Reduction Plan outline that will be presented to the Board for their conceptual approval at least one month before it may need to be adopted. Staff requires time to prepare for special procedures and the customer service and billing personnel will make program modifications to the billing system. CCWD’s Board of Directors will be kept well informed of the shortage status to enable them to make timely and appropriate decisions on the following actions:
1. Declaration of water shortage emergency 2. Adoption of Emergency Water Reduction Plan 3. Frequent assessment of water shortage status 4. Adoption of resolutions to change stage as necessary 5. Coordination with municipal and industrial customers on the development and
implementation of the plan

Contra Costa Water District 2015 Urban Water Management Plan
June 2016 8-19
Water shortage resolutions have been adopted by CCWD’s Board of Directors in response to past drought events, including the 1987-1992 and 2007-2009 droughts. Additionally, an ordinance (15-01) establishing the 2015 Drought Management Program was adopted by the Board of Directors in response to the 2014-2015 drought. A list of drought and water shortage-related resolutions and ordinances adopted by CCWD’s Board is included in Appendix F. Ordinance 15-01, which is provided in Appendix F is an example of a water shortage contingency resolution or ordinance that the District may adopt in response to a future water shortage.
8.7. Catastrophic Supply Interruption
Catastrophic supply interruptions differ from the staged drought responses addressed earlier n this chapter in that catastrophic interruptions occur suddenly and can immediately jeopardize a large portion of CCWD’s water supply. CCWD is prepared to address major water shortage emergencies in several ways. Emergency response procedures are described in the Emergency Operations Plan (EOP). In addition, the Seismic Reliability and Improvement and Los Vaqueros Projects have been implemented to minimize damage and service interruptions resulting from a regional power outage, earthquakes, or other disaster that results in disruptions to CCWD’s supplies. Figure 8-4 below summarizes the actions CCWD has taken to prepare for catastrophic supply interruption. The sections following the table further describe the options available to the District during an emergency.

Contra Costa Water District 2015 Urban Water Management Plan
June 2016 8-20
Figure 8-4 : Preparation Actions for a Catastrophe Examples of Actions Source
Determine what constitutes a proclamation of a water shortage emergency. UWMP
Stretch existing water storage. UWMP Obtain additional water supplies. UWMP, FWSS
Develop alternative water supplies. FWSS Determine where the funding will come from. Budget, CIP Contact and coordinate with other agencies. EOP
Create an Emergency Response Team/Coordinator. EOP Create a catastrophe preparedness plan. EOP
Put employees/contractors on-call. EOP Develop methods to communicate with the public. EOP
Develop methods to prepare for water quality interruptions. EOP, LVP, LVE Increase seismic reliability of conveyance and distribution
systems SRIP, CIP
Increase emergency storage LVP, TWMP, LVE NOTES: Acronyms used in this table: UWMP - CCWD Urban Water Management Plan FWSS - CCWD Future Water Supply Study CIP - CCWD Ten Year Capital Improvement Program EOP - CCWD Emergency Operations Plan SRIP – Seismic Reliability Improvement Project LVP – Los Vaqueros Project TWMP – Treated Water Master Plan LVE – Los Vaqueros Expansion Project
Emergency Operations Plan (EOP)
In order to protect the public welfare in the event of an emergency, it is essential that the District respond in an expeditious and coordinated manner. CCWD's EOP provides a framework for directing District-wide responses to a broad scope of emergency situations associated with natural disasters, power outages, or other disasters. It supplements existing operational plans and emergency procedures and reflects CCWD's emergency operations policy. CCWD coordinates with Contra Costa County, its political subdivisions, and other water districts and utilities within the State to plan for the effective mobilization and utilization of available resources during disasters. During emergencies, CCWD may request mutual aid response through the State Office of Emergency Services. Upon request by the County, State, or other public authority, and when feasible, CCWD may provide personnel, supplies, and equipment resources to other agencies. CCWD is also a member of the California Water/Wastewater Agency Response Network (CalWARN) which was established to support and promote statewide emergency preparedness, disaster response, and mutual assistance processes for public and private water and wastewater utilities.

Contra Costa Water District 2015 Urban Water Management Plan
June 2016 8-21
Seismic Reliability and Improvement Project
In 1997, CCWD completed a Seismic Reliability and Improvements Study of the reliability and capacity of its water distribution facilities. As a result of the study, CCWD has completed three major capital projects that improve the capacity and reliability of the untreated water system to meet future demands, as well as to meet potential fire flow needs following a major earthquake or other disaster. These projects are: Raw Water Seismic Improvement Project, which reinforced seven areas of seismic vulnerability along the Contra Costa Canal; the Mallard Slough Pump Station project, which replaced the existing 65-year-old Mallard Slough intake at Bay Point; and the MPP, which is a 21-mile long pipeline to supplement the capacity of the Contra Costa Canal. Additionally, CCWD has implemented projects that improve the reliability of its treated water system, including the Fault Crossings Connections project, which installed connections at three locations where large treated water transmission pipelines cross the Concord fault; the Emergency Generators project, which provided six permanent and two portable backup generators at critical pump stations in CCWD’s treated water distribution system; and the Seismic Isolation Valves project, which installed five isolation valves at key treated water reservoirs. The MPP conveys treated water from the Randall-Bold Water Treatment Plant in Oakley to CCWD's existing water distribution system in Concord, near the Bollman Water Treatment Plant. Under normal operations, the MPP delivers treated water from east to west, to the District's treated water customers. In an emergency, the MPP could also carry water in the reverse direction (from west to east), transporting treated water eastward from the Bollman Water Treatment Plant to customers in eastern Contra Costa County. The MPP also has several emergency connections to the Canal. If the Canal is damaged during an earthquake or requires maintenance, water could be diverted from the MPP to the Canal around damaged or closed sections using the emergency connections. The MPP serves multiple purposes and greatly improves the existing Canal system reliability for delivery during emergencies.
Los Vaqueros Reservoir
CCWD’s Los Vaqueros Reservoir provides 160,000 AF of off-stream storage to improve water quality and to provide emergency storage for customers of CCWD. A large portion of the reservoir is reserved for emergency purposes. The reservoir provides up to 70,000 AF of emergency supply in wet years and up to 44,000 AF in dry years. The Los Vaqueros Reservoir provides a minimum of 3 to 6 months of emergency storage that may be utilized during a catastrophic interruption of CCWD’s Delta supplies. When full, the reservoir provides enough storage for approximately 14 to 28 months of normal use, if necessary.
Short-term Supplemental Supply Options
The FWSS and Implementation Plan were undertaken to strengthen the reliability of supplies for existing customers and to bridge the gap between water supplies and projected demands. The Implementation Plan includes the purchase of water transfers in incremental blocks to meet 100 percent of demand in normal years and at least 85 percent of demand in drought conditions. Additional short-term supplies may be required in response to an emergency or catastrophic interruption of the District’s supply. Potential supplemental supplies include spot market water

Contra Costa Water District 2015 Urban Water Management Plan
June 2016 8-22
transfers, increased use of groundwater, emergency desalination at Mallard Slough, and increased water recycling. The legal and time constraints, availability, costs, and relative amounts of water determine how and if the supplemental source would be pursued. Water transfers (through the State Water Bank), increased water recycling, and increased groundwater pumping were used in the drought of 1987 to 1992. CCWD purchased 6,717 AF and 10,000 AF from the State Water Bank in 1991 and 1992, respectively. During the summer of 1991, as a response to drought emergency, approximately 400 AF of recycled water was distributed to Shell and Tosco (now Tesoro) refineries for cooling tower water. A truck fill station was built to provide recycled water for construction uses. Since then, additional recycled water facilities have been constructed by DDSD and CCCSD for non-potable demands including industrial cooling and irrigation supplies. Utilization of the recycled water facilities could be maximized in response to an emergency. In response to recent drought conditions, CCWD implemented a dry-year water transfer with ECCID in 2007 to 2009 and in 2015. The current agreement between the two districts allows CCWD to purchase up to 4,000 AFY of groundwater via exchange when the CVP is in shortage situation. Groundwater resources in Contra Costa County are limited. Outside of the District, only Byron-Bethany Irrigation District, ECCID, and the City of Brentwood have the ability to produce significant amounts of groundwater (approximately 5,000 AF annually each). The potential to increase groundwater pumping in eastern Contra Costa County would be explored in the event of an emergency.
8.8. Minimum Supply Next Three Years
Per CWC Section 10632 (a)(2), this section provides an estimate of the minimum water supply available during each of the next three water years based on the driest three-year historic sequence for CCWD’s water supply. The District’s primary supply is CVP water obtained under contract with Reclamation. The M&I Water Shortage Policy defines the reliability of the District’s CVP supply and provides for a minimum shortage allocation of 75 percent of adjusted historical use until irrigation allocations fall below 25 percent. Under a scenario representing three consecutive dry years over the next three years, the District’s CVP supply is assumed to range from 50 to 75 percent of historical use. The District’s CVP allocation during minimum public health and safety conditions is estimated to be between 50 and 60 percent. The District’s agreement with ECCID provides up to 8,200 AFY (current demand is 6,000 AFY) for service in the areas common to both Districts. An additional 4,000 AFY is available in dry years through groundwater exchange. The District’s Mallard Slough and customer (Industrial and City of Antioch) supplies from the San Joaquin River are typically not available in dry years due to poor water quality.

Contra Costa Water District 2015 Urban Water Management Plan
June 2016 8-23
The District’s minimum supply during the next three years, assuming three consecutive dry years, is shown in Table 8-4W for wholesale and Table 8-4R for retail. CCWD’s retail area is assumed to be a customer in the wholesale area, and therefore receives the same supply reliability as the rest of CCWD’s wholesale customers.
Table 8-4W: Minimum Supply Next Three Years
2016 2017 2018 Available Water Supply (AFY) 120,500 122,400 124,300 NOTES: (a) Minimum supply availability assumptions are described in Section 8.9.
Table 8-4R: Minimum Supply Next Three Years
2016 2017 2018 Available Water Supply (AFY) 63,900 64,900 65,600 NOTES: (a) For UWMP reporting purposes, CCWD’s retail area is considered a customer to CCWD’s wholesale area and therefore receives the same supply reliability as the rest of CCWD’s wholesale customers. CCWD’s total minimum supply availability assumptions are described in Section 8.9.

Contra Costa Water District 2015 Urban Water Management Plan
June 2016
This page left intentionally blank.

Water Management Plan
APPENDIX F
Resolution No. 16-01, Water Waste Prohibition with the Area
Served by the District

THIS PAGE INTENTIONALLY LEFT BLANK


Water Management Plan
APPENDIX G
CCWD Annual Water Quality Report (2015)

THIS PAGE INTENTIONALLY LEFT BLANK

ANNUALWATER
QUALITYREPORT
YOUR DRINKING WATERIN 2015From the Contra Costa Water District,the Cities of Antioch, Martinez and Pittsburg, and Diablo Water District (Oakley)

TO OUR CUSTOMERS THE SOURCE OF YOUR WATER
THE STATE WATER RESOURCES CONTROL BOARD DIVISION OF DRINKING WATER WANTS YOU TO KNOW
There’s one thing everyone should be able to count on when turning on their faucet: a supply of high-quality drinking water. Even after years of drought, customers in Central and Eastern Contra Costa County can expect the water they need at a quality they deserve. Every year, we provide a report full of water quality data so you can see how our water quality compares to state and federal drinking water standards. We encourage you to read through this report to get a better understanding of your drinking water.
You can be confident your tap water is of a high quality. Frequent testing for water quality and regular improvements in the treatment process keeps your drinking water among the best in the country. This report includes water quality data collected throughout 2015 and answers questions you might have about your tap water. It reports on
the quality of tap water delivered by the Contra Costa Water District (CCWD), the cities of Antioch, Martinez and Pittsburg, and Diablo Water District (DWD) in Oakley.
Need more information about the tap water in your community? Please call:
CCWD: Calvin Liu, 925-688-8091City of Antioch: Lori Sarti, 925-779-7024City of Martinez: Hiren Patel, 925-372-3588City of Pittsburg: Ana Corti, 925-252-6916Diablo Water District (Oakley): Nacho Mendoza, 925-625-2112Golden State Water Company (Bay Point): 925-458-3112City of Brentwood: Eric Brennan, 925-516-6000
Your investments in infrastructure and water quality projects like the Middle River Intake have ensured high quality water from all sources of your drinking water. The primary source of water for 500,000 residents in central and eastern Contra Costa County is the Sacramento-San Joaquin Delta. Protecting the health of the Delta is pivotal to maintaining the water quality you’ve come to enjoy.
The Contra Costa Water District (CCWD) pumps Delta water from four locations: Rock Slough near Oakley, Old River near Discovery Bay, Middle River on Victoria Island, and Mallard Slough in Bay Point. CCWD’s major conveyance facilities are the Contra Costa Canal, the Los Vaqueros Pipeline and the Multi-Purpose Pipeline.
Clayton, Clyde, Concord, Pacheco, Port Costa, and parts of Pleasant Hill, Martinez and Walnut Creek: CCWD provides treated drinking water to homes and businesses. CCWD pumps water from the Delta, treats it in treatment plants and delivers it to customers through distribution pipelines.
Antioch: The City of Antioch purchases untreated water from CCWD, treats it in a city-owned treatment plant and delivers it to customers through the city’s distribution pipelines. In addition to the untreated water it buys from CCWD, the City of Antioch can pump directly from the San Joaquin River and buy treated water from CCWD.
Pittsburg: The City of Pittsburg purchases untreated water from CCWD, treats it in a city-owned treatment plant and delivers it to customers through the city’s distribution pipelines. In addition to the water it buys from CCWD, the City of Pittsburg can pump water from two wells.
Martinez (the portion of the city that does not receive treated water from CCWD): The City of Martinez purchases untreated water from CCWD, treats it in a city-owned treatment plant and delivers it to customers through the city’s distribution pipeline.
Diablo Water District (Oakley): DWD purchases untreated water from CCWD. Water is treated at a plant jointly owned by DWD and CCWD, and blended with groundwater pumped from two wells. Water is then delivered to customers through DWD’s distribution pipelines.
Bay Point: CCWD sells treated water to the Golden State Water Company. The water is delivered to customers through Bay Point distribution pipelines.
Brentwood: CCWD operates the City of Brentwood’s treatment plant to treat water for the City. For complete information about the City of Brentwood’s drinking water, visit www.brentwoodca.gov/gov/pw/water/reports.asp.
The sources of drinking water (both tap water and bottled water) include rivers, lakes, streams, ponds, reservoirs, springs and wells. As water travels over the surface of the land or through the ground, it dissolves naturally occurring minerals and, in some cases, radioactive material, and can pick up substances resulting from the presence of animals or from human activity. Contaminants that may be present in source water before it is treated include:Microbial contaminants, such as viruses and bacteria, which may come from sewage treatment plants, septic systems, agricultural livestock operations and wildlife.Inorganic contaminants, such as salts and metals, which can be naturally occurring or result from urban stormwater runoff, industrial or domestic wastewater discharges, oil and gas production, mining or farming.Pesticides and herbicides, which may come from a variety of sources, such as agriculture, urban stormwater runoff and residential uses.Organic chemical contaminants, including synthetic and volatile organic chemicals that are byproducts of industrial processes and can also come from gas stations, urban stormwater runoff, agricultural applications and septic systems.Radioactive contaminants, which can be naturally occurring or the result of oil and gas production and mining activities.
To ensure that tap water is safe to drink, the U.S. Environmental Protection Agency (EPA) and the State Water Resources Control Board Division of Drinking Water (DDW) prescribe regulations that limit the amount of certain contaminants in water provided by public water systems. State Board regulations also establish limits for contaminants in bottled water that must provide the same protection for public health.
Drinking water, including bottled water, may reasonably be expected to contain at least small amounts of some contaminants. The presence of contaminants does not necessarily indicate that water poses a health risk. The State Board allows us to monitor for certain contaminants less than once per year because the concentrations of these contaminants do not change frequently. Some of the data, though representative of the water quality, are more than one year old. More information about contaminants and potential health effects can be obtained by calling the USEPA’s Safe Drinking Water Hotline (1-800-426-4791).
Some people may be more vulnerable to contaminants in drinking water than the general population. Immuno-compromised persons such as persons with cancer undergoing chemotherapy, persons who have undergone organ transplants, people with HIV/AIDS or other immune system disorders, some elderly, and infants can be particularly at risk from infections. These people should seek advice about drinking water from their health care providers. USEPA/Centers for Disease Control (CDC) guidelines on appropriate means to lessen the risk of infection by Cryptosporidium and other microbial contaminants are available from the Safe Drinking Water Hotline (1-800-426-4791).
For more information about contaminants and potential health effects, or for EPA and CDC guidelines on ways to lessen the risk of infection, call the EPA Safe Drinking Water Hotline at:1-800-426-4791www.epa.gov/your-drinking-water
2015 CALENDAR YEARANNUAL WATER QUALITY REPORT1 2
CCWD Treated & Untreated Water Service Area
Water Treatment Plants1. City of Martinez2. CCWD’s Ralph D. Bollman Plant3. City of Pittsburg4. City of Antioch5. Randall-Bold
Bay Point Treated Water Connection
Multi-Purpose Pipeline
Los Vaqueros Pipeline
Victoria Canal Pipeline
Contra Costa Canal
12
34 5

LEADIf present, elevated levels of lead can cause serious health problems, especially for pregnant women and young children. None of the samples for any agency exceeded the Action Level. Lead in drinking water is primarily from materials and components associated with service lines and home plumbing. Your drinking water provider is responsible for providing high quality drinking water, but cannot control the variety of materials used in plumbing components. When your water has been sitting for several hours, you can minimize the potential for lead exposure by flushing your tap for 30 seconds to two minutes before using water for drinking or cooking. If you do so, you may wish to collect the flushed water and reuse it for another beneficial purpose, such as watering plants. If you are concerned about lead in your water, you may wish to have your water tested. Information on lead in drinking water, testing methods, and steps you can take to minimize exposure is available from the Safe Drinking Water Hotline at 800-426-4791 or https://www.epa.gov/your-drinking-water/basic-information-about-lead-drinking-water.
FLUORIDETo prevent tooth decay, fluoride is added to your drinking water. This is a long-standing practice that has improved public health over many years. The DDW is a good source of information about fluoridation. Information can be found at www.waterboards.ca.gov/drinking_water/certlic/drinkingwater/Fluoridation.shtml.
CRYPTOSPORIDIUMCryptosporidium is a microbial pathogen found in surface water throughout the United States. Although filtration removes Cryptosporidium, the most commonly-used filtration methods cannot guarantee 100-percent removal. Our monitoring indicates the presence of these organisms in untreated source water. Current test methods do not allow us to determine if the organisms are dead or if they are capable of causing disease. Ingestion of Cryptosporidium may cause cryptosporidiosis, an abdominal infection. Symptoms of infection include nausea, diarrhea, and abdominal cramps. Most healthy individuals can overcome the disease within a few weeks. However, immuno-compromised people, infants, small children and the elderly are at greater risk of developing life-threatening illness. We encourage immuno-compromised individuals to consult their doctors regarding appropriate precautions to take to avoid infection. Cryptosporidium must be ingested to cause disease, and it may be spread through means other than drinking water.
2015 CALENDAR YEARANNUAL WATER QUALITY REPORT3 4
THE SOURCE OF YOUR WATER (CONTINUED)
WATERSHED SANITARY SURVEYS
SOURCE WATER ASSESSMENTS
SOURCE WATER ASSESSMENTS (CONTINUED)
Sanitary surveys of the watershed that comes in contact with your water are conducted every three to five years. CCWD and the City of Antioch have both conducted sanitary surveys. CCWD updated its sanitary survey in 2007, 2010 and 2015. The City of Antioch updated its survey in 2007 and 2012. These surveys identified that the Delta water supply could be affected
by contamination from industrial and municipal wastewater discharges, urban runoff, highway
runoff, agricultural runoff, pesticides, grazing animals, concentrated
animal facilities, wild animals, mine runoff, recreational activities, traffic accidents/spills, saltwater intrusion, geologic hazards and solid and hazardous waste disposal facilities. The surveys concluded that potential contamination is
regularly mitigated by the natural flushing of the Delta, controls at the
contamination sources and existing water treatment practices.
Source water assessments are one-time studies conducted to determine how susceptible a water supply is to contamination. Assessment results are below.
Contra Costa Water DistrictIn June 2002 and May 2003, source water
assessments were conducted for the CCWD’s water sources. These sources include the Delta intakes on
Old River, Rock Slough and Mallard Slough, as well as the Los Vaqueros, Contra Loma, Mallard and Martinez
reservoirs and the Contra Costa Canal (sampled at Clyde). A source water assessment was also conducted for the
Middle River Intake in 2012.
The assessments were based on a review of data collected from 1996 through 2001, as well as a review of the activities and facilities located at or near each source.
In summary:• The District’s Delta sources were found to be most
vulnerable to the effects of saltwater intrusion, agricultural drainage, recreational boating and regulated point discharges.
• The District’s reservoirs were found to be most vulnerable to the effects of associated recreation, roads and parking lots, and watershed runoff.
• The Contra Costa Canal traverses rural, municipal and industrial areas. It was found to be most vulnerable to gas stations, chemical/petroleum processing/storage, septic systems, historic landfills and military institutions.
For more information, contact Andrea Flores at925-688-8183.
City of AntiochIn April 2003, a source water assessment was conducted for the Antioch Municipal Reservoir and the San Joaquin River source of the City of Antioch water system.
In summary:• The Antioch Municipal Reservoir was found to be most
vulnerable to sewer collection systems; this activity is not associated with contaminants in the water supply.
• The San Joaquin River source was found to be most vulnerable to the effects of saltwater intrusion, chemical/petroleum processing or storage, and regulated point discharges.
Water from the San Joaquin River is not always acceptable due to saltwater intrusion. Historically, as major diversions began and the freshwater flows into the Delta decreased, saline bay waters have moved further upstream, replacing the fresh water. When chloride levels in the river exceed 250 milligrams per liter, the City stops pumping until chloride levels decrease.
For more information, contact Lori Sarti at 925-779-7024.
City of PittsburgIn November 2001, a source water assessment was conducted for the City of Pittsburg’s Rossmoor well. In July 2009, a source water assessment was conducted for the Bodega well.
The following water sources were found to be most vulnerable to the following activities NOT associated with any detected contaminants in the water supply:• Bodega Well: Residential sewer collection systems,
abandoned military installation (Camp Stoneman) and illegal activities (drug labs).
• Rossmoor Well: Grazing, sewer collection systems, utility stations and maintenance areas.
You may request a summary of the assessment by contacting the State Water Resources Control Board at 510-620-3474.
Diablo Water District (Oakley)A source water assessment was conducted for Diablo Water District’s Glen Park Well in April 2005 and Stonecreek Well in March 2011. Both sources are considered to be most vulnerable to the following activities NOT associated with contaminants in the water supply: historic waste dumps/landfills and septic systems – high density (>1/acre).
You may request a summary of the assessment by contacting Nacho Mendoza, 925-625-2112.
WATER QUALITY NOTIFICATIONS
PROTECTING THE SOURCE OF WATER
Protection of drinking water is everyone’s responsibility. You
can help protect your community’s drinking water source in several ways:
• Eliminate excess use of lawn and garden fertilizers and pesticides; they
contain hazardous chemicals that can reach your drinking water source.
• Pick up after your pets.• Dispose of chemicals properly; take used motor
oil to a recycling center.

2015 CALENDAR YEARANNUAL WATER QUALITY REPORT5
UNDERSTANDING THE TABLEThe table to the right contains detailed information about the water that comes from your tap. Your water is regularly tested for more than 120 chemicals and other substances, as well as radioactivity. The table lists only substances that were detected.
DefinitionsPublic Health Goal (PHG): The level of a contaminant in drinking water below which there is no known or expected risk to health. PHGs are set by the California Environmental Protection Agency Office of Health and Hazard Assessment.Maximum Contaminant Level Goal (MCLG): The level of a contaminant in drinking water below which there is no known or expected risk to health. MCLGs are set by the U.S. Environmental Protection Agency.Maximum Residual Disinfectant Level Goal (MRDLG): The level of a drinking water disinfectant below which there is no known or expected risk to health. MRDLGs do not reflect the benefits of the use of disinfectants to control microbial contaminants.PHGs, MCLGs and MRDLGs are non-mandatory goals based solely on public health considerations using the most recent scientific research available. When these goals are set, the technological and economic feasibility of reaching these goals is not considered.Maximum Contaminant Level (MCL): The highest level of a contaminant that is allowed in drinking water. Primary MCLs are set as close to the PHGs (or MCLGs) as is economically or technologically feasible.Maximum Residual Disinfectant Level (MRDL): The highest level of a disinfectant allowed in drinking water. There is convincing evidence that the addition of a disinfectant is necessary for control of microbial contaminants.Primary Drinking Water Standards: MCLs for contaminants that affect health along with their monitoring and reporting requirements, and water treatment requirements.Secondary Drinking Water Standards: Secondary MCLs are set for contaminants that affect the odor, taste or appearance of water.Treatment Technique (TT): A required process intended to reduce the level of a contaminant in drinking water.Treated Water: Water that has been filtered and treated.Regulatory Action Level (AL): The concentration of a contaminant which, if exceeded, triggers treatment or other requirements which a water system must follow.Untreated Water: Water before it has been filtered and treated.Unregulated Contaminant Monitoring Rule (UCMR): A federal rule that requires monitoring for contaminants that are unregulated. Unregulated contaminants are those that don’t yet have a drinking water standard set by the U.S. Environmental Protection Agency. The purpose of monitoring for these contaminants is to help the EPA decide whether the contaminants should have a standard.
6
WATER TEST RESULTS
AbbreviationsAL = Action levelmg/L = Milligrams per litern/a = Not analyzed or not applicable (used in average column when only one data point was available)ND = Not detected above the detection limit used for purposes of reportingng/L = Nanograms per literNTU = Nephelometric turbidity unitspCi/L = Picocuries per liter (a measure of radioactivity)RAA = Running annual averageµg/L = Micrograms per literµmhos/cm = micromhos per centimeter (a measure of conductivity)
Primary DrinkingWater Standards
Microbiological Standards
Secondary DrinkingWater Standards
General Water Quality Parameters
Lead and Copper
UCMR3 Assessment Monitoring(2013–2015)
Contra Costa Water District
Randall-BoldWTP1
CCWD/BrentwoodWTP
DiabloWater District
City ofMartinez
City ofAntioch
City ofPittsburg
Aluminum (mg/L) 0.6 ND ND ND ND ND ND ND ND ND ND ND ND ND–0.055 ND Erosion of natural deposits; residue from some surface water treatment processes
Runoff and leaching from fertilizer use; erosion of natural depositsDischarge from petroleum, glass, and metal refineries; erosion of natural deposits; discharge from mines and chemical manufacturers; runoff from livestock lots (feed additive)
Erosion of natural depositsWater additive that promotes strong teeth
Soil runoff
Byproduct of drinking water disinfection
Erosion of natural deposits; residual from some surface water treatment processes
Drinking water disinfectant added for treatmentByproduct of drinking water disinfectionByproduct of drinking water disinfection
Runoff/leaching from natural deposits; seawater influenceNaturally-occurring organic materialsLeaching from natural depositsNaturally-occurring organic materialsSubstances that form ions when in water; seawater influenceRunoff/leaching from natural deposits; industrial wastesRunoff/leaching from natural depositsSoil runoff
Barium (mg/L) 2 ND n/a ND n/a ND n/a ND n/a ND ND ND ND 0.1 n/aFluoride (mg/L) 1 0.5–1.0 0.8 0.7–0.9 0.7 ND ND 0.6–0.7 0.7 0.6–0.8 0.7 0.7–1.1 0.8 0.5–1 0.7Nitrate as N (mg/L) 10 ND ND ND–1.3 0.4 ND ND ND–1.3 0.5 ND–1.0 0.5 ND ND 0.7 n/a
Selenium (µg/L) 30 ND n/a ND n/a ND n/a ND n/a ND–7.6 3.8 ND n/a ND n/a
Turbidity (NTU) (treatment plant) n/a 0.25 100% 0.28 100% 0.12 100% n/a n/a 0.11 100% 0.21 100% 0.23 100%
Bromate (µg/L)2 0.1 ND–6 ND ND ND ND ND ND ND ND–18 ND n/a n/a n/a n/aChloramines as Cl2 (mg/L)2 4 ND–3.6 1.5 n/a n/a n/a n/a ND–3.5 2.3 0.1–3.2 1.27 0.05–3.97 2.17 0.1–2.5 1.27Haloacetic acids (µg/L)2 n/a ND–12 9 n/a n/a n/a n/a ND–6.2 6 ND–14 6 3.2–15 7 1.1–9.2 6.7
Aluminum (µg/L) ND ND ND ND ND ND ND ND ND ND ND ND ND–55 ND
Chloride (mg/L) 83–119 105 52–125 93 83–215 165 57–127 101 73–130 101 58–142 111 61–148 117Color (units) ND n/a ND n/a ND n/a ND n/a ND ND ND ND ND–5 1.25Manganese (µg/L) ND n/a ND n/a ND n/a ND–350 54 ND ND ND ND ND n/aOdor-threshold (units) 2 n/a 2 n/a 1 n/a 2 n/a ND–2.0 1 ND–2 ND 1.3–1.6 1.3Specific conductivity (µmhos/cm) 600–700 660 490–710 620 580–970 800 550–840 710 560–720 640 580–710 645 480–902 761Sulfate (mg/L) 70–90 80 60–80 70 60–80 70 70–110 90 63–64 63 56–57 56 70–77 74
Alkalinity (mg/L) 60–90 70 70–90 80 50–80 70 80–120 100 83–88 85 72–125 95 85–175 118Ammonia (mg/L) 0.5 n/a 0.5 n/a 0.7 n/a 0.4 n/a ND ND ND ND ND–0.49 0.1Bromide (mg/L) 0.10–0.29 0.18 0.09–0.27 0.19 ND–0.67 0.28 0.098–0.31 0.19 0.18–0.32 0.28 n/a n/a n/a n/aCalcium (mg/L) 21–26 24 20–26 24 16–22 19 24–40 31 25–26 25 17–30 24 29 n/aHardness (mg/L) 120–140 130 110–150 130 110–150 130 120–190 150 120–130 125 89–158 121 130–210 172Magnesium (mg/L) 14–16 15 12–16 14 16–21 18 15–22 18 14–17 15 15 n/a 18 n/a
Lead (µg/L) 0.2 60/0 ND n/a n/a n/a n/a 33/0 ND 62/0 ND 65/0 ND 47/0 ND
Bromochloromethane (µg/L) ND–0.06 ND ND–0.10 0.07 n/a n/a ND–0.08 ND ND ND ND–0.15 0.09 0.09–0.21 0.14Chlorate (µg/L) 26–170 68 ND ND n/a n/a 24–110 54 72–350 196 ND–44 ND ND NDChromium (µg/L) ND–0.4 ND ND–0.5 ND n/a n/a ND–0.7 0.4 ND–0.8 0.3 ND–0.52 ND ND NDHexavalent chromium (µg/L) 0.05–0.14 0.08 0.06–0.10 0.08 n/a n/a 0.18–0.49 0.33 0.046–0.30 0.17 0.056–0.1 0.08 0.05–0.07 0.06Molybdenum (µg/L) ND–1.7 1.2 ND–1.5 1 n/a n/a 1.1–1.8 1.5 1.0–1.4 1.2 ND–1.2 ND 2.4–3.1 2.78Strontium (µg/L)Vanadium (µg/L)
140–1902.2–2.9
1542.6
140–1801.6–2.4
1552.2
n/an/a
n/an/a
200–3001.7–2.7
2342.5
130–1801.5–3.3
1552.4
110–1901.4–3.4
1532.6
240–3101.9–4.5
2853.15
Date of study 2013 2013 n/a 2013 2013 2013–2014 2014–2015
Copper (mg/L) 0.3 60/0 0.16 n/a n/a n/a n/a 33/0 0.15 62/0 0.06 65/0 0.098 47/0 NDDate of sampling June 2013 n/a n/a June 2013 July 2012 August 2015 August 2015
pH 8.1–8.4 8.3 8.0–8.9 8.5 7.8–8.8 8.4 8.0–8.6 8.3 7.6–8.7 8.2 8.0–9.0 8.7 7.0–8.7 8.49Potassium (mg/L) 3.1–3.9 3.4 2.8–4.1 3.4 3.1–5.4 4.4 2.8–4.0 3.3 3.5–4.2 3.8 3.5 n/a 3.8 n/aSodium (mg/L) 69–89 80 55–93 75 65–130 110 62–100 83 63–95 79 39–95 74 77 n/a
Total dissolved solids (mg/L) 320–380 350 270–380 330 310–520 420 305–460 390 340–410 375 253–439 340 333–510 428Turbidity (NTU) (distribution system) 0.05–1.3 0.13 n/a n/a n/a n/a 0.06–1.75 0.13 0.06–0.25 0.1 0.05–0.14 0.07 0.07–0.15 0.11
Total coliform 0 1.7% 0% 0% 0% 0% 0% 0%
Total trihalomethanes (µg/L)2 n/a 9.0–83 55 n/a n/a n/a n/a 12–36 22 8.6–20 17 58–89 79 8.6–28.4 18.4
PHG or MCLG
PHG or MCLG
PHG or MCLG
n/a n/an/a n/an/a 500.02 10n/a n/an/an/a
n/an/a
PHG or Notification
LevelMCL
PHG,MCLG or MRDLG
PHG or MCLG
Range
Highest Monthly % of Positive Samples
Range
Range
# of Sites Tested/#
ExceedingAL
Range
Range of All Distribution Sites Tested
Maximum Value
Range
Highest Monthly % of Positive Samples
Range
Range
# of Sites Tested/#
ExceedingAL
Range
Range of All Distribution Sites Tested
Maximum Value
Range
Highest Monthly % of Positive Samples
Range
Range
# of Sites Tested/#
ExceedingAL
Range
Range of All Distribution Sites Tested
Maximum Value
Range
Highest Monthly % of Positive Samples
Range
Range
# of Sites Tested/#
ExceedingAL
Range
Range of All Distribution Sites Tested
Maximum Value
Range
Highest Monthly % of Positive Samples
Range
Range
# of Sites Tested/#
ExceedingAL
Range
Range of All Distribution Sites Tested
Maximum Value
Range
Highest Monthly % of Positive Samples
Range
Range
# of Sites Tested/#
ExceedingAL
Range
Range of All Distribution Sites Tested
Maximum Value
Range
Highest Monthly % of Positive Samples
Range
Range
# of Sites Tested/#
ExceedingAL
Range
Range of All Distribution Sites Tested
Maximum Value
Average
Average
Average
90% Percentile
Average
Highest Quarterly
RAA
Lowest Monthly % of Samples That Meets
Requirements
Average
Average
Average
90% Percentile
Average
Highest Quarterly
RAA
Lowest Monthly % of Samples That Meets
Requirements
Average
Average
Average
90% Percentile
Average
Highest Quarterly
RAA
Lowest Monthly % of Samples That Meets
Requirements
Average
Average
Average
90% Percentile
Average
Highest Quarterly
RAA
Lowest Monthly % of Samples That Meets
Requirements
Average
Average
Average
90% Percentile
Average
Highest Quarterly
RAA
Lowest Monthly % of Samples That Meets
Requirements
Average
Average
Average
90% Percentile
Average
Highest Quarterly
RAA
Lowest Monthly % of Samples That Meets
Requirements
Average Major Source in Drinking Water
Average
Average
90% Percentile
Average
Highest Quarterly
RAA
Lowest Monthly % of Samples That Meets
Requirements
1 Randall-Bold WTP is a regular source of water for CCWD, DWD and the Goldern State Water Company in Bay Point. It is also an as-needed source of water for Antioch and Brentwood and an emergency source for Pittsburg.
2 MCL Compliance is based on an annual average, not an individual result.
3Calculated result.
1
1210
50
TT
10460
200
50015 units
503 units1,600500
n/an/an/an/an/an/a
151.3
n/an/an/a
1,0005
>5% of monthly samples
80
MCL
MCL
MCL
MCL
ActionLevel
MCL or MRDL
MCL
Naturally present in the environment
Major Source in Drinking Water
Major Source in Drinking Water
Major Source in Drinking Water
Major Source in Drinking Water
HOW TO GET INVOLVED IN THE QUALITY OF YOUR WATERCONTRA COSTA WATER DISTRICTThe Board of Directors meets in regular session at 6:30 p.m. on the first and third Wednesday of each month. Meetings are held in the Board Room at the Contra Costa Water District Center, 1331 Concord Ave., Concord. For meeting agendas, contact the District Secretary at 925-688-8000 or visit www.ccwater.com.
CITY OF MARTINEZThe Martinez City Council meets in regular session at 7 p.m. on the first and third Wednesday of each month. Meetings are held in Council Chambers at 525 Henrietta Street, Martinez. For meeting agendas, contact the Deputy City Clerk at 925-372-3512 or visit www.cityofmartinez.org.
CITY OF PITTSBURGThe Pittsburg City Council meets in regular session at 7 p.m. on the first and third Monday of each month. Meetings are held in Council Chambers at 65 Civic Drive, Pittsburg. For meeting agendas, call 925-252-4850 or visit www.ci.pittsburg.ca.us.
CITY OF ANTIOCHThe Antioch City Council meets in regular session at 7 p.m. on the second and fourth Tuesday of each month. Meetings are held in Council Chambers at Third and H streets, Antioch. For meeting agendas, contact the City Clerk at 925-779-7009 or visit www.ci.antioch.ca.us.
DIABLO WATER DISTRICT (OAKLEY)The Board of Directors meets in regular session at 7:30 p.m. on the fourth Wednesday of each month. Meetings are held at 87 Carol Lane, Oakley. For meeting agendas, contact DWD at925-625-3798 or visit www.diablowater.org.
This report contains important information about your drinking
water. Have someone translate it for you, or speak with someone who
understands it.
Este informe contiene información muy importante sobre su agua potable.
Tradúzcalo o hable con alguien que lo entienda bien.
Mahalaga ang impormasyong ito.Mangyaring ipasalin ito.
WANT MORE INFORMATION?Contra Costa Water District’s website contains valuable
information about water issues. Visit www.ccwater.comto begin your research.

THIS PAGE INTENTIONALLY LEFT BLANK

Water Management Plan
APPENDIX H
CCWD BMP Reports (FY14, FY15 and 10-Year)

THIS PAGE INTENTIONALLY LEFT BLANK
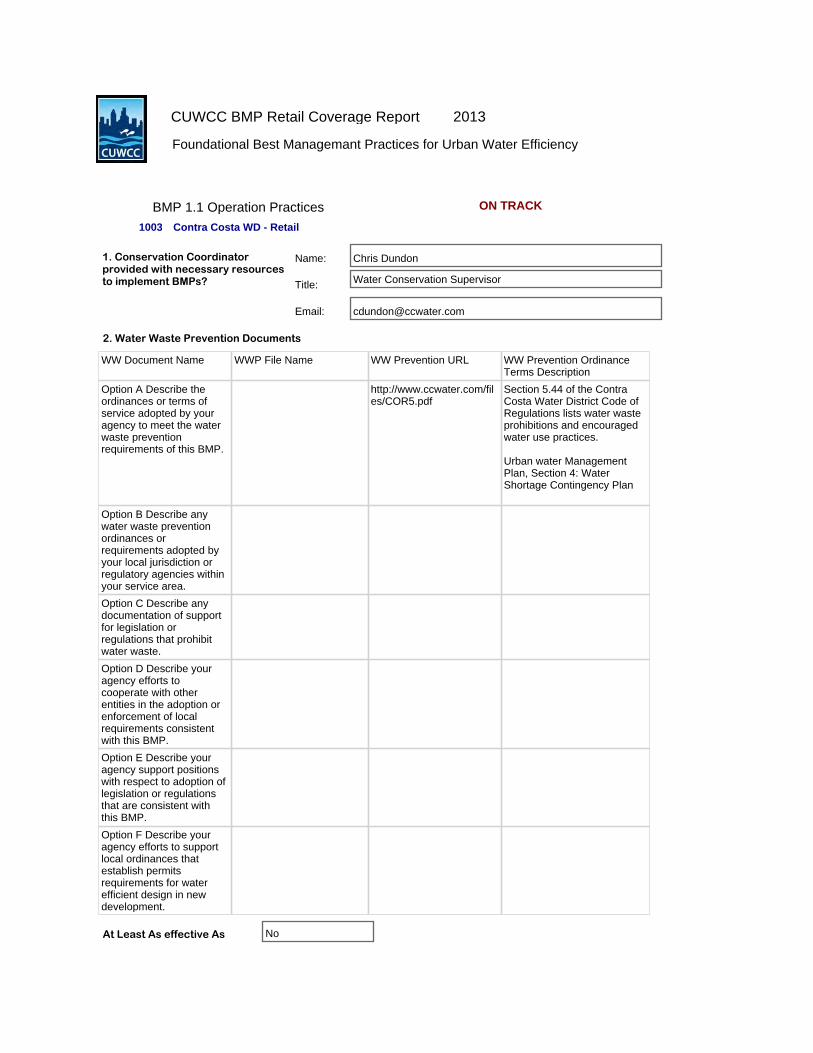
1. Conservation Coordinator provided with necessary resources to implement BMPs?
Name:
Title:
Email:
Water Conservation Supervisor
Chris Dundon
2. Water Waste Prevention Documents
Contra Costa WD - Retail1003
WW Document Name WWP File Name WW Prevention URL WW Prevention Ordinance Terms Description
Option A Describe the ordinances or terms of service adopted by your agency to meet the water waste prevention requirements of this BMP.
http://www.ccwater.com/files/COR5.pdf
Section 5.44 of the Contra Costa Water District Code of Regulations lists water waste prohibitions and encouraged water use practices.
Urban water Management Plan, Section 4: Water Shortage Contingency Plan
Option B Describe any water waste prevention ordinances or requirements adopted by your local jurisdiction or regulatory agencies within your service area.
Option C Describe any documentation of support for legislation or regulations that prohibit water waste.
Option D Describe your agency efforts to cooperate with other entities in the adoption or enforcement of local requirements consistent with this BMP.
Option E Describe your agency support positions with respect to adoption of legislation or regulations that are consistent with this BMP.
Option F Describe your agency efforts to support local ordinances that establish permits requirements for water efficient design in new development.
At Least As effective As No
BMP 1.1 Operation Practices
Foundational Best Managemant Practices for Urban Water Efficiency
CUWCC BMP Retail Coverage Report 2013
ON TRACK

Exemption
Comments:
No
BMP 1.1 Operation Practices
Foundational Best Managemant Practices for Urban Water Efficiency
CUWCC BMP Retail Coverage Report 2013
ON TRACK

1. Conservation Coordinator provided with necessary resources to implement BMPs?
Name:
Title:
Email:
Water Conservation Supervisor
Chris Dundon
2. Water Waste Prevention Documents
Contra Costa WD - Retail1003
WW Document Name WWP File Name WW Prevention URL WW Prevention Ordinance Terms Description
Option A Describe the ordinances or terms of service adopted by your agency to meet the water waste prevention requirements of this BMP.
http://www.ccwater.com/files/COR5.pdf
Section 5.44 of the Contra Costa Water District Code of Regulations lists water waste prohibitions and encouraged water use practices.
Urban water Management Plan, Section 4: Water Shortage Contingency Plan
Option B Describe any water waste prevention ordinances or requirements adopted by your local jurisdiction or regulatory agencies within your service area.
Option C Describe any documentation of support for legislation or regulations that prohibit water waste.
Option D Describe your agency efforts to cooperate with other entities in the adoption or enforcement of local requirements consistent with this BMP.
Option E Describe your agency support positions with respect to adoption of legislation or regulations that are consistent with this BMP.
Option F Describe your agency efforts to support local ordinances that establish permits requirements for water efficient design in new development.
At Least As effective As No
BMP 1.1 Operation Practices
Foundational Best Managemant Practices for Urban Water Efficiency
CUWCC BMP Retail Coverage Report 2014
ON TRACK

Exemption
Comments:
No
BMP 1.1 Operation Practices
Foundational Best Managemant Practices for Urban Water Efficiency
CUWCC BMP Retail Coverage Report 2014
ON TRACK

1003 Contra Costa WD - Retail
Completed Standard Water Audit Using AWWA Software? Yes
AWWA File provided to CUWCC? Yes
AWWA WaterAudit Software_CCWD_FY13 Retail.xls
AWWA Water Audit Validity Score? 81
Complete Training in AWWA Audit Method Yes
Complete Training in Component Analysis Process? Yes
Component Analysis? Yes
Repaired all leaks and breaks to the extent cost effective? Yes
Locate and Repar unreported leaks to the extent cost effective? Yes
Maintain a record keeping system for the repair of reported leaks, including time of report, leak location, type of leaking pipe segment or fitting, and leak running time from
report to repair. Yes
CUWCC BMP Coverage Report 2013
Foundational Best Management Practices For Urban Water Efficiency
BMP 1.2 Water Loss Control ON TRACK
Provided 7 Types of Water Loss Control Info
Leaks Repairs Value Real Losses
Value Apparent Losses
Miles Surveyed Press Reduction Cost Of Interventions
Water Saved (AF)
Comments:
At Least As effective As No
NoExemption

1003 Contra Costa WD - Retail
Completed Standard Water Audit Using AWWA Software? Yes
AWWA File provided to CUWCC? Yes
AWWA WaterAudit Software_CCWD_FY14 Retail.xls
AWWA Water Audit Validity Score? 80
Complete Training in AWWA Audit Method Yes
Complete Training in Component Analysis Process? Yes
Component Analysis? Yes
Repaired all leaks and breaks to the extent cost effective? Yes
Locate and Repar unreported leaks to the extent cost effective? Yes
Maintain a record keeping system for the repair of reported leaks, including time of report, leak location, type of leaking pipe segment or fitting, and leak running time from
report to repair. Yes
CUWCC BMP Coverage Report 2014
Foundational Best Management Practices For Urban Water Efficiency
BMP 1.2 Water Loss Control ON TRACK
Provided 7 Types of Water Loss Control Info
Leaks Repairs Value Real Losses
Value Apparent Losses
Miles Surveyed Press Reduction Cost Of Interventions
Water Saved (AF)
Comments:
At Least As effective As No
NoExemption

1003 Contra Costa WD - Retail
Numbered Unmetered Accounts No
Metered Accounts billed by volume of use Yes
Number of CII Accounts with Mixed UseMeters
1097
Conducted a feasibility study to assess merits of a program to provide incentives to switch mixed-use accounts to dedicated landscape meters?
Yes
Feasibility Study provided to CUWCC? Yes
Completed a written plan, policy or program to test, repair and replace meters
Yes
Comments:
Date:
Uploaded file name:
5/31/2011
At Least As effective As No
NoExemption
BMP 1.3 Metering With Commodity
CUWCC BMP Coverage Report 2013
Foundational Best Management Practices For Urban Water Efficiency
ON TRACK

1003 Contra Costa WD - Retail
Numbered Unmetered Accounts No
Metered Accounts billed by volume of use Yes
Number of CII Accounts with Mixed UseMeters
1097
Conducted a feasibility study to assess merits of a program to provide incentives to switch mixed-use accounts to dedicated landscape meters?
Yes
Feasibility Study provided to CUWCC? Yes
Completed a written plan, policy or program to test, repair and replace meters
Yes
Comments:
Date:
Uploaded file name:
5/31/2011
At Least As effective As No
NoExemption
BMP 1.3 Metering With Commodity
CUWCC BMP Coverage Report 2014
Foundational Best Management Practices For Urban Water Efficiency
ON TRACK
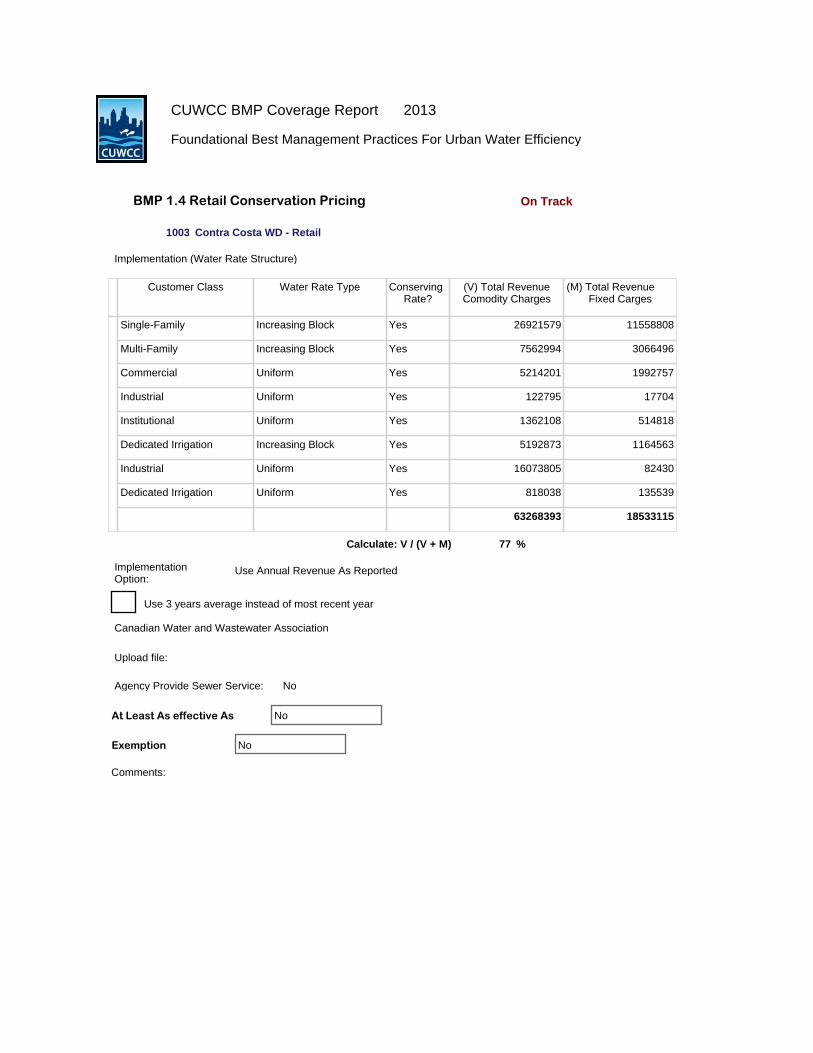
Use Annual Revenue As ReportedImplementation Option:
Implementation (Water Rate Structure)
1003 Contra Costa WD - Retail
NoAgency Provide Sewer Service:
Customer Class Water Rate Type ConservingRate?
(V) Total RevenueComodity Charges
(M) Total Revenue Fixed Carges
458
Single-Family Increasing Block Yes 26921579 11558808
Multi-Family Increasing Block Yes 7562994 3066496
Commercial Uniform Yes 5214201 1992757
Industrial Uniform Yes 122795 17704
Institutional Uniform Yes 1362108 514818
Dedicated Irrigation Increasing Block Yes 5192873 1164563
Industrial Uniform Yes 16073805 82430
Dedicated Irrigation Uniform Yes 818038 135539
63268393 18533115
77Calculate: V / (V + M) %
Canadian Water and Wastewater Association
Use 3 years average instead of most recent year
Upload file:
Comments:
At Least As effective As No
NoExemption
BMP 1.4 Retail Conservation Pricing
CUWCC BMP Coverage Report 2013
Foundational Best Management Practices For Urban Water Efficiency
On Track

Use Annual Revenue As ReportedImplementation Option:
Implementation (Water Rate Structure)
1003 Contra Costa WD - Retail
NoAgency Provide Sewer Service:
Customer Class Water Rate Type ConservingRate?
(V) Total RevenueComodity Charges
(M) Total Revenue Fixed Carges
1089
Single-Family Increasing Block Yes 28000089 11700433
Multi-Family Increasing Block Yes 7751850 3162503
Commercial Uniform Yes 5531916 2016596
Industrial Uniform Yes 134538 17785
Institutional Uniform Yes 1410316 509512
Dedicated Irrigation Increasing Block Yes 5364744 1187398
Industrial Uniform Yes 17740558 0
Dedicated Irrigation Uniform Yes 745746 137241
Other Uniform Yes 121865 95307
Other Uniform Yes 99225 185328
66900847 19012103
78Calculate: V / (V + M) %
Canadian Water and Wastewater Association
Use 3 years average instead of most recent year
Upload file:
Comments:
At Least As effective As No
NoExemption
BMP 1.4 Retail Conservation Pricing
CUWCC BMP Coverage Report 2014
Foundational Best Management Practices For Urban Water Efficiency
On Track

Reporting unit # 1003
Contra Costa WD - Retail
Reporting unit name
/ Retail
Please provide the name of Agency if not CUWCC Group1 members
Did at least one contact take place duringeach quarter of the reporting year? YES
Public Information Programs List
Number of Public Contacts
Public Information Programs Name
680000 Newsletter articles on conservation
392500 Flyers and/or brochures (total copies), bill stuffers, messages printed on bill, information packets
21 Landscape water conservation media campaigns
60000 Email Messages
Contact with the Media
Did at least one contact take place during each quarter of the reporting year? Yes
Number of Media Contacts
Public Outreach Media Contact Name List
8 Articles or stories resulting from outreach 77529
2 News releases 77529
2 Television contacts 77529
Does your agency perform Public Outreach programs?
The list of wholesale agencies performing public outreach which can be counted to help the agency comply with the BMP
Yes
Yes
The list of wholesale agencies performing public outreach which can be counted to help the agency comply with the BMP
Please provide the name of Agency if not CUWCC Group1 members
Wholesale Agency Website Updates
NoThe list of wholesale agencies performing public outreach which can be counted to help the agency comply with the BMP
Please provide the name of Agency if not CUWCC Group1 members
BMP 2.1 Public Outreach 2013

IAgency Website Updates
Enter your agency's URL (website address): www.ccwater.com
Describe a minimum of four water conservationrelated updates to your agency's website thattook place during the year:
WaterSaver NewsletterGarden Design Assistance CouponLawn To Garden Workshop Washer Rebate Program Revision
Did at least one Website Update take place duringeach quarter of the reporting year? Yes
Public Information Programs Annual Budget
Enter budget for public outreach programs. You may enter total budget in a single line or brake the budget into discretecategories by entering many rows. Please indicate if personnel costs are included in the entry.
Annual BudgetCategory
Annual Budget Amount
Personal CostIncluded?
Comments
Public Outreach 195000
Public Information Expenses
Enter expenses for public outreach programs. Please include the same kind of expenses you included in the question relatedto your budget (Section 2.1.7, above). For example, if you included personnel costs in the budget entered above,be sure to include them here as well.
Public Outreach Expense Category Expense Amount Personal Cost Included?
Public Outreach 150000
Additional Public Information Program
Please report additional public information contacts. List these additional contacts in order of howyour agency views their importance / effectiveness with respect to conserving water, with the mostimportant/ effective listed first(where 1 = most important).
Were there additional Public Outreach efforts? Yes
Public Outreach Additional Information
Social Marketing Programs
Branding Does your agency have a water conservation”brand,” “theme” or mascot? No
Describe the brand, theme or mascot.
Market Research Have you sponsored or participated inmarket research to refine your message? No
Market Research Topic
Brand Message
Brand Mission Statement
Community Committees
Do you have a community conservation committee? No
Enter the names of the community committees:
Training
BMP 2.1 Public Outreach 2013

Reporting unit # 1003
Contra Costa WD - Retail
Reporting unit name
/ Retail
Please provide the name of Agency if not CUWCC Group1 members
Did at least one contact take place duringeach quarter of the reporting year? Yes
Public Information Programs List
Number of Public Contacts
Public Information Programs Name
697000 Newsletter articles on conservation
390480 Flyers and/or brochures (total copies), bill stuffers, messages printed on bill, information packets
7825 General water conservation information
235000 Landscape water conservation media campaigns
62400 Email Messages
Contact with the Media
Did at least one contact take place during each quarter of the reporting year? Yes
Number of Media Contacts
Public Outreach Media Contact Name List
10 Articles or stories resulting from outreach 78252
5 News releases 78252
5 Radio contacts 78252
14 Television contacts 78252
Does your agency perform Public Outreach programs?
The list of wholesale agencies performing public outreach which can be counted to help the agency comply with the BMP
Yes
Yes
The list of wholesale agencies performing public outreach which can be counted to help the agency comply with the BMP
Please provide the name of Agency if not CUWCC Group1 members
BMP 2.1 Public Outreach 2014

IAgency Website Updates
Enter your agency's URL (website address): www.ccwater.com
Describe a minimum of four water conservationrelated updates to your agency's website thattook place during the year:
Lawn to Garden Website RevisionGarden Design Assistance Program Coupon Programs UpdatesDrought Program Updates
Did at least one Website Update take place duringeach quarter of the reporting year? Yes
Public Information Programs Annual Budget
Enter budget for public outreach programs. You may enter total budget in a single line or brake the budget into discretecategories by entering many rows. Please indicate if personnel costs are included in the entry.
Annual BudgetCategory
Annual Budget Amount
Personal CostIncluded?
Comments
Public Information 110000
Public Information Expenses
Enter expenses for public outreach programs. Please include the same kind of expenses you included in the question relatedto your budget (Section 2.1.7, above). For example, if you included personnel costs in the budget entered above,be sure to include them here as well.
Public Outreach Expense Category Expense Amount Personal Cost Included?
Public Information 110000
Additional Public Information Program
Please report additional public information contacts. List these additional contacts in order of howyour agency views their importance / effectiveness with respect to conserving water, with the mostimportant/ effective listed first(where 1 = most important).
Were there additional Public Outreach efforts? No
Public Outreach Additional Information
Social Marketing Programs
Branding Does your agency have a water conservation”brand,” “theme” or mascot? No
Describe the brand, theme or mascot.
Market Research Have you sponsored or participated inmarket research to refine your message? No
Market Research Topic
Brand Message
Brand Mission Statement
Wholesale Agency Website Updates
NoThe list of wholesale agencies performing public outreach which can be counted to help the agency comply with the BMP
Please provide the name of Agency if not CUWCC Group1 members
BMP 2.1 Public Outreach 2014

1003 Contra Costa WD - Retail Retail
Materials meet state education framework requirements?
Materials are reviewed annually to ensure they meet state standards
Materials distributed to K-6?
Water Conservation booklets and canal safety newsletters, water cycle, water role in CA history, forces that move water, how water is treated, source water education, watersheds, CA water geography
Materials distributed to 7-12 students? (Info Only)
Annual budget for school education program: 106862.00
Description of all other water supplier education programs
The school education program includes: classroom instruction, water treatment plant tours, watershed fieldtrips, student assembly programs, and canal safety
YesDoes your agency implement School Education programs?
The list of wholesale agencies performing public outreach which can be counted to help the agency comply with the BMP
Yes
Yes
Yes
grade appropriate infomation on water conservation, water cycle, canal safety, water quality
Comments:
Budget is 50% of total. Other 50% is in wholesale report
0NoExemption
At Least As effective As No
BMP 2.2 School Education Programs
CUWCC BMP Coverage Report 2013
Foundational Best Management Practices For Urban Water Efficiency
ON TRACK

1003 Contra Costa WD - Retail Retail
Materials meet state education framework requirements?
Materials are reviewed annually to ensure they meet state standards
Materials distributed to K-6?
Water Conservation booklets and canal safety newsletters, watercycle, water role in CA history, forces that move water, how water istreated, source water education, watersheds, CA water geography
Materials distributed to 7-12 students? (Info Only)
Annual budget for school education program: 106860.00
Description of all other water supplier education programs
The school education program includes: classroom instruction, water treatment planttours, watershed fieldtrips, student assembly programs, and canal safety
YesDoes your agency implement School Education programs?
The list of wholesale agencies performing public outreach which can be counted to help the agency comply with the BMP
Yes
Yes
Yes
grade appropriate infomation on water conservation, water cycle,canal safety, water quality
Comments:
0NoExemption
At Least As effective As No
BMP 2.2 School Education Programs
CUWCC BMP Coverage Report 2014
Foundational Best Management Practices For Urban Water Efficiency
ON TRACK

Contra Costa WD - RetailAgency Date Agency Signed MOU: 9/11/1991
Residential Assistance
High Efficiency Clothes Washers
Water Sense Specification Toilets
NoRetrofit 'On Resale' Ordinance exists
No75% Market Penetration Achieved
Single Family Units Multi Family Units
Five year average Resale Rate
Number Toilets per Household
Number WSS Toilets Installed
Target Number of WSS Toilets
2.08
0.03
931
1659.12
1.38
0.03
365
631.64
WSS for New Residential Development
Single Family Units Multi Family UnitsDoes an Ordinance Exists Requiring WSS Fixtures and Appliances in new SF and MF residences?
Number of new SF & MF units built
Yes
0
Yes
0
Incentives
Single Family Accounts
Single Family Target
Multi Family Units Multi Family Target
Total Number Of Accounts/Units 53177 30514
Total Participants during Reporting 0 102
Number of Leak Detection Surveys or Assistance on Customer Property
0 398.83 102 228.86
Number of Faucet Aerators Distributed 307 194
Number of WSS Showerheads Distributed 241 204
Landscape Water Surveys 0 398.83 102
Has agency reached a 75% market saturation for showerheads? Yes
Are financial incentives provided for HECWs? Yes
Has agency completed a HECW Market Penetration Study? No
Single Family Accounts
Single Family Target
425.421529Number of installations for HECW
Coverage Option: Flextrack
Total Measured Water Savings (AF/Year)
TRADITIONAL FLEXTRACK ACTUAL TARGET Prior ActivitiesCredit
131.93 18 149.93 209.26 258.070
BMP3 - Residential
CUWCC BMP Coverage Report 2013
ON TRACK

Unique Conservation Measures
Residential Assistance / Landscape Water Survey unique water savinigs
18
Copy4_of_Whitcomb_Report_2000.pdf
Measured water savings (AF/YR)
Uploaded file name:
High Efficiency Clothes Washers unique water savinigs
0Measured water savings (AF/YR)
Uploaded file name:
WaterSense Specification toilets unique water savinigs
SF Measured water savings (AF/YR)
Uploaded file name:
MF Measured water savings (AF/YR)
WaterSense Specification toilets for New Residential development unique water savinigs
0Measured water savings (AF/YR)
Uploaded file name:
High bill contact with single-family and multi-family customers
Measured water savings (AF/YR)
Uploaded file name:
Educate residential customers about the behavioral aspects of water conservation
0Measured water savings (AF/YR)
Uploaded file name:
Notify residential customers of leaks on the customer's side of the meters
0Measured water savings (AF/YR)
Uploaded file name:
Provide bill or surcharge refunds for customers to repair leaks on the customer's side of the meters
0Measured water savings (AF/YR)
Uploaded file name:
Provide unique water savings fixtures that are not included in the BMP list above
0Measured water savings (AF/YR)
Uploaded file name:
Install residence water use monitors
0Measured water savings (AF/YR)
Uploaded file name:
Participate in programs that provide residences with school water conservation kits
0Measured water savings (AF/YR)
Uploaded file name:
Implement in automatic meter reading program for residential customers
BMP3 - Residential
CUWCC BMP Coverage Report 2013
ON TRACK

Traditional Water Savings Calculation result:
Measures Target Water Savings (AF): Actual Water Savings (AF):
SF Leak Detection Surveys
MF Leak Detection Surveys
Landscape Water Surveys
SF WSS Toilets Installed
MF WSS Toilets Installed
HECW
8.93
8.93
2.56
0.00
0.00
1.14
95.52
63.54
26.80
18.36
29.78 85.63
0Measured water savings (AF/YR)
Uploaded file name:
OTHER Types of Measures
0Measured water savings (AF/YR)
Uploaded file name:
At Least As Effective As
Comments:
No
Exemption No
BMP3 - Residential
CUWCC BMP Coverage Report 2013
ON TRACK

Contra Costa WD - RetailAgency Date Agency Signed MOU: 9/11/1991
Residential Assistance
High Efficiency Clothes Washers
Water Sense Specification Toilets
NoRetrofit 'On Resale' Ordinance exists
No75% Market Penetration Achieved
Single Family Units Multi Family Units
Five year average Resale Rate
Number Toilets per Household
Number WSS Toilets Installed
Target Number of WSS Toilets
2.08
0.03
1630
1660.78
1.38
0.03
716
635.82
WSS for New Residential Development
Single Family Units Multi Family UnitsDoes an Ordinance Exists Requiring WSS Fixtures and Appliances in new SF and MF residences?
Number of new SF & MF units built
Yes
0
Yes
0
Incentives
Single Family Accounts
Single Family Target
Multi Family Units Multi Family Target
Total Number Of Accounts/Units 53230 30716
Total Participants during Reporting 0 184
Number of Leak Detection Surveys or Assistance on Customer Property
0 399.23 184 230.37
Number of Faucet Aerators Distributed 461 394
Number of WSS Showerheads Distributed 511 601
Landscape Water Surveys 0 399.22 0
Has agency reached a 75% market saturation for showerheads? Yes
Are financial incentives provided for HECWs? Yes
Has agency completed a HECW Market Penetration Study? No
Single Family Accounts
Single Family Target
425.841432Number of installations for HECW
Coverage Option: Flextrack
Total Measured Water Savings (AF/Year)
TRADITIONAL FLEXTRACK ACTUAL TARGET Prior ActivitiesCredit
214 21 235 194.95 204.890
BMP3 - Residential
CUWCC BMP Coverage Report 2014
ON TRACK

Unique Conservation Measures
Residential Assistance / Landscape Water Survey unique water savinigs
21
BMP 3 SF Survey Savings Calcs FY14.xls
Measured water savings (AF/YR)
Uploaded file name:
High Efficiency Clothes Washers unique water savinigs
0Measured water savings (AF/YR)
Uploaded file name:
WaterSense Specification toilets unique water savinigs
SF Measured water savings (AF/YR)
Uploaded file name:
MF Measured water savings (AF/YR)
WaterSense Specification toilets for New Residential development unique water savinigs
0Measured water savings (AF/YR)
Uploaded file name:
High bill contact with single-family and multi-family customers
Measured water savings (AF/YR)
Uploaded file name:
Educate residential customers about the behavioral aspects of water conservation
0Measured water savings (AF/YR)
Uploaded file name:
Notify residential customers of leaks on the customer's side of the meters
0Measured water savings (AF/YR)
Uploaded file name:
Provide bill or surcharge refunds for customers to repair leaks on the customer's side of the meters
0Measured water savings (AF/YR)
Uploaded file name:
Provide unique water savings fixtures that are not included in the BMP list above
0Measured water savings (AF/YR)
Uploaded file name:
Install residence water use monitors
0Measured water savings (AF/YR)
Uploaded file name:
Participate in programs that provide residences with school water conservation kits
0Measured water savings (AF/YR)
Uploaded file name:
Implement in automatic meter reading program for residential customers
BMP3 - Residential
CUWCC BMP Coverage Report 2014
ON TRACK

Traditional Water Savings Calculation result:
Measures Target Water Savings (AF): Actual Water Savings (AF):
SF Leak Detection Surveys
MF Leak Detection Surveys
Landscape Water Surveys
SF WSS Toilets Installed
MF WSS Toilets Installed
HECW
8.94
8.94
2.58
0.00
0.00
2.98
95.62
63.96
73.73
54.37
14.91 82.92
0Measured water savings (AF/YR)
Uploaded file name:
OTHER Types of Measures
0Measured water savings (AF/YR)
Uploaded file name:
At Least As Effective As
Comments:
No
Exemption No
BMP3 - Residential
CUWCC BMP Coverage Report 2014
ON TRACK

CII Baseline Water Use (AF): 5401.00
Water Efficiency Measures:QuantityInstalled:
8 Connectionless Food Steamers
9 Medical Equipment Steam Sterilizers
10 Water Efficient Ice Machines
11 Pressurized Water Brooms
12 Dry Vacuum Pumps
Total Water Savings:
7 Cooling Tower pH Controllers
6 Cooling Tower Conductivity Controllers
5 Commercial High Efficiency Single Load Clothes Washers
4 Zero Consumption Urinals
3 Ultra Low Flow Urinals
2 High Efficiency Urinals (0.5 GPF or less)
1 High Efficiency Toilets (1.2 GPF or less)
0.00
0.00
0.00
0.00
2.00
0.00
0.00
8.00
0.00
0.00
0
46
WaterSavings:
2.58
0.83
0.42
1.33
Contra Costa WD - RetailAgency Date Agency Signed MOU: 9/11/1991
Coverage Option: Flextrack
AcceptCouncil'sdefaultvalue
No
No
No
No
Yes
No
No
Yes
No
No
No
Yes
Unique Conservation Measures
Industrial Process Water Use Reduction
Measured water savings (AF/YR) 234
Uploaded file name:
Commercial Laundry Retrofits
Measured water savings (AF/YR)
Uploaded file name:
Industrial Laundry Retrofits
Measured water savings (AF/YR)
Uploaded file name:
Filter Upgrades (for pools, spas and fountants)
CII Water Use Reduction(AF): 540.1
TRADITIONAL FLEXTRACK ACTUAL TARGET Prior Activities Credit
2.6 234 236.6 232.24 250.230
Total Measured Water Savings (AF/Year)
BMP4 - Commercial Industrial Institutional
2013CUWCC BMP Coverage Report
ON TRACK

CII Baseline Water Use (AF): 5401.00
Water Efficiency Measures:QuantityInstalled:
8 Connectionless Food Steamers
9 Medical Equipment Steam Sterilizers
10 Water Efficient Ice Machines
11 Pressurized Water Brooms
12 Dry Vacuum Pumps
Total Water Savings:
7 Cooling Tower pH Controllers
6 Cooling Tower Conductivity Controllers
5 Commercial High Efficiency Single Load Clothes Washers
4 Zero Consumption Urinals
3 Ultra Low Flow Urinals
2 High Efficiency Urinals (0.5 GPF or less)
1 High Efficiency Toilets (1.2 GPF or less)
0.00
0.00
0.00
0.00
0.00
0.00
0.00
0.00
0.00
0.00
50
166
WaterSavings:
5.56
0.00
0.00
0.00
0.00
0.00
0.00
0.00
0.00
0.00
0.00
0.75
4.81
Contra Costa WD - RetailAgency Date Agency Signed MOU: 9/11/1991
Coverage Option: Flextrack
AcceptCouncil'sdefaultvalue
Yes
Yes
Yes
Yes
Yes
Yes
Yes
Yes
Yes
Yes
Yes
Yes
Unique Conservation Measures
Industrial Process Water Use Reduction
Measured water savings (AF/YR)
Uploaded file name:
Commercial Laundry Retrofits
Measured water savings (AF/YR)
Uploaded file name:
Industrial Laundry Retrofits
Measured water savings (AF/YR)
Uploaded file name:
Filter Upgrades (for pools, spas and fountants)
CII Water Use Reduction(AF): 540.1
TRADITIONAL FLEXTRACK ACTUAL TARGET Prior Activities Credit
5.56 0 5.56 232.24 566.050
Total Measured Water Savings (AF/Year)
BMP4 - Commercial Industrial Institutional
2014CUWCC BMP Coverage Report
ON TRACK

a) Number of dedicated irrigation meter accounts
b) Number of dedicated irrigation meter accounts with water budgets
c) Aggregate water use for all dedicated non-recreational landscape accounts with water budgets
d)Aggregate acreage assigned water budgets for dedicated non-recreational landscape accounts with budgets
1) Accounts with Dedicated Irrigation Meters
Aggregate acreage of recreational areas assigned water budgets for dedicated recreational landscape accounts with budgets
Preserved water use records and budgets for customers with dedicated landscape irrigation accounts for at least four years
Number of Accounts 20% over-budget
Number of Accounts 20% over-budget offered technical assistance
Number of Accounts 20% over-budget accepting technical assistance
2) Commercial / Industrial / Institutional Accounts without Meters or with Mixed-Use Meters
Number of mixed use and un-metered accounts.
Number of irrigation water use surveys offered
Type: Incentives numbers received by customers: $ Value:
Type: Rebates numbers received by customers: $ Value:
Type No- or low-Interest loan offered numbers received by customers:
$ Value:
Estimated annual water savings by customers receiving surveys and implementing recommendations
1314
840
2652
1275
371
371
20
1390
1390
0
0
0
Agency Contra Costa WD - Retail Date Agency Signed MOU: 9/11/1991
Yes
Unique measured water Savings (AF/YR) in this measure
Uploaded the backup data if there are unique measured water savings?
833
Yes
Technical Assistance
Unique measured water Savings (AF/YR) in technical assistance
NoUploaded the backup data if there are unique measured water savings?
Number of irrigation water use surveys accepted 8
Annual water savings by customers receiving irrigation water savings surveys and implementing recomendations
Coverage Option: Flextrack
Total Measured Water Savings (AF/Year)
TRADITIONAL FLEXTRACK ACTUAL TARGET PRIOR ACTIVITIESCREDIT
299.24 835.11 1134.35 210.6 2025.15
BMP5 - Landscape
CUWCC BMP Coverage Report 2013
ON TRACK
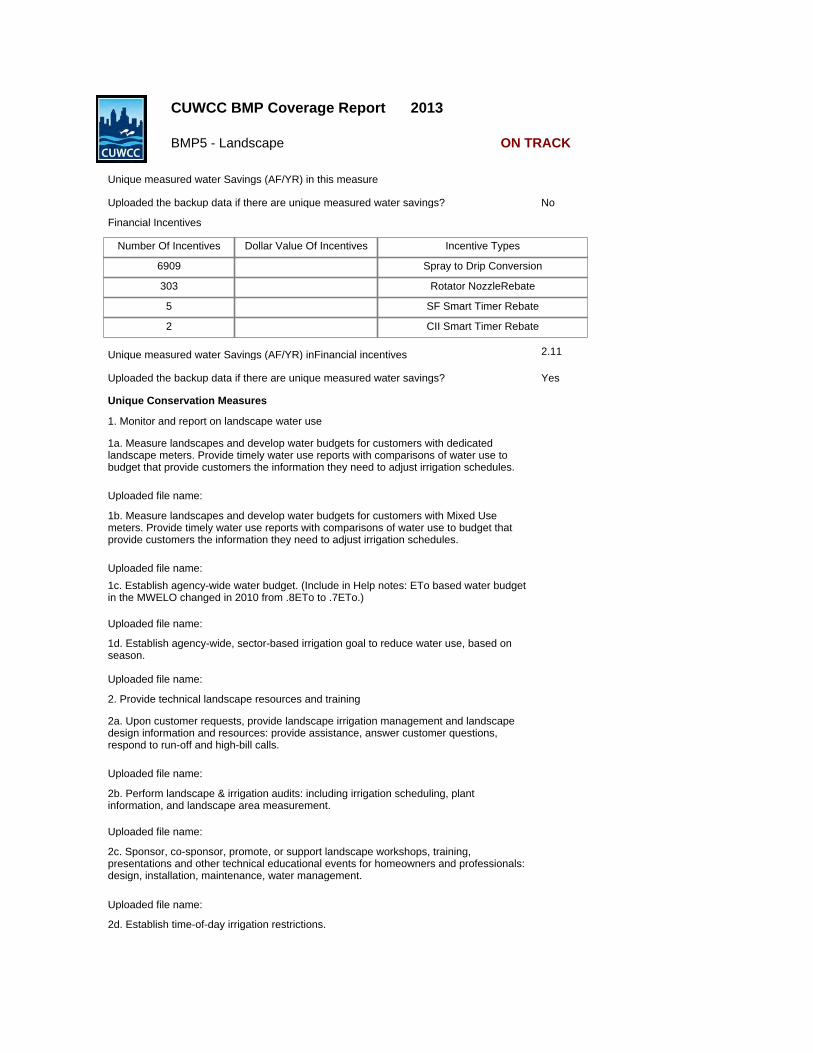
Unique measured water Savings (AF/YR) in this measure
Uploaded the backup data if there are unique measured water savings? No
Financial Incentives
Unique measured water Savings (AF/YR) inFinancial incentives 2.11
YesUploaded the backup data if there are unique measured water savings?
Number Of Incentives Dollar Value Of Incentives Incentive Types
6909 Spray to Drip Conversion
303 Rotator NozzleRebate
5 SF Smart Timer Rebate
2 CII Smart Timer Rebate
Unique Conservation Measures
1. Monitor and report on landscape water use
1a. Measure landscapes and develop water budgets for customers with dedicated landscape meters. Provide timely water use reports with comparisons of water use to budget that provide customers the information they need to adjust irrigation schedules.
Uploaded file name:
1b. Measure landscapes and develop water budgets for customers with Mixed Use meters. Provide timely water use reports with comparisons of water use to budget that provide customers the information they need to adjust irrigation schedules.
Uploaded file name:
1c. Establish agency-wide water budget. (Include in Help notes: ETo based water budget in the MWELO changed in 2010 from .8ETo to .7ETo.)
Uploaded file name:
1d. Establish agency-wide, sector-based irrigation goal to reduce water use, based on season.
Uploaded file name:
2. Provide technical landscape resources and training
2a. Upon customer requests, provide landscape irrigation management and landscape design information and resources: provide assistance, answer customer questions, respond to run-off and high-bill calls.
Uploaded file name:
2b. Perform landscape & irrigation audits: including irrigation scheduling, plant information, and landscape area measurement.
Uploaded file name:
2c. Sponsor, co-sponsor, promote, or support landscape workshops, training, presentations and other technical educational events for homeowners and professionals: design, installation, maintenance, water management.
Uploaded file name:
2d. Establish time-of-day irrigation restrictions.
BMP5 - Landscape
CUWCC BMP Coverage Report 2013
ON TRACK

Uploaded file name:
2e . Establish day-of-week irrigation restrictions.
Uploaded file name:
3. Provide incentives
3a. Establish landscape budget-based rates.
Uploaded file name:
3b. Provide incentives for conversions from mixed-use meters to dedicated landscape meters.
Uploaded file name:
3c. Provide incentives for irrigation equipment upgrades that improve distribution uniformity, irrigation efficiency, or scheduling capabilities.
Uploaded file name:
3d. Provide incentives for the reduction of water use over an irrigated area, or reduction in the size of the irrigated area due to replacement of turf or other high water-using plants with low water-using plants, artificial turf, or permeable surfaces.
Uploaded file name:
3e. Provide incentives for conversions from potable to recycled water. 7
Uploaded file name:
3f. Provide incentives for the use of alternative sources of water in the landscape (i.e. gray water, rainwater, cisterns, etc.)
Uploaded file name:
4. Participate in local and regional planning and regulatory activities
4a. Collaborate with planning agencies at the local and regional level, other water suppliers in the area and stakeholders in response to state or federal requirements such as the State Model Water Efficient Landscape Ordinance and AB 1881. Participate in the development, review, implementation, and enforcement of requirements for new developments. Provide water use data to planning agencies.
4b. Establish or participate in a water conservation advisory committee or other community outreach effort to drive market transformation and exchange information about landscape water conservation with developers, community-based organizations, homeowners associations, residential customers, landscape professionals, educators, other water suppliers in region.
4c. Participate in regional efforts: integrated water resource management, watershed management, NPDES permit agencies, etc.
5. Develop a holistic approach to landscape water use efficiency
5a. Develop and implement a comprehensive landscape water conservation program for all customers. Target marketing efforts to those most likely to result in benefits to both customer and Agency.
Uploaded file name:
6. Other Measures
Other Landscape Measures.
BMP5 - Landscape
CUWCC BMP Coverage Report 2013
ON TRACK

a) Number of dedicated irrigation meter accounts
b) Number of dedicated irrigation meter accounts with water budgets
c) Aggregate water use for all dedicated non-recreational landscape accounts with water budgets
d)Aggregate acreage assigned water budgets for dedicated non-recreational landscape accounts with budgets
1) Accounts with Dedicated Irrigation Meters
Aggregate acreage of recreational areas assigned water budgets for dedicated recreational landscape accounts with budgets
Preserved water use records and budgets for customers with dedicated landscape irrigation accounts for at least four years
Number of Accounts 20% over-budget
Number of Accounts 20% over-budget offered technical assistance
Number of Accounts 20% over-budget accepting technical assistance
2) Commercial / Industrial / Institutional Accounts without Meters or with Mixed-Use Meters
Number of mixed use and un-metered accounts.
Number of irrigation water use surveys offered
Type: Incentives numbers received by customers: $ Value:
Type: Rebates numbers received by customers: $ Value:
Type No- or low-Interest loan offered numbers received by customers:
$ Value:
Estimated annual water savings by customers receiving surveys and implementing recommendations
350
350
45
0
0
0
Agency Contra Costa WD - Retail Date Agency Signed MOU: 9/11/1991
Yes
Unique measured water Savings (AF/YR) in this measure
Uploaded the backup data if there are unique measured water savings? No
Technical Assistance
Unique measured water Savings (AF/YR) in technical assistance
NoUploaded the backup data if there are unique measured water savings?
Number of irrigation water use surveys accepted
Annual water savings by customers receiving irrigation water savings surveys and implementing recomendations
Coverage Option: Flextrack
Total Measured Water Savings (AF/Year)
TRADITIONAL FLEXTRACK ACTUAL TARGET PRIOR ACTIVITIESCREDIT
0.05 0 0.05 50.04 3133.21
BMP5 - Landscape
CUWCC BMP Coverage Report 2014
ON TRACK

Unique measured water Savings (AF/YR) in this measure
Uploaded the backup data if there are unique measured water savings? No
Financial Incentives
Unique measured water Savings (AF/YR) inFinancial incentives
NoUploaded the backup data if there are unique measured water savings?
Number Of Incentives Dollar Value Of Incentives Incentive Types
46 552 SF Smart Timer(stations)
129 2580 CII Smart Timer
483 Sprinkler Head Replacement
1051 Rotator Nozzles
1 Sub Meter
3036 Spray to Drip Retrofit (sq. ft.)
Unique Conservation Measures
1. Monitor and report on landscape water use
1a. Measure landscapes and develop water budgets for customers with dedicated landscape meters. Provide timely water use reports with comparisons of water use to budget that provide customers the information they need to adjust irrigation schedules.
Uploaded file name:
1b. Measure landscapes and develop water budgets for customers with Mixed Use meters. Provide timely water use reports with comparisons of water use to budget that provide customers the information they need to adjust irrigation schedules.
Uploaded file name:
1c. Establish agency-wide water budget. (Include in Help notes: ETo based water budget in the MWELO changed in 2010 from .8ETo to .7ETo.)
Uploaded file name:
1d. Establish agency-wide, sector-based irrigation goal to reduce water use, based on season.
Uploaded file name:
2. Provide technical landscape resources and training
2a. Upon customer requests, provide landscape irrigation management and landscape design information and resources: provide assistance, answer customer questions, respond to run-off and high-bill calls.
Uploaded file name:
2b. Perform landscape & irrigation audits: including irrigation scheduling, plant information, and landscape area measurement.
Uploaded file name:
2c. Sponsor, co-sponsor, promote, or support landscape workshops, training, presentations and other technical educational events for homeowners and professionals: design, installation, maintenance, water management.
Uploaded file name:
BMP5 - Landscape
CUWCC BMP Coverage Report 2014
ON TRACK

BMP ACTUAL TARGET PRIOR CREDIT Coverage option STATUS
BMP 3 149.93 209.26 258.070 Flextrack ON TRACK
BMP 4 236.6 232.24 250.230 Flextrack ON TRACK
BMP 5 1134.35 210.6 2025.15 Flextrack ON TRACK
TOTAL 597.13 652.1 2533.45 On Track
Foundational Best Management Practices For Urban Water Efficiency
Flex Track Summary Report
1003 Contra Costa WD - Retail

BMP ACTUAL TARGET PRIOR CREDIT Coverage option STATUS
BMP 3 235 194.95 204.890 Flextrack ON TRACK
BMP 4 5.56 232.24 566.050 Flextrack ON TRACK
BMP 5 0.05 50.04 3133.21 Flextrack ON TRACK
TOTAL 290.6 477.23 3904.15 On Track
Foundational Best Management Practices For Urban Water Efficiency
Flex Track Summary Report
1003 Contra Costa WD - Retail

1. Conservation Coordinator provided with necessary resources to implement BMPs?
Name:
Title:
Email:
Water Conservation Supervisor
Chris Dundon
2. Water Waste Prevention Documents
Contra Costa WD - Wholesale2003
At Least As effective As No
Exemption
Comments:
No
BMP 1.1 Operation Practices
Foundational Best Managemant Practices for Urban Water Efficiency
CUWCC BMP Retail Coverage Report 2013
ON TRACK

Name: Email:
Contra Costa WD - Wholesale2003
[email protected] Dundon
BMP Section Monetary Amount for Financial Incentives
Monetary Amount for Equivalent Resources
BMP 3 Residential 327169 123898
BMP 4 CII 1920 6312
BMP 5 Landscape 2703 4833
b) Technical Support
d) Water Shortage Allocation
Adoption Date: 6/1/2011
http://www.ccwater.com/files/UWMP.pdfFile Name:
e) Non signatory Reporting of BMP implementation by non-signatory Agencies
CCWD encourages its members to join the CUWCC.
f) Encourage CUWCC Membership List Efforts to Recuit Retailers
a) Financial Investments and Building Partnerships
c) Retail Agency
Comments:
At Least As effective As No
NoExemption
BMP 1.1 Wholesale Agency Assistance Programs
CUWCC BMP Wholesale Coverage Report 2014
Foundational Best Managemant Practices for Urban Water Efficiency
ON TRACK

2003 Contra Costa WD - Wholesale
Completed Standard Water Audit Using AWWA Software? Yes
AWWA File provided to CUWCC? Yes
AWWA WaterAudit Software_CCWD_FY13 Wholesale.xls
AWWA Water Audit Validity Score? 81
Complete Training in AWWA Audit Method Yes
Complete Training in Component Analysis Process? Yes
Component Analysis? Yes
Repaired all leaks and breaks to the extent cost effective? Yes
Locate and Repar unreported leaks to the extent cost effective? Yes
Maintain a record keeping system for the repair of reported leaks, including time of report, leak location, type of leaking pipe segment or fitting, and leak running time from
report to repair. Yes
CUWCC BMP Coverage Report 2013
Foundational Best Management Practices For Urban Water Efficiency
BMP 1.2 Water Loss Control ON TRACK
Provided 7 Types of Water Loss Control Info
Leaks Repairs Value Real Losses
Value Apparent Losses
Miles Surveyed Press Reduction Cost Of Interventions
Water Saved (AF)
Comments:
Wholesale water system is almost entirely made up of untreated water delivered in open channel, gravity systems. Losses, Leakage, and Component Analysis not applicable when using AWWA software.
At Least As effective As No
NoExemption
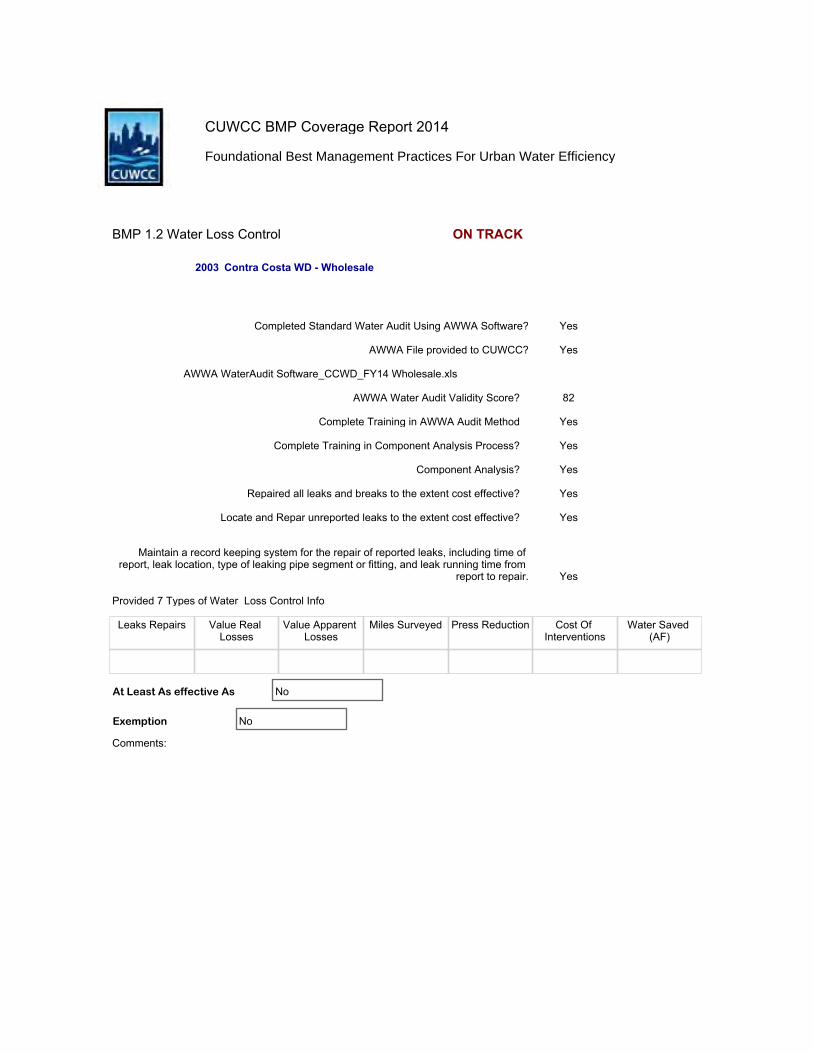
2003 Contra Costa WD - Wholesale
Completed Standard Water Audit Using AWWA Software? Yes
AWWA File provided to CUWCC? Yes
AWWA WaterAudit Software_CCWD_FY14 Wholesale.xls
AWWA Water Audit Validity Score? 82
Complete Training in AWWA Audit Method Yes
Complete Training in Component Analysis Process? Yes
Component Analysis? Yes
Repaired all leaks and breaks to the extent cost effective? Yes
Locate and Repar unreported leaks to the extent cost effective? Yes
Maintain a record keeping system for the repair of reported leaks, including time of report, leak location, type of leaking pipe segment or fitting, and leak running time from
report to repair. Yes
CUWCC BMP Coverage Report 2014
Foundational Best Management Practices For Urban Water Efficiency
BMP 1.2 Water Loss Control ON TRACK
Provided 7 Types of Water Loss Control Info
Leaks Repairs Value Real Losses
Value Apparent Losses
Miles Surveyed Press Reduction Cost Of Interventions
Water Saved (AF)
Comments:
At Least As effective As No
NoExemption
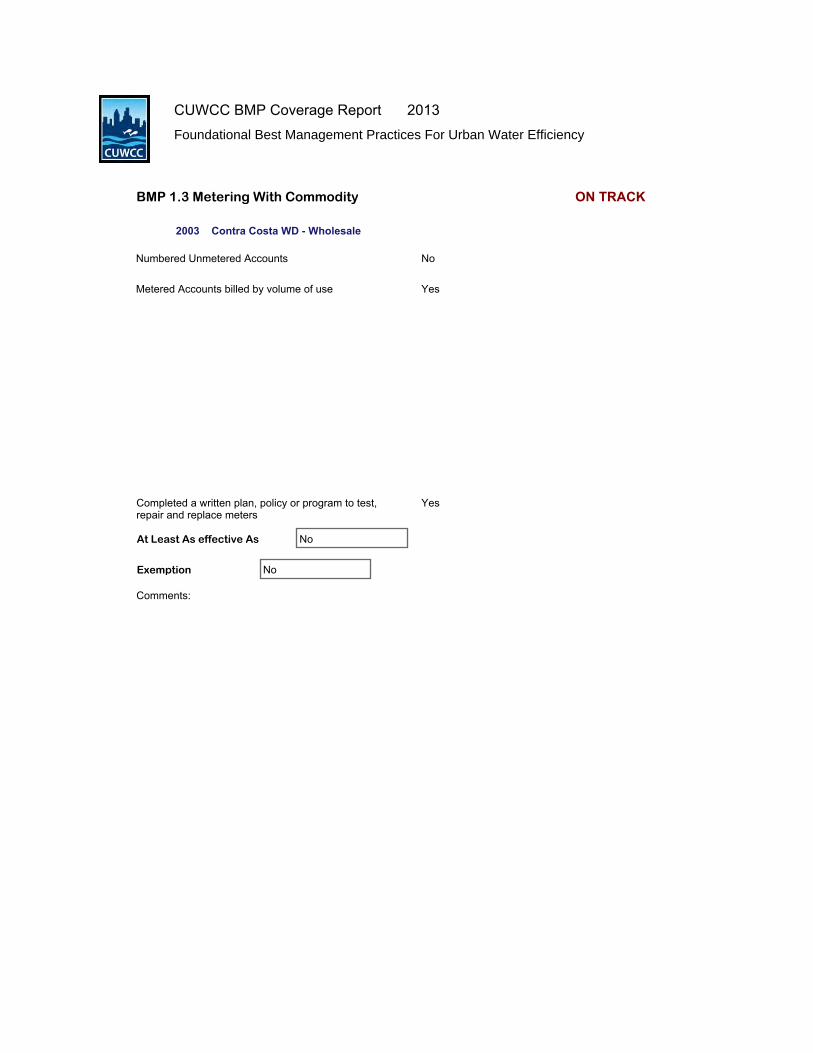
2003 Contra Costa WD - Wholesale
Numbered Unmetered Accounts No
Metered Accounts billed by volume of use Yes
Completed a written plan, policy or program to test, repair and replace meters
Yes
Comments:
At Least As effective As No
NoExemption
BMP 1.3 Metering With Commodity
CUWCC BMP Coverage Report 2013Foundational Best Management Practices For Urban Water Efficiency
ON TRACK

2003 Contra Costa WD - Wholesale
Numbered Unmetered Accounts No
Metered Accounts billed by volume of use Yes
Completed a written plan, policy or program to test, repair and replace meters
Yes
Comments:
At Least As effective As No
NoExemption
BMP 1.3 Metering With Commodity
CUWCC BMP Coverage Report 2014Foundational Best Management Practices For Urban Water Efficiency
ON TRACK
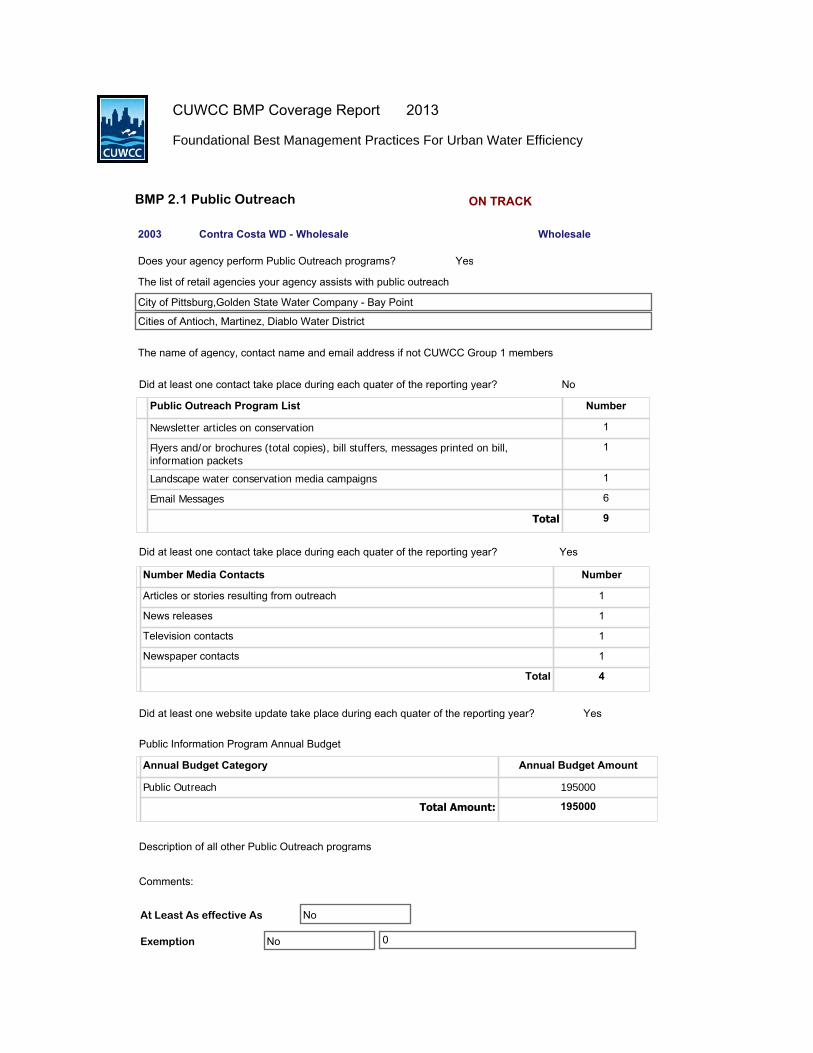
2003 Contra Costa WD - Wholesale Wholesale
The list of retail agencies your agency assists with public outreach
Description of all other Public Outreach programs
p Public Outreach Program List Number
311804
Newsletter articles on conservation 1
Flyers and/or brochures (total copies), bill stuffers, messages printed on bill, information packets
1
Landscape water conservation media campaigns 1
Email Messages 6
Total 9
Number Media Contacts Number
Articles or stories resulting from outreach 1
News releases 1
Television contacts 1
Newspaper contacts 1
Total 4
Annual Budget Category Annual Budget Amount
Public Outreach 195000Total Amount: 195000
Does your agency perform Public Outreach programs? Yes
City of Pittsburg,Golden State Water Company - Bay Point
Did at least one contact take place during each quater of the reporting year? No
Did at least one contact take place during each quater of the reporting year? Yes
Did at least one website update take place during each quater of the reporting year? Yes
Public Information Program Annual Budget
Cities of Antioch, Martinez, Diablo Water District
Comments:
The name of agency, contact name and email address if not CUWCC Group 1 members
0NoExemption
At Least As effective As No
CUWCC BMP Coverage Report
BMP 2.1 Public Outreach
2013
Foundational Best Management Practices For Urban Water Efficiency
ON TRACK
CUWCC BMP Coverage Report
BMP 2.1 Public Outreach
2013
Foundational Best Management Practices For Urban Water Efficiency
ON TRACK

2003 Contra Costa WD - Wholesale Wholesale
The list of retail agencies your agency assists with public outreach
Description of all other Public Outreach programs
p Public Outreach Program List Number
313040
Newsletter articles on conservation 697000
Flyers and/or brochures (total copies), bill stuffers, messages printed on bill, information packets
390480
Landscape water conservation media campaigns 235000
Email Messages 62400
Total 1384880
Number Media Contacts Number
Articles or stories resulting from outreach 10
News releases 5
Radio contacts 5
Television contacts 14
Total 34
Annual Budget Category Annual Budget Amount
Public Outreach 110000Total Amount: 110000
Does your agency perform Public Outreach programs? Yes
City of Pittsburg,Golden State Water Company - Bay Point
Did at least one contact take place during each quater of the reporting year? No
Did at least one contact take place during each quater of the reporting year? Yes
Did at least one website update take place during each quater of the reporting year? Yes
Public Information Program Annual Budget
Cities of Antioch and Martinez, and Diablo Water District
Comments:
The name of agency, contact name and email address if not CUWCC Group 1 members
0NoExemption
At Least As effective As No
CUWCC BMP Coverage Report
BMP 2.1 Public Outreach
2014
Foundational Best Management Practices For Urban Water Efficiency
ON TRACK

CUWCC BMP Coverage Report
BMP 2.1 Public Outreach
2014
Foundational Best Management Practices For Urban Water Efficiency
ON TRACK

2003 Contra Costa WD - Wholesale Wholesale
Materials meet state education framework requirements?
Materials are reviewed annually to ensure they meet state standards
Materials distributed to K-6?
Water Conservation booklets and canal safety newsletters, water cycle, water role in CA history, forces that move water, how water is treated, source water education, watersheds, CA water geography
Materials distributed to 7-12 students? (Info Only)
Annual budget for school education program: 106862.00
Description of all other water supplier education programs
Contra Costa WD - Wholesale
NoDoes your agency implement School Education programs?
The list of retail agencies your agency assists with public outreach
Yes
Yes
Yes
grade appropriate infomation on water conservation, water cycle, canal safety, water quality
Comments:
Budget is 50% of total. Other 50% is in retail report
0NoExemption
At Least As effective As No
BMP 2.2 School Education Programs
CUWCC BMP Coverage Report 2013
Foundational Best Management Practices For Urban Water Efficiency
ON TRACK

2003 Contra Costa WD - Wholesale Wholesale
Materials meet state education framework requirements?
Materials are reviewed annually to ensure they meet state standards
Materials distributed to K-6?
Water Conservation booklets and canal safety newsletters, watercycle, water role in CA history, forces that move water, how water istreated, source water education, watersheds, CA water geography
Materials distributed to 7-12 students? (Info Only)
Annual budget for school education program: 106860.00
Description of all other water supplier education programs
City of Pittsburg,Golden State Water Company - Bay Point
YesDoes your agency implement School Education programs?
The list of retail agencies your agency assists with public outreach
City of Martinez, City of Antioch, Diablo Water District,
Yes
Yes
Yes
grade appropriate infomation on water conservation, water cycle,canal safety, water quality
Comments:
0NoExemption
At Least As effective As No
BMP 2.2 School Education Programs
CUWCC BMP Coverage Report 2014
Foundational Best Management Practices For Urban Water Efficiency
ON TRACK

1. Conservation Coordinator provided with necessary resources to implement BMPs?
Name:
Title:
Email:
WC Supervisor
Chris Dundon
2. Water Waste Prevention Documents
Contra Costa WD - Retail1003
WW Document Name WWP File Name WW Prevention URL WW Prevention Ordinance Terms Description
Option A Describe the ordinances or terms of service adopted by your agency to meet the water waste prevention requirements of this BMP.
http://www.ccwater.com/documentcenter/view/449
Look at section 5.44
Option B Describe any water waste prevention ordinances or requirements adopted by your local jurisdiction or regulatory agencies within your service area.
http://www.ccwater.com/548/Prohibitions-of-Water-Use
Drought Ordinance
Option C Describe any documentation of support for legislation or regulations that prohibit water waste.
Option D Describe your agency efforts to cooperate with other entities in the adoption or enforcement of local requirements consistent with this BMP.
Option E Describe your agency support positions with respect to adoption of legislation or regulations that are consistent with this BMP.
Option F Describe your agency efforts to support local ordinances that establish permits requirements for water efficient design in new development.
At Least As effective As No
Exemption
Comments:
No
BMP 1.1 Operation Practices
Foundational Best Managemant Practices for Urban Water Efficiency
CUWCC BMP Retail Coverage Report 2015
ON TRACK

BMP 1.1 Operation Practices
Foundational Best Managemant Practices for Urban Water Efficiency
CUWCC BMP Retail Coverage Report 2015
ON TRACK

1003 Contra Costa WD - Retail
Completed Standard Water Audit Using AWWA Software? Yes
AWWA File provided to CUWCC? Yes
AWWA WaterAudit Software_CCWD_CY15 Retail.xls
AWWA Water Audit Validity Score? 77
Complete Training in AWWA Audit Method Yes
Complete Training in Component Analysis Process? Yes
Component Analysis? Yes
Repaired all leaks and breaks to the extent cost effective? Yes
Locate and Repar unreported leaks to the extent cost effective? Yes
Maintain a record keeping system for the repair of reported leaks, including time of report, leak location, type of leaking pipe segment or fitting, and leak running time from
report to repair. Yes
CUWCC BMP Coverage Report 2015
Foundational Best Management Practices For Urban Water Efficiency
BMP 1.2 Water Loss Control NOT ON TRACK
Provided 7 Types of Water Loss Control Info
Leaks Repairs Value Real Losses
Value Apparent Losses
Miles Surveyed Press Reduction Cost Of Interventions
Water Saved (AF)
176 308787 702031 0 False
Comments:
At Least As effective As No
NoExemption

1003 Contra Costa WD - Retail
Numbered Unmetered Accounts No
Metered Accounts billed by volume of use Yes
Number of CII Accounts with Mixed UseMeters
1097
Conducted a feasibility study to assess merits of a program to provide incentives to switch mixed-use accounts to dedicated landscape meters?
Yes
Feasibility Study provided to CUWCC? Yes
Completed a written plan, policy or program to test, repair and replace meters
Yes
Comments:
Date:
Uploaded file name:
5/31/2011
At Least As effective As No
NoExemption
BMP 1.3 Metering With Commodity
CUWCC BMP Coverage Report 2015
Foundational Best Management Practices For Urban Water Efficiency
ON TRACK

Use Annual Revenue As ReportedImplementation Option:
Implementation (Water Rate Structure)
1003 Contra Costa WD - Retail
NoAgency Provide Sewer Service:
Customer Class Water Rate Type ConservingRate?
(V) Total RevenueComodity Charges
(M) Total RevenueFixed Carges
1179
Single-Family Increasing Block Yes 24054550 11863794
Multi-Family Increasing Block Yes 7481784 3242687
Commercial Uniform Yes 5290183 2024759
Industrial Uniform Yes 96445 17963
Institutional Uniform Yes 1295297 515420
Dedicated Irrigation Increasing Block Yes 4604052 1191604
Industrial Uniform Yes 16449324 0
Dedicated Irrigation Uniform Yes 673481 133148
Other Uniform Yes 1350 96132
Other Uniform Yes 73493 177953
60019959 19263460
76Calculate: V / (V + M) %
Canadian Water and Wastewater Association
Use 3 years average instead of most recent year
Upload file:
Comments:
At Least As effective As No
NoExemption
BMP 1.4 Retail Conservation Pricing
CUWCC BMP Coverage Report 2015
Foundational Best Management Practices For Urban Water Efficiency
On Track

1003 Contra Costa WD - Retail Retail
The list of wholesale agencies performing public outreach which can be counted to help the agency comply with the BMP
Description of all other Public Outreach programs
p Public Outreach Program List Number
313648
Newsletter articles on conservation 721000
Flyers and/or brochures (total copies), bill stuffers, messages printed on bill, information packets
390330
Landscape water conservation media campaigns 208000
Email Messages 135200
Total 1454530
Number Media Contacts Number
Articles or stories resulting from outreach 15
News releases 3
Radio contacts 5
Television contacts 15
Total 38
Annual Budget Category Annual Budget Amount
Public Information 110000Total Amount: 110000
Does your agency perform Public Outreach programs? Yes
Did at least one contact take place during each quater of the reporting year? No
Did at least one contact take place during each quater of the reporting year? Yes
Did at least one website update take place during each quater of the reporting year? Yes
Public Information Program Annual Budget
Comments:
The name of agency, contact name and email address if not CUWCC Group 1 members
0NoExemption
At Least As effective As No
CUWCC BMP Coverage Report
BMP 2.1 Public Outreach
2015
Foundational Best Management Practices For Urban Water Efficiency
ON TRACK

1003 Contra Costa WD - Retail Retail
Materials meet state education framework requirements?
Materials are reviewed annually to ensure they meet state standards
Materials distributed to K-6?
Water Conservation booklets and canal safety newsletters, watercycle, water role in CA history, forces that move water, how water istreated, source water education, watersheds, CA water geography
Materials distributed to 7-12 students? (Info Only)
Annual budget for school education program: 99267.00
Description of all other water supplier education programs
The school education program includes: classroom instruction, water treatment planttours, watershed fieldtrips, student assembly programs, and canal safety
YesDoes your agency implement School Education programs?
The list of wholesale agencies performing public outreach which can be counted to help the agency comply with the BMP
Yes
Yes
Yes
grade appropriate infomation on water conservation, water cycle,canal safety, water quality
Comments:
0NoExemption
At Least As effective As No
BMP 2.2 School Education Programs
CUWCC BMP Coverage Report 2015
Foundational Best Management Practices For Urban Water Efficiency
ON TRACK

GPCD in 2015
GPCD Target for 2018:
114.06
Biennial GPCD Compliance Table
Year
2010
2012
2014
2016
2018
Report
1
2
3
4
5
% Base
96.4%
92.8%
89.2%
85.6%
82.0%
GPCD
175.90
169.30
162.80
156.20
149.60
% Base
100%
96.4%
92.8%
89.2%
82.0%
GPCD
182.50
175.90
169.30
162.80
149.60
Target Highest Acceptable Bound
1003 Contra Costa WD - Retail
149.60
Baseline GPCD: 186.92
ON TRACK
CUWCC BMP Coverage Report 2015

THIS PAGE INTENTIONALLY LEFT BLANK

Water Management Plan
APPENDIX I
Examples of Public Information and School Education Programs

THIS PAGE INTENTIONALLY LEFT BLANK

On TapSummer 2016
The Value of Your Water ServiceEvery day, with a simple turn of the faucet, you have access to safe, clean tap water. Water to drink and to make coffee. Water to shower and to flush the toilet. Firefighters are able to put out fires, hospitals are able to treat patients and businesses are able to operate. It’s the service you pay for and the service we work hard to protect.
On September 15, the Value of Water Coalition will host its annual Imagine a Day Without Water to raise awareness about water infrastructure. As a Contra Costa Water District customer, it’s a scenario you won’t have to face. We are well prepared to deliver the best possible water at the lowest possible cost for generations to come.
Before the first droplet comes out of your faucet, it travels through a billion-dollar system to collect the water, treat it, store it and deliver it. For our customers, the average cost of water service is about $2 a day. That’s less than the average person pays for cable TV, mobile phone service, electricity and other utilities.
Here’s how we spend each of your rate dollars:
Long-range planning and system upkeep play a crucial role in stretching that $2 as far as possible. Careful reinvesting in the system ensures the facilities can be properly maintained and upgraded while costs are controlled. We also continually monitor costs of materials, chemicals, labor and energy and compare with benchmarks to ensure the most efficient and productive operation possible. In doing so, your rate dollars are spent in ways that get the most bang for the buck.
The Contra Costa Water District is fiscally responsible and we are always looking for ways to increase efficiency and identify cost savings. With declining water sales associated with the drought, the District reduced staffing, renegotiated labor contracts, modernized our services and processes, and refinanced debt to lower expenses. These actions cut some of our costs in the short run, but our focus is on the long run, and we must continue to invest in our system.
We will continue to strategically build and maintain our system, replacing the oldest components with newer and more durable materials. We are committed to using your rate dollars wisely to improve our system so that you and generations to come won’t have to experience a day without water.
New Monitoring Equipment Saves Water and Money A new technology that better regulates water used during the water treatment process at Contra Costa Water District’s treatment plants is being employed to save water and money.
Changes in water quality, temperature and treatment chemical dosages affect the amount of water required to clean the filters. Filter beds, made of sand and granulated activated carbon, are cleaned through a process called backwash in which water flow is reversed at a high velocity to remove debris and particles.
Now, a sensor located in the filter analyzes water properties that would normally require two people up to two hours to manually collect. With the sensors in place, treatment plant operators can evaluate these properties in real time and make immediate adjustments to water flow.
Since the technology was installed at Randall-Bold Water Treatment Plant, the plant reduced water used for backwash by 31%. The District expects to save an average 910,000 gallons per month once the technology is deployed at the City of Brentwood Water Treatment Plant. From this estimate, the sensor should pay for itself within 11 months of operation.
Page 1
Your water system at a glance4 water intakes
4 dams
48 miles of canal
40 reservoirs and pumping station sites
3 water treatment plants
900 miles of distribution piping
62,000 service connections
5,000 fire hydrants
44¢Infrastructure
24¢Customer Service, Conservation & Administration
32¢Operations
Contra Costa Water District invests your rate dollars wisely to ensure you have access to water when you need it.
The District is finding new ways to save water at its treatment facilities.


9/27/2016 More Photos of Unique Lawn-to-Garden Projects
http://us8.campaign-archive1.com/?u=ea9717c4a61e3be1c9d2c4df8&id=ddf25a6f4d&e=6e38510889 1/5
Talk to us at the Home & Garden Show Oct. 21-23. Here are freetickets.
View this email in your browser
September 2016
We've Added Three Unique Homes to Our 'CompletedLawn to Garden Projects' Page
Even if you’ve seen our web page of completed local Lawn to Garden projects,please take another look. Every month we add three more homes to the page,giving you a chance to see how your neighbors are beautifully saving water.
The three houses we’ve added this month are from Clayton, Walnut Creek andConcord. The home in Concord is among the most unique and interestingprojects we’ve seen locally, with very angular raised white beds, walkways andeven plant placement. This home has a neat “succulent art wall,” with cutoutsfor cactus.The homeowners already had several large palm trees in the yard,and built these large planters and the garden around them.
In one of the other homes, the owners removed a large olive tree and replacedit with a water-saving garden. The result is that the garden now frames thebeauty of what was once an almost-hidden and elegant home. In the thirdhouse, the homeowners used existing huge trees to center their design, whichis now very welcoming with a clever walkway that winds through the trees.
The homes we’ve featured on this page are just a few of the hundreds ofhouses within the District that have converted from water-consuming lawns towater-saving gardens. Nearly 2 million square feet of lawn has disappearedwithin the District since 2012.
Subscribe Share Past Issues Translate

9/27/2016 More Photos of Unique Lawn-to-Garden Projects
http://us8.campaign-archive1.com/?u=ea9717c4a61e3be1c9d2c4df8&id=ddf25a6f4d&e=6e38510889 2/5
This angular design in Concord is among the most unique Lawn to Gardenprojects we've seen in the District. Look here to see more recently-addedprojects on our page.
A Survey May Help You Save Water “This is the time of year when many people waste the most water,” said CCWD
Water Conservation Specialist Nicolle Fratus.
She explained that with temperatures staying warm (or very hot this past weekend),
many people put much more water on their yards than is needed. She said with
days growing shorter, it’s the amount of sunlight that determines how much water is
needed, not the temperature.
Signup to have a free Home Water Use Survey. Among the things we’ll do is
program your irrigation timer to this time of year, show you how you can do it
yourself and leave an irrigation schedule for you to follow.
In October, you need to water your lawn only twice a week, your trees and shrubs
once a week.
Our water conservation experts will also go through your house to check for leaks
in toilets and more.
Subscribe Share Past Issues Translate

9/27/2016 More Photos of Unique Lawn-to-Garden Projects
http://us8.campaign-archive1.com/?u=ea9717c4a61e3be1c9d2c4df8&id=ddf25a6f4d&e=6e38510889 3/5
Talk to Our Water-Saving Experts at the Home &Garden Show; Print Free Tickets
We have free tickets to the Fall Home & Garden Show at the Concord Pavilion Oct.
21-23. Be sure to visit the CCWD booth to talk to our experts about saving water, or
converting your lawn into a garden. Print the tickets below, take them to the show,
and you'll get in free. These tickets do not include the price of parking. Print These
Free Tickets (PDF)
Please Take A Look at Our New CCWD Video
Our entertaining new video, "Always For You", shows how the Contra Costa Water
District provides clean, reliable water for you every day.
Mulch Coupons Save Water & Money
Mulch is the best way to save water in your garden. Our coupons will help you
save money while you save water.
Conservation & Gardening Calendar
Join the Garden RevolutionLarry Weaner, Author & Landscape Designer
September 29, 7 PM - 9 PMThe Gardens at Heather Farms
The Gardens at Heather Farm is partnering with The Garden Conservancy to bringcelebrated landscape designer, author and horticultural icon, Larry Weaner, to Walnut
Creek to share his insights on how to change your garden — and the environment — forthe better. On Thursday, September 29th, the program will feature a lecture by Mr.
Weaner, followed by a special reception and signing of his new book Garden Revolution(May 2016, Timber Press).
More Details
Great Soil = Great GardensOctober 1, 9:30 AM - 12 PM
ConcordImprove your success rate with new plantings and create a stable environment for your
gardens and landscapes to thrive — even through drought and other climate changes —by creating and maintaining a thriving soil food web.
More Details
Subscribe Share Past Issues Translate

9/27/2016 More Photos of Unique Lawn-to-Garden Projects
http://us8.campaign-archive1.com/?u=ea9717c4a61e3be1c9d2c4df8&id=ddf25a6f4d&e=6e38510889 4/5
Gardening with Nature in Mind
October 8, 10 AM - 3 PM Walnut Creek
Join renowned environmental educator Judy Adler in this in-depth tour of her half-acreWalnut Creek garden. Judy’s suburban garden, part farm, part classroom, part nursery,
and part nature preserve, features happy chickens, a rainwater harvesting system, apond, and many California native and/or pollinator-friendly plants. Judy’s was one of the
first gardens to be certified as a Backyard Wildlife Habitat by the National WildlifeFederation, and it is also certified as a habitat for pollinators by the Xerces Society.
More Details
Pacific Horticulture: Summit 2016: Changing Times, Changing GardensOctober 15 -16
Russian River Valley Join Pacific Horticulture for an autumn weekend in the bucolic Russian River Valley as weexplore the power of gardens in the context of their natural surroundings. This importantsummit features nationally renowned speakers from across the horticultural horizon and
offers visits to superb gardens that respect the region’s watershed. Summit 2016, thelatest in our Changing Times, Changing Gardens seminar series, is for anyone eager tosupport the environment within the context of engaging, lively and resilient landscapes
More Details
Worm Composting WorkshopOctober 15, 10 AM - 12 PM
Home in MartinezLearn how to compost by using a worm box. Worm boxes use vegetable waste and
produce an excellent material to use as potting soil.More Details
Contra Costa Home & Garden Show (Print Free Admission Tickets)October 21- 23
Concord PavilionWe have free tickets to the Fall Home and Garden Show. CCWD will have a booth there,
giving you a chance to talk to our water-saving experts. Just print out the PDF andpresent it at the gate. These tickets do not include the parking fee.
More Details
Watershed Approach to Landscaping ClassOctober 22, 9 AM - 5PM
OaklandWater conservation is no longer just about "losing the thirsty lawn" and reducing
irrigation. Join us to find out how to create drought resilient landscapes that conservewater, reduce pollution, invite habitat, and are just plain gorgeous!
More Details
Subscribe Share Past Issues Translate

9/27/2016 More Photos of Unique Lawn-to-Garden Projects
http://us8.campaign-archive1.com/?u=ea9717c4a61e3be1c9d2c4df8&id=ddf25a6f4d&e=6e38510889 5/5
Copyright © 2016 Contra Costa Water District, All rights reserved.
Want to change how you receive these emails?You can update your preferences or unsubscribe from this list
Subscribe Share Past Issues Translate

THIS PAGE INTENTIONALLY LEFT BLANK

Water Management Plan
APPENDIX J
Resolution No. 17-XX, a Resolution of the Board of Directors of the Contra Costa Water
District Authorizing Approval of the Contra Costa Water District Water Management Plan as Required by the United States Bureau of Reclamation

THIS PAGE INTENTIONALLY LEFT BLANK

RESOLUTION NO. 17-013
A RESOLUTION OF THE BOARD OF DIRECTORS OF THE CONTRA COSTA WATER DISTRICT AUTHORIZING APPROVAL
OF THE CONTRA COSTA WATER DISTRICT WATER MANAGEMENT PLAN
AS REQUIRED BY THE UNITED STATES BUREAU OF RECLAMATION
This page intentionally left blank until board approval