Embed Size (px)
Citation preview

Department ofAgriculture and Food
Report to the Commissioner of Soil and Land Conservation on the trend of the Western Australian pastoral resource base
October 2015

Report to the Commissioner of Soil and Land Conservation on the trend of the Western
Australian pastoral resource base
October 2015
D P Warburton and P W E Thomas
Copyright © Western Australian Agriculture Authority, 2015
October 2015
Recommended reference
Warburton, DP and Thomas, PWE 2015, ‘Report to the Commissioner of Soil and Land Conservation on the trend of the Western Australian pastoral resource base’, Department of Agriculture and Food, Perth.

Report on the condition of the pastoral resource base
iii
Contents
Summary .......................................................................................................................... v
1 Introduction ............................................................................................................. 1
1.1 Data sources and information provided ......................................................... 1
2 The Western Australian pastoral rangelands ....................................................... 8
2.1 The pastoral estate ........................................................................................ 8
2.2 The rangelands environment ......................................................................... 8
3 Seasonal conditions ............................................................................................. 11
3.1 Annual rainfall ............................................................................................. 11
3.2 Seasonal quality .......................................................................................... 12
4 Regional rangeland condition trend assessment ............................................... 21
4.1 Kimberley grasslands .................................................................................. 21
4.2 South of the Kimberley grasslands .............................................................. 22
4.3 Southern shrublands ................................................................................... 24
5 Management and rangeland condition interaction ............................................. 28
5.1 Kimberley .................................................................................................... 30
5.2 Grassland south of the Kimberley ................................................................ 32
5.3 Southern shrublands ................................................................................... 34
6 Rangeland condition ‘hotspots’........................................................................... 37
6.1 Northern rangeland ‘hotspots’...................................................................... 37
6.2 Southern rangeland ‘hotspots’ ..................................................................... 38
7 Discussion ............................................................................................................ 39
7.1 Kimberley LCDs .......................................................................................... 39
7.2 South of Kimberley grassland LCDs ............................................................ 39
7.3 Southern Rangeland LCDs .......................................................................... 40
7.4 General discussion ...................................................................................... 41
8 Conclusions .......................................................................................................... 45
References ..................................................................................................................... 46

Report on the condition of the pastoral resource base
v
Summary
This report provides a regional overview of the trend in the pastoral rangelands of Western Australia, based on data from the Bureau of Meteorology, the Annual Return of Livestock and Improvements (submitted annually by pastoral lessees) and the Western Australian Rangeland Monitoring System (WARMS), for which data are available for over 20 years. The report provides a context for assessment of the range condition and trend of individual pastoral leases within defined regions of the state, as well as providing a current assessment of the status of each of the regions’ rangelands, and the drivers (both seasonal and managerial) affecting this status and its trend. Such information allows assessment of the environmental status within the pastoral rangelands, and identifies differences among regions in that status.
The 2015 report updates changes in the Western Australian pastoral rangelands at the Land Conservation District (LCD) scale, providing information on seasonal quality, stock numbers and changes in the density/frequency of perennial shrubs and grasses. This report includes the most recently collected data where sufficient sites in an LCD have been reassessed.
Key Points
Seasonal conditions were generally favourable in the Kimberley and for grassland sites south of Kimberley during 2014 (with some regional differences). Seasonal conditions were more variable in the southern rangelands, 35% of WARMS sites were assessed as receiving below average seasonal conditions but this rises to almost 100% in several LCDs located in the west. This emphasises the extreme climate variability characteristic of the Southern Rangelands and places severe restrictions on management to avoid overgrazing.
Perennial grass frequency is generally stable in the Kimberley under high stocking rates due to continuing favourable seasons. ‘Hotspot’ analysis identifies locations where there is a moderate risk of land degradation through loss of palatable perennial grasses.
Reported stocking rates are high on south of the Kimberley grassland LCDs (relative to Present Carrying Capacity (PCC)). Rangeland condition trend at recent assessment is variable and long term decline is apparent in the Ashburton and Lyndon LCDs.
A divergent trend is apparent in the southern rangelands in terms of rangeland condition assessment and reported stocking rates (relative to PCC). High reported stocking rates in LCDs situated in the upper southern rangelands are being accompanied by serious declines in the density of desirable shrubs. Rangeland condition continues to decline on all sites irrespective of seasonal quality.
In contrast, stocking rates on LCDs situated in the lower southern rangelands are generally within PCC and rangeland condition trend generally correlates with seasonal quality.

Report on the condition of the pastoral resource base
1 Introduction
This report views rangeland condition as the ‘health’ of country. Good condition confers rangeland resilience to climatic events such as flood and drought, and can sustain a level of offtake by grazing. The importance of rangeland condition for profitable and productive pastoralism cannot be overstated. Rangeland in good condition not only provides pasture for livestock but also supports pastoral management by buffering against seasonal fluctuations in pasture quantity and quality.
This report provides a regional overview of the trend in range condition in the pastoral rangelands of Western Australia and discussion on processes driving this trend. While not providing information at the individual pastoral lease level, it:
Provides information on the status and trend of various regions of Western Australia for sustainable pastoralism and the data used to assess trend;
Assists in understanding the nature of the changes occurring, provides information on their scale, and attempts to separate the effects of management from changes that cannot be controlled.
Assists in identifying potential responses to changes in land management or policy to ensure sustainable land use.
1.1 Data sources and information provided
This report provides information on seasonal conditions and the condition of rangeland under pastoral lease, and discussion of the variables determinate of rangeland condition. In generating this information and discussion, it applies data obtained through the Western Australian Rangeland Monitoring System (WARMS), information collected by the Pastoral Lands Board (PLB) through the Annual Return of Livestock and Improvements and catalogued in DAFWA’s Pastoral Livestock database, and Bureau of Meteorology (BoM) observations.
1.1.1 Land Conservation Districts
Data and analysis are provided at the Land Conservation District (LCD) scale. Pastoral LCDs are established under section 22(1) of the Soil and Land Conservation Act. Pastoral LCDs are composed of pastoral leasehold land, defined conservation areas (which may have constituted part of the pastoral estate prior to their declaration as conservation areas) and other Crown land. There are 27 LCDs in the WA rangelands (Figure 1 and Table 1). This report deals only with that portion of each LCD that is or was pastoral land. It does not describe rangeland condition on Unallocated Crown Land (UCL).
The Kimberley grasslands are comprised of the Broome, Derby-West Kimberley, Halls Creek-East Kimberley and North Kimberley LCDs (Figure 1). In this region, the two major catchments of the Ord and the Fitzroy Rivers contain the majority of stations.
The Pilbara grasslands are comprised of the Ashburton, De Grey, East Pilbara and Roebourne LCDs (Figure 1). Pilbara LCDs generally have a reasonably uniform number of stations in each LCD.
This report considers the Southern Rangelands to be south of the Pilbara between the South-West Agricultural Area and the arid interior, with a boundary delineated by LCD. It includes the Gascoyne, Murchison, Goldfields and Nullarbor Regions. There are 19 LCDs in the Southern Rangelands (Figure 1).
The Southern Rangelands encompasses a large portion of the state; seasonal conditions and landscapes can be very variable, and land management differs markedly between

Report on the condition of the pastoral resource base
2
stations and LCDs. For the purposes of this report, the Southern Rangelands have been further split into upper and lower ‘zones’ based on common characteristics such as rainfall, seasonality of rainfall, land type and land management issues. These zones are comprised of the following LCDs:
Upper southern rangelands - LCDs of Lyndon, Gascoyne-Wooramel, Upper Gascoyne, Gascoyne-Ashburton Headwaters, Meekatharra and Wiluna.
Lower southern rangelands - LCDs of Cue, Kalgoorlie, Mt Magnet, Murchison, North-eastern Goldfields, Nullarbor - Eyre Highway, Sandstone, Shark Bay and Yalgoo.
Note: A small number of minor LCDs situated at the agricultural/pastoral interface (Binnu, Perenjori, Mt Marshall and Yilgarn) are not identified in these zones. These LCDs are relatively small and contain few WARMS sites. Moreover, none present significant land management issues on the basis of the available information.

Report on the condition of the pastoral resource base
Table 1 Western Australian pastoral Land Conservation Districts (LCDs)
LCD
NUMBER
LCD LCD
CODE
LCD area (ha) Pastoral
stations
% of LCD as
pastoral lease
1 North Kimberley NTK 11 276 364 14 33
2 Halls Creek - East
Kimberley
HAL 8 753 170 36 95
3 Derby - West
Kimberley
DWK 7 518 115 32 98
4 Broome BRM 2 582 365 9 63
5 De Grey DEG 5 082 429 15 76
6 Roebourne ROE 5 177 240 18 59
7 East Pilbara EAP 4 831 201 13 69
8 Ashburton ASH 6 152 959 16 62
9 Gascoyne-Ashburton
Headwaters
GAH 6 906 425 16 72
10 Upper Gascoyne UPG 4 181 585 18 78
11 Wiluna WIL 33 705 599 18 13
12 Lyndon LYN 3 715 081 21 90
13 Gascoyne-Wooramel GAW 1 653 843 16 117
14 Shark Bay SBY 2 667 947 13 56
15 Murchison MUR 4 475 451 26 93
16 Meekatharra MEK 3 211 619 20 112
17 Cue CUE 1 257 263 8 71
18 Mount Magnet MTM 1 223 568 17 135
19 Sandstone SAN 3 330 243 12 72
20 Yalgoo YAL 3 020 649 19 81
21 Mount Marshall MML 1 017 906 2 28
22 Binnu BIN 1 216 520 5 17
23 Perenjori PER 782 248 3 24
24 North - eastern
Goldfields
NEG 3 936 601 29 161
25 Kalgoorlie KAL 6 092 703 22 73
26 Yilgarn YLG 3 057 623 6 10
27 Nullarbor - Eyre
Highway
NUE 6 247 761 20 97

Report on the condition of the pastoral resource base
4
Figure 1 Land Conservation Districts in the WA rangelands (see Table 1)

Report on the condition of the pastoral resource base
1.1.2 WARMS
WARMS provides information on rangeland condition trend in the pastoral rangelands at a regional or district scale, not the lease scale. It does this through a representative network of point-based rangeland monitoring sites on which soil surface and vegetation attributes are recorded and regularly re-assessed. Site installation began in 1993 and was completed in 1999. There are 1608 WARMS sites; 625 are ‘grassland’ sites and 983 ‘shrubland’ sites.
Grassland sites are reassessed on a 3 year schedule and shrubland sites on a 5 year schedule. The completed reassessment of all grassland or shrubland sites is referred to as a WARMS ‘epoch’ and the change between 2 epochs is referred to as a WARMS ‘cycle’. Analysis of rangeland condition trend is carried out on the completion of each epoch.
Tables 2 and 3 below provide the WARMS assessment years for all sites by LCD. Epoch 7 of grassland site assessment concluded in 2014 providing a full dataset for change analysis for WARMS grassland cycle 6 which is applied in this report.
The last completed assessment epoch in the shrublands (epoch 3) occurred in 2010; epoch 4 will conclude in 2015. Shrubland assessment dataset used for this report is complete for all LCDs except Yalgoo.
Table 2 Year of WARMS assessment (Epochs 6 and 7) grassland monitoring sites
Cycle 6
LCD NUMBER LCD Epoch 6 Epoch 7
1 North Kimberley 2009 2012
2 Halls Creek - East Kimberley 2009,10,11 2012,13,14
3 Derby - West Kimberley 2010, 2011 2013, 2014
4 Broome 2009 2012
5 De Grey 2009, 2010 2013
6 Roebourne 2010 2013
7 East Pilbara 2011 2014
8 Ashburton 2009 2012
12 Lyndon 2011, 2012 2014

Report on the condition of the pastoral resource base
6
Table 3 Year of WARMS assessment (Epochs 3 and 4) shrubland monitoring sites
Cycle 3
LCD NUMBER LCD Epoch 3 Epoch 4
8 Ashburton 2006 2012
9 Gascoyne -Ashburton Headwaters 2006, 2007 2012, 2013
10 Upper Gascoyne 2006 2011
11 Wiluna 2005, 2006 2010, 2011
12 Lyndon 2006 2011
13 Gascoyne-Wooramel 2006, 2008 2013, 2015
14 Shark Bay 2008 2014
15 Murchison 2008, 2009 2013, 2014
16 Meekatharra 2007, 2009 2012, 2014
17 Cue 2007 2012
18 Mount Magnet 2008 2013
19 Sandstone 2008 2014
20 Yalgoo 2009, 2010 2015
21 Mount Marshall 2010 2015
22 Binnu 2008 2013
23 Perenjori 2010 2015
24 North-eastern Goldfields 2006 2010, 2011
25 Kalgoorlie 2005-06-07 2010, 2012
26 Yilgarn 2010 -
27 Nullarbor - Eyre Highway 2007-08-09 2012-13-14
At WARMS sites, data of all perennial species present at monitoring sites is collected. WARMS differentiates between those species that are desirable, i.e productive and palatable to grazing animals, and those that are not. As the frequency of desirable perennial grasses or the density of desirable shrubs declines in a pasture, so does its productivity for pastoralism. If this decline leads to increased amounts of bare ground and/or annual herbage, then rangeland stability and resilience will also have declined. If desirable species are being replaced by undesirable perennials, while these may serve to maintain the functionality of a landscape, the pasture’s productivity for grazing will still have declined.
Grasslands of the Kimberley and Pilbara are comprised of perennial hummock (mainly spinifex) or tussock grasses, with a variable woody overstorey. The frequency of perennial grasses is recorded in WARMS. Frequency is a measure of the presence of perennial grass at a site, expressed as a percentage (Watson et al, 2007). WARMS data may not detect improvement following favourable seasons in landscapes already supporting high grass frequencies.
In the Pilbara, vegetation changes from grasslands common in the Kimberley to a semi-arid mixed woodland (mulga or eucalypt) with a shrub-dominated understorey. This region is sometimes referred to as the ‘transition zone’ between grasslands and shrublands. The transition between grasses and shrubs is gradual requiring a combination of both grassland and shrubland monitoring sites to assess rangeland condition. Rangeland in this transition zone can change from a shrubland to a grassland or vice versa. Where a WARMS site displays a permanent change in type, it is necessary to alter the monitoring technique accordingly.

Report on the condition of the pastoral resource base
In the shrublands, pastoral productivity is driven by a combination of palatable shrubs, perennial grasses and ephemerals. Rangeland condition is assessed in terms of the composition and density of perennial shrubs (Watson et al, 2007). Unlike grass frequency, shrub density is an absolute measure of the number of shrubs at a site. Shrub density has no practical upper limit.

Report on the condition of the pastoral resource base
8
2 The Western Australian pastoral rangelands
2.1 The pastoral estate
Western Australia’s rangelands cover 87% of the state. Pastoral leases are issued over approximately half of the rangelands (870,544 km 2) with the remainder consisting of UCL, and land vested for conservation and indigenous purposes. The rangeland over which pastoral leases are issued is referred to Western Australia’s ‘pastoral estate’.
As at 30 June 2015, the pastoral estate comprised 453 registered ‘stations’ on 508 pastoral leases. There were 152 stations situated in the Kimberley and Pilbara and 301 stations in the southern rangelands including nine stations in the South West Land Division.
Stations are predominantly operated as pastoral businesses though ownership might be as an individual, family or under a corporate structure. Recent decades have witnessed the emergence of entities who acquire pastoral leases for reasons other than pastoralism. These might be resource companies for purpose of resource security, Indigenous groups for cultural and lifestyle reasons, and philanthropic groups for conservation.
2.2 The rangelands environment
Rangelands worldwide are typically those lands that have proven unsuitable for development as farming land or for close settlement as they experience a hostile climate, unreliable rainfall and/or remoteness. As in the Western Australian pastoral estate, rangelands often support extensive livestock grazing of native pastures.
Rangelands in Western Australia exhibit considerable diversity, ranging from tropical savannah woodlands in the Kimberley to arid shrublands in the south. The vegetation indigenous to a region has evolved over millennia to best exploit the prevailing climate and soils of that region.
Figure 2 overlays rangeland type with climate. The tropical savannahs of the Kimberley experience a monsoonal climate characterised by a defined wet season and warm, dry winters. The tussock and hummock grasslands of the southern Kimberley and a large portion of the Pilbara is also driven by defined wet seasons between December and April though rainfall is lower and may occur at other times of the year.

Report on the condition of the pastoral resource base
Figure 2 Climate and Rangeland Classification Source: BoM
In contrast to northern grasslands, southern shrublands are significantly more arid and support an increasing proportion of drought evading shrubs and trees. Summers remain warm to hot and winters are cool. Southernmost regions fringing the agricultural zone receive some winter rain from remnants of southern frontal weather systems. Increasing aridity south and east causes rangeland to transition from grassland or shrubland to hot and dry desert in the eastern Pilbara, Goldfields and even reaching to the coast in the Gascoyne and north Pilbara.
Increasing variability of rainfall is a defining characteristic of rangeland south of the Kimberley. The BoM evaluates rainfall variability in terms of the difference between a ‘wet’ year (90th percentile rainfall) and a ‘dry’ year (10th percentile rainfall) expressed as a proportion of the average rainfall (50th percentile).
Report on the condition of the pastoral resource base
10
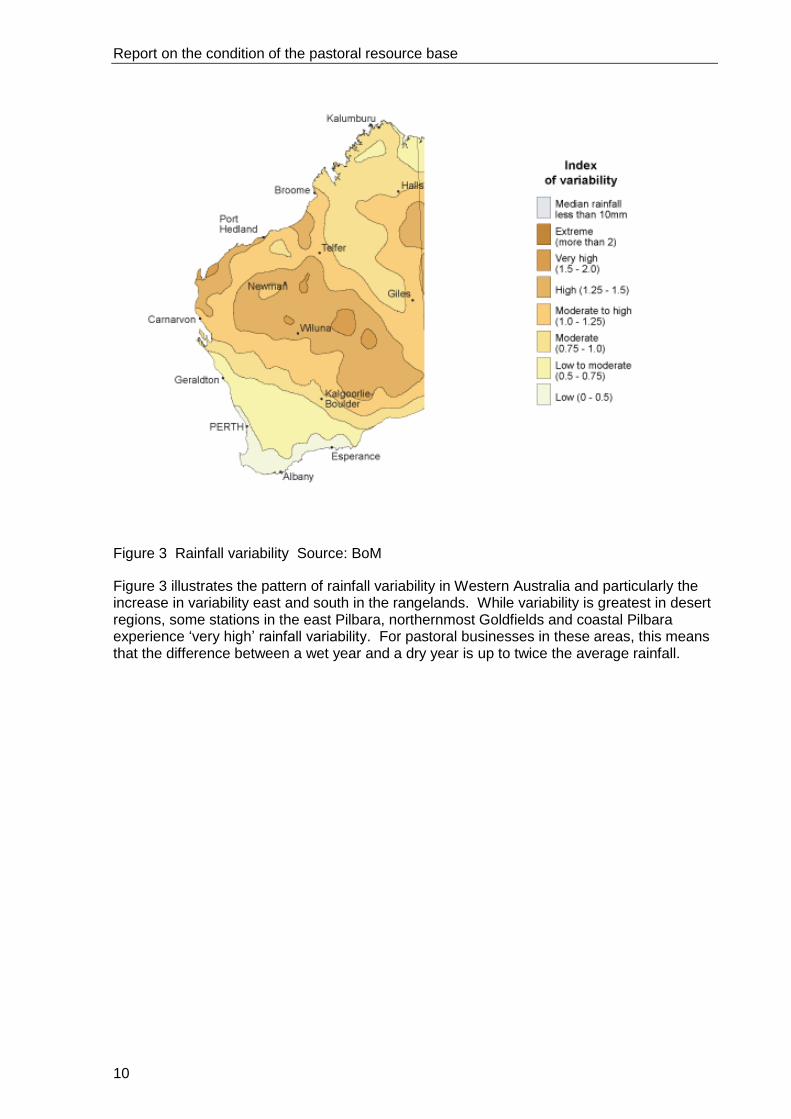
Figure 3 Rainfall variability Source: BoM
Figure 3 illustrates the pattern of rainfall variability in Western Australia and particularly the increase in variability east and south in the rangelands. While variability is greatest in desert regions, some stations in the east Pilbara, northernmost Goldfields and coastal Pilbara experience ‘very high’ rainfall variability. For pastoral businesses in these areas, this means that the difference between a wet year and a dry year is up to twice the average rainfall.

Report on the condition of the pastoral resource base
3 Seasonal conditions
Soil available moisture is the most important driver of plant recruitment and growth, and therefore rangeland condition. Soil moisture is primarily a function of rainfall although the intensity of rainfall events, soil types, evaporation rates, the extent of vegetative cover and rangeland condition all influence a landscape’s capacity to capture rainfall. While land managers cannot control the amount of rainfall they receive though they have some influence over the level of rainfall infiltration.
Rainfall seasonality is also significant. The northern grasslands generally experience rainfall during a summer ‘wet’ or growing season when most vegetative growth occurs (Figure 2). Plants are less adapted to respond to dry season rainfall which can degrade the nutritive value of dry standing pasture if it occurs late in the dry.
Rainfall in the lower Pilbara and southern rangelands is less seasonal (may occur at any time of the year) and more variable. Extended periods without rain are common and vegetation is ‘drought evading’, as plants senesce or become dormant during dry periods. Summer rainfall events are typically more intense (than winter rain) and evaporation rates are very high. Subsequently, winter rainfall is important for shrub recruitment and growth in these areas.
3.1 Annual rainfall
In 2014, total rainfall recordings ranged from greater than 1,200mm in the north and east Kimberley (1,253mm at Kununurra) to less than 150mm at numerous locations in the western Gascoyne and Murchison (Figure 4). Carnarvon recorded only 91mm in 2014. Figure 4 illustrates this contrast in rainfall experienced across different regions of the rangelands.
Figure 4 Rainfall totals (mm) 2014 Source BoM
Report on the condition of the pastoral resource base
12
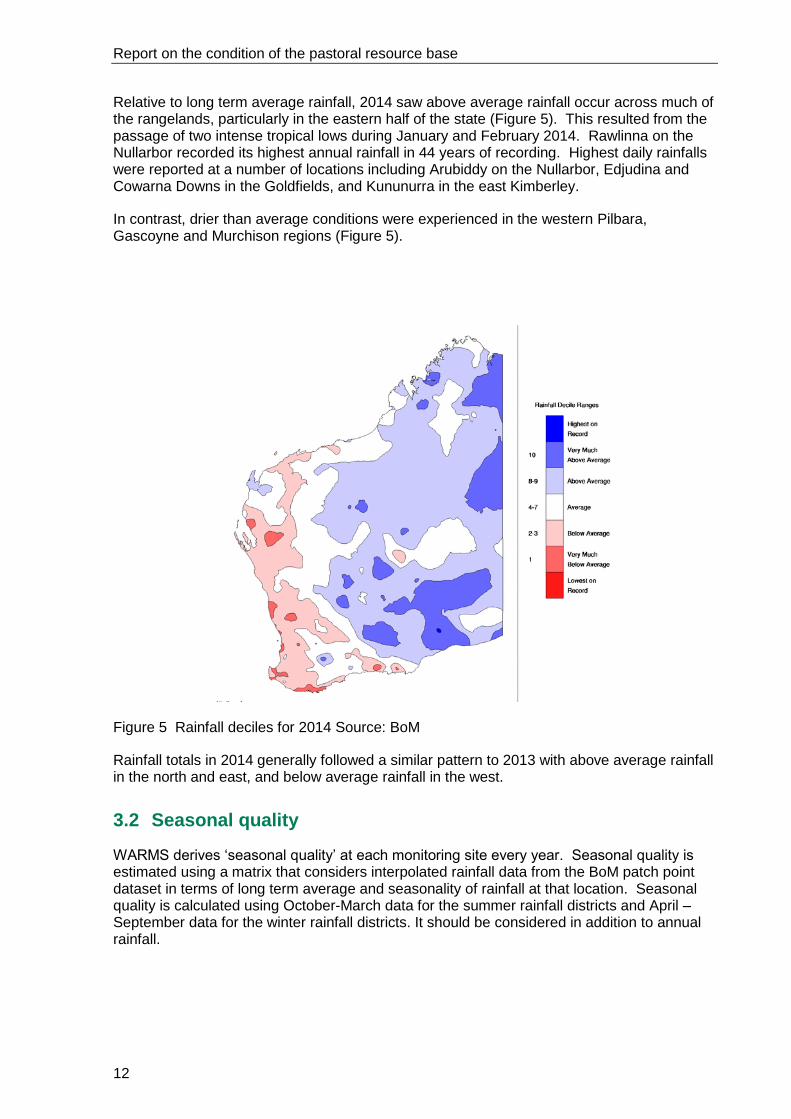
Relative to long term average rainfall, 2014 saw above average rainfall occur across much of the rangelands, particularly in the eastern half of the state (Figure 5). This resulted from the passage of two intense tropical lows during January and February 2014. Rawlinna on the Nullarbor recorded its highest annual rainfall in 44 years of recording. Highest daily rainfalls were reported at a number of locations including Arubiddy on the Nullarbor, Edjudina and Cowarna Downs in the Goldfields, and Kununurra in the east Kimberley.
In contrast, drier than average conditions were experienced in the western Pilbara, Gascoyne and Murchison regions (Figure 5).
Figure 5 Rainfall deciles for 2014 Source: BoM
Rainfall totals in 2014 generally followed a similar pattern to 2013 with above average rainfall in the north and east, and below average rainfall in the west.
3.2 Seasonal quality
WARMS derives ‘seasonal quality’ at each monitoring site every year. Seasonal quality is estimated using a matrix that considers interpolated rainfall data from the BoM patch point dataset in terms of long term average and seasonality of rainfall at that location. Seasonal quality is calculated using October-March data for the summer rainfall districts and April – September data for the winter rainfall districts. It should be considered in addition to annual rainfall.
Report on the condition of the pastoral resource base
3.2.1 Northern grasslands
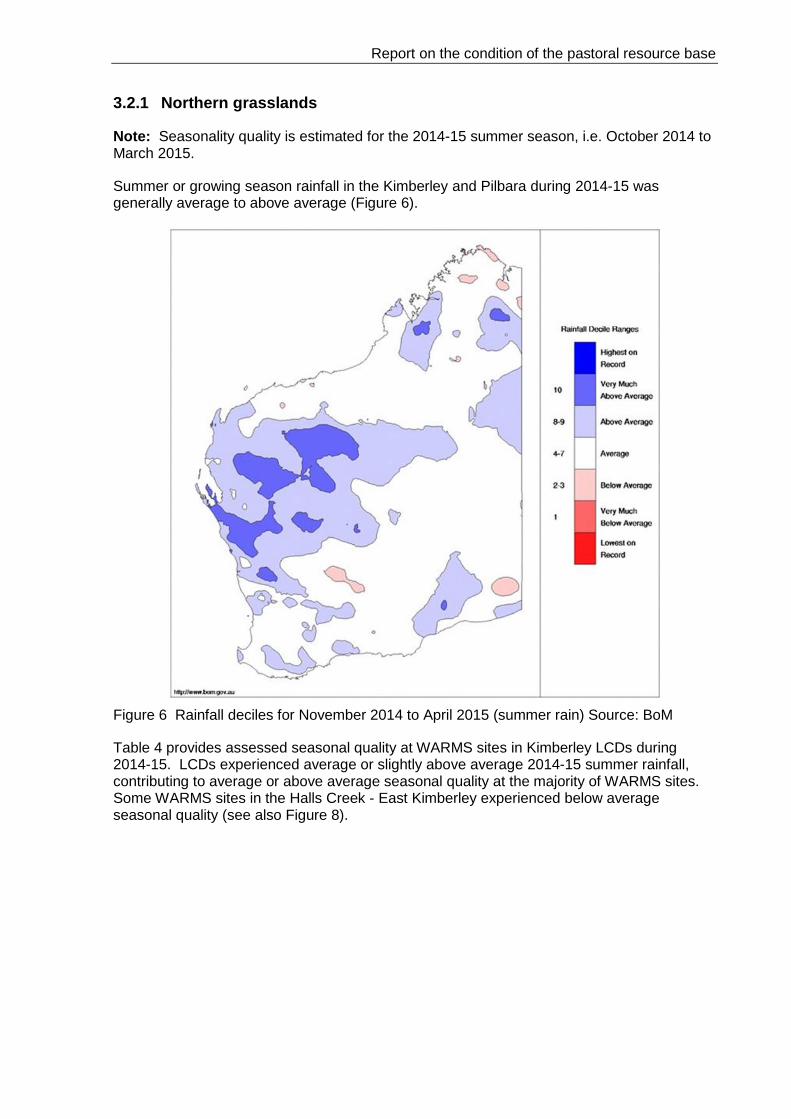
Note: Seasonality quality is estimated for the 2014-15 summer season, i.e. October 2014 to March 2015.
Summer or growing season rainfall in the Kimberley and Pilbara during 2014-15 was generally average to above average (Figure 6).
Figure 6 Rainfall deciles for November 2014 to April 2015 (summer rain) Source: BoM
Table 4 provides assessed seasonal quality at WARMS sites in Kimberley LCDs during 2014-15. LCDs experienced average or slightly above average 2014-15 summer rainfall, contributing to average or above average seasonal quality at the majority of WARMS sites. Some WARMS sites in the Halls Creek - East Kimberley experienced below average seasonal quality (see also Figure 8).

Report on the condition of the pastoral resource base
14
Table 4 Seasonal quality 2014-15, Kimberley LCDs
Seasonal quality Proportion
of long-term summer rainfall
%
Average long-term
(115 years) summer rainfall
mm LCD
Above average
%
Average
%
Below average
%
Broome 13 87 0 94 463
Derby - West Kimberley 51 49 0 119 508
Halls Creek - East Kimberley 50 42 8 108 536
North Kimberley 0 100 0 97 787
Kimberley LCDs overall 40 58 2
The assessed seasonal quality at WARMS grassland sites south of the Kimberley (the Pilbara and some sites in the southern rangelands) during 2014-15 is presented in Table 5. This analysis shows that summer rainfall in the Pilbara was more variable than in the Kimberley. The De Grey LCD received only 76% of its average summer rainfall whilst Lyndon received 179%. Nonetheless, the great majority (94%) of sites in the Pilbara were assessed as receiving average or above average seasonal quality.
Table 5 Seasonal quality 2014-15, south of Kimberley grassland LCDs
Seasonal quality Proportion
of long-term summer rainfall
%
Average long-term
(115 years) summer rainfall
mm LCD
Above average
%
Average
%
Below average
%
Ashburton 60 40 0 131 177
De Grey 0 98 2 76 249
East Pilbara 77 23 0 145 195
Lyndon 92 8 0 179 126
Roebourne 14 68 18 85 220
South of Kimberley grasslands overall 38 56 6

Report on the condition of the pastoral resource base
Southern rangelands
Growing season rainfall in 2014 was variable across the southern rangelands (Figure 7). Two tropical low pressure systems deposited extensive rain throughout the southern rangelands and interior separately in January and February with many locations recording their highest daily and annual rainfall totals.
However, this wet summer was followed by average or often below average winter (growing season) rainfall (Figure 7). The situation would have been significantly worse if not for rain that fell at the very end of the season in the coastal Gascoyne, Murchison, Goldfields and Nullarbor. Areas in the inland Gascoyne and Murchison did not experience much rain from this system and subsequently experienced a very much below average winter season.
Across much of the southern rangelands, spring (September to November) is generally the period that receives the least rain. However, 2014 saw significant falls across much of the region including those areas that had experienced a very dry winter.
Figure 7 Rainfall deciles for April to September 2014 (winter rain) Source: BoM
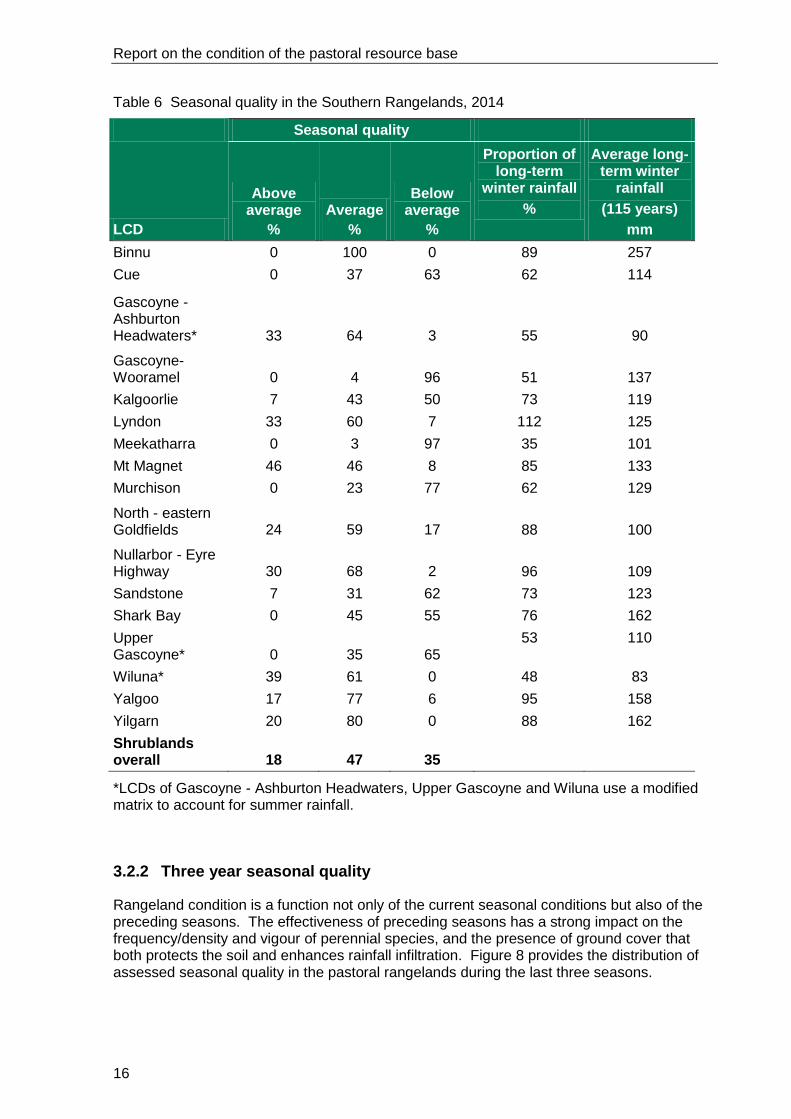
The assessed seasonal quality at WARMS shrubland sites for all of the southern rangelands during 2014 was highly variable (Table 6). LCDs such as Gascoyne-Wooramel, Meekatharra and Murchison experienced predominantly below average seasonal quality (96%, 97% and 77% below average respectively). In contrast, LCDs in the north, east and south experienced generally average or above average seasonal quality – Gascoyne - Ashburton Headwaters 97% average and above average, Wiluna 100% and Nullarbor - Eyre Highway 98%.
Report on the condition of the pastoral resource base
16
Table 6 Seasonal quality in the Southern Rangelands, 2014
Seasonal quality
LCD
Above average
%
Average
%
Below average
%
Proportion of long-term
winter rainfall
%
Average long-term winter
rainfall
(115 years)
mm
Binnu 0 100 0 89 257
Cue 0 37 63 62 114
Gascoyne -Ashburton Headwaters* 33 64 3
55
90
Gascoyne- Wooramel 0 4 96
51
137
Kalgoorlie 7 43 50 73 119
Lyndon 33 60 7 112 125
Meekatharra 0 3 97 35 101
Mt Magnet 46 46 8 85 133
Murchison 0 23 77 62 129
North - eastern Goldfields 24 59 17
88
100
Nullarbor - Eyre Highway 30 68 2
96
109
Sandstone 7 31 62 73 123
Shark Bay 0 45 55 76 162
Upper Gascoyne* 0 35 65
53 110
Wiluna* 39 61 0 48 83
Yalgoo 17 77 6 95 158
Yilgarn 20 80 0 88 162
Shrublands overall 18 47 35
*LCDs of Gascoyne - Ashburton Headwaters, Upper Gascoyne and Wiluna use a modified matrix to account for summer rainfall.
3.2.2 Three year seasonal quality
Rangeland condition is a function not only of the current seasonal conditions but also of the preceding seasons. The effectiveness of preceding seasons has a strong impact on the frequency/density and vigour of perennial species, and the presence of ground cover that both protects the soil and enhances rainfall infiltration. Figure 8 provides the distribution of assessed seasonal quality in the pastoral rangelands during the last three seasons.

Report on the condition of the pastoral resource base
The continued run of favourable seasons in the Kimberley and, to a lesser extent, the north and east Pilbara is clearly evident. Conditions in these areas would be expected to be favourable for recruitment and growth of perennial grasses, expressed as a stable or improving trend in rangeland condition at WARMS monitoring sites.
In contrast to the Kimberley and upper Pilbara, Figure 8 illustrates the succession of poor seasons that have been experienced in areas of the Gascoyne and Murchison, and the more variable seasons elsewhere in the southern rangelands and lower Pilbara. In these areas, pasture production and quality will likely have been poor, and rangeland condition would be at risk if grazing pressure had not been commensurably reduced. A declining trend in rangeland condition would be expected at monitoring sites in these areas.

Report on the condition of the pastoral resource base
18
Figure 8 Seasonal quality assessed for rangeland LCDs
Seasonal quality is calculated from interpolated long term rainfall data at the WARMS site location.
In the northern rangelands summer rainfall is considered more effective for vegetation growth and conversely in the southern rangelands winter rainfall is considered more effective for vegetation growth. (Watson et al 2007)

Report on the condition of the pastoral resource base
3.2.3 NDVI
Normalised Difference Vegetation Index (NDVI) is a vegetative response to rainfall and is therefore an additional measure of seasonal quality. DAFWA analyses MODIS NDVI data to give a calculated greening response for each year during the last decade (see Appendix 1). This analysis is based on the difference between the observed least green (driest) time during the year and the most green, and ranked against long term observations. Greater than average greening response (vegetative growth) is coloured dark green, average response light green, below average response tan, and very much below average response (little vegetative growth) dark brown.
While greening response is suggestive of the amount of forage produced, it cannot discern species and therefore, is not of itself a reliable measure of feed-on-offer. However, below average greening response indicates a very strong likelihood of forage deficiency at that location.
Figure 9 below shows the statewide greening response during 2012, 2013, 2014, plus 2015 as at August. This analysis correlates with the WARMS seasonal quality observations in Figure 8. A strong greening response is recorded in all recent years over the majority of the Kimberley and northern Pilbara. A similarly average or above average response is observed in most of the southern portion of the southern rangelands although the Nullarbor showed a poor response in 2012 and 2013.
The situation is less favourable in the west with a below average response observed in 2012, 2013 and 2014 in areas approximating the Ashburton, Gascoyne-Wooramel, Upper Gascoyne and Murchison LCDs. Significantly, this follows widespread below average greening in the Gascoyne and Pilbara in 2009 and 2010.
Favourable seasonal conditions during early 2015 appear to have stimulated considerable growth in these areas.

Report on the condition of the pastoral resource base
20
2012
2013
2014
2015
Figure 9 Seasonal Greenness response based on MODIS NDVI 2012-2015 (August 2015)
Report on the condition of the pastoral resource base
4 Regional rangeland condition trend assessment
Rangeland condition and rangeland condition trend can be measured (assessed). A stable or improving trend in rangeland condition is generally accepted as indicative of ecological sustainability, though it is recognised that under certain circumstances (such as extended rainfall deficiency) a decline in rangeland condition is not indicative of a loss of sustainability.
4.1 Kimberley grasslands
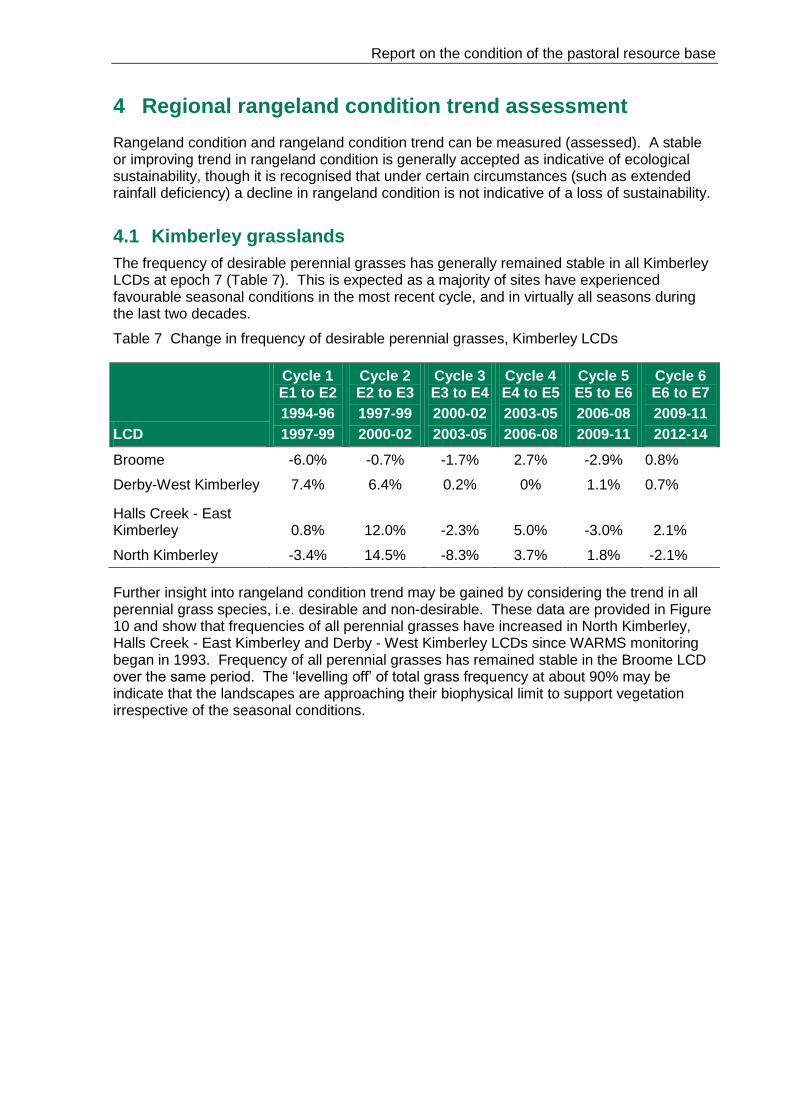
The frequency of desirable perennial grasses has generally remained stable in all Kimberley LCDs at epoch 7 (Table 7). This is expected as a majority of sites have experienced favourable seasonal conditions in the most recent cycle, and in virtually all seasons during the last two decades.
Table 7 Change in frequency of desirable perennial grasses, Kimberley LCDs
LCD
Cycle 1 E1 to E2
1994-96
1997-99
Cycle 2 E2 to E3
1997-99
2000-02
Cycle 3 E3 to E4
2000-02
2003-05
Cycle 4 E4 to E5
2003-05
2006-08
Cycle 5 E5 to E6
2006-08
2009-11
Cycle 6 E6 to E7
2009-11
2012-14
Broome -6.0% -0.7% -1.7% 2.7% -2.9% 0.8%
Derby-West Kimberley 7.4% 6.4% 0.2% 0% 1.1% 0.7%
Halls Creek - East Kimberley 0.8% 12.0% -2.3% 5.0% -3.0%
2.1%
North Kimberley -3.4% 14.5% -8.3% 3.7% 1.8% -2.1%
Further insight into rangeland condition trend may be gained by considering the trend in all perennial grass species, i.e. desirable and non-desirable. These data are provided in Figure 10 and show that frequencies of all perennial grasses have increased in North Kimberley, Halls Creek - East Kimberley and Derby - West Kimberley LCDs since WARMS monitoring began in 1993. Frequency of all perennial grasses has remained stable in the Broome LCD over the same period. The ‘levelling off’ of total grass frequency at about 90% may be indicate that the landscapes are approaching their biophysical limit to support vegetation irrespective of the seasonal conditions.

Report on the condition of the pastoral resource base
22
Figure 10 Average perennial grass frequencies (all grasses), Kimberley LCDs, Epoch 1 to Epoch 7
4.2 South of the Kimberley grasslands
The recorded frequency of desirable perennial grasses south of the Kimberley is variable (Table 8). Ashburton and Lyndon LCDs recorded significant declines in the frequency of desirable grasses whilst De Grey, Roebourne and especially East Pilbara (18.4%) exhibited increases. These results highlight that grassland sites south of the Kimberley exhibit changes of greater magnitude; often exceeding 10% (up and down).
Table 8 Change in desirable grass frequency, south of Kimberley LCDs
LCD Cycle 1
(E1 to E2) Cycle 2
(E2 to E3) Cycle 3
(E3 to E4) Cycle 4
(E4 to E5) Cycle 5
(E5 to E6) Cycle 6
(E6 to E7)
Ashburton 8.3% -4.6% - - -4.4% -6.8%
De Grey 8.0% -2.0% -3.0% -8.8% 6.9%
East Pilbara -3.4% -2.6% -5.9% 18.4%
Lyndon 4.3% -21.8% -3.4% 4.1% -10.3%
Roebourne 15.7% -20.4% 9.0% -4.4% 5.9%
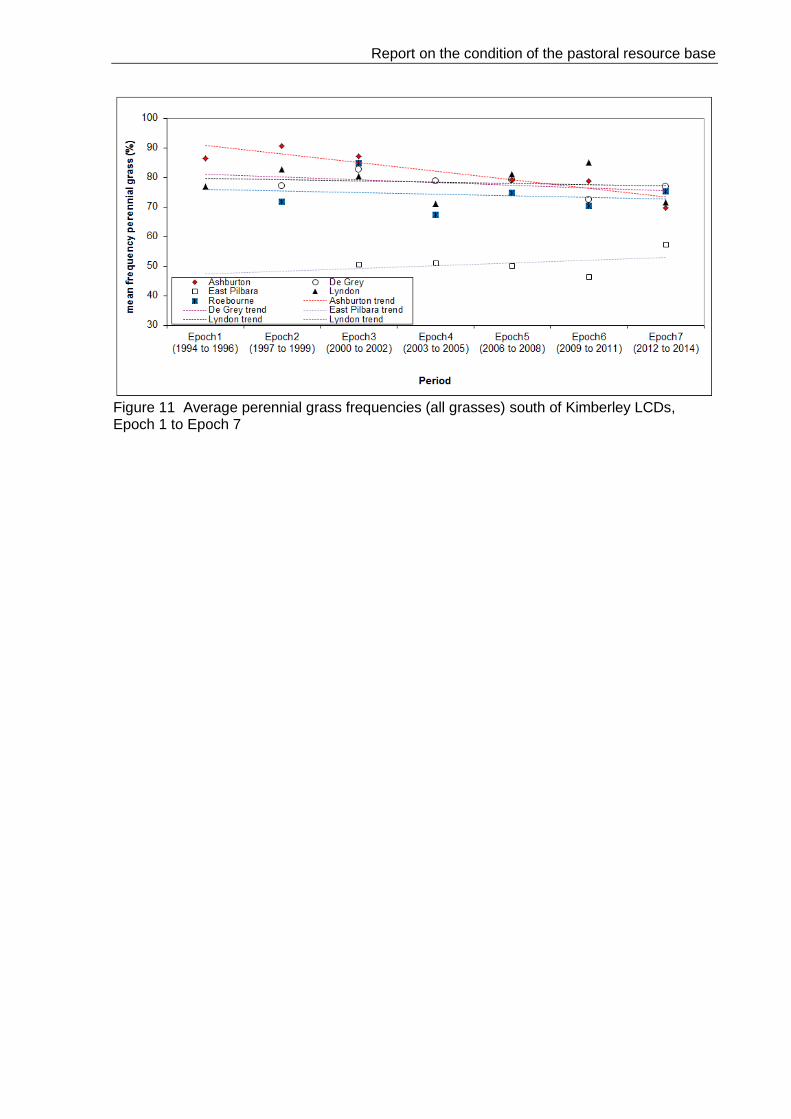
Figure 11 shows the frequency of all perennial grasses (desirable and non-desirable) on WARMS grassland sites south of the Kimberley. The trend in Roebourne, De Grey, East Pilbara and Lyndon LCDs is of generally stable perennial grass frequency when applied over multiple WARMS epochs, though changes in frequency between cycles tends to be greater than in the Kimberley. Given desirable grass frequency has declined in the Lyndon LCD, these data are suggestive that desirable perennial grasses are being displaced by undesirable species. A 23% decline in the frequency of all perennial grasses (90% to 69%) since 1997 may be indicative of a decline in rangeland condition in the Ashburton LCD.
Report on the condition of the pastoral resource base
Figure 11 Average perennial grass frequencies (all grasses) south of Kimberley LCDs, Epoch 1 to Epoch 7

Report on the condition of the pastoral resource base
24
4.3 Southern shrublands
Table 9 lists monitoring assessment to July 2015 of shrubland sites across the southern rangelands. This assessment is grouped according to the estimated seasonal quality which allows greater insight into apparent rangeland condition trend in the shrublands.
Table 9 Change in desirable shrub numbers between Epoch 3 (2005 to 2009) and Epoch 4 (2010 to July 2015), Southern Rangelands. (LCDs reassessed to July 2015)
LCD
Seasonal quality
Above average
%
Average
%
Below average
%
Cue 2.1 4.4 n.a.
Gascoyne - Ashburton Headwaters -28.4 -26.3 n.a
Gascoyne-Wooramel n.a -27.6 -22.0
Kalgoorlie -11.9 -10.4 -22.5
Lyndon n.a. -19.9 -28.8
Meekatharra -12.6 -28.2 -47.5
Mount Magnet 24.5 27.8 n.a.
Mount Marshall n.a. -8.1 15.2
Murchison -12.1 -12.3 -14.7
North-eastern Goldfields n.a. -6.3 -22.1
Nullarbor - Eyre Highway 1.3 -6.9 0.8
Sandstone 20.3 8.9 -19.3
Shark Bay n.a. -16.2 -8.8
Upper Gascoyne -11.8 -9.0 -35.9
Wiluna -19.4 -34.7 -44.0
Yalgoo** 69.8 21.4 -24.7
Shrublands -4.8 -10.3 -24.1
** 67% of Yalgoo sites assessed to July 2015
n.a this category of seasonal quality not experienced in this LCD for the WARMS assessment period.
Monitoring site assessments from the third WARMS shrubland cycle (between epochs 3 and 4) show a declining density of desirable shrubs across the southern rangelands (Tables 9 and 10, and Figure 12). Desirable shrub densities are continuing to decline even where sites experience above average seasonal quality (-4.8%, -10.3% and -24.1% for above average, average and below average seasonal quality respectively). This trend is most apparent in the LCDs of Gascoyne-Ashburton Headwaters, Kalgoorlie, Murchison, North-eastern Goldfields, Shark Bay, Upper Gascoyne and Wiluna. The decline in desirable shrubs in the Lyndon LCD is compounded by the parallel 10.3% decline in grass frequency observed in this LCD during WARMS grassland cycle 6.
Data of total shrub density (i.e. desirable, intermediate and undesirable shrubs) also exhibits an average decline of -7.6% in the southern rangelands from epoch 3 to epoch 4 (Table 10). The decline is greater (-17.8%) where seasonal quality was below average with a minor increase (1.6%) assessed at sites where seasonal quality was above average. Comparing

Report on the condition of the pastoral resource base
this trend with the aforementioned trend in desirable shrub numbers over the same period and at the same sites indicates that undesirable shrubs (woody weeds) are forming a higher proportion of rangeland plant communities.
Table 10 Change in all shrub numbers between Epoch 3 (2005 to 2009) and Epoch 4 (2010 to July 2015), Southern Rangelands. (LCDs reassessed to July 2015)
Seasonal quality Change: desirable shrubs Change: all shrubs
Overall -13.0% -7.6%
Above average -4.8% 1.6%
Average -10.3% -7.0%
Below average -24.1% -17.8%
Preliminary assessments of the Southern Goldfields rangeland survey suggest that a significant recruitment of woody weeds including Acacia spp, Eremophila spp and Senna spp is occurring to the detriment of desirable shrubs such as Maireana spp and Atriplex spp.
Photo 1 is of a WARMS monitoring site in a common mulga shrubland situation. The site is exhibiting a declining trend typical of that being assessed across the southern rangelands. Between May 2006 and May 2010, the number of desirable shrubs within this site decreased from 92 (1,530 plants per hectare) to 19 (320 plants per hectare).
May 2006 (epoch 3) – 92 desirable shrubs (1530 plants per ha)
May 2010 (epoch 4) – 19 desirable shrubs (320 plants per ha)
Photo 1 Rangeland decline in mulga shrubland
Another trend apparent in certain landscapes in the southern rangelands is the complete loss of the shrub component and its replacement by short season perennial grasses. The Nullarbor rangeland survey identified this event in certain locations where chenopod shrubs had been completely replaced by speargrass (Austrostipa spp), and it is also apparent in WARMS data from the Gascoyne. Photo 2 shows a WARMS shrubland site in the Gascoyne-Wooramel LCD where a silver saltbush pasture has transitioned to a buffel grass pasture.

Report on the condition of the pastoral resource base
26
2002 – 1600 silver saltbush per ha
2008 – 1000 silver saltbush per ha
2015 - 0 silver saltbush
Buffel grass 56% frequency
Photo 2 Shrubland to grassland transition
Transition from shrubland to grassland may occur as a consequence of a range of factors including fire, flooding or grazing. Landscape functionality and productivity for grazing of the resultant state is likely to be different to that of the former state, particularly in terms of its drought resilience. However of greater significance is that the new state represents a stable system which is unlikely to return to its original state within a human lifetime under reasonable management (Watson and Novelly 2012).
Figures 12 and 13 illustrate a marked difference in rangeland condition trend between LCDs in the upper southern rangelands and those in the lower southern rangelands. Since monitoring began desirable plant populations have declined in all upper LCDs; 36% in Gascoyne-Ashburton Headwaters, 28% in Gascoyne-Wooramel and 26% in Lyndon LCDs. This decline in rangeland condition cannot be linked to any particularly adverse sequence of seasons.
In contrast, the trend in rangeland condition on lower LCDs is more variable. Virtually half of the desirable plants (-45%) have been lost on Murchison LCD WARMS sites since monitoring in this LCD began in 1998. Yet in the adjoining LCDs of Cue and North-eastern Goldfields, the trend in desirable shrub densities was either stable or mixed over the same period. Desirable shrub populations in the LCDs of Sandstone and Yalgoo behaved as expected with increases observed at sites experiencing above average seasonal quality, and decreases where below average. The Mt Magnet LCD exhibited a strong improvement in response to favourable seasonal quality.

Report on the condition of the pastoral resource base
Figure 12 Average desirable shrub populations ‘Upper’ southern rangelands (change in desirable shrub numbers between E1 and E4 are shown in brackets).
Figure 13 Average desirable shrub populations ‘Lower’ southern rangelands (change in desirable shrub numbers between E1 and E4 are shown in brackets).
Report on the condition of the pastoral resource base
28
5 Management and rangeland condition interaction
Rangeland condition and trend is a function of rainfall (which the land manager cannot control) and management (which the land manager does control). Manipulation of stocking rates remains the single most effective instrument for a land manager to achieve a rangeland condition outcome.
Determining the cause of any apparent trend in rangeland condition must consider the relationship between measures of rangeland condition trend (site assessment data) and the drivers of this apparent trend (rainfall and stocking rate). Management response, such as by manipulating stocking rates to match seasonal pasture availability determines whether rangeland condition should be considered at risk.
Reported livestock numbers are considered in terms of Potential and Present Carrying Capacities of pastoral leases and LCDs. Potential carrying capacity assumes that all rangeland on the lease is in ‘good’ condition whereas Present carrying capacity (PCC) applies a stocking rate discount according to the most recently assessed rangeland condition. Potential carrying capacity and PCC assume that infrastructure development is sufficient to enable livestock to access all parts of a lease.
Carrying capacities are derived from DAFWA rangeland surveys and were developed in consultation with pastoralists in the survey region. Potential carrying capacity remains constant whereas PCC shifts in line with changes to rangeland condition.
Prior to May 2009, DAFWA’s rangeland condition assessments provided contemporary estimates of PCC. These assessments ceased with the PLB’s adoption of Rangeland Condition Monitoring in May 2009. As with previous reports, this report continues to employ PCC but it is recognised that these estimates are becoming increasingly dated.

Report on the condition of the pastoral resource base
The conceptual rangeland condition risk matrix based on the relationship between stocking rate and rangeland condition trend (figure 14) allows an LCD (or any other management unit) stocking rate to be plotted on the vertical axis against assessed rangeland condition trend on the horizontal axis. This places the scenario into one of four ‘risk quadrats’ described in terms of risk to rangeland condition. As a rule of thumb, below the line conveys low risk because stocking rate is within the capacity of the rangeland to sustain, although livestock numbers may not be sufficient for business optimisation. Right of the middle line conveys low risk because rangeland condition is improving, although management would need to monitor stocking rate and forage availability closely. The ‘high risk’ top left quadrat is to be avoided as this equates to a high stocking rate and declining rangeland condition. It would be expected that pastoralists would aim for the intersection point of the horizontal and vertical axes (the crosshair) which equates to stable rangeland condition and stocking rates equivalent to carrying capacity.
Figure 14 Interaction of stocking rate and rangeland condition
This report discusses reported stocking rates using this matrix.

Report on the condition of the pastoral resource base
30
5.1 Kimberley
5.1.1 Stocking rate
Figure 15 provides the reported annual average stocking rates for Kimberley LCDs since the commencement of WARMS in 1993. Prior to 2005, stocking rates were more variable but during the last decade have steadily increased by around 5% per year. In 2014, all LCDs excepting Halls Creek - East Kimberley were reporting approximately twice the livestock as in the early 1990s.
When considering this trend, it is important to note that stocking rates are averaged across LCDs meaning that stocking rates between stations in an LCD may be quite variable.
Figure 15 Average reported stock densities (cu/km2) in Kimberley LCDs, 1993–2014
5.1.2 Interaction of stock numbers and desirable grass frequency
Figure 16 plots the reported stocking rate for Kimberley LCDs over WARMS cycle 6 (Table 2) on a rangeland condition risk matrix. As has been the case in previous years, Kimberley LCDs are located close to the vertical axis in the ‘moderate risk’ quadrat. The one exception in Figure 16 is the North Kimberley LCD which has exhibited a slight decline in perennial grass frequency. Reported livestock numbers for 2014 indicate that stocking rates in the Kimberley LCDs remain mostly equal or greater than Present carrying capacity (Broome 105%, Derby - West Kimberley 152%, Halls Creek - East Kimberley 123% and North Kimberley 97%).
This analysis suggests that continuing favourable seasons are sufficiently buffering the high stocking rate.
0.0
1.0
2.0
3.0
4.0
5.0
6.0
1993
1994
1995
1996
1997
1998
1999
2000
2001
2002
2003
2004
2005
2006
2007
2008
2009
2010
2011
2012
2013
2014
cu
/ k
m2
Year
BroomeDerby WKHalls CkN.Kimberley

Report on the condition of the pastoral resource base
Figure 16 Changes in recorded frequency of desirable perennial grasses (WARMS cycle 6) in relation to stocking rate, Kimberley LCDs. (refer to data in Table 7)

Report on the condition of the pastoral resource base
32
5.2 Grassland south of the Kimberley
5.2.1 Stocking rate
Figure 17 provides the reported annual average stocking rates for grassland LCDs south of the Kimberley since the commencement of WARMS in 1993. In general, stock numbers have followed a similar trend to those in the Kimberley over the same period with livestock numbers being variable until approximately 2000 followed by a general increasing trend. However, this increase has been more pronounced in the East Pilbara and De Grey LCDs where livestock numbers have more than doubled since the early 1990s and are now 132% and 155% of PCC respectively. In contrast, reported livestock numbers in Lyndon (the southernmost LCD) have remained more static.
The marked fall in reported livestock numbers in 2010 across the region was a necessary response to an acute shortage of pasture due to successive dry seasons. All LCDs have been rebuilding livestock numbers rapidly since 2011, although the Ashburton LCD remains well below the peak in livestock numbers reported in 2009.
Scrutiny of 2014 reported stocking rates at the lease level reveals that 100% (15 of 15) of stations in the De Grey LCD, 50% (8 of 16) in Ashburton, 54% (7 of 13) in East Pilbara, 75% (12 of 16) in Roebourne, and 63% (12 of 19) in Lyndon are running livestock numbers in excess of PCC.
Figure 17 Average reported stock densities (cu/km2) in south of Kimberley grassland LCDs, 1993–2014
5.2.2 Interaction of stock numbers and desirable grass frequency
Figure 18 plots the reported stocking rate for these grassland LCDs over WARMS cycle 6 (Table 2) on a rangeland condition risk matrix. As has been reported in previous years, all LCDs are situated on or above the horizontal axis of the rangeland condition risk matrix as stocking rates averaged across LCDs are equal or greater than PCC. At the same time, a
0.0
0.5
1.0
1.5
2.0
2.5
3.0
1993
1994
1995
1996
1997
1998
1999
2000
2001
2002
2003
2004
2005
2006
2007
2008
2009
2010
2011
2012
2013
2014
cu
/ k
m2
Year
Ashburton
De Grey
East Pilbara
Roebourne
Lyndon

Report on the condition of the pastoral resource base
recorded improving trend in desirable perennial grass frequency in the Roebourne, De Grey and East Pilbara LCDs during WARMS cycle 6 places them in the ‘moderate risk’ quadrat as continuing favourable seasons are buffering rangeland condition.
In contrast to these LCDs, there was a deterioration of approximately -10% in the frequency of desirable perennial grasses on WARMS sites in the Lyndon and Ashburton LCDs during WARMS cycle 6. This adverse trend might be explained to some extent by the poor seasonal conditions experienced early in this cycle and described in the 2012, 2013 and 2014 reports of the Commissioner for Soil Conservation, and further indicated by the poor greening response in these years (see Figure 9). However, this decline assessed in WARMS cycle 6 follows similar declines in rangeland condition recorded in WARMS cycles 4 and 5 (Table 8). This longer term decline in rangeland condition suggests that stocking practices across these LCDs are inconsistent with ecological sustainability.
Figure 18 Changes in recorded frequency of desirable perennial grasses (WARMS Cycle 6) in relation to stocking rate, south of the Kimberley grassland LCDs. (refer to data in Table 8)

Report on the condition of the pastoral resource base
34
5.3 Southern shrublands
5.3.1 Stocking rate
Figure 19 provides the reported annual average stocking rates for the upper southern rangelands LCDs. (Note that Lyndon LCD is also considered with south of the Kimberley grassland LCDs). Livestock numbers in Lyndon and the other northern LCDs (Upper Gascoyne, Gascoyne-Wooramel, Gascoyne-Ashburton Headwaters and Wiluna) reached a peak in 2009, dropped in 2010 in response to acute forage deficiency, and have gradually increased since. This pattern mirrors that of LCDs in the lower Pilbara. Reported livestock numbers in 2014 exceeded the PCC in the Lyndon, Upper Gascoyne, Gascoyne-Ashburton Headwaters and Wiluna LCDs. Reported livestock numbers for the Upper Gascoyne LCD were almost double (192%) PCC.
Figure 19 Average reported stock densities (cu/km2) in upper Southern Rangelands LCDs, 2004–2014
Table 11 (below) shows the reported annual average stocking rates for lower southern rangelands LCDs. In contrast to the upper southern rangeland LCDs, reported livestock numbers have been more stable and are generally significantly lower than PCC. The Nullarbor-Eyre Highway is the only LCD that has reported stocking levels equal to or greater than PCC at any time during the last decade. The moderate stocking rate applied in most lower southern rangelands LCDs should be conducive to stable or improving rangeland condition.
0.0
0.2
0.4
0.6
0.8
1.0
1.2
1.4
1.6
1.8
2.0
2004
2005
2006
2007
2008
2009
2010
2011
2012
2013
2014
cu
/km
2
Year
GascoyneWooramel
GascoyneAshburtonHeadwaters
Lyndon
Meekatharra
UpperGascoyne
Wiluna

Report on the condition of the pastoral resource base
Table 11 Reported stock densities in lower Southern Rangelands LCDs, 2004–14
Stock density cu/km2
LCD
Ave. Present
CC
2004
2005
2006
2007
2008
2009
2010
2011
2012
2013
2014
Cue 0.76 0.31 0.34 0.43 0.54 0.45 0.40 0.21 0.22 0.26 0.23 0.20
Kalgoorlie 0.70 0.38 0.38 0.32 0.27 0.31 0.27 0.23 0.27 0.35 0.38 0.44
Mt Magnet 0.84 0.57 0.65 0.78 0.65 0.62 0.58 0.48 0.34 0.40 0.32 0.39
Murchison 0.79 0.35 0.43 0.54 0.49 0.64 0.58 0.42 0.38 0.46 0.36 0.26
North-eastern Goldfields
0.62 0.29 0.31 0.26 0.34 0.39 0.32 0.33 0.32 0.42 0.36 0.55
Nullarbor-Eyre Highway
0.59 0.63 0.57 0.43 0.51 0.45 0.43 0.43 0.55 0.58 0.59 0.62
Sandstone 0.74 0.22 0.14 0.17 0.19 0.22 0.24 0.22 0.28 0.19 0.10 0.14
Shark Bay 1.12 0.71 0.84 0.78 0.66 0.77 0.88 0.66 0.68 0.60 0.71 0.56
Yalgoo 0.79 0.37 0.38 0.46 0.56 0.50 0.50 0.32 0.31 0.36 0.33 0.26
5.3.2 Interaction of stock numbers and desirable shrub density
Figures 20 and 21 plot the reported stocking rate for upper and lower southern rangelands LCDs respectively over WARMS shrubland cycle 3 (Table 3) on the rangeland condition risk matrix.
All upper southern rangelands LCDs are placed left of the vertical axis as the density of desirable shrubs, and therefore rangeland condition has deteriorated during WARMS shrubland cycle 3. Upper Gascoyne, Gascoyne-Ashburton Headwaters and Wiluna are placed in the ‘high risk’ quadrat due to concurrent high stocking rates and deteriorating rangeland condition.
Lyndon is placed on the axis between ‘high risk’ and ‘low risk’ due to reported stocking rates being equivalent to PCC. However, both desirable perennial grass frequency and desirable shrub density declined in the Lyndon LCD by 10% and 25% respectively (Figures 18 and 20).
While the deteriorating trend in rangeland condition in the upper southern rangelands may have some explanation in seasonal conditions, the maintenance of stock numbers at or beyond PCC in unfavourable seasons is incompatible with ecological sustainability.
In contrast, all lower southern rangelands LCDs are placed beneath the horizontal axis (stocking rates less than PCC) and are therefore in the ‘low’ and ‘very low’ risk quadrats. While some LCDs have exhibited a decline in desirable shrub density since WARMS epoch 3, it could only be argued that this would be a consequence of poor seasonal conditions or perhaps site specific issues.
Given that all lower southern rangelands LCDs are applying a modest stocking rate (Figure 21 and Table 11), it is difficult to envisage what intervention land managers might reasonably be expected to apply to improve rangeland condition.

Report on the condition of the pastoral resource base
36
Figure 20 Stocking rate and change in desirable shrub populations (WARMS shrubland cycle 3) ‘upper’ Southern Rangeland LCDs
Figure 21: Stocking rate and change in desirable shrub populations (WARMS shrubland cycle 3) ‘lower’ Southern Rangeland LCDs
Report on the condition of the pastoral resource base
6 Rangeland condition ‘hotspots’
Previous reports have effectively identified hotspots though at a LCD level only. Analysis of change data (frequency of desirable perennial grasses or density of desirable shrubs) from the most recent WARMS cycle (cycle 6 in the grasslands and cycle 3 in the shrublands), interpolated BoM rainfall data and reported stocking rates (relative to PCC) averaged over the assessment period provide preliminary identification of areas where rangeland condition is at risk (“hotspots”).
The analysis should not be considered a definitive measure of rangeland condition risk as:
1. WARMS site stratification was designed to provide regional level rangeland condition trend data, and therefore is not appropriate for reporting at lease level,
2. WARMS monitoring sites are not evenly distributed sub-regionally meaning that rangeland condition risk is derived for some locations from sparse monitoring data,
3. The analysis is constrained to use the most recent full set of data which for some LCDs might be several years old (see Tables 2 and 3), and
4. It does not consider the underlying rangeland condition at a location; for example, a strong positive trend may be at a location in poor condition.
6.1 Northern rangeland ‘hotspots’
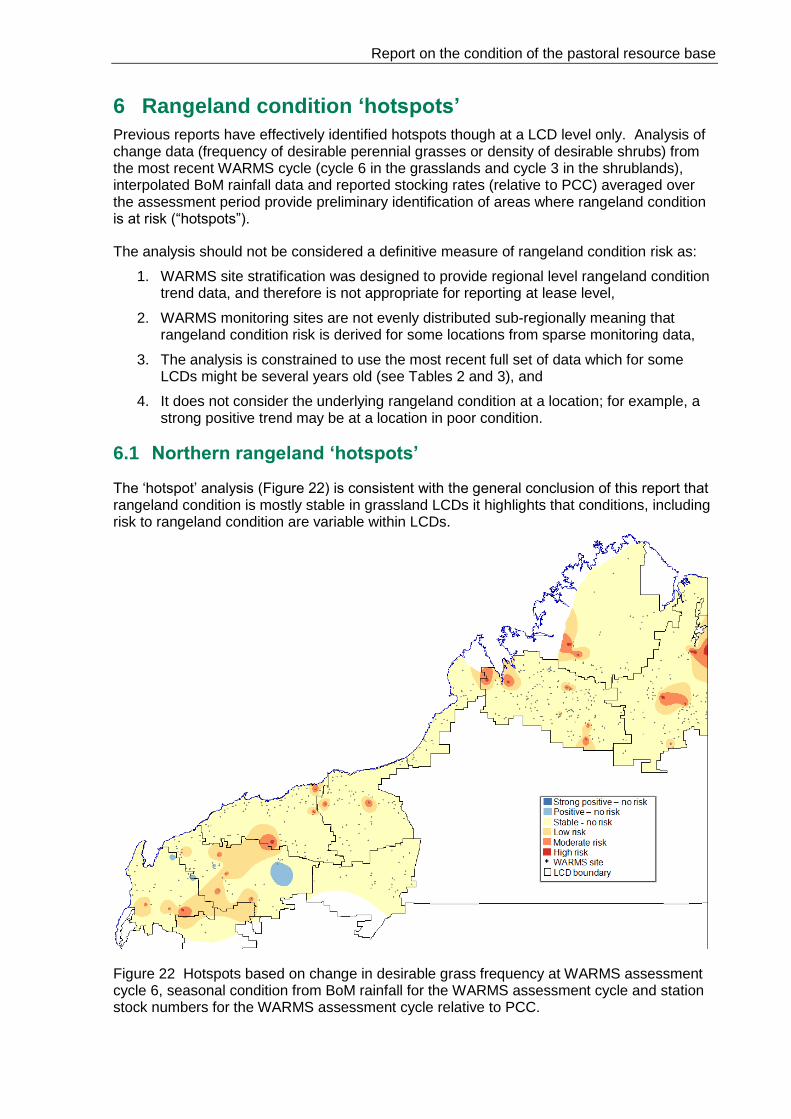
The ‘hotspot’ analysis (Figure 22) is consistent with the general conclusion of this report that rangeland condition is mostly stable in grassland LCDs it highlights that conditions, including risk to rangeland condition are variable within LCDs.
Figure 22 Hotspots based on change in desirable grass frequency at WARMS assessment cycle 6, seasonal condition from BoM rainfall for the WARMS assessment cycle and station stock numbers for the WARMS assessment cycle relative to PCC.
Report on the condition of the pastoral resource base
38
6.2 Southern rangeland ‘hotspots’
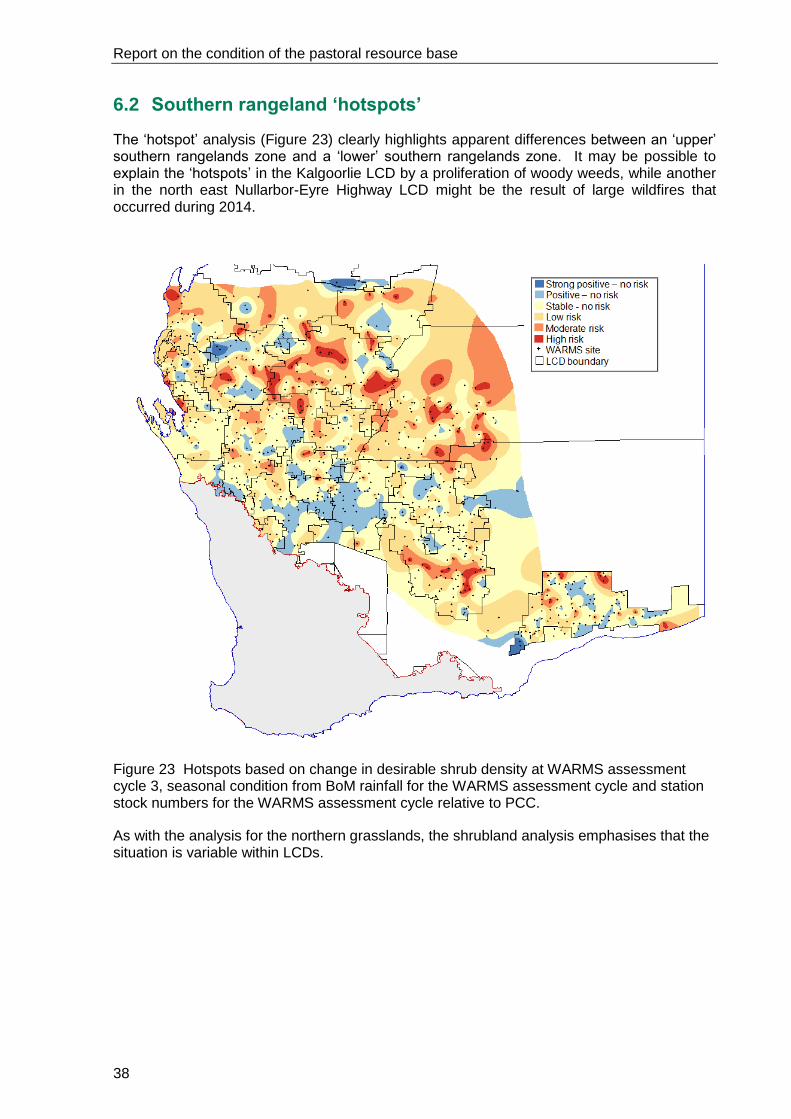
The ‘hotspot’ analysis (Figure 23) clearly highlights apparent differences between an ‘upper’ southern rangelands zone and a ‘lower’ southern rangelands zone. It may be possible to explain the ‘hotspots’ in the Kalgoorlie LCD by a proliferation of woody weeds, while another in the north east Nullarbor-Eyre Highway LCD might be the result of large wildfires that occurred during 2014.
Figure 23 Hotspots based on change in desirable shrub density at WARMS assessment cycle 3, seasonal condition from BoM rainfall for the WARMS assessment cycle and station stock numbers for the WARMS assessment cycle relative to PCC.
As with the analysis for the northern grasslands, the shrubland analysis emphasises that the situation is variable within LCDs.

Report on the condition of the pastoral resource base
7 Discussion
7.1 Kimberley LCDs
The Kimberley region experiences a relatively reliable summer wet season that supports dynamic and productive pasture communities. In the context of historical rainfall records, the region has experienced a remarkable sequence of more than two decades of average or above average wet seasons. While reported stocking rates remain at or above PCC, monitoring data from successive WARMS cycles indicate continued rangeland stability and resilience. This suggests that stocking rates are being finely balanced with seasonal forage availability.
Nonetheless, high stocking rates confer a ‘moderate’ risk to rangeland condition. This risk would materialise if land managers failed to substantially reduce livestock numbers in the event of a failed season.
The situation is more variable at station level with 30% of stations owned by Indigenous interests and generally carry relatively low stock numbers. ; In 2014, 51 of 86 stations reported stock numbers greater than PCC suggesting that the risk to rangeland condition is disproportionately higher on non-Indigenous leases.
New market opportunities in east and south east Asia for live export cattle have triggered ‘corporate’ (foreign and domestic) interest in Kimberley and Pilbara stations. These entities come to the industry with high aspirations and considerable capital. It is likely that their relationship with land regulators will require development.
7.2 South of Kimberley grassland LCDs
South of the Kimberley annual rainfall declines, seasonality becomes less defined and rainfall variability increases. These seasonal characteristics provide some explanation for the difference in productive capacity and rangeland condition trend both between the Pilbara and the Kimberley, and between LCDs within the Pilbara. Moreover, these seasonal characteristics serve to define the challenges for pastoralists in managing livestock while maintaining ecological sustainability.
The frequency of both desirable and other perennial grasses increased in the Roebourne and De Grey LCDs during WARMS cycle 6. This follows a decline of a similar magnitude during WARMS cycle 5, and variable results in earlier cycles. That these trends are occurring in an environment of high livestock numbers indicates that favourable seasons are buffering rangeland condition against the high stocking rates.
The circumstances are different in the other grassland LCDs. Cycle 6 witnessed a large increase in the frequency of perennial grasses in the inland East Pilbara LCD; but this must be considered in the context of the successive declines observed in earlier cycles, inferring that rangeland condition is nonetheless exhibiting significant variability. Rangeland condition declined during WARMS cycle 6 in the Lyndon and Ashburton LCDs. Assessments of earlier cycles indicate a longer term decline in the frequency of both desirable and other perennial grasses. Stocking rate in these LCDs is also high relative to the PCC, but unlike the Roebourne and De Grey LCDs would appear to be higher than the rangeland’s capacity to sustain.
Report on the condition of the pastoral resource base
40
7.3 Southern Rangeland LCDs
The southern rangeland is characterised by aridity and high rainfall variability. The rangelands of this zone are adapted by way of shrub and tree dominance in place of perennial grasses. A key characteristic of shrubs and trees, and ephemerals of the southern rangelands is their drought evading habit of long term dormancy and senescence during periods of rainfall deficit. The consequence for livestock producers is frequent and extended periods of acute forage deficiency. The effectiveness by which land managers respond to periods of forage deficiency determines their capacity to utilise their landscapes sustainably. Failure to reduce grazing pressure during forage deficit results in unsustainable utilisation of desirable species. In turn, this causes extensive shrub mortality, landscape dysfunction and ultimately irreversible changes in rangeland condition ‘state’.
This report identifies distinct ‘zones’ in the southern rangelands that exhibit clear differences in rangeland condition trend and underpinning management issues. The ‘upper’ zone exhibits serious and sustained losses of desirable perennial shrubs. This is occurring in an environment of sustained high stocking rates (relative to PCC) and highly variable seasons.
Rangeland condition trend in the ‘lower’ southern rangelands is more variable. Importantly, stocking rates are moderate relative both to PCC and historical stocking levels. This is contributing to an improvement in rangeland condition when moderate stocking rates coincide with favourable seasons.
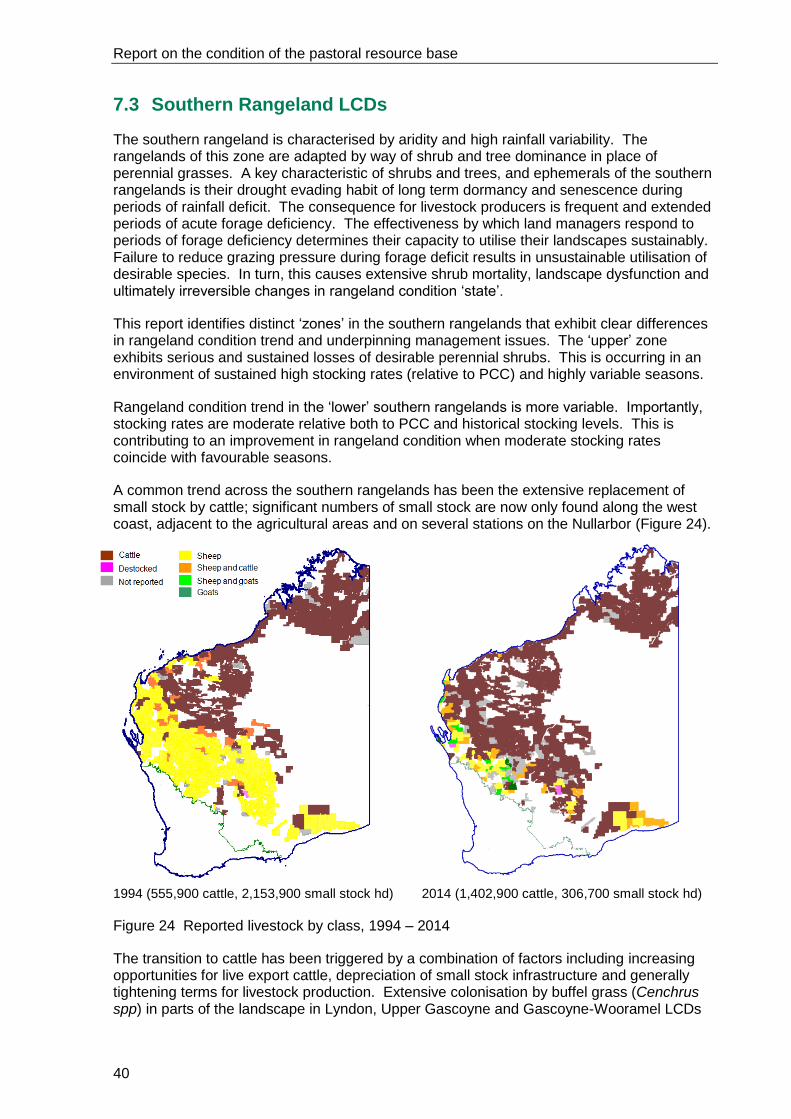
A common trend across the southern rangelands has been the extensive replacement of small stock by cattle; significant numbers of small stock are now only found along the west coast, adjacent to the agricultural areas and on several stations on the Nullarbor (Figure 24).
1994 (555,900 cattle, 2,153,900 small stock hd) 2014 (1,402,900 cattle, 306,700 small stock hd)
Figure 24 Reported livestock by class, 1994 – 2014
The transition to cattle has been triggered by a combination of factors including increasing opportunities for live export cattle, depreciation of small stock infrastructure and generally tightening terms for livestock production. Extensive colonisation by buffel grass (Cenchrus spp) in parts of the landscape in Lyndon, Upper Gascoyne and Gascoyne-Wooramel LCDs

Report on the condition of the pastoral resource base
has certainly favoured cattle more so than small stock. While there is a commonly held view that cattle are ‘gentler’ on country than sheep, this is yet to be observed in monitoring data.
7.4 General discussion
7.4.1 Landscape productivity
Landscape productivity is fundamental for financial and ecological sustainability. In pastoral terms, rangeland productivity refers to the capacity of a landscape to produce forage for livestock and is determined by the climate, soil and pasture characteristics of a location. High productivity rangeland will produce sufficient forage to sustain high numbers of livestock whilst maintaining rangeland condition; low productivity country produces less forage and subsequently supports fewer livestock.
Rangeland productivity varies considerably across the rangelands of Western Australia. Based on rangeland survey assessment rangeland productivity is highest on stations in the Kimberley, remains higher inland in the northern rangelands and on the coast, and is lowest in the inland southern rangelands (Figure 25). In absolute terms, productivity ranges from greater than 10 cu/km2 on some stations in the Derby-West Kimberley and Halls Creek - East Kimberley LCDs to less than 1.0 cu/km2 on numerous stations in the southern rangelands.
Figure 25 Potential stocking rates (cu/km2)
The critical intersection between productivity, pastoral management and ecological sustainability is in the setting of stocking rates. Pastoralists must generate a financial return from livestock production within the constraints inherent of livestock and rangeland productivity. If rangeland productivity is or becomes insufficient to generate a sustainable economic return on investment (in land, infrastructure and labour), the management choice is between compromise, diversification or withdrawal. Elevating stocking rates beyond PCC is clearly not sustainable but all too often this has been pastoralists’ response to declining profitability and the consequence is evident in the monitoring data.
Report on the condition of the pastoral resource base
42
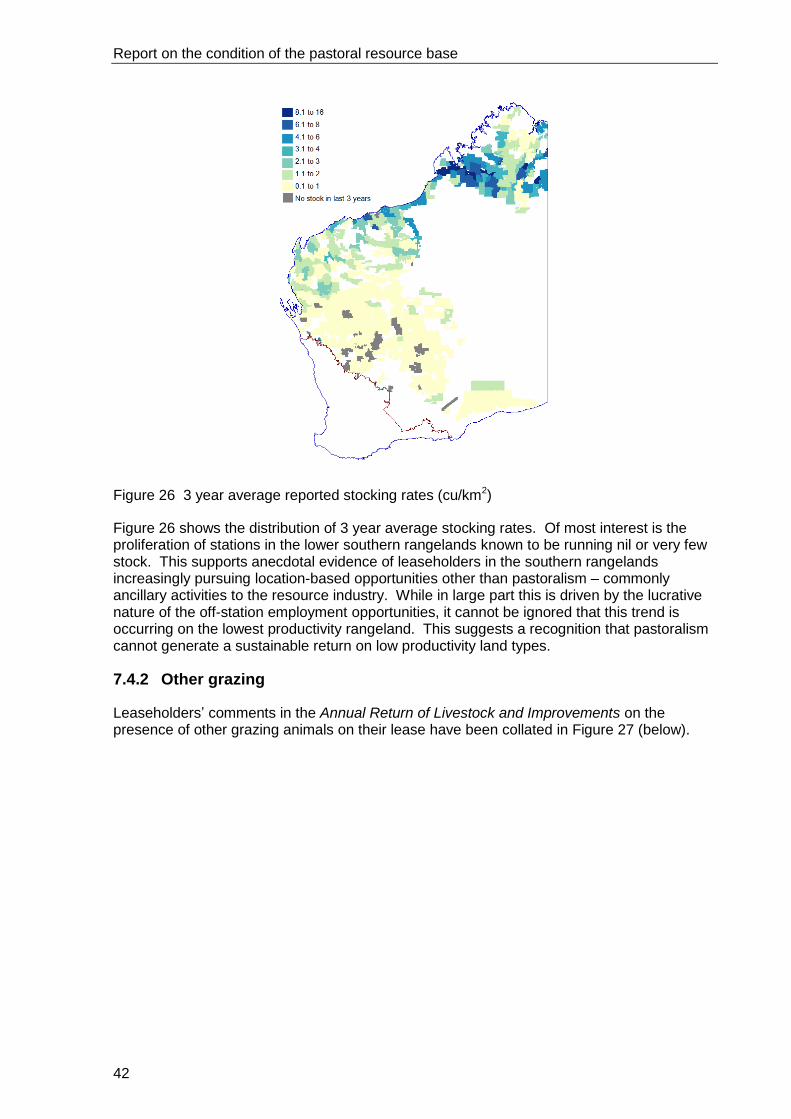
Figure 26 3 year average reported stocking rates (cu/km2)
Figure 26 shows the distribution of 3 year average stocking rates. Of most interest is the proliferation of stations in the lower southern rangelands known to be running nil or very few stock. This supports anecdotal evidence of leaseholders in the southern rangelands increasingly pursuing location-based opportunities other than pastoralism – commonly ancillary activities to the resource industry. While in large part this is driven by the lucrative nature of the off-station employment opportunities, it cannot be ignored that this trend is occurring on the lowest productivity rangeland. This suggests a recognition that pastoralism cannot generate a sustainable return on low productivity land types.
7.4.2 Other grazing
Leaseholders’ comments in the Annual Return of Livestock and Improvements on the presence of other grazing animals on their lease have been collated in Figure 27 (below).

Report on the condition of the pastoral resource base
Goats
Kangaroos and wallabies
Camels
Donkeys
Figure 27 Reported ‘other’ grazing in 2014
The distribution of feral goats in the rangelands has retreated dramatically during the last decade. Previously feral goats were numerous throughout the Gascoyne, Murchison and North - eastern Goldfields, but are now only observed in numbers in the Gascoyne-Wooramel, Shark Bay and Yalgoo LCDs. Remnant populations persist in adjacent LCDs. The actual number of goats in the rangelands cannot be estimated but are undoubtedly

Report on the condition of the pastoral resource base
44
much lower in 2014 than during the 1990s. Large populations of feral goats are known to be damaging to rangeland condition; land managers are advising of dramatic improvement in their country following the retreat of feral goats.
Camels are most prevalent on stations adjacent to the pastoral estate-UCL interface. However, Figure 27 suggests they have penetrated considerably into the Pilbara and Gascoyne. Camels compete aggressively for forage and access to water, and damage pastoral infrastructure.
Donkeys are reported to occur in numbers on many stations in the Pilbara, Gascoyne and Murchison. Donkeys are able to increase numbers rapidly and compete vigorously for forage. Donkeys previously occurred in high numbers causing significant rangeland degradation in the Kimberley and parts of the Pilbara. Their numbers were successfully reduced through a concerted Agricultural Protection Board eradication program during the early 1990s.
Kangaroos and wallabies are widespread in the pastoral estate. They are highly mobile, difficult to exclude and able to rapidly increase populations following rain. Kangaroos do not degrade rangeland in the same manner as goats, camels and donkeys, but their mobility sees them suppressing recovery of rangeland, particularly where land managers are actively managing to lessen grazing pressure.
Total grazing pressure is cumulative of domestic, feral and marsupial grazing. Land managers must monitor and control all grazing pressure on their land in the interests of profitability and ecological sustainability. Leaseholders are obliged to control feral animals (goats, camels and donkeys) under the Biosecurity and Agriculture Management Act 2007.
Report on the condition of the pastoral resource base
8 Conclusions
This report restates the conclusion of previous reports of the Commissioner for Soil Conservation. WARMS data provide evidence of rangeland condition decline in a number of LCDs which has been varyingly apparent over the past two decades.
There is a clear association of rangeland condition decline with average LCD stocking rates in excess of PCC during periods of rainfall deficit.
In other LCDs with average stocking rates in excess of PCC, WARMS data provides evidence that favourable seasonal conditions have enabled rangeland condition to remain stable. However, in these LCDs there is an inherent risk to rangeland condition should poor quality seasons be experienced. This highlights the importance for seasonally responsive management.
Rangeland condition decline carries serious implications for the future sustainability of the pastoral industry and the State’s rangeland resource. Terms of trade will continue to gradually deteriorate and climate is forecast to become more variable with extended dry periods likely to be more frequent in some areas.
The situation is complex and a solution will not be straightforward. Previous attempts to regulate pastoral land condition have been ineffective. Therefore, it is imperative that the Board and the Department of Lands finalise and implement a compliance and enforcement policy and formulate a response to issues identified in this report.

Report on the condition of the pastoral resource base
46
References
Novelly, PE & Thomas, PWE 2012, ‘Report to the Commissioner of Soil Conservation on the condition of the Western Australian pastoral resource base’, Department of Agriculture and Food, Perth.
Novelly, PE & Thomas, PWE 2013, ‘Report to the Commissioner of Soil Conservation on the condition of the Western Australian pastoral resource base’, Department of Agriculture and Food, Perth.
Novelly, PE & Thomas, PWE 2014, ‘Report to the Commissioner of Soil Conservation on the condition of the Western Australian pastoral resource base’, Department of Agriculture and Food, Perth.
Watson, IW & Novelly, PE 2012, ‘Transitions across thresholds of vegetation states in the grazed rangelands of Western Australia’, The Rangeland Journal, vol. 34, pp. 231–38.
Watson, IW, Novelly, PE & Thomas, PWE 2007, ‘Monitoring changes in pastoral rangelands – the Western Australian Rangeland Monitoring System (WARMS)’, The Rangeland Journal, vol 29, pp. 191-205.

Report on the condition of the pastoral resource base
2006
2007
2008
2009
2010
2011
2012
2013
2014
2015
Figure 28 Seasonal greenness response based on MODIS NDVI 2006 to 2015 (August 2015)