Embed Size (px)
Citation preview
3
Report to shareholders Third-quarter 2013
2 REPORT TO SHAREHOLDERS THIRD-QUARTER 2013
Contents:
Highlights 3
Group summary 4
Business segments 5
Other matters and outlook 9
Profit and loss 10
Balance sheet and cash flow 11
Business segments 12
Notes to the accounts 13
Historical comparative data 17
Financial calendar and investor contact 20
3
Third-quarter 2013 highlights
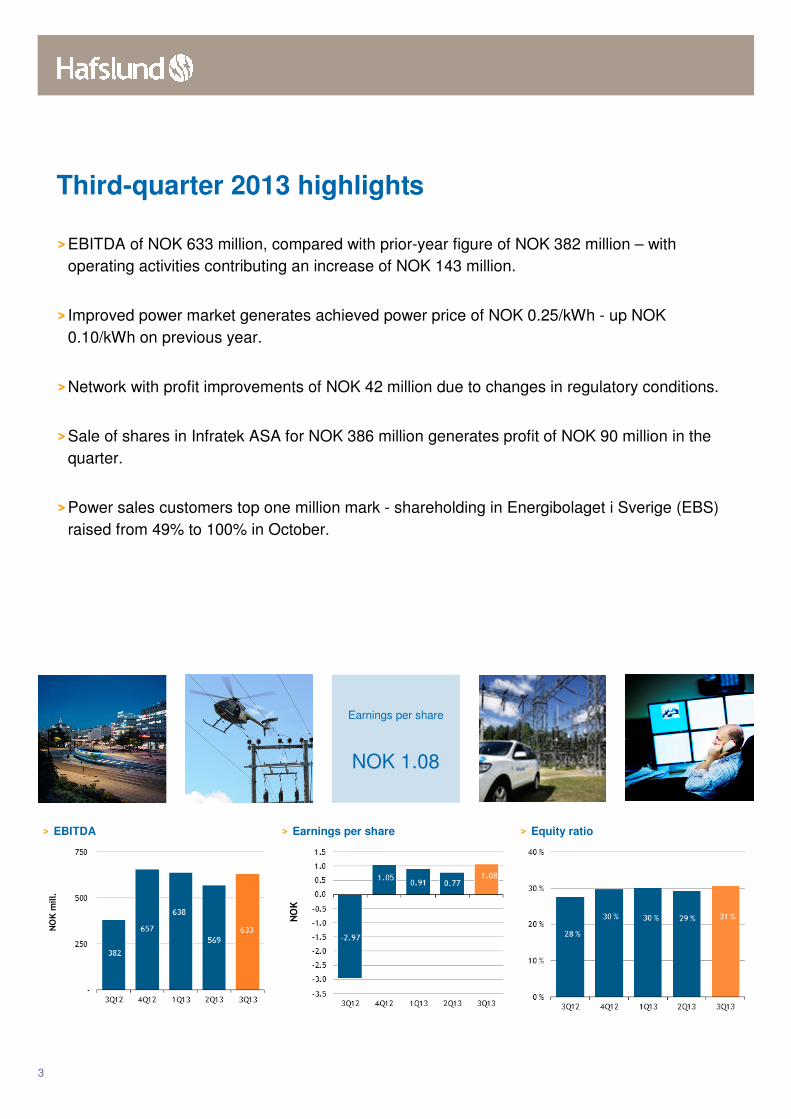
> EBITDA of NOK 633 million, compared with prior-year figure of NOK 382 million – with
operating activities contributing an increase of NOK 143 million.
> Improved power market generates achieved power price of NOK 0.25/kWh - up NOK
0.10/kWh on previous year.
> Network with profit improvements of NOK 42 million due to changes in regulatory conditions.
> Sale of shares in Infratek ASA for NOK 386 million generates profit of NOK 90 million in the
quarter.
> Power sales customers top one million mark - shareholding in Energibolaget i Sverige (EBS)
raised from 49% to 100% in October.
> EBITDA
> Earnings per share
> Equity ratio
Earnings per share
NOK 1.08
NOK mill.
NOK
4 REPORT TO SHAREHOLDERS THIRD-QUARTER 2013
Key figures
Q3 12 Q3 13 Profit and loss (NOK million) Ytd 13 Ytd 12
1 854 2 380 Operating revenues 9 197 7 874
382 633 EBITDA 1 840 1 513
-268 431 Operating profit 1 245 483
-502 326 Profit before tax and discontinued operations 875 31
-580 210 Profit after tax 539 -216
Capital matters
Equity ratio 31 % 28 %
Net interest-bearing debt 9 804 9 579
Per-share figures (NOK)
-2.97 1.08 Profit (EPS) 2.76 -1.11
2.7 0.1 Cash flow from operations 7.4 4.6
Key figures
0.15 0.25 Power prices (NOK per kWh) 0.27 0.20
924 825 Hydropower production (GWh) 2 170 2 413
230 230 Heat production (GWh) 1 454 1 294
2 782 2 893 Power sales (GWh) 12 185 11 289
Figures are in NOK unless otherwise stated. Comparative 2012 figures appear in parentheses. Profit, balance sheet, and cash flow figures for 2012 have
been restated pursuant to implementation of the revised IAS 19 pension standard.
Third-quarter 2013 summary
Third-quarter 2013 results
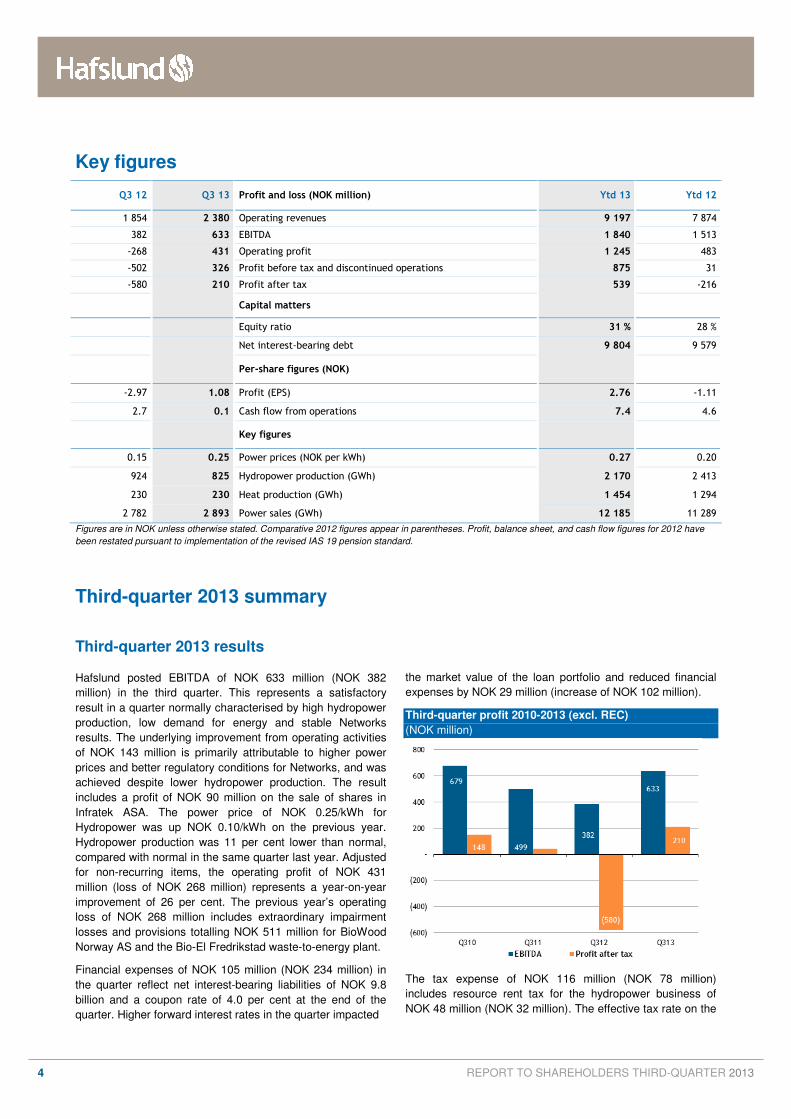
Hafslund posted EBITDA of NOK 633 million (NOK 382
million) in the third quarter. This represents a satisfactory
result in a quarter normally characterised by high hydropower
production, low demand for energy and stable Networks
results. The underlying improvement from operating activities
of NOK 143 million is primarily attributable to higher power
prices and better regulatory conditions for Networks, and was
achieved despite lower hydropower production. The result
includes a profit of NOK 90 million on the sale of shares in
Infratek ASA. The power price of NOK 0.25/kWh for
Hydropower was up NOK 0.10/kWh on the previous year.
Hydropower production was 11 per cent lower than normal,
compared with normal in the same quarter last year. Adjusted
for non-recurring items, the operating profit of NOK 431
million (loss of NOK 268 million) represents a year-on-year
improvement of 26 per cent. The previous year’s operating
loss of NOK 268 million includes extraordinary impairment
losses and provisions totalling NOK 511 million for BioWood
Norway AS and the Bio-El Fredrikstad waste-to-energy plant.
Financial expenses of NOK 105 million (NOK 234 million) in
the quarter reflect net interest-bearing liabilities of NOK 9.8
billion and a coupon rate of 4.0 per cent at the end of the
quarter. Higher forward interest rates in the quarter impacted
the market value of the loan portfolio and reduced financial
expenses by NOK 29 million (increase of NOK 102 million).
Third-quarter profit 2010-2013 (excl. REC)
(NOK million)
The tax expense of NOK 116 million (NOK 78 million)
includes resource rent tax for the hydropower business of
NOK 48 million (NOK 32 million). The effective tax rate on the
5 REPORT TO SHAREHOLDERS THIRD-QUARTER 2013
profit before tax of NOK 326 million should be viewed in the
context of the fact that the profit of NOK 90 million on the sale
of shares in Infratek ASA is non-taxable in accordance with
the exemption model. The tax expense for the previous year
includes a provision of NOK 183 million relating to an ongoing
tax dispute. The profit after tax of NOK 210 million (loss of
NOK 580 million) equates to an earnings per share figure of
NOK 1.08 (NOK -2.97).
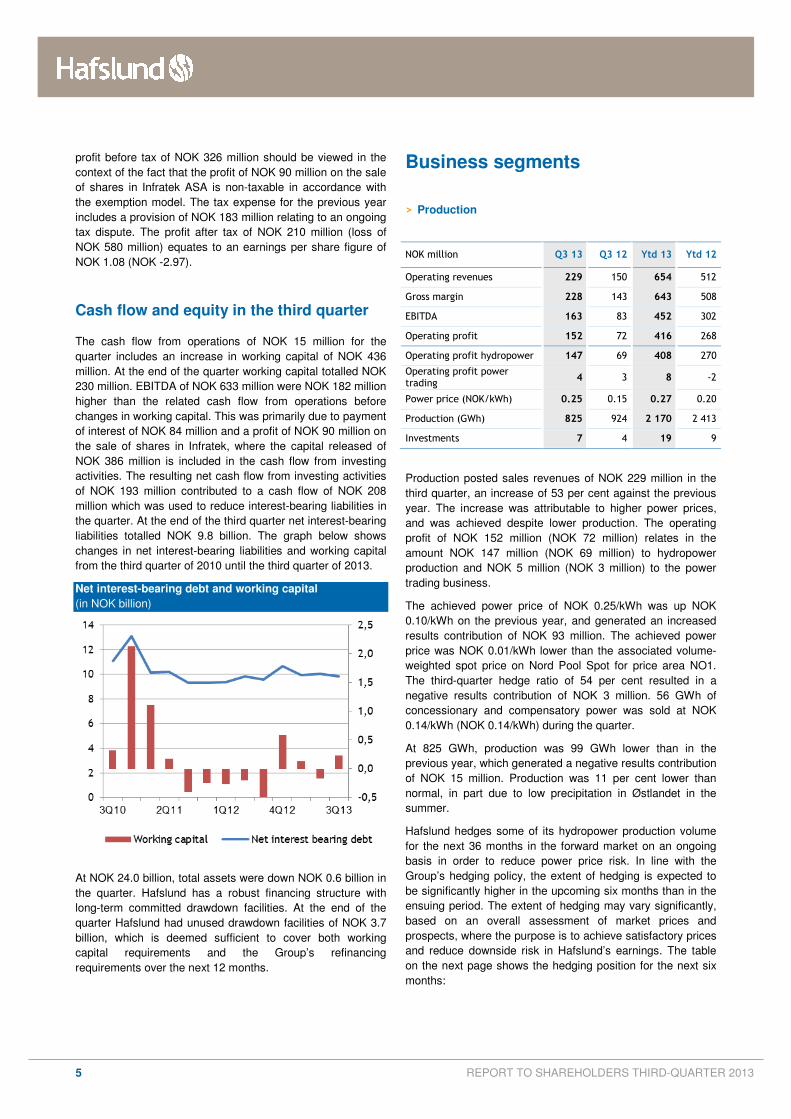
Cash flow and equity in the third quarter
The cash flow from operations of NOK 15 million for the
quarter includes an increase in working capital of NOK 436
million. At the end of the quarter working capital totalled NOK
230 million. EBITDA of NOK 633 million were NOK 182 million
higher than the related cash flow from operations before
changes in working capital. This was primarily due to payment
of interest of NOK 84 million and a profit of NOK 90 million on
the sale of shares in Infratek, where the capital released of
NOK 386 million is included in the cash flow from investing
activities. The resulting net cash flow from investing activities
of NOK 193 million contributed to a cash flow of NOK 208
million which was used to reduce interest-bearing liabilities in
the quarter. At the end of the third quarter net interest-bearing
liabilities totalled NOK 9.8 billion. The graph below shows
changes in net interest-bearing liabilities and working capital
from the third quarter of 2010 until the third quarter of 2013.
Net interest-bearing debt and working capital
(in NOK billion)
At NOK 24.0 billion, total assets were down NOK 0.6 billion in
the quarter. Hafslund has a robust financing structure with
long-term committed drawdown facilities. At the end of the
quarter Hafslund had unused drawdown facilities of NOK 3.7
billion, which is deemed sufficient to cover both working
capital requirements and the Group’s refinancing
requirements over the next 12 months.
Business segments
> Production
NOK million Q3 13 Q3 12 Ytd 13 Ytd 12
Operating revenues 229 150 654 512
Gross margin 228 143 643 508
EBITDA 163 83 452 302
Operating profit 152 72 416 268
Operating profit hydropower 147 69 408 270
Operating profit power trading
4 3 8 -2
Power price (NOK/kWh) 0.25 0.15 0.27 0.20
Production (GWh) 825 924 2 170 2 413
Investments 7 4 19 9
Production posted sales revenues of NOK 229 million in the
third quarter, an increase of 53 per cent against the previous
year. The increase was attributable to higher power prices,
and was achieved despite lower production. The operating
profit of NOK 152 million (NOK 72 million) relates in the
amount NOK 147 million (NOK 69 million) to hydropower
production and NOK 5 million (NOK 3 million) to the power
trading business.
The achieved power price of NOK 0.25/kWh was up NOK
0.10/kWh on the previous year, and generated an increased
results contribution of NOK 93 million. The achieved power
price was NOK 0.01/kWh lower than the associated volume-
weighted spot price on Nord Pool Spot for price area NO1.
The third-quarter hedge ratio of 54 per cent resulted in a
negative results contribution of NOK 3 million. 56 GWh of
concessionary and compensatory power was sold at NOK
0.14/kWh (NOK 0.14/kWh) during the quarter.
At 825 GWh, production was 99 GWh lower than in the
previous year, which generated a negative results contribution
of NOK 15 million. Production was 11 per cent lower than
normal, in part due to low precipitation in Østlandet in the
summer.
Hafslund hedges some of its hydropower production volume
for the next 36 months in the forward market on an ongoing
basis in order to reduce power price risk. In line with the
Group’s hedging policy, the extent of hedging is expected to
be significantly higher in the upcoming six months than in the
ensuing period. The extent of hedging may vary significantly,
based on an overall assessment of market prices and
prospects, where the purpose is to achieve satisfactory prices
and reduce downside risk in Hafslund’s earnings. The table
on the next page shows the hedging position for the next six
months:
6 REPORT TO SHAREHOLDERS THIRD-QUARTER 2013
Hedging position Next 6 months
Hedge ratio as of 30.09.2013 45 %
Hedge price less market price as of 30.09.2013 (NOK/kWh)
-0.007
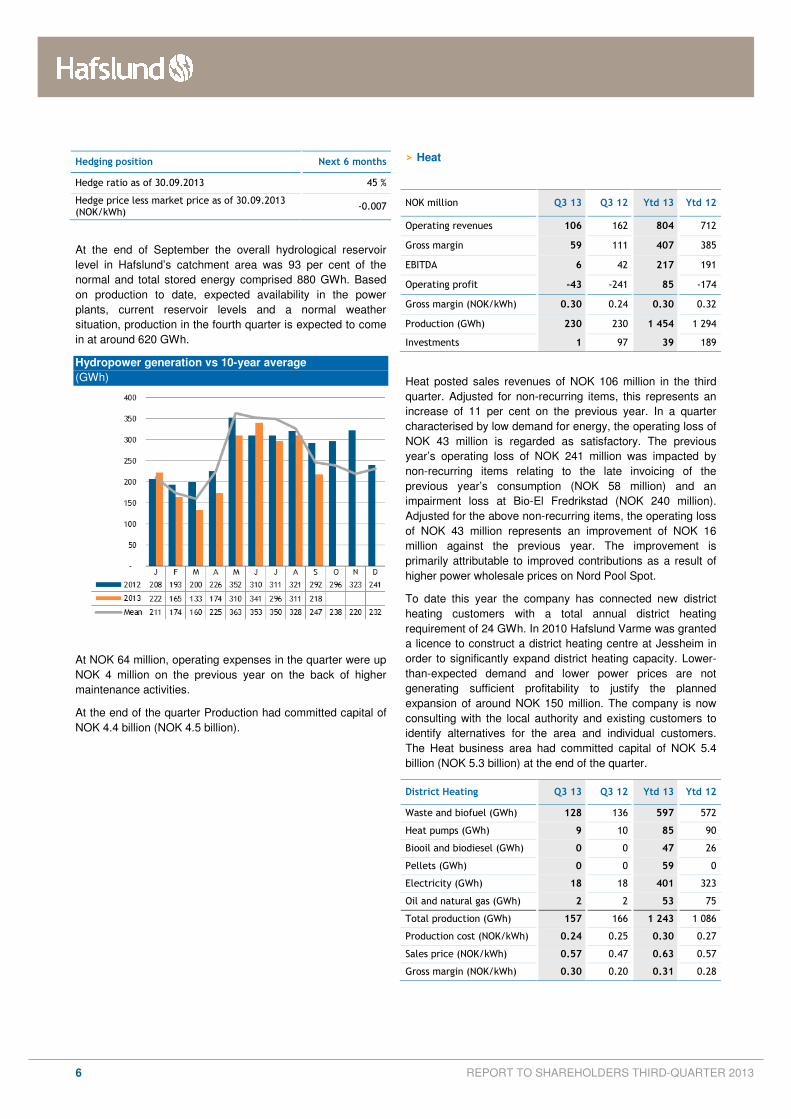
At the end of September the overall hydrological reservoir
level in Hafslund’s catchment area was 93 per cent of the
normal and total stored energy comprised 880 GWh. Based
on production to date, expected availability in the power
plants, current reservoir levels and a normal weather
situation, production in the fourth quarter is expected to come
in at around 620 GWh.
Hydropower generation vs 10-year average
(GWh)
At NOK 64 million, operating expenses in the quarter were up
NOK 4 million on the previous year on the back of higher
maintenance activities.
At the end of the quarter Production had committed capital of
NOK 4.4 billion (NOK 4.5 billion).
> Heat
NOK million Q3 13 Q3 12 Ytd 13 Ytd 12
Operating revenues 106 162 804 712
Gross margin 59 111 407 385
EBITDA 6 42 217 191
Operating profit -43 -241 85 -174
Gross margin (NOK/kWh) 0.30 0.24 0.30 0.32
Production (GWh) 230 230 1 454 1 294
Investments 1 97 39 189
Heat posted sales revenues of NOK 106 million in the third
quarter. Adjusted for non-recurring items, this represents an
increase of 11 per cent on the previous year. In a quarter
characterised by low demand for energy, the operating loss of
NOK 43 million is regarded as satisfactory. The previous
year’s operating loss of NOK 241 million was impacted by
non-recurring items relating to the late invoicing of the
previous year’s consumption (NOK 58 million) and an
impairment loss at Bio-El Fredrikstad (NOK 240 million).
Adjusted for the above non-recurring items, the operating loss
of NOK 43 million represents an improvement of NOK 16
million against the previous year. The improvement is
primarily attributable to improved contributions as a result of
higher power wholesale prices on Nord Pool Spot.
To date this year the company has connected new district
heating customers with a total annual district heating
requirement of 24 GWh. In 2010 Hafslund Varme was granted
a licence to construct a district heating centre at Jessheim in
order to significantly expand district heating capacity. Lower-
than-expected demand and lower power prices are not
generating sufficient profitability to justify the planned
expansion of around NOK 150 million. The company is now
consulting with the local authority and existing customers to
identify alternatives for the area and individual customers.
The Heat business area had committed capital of NOK 5.4
billion (NOK 5.3 billion) at the end of the quarter.
District Heating Q3 13 Q3 12 Ytd 13 Ytd 12
Waste and biofuel (GWh) 128 136 597 572
Heat pumps (GWh) 9 10 85 90
Biooil and biodiesel (GWh) 0 0 47 26
Pellets (GWh) 0 0 59 0
Electricity (GWh) 18 18 401 323
Oil and natural gas (GWh) 2 2 53 75
Total production (GWh) 157 166 1 243 1 086
Production cost (NOK/kWh) 0.24 0.25 0.30 0.27
Sales price (NOK/kWh) 0.57 0.47 0.63 0.57
Gross margin (NOK/kWh) 0.30 0.20 0.31 0.28
7 REPORT TO SHAREHOLDERS THIRD-QUARTER 2013
The district heating price (including the distribution stage) was
NOK 0.57/kWh in the quarter. The increase of NOK 0.10/kWh
compared with the previous year is attributable to higher
power wholesale prices on Nord Pool Spot. At 157 GWh,
district heating production was down 9 GWh on the previous
year on the back of slightly lower energy demand, despite
growth in the connection of new customers. The fuel cost of
NOK 0.24/kWh reflects a high base load quota from the
waste-to-energy plant at Klemetsrud in a quarter
characterised by low energy demand. This resulted in a gross
contribution for district heating sales of NOK 0.30/kWh, up
NOK 0.10/kWh on the previous year. The share of renewable
energy sources in the quarter was 99 per cent, and 95 per
cent over the last 12 months.
District heating hedges some of its hydropower production
volume on the futures market for the next 36 months on an
ongoing basis in order to reduce power price risk. The extent
of hedging may vary significantly, based on an overall
assessment of market prices and prospects, where the
intention is to achieve satisfactory prices and reduce
fluctuations in Hafslund’s earnings. In the third quarter 86
GWh (55 percent) of production was hedged, resulting in a
profit of NOK 0.2 million. The table below shows the hedging
position in relation to net power price exposure for the district
heating business for the next six months:
Hedging position Next 6 months
Hedge ratio as of 30.09.2013 37 %
Hedge price less market price as of 30.09.2013 (NOK/kWh)
-0.017
The table below shows the key figures for the two industrial
heating plants in Østfold. The energy is delivered in the form
of steam, district heating and electricity. Energy production of
73 GWh was 9 GWh higher than the previous year. The sales
price of NOK 0.28/kWh was slightly higher than the previous
year due a higher share of steam and higher steam price. At
NOK 0.30/kWh the gross contribution was down NOK
0.03/kWh against the previous year due to around NOK 110
per tonne lower revenues from received waste. Industrial heat
posted a gross contribution of NOK 22 million (NOK 21
million) in the third quarter, relating in the amount of NOK 16
million (NOK 17 million) to the plant at Sarpsborg and NOK 6
million (NOK 4 million) to Bio-El Fredrikstad.
Industrial energy Q3 13 Q3 12 Ytd 13 Ytd 12
Sales price (NOK/kWh) 0.28 0.26 0.26 0.27
Used waste (thousand tonns)
33 35 97 100
Gross margin (NOK/kWh) 0.30 0.33 0.29 0.32
Production (GWh) 73 64 212 209
* The gross contribution (NOK/kWh) is higher than the sales price due to the fact that
income from the receipt of waste is included in the contribution but not in the sales
price.
> Network
NOK million Q3 13 Q3 12 Ytd 13 Ytd 12
Operating revenues 925 839 2 962 2 799
Gross margin 621 550 1 790 1 701
EBITDA 286 244 841 734
Operating profit 164 120 477 361
Result effect income surpluses/(shortfalls)
(44) 65 (164) 35
Investments 142 120 334 292
Networks posted sales revenues of NOK 925 million (NOK
839 million) in the third quarter. The sales revenues and
contribution reflect an income shortfall of NOK 44 million
(income surplus of NOK 65 million). We refer to Note 2 later in
the report for further information on income
surpluses/shortfalls. Networks posted a gross contribution of
NOK 621 million (NOK 550 million) in the quarter. Operating
expenses of NOK 336 million reflect higher maintenance
activities than in the previous year. EBITDA of NOK 286
million was up NOK 42 million on the previous year, due to
better regulatory conditions.
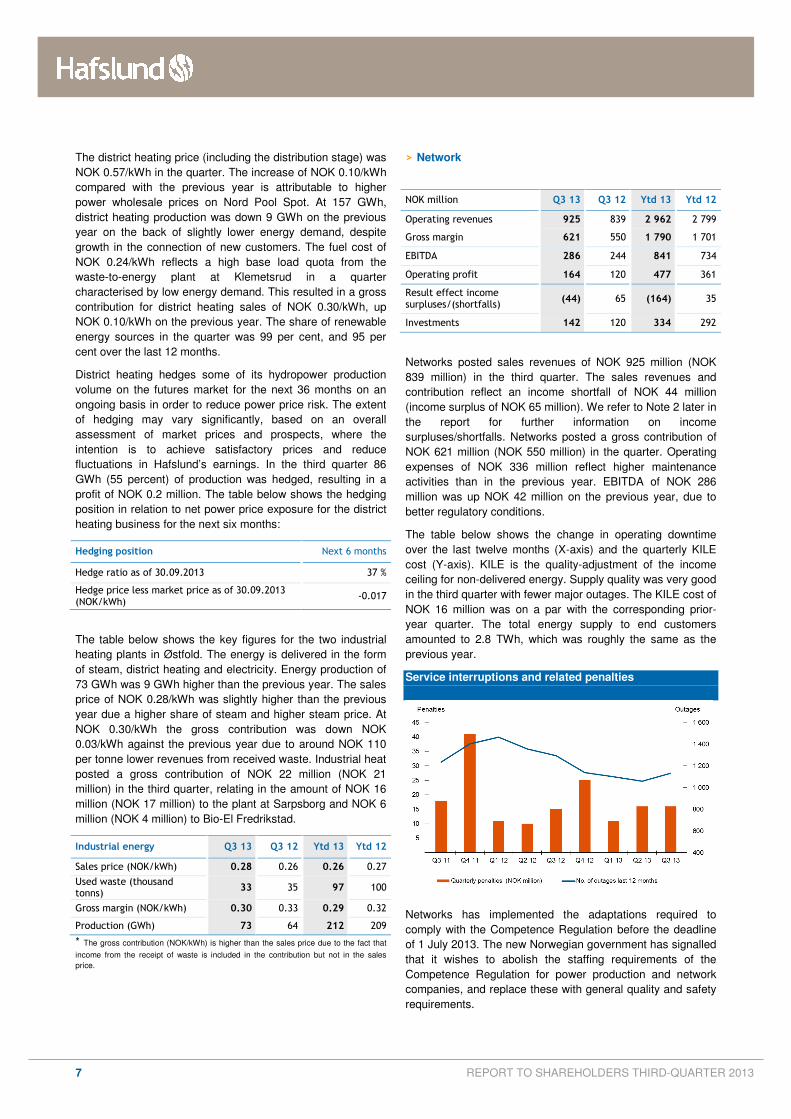
The table below shows the change in operating downtime
over the last twelve months (X-axis) and the quarterly KILE
cost (Y-axis). KILE is the quality-adjustment of the income
ceiling for non-delivered energy. Supply quality was very good
in the third quarter with fewer major outages. The KILE cost of
NOK 16 million was on a par with the corresponding prior-
year quarter. The total energy supply to end customers
amounted to 2.8 TWh, which was roughly the same as the
previous year.
Service interruptions and related penalties
Networks has implemented the adaptations required to
comply with the Competence Regulation before the deadline
of 1 July 2013. The new Norwegian government has signalled
that it wishes to abolish the staffing requirements of the
Competence Regulation for power production and network
companies, and replace these with general quality and safety
requirements.
8 REPORT TO SHAREHOLDERS THIRD-QUARTER 2013
Assuming normal energy demand in the fourth quarter, the
operating result for 2013 is expected to come in around 15
per cent higher than in 2012, based on the current net tariffs.
Investments totalled NOK 142 million (NOK 120 million) in the
third quarter. Networks had committed capital of NOK 9.0
billion (NOK 8.2 billion) at the end of the quarter.
> Markets
NOK million Q3 13 Q3 12 Ytd 13 Ytd 12
Operating revenues 1 147 708 4 847 3 799
Gross margin 270 262 818 834
EBITDA 83 84 246 336
Operating profit 73 80 217 323
Operating profit power sales 65 59 197 259
- included value change derivatives
10 1 5 36
Sales volume (GWh) 2 893 2 782 12 185 11 289
Operating profit billing and customer service
9 21 20 64
Markets posted sales revenues of NOK 1,147 million for the
quarter, an increase of 62 per cent against the previous year.
The increase in sales is primarily attributable to higher
wholesale power prices on Nord Pool Spot.
In a quarter featuring low demand, the operating profit came
in at NOK 73 million (NOK 80 million). The customer base is
continuing to expand and despite slightly lower margins
(NOK/MWh) the contribution from power sales was on a par
with the previous year. At NOK 187 million, year-on-year
operating expenses were up NOK 9 million. In addition to
more customers, the transitional phase is resulting in slightly
higher costs for system operations due to the replacement of
the Group’s customer service and invoicing systems. Costs of
NOK 9 million were recognised relating to customer
recruitment in the quarter. Power sales posted an operating
profit of NOK 65 million, which equates to post-tax earnings of
around NOK 56 per customer in the quarter (NOK 48).
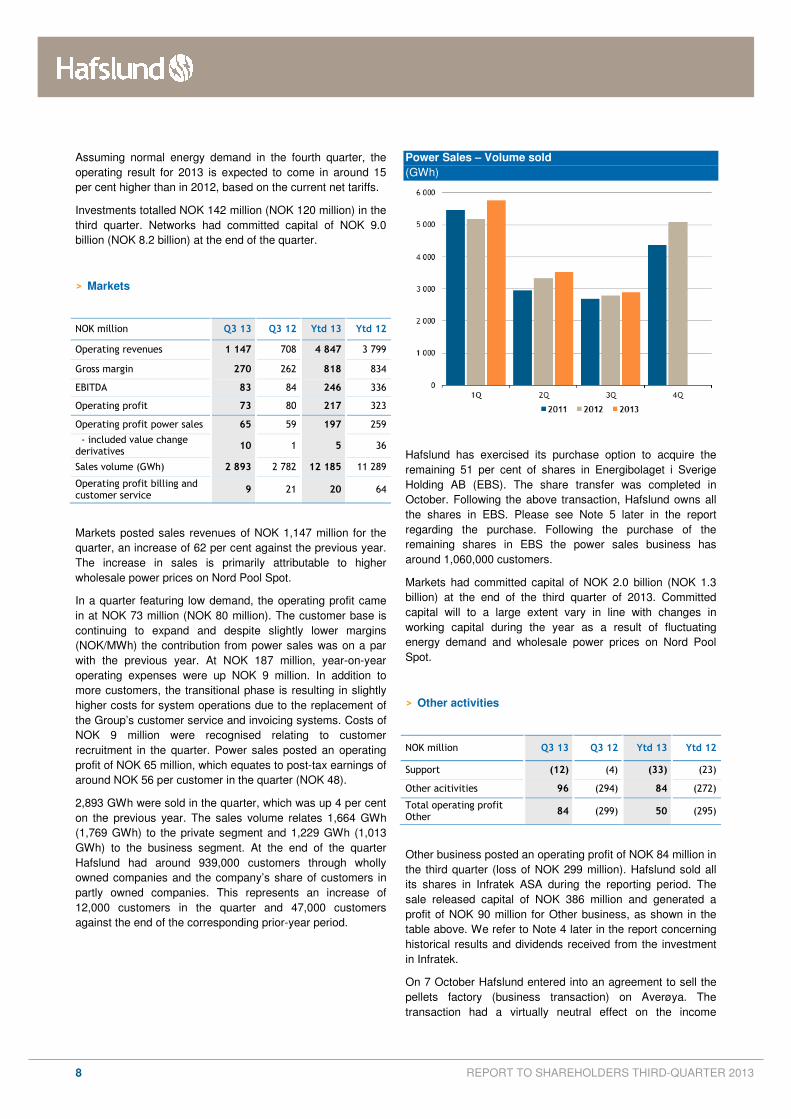
2,893 GWh were sold in the quarter, which was up 4 per cent
on the previous year. The sales volume relates 1,664 GWh
(1,769 GWh) to the private segment and 1,229 GWh (1,013
GWh) to the business segment. At the end of the quarter
Hafslund had around 939,000 customers through wholly
owned companies and the company’s share of customers in
partly owned companies. This represents an increase of
12,000 customers in the quarter and 47,000 customers
against the end of the corresponding prior-year period.
Power Sales – Volume sold
(GWh)
Hafslund has exercised its purchase option to acquire the
remaining 51 per cent of shares in Energibolaget i Sverige
Holding AB (EBS). The share transfer was completed in
October. Following the above transaction, Hafslund owns all
the shares in EBS. Please see Note 5 later in the report
regarding the purchase. Following the purchase of the
remaining shares in EBS the power sales business has
around 1,060,000 customers.
Markets had committed capital of NOK 2.0 billion (NOK 1.3
billion) at the end of the third quarter of 2013. Committed
capital will to a large extent vary in line with changes in
working capital during the year as a result of fluctuating
energy demand and wholesale power prices on Nord Pool
Spot.
> Other activities
NOK million Q3 13 Q3 12 Ytd 13 Ytd 12
Support (12) (4) (33) (23)
Other acitivities 96 (294) 84 (272)
Total operating profit Other
84 (299) 50 (295)
Other business posted an operating profit of NOK 84 million in
the third quarter (loss of NOK 299 million). Hafslund sold all
its shares in Infratek ASA during the reporting period. The
sale released capital of NOK 386 million and generated a
profit of NOK 90 million for Other business, as shown in the
table above. We refer to Note 4 later in the report concerning
historical results and dividends received from the investment
in Infratek.
On 7 October Hafslund entered into an agreement to sell the
pellets factory (business transaction) on Averøya. The
transaction had a virtually neutral effect on the income
9 REPORT TO SHAREHOLDERS THIRD-QUARTER 2013
statement and will be recognised in the fourth quarter. The
previous year’s result for Other business in the table above
includes NOK 271 million in impairment losses and provisions
resulting from the decision to close down the pellets business.
Other matters
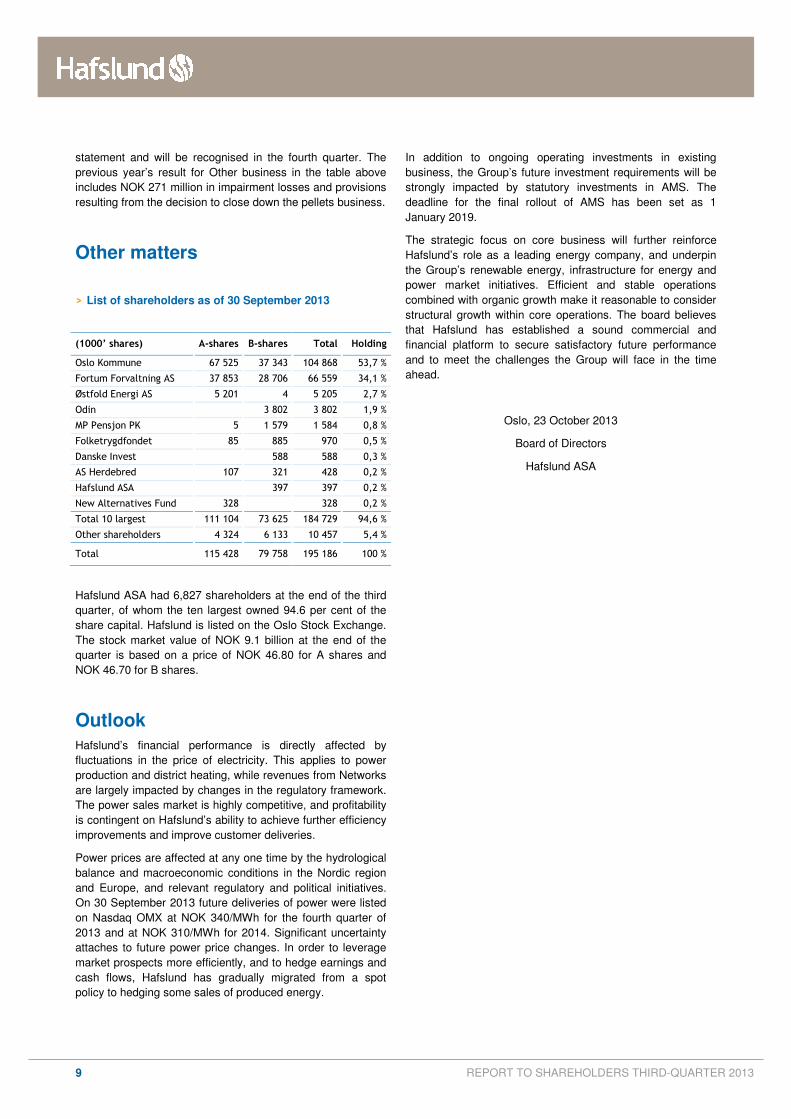
> List of shareholders as of 30 September 2013
(1000’ shares) A-shares B-shares Total Holding
Oslo Kommune 67 525 37 343 104 868 53,7 %
Fortum Forvaltning AS 37 853 28 706 66 559 34,1 %
Østfold Energi AS 5 201 4 5 205 2,7 %
Odin
3 802 3 802 1,9 %
MP Pensjon PK 5 1 579 1 584 0,8 %
Folketrygdfondet 85 885 970 0,5 %
Danske Invest 588 588 0,3 %
AS Herdebred 107 321 428 0,2 %
Hafslund ASA 397 397 0,2 %
New Alternatives Fund 328 328 0,2 %
Total 10 largest 111 104 73 625 184 729 94,6 %
Other shareholders 4 324 6 133 10 457 5,4 %
Total 115 428 79 758 195 186 100 %
Hafslund ASA had 6,827 shareholders at the end of the third
quarter, of whom the ten largest owned 94.6 per cent of the
share capital. Hafslund is listed on the Oslo Stock Exchange.
The stock market value of NOK 9.1 billion at the end of the
quarter is based on a price of NOK 46.80 for A shares and
NOK 46.70 for B shares.
Outlook
Hafslund’s financial performance is directly affected by
fluctuations in the price of electricity. This applies to power
production and district heating, while revenues from Networks
are largely impacted by changes in the regulatory framework.
The power sales market is highly competitive, and profitability
is contingent on Hafslund’s ability to achieve further efficiency
improvements and improve customer deliveries.
Power prices are affected at any one time by the hydrological
balance and macroeconomic conditions in the Nordic region
and Europe, and relevant regulatory and political initiatives.
On 30 September 2013 future deliveries of power were listed
on Nasdaq OMX at NOK 340/MWh for the fourth quarter of
2013 and at NOK 310/MWh for 2014. Significant uncertainty
attaches to future power price changes. In order to leverage
market prospects more efficiently, and to hedge earnings and
cash flows, Hafslund has gradually migrated from a spot
policy to hedging some sales of produced energy.
In addition to ongoing operating investments in existing
business, the Group’s future investment requirements will be
strongly impacted by statutory investments in AMS. The
deadline for the final rollout of AMS has been set as 1
January 2019.
The strategic focus on core business will further reinforce
Hafslund’s role as a leading energy company, and underpin
the Group’s renewable energy, infrastructure for energy and
power market initiatives. Efficient and stable operations
combined with organic growth make it reasonable to consider
structural growth within core operations. The board believes
that Hafslund has established a sound commercial and
financial platform to secure satisfactory future performance
and to meet the challenges the Group will face in the time
ahead.
Oslo, 23 October 2013
Board of Directors
Hafslund ASA
10 REPORT TO SHAREHOLDERS THIRD-QUARTER 2013
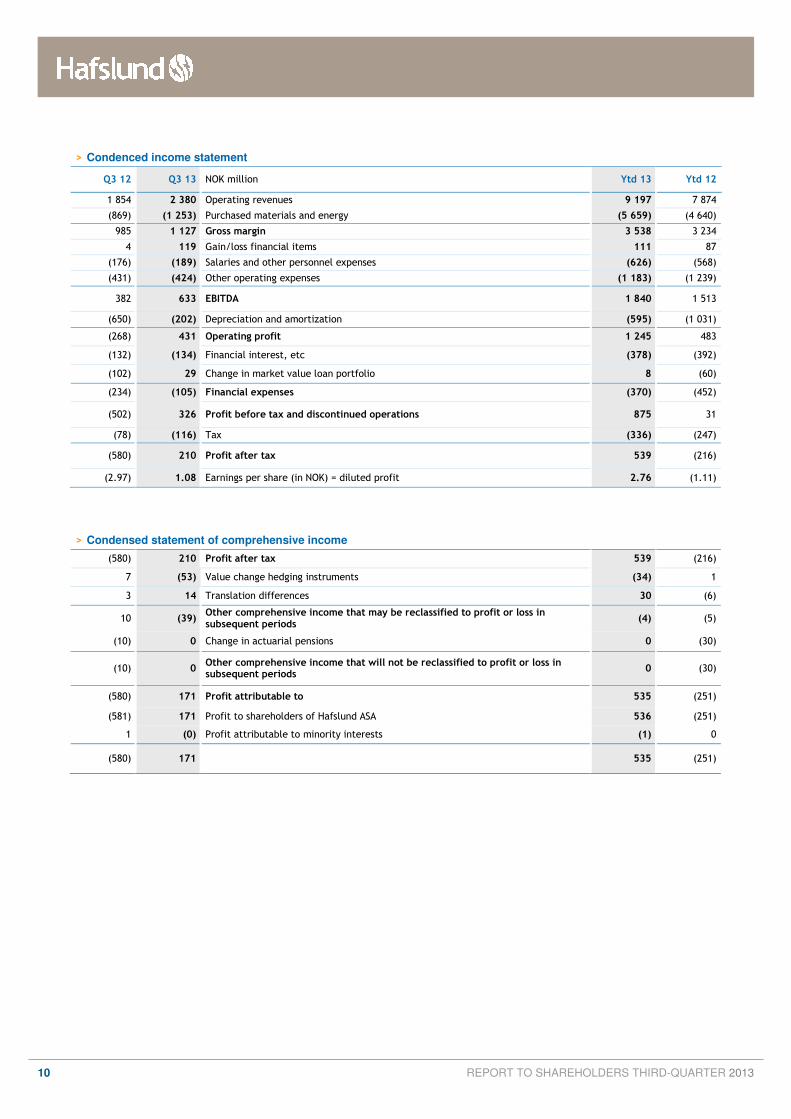
> Condenced income statement
Q3 12 Q3 13 NOK million Ytd 13 Ytd 12
1 854 2 380 Operating revenues 9 197 7 874
(869) (1 253) Purchased materials and energy (5 659) (4 640)
985 1 127 Gross margin 3 538 3 234
4 119 Gain/loss financial items 111 87
(176) (189) Salaries and other personnel expenses (626) (568)
(431) (424) Other operating expenses (1 183) (1 239)
382 633 EBITDA 1 840 1 513
(650) (202) Depreciation and amortization (595) (1 031)
(268) 431 Operating profit 1 245 483
(132) (134) Financial interest, etc (378) (392)
(102) 29 Change in market value loan portfolio 8 (60)
(234) (105) Financial expenses (370) (452)
(502) 326 Profit before tax and discontinued operations 875 31
(78) (116) Tax (336) (247)
(580) 210 Profit after tax 539 (216)
(2.97) 1.08 Earnings per share (in NOK) = diluted profit 2.76 (1.11)
> Condensed statement of comprehensive income
(580) 210 Profit after tax 539 (216)
7 (53) Value change hedging instruments (34) 1
3 14 Translation differences 30 (6)
10 (39) Other comprehensive income that may be reclassified to profit or loss in subsequent periods
(4) (5)
(10) 0 Change in actuarial pensions 0 (30)
(10) 0 Other comprehensive income that will not be reclassified to profit or loss in subsequent periods
0 (30)
(580) 171 Profit attributable to 535 (251)
(581) 171 Profit to shareholders of Hafslund ASA 536 (251)
1 (0) Profit attributable to minority interests (1) 0
(580) 171 535 (251)
11 REPORT TO SHAREHOLDERS THIRD-QUARTER 2013
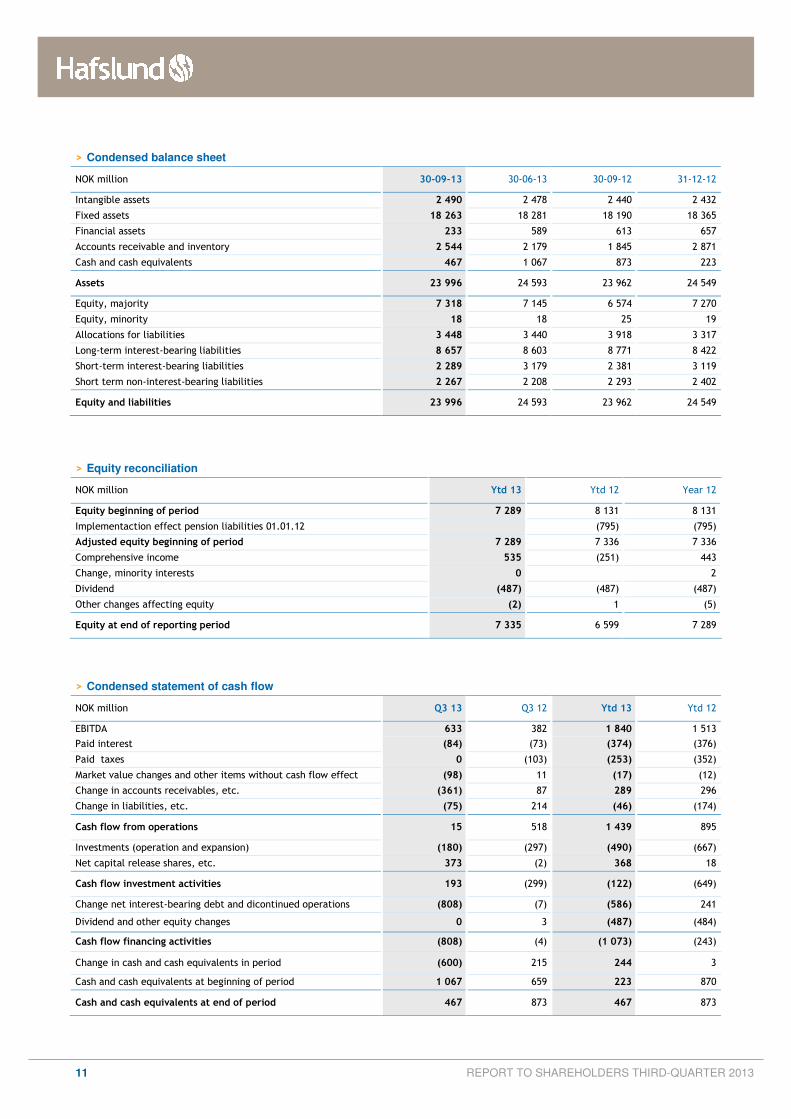
> Condensed balance sheet
NOK million 30-09-13 30-06-13 30-09-12 31-12-12
Intangible assets 2 490 2 478 2 440 2 432
Fixed assets 18 263 18 281 18 190 18 365
Financial assets 233 589 613 657
Accounts receivable and inventory 2 544 2 179 1 845 2 871
Cash and cash equivalents 467 1 067 873 223
Assets 23 996 24 593 23 962 24 549
Equity, majority 7 318 7 145 6 574 7 270
Equity, minority 18 18 25 19
Allocations for liabilities 3 448 3 440 3 918 3 317
Long-term interest-bearing liabilities 8 657 8 603 8 771 8 422
Short-term interest-bearing liabilities 2 289 3 179 2 381 3 119
Short term non-interest-bearing liabilities 2 267 2 208 2 293 2 402
Equity and liabilities 23 996 24 593 23 962 24 549
> Equity reconciliation
NOK million Ytd 13 Ytd 12 Year 12
Equity beginning of period 7 289 8 131 8 131
Implementaction effect pension liabilities 01.01.12 (795) (795)
Adjusted equity beginning of period 7 289 7 336 7 336
Comprehensive income 535 (251) 443
Change, minority interests 0 2
Dividend (487) (487) (487)
Other changes affecting equity (2) 1 (5)
Equity at end of reporting period 7 335 6 599 7 289
> Condensed statement of cash flow
NOK million Q3 13 Q3 12 Ytd 13 Ytd 12
EBITDA 633 382 1 840 1 513
Paid interest (84) (73) (374) (376)
Paid taxes 0 (103) (253) (352)
Market value changes and other items without cash flow effect (98) 11 (17) (12)
Change in accounts receivables, etc. (361) 87 289 296
Change in liabilities, etc. (75) 214 (46) (174)
Cash flow from operations 15 518 1 439 895
Investments (operation and expansion) (180) (297) (490) (667)
Net capital release shares, etc. 373 (2) 368 18
Cash flow investment activities 193 (299) (122) (649)
Change net interest-bearing debt and dicontinued operations (808) (7) (586) 241
Dividend and other equity changes 0 3 (487) (484)
Cash flow financing activities (808) (4) (1 073) (243)
Change in cash and cash equivalents in period (600) 215 244 3
Cash and cash equivalents at beginning of period 1 067 659 223 870
Cash and cash equivalents at end of period 467 873 467 873
12 REPORT TO SHAREHOLDERS THIRD-QUARTER 2013
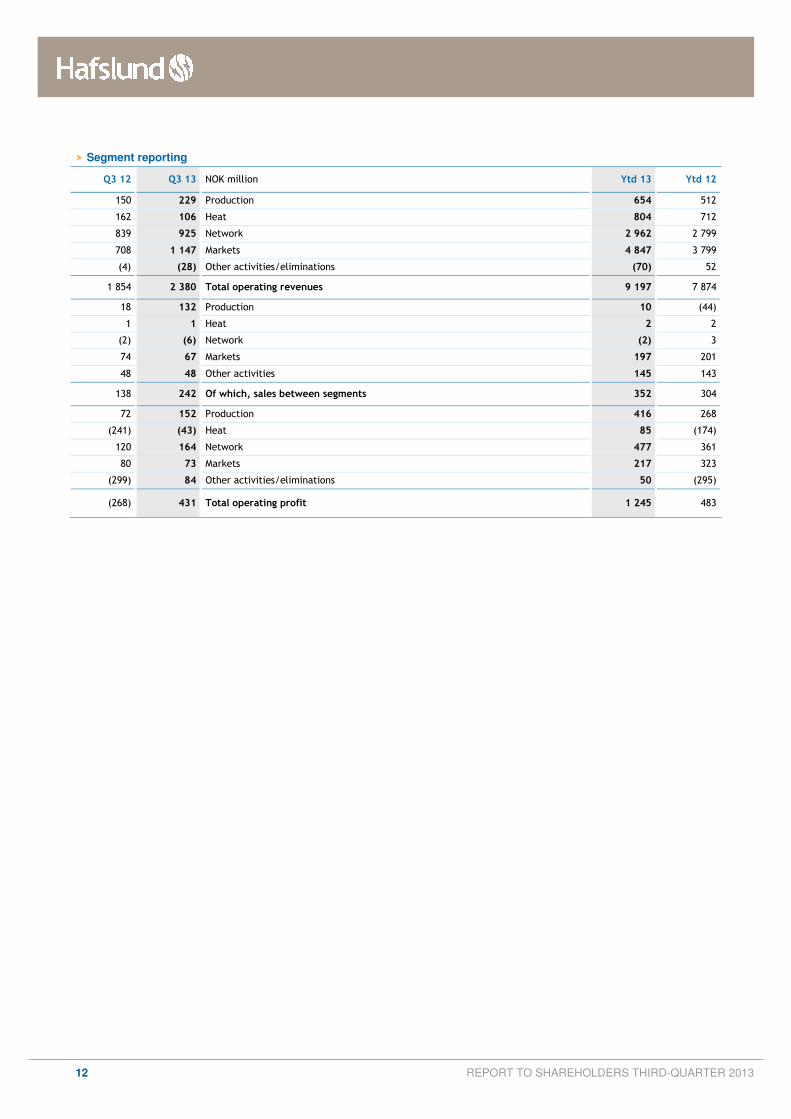
> Segment reporting
Q3 12 Q3 13 NOK million Ytd 13 Ytd 12
150 229 Production 654 512
162 106 Heat 804 712
839 925 Network 2 962 2 799
708 1 147 Markets 4 847 3 799
(4) (28) Other activities/eliminations (70) 52
1 854 2 380 Total operating revenues 9 197 7 874
18 132 Production 10 (44)
1 1 Heat 2 2
(2) (6) Network (2) 3
74 67 Markets 197 201
48 48 Other activities 145 143
138 242 Of which, sales between segments 352 304
72 152 Production 416 268
(241) (43) Heat 85 (174)
120 164 Network 477 361
80 73 Markets 217 323
(299) 84 Other activities/eliminations 50 (295)
(268) 431 Total operating profit 1 245 483
13 REPORT TO SHAREHOLDERS THIRD-QUARTER 2013
Notes to the accounts
1) Framework conditions and key accounting policies
The consolidated financial statements for the third quarter of 2013, the period ending 30 September 2013, have been prepared
in accordance with International Financial Accounting Standards (IRFSs) as established by the EU and include Hafslund ASA
and its associates and subsidiaries. This interim report, which has not been audited, has been prepared in accordance with IAS
34 Interim Financial Reporting. The interim financial statements do not provide the same scope of information as the annual
financial statements and should therefore be viewed in the context of the consolidated financial statements for 2012. The
accounting policies and calculation methods applied in interim reporting are the same as those described in Note 2 to the
consolidated annual financial statements for 2012, with the exception of accounting policies concerning accounting for pensions.
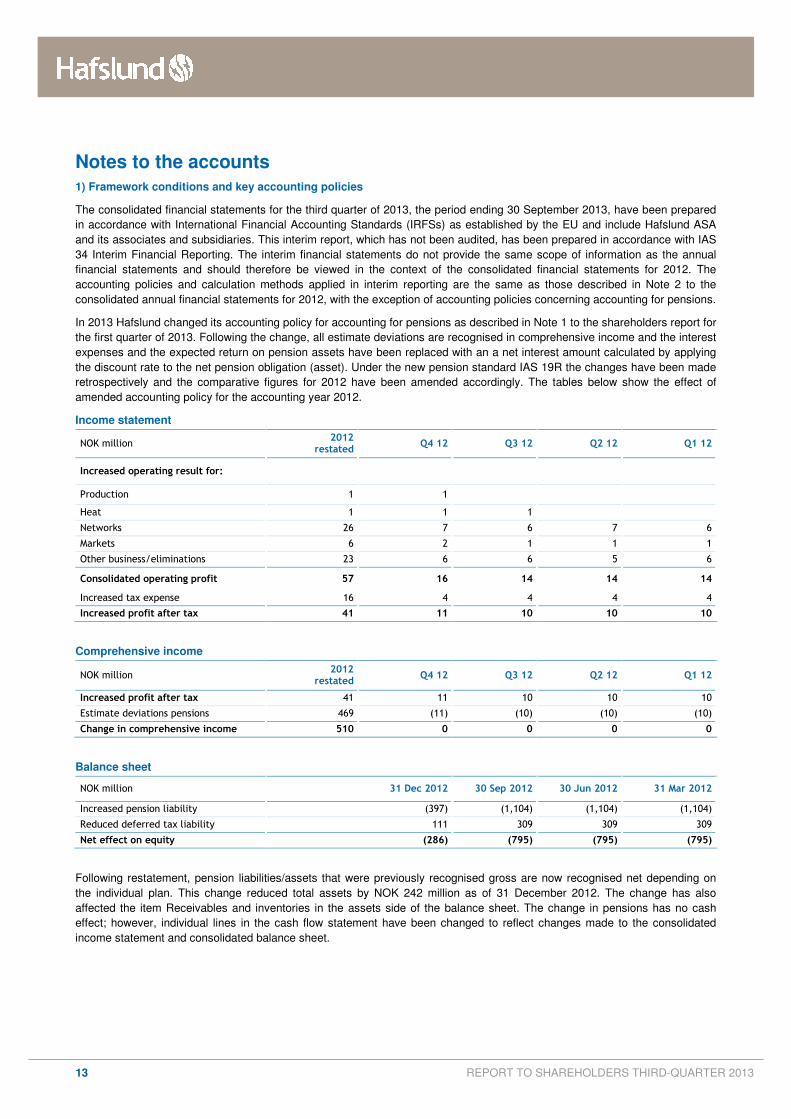
In 2013 Hafslund changed its accounting policy for accounting for pensions as described in Note 1 to the shareholders report for
the first quarter of 2013. Following the change, all estimate deviations are recognised in comprehensive income and the interest
expenses and the expected return on pension assets have been replaced with an a net interest amount calculated by applying
the discount rate to the net pension obligation (asset). Under the new pension standard IAS 19R the changes have been made
retrospectively and the comparative figures for 2012 have been amended accordingly. The tables below show the effect of
amended accounting policy for the accounting year 2012.
Income statement
NOK million 2012
restated Q4 12 Q3 12 Q2 12 Q1 12
Increased operating result for:
Production 1 1
Heat 1 1 1
Networks 26 7 6 7 6
Markets 6 2 1 1 1
Other business/eliminations 23 6 6 5 6
Consolidated operating profit 57 16 14 14 14
Increased tax expense 16 4 4 4 4
Increased profit after tax 41 11 10 10 10
Comprehensive income
NOK million 2012
restated Q4 12 Q3 12 Q2 12 Q1 12
Increased profit after tax 41 11 10 10 10
Estimate deviations pensions 469 (11) (10) (10) (10)
Change in comprehensive income 510 0 0 0 0
Balance sheet
NOK million 31 Dec 2012 30 Sep 2012 30 Jun 2012 31 Mar 2012
Increased pension liability (397) (1,104) (1,104) (1,104)
Reduced deferred tax liability 111 309 309 309
Net effect on equity (286) (795) (795) (795)
Following restatement, pension liabilities/assets that were previously recognised gross are now recognised net depending on
the individual plan. This change reduced total assets by NOK 242 million as of 31 December 2012. The change has also
affected the item Receivables and inventories in the assets side of the balance sheet. The change in pensions has no cash
effect; however, individual lines in the cash flow statement have been changed to reflect changes made to the consolidated
income statement and consolidated balance sheet.
14 REPORT TO SHAREHOLDERS THIRD-QUARTER 2013
2) Networks – income ceiling and income surpluses/shortfalls
Under IFRSs special accounting policies apply to the accounting treatment of grid rental (regulatory income). Grid rental
recognised in income in individual years corresponds to the volume delivered in the period, settled at the established tariff in
force at any one time. Permitted income comprises the revenue ceiling established by the regulator (the Norwegian Water
Resources and Energy Directorate – NVE) plus transmission costs (Statnett), Enova mark-ups and property tax less downtime
costs. Income surpluses/shortfalls, which represent the difference between recognised grid rental and permitted income, are
defined under IFRSs as regulatory liabilities/assets that do not qualify for balance-sheet recognition. This is justified on the
grounds that a contract has not been entered into with a particular customer and therefore the resulting receivable/liability is
theoretically contingent on a future delivery. The tariffs are managed based on the rationale that the annual income will over
time correspond to the permitted income. Income surpluses arise if the grid rental recognised in income is higher than the
permitted income for the year and this will have a positive impact on the result. On the same principle, income shortfalls will
negatively impact the bottom line.
Networks’ result for the third quarter of 2013 includes an income shortfall of NOK 44 million. The result for the corresponding
period in 2012 reflects surplus income of NOK 65 million. In the third quarter of 2013 Networks’ operating result includes an
income shortfall of NOK 164 million (income surplus of NOK 35 million). At the end of the third quarter of 2013, Hafslund Nett's
accumulated surplus income amounted to NOK 268 million.
3) Interest-bearing loans and interest and currency derivatives
At the end of the third quarter of 2013, the value of the loan portfolio recognised in the balance sheet amounted to NOK 10,946
million, of which NOK 8,657 million related to long-term liabilities and NOK 2,289 million to current liabilities. The change in the
fair value of loans boosted profits by NOK 29 million in the reporting period. The change in the fair value of interest and currency
derivatives had a combined positive effect on results of NOK 7 million in the third quarter of 2013. In the third quarter of 2013
Hafslund’s credit spreads had an entry position of around 10 basis points for maturities up to one year and more than five years.
For maturities of 2–4 years the entry position was around 5 basis points. NIBOR and swap rates rose by 10 to 15 basis points
for maturities of up to 2 years and around 20 basis points for longer maturities. The net effect of the above was a slight
decrease in the market interest rate (including Hafslund’s credit spreads) for maturities up to 1 year and an increase of around
10 basis points for longer maturities.
The change in the fair value of loans is recognised in income as financial expenses, while the change in value of interest and
currency derivatives is recognised in income as net financial items in the operating result. None of the Group’s loan agreements
impose any financial covenants. As of 30 September 2013 the loan and interest derivatives portfolio was split between fixed and
variable rates in the ratio 53/47. Hafslund has a drawdown facility of NOK 3,600 million with a syndicate of six Nordic banks that
matures in 2018. The company has negotiated favourable terms and no financial covenants attach to the loan agreement. The
facility is intended to be used as a general liquidity reserve. Hafslund also has an unused bank overdraft facility with Nordea of
NOK 100 million.
The Group has liabilities denominated in foreign currency. In addition, Group businesses conduct transactions that are exposed
to currency fluctuations. Currently this applies in particular to EUR- and SEK-denominated trades in power and power
derivatives. The Group’s treasury department is responsible for currency hedging, and performs all transactions with the market.
In the case of foreign currency borrowings, principal amounts and basis interest rates are hedged using basis swaps when
borrowings are taken out. Until 31 December 2009 the Group’s entire loan portfolio was valued at fair value through profit or
loss. Since 2010 new borrowings have been measured at amortised cost and at the end of the third quarter of 2013 these
amounted to NOK 5,312 million.
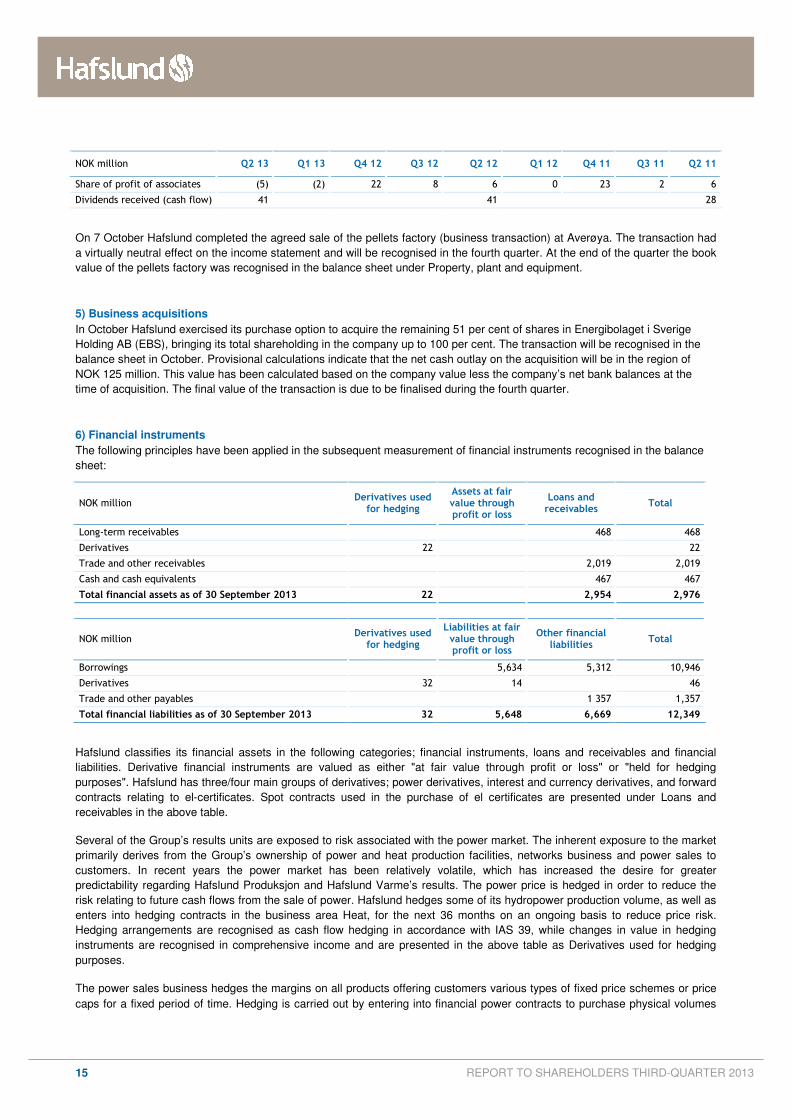
4) Business divestments
On 25 June 2013 Hafslund ASA entered into an agreement to sell its entire shareholding of 27.6 million shares in Infratek ASA,
equating to 43.3% of all outstanding shares in Infratek, at a price of NOK 14 per share. The Norwegian and Swedish anti-trust
authorities approved the sale in July 2013 and the transaction was recognised in the third quarter of 2013. The sale generated
an accounting profit of NOK 90 million, which has been recognised under the item Net financial items in the income statement
and in the Other business segment. The recognised result from the investment until the time of sale has also been recognised
under Net financial items. The table below shows the recognised profit/loss per quarter and dividends received (cash flow) for
the investment in Infratek ASA:
15 REPORT TO SHAREHOLDERS THIRD-QUARTER 2013
NOK million Q2 13 Q1 13 Q4 12 Q3 12 Q2 12 Q1 12 Q4 11 Q3 11 Q2 11
Share of profit of associates (5) (2) 22 8 6 0 23 2 6
Dividends received (cash flow) 41 41 28
On 7 October Hafslund completed the agreed sale of the pellets factory (business transaction) at Averøya. The transaction had
a virtually neutral effect on the income statement and will be recognised in the fourth quarter. At the end of the quarter the book
value of the pellets factory was recognised in the balance sheet under Property, plant and equipment.
5) Business acquisitions
In October Hafslund exercised its purchase option to acquire the remaining 51 per cent of shares in Energibolaget i Sverige
Holding AB (EBS), bringing its total shareholding in the company up to 100 per cent. The transaction will be recognised in the
balance sheet in October. Provisional calculations indicate that the net cash outlay on the acquisition will be in the region of
NOK 125 million. This value has been calculated based on the company value less the company’s net bank balances at the
time of acquisition. The final value of the transaction is due to be finalised during the fourth quarter.
6) Financial instruments
The following principles have been applied in the subsequent measurement of financial instruments recognised in the balance
sheet:
NOK million Derivatives used
for hedging
Assets at fair value through profit or loss
Loans and receivables
Total
Long-term receivables 468 468
Derivatives 22 22
Trade and other receivables 2,019 2,019
Cash and cash equivalents 467 467
Total financial assets as of 30 September 2013 22 2,954 2,976
NOK million Derivatives used
for hedging
Liabilities at fair value through profit or loss
Other financial liabilities
Total
Borrowings 5,634 5,312 10,946
Derivatives 32 14 46
Trade and other payables 1 357 1,357
Total financial liabilities as of 30 September 2013 32 5,648 6,669 12,349
Hafslund classifies its financial assets in the following categories; financial instruments, loans and receivables and financial
liabilities. Derivative financial instruments are valued as either "at fair value through profit or loss" or "held for hedging
purposes". Hafslund has three/four main groups of derivatives; power derivatives, interest and currency derivatives, and forward
contracts relating to el-certificates. Spot contracts used in the purchase of el certificates are presented under Loans and
receivables in the above table.
Several of the Group’s results units are exposed to risk associated with the power market. The inherent exposure to the market
primarily derives from the Group’s ownership of power and heat production facilities, networks business and power sales to
customers. In recent years the power market has been relatively volatile, which has increased the desire for greater
predictability regarding Hafslund Produksjon and Hafslund Varme’s results. The power price is hedged in order to reduce the
risk relating to future cash flows from the sale of power. Hafslund hedges some of its hydropower production volume, as well as
enters into hedging contracts in the business area Heat, for the next 36 months on an ongoing basis to reduce price risk.
Hedging arrangements are recognised as cash flow hedging in accordance with IAS 39, while changes in value in hedging
instruments are recognised in comprehensive income and are presented in the above table as Derivatives used for hedging
purposes.
The power sales business hedges the margins on all products offering customers various types of fixed price schemes or price
caps for a fixed period of time. Hedging is carried out by entering into financial power contracts to purchase physical volumes
16 REPORT TO SHAREHOLDERS THIRD-QUARTER 2013
corresponding to the supply obligation to the customers. Financial power contracts are recognised at fair value through profit or
loss and do not satisfy the requirements for hedge accounting. The Group enters into contract trading to hedge the margins on
its customer portfolios. In a market characterised by major fluctuations in wholesale and forward prices, the fair value of future
power contracts will vary in line with price changes on Nasdaq OMX. Towards the end of the third quarter of 2013 wholesale
and forward prices rose, impacting the unrealised values of power contracts. A gain of around NOK 10 million was recognised in
respect of increase in unrealised values in the third quarter. Gains on increases in the value of power contracts will be largely
offset by corresponding reduced margins relating to end-user contracts. However, the Group’s end-user contracts are not
deemed to fall within the scope of IAS 39 and are recognised in accordance with the lowest value principle
7) Operating assets
A total of NOK 490 million has been invested in operating assets in the year to date, of which NOK 180 million relates to the
third quarter. All the investments relate to operations and expansion.
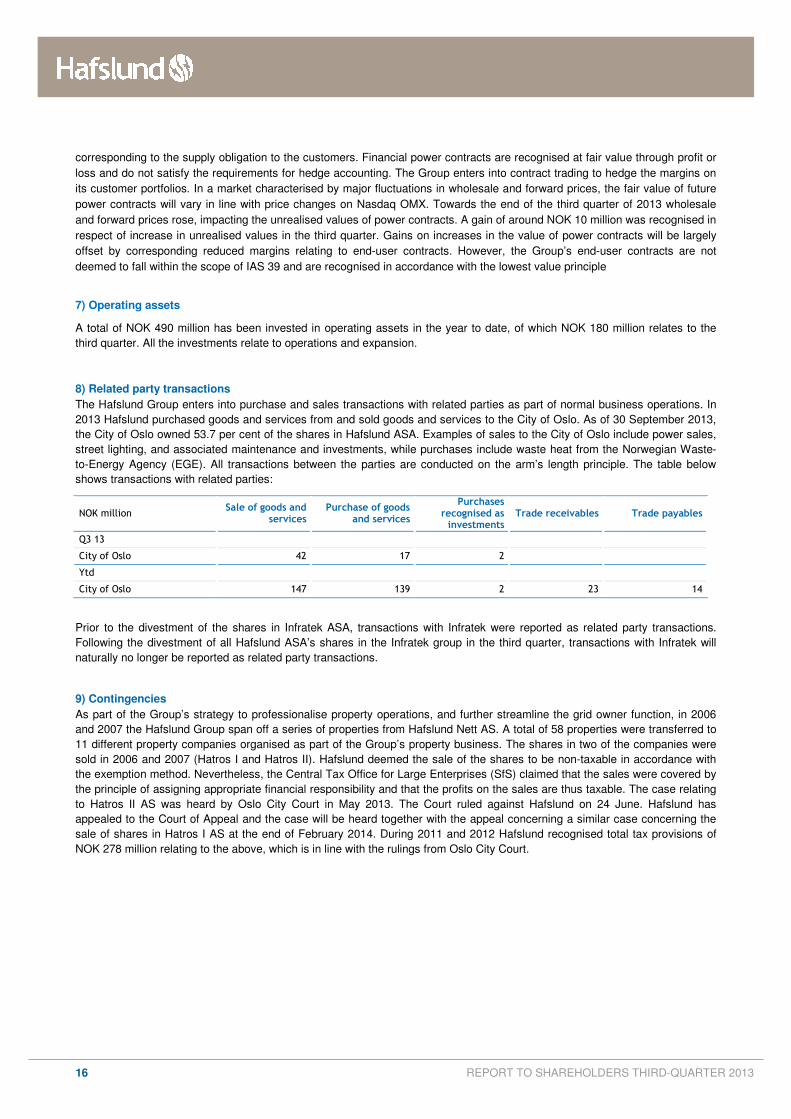
8) Related party transactions
The Hafslund Group enters into purchase and sales transactions with related parties as part of normal business operations. In
2013 Hafslund purchased goods and services from and sold goods and services to the City of Oslo. As of 30 September 2013,
the City of Oslo owned 53.7 per cent of the shares in Hafslund ASA. Examples of sales to the City of Oslo include power sales,
street lighting, and associated maintenance and investments, while purchases include waste heat from the Norwegian Waste-
to-Energy Agency (EGE). All transactions between the parties are conducted on the arm’s length principle. The table below
shows transactions with related parties:
NOK million Sale of goods and
services Purchase of goods
and services
Purchases recognised as investments
Trade receivables Trade payables
Q3 13
City of Oslo 42 17 2
Ytd
City of Oslo 147 139 2 23 14
Prior to the divestment of the shares in Infratek ASA, transactions with Infratek were reported as related party transactions.
Following the divestment of all Hafslund ASA’s shares in the Infratek group in the third quarter, transactions with Infratek will
naturally no longer be reported as related party transactions.
9) Contingencies
As part of the Group’s strategy to professionalise property operations, and further streamline the grid owner function, in 2006
and 2007 the Hafslund Group span off a series of properties from Hafslund Nett AS. A total of 58 properties were transferred to
11 different property companies organised as part of the Group’s property business. The shares in two of the companies were
sold in 2006 and 2007 (Hatros I and Hatros II). Hafslund deemed the sale of the shares to be non-taxable in accordance with
the exemption method. Nevertheless, the Central Tax Office for Large Enterprises (SfS) claimed that the sales were covered by
the principle of assigning appropriate financial responsibility and that the profits on the sales are thus taxable. The case relating
to Hatros II AS was heard by Oslo City Court in May 2013. The Court ruled against Hafslund on 24 June. Hafslund has
appealed to the Court of Appeal and the case will be heard together with the appeal concerning a similar case concerning the
sale of shares in Hatros I AS at the end of February 2014. During 2011 and 2012 Hafslund recognised total tax provisions of
NOK 278 million relating to the above, which is in line with the rulings from Oslo City Court.
17 REPORT TO SHAREHOLDERS THIRD-QUARTER 2013
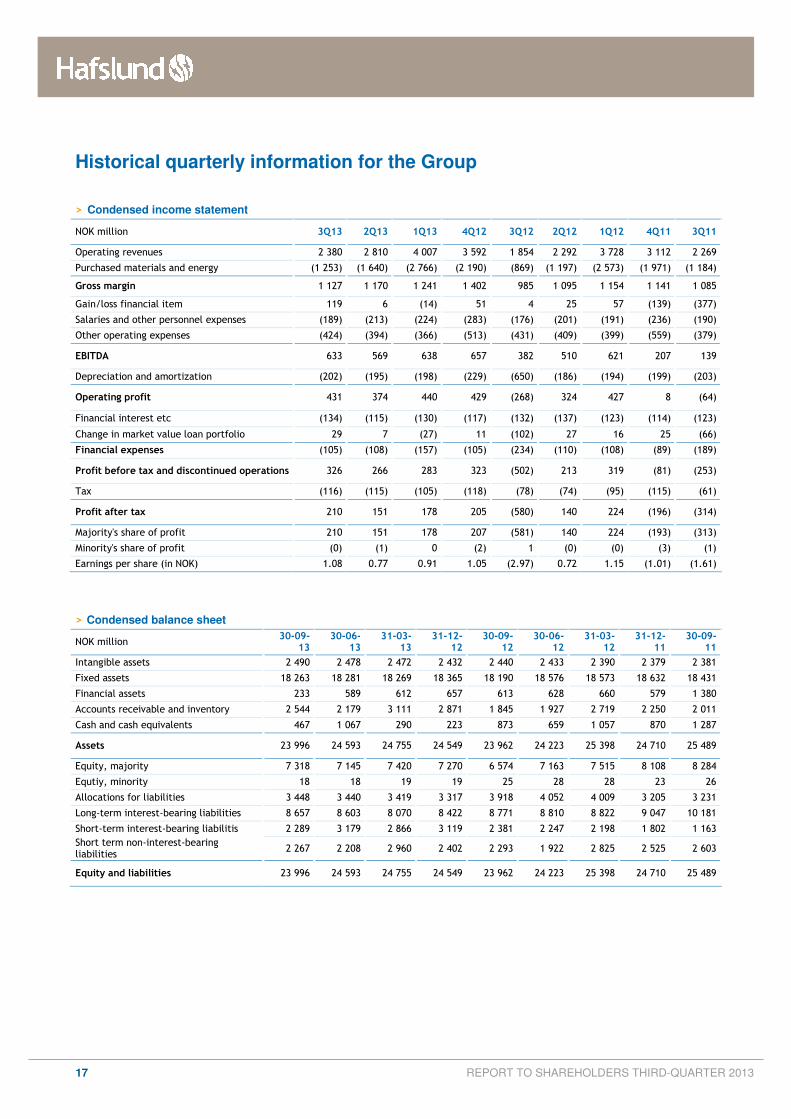
Historical quarterly information for the Group
> Condensed income statement
NOK million 3Q13 2Q13 1Q13 4Q12 3Q12 2Q12 1Q12 4Q11 3Q11
Operating revenues 2 380 2 810 4 007 3 592 1 854 2 292 3 728 3 112 2 269
Purchased materials and energy (1 253) (1 640) (2 766) (2 190) (869) (1 197) (2 573) (1 971) (1 184)
Gross margin 1 127 1 170 1 241 1 402 985 1 095 1 154 1 141 1 085
Gain/loss financial item 119 6 (14) 51 4 25 57 (139) (377)
Salaries and other personnel expenses (189) (213) (224) (283) (176) (201) (191) (236) (190)
Other operating expenses (424) (394) (366) (513) (431) (409) (399) (559) (379)
EBITDA 633 569 638 657 382 510 621 207 139
Depreciation and amortization (202) (195) (198) (229) (650) (186) (194) (199) (203)
Operating profit 431 374 440 429 (268) 324 427 8 (64)
Financial interest etc (134) (115) (130) (117) (132) (137) (123) (114) (123)
Change in market value loan portfolio 29 7 (27) 11 (102) 27 16 25 (66)
Financial expenses (105) (108) (157) (105) (234) (110) (108) (89) (189)
Profit before tax and discontinued operations 326 266 283 323 (502) 213 319 (81) (253)
Tax (116) (115) (105) (118) (78) (74) (95) (115) (61)
Profit after tax 210 151 178 205 (580) 140 224 (196) (314)
Majority's share of profit 210 151 178 207 (581) 140 224 (193) (313)
Minority's share of profit (0) (1) 0 (2) 1 (0) (0) (3) (1)
Earnings per share (in NOK) 1.08 0.77 0.91 1.05 (2.97) 0.72 1.15 (1.01) (1.61)
> Condensed balance sheet
NOK million 30-09-
13 30-06-
13 31-03-
13 31-12-
12 30-09-
12 30-06-
12 31-03-
12 31-12-
11 30-09-
11
Intangible assets 2 490 2 478 2 472 2 432 2 440 2 433 2 390 2 379 2 381
Fixed assets 18 263 18 281 18 269 18 365 18 190 18 576 18 573 18 632 18 431
Financial assets 233 589 612 657 613 628 660 579 1 380
Accounts receivable and inventory 2 544 2 179 3 111 2 871 1 845 1 927 2 719 2 250 2 011
Cash and cash equivalents 467 1 067 290 223 873 659 1 057 870 1 287
Assets 23 996 24 593 24 755 24 549 23 962 24 223 25 398 24 710 25 489
Equity, majority 7 318 7 145 7 420 7 270 6 574 7 163 7 515 8 108 8 284
Equtiy, minority 18 18 19 19 25 28 28 23 26
Allocations for liabilities 3 448 3 440 3 419 3 317 3 918 4 052 4 009 3 205 3 231
Long-term interest-bearing liabilities 8 657 8 603 8 070 8 422 8 771 8 810 8 822 9 047 10 181
Short-term interest-bearing liabilitis 2 289 3 179 2 866 3 119 2 381 2 247 2 198 1 802 1 163
Short term non-interest-bearing liabilities
2 267 2 208 2 960 2 402 2 293 1 922 2 825 2 525 2 603
Equity and liabilities 23 996 24 593 24 755 24 549 23 962 24 223 25 398 24 710 25 489
18 REPORT TO SHAREHOLDERS THIRD-QUARTER 2013
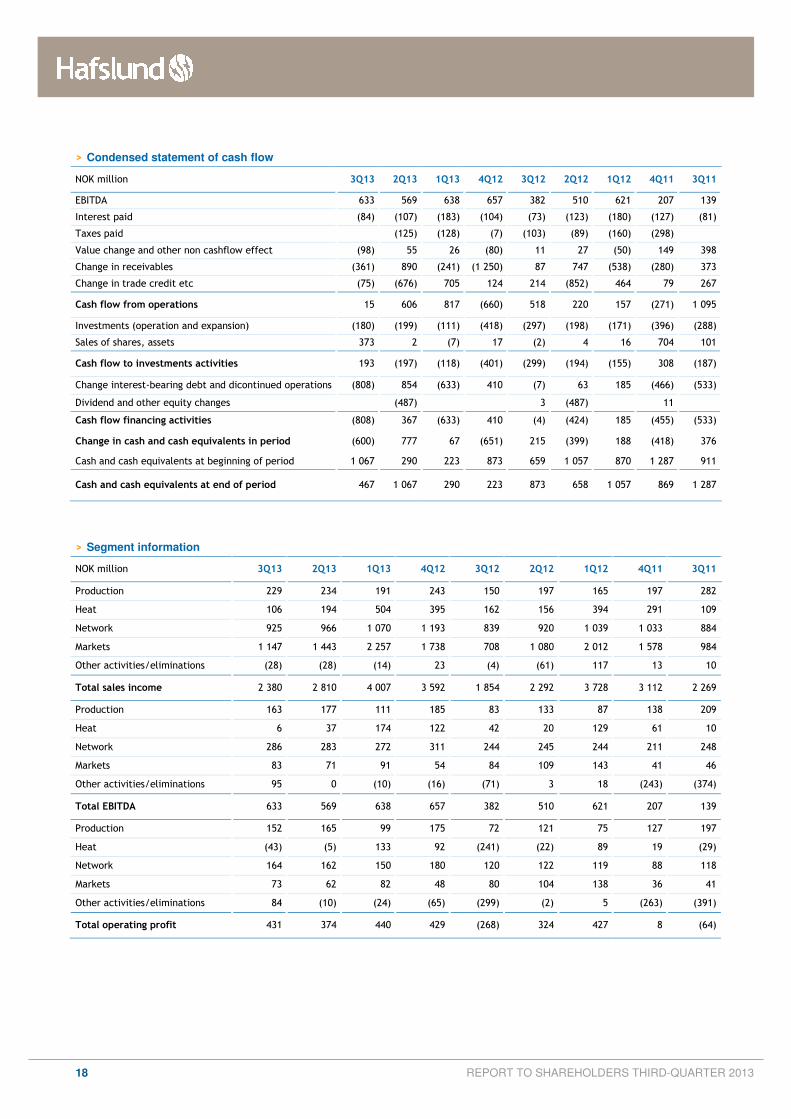
> Condensed statement of cash flow
NOK million 3Q13 2Q13 1Q13 4Q12 3Q12 2Q12 1Q12 4Q11 3Q11
EBITDA 633 569 638 657 382 510 621 207 139
Interest paid (84) (107) (183) (104) (73) (123) (180) (127) (81)
Taxes paid
(125) (128) (7) (103) (89) (160) (298)
Value change and other non cashflow effect (98) 55 26 (80) 11 27 (50) 149 398
Change in receivables (361) 890 (241) (1 250) 87 747 (538) (280) 373
Change in trade credit etc (75) (676) 705 124 214 (852) 464 79 267
Cash flow from operations 15 606 817 (660) 518 220 157 (271) 1 095
Investments (operation and expansion) (180) (199) (111) (418) (297) (198) (171) (396) (288)
Sales of shares, assets 373 2 (7) 17 (2) 4 16 704 101
Cash flow to investments activities 193 (197) (118) (401) (299) (194) (155) 308 (187)
Change interest-bearing debt and dicontinued operations (808) 854 (633) 410 (7) 63 185 (466) (533)
Dividend and other equity changes
(487)
3 (487)
11
Cash flow financing activities (808) 367 (633) 410 (4) (424) 185 (455) (533)
Change in cash and cash equivalents in period (600) 777 67 (651) 215 (399) 188 (418) 376
Cash and cash equivalents at beginning of period 1 067 290 223 873 659 1 057 870 1 287 911
Cash and cash equivalents at end of period 467 1 067 290 223 873 658 1 057 869 1 287
> Segment information
NOK million 3Q13 2Q13 1Q13 4Q12 3Q12 2Q12 1Q12 4Q11 3Q11
Production 229 234 191 243 150 197 165 197 282
Heat 106 194 504 395 162 156 394 291 109
Network 925 966 1 070 1 193 839 920 1 039 1 033 884
Markets 1 147 1 443 2 257 1 738 708 1 080 2 012 1 578 984
Other activities/eliminations (28) (28) (14) 23 (4) (61) 117 13 10
Total sales income 2 380 2 810 4 007 3 592 1 854 2 292 3 728 3 112 2 269
Production 163 177 111 185 83 133 87 138 209
Heat 6 37 174 122 42 20 129 61 10
Network 286 283 272 311 244 245 244 211 248
Markets 83 71 91 54 84 109 143 41 46
Other activities/eliminations 95 0 (10) (16) (71) 3 18 (243) (374)
Total EBITDA 633 569 638 657 382 510 621 207 139
Production 152 165 99 175 72 121 75 127 197
Heat (43) (5) 133 92 (241) (22) 89 19 (29)
Network 164 162 150 180 120 122 119 88 118
Markets 73 62 82 48 80 104 138 36 41
Other activities/eliminations 84 (10) (24) (65) (299) (2) 5 (263) (391)
Total operating profit 431 374 440 429 (268) 324 427 8 (64)
19 REPORT TO SHAREHOLDERS THIRD-QUARTER 2013
Financial calendar
1. Fourth-quarter 2013 report - 5 February 2014
2. First-quarter 2014 report - 8 May 2014
3. Annual General Meeting - 8 May 2014
3. Second-quarter 2014 report - 10 July 2014
4. Third-quarter 2014 report - 22 October 2014
Investor information
1. Additional information is available from Hafslund’s website:
o www.hafslund.no
o You can subscribe to Hafslund press releases
2. Group CFO, Heidi Ulmo
o tel: +47 909 19 325
3. Financial Director and investor relations contact, Morten J. Hansen
o tel: +47 908 28 577

20 REPORT TO SHAREHOLDERS THIRD-QUARTER 2013
>
Hafslund ASA
Drammensveien 144, Skøyen
N-0247 Oslo, Norway
Tel: + 47 22 43 50 00
Faks: + 47 22 43 51 69
www.hafslund.no
emaiø: [email protected]


![Estimating Road Segments Using Natural Point ...segments”-contest [6] was organized with the task of averaging segments of GPS trajectories to predict road segments while including](https://img.pdfslide.us/doc/110x75/60cfe59c42219c07ae1490d1/estimating-road-segments-using-natural-point-segmentsa-contest-6-was-organized.jpg)