Embed Size (px)
Citation preview

Annual Report
Edcon Holdings Limited
For the 52 weeks ended 30 March 2013

2
EDCON ANNUAL REPORT 2013
Index
Page
Introduction 3
Business 3
Shareholders and Management 3
Summary Historical and Pro Forma Financial and Other Data 4
Management’s Discussion and Analysis of Audited Consolidated Results 5
Risk Factors 14
Audited Consolidated and Company Annual Financial Statements 22
Corporate Information
151
This annual report includes forward looking statements. All statements other than statements of historical facts
contained in this annual report, including, without limitation, those regarding our future financial position and
results of operations, our strategy, plans, objectives, goals, targets and future developments in the markets in
which we participate or are seeking to participate, and any statements preceded by, followed by or that include
the words “anticipate”, “believe”, “continue”, “could”, “estimate”, “expect”, “forecast”, “aim”, “intend”, “will”, “may”,
“plan”, “should” or similar expressions or the negative thereof, are forward-looking statements. Any statements
contained herein regarding industry outlook, our expectations regarding future performance, liquidity and capital
resources and other non-historical statements in this discussion are forward looking statements. Such forward-
looking statements involve known and unknown risks, uncertainties and other factors which may cause our actual
results, performance or achievements, or industry results, to be materially different from any future results,
performance or achievements expressed or implied by such forward-looking statements. Such forward-looking
statements are based on numerous assumptions regarding our present and future business strategies and the
environment in which we will operate in the future. Our actual results may differ materially from these contained or
implied by any forward looking statements.

3
BUSINESS
Edcon Holdings Limited (“the Group” or “Edcon” or “we” or “us”) is South Africa’s largest non-food retailer,
with a market share of the South African clothing and footwear (C&F) market nearly twice that of its nearest
competitor. Edcon has been in operation for more than 80 years and has expanded its footprint to 1,233
stores as at 30 March 2013 under three principal divisions comprising nine key store chains throughout
southern Africa.
Edcon’s Edgars division, which consists of department stores targeted at middle- to upper-income
customers, includes store chains Edgars, Edgars Active, Edgars Shoe Gallery, Boardmans and Red
Square, and accounted for 53% of total retail sales in the 52-week period ended 30 March 2013. Edcon’s
Discount division, which consists of discount stores selling value merchandise targeted at lower- to middle-
income customers, includes store chains Jet, Legit and Jet Mart, and accounted for 39% of total retail sales
in the 52 week period ended 30 March 2013. Edcon is a leading retailer of books and magazines in South
Africa under its CNA division, which accounted for 8% of total retail sales in the 52-week period ended
30 March 2013. Edcon also sells mobile phones, related accessories and airtime across all of its divisions,
which is included in retail sales and accounted for 10% of total retail sales in the 52 week period ended
30 March 2013. Edcon’s popular retail store chains allow it to serve a wide cross-section of South African
society. In November 2012, Edcon opened its first mono-brand store, Topshop, in Johannesburg followed
by the opening of a second Topshop store in Durban in December 2012. Edcon is the number one or
number two retailer in the majority of its product lines, including clothing, footwear, cosmetics, mobile
phones, stationery and books.
Although our retail businesses are divided into three divisions we maintain six operating segments as
detailed in note 2 of the consolidated financial statements on page 61 of this report. See “Notes to the
Consolidated Financial Statements of Edcon Holdings Limited – Operating Segment Report”. There have
been no material changes in Edcon’s business from the date of publication of the Offering Memorandum
dated 8 February 2013.
SHAREHOLDERS AND MANAGEMENT
Shareholders
Edcon’s shareholders are described in the directors’ report of the consolidated financial statements on page
28 of this report. See “Audited Consolidated and Company Annual Financial Statements of Edcon Holdings
Limited – Directors Report - Shareholding”. There have been no material changes in Edcon’s shareholders
from the date of publication of the Offering Memorandum dated 8 February 2013.
Directors and management
Edcon has a unitary board structure comprising three executive directors, four non executive directors and
four independent non-executive directors. Our board has delegated authority for the day-to-day affairs of
each of our divisions to our executive managers comprising the group chief executive officer, the deputy
chief executive officer and chief financial officer, the chief operating officer and the chief executives of the
Edgars and Discount divisions. The group chief executive officer is currently also the chief executive for the
Edgars division.
The members of the board and the executive management committee are described in the directors’ report
of the consolidated financial statements on page 29 of this report. See “Audited Consolidated and Company
Annual Financial Statements of Edcon Holdings Limited – Directors’ Report”. There have been no material
changes in Edcon’s directors and management from the date of publication of the Offering Memorandum
dated 8 February 2013.

4
SUMMARY HISTORICAL AND PRO FORMA FINANCIAL AND OTHER DATA
The following historical financial data relates to the audited consolidated financial statements for the 52-
week period ended 30 March 2013, the 52-week period ended 31 March 2012 and the 52-week period
ended 2 April 2011 which appear elsewhere in this annual report. These consolidated financial statements
have been audited by Ernst & Young Inc., South Africa. Unless the context requires otherwise, references
in this notice to “financial year 2013” (or “FY2013”) and “financial year 2012” (or “FY2012”) and “financial
year 2011” (or “FY2011”) shall mean the 52-week period ended 30 March 2013, the 52-week period ended
31 March 2012 and the 52-week period ended 2 April 2011 respectively.
Throughout these reports Edgars refers to the Edgars division, which comprises Edgars, Red Square,
Boardmans, Edgars Active, Edgars Shoe Gallery and the mono-branded stores while Discount refers to the
Discount division, which comprises Jet, Jet Mart and Legit as well as Discom prior to the conversion/closure
of these stores.
The summary historical and pro forma financial and other data are detailed in the next entitled section
“Management’s discussion and analysis of audited consolidated results”. Following the unwind of
OntheCards Investments II Proprietary Limited (“OtC”) on 31 October 2012 and the sale of the trade
receivables under our private label store card program to Absa Bank Limited (“Absa”) on 1 November 2012,
we believe that the presentation of our financial information excluding the impact of consolidating OtC is no
longer relevant to analyse our performance. The relevant sections of the impact of consolidating OtC are
included in note 39 of the consolidated financial statements on page 123 of this report. See “Notes to the
Consolidated Financial Statements of Edcon Holdings Limited – Consolidation of OntheCards Investments
II Proprietary Limited”.

5
MANAGEMENT’S DISCUSSION AND ANALYSIS OF AUDITED CONSOLIDATED RESULTS
The following discussion should be read in conjunction with, and is qualified in its entirety by reference to,
our audited consolidated financial statements and the related notes thereto included in this annual report.
Highlights
Pertaining to the 52-week period ended 30 March 2013 compared to the prior comparative period
Delivering against strategic plan
Refurbishment on track
Brand pipeline secured for Edgars division
New store formats and first mono-branded store launched
Average space increased 3.4%
More than 9.0 million loyalty customers
Strategic initiatives disruptive in the short term
Retail sales increased 2.0%
Same store retail sales increased 0.4%
Profitability under pressure
Gross profit increased 1.8%
Pro forma adjusted EBITDA down 13.1%
Sound capital structure management
Sale of the trade receivables
Unwind of securitization program
Refinance of all short term, 2014, maturities (by 20 May 2013)
Migration of funding structure to rand denominated
Overview
We have been focused on establishing Edcon for future growth and enhanced value creation through the
recently articulated vision and strategy. The strategy initiatives are built around four key pillars being the
ability to grow comparable store growth, grow new space, expand margins and leverage credit
opportunities.
During the financial year 2013 we have transformed more than 120 stores, opened and closed retail formats
and made management changes in various areas across the Group. It has been disruptive to our business,
and one cannot necessarily see the positive impact immediately. However, like any good investment, the
benefit is expected to be felt for many years to come. We commenced the strategic change process in the
Discount division earlier than the Edgars division, so it is heartening to see some of the positive results
coming through in this division. As these transformations gain traction in the Edgars division we anticipate
that we will see similar benefits.
The closing of the sale of our trade receivables book to Absa in November 2012 is significant and
transformative for Edcon. We used the proceeds from the sale to strengthen our balance sheet and provide
our customers with an enhanced source of credit. We expect that the sale to, and our new strategic
relationship with Absa, will allow us to better focus on our core retail operations. The sale of the trade
receivables, together with the refinancing completed only after 30 March 2013, initiates the process of
migrating from foreign denominated debt into rand denominated debt, removing currency risk from our
funding model, and addresses our short-term financing needs until June 2015.
We are also excited about our loyalty program, which has grown to over nine million Thank U cards in one
year, and continues to exceed our expectations. Customers clearly see the real benefits of the program
already and we can use the information from the program to customize our offerings to particular market
segments and bring even greater value to current and future customers.

6
Trading review
Key operational data
Retail sales growth (%)
FY2011
Actual
FY2012
Actual
FY2013
Actual
FY2011
LFL(1)
FY2012
LFL(1)
FY2013
LFL(1)
Edgars 7.1 8.7 4.1 4.0 4.9 (1.1)
Discount 3.9 8.4 (0.3) 6.9 10.8 2.1
CNA 5.3 8.5 0.7 5.3 7.7 2.4
Total 6.1 8.6 2.0 5.3 7.4 0.4
(1) Like-for-like sales (same store sales)
Gross profit margin (%)
FY2011 FY2012 FY2013 pts
change(1)
Edgars 41.5 40.8 39.7 (1.1)
Discount 31.8 31.8 33.0 1.2
CNA 32.6 33.1 32.4 (0.7)
Total 36.9 36.6 36.5 (0.1)
(1) FY2013 % change on FY2012
Other
FY2011 FY2012 FY2013 %
change(1)
Total number of stores 1 181 1 167 1 233 5.7
Average retail space (‘000 sqm) 1 321 1 340 1 386 3.4
Customer accounts (‘000s) 3 713 3 831 3 776 (1.4)
Thank U cards (‘000s) n/a 5 240 9 000 71.8
(1) FY2013 % change on FY2012
Our retail business comprises three retail divisions discussed below.
Edgars
The financial year 2013 was an exciting one, with new formats introduced and rolled out, including the first
mono-branded TOPSHOP TOPMAN store, and the expansion of the Edgars Active format to over 100
stores by the financial year-end 2013. The store refurbishment program, Tipping Point, was initiated and
multiple new local and international brands were secured with a few starting to roll out into stores. Most,
however, will become available in-store at Edgars in the next financial year as well as further mono-branded
stores. A new marketing calendar, changed merchandising teams and improved sourcing methodologies
were also all established. All-in-all a lot of change. These strategic changes in the business created some
disruption to the operational performance. It is expected that this will continue into the first half of the next
financial year and that the benefits will only be felt in the second half of the next financial year.
The Edgars division retail sales grew 4.1% to R13,318 million (FY2012: R12,796 million) mainly attributable
to the addition of 69 new Edgars Active stores and increased promotional activity. Same store sales were
1.1% lower at R12,031 million due in part to the disruptions experienced as store refurbishments and
strategic changes to the supply chain impacted the business. Gross profit margins reduced marginally to
39.7% (FY2012: 40.8%) compared to the prior period. Margins were impacted negatively by increased
promotional and clearance activity offset by the continued focus on methodical pricing of our products,
improved sourcing and a significant investment in new planning systems and people.

7
Discount
The financial year 2013 showed some periods of exceptional performance alternating with periods of
negative growth. Retail sales for the Discount division decreased by 0.3% to R9,786 million (FY2012:
R9,817 million) driven by higher same store sales growth of 2.1% to R9,104 million across all formats, but
negatively impacted by the conversion of the division’s Discom stores to Edgars Active stores. These stores
are now reported in the Edgars division. We seek to appropriately size new stores according to the
anticipated demand and location type. Our efforts to right-size our Discount division stores combined with
the conversion of the Discom format resulted in weighted average net store space decreasing by 0.8% over
the previous financial year. Gross profit margin improved to 33.0% (FY2012: 31.8%) primarily as a result of
improved pricing coupled with competitive sourcing and to a lesser extent due to category mix shifts. Jet
and Jet Mart are fast becoming destinations for key value items and research is indicating an improvement
in customers’ price perception of these formats.
CNA
Sales for the CNA division increased 0.7% to R2,065 million (FY2012: R2,051 million). On a same store
sales basis, sales grew by 2.4% to R1,995 million in the financial year 2013. Comparable stores sales
growth was negatively affected by lower mobile phone sales and disruption due to store refurbishments and
layout changes made during the financial year 2013. Gross profit for the financial year 2013 was
R670 million, slightly down on the R679 million for the financial year 2012. The gross profit of 32.4% was
marginally down from the 33.1% for the financial year 2012 due to a higher proportion of electronics and
branded toys in the sales mix.
African expansion
The continued growth in our operations outside of South Africa, mainly through the Jet, JetMart and Edgars
Active formats, is encouraging and the Group continues to expand its footprint at a steady pace. Sales
outside of South Africa contributed 7.1% of retail sales for the financial year 2013.
Credit and financial services
On 1 November 2012, we sold R8,667 million in trade receivables to Absa. Although Edcon is still able to
provide credit to customers, and practically continues to do so, the remaining eligible R1,134 million of net
trade receivables not yet sold to Absa, are disclosed as a discontinued operation and the prior financial
years numbers have been re-presented. The provision of credit by Absa remains fundamental for Edcon
and credit sales for the financial year 2013 remained stable at 51% of total retail sales. Despite no changes
being made to the acceptance criteria when Absa took over the trade receivables book, the total number of
accounts decreased by approximately 55,000, or 1.4%, from the end of financial year 2012 to the end of
financial year 2013. Income from the insurance joint ventures increased 23.1% over the prior year to R666
million (FY2012: R541 million) due to a combination of an increased number of policies and standard
premium increases.

8
Financial review
Summary financial information
Rm FY2011 FY2012 FY2013 % change(4)
Total revenues(1)
23 844 25 925 26 719 3.1
Retail sales 22 716 24 664 25 169 2.0
Gross profit 8 384 9 022 9 184 1.8
Gross profit margin (%) 36.9 36.6 36.5 (0.1)pts
Adjusted EBITDA(2)
3 624 4 041 3 256 (19.4)
Pro forma adjusted EBITDA(3)
2 949 3 181 2 763 (13.1)
Capital expenditure
(excluding finance leases) 474 710 819 15.4
Net debt including cash and derivatives 23 349 26 068 19 514 (25.1)
(1) As re-presented for the discontinued operations
(2) See table on page 9 which reconciles net loss to EBITDA, adjusted EBITDA and Pro forma adjusted EBITDA
(3) Pro forma income “lost” to Absa for the portion of the trade receivables book sold including finance charges revenue, bad debts and provisions and including a pro
forma fee earned by Edcon under the new arrangement with Absa.
(4) FY2013 % change on FY2012
Revenues
Total revenues increased by 3.1% and retail sales increased by 2.0% in the financial year 2013 compared
to the financial year 2012. Same store sales increased by 0.4% in the financial year 2013 due to the trading
performance in the Discount and CNA divisions, as the Edgars division reported lower same store sales.
Retail gross profit
Gross profit increased by 1.8% in the financial year 2013 compared to the financial year 2012 however the
gross profit margin stayed relatively flat at 36.5% for the financial year 2013 compared to 36.6% for the
financial year 2012. This was primarily due to declining margins in the Edgars and CNA divisions, while the
Discount division margin improved by 1.2% points when compared to the same period in the prior year.
Costs
Rm FY2011 FY2012 FY2013 % change(2)
Store costs 4 348 4 622 4 990 8.0
Other operating costs 3 229 3 552 3 672 3.4
Transitional costs(1)
n/a 278 599 115.5
(1) Included in other operating costs in the statement of comprehensive income in the Consolidated Financial Statements
(2) FY2013 % change on FY2012
Store costs increased by R368 million, or 8.0%, from R4,622 million in the financial year 2012 to R4,990
million in the financial year 2013. Increases in rentals remained high, as new space also impacted total
rentals. Utility cost increases were well managed and further productivity savings in the financial year 2013
from the store optimisation project in the Discount division reduced overall store costs.
Other operating costs, excluding transitional costs, increased by R120 million, or 3.4%, from R3,552 million
in the financial year 2012 to R3,672 million in the financial year 2013. These costs include fees paid for
fundraising.
The large transitional costs are mainly as a result of fees and IT costs relating to the modification of the
trade receivables system to accommodate the sale of the trade receivables to Absa. Transitional costs also
include those related to other one-off strategic initiatives to improve Edcon’s business in the medium term.
There will be no further transitional costs allocated in future financial years.

9
Pro forma adjusted EBITDA
Pro forma adjusted EBITDA decreased 13.1% as sound store cost management contributed positively but
total operating cost growth remained higher than revenue growth. Pro forma adjusted EBITDA is adjusted to
exclude clearly identified transitional costs and further adjusted to give effect to the transaction with Absa.
The following table reconciles net loss to EBITDA, adjusted EBITDA and Pro forma adjusted EBITDA:
Rm FY2011 FY2012 FY2013 % change(6)
Net loss(1)
(1 643) (1 999) (5 028)
Taxation (561) 4 1 185
Net financing costs 2 497 3 688 3 013
Depreciation & amortisation 1 216 1 172 1 049
EBITDA 1 509 2 865 219
Asset write-off and impairment of intangible
assets (8) 148 487
Net fair value movement on notes and
associated derivatives including foreign
exchange gains and losses(2)
2 113 690 2 005
Discount on repurchase of senior floating rate
notes(3)
(36)
Other adjustments(4)
10 374 545
Adjusted EBITDA 3 624 4 041 3 256 (19.4)
Net reduction resulting from pro forma
transactions(5)
(675) (860) (493)
Pro forma adjusted EBITDA 2 949 3 181 2 763 (13.1)
(1)
The results of discontinued operations are included being R389 million (FY2011), R463 million (FY2012) and R199 million (FY2013).
(2)
We have executed currency and interest rate derivatives to hedge the repayment of the interest and a portion of the principal on the respective floating and
fixed rate notes. This adjustment relates to the revaluation of the notes to the spot exchange rate and change in the fair value of the related cross currency
swaps, foreign currency call options and foreign exchange losses.
(3)
Relates to the repurchase of a portion of the senior secured floating rate notes in 2012 with a nominal value of €39 million for €35 million, being 90% of the face
value. As a result of the buy-back, the Group recognized a gain, net of associated fees, of R36 million.
(4)
Other consists of transitional expenditure, advisory fees relating to funding and Mastercard income,
(5)
Pro forma income “lost” to Absa for the portion of the trade receivables book sold including finance charges revenue, bad debts and provisions and including a
pro forma fee earned by Edcon under the new arrangement with Absa.
(6)
FY2013 % change on FY2012
Depreciation and amortisation
The amortisation charge decreased by R98 million, or 23.5%, for the financial year 2013 to R319 million as
a result of certain intangible assets now being fully amortised. The intangible assets were raised following
the acquisition of Edcon by Bain Capital in 2007. The depreciation charge decreased by 3.3% to
R730 million for the financial year 2013 when compared to the financial year 2012 of R755 million.
Net financing costs
Rm
FY2011 FY2012 FY2013 %
change(1)
Finance income 60 68 114 67.6
Financing costs (2 557) (3 756) (3 127) (16.7)
Net financing costs (2 497) (3 688) (3 013) (18.3)
(1) FY2013 % change on FY2012
Net financing costs decreased by R675 million, or 18.3%, from R3,688 million in the financial year 2012 to
R3,013 million in the financial year 2013. This decrease is primarily as a result of an improved net debt
position following the sale of our trade receivables book to Absa on 1 November 2012 and the settlement of
the R4,300 million OtC notes. There was a carry cost of keeping the cash balance for the remaining
proceeds not applied but this was partially offset by higher finance income.

10
Taxation
Notwithstanding that we believed that we were in compliance with applicable South African tax laws and
regulations, a settlement agreement was entered into with the South African Revenue Service (“SARS”) on
14 December 2012. The agreement addresses the tax treatment of the issues in dispute from the financial
years since the acquisition of Edcon by Bain Capital, being financial years 2008 through 2013, as well as
future financial years. Pursuant to the agreement, no cash outflow in relation to tax payments due will be
required until September 2014. However, as a result of the settlement, Edcon is likely to pay income tax
earlier than was anticipated prior to the entering into of the settlement.
The Group’s deferred tax balance has therefore moved from an asset of R1,030 million at 31 March 2012 to
a net liability of R537 million at 30 March 2013; resulting in a net unfavourable movement of R1,567 million.
Cash flow
Operating cash inflow before changes in working capital decreased by R784 million from R3,691 million in
the financial year 2012 to R2,907 million in the financial year 2013 as sales growth was lower than
operational costs and combined with higher transitional costs, negatively impacted cashflows.
Working capital decreased by R8,447 million in the financial year 2013, compared to an increase of
R1,603 million in the financial year 2012 attributable to:
(i) a decrease in total trade receivables of R8,688 million in the financial year 2013 compared to an
increase of R1,094 million in the financial year 2012, following the sale of the trade receivables on
1 November 2012;
(ii) an increase of R26 million from other receivables and prepayments in the financial year 2013
compared to an increase of R135 million in the financial year 2012;
(iii) an increase in inventory of R486 million in the financial year 2013 compared to an increase of
R543 million in the financial year 2012; and
(iv) an increase in trade payables of R271 million in the financial year 2013 compared to an increase of
R169 million in the financial year 2012.
Operating activities generated cash of R8,474 million, as opposed to the R985 million utilised in the financial
year of 2012 driven mainly by the sale of trade accounts receivable which generated R8,667 million.
Capital expenditure
Rm
FY2011 FY2012 FY2013 %
change(1)
Edgars 199 204 302 48.0
- Expansion 15 90 94 4.4
- Refurbishment 184 114 208 82.5
Discount 122 167 238 42.5
- Expansion 7 61 52 (14.8)
- Refurbishment 115 106 186 75.5
CNA 20 20 41 105.0
- Expansion 3 1 4 300.0
- Refurbishment 17 19 37 94.7
IT 127 293 189 (35.5)
Other corporate capex 6 26 49 88.5
474 710 819 15.4
(1) FY2013 % change on FY2012
Capital expenditure (excluding finance leases) increased by R109 million, or 15.4%, to R819 million in the
financial year 2013, from R710 million in the financial year 2012. In the financial year 2013 we opened 147
new stores (including 128 conversions) and closed 81 stores which, combined with store refurbishments,
resulted in investments in store fixtures of R530 million, compared to the financial year 2012 where we
opened 65 new stores (including 56 conversions) and closed 79 stores that resulted in investment in store
fixtures of R322 million. We invested R189 million in information systems infrastructure in the financial year
2013 compared to R293 million in the financial year 2012 following the completion of the major costs of the
new planning system.

11
Net debt, liquidity and capital resources
Our primary source of short-term liquidity is cash on hand and our revolving credit facility. The amount of
cash on hand and the outstanding balance of our revolving credit facility are influenced by a number of
factors, including retail sales, working capital levels, supplier payment terms, timing of payment for capital
expenditure projects, and tax payment requirements.
Our working capital requirements fluctuate during each month, depending on when we pay our suppliers
and generate sales, and throughout the financial year depending on the seasonal build-up of net working
capital. We fund peaks in the working capital cycle with cash flows from operations and drawings under our
revolving credit facility. At 30 March 2013 our total net debt including cash and derivatives of R19,514
million consisted of (i) the carrying value of floating rate notes of R8,949 million, (ii) the carrying value of
fixed rate notes of R9,178 million, (iii) super senior secured notes of R1,010 million, (iv) borrowings under
the revolving credit facility of R1,456 million, (v) finance lease liability of R313 million, (vi) deferred option
premium of R305 million, less (vii) net derivative assets of R1,028 million, and (viii) cash and cash
equivalents of R669 million.
At 30 March 2013, the total limit under the revolving credit facility was R3,967 million, R250 million of which
matures on 31 December 2013 with the balance of R3,717 million maturing on 31 March 2014. The
maximum utilisation of the revolving credit facility during the financial year 2013 was R1,670 million.
We believe that operating cash flows and amounts available under the revolving credit facility will be
sufficient to fund our debt service obligations and operations, including capital expenditure and contractual
commitments, through to 29 March 2014.
Market risk
Foreign currency risk
We are exposed to the exchange rate movement of the rand, our operating currency, against other
currencies in respect of merchandise we import. A substantial portion of our indebtedness is denominated in
euro and U.S. dollar. Foreign exchange rate fluctuations in the future may affect our ability to service our
foreign-currency denominated indebtedness, including payments in euro and U.S. dollar on the floating rate
notes and fixed rate notes. Historically, our policy has been to cover all foreign-denominated import
liabilities using forward exchange contracts. We partially hedge our exposure to the rate movement of the
rand against the euro and US dollar in relation to the principal, while by April 2013, subsequent to the
update to the long-term hedging strategy, we fully hedge the interest coupons up to March 2014 and March
2015. See audited consolidated financial statements.
Interest rate risk
As a result of the significant inter-seasonal and intra-month swings in working capital in our business, our
short-term net debt can fluctuate significantly. Therefore, our treasury actively monitors our interest rate
exposure. We use swaps to manage our interest rate risk against any unexpected fluctuations in the interest
rate. We also actively manage our fixed and floating rate interest-bearing debt, and cash and cash
equivalents mix as part of this exposure management process. In order to hedge specific interest rate
exposure of existing borrowings and anticipated peak additional borrowings, we make use of interest rate
derivatives, only as approved in terms of policy limits which require approval of the group chief executive
officer and, in some cases, the board of directors, depending on the size of the derivative. Subsequent to
the update of the long-term hedging strategy, we have fixed the interest payments on the foreign
denominated floating rate notes until March 2014. See audited consolidated financial statements.
Counterparty risk
Counterparty risk for deposits with financial institutions is managed by clearly defined bank mandates and
delegation of authority. We carefully assess on an ongoing basis the creditworthiness of financial
counterparties. Exposure limits are managed and monitored within our treasury.

12
Scheduled repayments of our obligations
The following table summarises as of 30 March 2013, (i) the contractual obligations, commercial
commitments and principal payments we are committed to make under our debt obligations, leases and
other agreements and (ii) their maturities.
Commitments due by year
R million
Total Less
than 1
year
1 – 3
years
3 – 5
years
More
than
5 years
Revolving Credit Facility (1)
3 967 250 3 717
2014 Senior Secured Floating Rate Notes
(net of derivatives)(2)
3 794
3 794
2015 Senior Floating Rate Notes (net of
derivatives)(2)
4 303
4 303
2018 Senior Secured Fixed Rate Notes(2)
9 631 9 631
Super Senior Secured Notes 1 010 1 010
Deferred Option Premium 320 36 284
Interest on 2014 Senior Secured Floating
Rate Notes (net of derivatives)(3)
527
487
40
Interest on 2015 Senior Floating Rate
Notes (net of derivatives)(3)
740
419
321
Interest on 2018 Senior Secured Fixed
Rate Notes (net of derivatives)(3)
4 468
874
1 816
1 778
Interest on Super Senior Secured Notes 375 115 230 30
Finance lease(4)
537 72 78 84 303
Leases(4)(5)
9 214 1 754 2 948 1 938 2 574
Medical aid(6)
184 184
Total debt obligations 39 070 4 007 17 531 14 471 3 061
1. As at 30 March 2013 R1,456 million of this revolving credit facility was utilised for seasonal working
capital requirements. Refer to events after the reporting period on page 13 relating to the RCF
extension.
2. Presented at the hedged rate of principal for the respective bonds. In terms of the group’s total
exposure to foreign currency on its principal debt obligations, 100% of the 2014 notes, 20% of the
2015 notes and 85% of the 2018 notes are hedged. The balance of unhedged principal is reflected
at the ruling rate of exchange at the reporting date. Refer to note 36.2 of the consolidated financial
statements for hedging strategy and page 13 for events after the reporting period relating to the
repayment of the senior secured floating rate notes.
3. Presented at the hedged rate of interest up to the maturity of the derivative contracts, of March
2014. Thereafter, interest is based on the floating interest and exchange rates at the reporting
date. Refer to note 36.2 of the consolidated financial statements for hedging strategy.
4. Leases include property and computer equipment lease commitments.
5. Our consolidated financial statements present our lease obligations in categories different from the
categories we use in this table. Therefore, we have straight-lined our lease obligations to present
them for the periods we use in this table.
6. We assume that there are no medical aid obligations that will become due and payable prior to five
years.
The property leases into which we enter have an average initial lease term of ten years for our Edgars
chain and five years for our other chains, with lease terms typically including four options to extend the
lease for periods of five years each. The leases generally give us the right to sublet the leased premises
and assign our rights under the lease to our affiliate companies. Rental payments are generally made on a
monthly basis and rent is increased at an agreed percentage rate (typically 7%) compounded annually.
13
Events after the reporting period
Update to long term hedging strategy
In April 2013, a series of derivative contracts were entered into to increase the extent of hedge cover on the
euro denominated senior secured fixed rate notes.
Cross currency swaps were entered into which, (i) protects against interest rate variability in future
interest cash flows on liabilities, (ii) protects against variability in future interest cash flows that are
subject to fluctuations based on foreign exchange rates, and (iii) hedges the repayment of €230 million
in principal and interest on the notes to 15 March 2015. The hedges create an effective annual average
fixed interest rate of 15.55% over the period of cover. The cross currency swaps have been designated
as cash flow hedges.
A cross currency swap was entered into which protects against variability in future interest cash flows
that are subject to fluctuations based on foreign exchange rates. The notional value of the hedge is
€70 million and provides cover on the coupon of the notes up to 15 March 2015. The hedge creates an
effective annual average fixed interest rate of 10.2% over the period of cover. The cross currency swap
has been designated as a cash flow hedge.
Foreign currency call options were entered into which hedge the repayment of €237 million in principal
on the notes to 12 March 2015. The premiums payable on the foreign currency call options of
R317 million have been deferred to 13 March 2015. These options have not been designated as cash
flow hedges.
Second closing of the trade receivables
On 30 April 2013, the Group complied with all requirements for the second closing of the South African
portion of the private label store card portfolio and a further R469 million of the South African trade
receivables book was sold to Absa. We expect to complete the sale of substantially all the remaining eligible
trade receivables of R1,134 million in the financial year 2014.
RCF extension
On 17 May 2013, the Group received commitments of R3,717 million from certain financial institutions to
extend the revolving credit facility from a maturity of 31 March 2014 to 31 December 2016. The other terms
of the facility will remain substantially the same.
Repayment of senior secured floating rate notes
On 20 May 2013, the Group completed the repurchase of its senior secured floating rate notes at the face
value of €387 million. The repurchase was funded from the proceeds drawn from the rand denominated
senior secured term loan as well as net proceeds derived on termination of the derivative contracts that
were hedging the exchange rate risk on the notes repurchased.
Critical accounting policies and use of estimates
In preparing the audited consolidated financial statements, management is required to make estimates,
assumptions and judgements that affect reported income, expenses, assets, liabilities and disclosure of
contingent assets and liabilities. Assessing available information and the application of judgement are
necessary elements in making estimates. Actual results in the future could differ from such estimates, and
such differences may be material to the financial statements. Estimates and their underlying assumptions
are reviewed on an on-going basis. Any revisions to estimates resulting from these reviews are recognised
in the period in which such estimates are revised.
Significant estimates, assumptions and judgements made at the reporting date, as reflected in the audited
consolidated financial statements, relate to credit risk valuation adjustments in determining the fair value of
derivative instruments to reflect non-performance risk (note 1.10.4), fair value of financial instruments (note
1.10 and 36.8) a provision for impairment of receivables (note 1.10.1), derecognition of financial instruments
(note 1.10.1 and 1.10.2), allowances for slow-moving inventory (note 1.11), residual values, useful lives and
depreciation methods for property, fixtures, equipment and vehicles (note 1.13), impairment of non-financial
assets including goodwill and intangibles with indefinite lives (note 1.7 and note 1.13.5), pension fund and
medical aid obligations (note 1.18, 30.3.6 and 30.5.4), operating lease (note 1.12), current and deferred tax
(note 1.15), discontinued operations (note 1.14 and note 13) and loyalty points deferred revenue (note
1.22.2). Other judgements made relate to classifying financial assets and liabilities into categories (note
1.10).

14
RISK FACTORS
The following comprehensive list of risk factors is presented to satisfy the needs of our wide group of
stakeholders, including international and local bond holders.
Risks related to our business and industry
Unfavourable macroeconomic factors may decrease consumer demand for our retail goods.
Macroeconomic factors such as interest rates, consumer indebtedness and employment levels affect
consumer demand for our goods. As a response to the ongoing global economic downturn, the South
African Reserve Bank reduced its repurchasing rate to 5% in July 2012, a 30-year low. Despite such
historically low interest rates, South African households are still considered to be financially fragile. The ratio
of total household debt to disposable income was 76% in the last quarter of calendar year 2012. Moreover,
South Africans at the lower end of the socioeconomic spectrum have felt the impact of the economic
downturn more severely and have experienced low disposable income growth mainly due to low
employment growth and a rising tax burden, coupled with significant increases in electricity, food, fuel and
property rates and taxes in South Africa. Consumer demand has been supported in part by increasing
social grants since 2002. However, the expansion of the provision of social grants is expected to stabilise,
which could have an adverse impact on consumer spending. Higher interest rates, increased consumer
indebtedness, rising unemployment, strike action, a leveling off of social grants and lower consumer
confidence could have a material adverse effect on our retail sales and results of operations.
Our results are also impacted by other macroeconomic factors, such as the prevailing economic climate,
levels of unemployment, real disposable income, salaries and wage rates, including any increase as a result
of payroll cost inflation or governmental action to increase minimum wages or contributions to pension
provisions, the availability of consumer credit and consumer perception of economic conditions. In January
2013, rating agency Fitch downgraded South Africa to BBB from BBB+. Fitch joins S&P, which downgraded
the country’s debt in October 2012, also to BBB, and Moody’s which in September 2012 downgraded the
country from A3 to Baa1. Over the last 12 months, economic growth performance and prospects have
deteriorated in South Africa, affecting public finances and exacerbating social and political tensions. Public
finances have weakened. Fitch estimates national government debt will have risen to 41% of GDP (around
43% including local authorities) at the end of calendar year 2012 from 27% at end of calendar year 2008.
Ninety-three per cent of our retail sales were derived from South Africa in the financial year 2013 and
therefore a general slowdown in South African GDP growth or an uncertain economic outlook may
adversely affect consumer spending habits, which may reduce our retail sales and adversely impact our
results of operations.
Moreover, many of the items we sell, particularly higher margin fashion and homeware products, represent
discretionary purchases, meaning that we may experience a decline in retail sales that is proportionally
greater than the level of general economic decline. Therefore, an economic downturn in South Africa could
have a material adverse effect on our financial condition and results of operations.
Our business could be adversely affected by disruptions in our supply chain.
Any significant disruption or other adverse event affecting our relationship with any of our major suppliers
could have a material adverse effect on the results of our financial condition and our operations. If we need
to replace any of our major suppliers, we may face risks and costs associated with a transfer of operations.
In addition, a failure to replace any of our major suppliers on commercially reasonable terms, or at all, could
have a material adverse effect on our financial condition and results of our operations.
The concentration of our suppliers will increase as we proceed with our ongoing strategy to reduce the
number of our suppliers. Our ongoing strategy to expand our supplier base in markets such as Mauritius,
Bangladesh, Madagascar and Africa, places us at risk if merchandise is in short supply in those locations. In
addition, such suppliers may be unwilling to provide us with merchandise if we do not place orders at an
internationally competitive order level or at a level competitive with large-volume customers. In the event
that one or more of our major suppliers chooses to cease providing us with merchandise or experiences
operational difficulties, and we are unable to secure alternative sources in a timely manner or on
commercially beneficial terms, we may experience inventory shortages or other adverse effects on our
business. If our suppliers are unable or unwilling to continue providing us with merchandise under our

15
presently agreed terms, including as a result of our significantly increased leverage, or if we are unable to
obtain goods from our suppliers at prices that will allow our merchandise to be competitively priced, there
could be a material adverse effect on our retail sales, results of operations and liquidity.
The cost and availability of our supplies are dependent on many factors, including:
- the base price of raw material costs, such as cotton and wool, as well as the cost of individual
product components;
- freight costs; and
- rebates and discounts earned from suppliers.
Moreover, we purchase a portion of our products in markets outside of South Africa, principally in Asia, and
the number of our foreign suppliers may increase as we proceed with our strategy to partner with suppliers
in low-cost countries. We face a variety of risks generally associated with doing business in foreign markets
and importing merchandise from these regions, including:
- currency risks;
- political instability;
- increased security requirements applicable to foreign goods;
- the imposition of duties and taxes, other charges and restrictions on imports;
- risks related to our suppliers’ labour practices, environmental matters or other issues in the foreign
countries or factories in which our merchandise is manufactured;
- delays in shipping; and
- increased costs of transportation.
In addition, the ongoing challenging economic environment could have a number of adverse effects on our
supply chain. The inability of suppliers to access liquidity, or the insolvency of suppliers, could lead to
delivery delays or failures.
Any of these risks, in isolation or in combination, could adversely affect our reputation, financial condition
and results of operations. New initiatives may be proposed that may have an impact on the trading status of
certain countries and may include retaliatory duties or other trade sanctions which, if enacted, could
increase the cost of products purchased from suppliers in such countries or restrict the importation of
products from such countries. The future performance of our business will partly depend on our foreign
suppliers and may be adversely affected by the factors listed above, all of which are beyond our control.
A reduction in the availability of credit under our existing consumer credit programs or changes in
the terms of our private label store card program, including any future regulatory requirements,
could have an adverse effect on our operations.
We maintain Edgars and Jet private label store card programs, and through an arrangement with Absa,
Absa extends credit to our customers. Absa issues our private label store cards to our customers and we
receive a net fee for providing certain IT and administrative services with respect to the program. In the
financial year 2013, purchases completed with our private label store cards accounted for approximately
51% of our retail sales. The inability or unwillingness of Absa to provide support for our private label store
card program may result in a decrease in store card sales to our customers, which could negatively impact
our overall sales given customers’ reduced purchasing capacity. As the credit provider with the ultimate
exposure to the credit risks of our cardholders, Absa has discretion to turn down store card applicants upon
an assessment of each applicant’s credit risks and in light of Absa’s screening and credit requirements.
While our arrangements with Absa reserve our right to extend credit to any customers that Absa turns
down, we would bear the default risk for any such credit extended. Furthermore, changes in local regulation
governing store card business practices, including marketing, underwriting, pricing and billing that may go
into effect in the future or tightening of credit from a deterioration of the economic situation in South Africa,
could place additional restrictions on consumer credit programs, including limiting the types of promotional
credit offerings that may be offered to consumers. These changes could make it more difficult for Absa to
extend credit to our customers, which could also have a material adverse effect on our results of operations.

16
Our business is affected by foreign currency fluctuations.
We realise a majority of our revenue, and incur a significant portion of our costs and expenses, in rand. We
purchase approximately 12% of our products from markets outside of South Africa denominated in a foreign
currency, principally in Asia, and the number of our foreign suppliers may increase as we proceed with our
strategy to partner with suppliers in countries with low production costs. A part of our costs are incurred
through indirect suppliers, who denominate their costs in rand but are exposed to foreign currency
fluctuation. The cost of foreign-sourced products is affected by the fluctuation of the relevant local currency
against the rand or, if priced in other currencies, the price of the merchandise in currencies other than the
rand. Accordingly, changes in the value of the rand relative to foreign currencies may increase our cost of
goods sold and, if we are unable to pass such cost increases on to our customers, decrease our gross
margins and ultimately our earnings.
In addition, a substantial portion of our indebtedness, including our outstanding senior secured floating rate
notes, senior secured notes, and senior secured fixed rate notes are denominated in euro, and in U.S.
dollars. In recent years, the value of the rand as measured against the euro and the U.S. dollar has
fluctuated considerably. Foreign currency fluctuations in the future may affect our ability to service our
foreign currency denominated indebtedness, including payments in euro and U.S. dollars on the senior
secured fixed rate notes and the senior secured notes.
We cannot assure you that we will be able to manage our currency risks effectively or that any volatility in
currency exchange rates will not have a material adverse effect on our financial condition or results of
operations or on our ability to make principal and interest payments on our indebtedness.
We use hedges as part of our hedging strategy.
As part of the hedging strategy that we implemented, we elected to hedge some of our interest rate and
currency risk arising under our outstanding notes obligations with credit-based hedges. These hedges rank
pari passu in right of recovery and benefit from the same security as our outstanding notes. If we were to
default in making payments under the notes, or if certain other credit events were to occur in relation to us
and a credit-linked hedge of interest rate or currency risk in respect of such notes were to terminate or be
closed out as a result, then, in relation to the mark-to-market value (“MTM”) which would normally be
payable by one party to the other on a termination or close-out of an equivalent hedge that was not credit-
linked, either (a) we will be limited, where such MTM would otherwise be payable to us, in claiming against
our hedge counterparty in respect of such termination or close-out to an amount equal to the product of
(i) such MTM and (ii) the credit recovery rate for holders of the notes (if applicable), such credit recovery
rate being determined within a reasonable period after such termination or close-out by reference to a
market auction process or market quotations for such notes, or (b) no MTM payment in respect of such
termination or close-out will be due from either party, depending on the particular type of credit-linked hedge
into which we enter.
If we are unable to renew or replace our store leases or enter into leases for new stores on
favourable terms, or if any of our current leases are terminated prior to the expiry of its stated term
and we cannot find suitable alternate locations, our growth and profitability could be harmed.
We lease all of our store locations. We typically occupy our stores under operating leases with terms of
between five and 10 years, with options to renew for additional multi-year periods thereafter. In the future,
we may not be able to negotiate favourable lease terms. In addition, many of our lease agreements have
defined escalating rent provisions over the initial term and any extensions. Our inability to renew the lease
agreements in relation to our stores or to meet the requirement for higher rental payments may cause our
occupancy costs to be higher in future years or may force us to close stores in desirable locations. Some of
our leases have early cancellation clauses, which permit the lease to be terminated by us or the landlord if
certain sales levels are not met in specific periods or if the shopping centre in which the relevant store is
located does not meet specified occupancy standards. In addition to future minimum lease payments, some
of our store leases provide for additional rental payments based on a percentage of net sales, or
percentage of rent, if sales at the respective stores exceed specified levels, as well as the payment of
common area maintenance charges, real property insurance and real estate taxes. As we expand our store
base, our lease expense and our cash outlays for rent under the lease terms will increase. An adverse
change in the terms of our store lease agreement or our inability to satisfy the requirements under these
agreements may have a material adverse effect on the results of our operations, profitability and financial

17
condition. In addition, if we are unable to renew existing leases or lease suitable alternative locations, or
enter into leases for new stores on favourable terms, our growth and our profitability may be significantly
harmed.
We depend on cash flow from operations to pay our lease expenses. If our business does not generate
sufficient cash flow from operating activities to fund these expenses, we may not be able to service our
lease expenses, which could materially harm our business. If an existing or future store is not profitable, and
we decide to close it, we may nonetheless be committed to perform our obligations under the applicable
lease including, amongst other things, paying the base rent for the balance of the lease term. Moreover,
even if a lease has an early cancellation clause, we may not satisfy the contractual requirements for early
cancellation under that lease. Our inability to enter into new leases or renew existing leases on terms
acceptable to us or be released from our obligations under leases for stores that we close could materially
adversely affect us.
Our results may be adversely affected by increases in energy costs.
Energy costs have increased dramatically in the past. These fluctuations may result in an increase in our
transportation costs for distribution, utility costs for our retail stores and costs to purchase products from our
suppliers. For example, electricity prices in South Africa increased an average of 25% per year since 2008,
and are expected to continue to increase in the near future. A continual rise in energy costs could adversely
affect consumer spending and demand for our products and could increase our operating costs, both of
which could have a material adverse effect on our financial condition and results of operations.
We depend heavily on our IT systems to operate our business.
We rely to a significant degree on the efficient and uninterrupted operation of our various computer and
communications systems to operate and monitor all aspects of our retail business and our credit and
financial services business, including, in respect of our retail business, sales, warehousing, distribution,
purchasing, inventory control, and merchandise planning and replenishment. Any significant breakdown or
other significant disruption to the operations of our primary sites for all of our computer and communications
systems could significantly affect our ability to manage our IT systems, which in turn could have a material
adverse effect on our financial condition and results of operations. If we cannot generate sufficient cash to
fund our upgrade plans, we may be required to delay or discontinue the implementation of our plans, which
could have a material adverse effect on our financial condition and results of operations.
Any negative impact on the reputation of, and value associated with, our brand names could
adversely affect our business.
Our brand names represent an important asset of our business. Maintaining the reputation of, and value
associated with, our brand names are central to the success of our business. Significant negative publicity,
widespread product recalls or other events could also cause damage to our brand names. We rely on
marketing to strengthen our brand names, but our marketing initiatives may prove to be ineffective.
Substantial erosion in the reputation of, or value associated with, our brand names could have a material
adverse effect on our financial condition and results of operations.
Our business could suffer as a result of weak retail sales during peak selling seasons.
Our business is subject to seasonal peaks. Historically, our most important trading periods in terms of retail
sales, operating results and cash flow have been the Easter and Christmas seasons, with 34% of our retail
sales occurring in April, November and December combined. We incur significant additional expenses in
advance of the Easter and Christmas seasons in anticipation of higher retail sales during those periods,
including the cost of additional inventory, advertising and hiring additional employees. In previous years, our
investment in working capital has peaked in early to middle March, October and November and has fallen
significantly in April and January. If, for any reason, retail sales during our peak seasons are significantly
lower than we expect, we may be unable to adjust our expenses in a timely fashion and may be left with a
substantial amount of unsold inventory, especially in seasonal merchandise that is difficult to liquidate. In
that event, we may be forced to rely on significant markdowns or promotional sales to dispose of excess
inventory, which could have a material adverse effect on our financial condition and results of operations. At
the same time, if we fail to purchase a sufficient quantity of merchandise, we may not have an adequate
supply of products to meet consumer demand, which may cause us to lose retail sales.

18
Our business can be adversely affected by unseasonal weather conditions.
Our results are affected by periods of abnormal or unseasonal weather conditions. For example, periods of
warm weather in the winter could render a portion of our inventory incompatible with such unseasonal
conditions. Adverse weather conditions early in the season could lead to a slowdown in retail sales at full
margin, followed by more extensive markdowns at the end of the season. Prolonged unseasonal weather
conditions during one of our peak trading seasons could adversely affect our turnover and, in turn, our
financial condition and results of operations. In addition, extreme weather conditions, such as floods, may
make it difficult for our employees and customers to travel to our stores.
The sector in which our business operates is highly competitive.
The retail market is highly competitive, particularly with respect to product selection and quality, store
location and design, price, customer service, credit availability and advertising. We compete at the national
and local levels with a wide variety of retailers of varying sizes and covering different product lines across all
geographic markets in which we operate. For example, in the Edgars division we compete directly with
Woolworths, Truworths and Foschini. In the Discount division we compete with Mr Price, Ackermans and
PEP. In addition, the South African retail sector has experienced a consolidation of market formats as retail
companies diversify in other sectors of the retail market. Our credit and financial services business faces
competition from other retail companies, such as Truworths and Foschini, which offer financial services to
their customers. Increased competition from our existing competitors or new entrants to the market could
result in lower prices and margins or a decrease in our market share, any of which could have a material
adverse effect on our financial condition and results of operations. In addition, international competitors
have entered our market, creating increased competition, as in the case of Cotton On, Walmart and Zara.
We face a variety of competitive challenges including:
- anticipating and quickly responding to changing consumer demands;
- maintaining favourable brand recognition and effectively marketing our products to consumers in
several diverse market segments;
- developing innovative fashion products in styles that appeal to consumers of varying age groups
and tastes;
- sourcing and distributing merchandise efficiently;
- competitively pricing our products; and
- responding to changes in consumer behaviour as a result of economic conditions and as a result of
changes in consumer spending patterns.
Actions taken by our competitors, as well as actions taken by us to maintain our competitiveness and
reputation, can place and will continue to place pressure on our pricing strategy, margins and profitability,
and could have a material adverse effect on our financial condition and results of operations. Some of our
competitors may have greater financial resources, greater purchasing economies of scale and/or lower cost
bases, any of which may give them a competitive advantage over us. Our competitors also may merge or
form strategic partnerships, which could cause significant additional competition for us.
We may not be able to predict accurately or fulfil customer preferences or demand.
A portion of our sales are from fashion-related products, which are subject to volatile and rapidly changing
customer tastes. The availability of new products and changes in customer preferences have made it more
difficult to predict sales demand accurately. As a multi-product retailer, our success depends, in part, on our
ability to effectively predict and respond to quickly changing consumer demands and preferences and to
translate market trends into attractive product offerings. Our ability to anticipate and effectively respond to
changing customer preferences and tastes depends, in part, on our ability to attract and retain key
personnel in our buying, design, merchandising, marketing and other functions. Competition for such
personnel is intense, and we may not be able to attract and retain a sufficient number of qualified personnel
in future periods.
Furthermore, some of our products are manufactured offshore. Accordingly, in some instances we must
enter into contracts for the purchase and manufacture of merchandise well in advance of the applicable

19
selling season. The long lead times between ordering and delivery make it more important to accurately
predict, and more difficult to fulfil, the demand for items.
There can be no assurance that our orders will match actual demand. If we are unable to successfully
predict or respond to sales demand or to changing styles or trends, our sales will be lower and we may be
forced to rely on additional markdowns or promotional sales to dispose of excess or slow-moving inventory
or we may experience inventory shortfalls on popular products, any of which could have a material adverse
effect on our financial condition and results of operations. In addition, a number of other factors, including
changes in personnel in the buying and merchandising function, could adversely affect product availability.
Failure to maintain adequate levels of inventory in order to meet customers’ needs or to accurately
forecast demand for our products could result in excess inventories, non-cancellable purchase
obligations or supply shortages.
We attempt to purchase and maintain adequate levels of inventory in order to meet customer needs on a
timely basis. The C&F market is subject to rapid changes in fashion trends, consumer preferences, new and
enhanced product specification requirements, and evolving industry standards. These changes may cause
inventory on hand to decline substantially in value or to rapidly fall out of favour. If we are unable to manage
the inventory on hand with a high degree of precision, we may have either insufficient or excess inventory,
resulting in either lost sales or inventory write-downs, which may lower our gross margins and cause us to
record inventory write-downs and harm our business, financial position and operating results. Our ability to
obtain and provide products and merchandise required to satisfy our customers’ needs on a timely basis is
critical to our success. We may occasionally experience a supply shortage of some products as a result of
strong demand or problems experienced by our suppliers. If shortages or delays persist, the price of those
products may increase, or the products may not be available at all. Accordingly, if we are not able to secure
and maintain an adequate supply of products to fulfil our customers’ needs on a timely basis, our business,
financial position and results of operations may be adversely affected.
Our growth depends in part on our ability to open and operate new stores profitably.
One of our business strategies is to expand our base of retail stores. For the financial year 2014, a total
capital expenditure budget of R1,063 million was approved to maintain and increase our store footprint in
South Africa and the rest of Africa. If we are unable to implement this strategy, our ability to increase our
sales, profitability and cash flow could be impaired. To the extent that we are unable to open and operate
new stores profitably, our sales growth would come only from increases in same-store sales. We may be
unable to implement our strategy if we cannot identify suitable sites for additional stores, negotiate
acceptable leases, access sufficient capital to support store growth, or hire and train a sufficient number of
qualified employees.
We rely on our key personnel and we face strong competition to attract and retain qualified
managers and employees.
We are highly dependent on our key personnel who have extensive experience in, and knowledge of, our
industry. In addition, our business faces significant and increasing competition for qualified management
and skilled employees. We have instituted a number of programs to improve the recruitment and retention
of managers and employees, and we invest substantially in their training and professional development.
However, these programs may prove unsuccessful and, in conditions of constrained supply of skilled
employees, there is a risk that our well-trained managers and employees will accept employment with our
competitors. The loss of the service of our key personnel or our failure to recruit, train and retain skilled
managers and employees could have a material adverse effect on our retail sales, results of operations and
liquidity.
Failure to maintain the full functionality and integrity of our IT systems that are used to manage our
private label store card program underwritten by Absa could have an adverse effect on our financial
condition and results of operations.
Our IT and telecommunications systems are used to manage our private label store card program
underwritten by Absa. The failure of these systems, or the termination of a third-party software licence or
service agreement on which any of these systems is based, could interrupt the operation of our private label
store card program. Because our IT and telecommunications systems interface depend on third-party

20
systems, we could experience service denials if demand for such services exceeds capacity or such third-
party systems fail or experience interruptions. If sustained or repeated, system failures or service denials
could result in a deterioration of Absa’s ability to process new credit applications, collect payments and
provide customer service, thereby compromising our ability to support our private label store card program
effectively, which may result in damage to our reputation and/or result in a loss of customer business, any of
which could have a material adverse effect on our financial condition and results of operations.
We are indirectly owned and controlled by investment funds advised by Bain Capital, and their
interests as equity holders may conflict with yours as a creditor.
We are indirectly owned and controlled by investment funds advised by Bain Capital. The interests of our
equity holders may not in all cases be aligned with your interests. For example, if we encounter financial
difficulties or are unable to pay our debts as they mature, the interests of our equity holders might conflict
with those of the holders of our outstanding notes or with those of other stakeholders. In addition, our equity
holders may have an interest in pursuing acquisitions, divestitures, financings or other transactions that, in
their judgment, could enhance their equity investments, even though such transactions might involve risks
to holders of the notes. Furthermore, such investment funds or their affiliates may in the future own
businesses that directly or indirectly compete with us. They also may pursue acquisition opportunities that
may be complementary to our business, and as a result, those acquisition opportunities may not be
available to us.
We could experience labour disputes that could disrupt our business.
As at 30 March 2013, 40% of our employees were represented by collective bargaining and are covered by
collective bargaining or similar agreements that are subject to periodic renegotiation, which is currently in
process. Although we negotiated in April 2013 a two-year collective bargaining agreement with the South
African Commercial, Catering and Allied Workers Union (the “SACCAWU”), the biggest trade union active
amongst our employees, future collective bargaining negotiations may not prove successful and result in the
disruption of our operations. Such future collective bargaining negotiations may result in an increase in our
labour costs. In addition, our employees could join in national labour strikes, boycotts or other collective
actions. Any work stoppages and labour disruptions or any increase in our labour costs could materially
adversely affect our retail sales, results of operations and financial condition.
Labour disputes and other workforce-related issues have been prevalent in certain industries in South
Africa. Labour disputes affecting our suppliers or social unrest in South Africa generally may also negatively
impact our business, by disrupting our supply chain or causing a reduction in the spending capacity of our
customers.
We are subject to complaints, claims and legal actions that could affect us.
We are party to various complaints, claims and legal actions in the ordinary course of our business. These
complaints, claims and legal actions, even if successfully disposed of without direct adverse financial effect,
could have a material adverse effect on our reputation and divert our financial and management resources
from more beneficial use. If we were to be found liable under any such claims, our results of operations
could be adversely affected.
Compliance with privacy and information laws and requirements could be costly, and a breach of
information security or privacy could adversely affect our business.
We are subject to privacy and information laws and requirements governing our use of identifiable data of
customers, employees and others. At present, data protection in South Africa is regulated under the broader
concept of the right to privacy. The right to privacy is a fundamental right that is protected both in terms of
South Africa's common law and under section 14 of the Constitution of the Republic of South Africa, which
provides individuals with the right to have their private or personal information protected against disclosure
by other persons. In order to give effect to the constitutional right to privacy, the South African Law Reform
Commission has prepared and published the Protection of Personal Information Bill (the “POPI Bill”).
The POPI Bill aims to bring South Africa in line with international data protection law, including that of the
European Union, by introducing measures to ensure that the processing of personal information (of both
natural and juristic persons) is safeguarded. The POPI Bill introduces eight "Information Protection
Conditions" which regulate the processing (both automated and non-automated) of personal information,

21
which includes the collection, recording, organisation, storage, updating or modification, retrieval,
consultation, use and dissemination by means of transmission, distribution or making available in any other
form, merging, linking, as well as blocking, erasure or destruction of information. The POPI Bill also
regulates the transfer and storage of information outside of South Africa as well as the use of personal
information for direct marketing.
The POPI Bill establishes an information regulator which is empowered to monitor and enforce compliance
with the provisions of the POPI Bill. A failure to comply with the POPI Bill, once enacted, will be an offence
and may attract certain penalties. A ninth draft of the POPI Bill was passed by the National Assembly on
11 September 2012, and it is expected that the POPI Bill will come into force in 2013.
Compliance with such laws and requirements may require us to make necessary systems changes and
implement new administrative processes. If a data security breach occurs, our reputation could be damaged
and we could experience lost sales, fines or lawsuits.
We may be unable to protect our trademarks and other intellectual property or may otherwise have
our brand names harmed.
We believe that our registered trademarks and other intellectual property have significant value and are
important to the marketing of our products and business. While we intend to take appropriate action to
protect our intellectual property rights, we may not be able to sufficiently prevent third parties from using our
intellectual property without our authorisation. The use of our intellectual property by others could reduce or
eliminate any competitive advantage we have developed, causing us to lose sales or otherwise harm the
reputation of our brands names.

22
Audited Consolidated and Company Annual Financial Statements
Edcon Holdings Limited
For the period ended 30 March 2013

23
Consolidated and Company Financial Statements of Edcon Holdings Limited (Registration number 2006/036903/06)
Contents
Consolidated and Company Financial Statements
Certificate by the Company Secretary 24
Approval of the Consolidated and Company Financial Statements 25
Independent Auditor’s Report 26
Directors’ Report 28
Audit Committee Report 32
Currency of the Consolidated and Company Financial Statements 34
Consolidated Financial Statements of Edcon Holdings Limited
Consolidated Statement of Financial Position 35
Consolidated Statement of Comprehensive Income 36
Consolidated Statement of Changes in Equity 37
Consolidated Disclosure of Tax Effects on Other Comprehensive Income 38
Consolidated Statement of Cash Flows 39
Notes to the Consolidated Financial Statements 40
Company Financial Statements 126
Company Statement of Financial Position 127
Company Statement of Comprehensive Income 128
Company Statement of Changes in Equity 129
Company Disclosure of Tax Effects on Other Comprehensive Income 130
Company Statement of Cash Flows 131
Notes to the Company Financial Statements 132
Annexure 1 – Interests in Significant Subsidiaries 150
Corporate Information 151
These annual financial statements were prepared by the finance department of the Edcon Holdings Limited Group acting
under the supervision of MR Bower CA (SA), the Chief Financial Officer of the Group.
24
Consolidated and Company Financial Statements of Edcon Holdings Limited (Registration number 2006/036903/06) Certificate by the Company Secretary
In my capacity as Company Secretary, I hereby confirm, in terms of the Companies Act, No. 71 of 2008 (the “Act”) of
South Africa, that for the period ended 30 March 2013, the Company has filed with the Commissioner all such returns
and notices as are required of a public company in terms of the Act and that all such returns and notices are true,
correct and up to date.
CM Vikisi Group Secretary
Johannesburg 30 May 2013
25
Approval of the Consolidated and Company Financial Statements of Edcon
Holdings Limited
The directors’ responsibility for the Consolidated and Company Financial Statements is set out on page 31 of the
directors’ report.
The Consolidated and Company annual financial statements, which appear on pages 28 to 151, were approved by the
board of directors on 30 May 2013 and are signed on its behalf by:
DM Poler, Chairman J Schreiber, Group Chief Executive Officer
Johannesburg
30 May 2013

26
Independent Auditor’s Report
TO THE SHAREHOLDERS OF EDCON HOLDINGS LIMITED
We have audited the consolidated and separate financial statements of Edcon Holdings Limited and its subsidiaries, set
out on pages 34 to 150, which comprise the consolidated and separate statements of financial position as at 30 March
2013, and the consolidated and separate statements of comprehensive income, consolidated and separate statements
of changes in equity and consolidated and separate statements of cash flows for the 52 week period then ended, and
the notes, comprising a summary of significant accounting policies and other explanatory information.
Directors’ Responsibility for the Consolidated Financial Statements
The company's directors are responsible for the preparation and fair presentation of these consolidated and separate
financial statements in accordance with International Financial Reporting Standards and the requirements of the
Companies Act of South Africa, and for such internal control as the directors determine is necessary to enable the
preparation of consolidated and separate financial statements that are free from material misstatement, whether due to
fraud or error.
Auditor’s Responsibility
Our responsibility is to express an opinion on these consolidated and separate financial statements based on our audit.
We conducted our audit in accordance with International Standards on Auditing. Those standards require that we
comply with ethical requirements and plan and perform the audit to obtain reasonable assurance about whether the
consolidated and separate financial statements are free from material misstatement.
An audit involves performing procedures to obtain audit evidence about the amounts and disclosures in the
consolidated and separate financial statements. The procedures selected depend on the auditor's judgement, including
the assessment of the risks of material misstatement of the consolidated and separate financial statements, whether
due to fraud or error. In making those risk assessments, the auditor considers internal control relevant to the entity's
preparation and fair presentation of the consolidated and separate financial statements in order to design audit
procedures that are appropriate in the circumstances, but not for the purpose of expressing an opinion on the
effectiveness of the entity's internal control. An audit also includes evaluation of the appropriateness of accounting
policies used and the reasonableness of accounting estimates made by management, as well as evaluating the overall
presentation of the consolidated and separate financial statements.
We believe that the audit evidence we have obtained is sufficient and appropriate to provide a basis for our audit
opinion.
Opinion
In our opinion, the consolidated and separate financial statements present fairly, in all material respects, the
consolidated and separate financial position of Edcon Holdings Limited as at 30 March 2013, and its consolidated and
separate financial performance and consolidated and separate cash flows for the 52 week period then ended in
accordance with International Financial Reporting Standards and the requirements of the Companies Act of South
Africa.
Ernst & Young Inc. Wanderers Office Park 52 Corlett Drive, Illovo Private Bag X14 Northlands 2116 Tel: 00 27 (0)11 772-3000 Fax: 00 27 (0)11 772-4000 Docex 123 Randburg Website www.ey.com/za

27
Independent Auditor’s Report (continued)
Other reports required by the Companies Act
As part of our audit of the consolidated and separate financial statements for the 52 week period ended 30 March 2013,
we have read the Directors’ Report, the Audit Committee Report and the Certificate of the Company Secretary for the
purpose of identifying whether there are material inconsistencies between these reports and the audited consolidated
and separate financial statements. These reports are the responsibility of the respective preparers. Based on reading
these reports we have not identified material inconsistencies between these reports and the audited consolidated and
separate financial statements. However, we have not audited these reports and accordingly do not express an opinion
on these reports.
Ernst & Young Inc.
Director – Jane Margaret Fitton
Registered Auditor
Chartered Accountant (SA)
30 May 2013

28
Consolidated and Company Financial Statements of Edcon Holdings Limited (Registration number 2006/036903/06)
DIRECTORS’ REPORT For the period ended 30 March 2013 ______________________________________________________________________________________________
The directors submit their report on the state of affairs, the business and profit or loss of Edcon Holdings Limited (the
“Company”) and the Edcon Holdings Limited Group (the “Group”) together with the Consolidated and Company
financial statements for the 52–week period ended 30 March 2013.
Nature of business
The Company is incorporated and domiciled in the Republic of South Africa. Its principal trading subsidiary Edcon
Limited is engaged in the retailing of fashion apparel and related merchandise. The Group operates primarily in
southern Africa. The Consolidated Financial Statements of Edcon Holdings Limited are set out on pages 34 to 125
and the Company Financial Statements are set out on pages 126 to 150.
Results of operations
The results for the period are detailed in the Consolidated and Company financial statements that follow.
Loans and Notes issued
On 31 October 2012, OntheCards Investments II Proprietary Limited (“OtC”) completed an early redemption of all its
Class A and Class B Notes in issue, in accordance with the terms and conditions of its R6,500 million Receivables
Backed Domestic Term Note Program. The notes redemption was necessary so that the OtC receivables asset could
be sold to Edcon Limited, and as such facilitate the sale of Edcon Limited’s storecard receivables portfolio to ABSA
Bank Limited (“Absa”). On 31 October 2012, the subordinated loan was repaid and OtC became dormant.
On 13 February 2013, Edcon Limited issued new senior secured fixed rate notes, in terms of its existing program which
mature in March 2018, with a face value of €300 milion. The notes were issued at 96.5% of face value, are guaranteed
on a senior secured basis and are secured, along with the revolving credit facility, the super senior secured term loan,
and the senior secured fixed rate notes, by security interests over substantially all the assets of Edcon Holdings Limited
and its subsidiaries.
On 14 February 2013 Edcon Limited completed a repurchase of senior secured floating rate notes with a nominal value
of €754 million at 100.1% of the face value. The notes were redeemed out of the combined proceeds raised from the
issuance of the new senior secured fixed rate notes, a portion of the proceeds from the sale of the private label store
card receivables portfolio and through proceeds on termination of certain in-the-money derivative contracts over the
related notes of being repurchased.
Dividends
No dividends were paid by the Company for the period ended 30 March 2013 (2012 and 2011: RNil).
Property, fixtures, equipment and vehicles
There were no major changes in the nature of the Group’s property, fixtures, equipment and vehicles during the
period.
Shareholding
Edcon Holdings Limited’s shareholders are Edcon (BC) S.A.R.L, The Edcon Staff Empowerment Trust (the
“Empowerment Trust”) and seven further trusts. Edcon (BC) S.A.R.L is a société à responsabilité limitée incorporated
in Luxembourg and holds 85% of the ordinary shares of Edcon Holdings Limited. The Empowerment Trust was
created in July 2005 as part of our Black Empowerment Equity (BEE) program and its beneficiaries are predominantly
black employees. The Staff Empowerment Trust holds shares entitling it in aggregate to 11% of the votes at any
general meeting of Edcon Holdings Limited. The remaining shareholders in Edcon Holdings Limited are the Founder
Investor Trusts and the Independent Investor Trusts. These trusts, the beneficiaries of which include members of
Edcon management and directors of Edcon, collectively hold 4% of the shares of Edcon Holdings Limited.

29
Consolidated and Company Financial Statements of Edcon Holdings Limited (Registration number 2006/036903/06)
DIRECTORS’ REPORT (continued) For the period ended 30 March 2013 ______________________________________________________________________________________________
Subsidiaries
The Company has a 100% shareholding in Edcon Acquisition Proprietary Limited, and indirectly owns 100% of the
issued capital of Edcon Limited. A list of significant subsidiaries is reflected in Annexure 1 on page 150.
Share capital
Details of the authorised and issued share capital of the Company and any movements during the period are
disclosed in note 8 of the Company Financial Statements.
Special resolutions
During the financial period the Company issued the following special resolutions:
to resolve that the Company’s memorandum of incorporation be replaced with the new memorandum of
incorporation in terms of the Companies Act, No. 71 of 2008 as amended;
to recategorise the Company as a public company and cease as a private company;
to approve the providing of financial assistance in terms of Section 45 of the Companies Act of South Africa;
to approve the remuneration payable to non-executive directors of the Company with effect 1 January 2013; and
to approve the sale of trade receivables to Absa Bank Limited (“Absa”).
Non-executive directors
DM Poler (Chairman)* (appointed on 25 May 2007)
EB Berk* (appointed on 25 May 2007)
ZB Ebrahim (appointed on 23 July 2007)
MMV Valentiny** (appointed on 4 November 2009)
MS Levin* (appointed on 2 June 2010)
DH Brown (appointed on 1 January 2013)
TF Mosololi (appointed on 1 January 2013)
LL von Zeuner (appointed on 1 April 2013)
Executive directors
J Schreiber*** (appointed on 1 April 2011)
Dr U Ferndale (appointed on 30 May 2007)
MR Bower (appointed on 1 July 2012)
SM Ross* (resigned 14 May 2012)
*USA **Belgian ***German
Prescribed officers
C Claassen – Chief Executive Discount Division
The directors’ and prescribed officers’ emoluments are included in the Consolidated Financial Statements in note 30.2.1
on page 91.
Auditors
Ernst & Young Inc. are the auditors of Edcon Holdings Limited and its significant subsidiaries.
Secretary
The Group secretary is CM Vikisi.
Registered Office
Edgardale, Press Avenue
Crown Mines, Johannesburg
2092
Postal Address
PO Box 100
Crown Mines
2025

30
Consolidated and Company Financial Statements of Edcon Holdings Limited (Registration number 2006/036903/06)
DIRECTORS’ REPORT (continued) For the period ended 30 March 2013 ______________________________________________________________________________________________
Events after the reporting period
No events occurred between the financial period end and the date of this report which would have a material impact on
the Company’s Financial Statements.
In terms of the Consolidated Financial Statements, the following events have occurred after the reporting period:
Repayment of senior secured floating rate notes
On 20 May 2013, the Group completed the repurchase of all its senior secured floating rate notes (note 19.2) at the face
value of €387 million. The repurchase was funded from the proceeds drawn from the senior secured term loan (note
19.7), as well as net proceeds derived on termination of the derivative contracts that were hedging the exchange rate
risk on the notes repurchased (included in note 7.5).
RCF extension
On 17 May 2013, the Group received commitments of R 3 717 million from certain financial institutions to extend the
revolving credit facility from a maturity of 31 March 2014 at reporting date to 31 December 2016. The other terms of the
facility remain substantially the same (note 21).
Update to long-term hedging strategy
In April 2013, a series of derivative contracts were entered into to increase the extent of hedge cover on the euro
denominated senior secured fixed rate notes:
Cross currency swaps were entered into which, (i) protect against interest rate variability in future interest cash
flows on liabilities, (ii) protect against variability in future interest cash flows that are subject to fluctuations based
on foreign exchange rates, and (iii) hedge the repayment of €230 million in principal and interest on the notes to
15 March 2015. The hedges create an effective annual average fixed interest rate of 15.55% over the period of
cover. The cross currency swaps have been designated as a cash flow hedge.
A cross currency swap was entered into which protects against variability in future interest cash flows that are
subject to fluctuations based on foreign exchange rates. The notional value of the hedge is €70 million and
provides cover on the coupon of the notes up to 15 March 2015. The hedge creates an effective annual average
fixed interest rate of 10.2% over the period of cover. The cross currency swap has been designated as a cash
flow hedge.
Foreign currency call options were entered into which hedge the repayment of €237 million in principal on the
notes to 12 March 2015. The premiums payable on the foreign currency call options of R317 million have been
deferred to 13 March 2015. These options have not been designated as cash flow hedges.
Sale of trade accounts receivable
On 30 April 2013, we sold an additional R469 million of the South African trade receivables to Absa. We expect to
complete the sale of all the remaining eligible trade accounts receivables of R1 134 million, classified as held-for-sale
on the Consolidated Statement of Financial Position of Edcon Holdings Limited in the 2014 financial period (refer to
note 13 of the Consolidated Financial Statements).

31
Consolidated and Company Financial Statements of Edcon Holdings Limited (Registration number 2006/036903/06)
DIRECTORS’ REPORT (continued) For the period ended 30 March 2013 ______________________________________________________________________________________________
Going concern
The Consolidated Statement of Financial Position at 30 March 2013 reports share premium of R2 153 million in equity
attributable to shareholders and a shareholder’s loan recognised in equity of R8 290 million offset by an accumulated
retained loss of R11 908 million and a net debit of R51 million in other reserves, resulting in negative equity at 30 March
2013 of R1 516 million. The shareholder’s loan of R9 091 million has been subordinated to the claims of all the creditors
of the Group and the total negative equity and shareholder’s loan is R715 million.
The directors’ have considered the solvency and liquidity of the business in accordance with the Act and in doing so,
have focused on the fair value of the assets and liabilities of the business (“solvency”) and the ability of the business to
meet its financial obligations for the 12 months following approval of the Consolidated Financial Statements (“liquidity”).
The analysis considered planned future sales growth, margin growth, expected operating costs, refinancing of debt, the
tax settlement of the Group, the terms of the shareholder’s loan, all guarantors and cross guarantors and the fair values
of the Group’s assets and liabilities. The directors have assessed after taking into consideration the analysis performed
including the issue of the R3 598 million senior secured fixed rate notes and their related derivative hedging strategy,
the repurchase of all the senior secured floating rate notes and the extension of the revolving credit facility that for the
next 12 months, following the approval of the Consolidated Financial Statements, the Group will have adequate facilities
and the assets at fair value exceed the liabilities of the Group.
Notwithstanding the fact that the Group’s liabilities exceed its assets in accordance with International Financial
Reporting Standards, the Consolidated Financial Statements set out on pages 34 to 125 have been prepared on the
going-concern basis as the Group’s assets at fair value exceed the liabilities. The directors have every reason to believe
that the Group has adequate resources to continue in operation for the foreseeable future and is considered both
solvent and liquid.
The Company Financial Statements set out on pages 126 to 150 have been prepared on the going-concern basis. The
directors have every reason to believe that the Company has adequate resources to continue in operation for the
foreseeable future.
Directors’ responsibility for financial reporting
The directors’ are ultimately responsible for the preparation of the Consolidated and Company financial statements and
related financial information that fairly present the state of affairs and the results of Edcon Holdings Limited. The
external auditors are responsible for independently auditing and reporting on these financial statements in conformity
with International Standards on Auditing.
The financial statements set out in this report have been prepared by management in accordance with International
Financial Reporting Standards and the South African Companies Act, No 71, of 2008. They incorporate full and
reasonable disclosures and are based on appropriate accounting policies, which have been consistently applied and
which are supported by reasonable and prudent judgements and estimates.
Adequate accounting records have been maintained throughout the period under review.

32
Consolidated and Company Financial Statements of Edcon Holdings Limited (Registration number 2006/036903/06) AUDIT COMMITTEE REPORT For the period ended 30 March 2013 ______________________________________________________________________________________________
This report is provided by the Audit and Risk Committee (the “Committee”), in respect of the 2013 financial period of
Edcon Holdings Limited, in compliance with section 94 of the Companies Act 71 of 2008 (the “Act”), as amended from
time to time. The Committee’s operation is guided by a detailed charter that is informed by the Act and the King Code of
Good Corporate Governance.
Charter
The Committee is appointed by the board of directors (the “board”) and the shareholders annually and has adopted a
comprehensive and formal Charter which has been approved by the board and reviewed on an annual basis.
Execution of functions
The Committee has executed its duties and responsibilities during the financial period in accordance with its terms of
reference as they relate to the Group's accounting, internal auditing, internal controls and financial reporting practices.
During the period under review the Committee, amongst other matters, considered the following:
In respect of the external auditors and the external audit:
— approved the external auditors’ terms of engagement, the audit plan and budgeted audit fees payable;
— reviewed the audit process and audit reports and evaluated the effectiveness of the audit; and
— obtained assurance from the external auditors that their independence was not impaired.
In respect of the financial statements:
— confirmed the going concern concept as the basis of preparation of the quarterly and annual financial
statements;
— examined and reviewed the quarterly and annual financial statements prior to submission and approval by the
board;
— reviewed any significant legal and tax matters that could have a material impact on the financial statements;
— reviewed and discussed the external auditors' audit report; and
— ensured that the financial statements fairly present the financial position of the Company and of the Group as at
the reporting dates and the results of operations and cash flows for the reporting period and based on the
above, the Committee was satisfied that at the date of this report, the financial statements complied with
accounting practices of the Group.
In respect of internal financial controls and internal audit:
— reviewed and approved the internal audit charter and audit plan and evaluated the independence, effectiveness
and performance of the internal audit department;
— considered reports of the internal auditors on the Group's systems of internal control, including internal financial
controls and maintenance of effective internal control systems;
— assessed the adequacy of the performance of the internal audit function and adequacy of the available internal
audit resources and found them to be satisfactory;
— reviewed significant issues raised by the internal audit processes and the adequacy of corrective action in
response to such findings; and
— noted that there were no significant differences of opinion between the internal audit function and management;
and based on the above, the Committee was satisfied that at the date of this report there were no material
breakdowns in internal control, including internal financial controls, resulting in any material loss to the Group.
In respect of legal, regulatory and compliance requirements:
— reviewed with management matters that could have a material impact on the Group;
— monitored compliance with the Act, JSE debt listing requirements, Irish Stock Exchange requirements and all
other applicable legislation and governance codes as well as financial covenants; and

33
Consolidated and Company Financial Statements of Edcon Holdings Limited (Registration number 2006/036903/06) AUDIT COMMITTEE REPORT (continued) For the period ended 30 March 2013 ______________________________________________________________________________________________
— noted that no complaints were received through the Group's ethics and fraud hotline concerning accounting
matters, internal audit, internal financial controls, contents of financial statements, potential violations of the law
and questionable accounting or auditing matters.
In respect of risk management and information technology
— considered and reviewed reports from management on risk management, including fraud risks and information
technology risks as they pertain to financial reporting, internal controls and the going concern assessment.
Solvency and liquidity review
The Committee considered the solvency and liquidity tests as stipulated in section 4 and 46 of the Act. The Committee
is satisfied that the board has performed a solvency and liquidity test and that the Group met all the requirements.
Going concern
The Committee considered the going concern status of the Company and the Group on the basis of a review of the
financial statements and the budgeted and forecast earnings and cash flow information as well as liquidity forecasts
available to the Committee and recommended such going concern status for adoption by the board. The board
statement on the going concern status of the Group and Company is contained on page 31 in the directors’ report.
Independence of the external auditors
The Committee is satisfied that Ernst & Young Inc. are independent of the Group. This conclusion was arrived at, inter
alia, after taking into account the following factors:
the representations made by Ernst & Young Inc. to the Committee;
the auditors do not, except as external auditors or in rendering permitted non-audit services, receive any
remuneration or other benefits from the Group;
the auditors' independence was not impaired by any consultancy, advisory or other work undertaken by the
auditors;
the auditors' independence was not prejudiced as a result of any previous appointment as auditor; and
the criteria specified for independence by the Independent Regulatory Board for Auditors and international
regulatory bodies were met.
The Committee has reviewed the Consolidated and Company Financial Statements of Edcon Holdings Limited and
recommended them to the board for approval.
On behalf of the Committee
David H Brown
Chairman of the Audit & Risk Committee
30 May 2013

34
Currency of the Consolidated and Company Financial Statements of Edcon Holdings Limited
The presentation currency of the financial statements is South African Rand (R). The approximate Rand cost of a unit of
the following currencies at each reporting period end was:
30 March
2013
31 March
2012
2 April
2011
US Dollar 9,16 7,71 6,69
Sterling 14,02 12,36 10,87
Botswana Pula 1,12 1,05 1,04
Euro 11,78 10,29 9,53
Zambian Kwacha - ZMW 1,70
Zambian Kwacha – ZMK 0,0014
Mozambique Metical 0,31
Singapore Dollar 7,44
Bangladeshi Taka 0,12
Chinese Yuan Renminbi 1,47
Hong Kong Dollar 1,19

35
Consolidated Statement of Financial Position of Edcon Holdings Limited
Note
2013 30 March
Rm
2012 31 March
Rm
2011 2 April
Rm
ASSETS
Non-current assets
Properties, fixtures, equipment and vehicles 3 2 559 2 471 2 246
Intangible assets 4 16 697 17 481 18 024
Employee benefit asset 30.3 172 154 -
Equity accounted investment in joint ventures 6 4 67 6
Derivative financial instruments 7.1 292 472 30
Deferred tax 8 33 1 030 887
Total non-current assets 19 757 21 675 21 193
Current assets
Inventories 9 3 659 3 170 2 626
Trade receivables 10 181 10 002 8 853
Sundry receivables and prepayments 11 455 424 342
Derivative financial instruments 7.2 815
Cash and cash equivalents 12 669 1 083 2 315
5 779 14 679 14 136
Assets classified as held-for-sale 13.2.2 1 160
Total current assets 6 939 14 679 14 136
Total assets 26 696 36 354 35 329
EQUITY AND LIABILITIES
Equity attributable to shareholders
Share capital 14 - - -
Share premium 14 2 153 2 153 2 148
Other reserves 15 (51) (688) (600)
Retained loss 16 (11 908) (6 887) (4 972)
Shareholder’s loan - equity 18 8 290 8 290
(1 516) 2 868 (3 424)
Non-controlling interest - - -
Total equity (1 516) 2 868 (3 424)
Non-current liabilities – shareholder’s loan
Shareholder’s loan 18 801 659 8 184
Total equity and shareholder’s loan (715) 3 527 4 760
Non-current liabilities – third parties
Interest-bearing debt 19 19 137 23 533 24 440
Deferred option premium 20 269
Finance lease liability 22.2 273 301
Lease equalisation 432 399 392
Derivative financial instruments 7.3 - 63 308
Employee benefit liability 30.5 184 182 130
Deferred tax 8 596
Deferred revenue 24 86
20 977 24 478 25 270
Total non-current liabilities 21 778 25 137 33 454
Current liabilities
Interest-bearing debt 21 1 456 2 901
Deferred option premium 20 36
Finance lease liability 22.2 40 28
Current taxation 12 241 244
Deferred revenue 24 106 80
Derivative financial instruments 7.4 79 797 946
Trade and other payables 23 4 705 4 302 4 109
Total current liabilities 6 434 8 349 5 299
Total equity and liabilities 26 696 36 354 35 329
Total managed capital per IAS 1 35 20 191 30 290 29 200
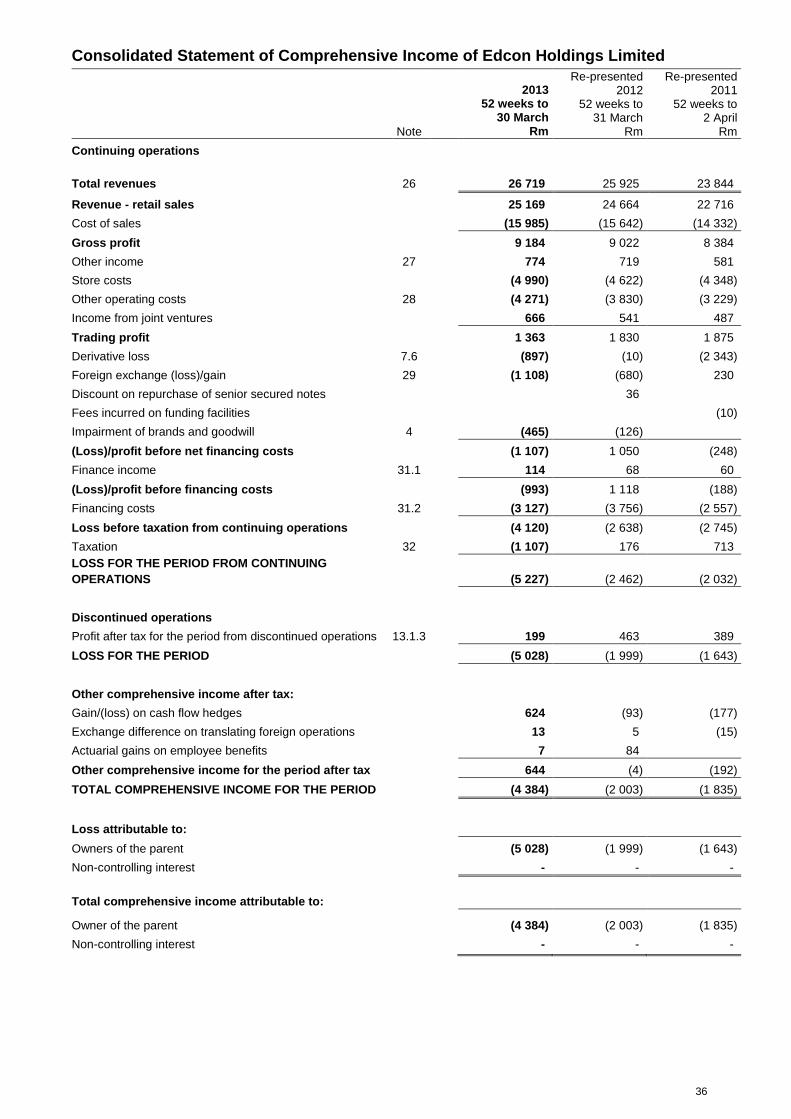
36
Consolidated Statement of Comprehensive Income of Edcon Holdings Limited
Note
2013 52 weeks to
30 March Rm
Re-presented 2012
52 weeks to 31 March
Rm
Re-presented 2011
52 weeks to 2 April
Rm
Continuing operations
Total revenues
26 26 719 25 925 23 844
Revenue - retail sales 25 169 24 664 22 716
Cost of sales (15 985) (15 642) (14 332)
Gross profit 9 184 9 022 8 384
Other income 27 774 719 581
Store costs (4 990) (4 622) (4 348)
Other operating costs 28 (4 271) (3 830) (3 229)
Income from joint ventures 666 541 487
Trading profit 1 363 1 830 1 875
Derivative loss 7.6 (897) (10) (2 343)
Foreign exchange (loss)/gain 29 (1 108) (680) 230
Discount on repurchase of senior secured notes 36
Fees incurred on funding facilities (10)
Impairment of brands and goodwill 4 (465) (126)
(Loss)/profit before net financing costs (1 107) 1 050 (248)
Finance income 31.1 114 68 60
(Loss)/profit before financing costs (993) 1 118 (188)
Financing costs 31.2 (3 127) (3 756) (2 557)
Loss before taxation from continuing operations (4 120) (2 638) (2 745)
Taxation 32 (1 107) 176 713
LOSS FOR THE PERIOD FROM CONTINUING
OPERATIONS (5 227) (2 462) (2 032)
Discontinued operations
Profit after tax for the period from discontinued operations 13.1.3 199 463 389
LOSS FOR THE PERIOD (5 028) (1 999) (1 643)
Other comprehensive income after tax:
Gain/(loss) on cash flow hedges 624 (93) (177)
Exchange difference on translating foreign operations 13 5 (15)
Actuarial gains on employee benefits 7 84
Other comprehensive income for the period after tax 644 (4) (192)
TOTAL COMPREHENSIVE INCOME FOR THE PERIOD (4 384) (2 003) (1 835)
Loss attributable to:
Owners of the parent (5 028) (1 999) (1 643)
Non-controlling interest - - -
Total comprehensive income attributable to:
Owner of the parent (4 384) (2 003) (1 835)
Non-controlling interest - - -

37
Consolidated Statement of Changes in Equity of Edcon Holdings Limited
Share Capi-
tal Rm
Share premium
Rm
Foreign currency
transla-tion
reserve Rm
Cash flow
hedging reserve
Rm
Revalua-tion
surplus Rm
Retained loss Rm
Share-holder’s
loan Rm
Total attributable
to owners of the
parent Rm
Non-control-
ling interest
Rm
Total equity
Rm
Balance as at
3 April 2010 - 2 148 (20) (391) 3 (3 329) (1 589) - (1 589)
Loss for the period - (1 643) (1 643) - (1 643)
Other
comprehensive
income for the
period (15) (177) (192) - (192)
Total
Comprehensive
income (15) (177) - (1 643) (1 835) - (1 835)
Balance as at
2 April 2011 - 2 148 (35) (568) 3 (4 972) (3 424) - (3 424)
Loss for the period - (1 999) (1 999) - (1 999)
Other
comprehensive
income for the
period 5 (93) 84 (4) - (4)
Total
Comprehensive
income 5 (93) - (1 915) (2 003) - (2 003)
Ordinary shares
issued - - -
Preference shares
issued - 5 5 5
Shareholder’s loan 8 290 8 290 8 290
Balance as at
31 March 2012 - 2 153 (30) (661) 3 (6 887)
8 290 2 868 - 2 868
Loss for the period - (5 028) (5 028) - (5 028)
Other
comprehensive
income
for the period 13 624 7 644 - 644
Total
Comprehensive
Income 13 624 - (5 021) (4 384) - (4 384)
Balance as at
30 March 2013 - 2 153 (17) (37) 3 (11 908) 8 290 (1 516) - (1 516)
Note 14.7 14.7 15 15 15 16 18

38
Consolidated Disclosure of Tax Effects on Other Comprehensive Income of Edcon Holdings Limited
2013 52 weeks to
30 March Rm
2012 52 weeks to
31 March Rm
2011 52 weeks to
2 April Rm
Disclosure of tax effects relating to each component of other
comprehensive income:
Before tax amount
Cash flow hedges 868 (130) (246)
Exchange differences on translating foreign operations 13 5 (15)
Actuarial gain on employee benefits 10 116
Other comprehensive income for the period before tax 891 (9) (261)
Tax (expense)/income
Cash flow hedges (244) 37 69
Employee benefits (3) (32)
Tax (expense)/income (247) 5 69
After tax amount
Cash flow hedges 624 (93) (177)
Exchange differences on translating foreign operations 13 5 (15)
Actuarial gain on employee benefits 7 84
Other comprehensive income for the period after tax 644 (4) (192)

39
Consolidated Statement of Cash Flows of Edcon Holdings Limited
Note
2013
52 weeks to 30 March
Rm
Re-presented 2012
52 weeks to 31 March
Rm
Re-presented 2011
52 weeks to 2 April
Rm
Cash retained from operating activities
Loss before taxation from continuing operations (4 120) (2 638) (2 745)
Profit before taxation from discontinued operations 277 643 541
Finance income (114) (68) (60)
Financing costs 3 127 3 756 2 557
Impairment of intangibles 4 465 126
Derivative loss 7.6 897 10 2 343
Deferred revenue 24 112 80
Foreign exchange loss/(gain) 29 1 108 680 (230)
Discount on repurchase of senior secured notes (36)
Amortisation of intangible assets 28.1 319 417 418
Depreciation 28.2 730 755 798
Net loss/(gain) on disposal of properties, fixtures, equipment
and vehicles 28.5 22 22 (8)
Other non-cash items 33.1 84 (56) 8
Operating cash inflow before changes in working
capital
2 907
3 691
3 622
Working capital movement 33.2 8 447 (1 603) (69)
Cash inflow from operating activities 11 354 2 088 3 553
Finance income received 100 68 60
Financing costs paid (2 890) (2 996) (2 191)
Taxation paid 33.3 (90) (145) (97)
Net cash inflow/(outflow) from operating activities 8 474 (985) 1 325
Cash utilised in investing activities
Investment to maintain operations 33.4 (560) (543) (349)
Investment to expand operations 33.5 (209) (151) (25)
Net cash outflow from investing activities (769) (694) (374)
Cash effects of financing activities
Increase in shareholder funding 33.6 5
Super senior secured term loan (decrease)/increase 33.7 (985) 985
Non-current interest-bearing debt (decrease)/increase 33.8 (5 512) 672 4 616
Settlement of derivatives 33.9 1 021 (5 001)
Receivables-backed notes (decrease) 33.10 (4 300)
Current interest-bearing debt increase/(decrease) 33.11 705 751 (350)
Capitalised finance lease (decrease )/increase 33.12 (34) 4
Net cash (outflow)/inflow from financing activities (8 120) 447 250
(Decrease)/increase in cash and cash equivalents 33.13 (415) (1 232) 1 201
Cash and cash equivalents at the beginning of the
period 1 083 2 315 1 125
Currency adjustments 1 - (11)
Cash and cash equivalents at the end of the period 669 1 083 2 315
40
Notes to the Consolidated Financial Statements of Edcon Holdings Limited
1. SIGNIFICANT ACCOUNTING POLICIES AND BASIS OF PREPARATION
1.1 Corporate information
Edcon Holdings Limited (the “Company”) is a limited liability company which is incorporated and domiciled in South Africa.
The address of the Company’s registered office is Edgardale, Press Avenue, Crown Mines, Johannesburg, 2092. The
consolidated financial statements of the Company for the year ended 30 March 2013 comprise the Company and its
subsidiaries (together referred to as the “Group”).
1.2 Basis of preparation
The financial statements have been prepared in accordance with International Financial Reporting Standards (IFRS), as
issued by the International Accounting Standards Board (IASB) and the Companies Act of South Africa (No. 71 of 2008).
The financial statements are presented in Rand (ZAR), the currency of South Africa where Edcon Holdings Limited is
incorporated. On 30 May 2013, the financial statements were authorised for issue by the Board of Directors.
The financial statements have been prepared on a historical cost basis except for land and buildings and certain financial
instruments that have been measured at fair value.
The 2013, 2012 and 2011 financial period consisted of 52 weeks respectively.
The Consolidated and Company Financial Statements incorporate the following accounting policies:
1.3 Basis of consolidation
The Consolidated Financial Statements comprise the financial statements of the parent company, Edcon Holdings
Limited, its subsidiaries, the Staff Empowerment Trust and OntheCards Investment Limited II Proprietary Limited (“OtC”)
(securitisation program), presented as a single economic entity and, consolidated at the same reporting date of Edcon
Holdings Limited. The Consolidated Financial Statements are prepared using uniform accounting policies for similar
transactions and other events. The comparative periods in the Consolidated Financial Statements have been re-
presented where applicable to take into account the discontinued operation (note 13). Transactions and balances
between Group companies are eliminated.
Edcon Holdings Limited controls an entity when it has the power to govern the financial and operating policies of the
entity. Generally this is indicated by a direct or indirect shareholding of more than one half of the voting rights.
Subsidiaries, which are directly or indirectly controlled by the Group, are consolidated from the date control is transferred
to the Group, and are de-consolidated from the date control ceases.
Business combinations
Business combinations are accounted for using the acquisition method. As of the acquisition date, the Group recognises
the identifiable assets acquired and the liabilities assumed at their acquisition date fair values. For each business
combination, the Group measures the non-controlling interests in the acquiree (being present ownership interests
providing entitlement to a proportionate share of the net assets of the acquiree in the event of liquidation) either at fair
value or at their proportionate share of the aquiree’s identifiable net assets.
The cost of an acquisition is the aggregate of the assets transferred, the liabilities incurred to former owners of the
acquiree and the equity instruments issued, measured at acquisition-date fair values. Acquisition related costs are
expensed as incurred. Any contingent consideration that may be transferred by the Group is recognized at fair value at
the acquisition date. If the contingent consideration is classified as an asset or liability, subsequent changes in the fair
value of the contingent consideration are recognized in profit or loss. If the contingent consideration is classified as equity,
it is not remeasured until it is finally settled.
Any excess of the aggregate of the consideration transferred and the amount recognized for non-controlling interests over
the net identifiable assets acquired and liabilities assumed is considered goodwill and is recognized as a separate asset
on the Statement of Financial Position, initially measured at cost. If the fair value of the net assets of the subsidiary
acquired exceeds the aggregate of the consideration transferred and the amount recognized for non-controlling interests,
the difference is recognized in profit or loss on the acquisition date.

41
Notes to the Consolidated Financial Statements of Edcon Holdings Limited (continued)
1. SIGNIFICANT ACCOUNTING POLICIES AND BASIS OF PREPARATION (continued)
1.4 Use of estimates and judgments and assumptions made in the preparation of the Financial Statements
In preparing the financial statements in accordance with IFRS, management is required to make estimates, assumptions
and judgements that affect reported income, expenses, assets, liabilities and disclosure of contingent assets and
liabilities. Assessing available information and the application of judgement are necessary elements in making estimates.
Actual results in the future could differ from such estimates, and such differences may be material to the financial
statements. Estimates and their underlying assumptions are reviewed on an on-going basis. Any revisions to estimates
resulting from these reviews are recognised in the period in which such estimates are revised.
Significant estimates, assumptions and judgements made at the reporting date relate to credit risk valuation adjustments
in determining the fair value of derivative instruments to reflect non-performance risk (note 1.10.4), fair value of financial
instruments (note 1.10 and 36.8) a provision for impairment of receivables (note 1.10.1), derecognition of financial
instruments (note 1.10.1 and 1.10.2), allowances for slow-moving inventory (note 1.11), residual values, useful lives and
depreciation methods for property, fixtures, equipment and vehicles (note 1.13), impairment of non-financial assets
including goodwill and intangibles with indefinite lives (note 1.7 and note 1.13.5), pension fund and medical aid
obligations (note 1.18, 30.3.6 and 30.5.4), operating lease (note 1.12), current and deferred tax (note 1.15), discontinued
operations (note 1.14 and note 13) and loyalty points deferred revenue (note 1.22.2). Other judgments made relate to
classifying financial assets and liabilities into categories (note 1.10).
1.5 Foreign currency transactions and balances – Group companies
The presentation currency of the Consolidated Financial Statements is the South African Rand, which is also the
functional currency of Edcon Holdings Limited. Each entity in the Group determines its own functional currency and items
included in the financial statements of each entity are measured using that functional currency.
Transactions in foreign currencies are initially recorded by the Group’s entities at their respective functional currency spot
rates at the date the transaction first qualifies for recognition. Subsequent to initial recognition, monetary assets and
liabilities denominated in foreign currencies are translated at the functional currency spot rates of exchange at the
reporting date. Differences arising on settlement or translation of monetary items are recognised in profit or loss.
Non-monetary items that are measured in terms of historical cost in a foreign currency are translated using the exchange
rates at the dates of the initial transactions. Non-monetary items measured at fair value in a foreign currency are
translated using the exchange rates at the date when the fair value is determined. The gain or loss arising on translation
of non-monetary items measured at fair value is treated in line with the recognition of gain or loss on change in fair value
of the item (i.e., translation differences on items whose fair value gain or loss is recognised in other comprehensive
income or profit or loss are also recognised in other comprehensive income or profit or loss, respectively).
Any goodwill arising on the acquisition of a foreign operation and any fair value adjustments to the carrying amounts of
assets and liabilities arising on the acquisition are treated as assets and liabilities of the foreign operation and translated
at the spot rate of exchange at the reporting date.
1.6 Foreign currency translations – Group companies
On consolidation, the assets and liabilities of entities with a functional currency other than the Rand are translated into
Rand at the rate of exchange prevailing at the reporting date and their statements of comprehensive income are
translated at the weighted average exchange rates for the period. The exchange differences arising on translation for
consolidation are recognised in other comprehensive income (foreign currency translation reserve). On disposal of a
foreign operation, the deferred cumulative amount recognised in other comprehensive income (foreign currency
translation reserve) relating to that particular foreign operation is recognised in profit or loss.
1.7 Goodwill
Goodwill represents the excess of the cost of an acquisition over the fair value of the Group’s share of net identifiable
assets of the acquired entity at the date of acquisition. Goodwill is not amortised; it is tested annually for impairment and,
additionally, when an indication of impairment exists at the end of each reporting period. For goodwill impairment testing
purposes, the segments reported in note 5 are separate cash-generating units, since this is the level at which the
performance of investments is reviewed and assessed by management. The recoverable amount of a segment is
determined on the basis of its value in use. Refer to note 5 for details.
42
Notes to the Consolidated Financial Statements of Edcon Holdings Limited (continued)
1. SIGNIFICANT ACCOUNTING POLICIES AND BASIS OF PREPARATION (continued)
1.8 Joint ventures
The Group has interests in joint ventures, which are jointly controlled entities, whereby the venturers have a contractual
arrangement that establishes joint control over the economic activities of the entity. The arrangement requires unanimous
agreement for financial and operating decisions among the venturers.
The Group’s interest in jointly controlled entities is classified as investments in joint ventures and accounted for using the
equity method. Under the equity method, the investment in joint ventures is at cost plus post acquisition changes in the
Group’s share of net assets of the joint ventures on the Consolidated Statement of Financial Position. Goodwill relating to
the joint ventures is included in the carrying amount of the investment and is not amortised or separately tested for
impairment. The Consolidated Statement of Comprehensive Income reflects the Group’s share of the results of
operations of the jointly controlled entity. The Group’s share of profit or loss of a jointly controlled entity is shown on the
face of the Consolidated Statement of Comprehensive Income and represents profit or loss after tax and non-controlling
interests in the subsidiaries of the jointly controlled entities. When there has been a change recognised directly in the
equity of the jointly controlled entity, the Group recognises its share of any changes, when applicable, in the Consolidated
Statement of Other Comprehensive Income. Where the Group transacts with a jointly controlled entity, unrealised profits
or losses are eliminated to the extent of the Group’s interest in the joint ventures. Losses on transactions are recognised
immediately if there is evidence of a reduction in the net realisable value of current assets or an impairment loss.
The reporting period for jointly controlled entities is the same as the Group’s. Where necessary, adjustments are made to
bring the accounting policies in line with those of the Group.
The investment in joint ventures are considered for impairment on an annual basis. At each reporting date, the Group
determines whether there is objective evidence that the investment in the joint ventures is impaired. If there is such
evidence, the Group calculates the amount of impairment as the difference between the recoverable amount of the joint
venture and its carrying value, then recognises the loss in the Consolidated Statement of Comprehensive Income.
The joint venture is equity accounted until the date on which the Group ceases to have joint control over the joint venture.
Upon loss of joint control, the Group measures and recognises its remaining investment at its fair value. The difference
between the carrying amount of the investment upon loss of joint control and the fair value of the remaining investment
and proceeds from disposal is recognised in profit or loss.
1.9 Intangible assets
Intangible assets comprise separately identifiable intangible items arising from business combinations and certain
purchased intangibles. Intangible assets acquired separately are initially measured at cost. The cost of intangible assets
acquired in a business combination are measured at their fair value as at the date of acquisition. Following initial
recognition, intangible assets are carried at cost less any accumulated amortisation and accumulated impairment losses.
Internally generated intangible assets, excluding capitalised development costs, are not capitalised and expenditure is
reflected in profit or loss in the year in which the expenditure is incurred.
The useful lives of intangible assets are assessed as either finite or indefinite.
Intangible assets with finite lives are amortised using the straight-line method over their estimated useful economic life
and assessed for impairment whenever there is an indication that the intangible asset may be impaired. The amortisation
period and the amortisation method for an intangible asset with a finite useful life is reviewed at least at the end of each
reporting period. Changes in the expected useful life or the expected pattern of consumption of future economic benefits
embodied in the asset is accounted for by changing the amortisation period or method, as appropriate, and are treated as
changes in accounting estimates. The amortisation expense on intangible assets with finite lives is recognised in profit or
loss in the expense category consistent with the function of the intangible assets.
Intangible assets with indefinite useful lives are not amortised, but are tested for impairment annually, either individually or
at the cash-generating unit level. The assessment of the indefinite life is reviewed annually to determine whether the
indefinite life basis continues to be supportable. If not, the change in useful life from indefinite to finite is made on a
prospective basis.

43
Notes to the Consolidated Financial Statements of Edcon Holdings Limited (continued) 1. SIGNIFICANT ACCOUNTING POLICIES AND BASIS OF PREPARATION (continued)
1.9 Intangible assets (continued)
The Group’s intangible assets and their associated useful lives are as follows:
Estimated
useful life
Edgars brand Indefinite
Jet brand Indefinite
CNA brand Indefinite
Boardmans brand Indefinite
Red Square brand 10 years
Legit brand 10 years
Customer relationships 5 – 10 years
Trademarks 5 – 15 years
Customer lists 5 – 10 years
Technology 7 years
Intangible assets are derecognised on disposal or when no future economic benefits are expected through use of the
intangible asset. Gains or losses arising from derecognition of an intangible asset are measured as the difference
between the net disposal proceeds and the carrying amount of the intangible asset and are recognised in profit or loss
when the intangible asset is derecognised. Expenditure on internally developed and maintained intangible assets are
expensed through profit or loss. Expenditure incurred to maintain brand names is charged in full to profit or loss as
incurred.
1.10 Financial instruments
The Group recognises financial instruments on the statement of financial position when the Group becomes party to the
contractual provisions of the instruments.
1.10.1 Financial assets
Initial recognition and measurement
Financial assets within the scope of IAS 39 are classified as financial assets at fair value through profit or loss, loans and
receivables, held-to-maturity investments, available-for-sale financial assets, or as derivatives designated as hedging
instruments in an effective hedge, as appropriate. The Group determines the classification of its financial assets at initial
recognition. Financial assets are initially recognised at fair value, including transaction costs except those at fair value
directly through profit or loss, when the Group becomes a party to contractual arrangements.
Purchases or sales of financial assets that require delivery of assets within a time frame established by regulation or
convention in the market place (regular way trades) are recognised on the trade date, i.e., the date that the Group
commits to purchase or sell the asset.
The Group’s financial assets includes trade and other receivables, derivatives and cash and cash equivalents which are
classified as either loans and receivables or as derivatives at fair value through profit or loss or derivatives designated as
hedging instruments in an effective hedge as appropriate.
Subsequent measurement
The subsequent measurement of financial assets depends on their classification as described below:
Financial assets at fair value through profit or loss
Financial assets at fair value through profit or loss include financial assets held for trading and financial assets designated
upon initial recognition at fair value through profit or loss. Financial assets are classified as held for trading if they are
acquired for the purpose of selling or repurchasing in the near term. Derivatives, including separated embedded
derivatives are also classified as held for trading unless they are designated as effective hedging instruments as defined
by IAS 39. The Group does not undertake any trading activity in financial assets.

44
Notes to the Consolidated Financial Statements of Edcon Holdings Limited (continued) 1. SIGNIFICANT ACCOUNTING POLICIES AND BASIS OF PREPARATION (continued)
1.10 Financial instruments (continued)
1.10.1 Financial assets (continued)
Financial assets at fair value through profit or loss (continued)
The Group does not have any financial assets, other than derivative financial instruments, designated at fair value
through profit or loss. Derivatives are discussed in note 1.10.4.
Financial assets designated upon initial recognition at fair value through profit or loss are designated at their initial
recognition date and only if the criteria under IAS 39 are satisfied.
Financial assets designated at fair value through profit or loss upon initial recognition cannot be reclassified after initial
recognition.
Derivatives embedded in host contracts are accounted for as separate derivatives and recorded at fair value if their
economic characteristics and risks are not closely related to those of the host contracts and the host contracts are not
held for trading or designated at fair value though profit or loss. These embedded derivatives are measured at fair value
with changes in fair value recognised in profit or loss. Reassessment only occurs if there is a change in the terms of the
contract that significantly modifies the cash flows that would otherwise be required.
Any gains and losses realized are recognized in profit or loss.
Loans and receivables
Loans and receivables are non-derivative financial assets with fixed or determinable payments that are not quoted in an
active market, not classified as held-for-trading, not designated as at fair value through profit or loss or available-for-sale.
Financial assets classified as loans and receivables include originated loans where funding is provided directly to the
borrower. Loans and receivables are recognized when the Group becomes a party to the contractual provisions of the
instrument, which is when funding is advanced to borrowers. After initial measurement, such financial assets are
subsequently measured at amortised cost using the effective interest rate method, less impairment. Effective interest rate
is the rate that exactly discounts the estimated future cash payments or receipts over the expected life of the financial
instrument or a shorter period, where appropriate, to the net carrying amount of the financial asset or liability. Amortised
cost is calculated by taking into account any discount or premium on acquisition and fees or costs that are an integral part
of the effective interest rate. The effective interest rate amortisation is included in other income in the Consolidated
Statement of Comprehensive Income. The losses arising from impairment are recognised in the Consolidated Statement
of Comprehensive Income in other operating expenses for trade receivables.
Cash and cash equivalents
Cash and cash equivalents are measured at amortised cost and comprise cash on hand and demand deposits together
with any highly liquid investments readily convertible to known amounts of cash.
Held-to-maturity investments
Non-derivative financial assets with fixed or determinable payments and fixed maturities are classified as held-to-maturity
when the Group has the positive intention and ability to hold them to maturity. After initial measurement, held-to-maturity
investments are measured at amortised cost using the effective interest rate, less impairment. Amortised cost is
calculated by taking into account any discount or premium on acquisition and fees or costs that are an integral part of the
effective interest rate. The Group did not have any held-to-maturity investments for the 2013, 2012 and 2011 financial
periods.
Available-for-sale financial investments
Investments classified as available-for-sale are those that are neither classified as held-for-trading nor designated at fair
value through profit or loss. After initial measurement, available-for-sale financial investments are subsequently measured
at fair value with unrealised gains or losses recognised as other comprehensive income until the investment is
derecognised, at which time the cumulative gain or loss is recognised in other operating income, or the investment is
determined to be impaired, when the cumulative loss is reclassified from other comprehensive income to the statement of
comprehensive income.
The Group did not have any available-for-sale investments for the 2013, 2012 and 2011 financial periods.

45
Notes to the Consolidated Financial Statements of Edcon Holdings Limited (continued) 1. SIGNIFICANT ACCOUNTING POLICIES AND BASIS OF PREPARATION (continued)
1.10 Financial instruments (continued)
1.10.1 Financial assets (continued)
Derecognition
A financial asset (or, where applicable, a part of a financial asset or part of a group of similar financial assets) is
derecognised when:
The rights to receive cash flows from the asset have expired.
The Group has transferred its rights to receive cash flows from the asset or has assumed an obligation to pay the
received cash flows in full without material delay to a third party under a ‘pass-through’ arrangement; and either (a)
the Group has transferred substantially all the risks and rewards of the asset, or (b) the Group has neither transferred
nor retained substantially all the risks and rewards of the asset, but has transferred control of the asset.
When the Group has transferred its rights to receive cash flows from an asset or has entered into a pass-through
arrangement, it evaluates if and to what extent it has retained the risks and rewards of ownership. When it has neither
transferred nor retained substantially all of the risks and rewards of the asset, nor transferred control of the asset, the
asset is recognised to the extent of the Group’s continuing involvement in the asset. In that case, the Group also
recognises an associated liability. The transferred asset and the associated liability are measured on a basis that reflects
the rights and obligations that the Group has retained.
Continuing involvement that takes the form of a guarantee over the transferred asset is measured at the lower of the
original carrying amount of the asset and the maximum amount of consideration that the Group could be required to
repay.
Impairment of financial assets
The Group assesses, at each reporting date, whether there is objective evidence that a financial asset or a group of
financial assets is impaired. A financial asset or a group of financial assets is deemed to be impaired if there is objective
evidence of impairment as a result of one or more events that has occurred since the initial recognition of the asset (an
incurred ‘loss event’) and that loss event has an impact on the estimated future cash flows of the financial asset or the
group of financial assets that can be reliably estimated.
Financial assets carried at amortised cost
For financial assets carried at amortised cost, the Group first assesses whether objective evidence of impairment exists
individually for financial assets that are individually significant, or collectively for financial assets that are not individually
significant. If the Group determines that no objective evidence of impairment exists for an individually assessed financial
asset, whether significant or not, it includes the asset in a group of financial assets with similar credit risk characterist ics
and collectively assesses them for impairment. Assets that are individually assessed for impairment and for which an
impairment loss is, or continues to be, recognised are not included in a collective assessment of impairment.
If there is objective evidence that an impairment loss has been incurred, the amount of the loss is measured as the
difference between the asset’s carrying amount and the present value of estimated future cash flows (excluding future
expected credit losses that have not yet been incurred). The present value of the estimated future cash flows is
discounted at the financial asset’s original effective interest rate.
The carrying amount of the asset is reduced through the use of an allowance account and the loss is recognized in profit
or loss. If, in a subsequent period, the amount of the estimated impairment loss increases or decreases because of an
event occurring after the impairment was recognised, the previously recognised impairment loss is increased or reduced
by adjusting the allowance account; to the extent the carrying value of the receivable does not exceed its cost at any
reversal date.
If a write-off is later recovered, the recovery is credited to other income in the statement of comprehensive income.
For trade receivables, evidence of impairment may include indications that the debtors or a group of debtors is
experiencing significant financial difficulty, default or delinquency in interest or principal payments, the probability that they
will enter bankruptcy or other financial reorganisation and observable data indicating that there is a measurable decrease
in the estimated future cash flows, such as changes in arrears or economic conditions that correlate with defaults. A

46
Notes to the Consolidated Financial Statements of Edcon Holdings Limited (continued) 1. SIGNIFICANT ACCOUNTING POLICIES AND BASIS OF PREPARATION (continued)
1.10 Financial instruments (continued)
1.10.1 Financial assets (continued)
Financial assets carried at amortised cost (continued)
provision for impairment is made when there is objective evidence that the Group will not be able to collect all amounts
due under the original terms of the trade receivable transactions. Delinquent accounts are impaired by applying the
Group’s impairment policy recognising both contractual and ages of accounts. Age refers to the number of months since a
qualifying payment was received. The process for estimating impairment considers all credit exposures, not only those of
low credit quality and is estimated on the basis of historical loss experience, adjusted on the basis of current observable
data, to reflect the effects of current conditions.
1.10.2 Financial liabilities
Initial recognition and measurement
Financial liabilities within the scope of IAS 39 are classified as financial liabilities at fair value through profit or loss, loans
and borrowings, or as derivatives designated as hedging instruments in an effective hedge, as appropriate. The Group
determines the classification of its financial liabilities at initial recognition. All financial liabilities are recognised initially at
fair value and, in the case of loans and borrowings, net of directly attributable transaction costs.
The Group’s financial liabilities include trade and other payables, loans and borrowings, deferred option premium and
derivative financial instruments and are classified as either loans and borrowings and derivatives at fair value through
profit or loss or derivatives designated as hedging instruments in an effective hedge, as appropriate.
Subsequent measurement
The measurement of financial liabilities depends on their classification as described below:
Financial liabilities at fair value through profit or loss
Financial liabilities at fair value through profit or loss include financial liabilities held-for-trading and financial liabilities
designated upon initial recognition as at fair value through profit or loss.
Financial liabilities are classified as held-for-trading if they are acquired for the purpose of selling in the near term. The
Group has not designated any financial liabilities as held for trading in the 2013, 2012 and 2011 financial period.
This category includes derivative financial instruments entered into by the Group that are not designated as hedging
instruments in hedge relationships as defined by IAS 39. Separated embedded derivatives are also classified as held-for-
trading unless they are designated as effective hedging instruments.
Financial liabilities designated upon initial recognition at fair value through profit or loss are designated at the initial date of
recognition, and only if the criteria in IAS 39 are satisfied.
Any gains and losses realized are recognized in profit or loss.
Loans and borrowings
After initial recognition, interest-bearing loans and borrowings are subsequently measured at amortised cost using the
effective interest rate method.
Amortised cost is calculated by taking into account any discount or premium on acquisition and fees or costs that are an
integral part of the effective interest rate. The effective interest rate amortisation is included as finance costs in the
statement of comprehensive income.
Derecognition
A financial liability is derecognised when the obligation under the liability is discharged, cancelled or has expired. When
an existing financial liability is replaced by another from the same lender on substantially different terms, or the terms of
an existing liability are substantially modified, such an exchange or modification is treated as the extinguishment of the

47
Notes to the Consolidated Financial Statements of Edcon Holdings Limited (continued) 1. SIGNIFICANT ACCOUNTING POLICIES AND BASIS OF PREPARATION (continued)
1.10 Financial instruments (continued)
1.10.2 Financial liabilities (continued)
Derecognition (continued)
original liability or part of it and the recognition of a new financial liability. The difference in the respective carrying
amounts is recognised in profit or loss.
1.10.3 Offsetting of financial instruments
Financial assets and financial liabilities are offset and the net amount is reported in the statement of financial position if
there is a currently enforceable legal right to offset the recognised amounts and there is an intention to settle on a net
basis, to realise the assets and settle the liabilities simultaneously.
1.10.4 Derivative financial instruments and hedge accounting
The Group uses derivative financial instruments such as foreign currency forward contracts, foreign currency call options,
cross currency swaps and interest rate swaps to manage the financial risks associated with their underlying business
activities and the financing of those activities. The Group does not undertake any trading activity in derivative financial
instruments.
Derivative financial instruments are initially measured at their fair value on the date on which a derivative portfolio contract
is entered into and are subsequently remeasured at fair value. Any gains or losses arising from changes in the fair value
of derivatives are taken directly to profit or loss, except for the effective portion of cash flow hedges, which is recognised
in other comprehensive income.
The fair value of foreign currency forward contracts, foreign currency call options and the cross currency swaps is
calculated by reference to current forward exchange rates for contracts with similar maturity profiles. The fair value of
interest rate swap contracts is determined by reference to market interest rates for similar instruments. The fair value of
cross currency swaps is determined by reference to market interest rates and forward exchange rates for similar
instruments. A credit risk valuation adjustment is incorporated to appropriately reflect the Group’s own non performance
risk and the respective counterparty’s non-performance risk in the fair value measurement. The significant inputs to the
overall valuations are based on market observable data or information derived from or corroborated by market observable
data, including transactions, broker or dealer quotations, or alternative pricing sources with reasonable levels of price
transparency.
Where models are used, the selection of a particular model to value the derivative depends upon the contractual terms of,
and specific risks inherent in the instrument as well as the availability of pricing information in the market. The Group uses
similar models to value similar instruments. Valuation models require a variety of inputs including contractual terms,
market prices, yield curves and credit curves.
The credit risk valuation adjustments are calculated by determining the net exposure of each derivative portfolio (including
current and potential future exposure) and then applying the Group’s credit spread, and each counterparty’s credit spread
to the applicable exposure.
The inputs utilised for the Group’s own credit spread are based on estimated fair market spreads for entities with similar
credit ratings as the Group. For counterparties with publicly available credit information, the credit spreads over the
benchmark rate used in the calculations represent implied credit default swap spreads obtained from a third party credit
provider.
In adjusting the fair value of derivative contracts for the effect of non-performance risk, the Group has not considered the
impact of netting and any applicable credit enhancements such as collateral postings, thresholds, mutual puts and
guarantees. The Group actively monitors counterparty credit ratings for any significant changes.
For the purpose of hedge accounting, hedges are classified as:
Fair value hedges when hedging the exposure to changes in the fair value of a recognised asset or liability or an
unrecognised firm commitment;

48
Notes to the Consolidated Financial Statements of Edcon Holdings Limited (continued) 1. SIGNIFICANT ACCOUNTING POLICIES AND BASIS OF PREPARATION (continued)
1.10 Financial instruments (continued)
1.10.4 Derivative financial instruments and hedge accounting (continued)
Cash flow hedges when hedging the exposure to variability in cash flows that is either attributable to a particular risk
associated with a recognised asset or liability or a highly probable forecast transaction or the foreign currency risk in
an unrecognised firm commitment; and
Hedges of a net investment in a foreign operation
The Group does not have any fair value or net investment in a foreign operation hedges.
At the inception of a hedge relationship, the Group formally designates and documents the hedge relationship to which
the Group wishes to apply hedge accounting and the risk management objective and strategy for undertaking the hedge.
The documentation includes identification of the hedging instrument, the hedged item or transaction, the nature of the risk
being hedged and how the entity will assess the effectiveness of changes in the hedging instrument’s fair value in
offsetting the exposure to changes in the hedged item’s fair value or cash flows attributable to the hedged risk. Such
hedges are expected to be highly effective in achieving offsetting changes in fair value or cash flows and are assessed on
an ongoing basis to determine that they actually have been highly effective throughout the financial reporting periods for
which they were designated.
In relation to cash flow hedges which meet the conditions for hedge accounting, the portion of the gain or loss on the
hedging instrument that is determined to be an effective hedge is recognised in other comprehensive income in the cash
flow hedging reserve and the ineffective portion is recognised in profit or loss.
For cash flow hedges, the gains or losses that are recognised in other comprehensive income are transferred to profit or
loss in the same period in which the hedged item affects the profit or loss.
Hedge accounting is discontinued when the hedging instrument expires or is sold, terminated or exercised, or no longer
qualifies for hedge accounting. At that point in time, any cumulative gain or loss on the hedging instrument recognised in
other comprehensive income is kept in other comprehensive income until the forecasted transaction occurs. If a hedged
transaction is no longer expected to occur, the net cumulative gain or loss recognised in other comprehensive income is
transferred to profit or loss for the period.
Current versus non-current classification
Derivative instruments are classified as current or non-current or separated into current and non-current portions based
on an assessment of the facts and circumstances (i.e., the underlying contracted cash flows).
When the Group expects to hold a derivative as an economic hedge (and does not apply hedge accounting) for a period
beyond 12 months after the reporting date, the derivative is classified as non-current (or separated into current and non-
current portions) consistent with the classification of the underlying item.
Embedded derivatives that are not closely related to the host contract are classified consistent with the cash flows of the
host contract.
Derivative instruments that are designated as, and are effective hedging instruments, are classified consistently with the
classification of the underlying hedged item. The derivative instrument is separated into a current portion and a non-
current portion only if a reliable allocation can be made.
1.11 Inventories
Retail trading inventories are valued at the lower of cost, using the weighted average cost, and net realisable value, less
an allowance for slow-moving items. Net realisable value is the estimated selling price in the ordinary course of business
less necessary costs to make the sale. In the case of own manufactured inventories, cost includes the total cost of
manufacture, based on normal production facility capacity, and excludes financing costs. Work-in-progress is valued at
actual cost, including direct material costs, labour costs and manufacturing overheads.
Factory raw materials and consumable stores are valued at average cost, less an allowance for slow-moving items.

49
Notes to the Consolidated Financial Statements of Edcon Holdings Limited (continued) 1. SIGNIFICANT ACCOUNTING POLICIES AND BASIS OF PREPARATION (continued)
1.11 Inventories (continued)
The allowance for slow-moving inventory is made with reference to an inventory age analysis. All inventory older than 18
months is provided for in full as it is not deemed to be readily disposable.
1.12 Leases
The determination of whether an arrangement is a lease, or contains a lease, is based on the substance of the
arrangement at inception date and whether the fulfilment of the arrangement is dependent on the use of a specific asset
or assets or the arrangement conveys a right to use the asset, even if that right is not explicitly specified in an
arrangement.
Group as a lessee
Leases are classified as finance leases where substantially all the risks and rewards associated with ownership of an
asset are transferred from the lessor to the Group as lessee. Assets subject to finance leases are capitalised at the lower
of the fair value of the asset, and the present value of the minimum lease payments, with the related lease obligation
recognised at the same value. Capitalised leased assets are depreciated over the shorter of the lease term and the
estimated useful life if the Group does not obtain ownership thereof.
Finance lease payments are allocated, using the effective interest rate method, between the lease finance cost, which is
included in financing costs, and the capital repayment, which reduces the liability to the lessor.
Operating leases are those leases which do not fall within the scope of the above definition. Operating lease rentals with
fixed escalation clauses are charged against trading profit on a straight-line basis over the term of the lease.
In the event of a sub-lease classified as an operating lease, lease rentals received are included in profit or loss on a
straight-line basis.
Group as a lessor
Leases in which the Group does not transfer substantially all the risks and rewards of ownership of an asset are classified
as operating leases. Initial direct costs incurred in negotiating an operating lease are added to the carrying amount of the
leased asset and recognised over the lease term on the same basis as rental income. Contingent rentals are recognised
as revenue in the period in which they are earned.
1.13 Properties, fixtures, equipment and vehicles
1.13.1 Fixtures, equipment and vehicles
Fixtures, equipment and vehicles are stated at cost, net of accumulated depreciation and accumulated impairment losses,
if any. Such cost includes the cost of replacing part of the fixtures, equipment and vehicles and borrowing costs for long-
term construction projects if the recognition criteria are met. When significant parts of property, plant and equipment are
required to be replaced at intervals, the Group recognises such parts as individual assets with specific useful lives and
depreciates them accordingly. Likewise, when a major inspection is performed, its cost is recognised in the carrying
amount of the plant and equipment as a replacement if the recognition criteria are satisfied. All other repair and
maintenance costs are recognised in profit or loss as incurred.
1.13.2 Properties (Land and buildings)
Land is initially measured at cost and subsequently revalued by recognised professional valuers, to net realisable open-
market value using the alternative or existing-use basis as appropriate, ensuring carrying amounts do not differ materially
from those which would be determined using fair value at the reporting date. Buildings are also measured at fair value (as
per above) less accumulated depreciation and impairment losses at the date of revaluation. Land and buildings were
valued by reference to market-based evidence, using comparable prices adjusted for specific market factors such as
nature , location and condition of the property.
Any revaluation surplus is recorded in other comprehensive income and hence, credited to the revaluation surplus
reserve in equity, except to the extent that it reverses a revaluation decrease of the same asset previously recognised in
profit or loss, in which case, the increase is recognised in profit or loss. A revaluation deficit is recognised in profit or loss,
except to the extent that it offsets an existing surplus on the same asset recognised in the asset revaluation reserve.

50
Notes to the Consolidated Financial Statements of Edcon Holdings Limited (continued) 1. SIGNIFICANT ACCOUNTING POLICIES AND BASIS OF PREPARATION (continued)
1.13 Properties, fixtures, equipment and vehicles (continued)
1.13.2 Properties (Land and buildings) (continued)
The amount in the revaluation surplus reserve is transferred to retained earnings/loss upon disposal of a particular asset.
Additionally, accumulated depreciation, for buildings, as at the revaluation date is eliminated against the gross carrying
amount of the asset and the net amount is restated to the revalued amount of the asset.
1.13.3 Lease premiums and leasehold improvements
Expenditure relating to leased premises is capitalised as appropriate and depreciated to expected residual value over the
remaining period of the lease on a straight-line basis.
Leasehold improvements for leasehold land and buildings are depreciated over the lease periods which range from 5 to
10 years, or such shorter periods as may be appropriate.
1.13.4 Depreciation rates
Fixtures, equipment and vehicles are depreciated on a straight-line basis to their expected residual values over the
estimated useful lives as follows:
Fixtures and fittings 7 – 8 years
Leased assets 5 – 50 years
Computer equipment 3 – 5 years
Computer software 2 – 3 years
Machinery 9 – 10 years
Vehicles 4 – 5 years
Buildings 48 – 50 years
1.13.5 Impairment of properties, fixtures, equipment and vehicles
Property, fixtures, equipment and vehicles are reviewed at each reporting date, to determine whether there is any
indication of impairment. When impairment indicators are present, the impairment recognised in the profit or loss (or other
comprehensive income for revalued property limited to the extent of the revaluation surplus) is the excess of the carrying
value over the recoverable amount (the greater of fair value less costs to sell and value in use).
Recoverable amounts are estimated for individual assets or, when an individual asset does not generate cash flows
independently, the recoverable amount is determined for the larger cash-generating unit to which the asset belongs.
A previously recognised impairment will be reversed in so far as estimates change as a result of an event occurring after
the impairment was recognised. This assessment is made at each reporting date. An impairment is reversed only to the
extent that the asset’s carrying amount does not exceed the carrying amount that would have been determined had no
impairment been recognised. A reversal of impairment is recognised in profit or loss.
1.13.6 Derecognition of properties, fixtures, equipment and vehicles
An item of property, fixtures, equipment and vehicles is derecognised on disposal or when no future economic benefits
are expected through its continued use. Gains or losses which arise on derecognition, are included in profit or loss in the
year of derecognition. The gain or loss is calculated as the difference between the net disposal proceeds and the carrying
amount of the property, fixtures, equipment or vehicles at the date of sale.
1.13.7. Asset lives and residual values
Buildings, fixtures, equipment and vehicles are depreciated over their useful life taking into account any residual values
where appropriate. The estimated useful life of these assets and depreciation methods are assessed at each reporting
date and could vary as a result of technological innovations and maintenance programs. In addition, residual values are
reviewed at each reporting date after considering future market conditions, the remaining life of the asset and projected
disposal values. Changes in asset lives and residual values are accounted for on a prospective basis as a change in
estimate.

51
Notes to the Consolidated Financial Statements of Edcon Holdings Limited (continued) 1. SIGNIFICANT ACCOUNTING POLICIES AND BASIS OF PREPARATION (continued)
1.13 Properties, fixtures, equipment and vehicles (continued)
1.13.8. Software costs
Packaged software and the direct costs associated with the development and installation thereof are capitalised as
computer software and are an integral part of computer hardware. The total cost is capitalised and depreciated in
accordance with note 1.13.1. and 1.13.4.
1.14 Non-current assets held–for-sale and discontinued operations
Non-current assets (or a disposal group) are classified as held for sale if the carrying amount will be recovered through a
highly probable sale transaction, rather than through continuing use. The sale is considered to be highly probable where
the assets (or a disposal group) are available for immediate sale, management is committed to the sale and the sale is
expected to be completed within a period of one year from the date of classification. Assets classified as held for sale are
measured at the lower of the asset’s carrying amount and fair value less costs to sell.
Where the sale is more than one year into the future due to circumstances beyond the Group’s control, the costs to sell
are measured at the present value. Any increase in the present value of costs to sell are recognised in the Group
statement of comprehensive income as a financing cost.
An impairment loss is recognised in profit or loss for any initial or subsequent write-down of the asset or disposal group to
fair value less costs to sell. A gain, for any subsequent increase in fair value less costs to sell, is recognised in profit or
loss to the extent that it does not exceed the cumulative impairment loss previously recognised.
Non-current assets classified as held for sale are not depreciated or amortised.
Where a component of the Group, being either a separate major line of business, a geographical area of operations or a
subsidiary is acquired exclusively with a view to resell and management is committed to the sale and it is expected to be
completed within a period of one year or has been sold, that component is classified as a discontinued operation.
Discontinued operations are excluded from the results of continuing operations and are presented as a single amount as
profit or loss after tax from discontinued operations in the statement of comprehensive income.
1.15 Taxation
Current income tax
Current income tax assets and liabilities for the current period are measured at the amount expected to be recovered from
or paid to the taxation authorities. The tax rates and tax laws used to compute the amount are those that are enacted or
substantively enacted, at the reporting date in the countries where the Group operates and generates taxable income.
Current income tax relating to items recognised directly in other comprehensive income or equity is recognised in other
comprehensive income or equity and not in profit or loss. Management periodically evaluates positions taken in the tax
returns with respect to situations in which applicable tax regulations are subject to interpretation and establishes
provisions where appropriate.
Uncertainties exist with respect to the interpretation of complex tax regulations, changes in tax laws, and the amount and
timing of future taxable income. Given the wide range of international business relationships and the long-term nature and
complexity of existing contractual agreements, differences arising between the actual results and the assumptions made,
or future changes to such assumptions, could necessitate future adjustments to tax income and expense already
recorded. The Group establishes provisions, based on reasonable estimates, for possible consequences of audits by the
tax authorities of the respective counties in which it operates. The amount of such provisions is based on various factors,
such as experience of previous tax audits and differing interpretations of tax regulations by the taxable entity and the
responsible tax authority. Such differences of interpretation may arise on a wide variety of issues depending on the
conditions prevailing in the respective domicile of the Group companies.
Deferred tax
Deferred tax is provided using the liability method on temporary differences at the reporting date between the tax base of
the assets and liabilities and their carrying amounts for financial reporting purposes.
Deferred tax liabilities are recognised for all taxable deductible differences, except:

52
Notes to the Consolidated Financial Statements of Edcon Holdings Limited (continued) 1. SIGNIFICANT ACCOUNTING POLICIES AND BASIS OF PREPARATION (continued)
1.15 Taxation (continued)
Deferred tax (continued)
When the deferred tax liability arises from the initial recognition of goodwill or an asset or liability in a transaction that
is not a business combination and, at the time of the transaction, affects neither the accounting profit nor taxable
profit or loss;
In respect of taxable temporary differences associated with investments in subsidiaries, associates and interests in
joint ventures, when the timing of the reversal of the temporary differences can be controlled and it is probable that
the temporary differences will not reverse in the foreseeable future
Deferred tax assets are recognised for all temporary differences, carry forward of unused tax credits and unused tax
losses, which will result in deductible amounts in future periods, but only to the extent that it is probable that sufficient
taxable profits will be available against which these deductible temporary differences, and carry forward of unused tax
credits and unused tax losses can be utilised, except:
When the deferred tax asset relating to the deductible temporary difference arises from the initial recognition of an
asset or liability in a transaction that is not a business combination and, at the time of the transaction, affects neither
the accounting profit nor taxable profit or loss;
In respect of deductible temporary differences associated with investments in subsidiaries, associates and interests
in joint ventures, deferred tax assets are recognised only to the extent that it is probable that the temporary
differences will reverse in the foreseeable future and taxable profit will be available against which the temporary
differences can be utilized
Significant management judgement is required to determine the amount of deferred tax assets that can be recognised,
based upon the likely timing and the level of future taxable profits together with future tax planning strategies.
The carrying amount of deferred income tax assets is reviewed at each reporting date and reduced to the extent that it is
no longer probable that sufficient taxable profit will be available to allow all or part of the deferred income tax asset to be
utilised. Unrecognised deferred income tax assets are reassessed at each reporting date and are recognised to the extent
that it has become probable that future taxable profit will allow the deferred tax asset to be recovered.
Deferred tax assets and liabilities are measured at the tax rates that are expected to apply in the period in which the asset
will be realised or the liability will be settled, based on enacted or substantively enacted rates at the reporting date.
Deferred tax relating to items recognised outside profit or loss is recognised outside profit or loss. Deferred tax items are
recognised in correlation to the underlying transaction either in other comprehensive income or directly in equity.
Current and deferred tax assets and liabilities are offset when they arise from the same tax reporting entity, and relate to
the same tax authority, and when the legal right to offset exists. Where applicable, non-resident shareholders’ taxation is
provided for in respect of foreign dividends receivable.
Tax benefits acquired as part of a business combination, but not satisfying the criteria for separate recognition at that
date, are recognised subsequently if new information about facts and circumstances change. The adjustment is either
treated as a reduction to goodwill (as long as it does not exceed goodwill) if it was incurred during the measurement
period or recognised in profit or loss.
Refer to note 8 and 32 for further details around current and deferred tax.
1.16 Financing costs
Finance costs comprises interest paid and payable on borrowings, calculated using the effective interest rate method, and
foreign currency gains and losses in respect of borrowings. Financing costs are recognised in profit or loss in the period in
which they are incurred.
1.17 Revenue recognition
Revenue is recognised to the extent that it is probable that the economic benefits will flow to the Group and the revenue
can be reliably measured, regardless of when payment is made. Revenue is measured at the fair value of the
53
Notes to the Consolidated Financial Statements of Edcon Holdings Limited (continued) 1. SIGNIFICANT ACCOUNTING POLICIES AND BASIS OF PREPARATION (continued)
1.17 Revenue recognition (continued)
consideration received net of returns and customer loyalty points excluding discounts, rebates and sales taxes or duty.
The Group assesses its revenue arrangements against specific criteria to determine if it is acting as principal or agent.
Revenue comprises retail sales of merchandise, manufacturing sales, club fees, revenue from joint ventures, dividends,
finance charges and administration fees accrued to the Group.
The specific recognition criteria described below must also be met before revenue is recognised.
Sales of merchandise
Revenue from sale of merchandise is recognised when the significant risks and rewards of ownership of the goods have
passed to the buyer, usually on delivery of goods. Such income represents the net invoice value of merchandise provided
to such third parties – excluding discounts, value-added and general sales tax. The Group chains that contribute to the
revenue from sale of merchandise are the Edgars division, CNA division and the Discount division.
Loyalty points program
The Group operates a loyalty points program that allows customers to accumulate points when they purchase
merchandise, subject to certain criteria, in the Group’s retail stores. The points can then be redeemed as discount against
merchandise purchases. The fair value which includes the expected redemption rate, attributed to the credits awarded, is
deferred as a provision and recognised as revenue on redemption of the points by customers.
Manufacturing sales
Revenue from manufacturing and other operations is recognised when the sale transactions giving rise to such revenue
are concluded.
Club fees
Club fees are recognised as revenue as incurred.
Finance charges
Finance charges on arrear account balances are accrued on a time proportion basis, recognising the effective yield on the
underlying assets.
Revenue from joint ventures
Group customers are offered Edgars and Jet branded insurance products, in pursuance of a joint venture formed with
Hollard Insurance (Hollard). Hollard underwrites all insurance products and further provides the joint venture with actuarial
and compliance support. The Group provides product distribution, marketing and billing and premium collection
services. The joint venture sells to both credit customers and cash customers. The joint venture is managed by a
dedicated team of people from both Hollard and the Group. The interest in joint ventures is accounted for using the equity
method. Under the provisions of the joint venture agreement, the Group charges the joint venture a fee for the continued
management of the debtors and maintenance of systems. The Group also charges the joint venture a fee for the use of
the Group’s brands in the marketing of the insurance products. This fee income is recognised by the Group as and when
it is accrued.
The profit share is done on a product by product basis with the profit share percentage as agreed between the parties
from time to time.
The Group has a closed book for the Edgars and Jet Legal Plan underwritten by Zurich Insurance Ltd. Europ Assistance
provides risk management and policy fulfillment services. Under the provisions of the joint venture agreement, if the policy
premiums exceed the claims and expenses, the net profit is distributed as a dividend. New business on the Legal Plans is
underwritten by Hollard as from 13 April 2011. Hollard replaced Zurich as the underwriter from the start of the 2011
financial period.
Dividends
Dividends are recognised when the Group’s right to receive payment is established, which is generally when shareholders
approve the dividend.
Interest received
Interest received is recognised using the effective interest rate method.

54
Notes to the Consolidated Financial Statements of Edcon Holdings Limited (continued) 1. SIGNIFICANT ACCOUNTING POLICIES AND BASIS OF PREPARATION (continued)
1.17 Revenue recognition (continued)
Administration fees
Administration fees are recognised as they are accrued based on the services provided.
1.18 Employee benefits
Short-term employee benefits
The cost of all short-term employee benefits is recognised during the period in which the employee renders the related
service. The accruals for employee entitlements to wages, salaries, annual and sick leave represent the amount which
the group has a present obligation to pay as a result of employees’ services provided to the reporting date. The short-term
employee benefits have been calculated at undiscounted amounts based on current wage and salary rates.
Post employment benefits
The Group operates a number of retirement benefit plans for its employees. These plans include both defined benefit and
defined contribution provident funds and other retirement benefits such as medical aid benefit plans.
Defined contribution plans – Provident fund benefits
A defined contribution plan is a post-employment benefit plan under which an entity pays fixed contributions into a
separate entity and will have no legal or constructive obligation to pay further amounts. Obligations for contributions to
defined contribution pension, provident and retirement funds are recognised as an employee benefit expense in profit or
loss when they are due. Prepaid contributions are recognised as an asset to the extent that a cash refund or a reduction
in future payments is available.
Defined benefit plans – Pension and Post-retirement Medical Aid benefits
The Group uses the projected unit credit actuarial method to determine the present value of its defined benefit plans and
the related current service cost and, where applicable, past service costs. Contribution rates to defined benefit plans are
adjusted for any unfavourable experience adjustments. Favorable experience adjustments are retained within the funds.
Net benefit assets are only brought into account in the Group’s Financial Statements when it is certain that economic
benefits will be available to the Group. Actuarial gains or losses are recognised in full the period in which they occur in
other comprehensive income. Such actuarial gains and losses are also immediately recognised in retained earnings and
are not reclassified to profit or loss in subsequent periods.
Unvested past service costs are recognised as an expense on a straight line basis over the average period until the
benefits become vested. Past service costs are recognised immediately if the benefits have already vested immediately
following the introduction of, or changes to, a plan.
The defined benefit asset or liability comprises the present value of the defined benefit obligation, less unrecognised past
service costs and less the fair value of any plan assets out of which the obligations are to be settled. Plan assets are
assets that are held by a long-term employee benefit fund or qualifying insurance policies. Plan assets are not available to
the creditors of the Group, nor can they be paid directly to the Group. Fair value is based on market price information and,
in the case of quoted securities, it is the published bid price. The value of any defined benefit asset recognised is
restricted to the sum of any unrecognised past service costs and the present value of any economic benefits available in
the form of refunds from the plan or reductions in the future contributions to the plan.
1.19 Share capitalisation awards and cash dividends
The full cash equivalent of capitalisation share awards and cash dividends paid by the Group are recorded and disclosed
as dividends declared in the statement of changes in equity. Dividends declared subsequent to the period-end are not
charged against shareholders’ equity at the reporting date as no liability exists. Upon allotment of shares in terms of a
capitalisation award, the election amounts are transferred to the share capital and share premium account; cash dividend
election amounts are paid and the amount deducted from equity.
1.20 Treasury shares
Shares held by the Staff Empowerment Trust are classified in the Group’s shareholders’ equity as treasury shares. These
shares are treated as a deduction from the issued number of shares, and the cost price of the shares is deducted from
share capital and premium, in the Group statement of financial position. Any dividends received on treasury shares are
eliminated on consolidation.

55
Notes to the Consolidated Financial Statements of Edcon Holdings Limited (continued) 1. SIGNIFICANT ACCOUNTING POLICIES AND BASIS OF PREPARATION (continued)
1.21 Operating Segment Report
The Group is organised into business units based on their target markets and product offering, and the business is
structured under six reportable operating segments. The segments were selected on the basis of internal reports in order
to allocate resources to the segment and assess its performance. Sales of merchandise in three main operating divisions
gives rise to the Edgars, Discount and CNA division which targets different domains of income, age and products.
Manufacturing Sales gives rise to the Manufacturing division which is an apparel manufacturer, focusing on mid to high-
end garments of mostly woven construction. This operating segment, manufactures ladies and men’s outerwear for the
Edgars and Discount divisions. The Credit and Financial division focuses on the management of the Group’s trade
debtors and administration of trade accounts receivable sold to Absa Limited and offers consumer credit and insurance
products. The Credit and Financial division incorporates revenue from the joint venture between Edcon and Hollard and
administration fees earned on the administration of the Absa Limited trade accounts receivable sold to Absa Limited.
1.22 Provisions
1.22.1 General
Provisions are recognised when the Group has a present obligation (legal or constructive) as a result of a past event, it is
probable that an outflow of resources embodying economic benefits will be required to settle the obligation and a reliable
estimate can be made of the amount of the obligation. The amount recognised as a provision will be reassessed at each
statement of financial position date taking into account the latest estimates of expenditure required and the probability of
the outflows. If the effect of the time value of money is material, provisions are determined by discounting the expected
future cash flows at a pre-tax rate that reflects current market assessments of the time value of money and, where
appropriate, the risks specific to the liability except those that have been taken into account in the estimate of future cash
flows. Where discounting is used, the increase in a provision due to the passage of time is recognised as an interest
expense in profit or loss. A provision is used only for the expenditures for which the provision was originally recognised.
When the Group expects some or all of a provision to be reimbursed, for example, under an insurance contract, the
reimbursement is recognized as a separate asset, but only when the reimbursement is virtually certain. The expense
relating to a provision is presented in the statement of comprehensive income net of any reimbursement.
1.22.2 Loyalty points deferred revenue
The Group operates a loyalty points program which allows customers to accumulate points when they purchase
merchandise, subject to certain criteria, in the Groups retail stores. The points can then be redeemed as discount against
merchandise purchases. The Group accounts for award credits as a separately identifiable component of the sales
transaction in which they are granted. The consideration in respect of the initial sale is allocated to award credits at their
fair value and is accounted for as a provision (deferred revenue) in the statement of financial position.
The fair value of an individual award credit is determined using estimation techniques reflecting the weighted average of a
number of factors. A rolling 12-month historical trend forms the basis of the calculations. The number of points not
expected to be redeemed by members are also factored into the estimation of fair value. Historical redemption trends are
also used to determine the long and short-term portion of the deferred revenue liability. A level of judgement is exercised
by management in determining the fair value of the points (note 24).
1.23 Investments in subsidiaries
Investments in subsidiaries are equity interests which are held for the purposes of Edcon Holdings Limited business
activities or for strategic reasons. They include all directly held subsidiaries through which Edcon Holdings Limited
conducts its business. The investments are carried at cost less impairment. The carrying value is tested for impairment
when indicators for a decrease in value exist, which include incurrence of significant operating losses. If an investment in
a subsidiary is impaired, its value is generally written down to the net asset value. Subsequent recoveries in value are
recognized up to the original cost value based on the increase net asset.

56
Notes to the Consolidated Financial Statements of Edcon Holdings Limited (continued) 1. SIGNIFICANT ACCOUNTING POLICIES AND BASIS OF PREPARATION (continued)
1.24 Changes in Accounting policies and disclosures
1.24.1 New and amended standards and interpretations
The accounting policies adopted are consistent with those of the previous financial period, except for the following new
and amended IFRS standards and IFRIC interpretations effective as of 1 April 2012.
IAS 12 Income Taxes (Amendment) — Deferred Taxes: Recovery of Underlying Assets
IFRS 1 First-time Adoption of International Financial Reporting Standards (Amendment) — Severe Hyperinflation and
Removal of Fixed Dates for First time Adopters
IFRS 7 Financial Instruments – Disclosures (Amendment)
The adoption of the standards or interpretations is described below:
IAS 12 Income Taxes (Amendment) – Deferred Taxes: Recovery of Underlying Assets
The amendment clarified the determination of deferred tax on investment property measured at fair value and introduces
a rebuttable presumption that deferred tax on investment property measured using the fair value model in IAS 40 should
be determined on the basis that its carrying amount will be recovered through sale. It includes the requirement that
deferred tax on non-depreciable assets that are measured using the revaluation model in IAS 16 should always be
measured on a sale basis.
The amendment is effective for annual periods beginning on or after 1 January 2012 and has no effect on the Group’s
financial position, performance or its disclosures.
IFRS 1 First-Time Adoption of International Financial Reporting Standards (Amendment) – Severe Hyperinflation
and Removal of Fixed Dates for First-Time Adopters
The IASB provided guidance on how an entity should resume presenting IFRS financial statements when its functional
currency ceases to be subject to hyperinflation. The amendment is effective for annual periods beginning on or after 1
July 2011.
The amendment had no impact to the Group.
IFRS 7 Financial Instruments - Disclosures (Amendment)
The amendment requires additional disclosure about financial assets that have been transferred but not derecognised to
enable the user of the Group’s financial statements to understand the relationship with those assets that have not been
derecognised and their associated liabilities. In addition, the amendment requires disclosures about the entity’s continuing
involvement in derecognised assets to enable the users to evaluate the nature of, and risks associated with, such
involvement. The amendment is effective for annual periods beginning on or after 1 July 2011.
The Group sold its private label store card portfolio to Absa Bank Limited (“Absa”) on 1 November 2012. All conditions
required for the first closing of the South African trade accounts receivable were satisfied on this date and R8 667 million
of the South African private label store card portfolio was sold to Absa for cash. In terms of the strategic agreement with
Absa, Absa will provide retail credit to Edcon customers, while Edcon continues to be responsible for all customer-facing
activities, including sales and marketing, customer services and collections.
1.25 Future changes in accounting policies
The following standards, amendments to standards and interpretations have been issued but are not yet effective at the
financial period end.
IFRS 9, Financial Instruments
This standard was issued in stages in November 2009, October 2010 and December 2011 and becomes effective for
financial periods beginning on or after 1 January 2015. It sets out the requirements for recognising and measuring
financial assets, including some hybrid contracts. It requires all financial assets to be classified on the basis of an entity’s
business model for managing the financial assets and the contractual cash flow characteristics of the financial asset. The
standard requires all financial assets to initially be measured at fair value plus, in the case of a financial asset not at fair
value through profit or loss, particular transaction costs. Financial assets are subsequently measured at amortised cost or
fair value.

57
Notes to the Consolidated Financial Statements of Edcon Holdings Limited (continued) 1. SIGNIFICANT ACCOUNTING POLICIES AND BASIS OF PREPARATION (continued)
1.25 Future changes in accounting policies (continued)
IFRS 9, Financial Instruments (continued)
For fair value option liabilities, the amount of change in the fair value of a liability that is attributable to changes in credit
risk must be presented in other comprehensive income. The remainder of the change in fair value is presented in profit or
loss, unless presentation of the fair value change in respect of the liability’s credit risk in other comprehensive income
would create or enlarge an accounting mismatch in profit or loss.
All other IAS 39 classification and measurement requirements for financial liabilities have been carried forward into IFRS
9, including the embedded derivative separation rules and the criteria for using the fair value option.
The Group is assessing the expected impact of IFRS 9 and what impact, if any, it could have on the Group’s accounting
for its financial instruments. The Group does not expect these changes to have a material effect on the results of the
financial statements.
IFRS 10, Consolidated financial statements
This standard was issued in May 2011 and becomes effective for financial periods on or after 1 January 2013. The
amendment creates a new, broader definition of control than under IAS 27 Consolidated and Separate Financial
Statements and has resulted in SIC 12 Consolidation – Special Purpose Entities being withdrawn.
IFRS 10 does not change the consolidation process; rather it changes whether an entity is consolidated by revising the
definition of control.
The revised definition of control will require consideration of aspects such as de-facto control, substantive vs. protective
rights, agency relationships, silo accounting and structured entities when evaluating whether or not an entity is controlled
by the investor.
The Group has evaluated the effect of adopting this standard and has determined that Edgars Zimbabwe Limited will be
consolidated on adoption of this standard in the 2014 financial period.
IFRS 10, Consolidated financial statements – amendment effective 1 January 2014
The amendment provides an exception to the consolidation requirement for entities that meet the definition of an
investment entity. The exception to consolidation requires investment entities to account for subsidiaries at fair value
through profit or loss in accordance with IFRS 9, Financial Instruments.
The Group has evaluated the effect of the above amendment and has determined it will have no impact on the financial
statements.
IFRS 11, Joint arrangements
This standard was issued in May 2011 and becomes effective for financial periods on or after 1 January 2013. IFRS 11
replaces IAS 31 Interest in Joint Ventures and SIC 13 Jointly Controlled Entities – Non-monetary Contributions by
Venturers and refers to IFRS 10’s revised definition of ‘control’ when referring to ‘joint control’.
Under IFRS 11 a joint arrangement (previously a ‘joint venture’ under IAS 31) is accounted for as either a:
joint operation – by showing the investor’s interest/ relative interest in the assets, liabilities, revenues and expenses of
the joint arrangement; or
joint venture – by applying the equity accounting method. Proportionate consolidation is no longer permitted.
Under IFRS 11 the structure of the joint arrangement is not the only factor considered when classifying the joint
arrangement as either a joint operation or joint venture.
The Group has evaluated the effect of adopting this standard and does not expect that adoption thereof, will impact the
financial statements based on current contractual agreements in existence. A change in any of these agreements could
impact the accounting on adoption of this standard.

58
Notes to the Consolidated Financial Statements of Edcon Holdings Limited (continued) 1. SIGNIFICANT ACCOUNTING POLICIES AND BASIS OF PREPARATION (continued)
1.25 Future changes in accounting policies (continued)
IFRS 12, Disclosure of interests in other entities
This standard was issued in May 2011 and becomes effective for financial periods on or after 1 January 2013. The new
standard applies to entities that have in interest in subsidiaries, joint arrangements, associates and/ or structured entities.
Many of the disclosures are those previously included in IAS 27, IAS 28 Investments in Associates and IAS 31. Many new
disclosures have however also been added, but has no impact on the Group’s financial position or performance.
The Group will include the relevant disclosure information in the financial statements in the year that it adopts this
standard. The necessary evaluation and the effects thereof will be completed before the effective date of adoption.
IFRS 10, 11 and 12, Transition guidance (Amendments to IFRS 10, 11 and 12)
This amendment states that IFRS 10 must be applied using a modified retrospective approach. The entity will need to
make an assessment of whether control exists at the date of initial application (i.e., the beginning of the annual reporting
period in which IFRS 10 is applied for the first time). If the control assessment is the same between IFRS 10 and IAS
27/SIC-12, no retrospective application is required. However, if the control assessment under the two standards is
different retrospective adjustments have to be made. If more than one comparative period is presented, additional relief is
given to require only one period to be restated.
Similar to IFRS 10, IFRS 11 must be applied using a modified retrospective approach. Relief is also given to require only
one period to be restated, if more than one comparative period is presented.
IFRS 12 must be applied retrospectively in accordance with the requirements of IAS 8 for changes in accounting policy,
with some relief being provided:
Disclosure requirements of IFRS 12 need to be applied only for the current period, and only one comparative period, if
more than one is presented
Comparatives for disclosures relating to unconsolidated structured entities are not required
As mentioned above, these standards will have no impact on the Group’s financial position or performance except for the
consolidation of Edgars Stores Limited Zimbabwe.
IFRS 13, Fair value measurement
This standard was issued in May 2011 and becomes effective for financial periods on or after 1 January 2013. The new
standard describes how to measure fair value where fair value is required or permitted to be used as a measurement
basis under IFRS (with certain standards being excluded from the scope of IFRS 13). Under IFRS 13 fair value is
presumed to be an ‘exit price’. New disclosures related to fair value measurements are also introduced.
The Group has evaluated the expected impact of IFRS 13 on its valuations of derivative instruments and property
valuations and, has determined that it already calculates fair value consistent with IFRS 13, including applying an
adjustment to the fair value to reflect the non-performance risk of the parties to its derivatives. As the Group has already
been incorporating the credit risk associated with our derivatives, it does not expect any material changes to our financial
results going forward.
IAS 1, Presentation of items of other comprehensive income (amendment to IAS 1)
This amendment was issued in June 2011 and becomes effective for financial periods on or after 1 July 2012. The
amendment to IAS 1 requires that items presented within other comprehensive income be grouped separately into those
items that will be recycled into profit or loss at a future point in time, and those items that will never be recycled.
The amendment affects presentation only and has no impact on the Group’s financial position or performance.
IAS 27, Separate financial statements
This amendment was issued in May 2011 and becomes effective for financial periods on or after 1 January 2013. IAS 27,
as revised, is limited to the accounting for investments in subsidiaries, joint ventures and associates in the separate
financial statements of the investor.
The Group has evaluated the effect of adopting this revised standard and does not expect that adoption thereof, will
impact the financial statements.

59
Notes to the Consolidated Financial Statements of Edcon Holdings Limited (continued) 1. SIGNIFICANT ACCOUNTING POLICIES AND BASIS OF PREPARATION (continued)
1.25 Future changes in accounting policies (continued)
IAS 28, Investments in associates and joint ventures
This amendment was issued in May 2011 and becomes effective for financial periods on or after 1 January 2013. The
revised standard caters for joint ventures (now accounted for by applying the equity accounting method) in addition to
prescribing the accounting for investments in associates.
The Group has evaluated the effect of adopting this revised standard and does not expect that adoption thereof, will
impact the consolidated financial statements.
IFRS 7, Disclosures – offsetting financial assets and financial liabilities (amendments to IFRS 7).
This amendment was issued in December 2011 and becomes effective for financial periods on or after 1 January 2013.
The amendment provides additional disclosures due to the offsetting amendments made to IAS 32 Financial Instruments:
Presentation.
The Group has evaluated the effect of adopting this amendment and does not expect that adoption thereof, will impact
the financial statements.
IAS 32, Offsetting financial assets and financial liabilities (amendments to IAS 32)
This amendment was issued in December 2011 and becomes effective for financial periods on or after 1 January 2014.
The amendment clarifies the meaning of the entity currently having a legally enforceable right to set off financial assets
and financial liabilities as well as the application of IAS 32 offsetting criteria to settlement systems (such as clearing
houses).
The Group has evaluated the effect of adopting this amendment and does not expect that adoption thereof, will impact
the financial statements.
IFRS 9 and IFRS 7, Mandatory effective date and transition disclosures (amendments to IFRS 9 and IFRS 7)
This amendment was issued in December 2011 and becomes effective for financial periods on or after 1 January 2013.
The amendment changes the mandatory effective date for IFRS 9 to 1 January 2015.
The amendments to IFRS 7 adopted by the Group will depend on when IFRS 9 is adopted and effect the extent of
comparative information required to be disclosed.
The Group is still evaluating the effect of adopting this standard and expects that the adoption of this standard will not
materially impact the financial statements. However the necessary evaluation and the effects thereof will be completed
before the effective date of adoption.
IFRIC 20, Stripping costs in the production phase of a surface mine
This amendment was issued in October 2011 and becomes effective for financial periods on or after 1 January 2013.
The amendment has no impact on the Group.
IFRS 1 Government Loans – Amendments to IFRS 1
These amendments require first-time adopters to apply the requirements of IAS 20 Accounting for Government Grants
and Disclosure of Government Assistance, prospectively to government loans existing at the date of transition to IFRS.
Entities may choose to apply the requirements of IFRS 9 (or IAS 39, as applicable) and IAS 20 to government loans
retrospectively if the information needed to do so had been obtained at the time of initially accounting for that loan. The
exception would give first-time adopters relief from retrospective measurement of government loans with a below-market
rate of interest. The amendment is effective for annual periods on or after 1 January 2013.
The amendment has no impact on the Group.
Improvements to IFRS’s (May 2012)
In May 2012, the IASB issued an omnibus of amendments to its standards and interpretations, primarily with a view to
removing inconsistencies and clarifying wording. The adoption of the following amendments is not expected to have any
impact on the financial position nor financial performance of the Group. The amendments are effective for annual periods
beginning on or after 1 January 2013.

60
Notes to the Consolidated Financial Statements of Edcon Holdings Limited (continued) 1. SIGNIFICANT ACCOUNTING POLICIES AND BASIS OF PREPARATION (continued)
1.25 Future changes in accounting policies (continued)
IFRS 1, First-time Adoption of International Financial Reporting Standards. Repeated application of IFRS 1 and
Borrowing costs.
IAS 1, Presentation of Financial Statements. Clarification of the requirements for comparative information.
IAS 16, Property, Plant and Equipment. Classification of servicing equipment
IAS 32, Financial Instruments: Presentation. Tax effect of distribution to holders of equity instruments.
IAS 34, Interim Financial Reporting. Interim financial reporting and segment information for total assets and
liabilities.
61
Notes to the Consolidated Financial Statements of Edcon Holdings Limited (continued)
2. OPERATING SEGMENT REPORT
For management purposes, the Group is organised into business units based on their target markets and product offering,
and the business is structured under six reportable operating segments. Management monitors the operating results of the
business segments separately for the purpose of making decisions about resources to be allocated and of assessing
performance. The reportable segments are as follows:
Edgars division
The department store division is targeted at middle to upper income consumers. The speciality store chains included in this
division are Edgars, Boardmans, Red Square, Temptations, Edgars Active, and Edgars Shoe Gallery. The products within
this operating segment include mainly clothing, footwear, cosmetics, mobile phones, homewares and accessories.
CNA division
The CNA division is targeted at middle to upper income consumers and its product offering includes stationery, books,
magazines, greeting cards, mobile phones, music, toys, photographic and digital equipment.
Discount division
The discount division sells value merchandise targeted at lower to middle income consumers. The largest brand in discount
division is Jet, with associated brands that include Jet Mart, Jet Shoes and Legit. The Discom chain was also part of the
Discount division operating segment. The product offering within this operating segment includes mainly clothing, footwear,
mobile phones, cosmetics, homewares and accessories.
Manufacturing division
Celrose, the manufacturing division, is an apparel manufacturer, focusing on mid to high-end garments of mostly woven
construction. This operating segment, manufactures ladies and men’s outerwear for the Edgars and Discount divisions and
the outside market.
Credit and Financial Services
Credit and financial services focuses on the management of the Group’s trade debtors and offers consumer credit and
insurance products. For the Group’s trade debtors, this operating segment issues private label credit cards to qualifying
customers who can use these credit cards in all the Group’s chains. Credit and financial services performs all aspects of
the credit management process in-house including credit scoring activation, servicing and collection.
For the third party’s debtors, the third party extends credit to our private label store card customers while this operating
segment remains responsible for all customer-facing activities, including the distribution of the store cards and credit
collection. A net fee is paid by the third party for the administration of the accounts.
In addition, all private label store card customers are offered insurance products in partnership with insurance providers
through joint venture agreements. The operating segment does not bear underwriting risk with respect to these insurance
products.
Group Services
Group Services performs the Group’s shared services functions which include, human resources, treasury, tax, finance,
internal audit, property management, logistics, loyalty, business intelligence and secretarial. Additionally, the trade accounts
payable function for the Group is managed centrally by Group Services and the accounting for trademarks and goodwill is
accounted for centrally.
Management monitors the operating results of its business units separately for the purpose of making decisions about
resource allocation and performance assessment. Operating segment performance is evaluated based on operating profit
or loss and is measured consistently with operating profit or loss in the Consolidated Financial Statements.
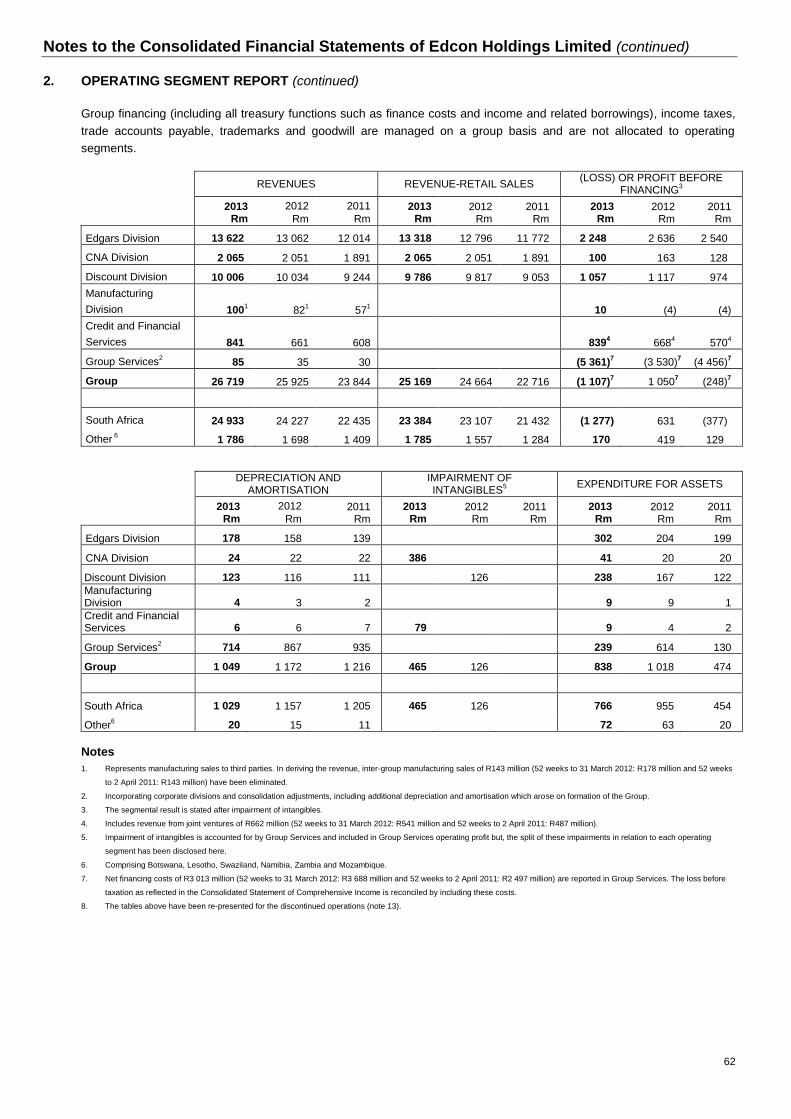
62
Notes to the Consolidated Financial Statements of Edcon Holdings Limited (continued)
2. OPERATING SEGMENT REPORT (continued)
Group financing (including all treasury functions such as finance costs and income and related borrowings), income taxes,
trade accounts payable, trademarks and goodwill are managed on a group basis and are not allocated to operating
segments.
REVENUES REVENUE-RETAIL SALES (LOSS) OR PROFIT BEFORE
FINANCING3
2013 Rm
2012
Rm
2011
Rm 2013
Rm 2012
Rm 2011
Rm 2013
Rm 2012
Rm 2011
Rm
Edgars Division 13 622 13 062 12 014 13 318 12 796 11 772 2 248 2 636 2 540
CNA Division 2 065 2 051 1 891 2 065 2 051 1 891 100 163 128
Discount Division 10 006 10 034 9 244 9 786 9 817 9 053 1 057 1 117 974
Manufacturing
Division 1001 82
1 57
1 10 (4) (4)
Credit and Financial
Services 841 661 608 8394 668
4 570
4
Group Services2 85 35 30 (5 361)
7 (3 530)
7 (4 456)
7
Group 26 719 25 925 23 844 25 169 24 664 22 716 (1 107)7 1 050
7 (248)
7
South Africa 24 933 24 227 22 435 23 384 23 107 21 432 (1 277) 631 (377)
Other 6 1 786 1 698 1 409 1 785 1 557 1 284 170 419 129
DEPRECIATION AND AMORTISATION
IMPAIRMENT OF INTANGIBLES
5
EXPENDITURE FOR ASSETS
2013 Rm
2012
Rm 2011
Rm 2013
Rm 2012
Rm 2011
Rm 2013
Rm 2012
Rm 2011
Rm
Edgars Division 178 158 139 302 204 199
CNA Division 24 22 22 386 41 20 20
Discount Division 123 116 111 126 238 167 122
Manufacturing Division 4 3 2 9 9 1
Credit and Financial Services 6 6 7 79 9 4 2
Group Services2 714 867 935 239 614 130
Group 1 049 1 172 1 216 465 126 838 1 018 474
South Africa 1 029 1 157 1 205 465 126 766 955 454
Other6 20 15 11 72 63 20
Notes
1. Represents manufacturing sales to third parties. In deriving the revenue, inter-group manufacturing sales of R143 million (52 weeks to 31 March 2012: R178 million and 52 weeks
to 2 April 2011: R143 million) have been eliminated.
2. Incorporating corporate divisions and consolidation adjustments, including additional depreciation and amortisation which arose on formation of the Group.
3. The segmental result is stated after impairment of intangibles.
4. Includes revenue from joint ventures of R662 million (52 weeks to 31 March 2012: R541 million and 52 weeks to 2 April 2011: R487 million).
5. Impairment of intangibles is accounted for by Group Services and included in Group Services operating profit but, the split of these impairments in relation to each operating
segment has been disclosed here.
6. Comprising Botswana, Lesotho, Swaziland, Namibia, Zambia and Mozambique.
7. Net financing costs of R3 013 million (52 weeks to 31 March 2012: R3 688 million and 52 weeks to 2 April 2011: R2 497 million) are reported in Group Services. The loss before
taxation as reflected in the Consolidated Statement of Comprehensive Income is reconciled by including these costs.
8. The tables above have been re-presented for the discontinued operations (note 13).

63
Notes to the Consolidated Financial Statements of Edcon Holdings Limited (continued)
2. OPERATING SEGMENT REPORT (continued)
The following is an analysis of the consolidated income from continuing operations by reportable segment:
Edgars Rm
CNA Rm
Discount Division
Rm
Manufac- turing
Rm
Credit and Finan-
cial Services
Rm
Group Services
Rm Total
Rm
52 weeks 30 March 2013
Retail sales 13 318 2 065 9 786
25 169
Club revenue 304
220
524
Manufacturing sales1
100
100
Finance charges on trade receivables
69
69
Revenue from joint ventures
662
662
Finance income
29 85 114
Administration fee 81 81
Total revenue 13 622 2 065 10 006 100 841 85 26 719
52 weeks 31 March 2012
Retail sales 12 796 2 051 9 817
24 664
Club revenue 266
217
483
Manufacturing sales1
82
82
Finance charges on trade receivables
154
154
Revenue from joint ventures
474
474
Finance income
33 35 68
Total revenue 13 062 2 051 10 034 82 661 35 25 925
52 weeks to 2 April 2011
Retail sales 11 772 1 891 9 053
22 716
Club revenue 242
191
433
Manufacturing sales1
57
57
Finance charges on trade receivables
91
91
Revenue from joint ventures
487
487
Finance income
30 30 60
Total revenue 12 014 1 891 9 244 57 608 30 23 844
Note 1 Represents manufacturing sales to third parties. In deriving the revenue, inter-group manufacturing sales of R143 million
(52 weeks to 31 March 2012: R178 million and 52 weeks to 2 April 2011: R143 million) have been eliminated.
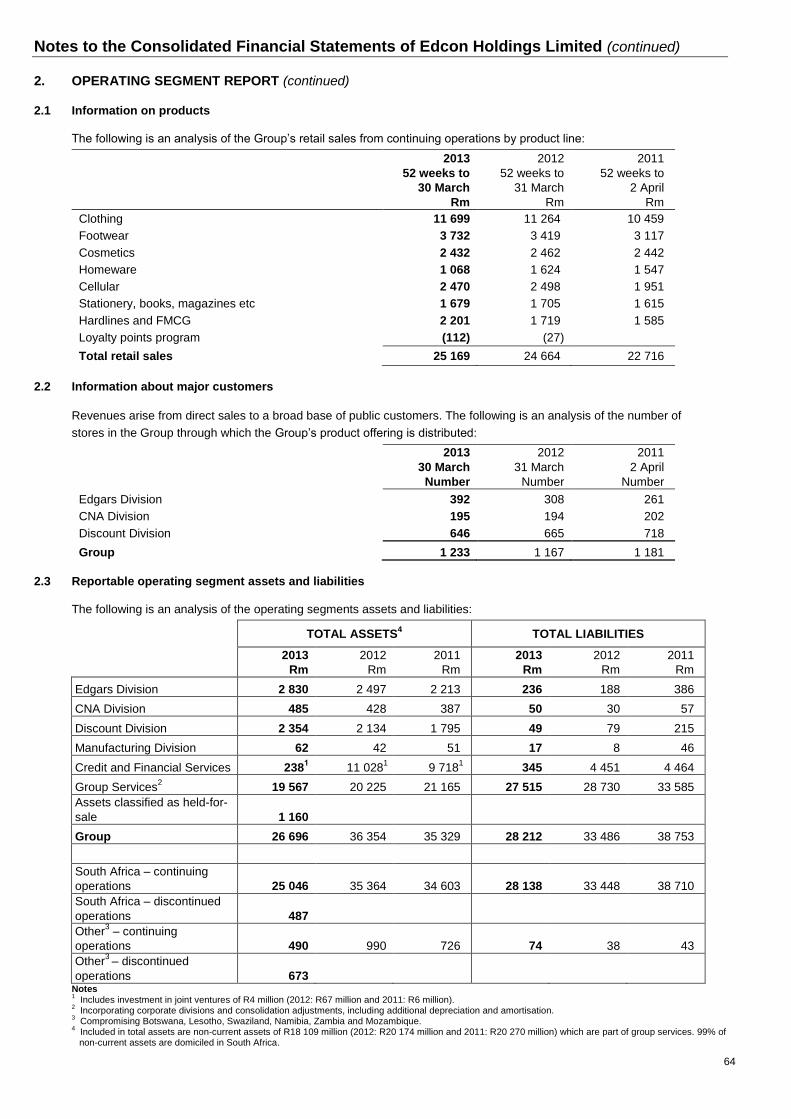
64
Notes to the Consolidated Financial Statements of Edcon Holdings Limited (continued)
2. OPERATING SEGMENT REPORT (continued) 2.1 Information on products
The following is an analysis of the Group’s retail sales from continuing operations by product line:
2013
52 weeks to
30 March
Rm
2012
52 weeks to
31 March
Rm
2011
52 weeks to
2 April
Rm
Clothing 11 699 11 264 10 459
Footwear 3 732 3 419 3 117
Cosmetics 2 432 2 462 2 442
Homeware 1 068 1 624 1 547
Cellular 2 470 2 498 1 951
Stationery, books, magazines etc 1 679 1 705 1 615
Hardlines and FMCG 2 201 1 719 1 585
Loyalty points program (112) (27)
Total retail sales 25 169 24 664 22 716
2.2 Information about major customers
Revenues arise from direct sales to a broad base of public customers. The following is an analysis of the number of
stores in the Group through which the Group’s product offering is distributed:
2013
30 March
Number
2012
31 March
Number
2011
2 April
Number
Edgars Division 392 308 261
CNA Division 195 194 202
Discount Division 646 665 718
Group 1 233 1 167 1 181
2.3 Reportable operating segment assets and liabilities
The following is an analysis of the operating segments assets and liabilities:
TOTAL ASSETS
4 TOTAL LIABILITIES
2013
Rm
2012
Rm
2011
Rm
2013
Rm
2012
Rm
2011
Rm
Edgars Division 2 830 2 497 2 213 236 188 386
CNA Division 485 428 387 50 30 57
Discount Division 2 354 2 134 1 795 49 79 215
Manufacturing Division 62 42 51 17 8 46
Credit and Financial Services 2381 11 028
1 9 718
1 345 4 451 4 464
Group Services2 19 567 20 225 21 165 27 515 28 730 33 585
Assets classified as held-for-
sale 1 160
Group 26 696 36 354 35 329 28 212 33 486 38 753
South Africa – continuing
operations 25 046 35 364 34 603 28 138 33 448 38 710
South Africa – discontinued
operations 487
Other3 – continuing
operations 490 990 726 74 38 43
Other3
– discontinued
operations 673 Notes 1 Includes investment in joint ventures of R4 million (2012: R67 million and 2011: R6 million).
2 Incorporating corporate divisions and consolidation adjustments, including additional depreciation and amortisation.
3 Compromising Botswana, Lesotho, Swaziland, Namibia, Zambia and Mozambique.
4 Included in total assets are non-current assets of R18 109 million (2012: R20 174 million and 2011: R20 270 million) which are part of group services. 99% of non-current assets are domiciled in South Africa.

65
Notes to the Consolidated Financial Statements of Edcon Holdings Limited (continued)
2013 30 March
Rm
2012 31 March
Rm
2011 2 April
Rm
3. PROPERTIES, FIXTURES, EQUIPMENT AND VEHICLES
Historic cost except for revalued land and buildings
Land and buildings
Historic cost 4 4 4
Revaluation surplus - - -
Leased assets 327 308
Leasehold improvements 785 707 626
Fixtures and fittings 3 592 3 106 2 842
Computer equipment and software 1 691 1 528 1 246
Machinery and vehicles 191 178 170
6 590 5 831 4 888
Accumulated depreciation
Buildings 1 1 1
Leased assets 40 17
Leasehold improvements 513 432 345
Fixtures and fittings 2 120 1 762 1 405
Computer equipment and software 1 232 1 042 805
Machinery and vehicles 125 106 86
4 031 3 360 2 642
Net carrying value
Comprising:
Land and buildings 3 3 3
Leased assets 287 292
Leasehold improvements 272 275 281
Fixtures and fittings 1 472 1 344 1 437
Computer equipment and software 459 486 441
Machinery and vehicles 66 71 84
2 559 2 471 2 246
Opening net carrying value 2 471 2 246 2 663
Movements for the period
Land and buildings – revaluation, cost less accumulated
depreciation - - -
Additions
Leased assets 19 308
Leasehold improvements 87 88 81
Fixtures and fittings 530 322 261
Computer equipment and software 189 293 127
Machinery and vehicles 13 7 5
838 1 018 474
Other
Currency adjustments 2 (1) (1)
840 1 017 473

66
Notes to the Consolidated Financial Statements of Edcon Holdings Limited (continued)
2013 30 March
Rm
2012 31 March
Rm
2011 2 April
Rm
3. PROPERTIES, FIXTURES, EQUIPMENT AND VEHICLES (continued)
Disposals (net carrying value)
Land and buildings 35
Leasehold improvements 4 6 12
Fixtures and fittings 16 25 44
Computer equipment and software 2 6 1
Machinery and vehicles - - -
22 37 92
Depreciation (note 28.2) 730 755 798
Closing net carrying value 2 559 2 471 2 246
Land and buildings were revalued at 30 March 2013 to open
market value based on the open market net rentals and current
replacement cost of each property. Deferred taxation has been
raised on the revaluation surplus. The independent valuations
were carried out by professional valuers. No other categories of
assets were revalued.
A register of the Group’s land and buildings is available for
inspection at the Company’s registered office. If the land and
buildings were measured using the cost model the cost would
have been R4 million (2012: R4 million and 2011: R4 million) and
the accumulated depreciation R1 million (2012: R1 million and
2011: R1 million).
At 30 March 2013, the properties, fixtures, equipment and
vehicles have an estimated replacement cost and insurance
value of R8 billion (2012: R7 billion and 2011: R6 billion) which
excludes input value added-tax where appropriate.
These assets are security in terms of the floating rate notes (note
19), fixed rate notes (note 19), the super senior secured notes
(note 19) and the revolving credit facility (note 21).
The leased assets are secured by the lease liabilities (note 22.2).
4.
INTANGIBLE ASSETS
Goodwill represents the excess of the purchase consideration
over the fair value of the identifiable assets at the date of
acquisition purchased as part of a business combination. Other
intangible assets represent registered rights to the exclusive use
of certain trademarks and brand names.
Balance at the beginning of the period 17 481 18 024 18 442
Movement of intangible assets:
Charge for the period (note 28.1) (319) (417) (418)
Derecognition/impairment of goodwill (79) (86)
Impairment of finite life brands (40)
Impairment of indefinite life brands (386)
Balance at the end of the period 16 697 17 481 18 024
Comprising:
Goodwill at cost 8 434 8 513 8 513
Intangible assets at cost 11 979 11 979 11 979
Impairment of intangibles including goodwill (1 346) (960) (834)
Accumulated amortisation of intangible assets (2 370) (2 051) (1 634)
16 697 17 481 18 024

67
Notes to the Consolidated Financial Statements of Edcon Holdings Limited (continued)
2013
30 March
Rm
2012
31 March
Rm
2011
2 April
Rm
4. INTANGIBLE ASSETS (continued)
Intangible assets (excluding goodwill)
Intangible assets at cost:
Indefinite life brands 8 492 8 492 8 492
Finite life brands 229 229 229
Customer relationships 1 974 1 974 1 974
Trademarks recognised 206 206 206
Customer lists 561 561 561
Technology 517 517 517
11 979 11 979 11 979
Impairment of intangibles:
Indefinite life brands (1 137) (751) (751)
Finite life brands (40) (40)
(1 177) (791) (751)
Accumulated amortisation of intangible assets:
Finite life brands (126) (111) (87)
Customer relationships (1 285) (1 110) (885)
Trademarks recognised (115) (101) (80)
Customer lists (407) (366) (292)
Technology (437) (363) (290)
(2 370) (2 051) (1 634)
Carrying value of intangible assets:
Indefinite life brands 7 355 7 741 7 741
Finite life brands 63 78 142
Customer relationships 689 864 1 089
Trademarks recognised 91 105 126
Customer lists 154 195 269
Technology 80 154 227
8 432 9 137 9 594
The remaining useful life of the finite life brands, customer relationships and customer lists is 4 years (2012: 5 years and
2011: 6 years), trademarks range from 4 to 9 years (2012: 5 to 10 years and 2011: 6 to 10 years) and technology is 1 year
(2012: 2 years and 2011: 3 years).
Indefinite life brands principally comprise those brands for which there is no foreseeable limit to the period over which they
are expected to generate net cash inflows.
The Edgars, Jet, CNA and Boardmans brands are considered to have an indefinite life as each has been in existence for a
significant period, have strength and durability and require a low level of marketing support.
During the 2012 financial period an impairment of R40 million was recognised on the finite life brands due to a change in
product offering.
Goodwill and indefinite life brands are tested annually for impairment (note 5).
5. IMPAIRMENT TESTING OF GOODWILL AND INTANGIBLES WITH INDEFINITE LIVES
Goodwill acquired through business combinations and intangible assets with indefinite lives have been allocated to individual
cash-generating units for impairment testing as follows:
Edgars Division – includes Edgars, Red Square, Temptations, Boardmans, Edgars Active and
Edgars Shoe Gallery, offering clothing, footwear and homeware products.
CNA – offers stationery and electronic products.
Discount Division – includes Jet, JetMart, Legit and Jet Shoes chains offering clothing, footwear, beauty and homeware
products.
Credit and Financial Services.

68
Notes to the Consolidated Financial Statements of Edcon Holdings Limited (continued)
5. IMPAIRMENT TESTING OF GOODWILL AND INTANGIBLES WITH INDEFINITE LIVES (continued)
Impairment testing of this goodwill and intangibles with indefinite lives was undertaken on the following basis:
The recoverable amount of cash-generating units has been determined based on a value-in-use calculation. To calculate
this, cash flow projections are based on financial budgets approved by senior management covering no more than a five-
year period. The discount rate applied to the cash flow projections for Edgars and the Discount Division is 12% (2012:
16% and 2011: 15%), for CNA, 14% (2012: 16% and 2011: 15%) and for the Credit and Financial Services Division, 12%
(2012 and 2011: 17%). The average growth rates used to extrapolate the cash flow projection of each cash-generating
unit beyond the periods covered by the financial forecasts for Edgars, the Discount Division and the Credit and Financial
Services Division is 6% (2012 and 2011: 6%) and for CNA, 4% (2012 and 2011: 6%) as future benefits are expected
beyond the periods of the financial forecasts.
As a result, forecast sales assumptions were based on estimated growths over the short-term and the growth rates
beyond the forecasted period were held constant for Edgars and the Discount Division at 6%, and for CNA, 4% (2012 and
2011: 6%).
Carrying amount of goodwill and intangibles
with indefinite lives (Rm) Edgars CNA
Discount
Division
Credit
and
Financial
Services Total
2013
Carrying amount of goodwill 1 753 2 922 3 590 8 265
Carrying amount of indefinite life intangibles 4 535 160 2 660 7 355
2012
Carrying amount of goodwill 1 753 2 922 3 669 8 344
Carrying amount of indefinite life intangibles 4 535 546 2 660 7 741
2011
Carrying amount of goodwill 1 753 3 008 3 669 8 430
Carrying amount of indefinite life intangibles 4 535 546 2 660 7 741
During the current period an impairment of R386 million was recognised on the indefinite life brand for CNA due to
economic trading conditions and a change in the mix of products sold by CNA stores. In addition, R79 million goodwill
relating to OtC was derecognised as the securitisation program was terminated during the period. During the 2012
financial period an impairment of R86 million was recognised on the goodwill allocated to Discom due to a change in
product offering.
Key assumptions applied in value-in-use calculation of the cash generating units
The calculation of value-in-use is most sensitive to gross margin, store expenses, discount rates, market share and
growth rates used to extrapolate cash flows beyond the financial forecast period.
Gross margins are based on average values achieved in the three years preceding the start of the budget period. These
are increased over the budget period for anticipated efficiency improvement and therefore based on financial forecasts for
the Edgars, CNA and the Discount Divisions.
Store expenses are applied as a percentage of sales to the forecast based on historic performance, adjusted for any
future impacts.
Discount rates reflect management’s estimate of the risks specific to each unit.
Market share assumptions (based on external market information) are important as management considers how the unit’s
position relative to its competitors might change over the forecast period. Management expects the market share of
Edgars, CNA and the Discount Division to be reasonably stable over the forecast period.
Growth rate estimates are conservatively applied to each unit having considered industry expected growth rates and
internal targets. The Group is not expected to exceed the long-term average growth rates of the industry.
A reasonable possible change in any of the key assumptions would not result in the carrying amount of any of the cash
generating units exceeding their recoverable amount.

69
Notes to the Consolidated Financial Statements of Edcon Holdings Limited (continued)
2013 30 March
Rm
2012 31 March
Rm
2011 2 April
Rm
6. EQUITY ACCOUNTED INVESTMENT IN JOINT VENTURES
Hollard Insurance – 50% holding offering long and short-term insurance products to account holders - 62 1
Europe Assistance 4 5 5
Total equity accounted in joint venture 4 67 6
6.1 Share of joint ventures’ reserves
Balance at the beginning of the period 67 6 -
Income for the period 666 541 487
Paid as follows:
Administration fee received (439) (401) (381)
Dividends received (290) (79) (100)
Carrying value of joint ventures 4 67 6
6.2 Share of joint ventures’ net assets, revenue and expenses
Current assets 4 67 6
Revenue 1 575 1 331 1 124
Expenses 879 727 582
7. DERIVATIVE FINANCIAL INSTRUMENTS1
7.1 Non-current derivative assets
Interest rate swaps - - 30
Cross currency swaps - 472 -
Foreign currency call options 292 - -
292 472 30
7.2 Current derivative assets
Cross currency swaps 813 - -
Foreign currency forward contracts 2 - -
815 - -
7.3 Non-current derivative liabilities
Interest rate swaps - 42 -
Foreign currency forward contracts - 21 55
Cross currency swaps - - 253
- 63 308
7.4 Current derivative liabilities
Interest rate swaps 68 42 111
Foreign currency forward contracts 11 24 146
Cross currency swaps - 731 689
79 797 946

70
Notes to the Consolidated Financial Statements of Edcon Holdings Limited (continued)
2013
30 March
Rm
2012
31 March
Rm
2011
2 April
Rm
7. DERIVATIVE FINANCIAL INSTRUMENTS1 (continued)
7.5 Total derivatives
Interest rate swaps liability (68) (84) (81)
Foreign currency forward contracts liability (9) (45) (201)
Cross currency swaps asset/(liability) 813 (259) (942)
Foreign currency call options asset 292
1 028 (388) (1 224)
Credit risk valuation adjustments1
Interest rate swaps (4) (9) (2)
Foreign currency forward contracts - (6) (13)
Cross currency swaps 7 (61) (154)
Foreign currency call options 1
4 (76) (169)
Total derivatives before credit risk valuation adjustments
Interest rate swaps liability (72) (93) (83)
Foreign currency forward contracts liability (9) (51) (214)
Cross currency swaps asset/(liability) 820 (320) (1 096)
Foreign currency call options asset 293
1 032 (464) (1 393)
1 Credit risk valuation adjustments are included
in the total fair value of derivatives above.
Refer to note 36.2 for details of hedging activities.
On 13 February 2013, Edcon Limited terminated cross currency
swaps as a consequence of the repurchase of the senior secured
floating rate notes with a nominal value of €754 million and
received proceeds of R1 021 million which were applied to the buy-
back transaction (note 19.2).
On 1 March 2011, Edcon Limited issued 9.5% senior secured fixed
rate notes due 2018, comprising of a €317 million tranche and a
US$250 million tranche (note 19.4). These funds were utilised to
settle a derivative liability of R5 001 million on 2 March 2011 (note
33.9).
Prior to the early redemption of OtC’s note program, the interest
rate risk relating to OtC receivables had been hedged with dynamic
interest rate swaps with Rand Merchant Bank, a division of
FirstRand Bank Limited. The fair value at financial period end of
2013 is RNil million (2012: liability R154 million and 2011: liability
R156 million). The interest rate swap balance was offset by the
movement for finance charges on eligible receivables.
7.6 Derivative loss
Derivative loss recognised in profit or loss (897) (10) (2 343)
(897) (10) (2 343)

71
Notes to the Consolidated Financial Statements of Edcon Holdings Limited (continued)
The deferred tax asset relating to the assessed loss will be realised through the normal course of business.
2013 30 March
Rm
2012 31 March
Rm
2011 2 April
Rm
8. DEFERRED TAXATION
Balance at the beginning of the period – asset 1 030 887 153
Recognised in profit or loss – current year (note 32.1) 697 133 693
Recognised in profit or loss – prior year (note 32.1) (2 028)
Deferred tax in other comprehensive income – currency
forwards (note 32.2) (233) 1
19
Deferred tax in other comprehensive income – cash flow
hedges and employee benefits (note 32.2) (3) 9
22
Balance at the end of the period – (liability)/asset (537) 1 030 887
Comprising:
Appro sales 13
Intangible assets 1 500 1 659 1 426
Property, fixtures, equipment and vehicles 236 261 209
Prepayments 3 4 4
Unearned finance income - 38 20
Employee benefits 35 32
Fair value gain on interest rate hedges 14
Other 2 29 26
Deferred tax liability 1 790 2 023 1 698
Provision for impairment of receivables 28 205 183
Other payables 196 175 138
Leave pay accrual 41 40 39
Operating lease adjustment 119 104 112
Finance leases 88 92
Fair value loss on interest rate hedges 29 245 232
Assessed loss 675 2 185 1 852
Deferred option premium 77
Other - 7 29
Deferred tax asset 1 253 3 053 2 585
Net deferred tax (liability) / asset (537) 1 030 887
Reflected in the Statement of Financial Position as
follows:
Deferred tax assets – continuing operations 33 1 030 887
Defereed tax assets – discontinued operations 26
Deferred tax liabilities – continuing operations (596)
Net deferred tax (liability)/asset (537) 1 030 887

72
Notes to the Consolidated Financial Statements of Edcon Holdings Limited (continued)
2013
30 March
Rm
2012
31 March
Rm
Rm
2011
2 April
Rm
9. INVENTORIES
Merchandise 3 621 3 140 2 605
Raw materials 29 22 13
Work in progress 9 8 8
Total inventories on hand 3 659 3 170 2 626
Inventory write-downs included above 143 86 153
Cost of inventories expensed 15 874 15 574 13 923
10. TRADE RECEIVABLES
Trade accounts receivable – retail 200 10 867 9 586
Provision for impairment of receivables (19) (865) (733)
Total trade receivables 181 10 002 8 853
R118 million (2012 and 2011: R6 864 million and R6 017 million) of
the balances are covered by an account protection policy whereby
the Group is the beneficiary in the event of the customer’s death, the
customer being retrenched or becoming permanently disabled. The
policy does not provide cover for insolvency or inability to pay.
The Group’s total trade receivables (net of related impairment losses)
moved from an asset of R10 002 million at 31 March 2012 to an
asset of R181 million at 30 March 2013 as a result of the sale of the
Group's private label store card portfolio to Absa on 1 November
2012. All conditions required for the first closing of the South African
trade receivables were satisfied on this date and R8 667 million of
the South African private label store card portfolio was sold to Absa
for cash.
The balance of the Group’s trade receivables has been disclosed as
R181 million in the consolidated financial statements, as the
remainder of the trade receivables balance of R1 134 million, has
been disclosed as “Assets classified as held-for-sale” (refer note 13).
The remaining portion of the card portfolio (in South Africa, Lesotho,
Namibia, Botswana and Swaziland) of R1 134 million is expected to
be sold as soon as Absa has completed compliance screening
processes in respect of these accounts and the relevant regulatory
approvals have been obtained.
In terms of the strategic agreement with Absa, Absa will provide retail
credit to Group customers, while the Group continues to be
responsible for all customer-facing activities, including sales and
marketing, customer services and collections.
At 31 March 2012, all obligations under the OtC receivables–backed
notes issued (note 19 and 21) were secured by pledge and cession
of the eligible receivables that OtC acquired from time to time. As at
31 March 2012, R5 991 million (2011: R6 146 million) was
designated as eligible receivables.
Refer to note 38 for details on the additional sale of South African
trade receivables which took place after the reporting period.

73
Notes to the Consolidated Financial Statements of Edcon Holdings Limited (continued)
2013
30 March
Rm
2012
31 March
Rm
2011
2 April
Rm
10. TRADE RECEIVABLES (continued)
10.1 Analysis of trade receivables past due but not impaired
Overdue 30 days – 60 days 22 1 386 1 011
Overdue 60 days – 90 days 3 184 134
Overdue 90 days – 120 days 2 98 71
Greater than 120 days 3 242 236
30 1 910 1 452
10.2 Interest on impaired receivables
Interest recognised on impaired receivables – continuing operations 4 5 7
Interest recognised on impaired receivables
discontinued operation (refer note 13)
1
3 18 184 247
Total interest recognised on impaired receivables 22 189 254
10.3 Provision for impairment of receivables
Balance at the beginning of the period 865 733 1 126
(Decrease)/increase in impairment provision (2) 132 (393)
Decrease in impairment provision – discontinued operation (refer
note 13) (844)
Balance at the end of the period 19 865 733
11. SUNDRY RECEIVABLES AND PREPAYMENTS
Sundry receivables 434 392 326
Staff loans 6 13 4
Prepayments 15 19 12
455 424 342
12. CASH AND CASH EQUIVALENTS
Cash on hand 386 265 1 370
Cash on deposit 283 818 945
669 1 083 2 315
13. DISCONTINUED OPERATIONS
On 6 June 2012, the Group announced the intended sale of its
private label store card portfolio to Absa as well as the proposed
implementation of a long-term strategic agreement. In terms of
the strategic agreement Absa will provide retail credit to the
Group’s customers, while the Group continues to be responsible
for all customer-facing activities, including sales, marketing,
customer services and collections. On 1 November 2012, all
conditions required for the first closing of the South African trade
accounts receivable were satisfied and R8 667 million of the
South African private label store card portfolio was sold to Absa.

74
Notes to the Consolidated Financial Statements of Edcon Holdings Limited (continued)
2013 52 weeks to
30 March Rm
2012 52 weeks to
31 March Rm
2011 52 weeks to
2 April Rm
13. DISCONTINUED OPERATIONS (continued)
A portion of the card portfolio in South Africa and the
card portfolio in Lesotho, Namibia, Botswana and
Swaziland, is expected to be sold as soon as Absa has
completed compliance screening processes in respect
of these accounts and the relevant regulatory
approvals have been obtained. Accordingly, the
provision of credit relating to the portion of the trade
accounts receivable not yet sold has been disclosed as
a discontinued operation, the prior period profit and
loss has been re-presented and trade receivables in
the current financial period classified as assets held-
for-sale.
The results of the discontinued operation are as
follows:
13.1 Statement of Comprehensive Income
13.1.1 Trade receivables disposed of
Revenues 1 072 1 745 1 552
Other income 1 072 1 745 1 552
Other operating costs (840) (1 142) (1 081)
Profit before taxation 232 603 471
Taxation (65) (169) (132)
Profit for the period 167 434 339
13.1.2 Trade receivables held-for-sale
Revenues 238 214 190
Other income 238 214 190
Other operating costs (193) (174) (120)
Profit before taxation 45 40 70
Taxation (13) (11) (20)
Profit for the period 32 29 50
13.1.3 Total discontinued operations
Revenues 1 310 1 959 1 742
Other income 1 310 1 959 1 742
Other operating costs (1 033) (1 316) (1 201)
Profit before taxation 277 643 541
Taxation (78) (180) (152)
Profit for the period 199 463 389

75
Notes to the Consolidated Financial Statements of Edcon Holdings Limited (continued)
2013
30 March
Rm
2012
31 March
Rm
2011
2 April
Rm
13. DISCONTINUED OPERATIONS (continued)
13.2 Statement of Financial Position
The major classes of assets sold on 1 November 2012 and held-for-
sale as at 30 March 2013 are as follows:
13.2.1 Trade receivables disposed of
Assets
Trade receivables 8 667
Total assets disposed of 8 667
13.2.2 Trade receivables held-for-sale
Assets
Trade receivables 1 134
Deferred tax asset 26
Total assets held-for-sale 1 160
2013 52 weeks
to 30 March
Rm
2012 52 weeks
to 31 March
Rm
2011 52 weeks
to 2 April
Rm
13.3 Statement of Cash Flows
The net cash flows incurred by the discontinued operations are as follows:
13.3.1 Trade receivables disposed of
Operating 8 899 (122) 369
Investing
Financing
Net cash inflow/(outflow) 8 899 (122) 369
13.3.2 Trade receivables held-for-sale
Operating (174) (100) 51
Investing
Financing
Net cash (outflow)/inflow (174) (100) 51
13.3.3 Total discontinued operations
Operating 8 725 (222) 420
Investing
Financing
Net cash (outflow)/inflow 8 725 (222) 420
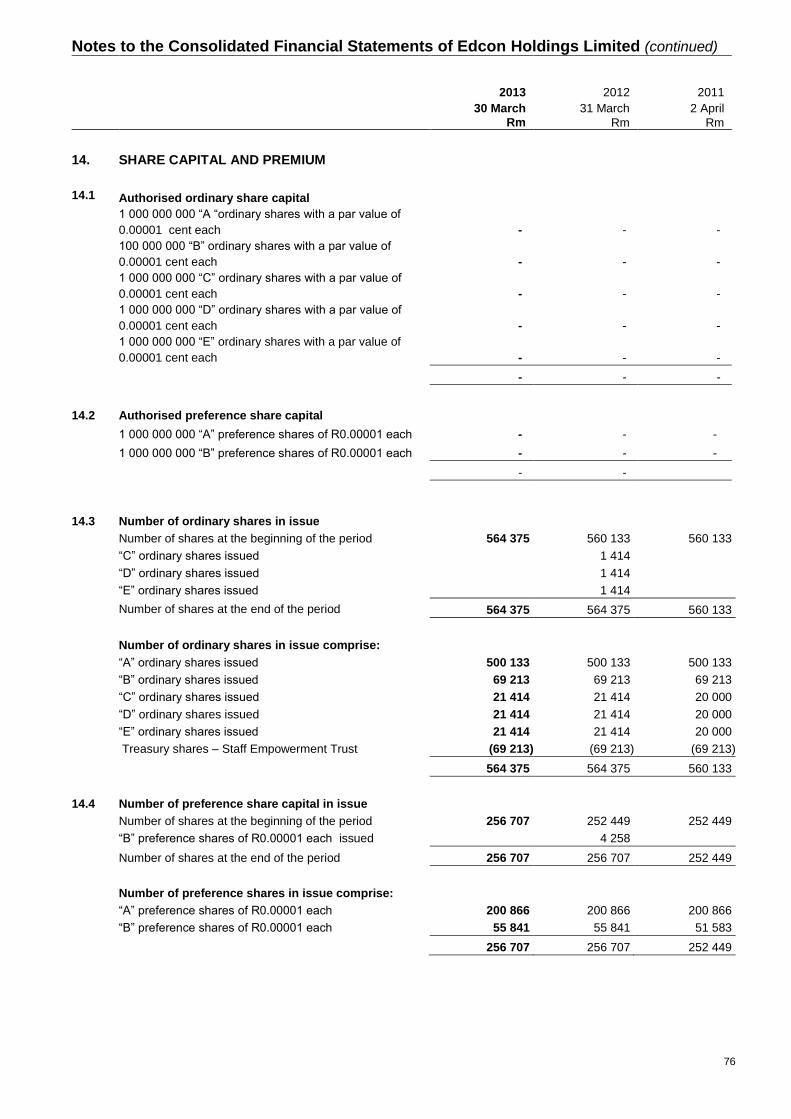
76
Notes to the Consolidated Financial Statements of Edcon Holdings Limited (continued)
2013
30 March
Rm
2012
31 March
Rm
2011
2 April
Rm
14. SHARE CAPITAL AND PREMIUM
14.1 Authorised ordinary share capital
1 000 000 000 “A “ordinary shares with a par value of
0.00001 cent each - - -
100 000 000 “B” ordinary shares with a par value of
0.00001 cent each - - -
1 000 000 000 “C” ordinary shares with a par value of
0.00001 cent each - - -
1 000 000 000 “D” ordinary shares with a par value of
0.00001 cent each - - -
1 000 000 000 “E” ordinary shares with a par value of
0.00001 cent each - - -
- - -
14.2 Authorised preference share capital
1 000 000 000 “A” preference shares of R0.00001 each - - -
1 000 000 000 “B” preference shares of R0.00001 each - - -
- - -
14.3 Number of ordinary shares in issue
Number of shares at the beginning of the period 564 375 560 133 560 133
“C” ordinary shares issued 1 414
“D” ordinary shares issued 1 414
“E” ordinary shares issued 1 414
Number of shares at the end of the period 564 375 564 375 560 133
Number of ordinary shares in issue comprise:
“A” ordinary shares issued 500 133 500 133 500 133
“B” ordinary shares issued 69 213 69 213 69 213
“C” ordinary shares issued 21 414 21 414 20 000
“D” ordinary shares issued 21 414 21 414 20 000
“E” ordinary shares issued 21 414 21 414 20 000
Treasury shares – Staff Empowerment Trust (69 213) (69 213) (69 213)
564 375 564 375 560 133
14.4 Number of preference share capital in issue
Number of shares at the beginning of the period 256 707 252 449 252 449
“B” preference shares of R0.00001 each issued 4 258
Number of shares at the end of the period 256 707 256 707 252 449
Number of preference shares in issue comprise:
“A” preference shares of R0.00001 each 200 866 200 866 200 866
“B” preference shares of R0.00001 each 55 841 55 841 51 583
256 707 256 707 252 449

77
Notes to the Consolidated Financial Statements of Edcon Holdings Limited (continued)
1
14. SHARE CAPITAL AND PREMIUM (continued)
14.5
Voting rights of ordinary and preference shares
Each “A” ordinary share of the Group shall entitle the holder
thereof to 1 000 votes on all matters upon which
shareholders have the right to vote.
Each “A” redeemable cumulative preference share of the
Group shall not entitle the holders thereof to receive notice
of or to attend or vote at any general meeting of the
company Edcon Holdings Limited, save where a resolution
affecting a matter contemplated in section 37(3)(a) of the
Companies Act of South Africa is proposed.
The total “B” ordinary shareholder of the Group at any time
shall, in aggregate, have the right to exercise such number
of votes as is equal to 10,6% of the aggregate voting rights
of the total “A” ordinary shares then in issue.
Each “B” redeemable cumulative preference share of the
Group shall not entitle the holders thereof to receive notice
of or to attend or vote at any general meeting of the
company Edcon Holdings Limited, save where a resolution
affecting a matter contemplated in section 37(3)(a) of the
Companies Act of South Africa is proposed.
Each “C”, “D” and “E” ordinary share shall entitle the holder
thereof to one vote on all matters upon which shareholders
have the right to vote.
14.6 Redemption of preference shares
The “A” and “B” Preference Shares may not be redeemed
within three years and one day of their date of issue and will
thereafter be redeemed at a date fixed by the Company.
The Company shall pay to the member, all monies payable
in respect of the redemption of such “A” and “B” Preference
Shares as calculated in accordance with the provisions of
the memorandum of incorporation of the Company.
The “A” and “B” Preference Shares shall not confer on the
holders thereof any further rights to participate in the profits
or assets of the Company.

78
Notes to the Consolidated Financial Statements of Edcon Holdings Limited (continued) 2013
30 March
Rm
2012
31 March
Rm
2011
2 April
Rm
14. SHARE CAPITAL AND PREMUIM (continued)
1
14.7 Issued shares and premium
Balance at the beginning of the period 2 153 2 148 2 148
Ordinary shares issued -
Preference shares issued – share capital -
Preference shares issued – share premium 5
Balance at the end of the period 2 153 2 153 2 148
Comprising:
Share capital - - -
Share premium 2 153 2 153 2 148
Total 2 153 2 153 2 148
15. OTHER RESERVES
Balance at the beginning of the period comprising:
Revaluation reserve net of deferred taxation 3 3 3
Foreign currency translation reserve (30) (35) (20)
Cash flow hedges net of tax (661) (568) (391)
(688) (600) (408)
Movements
Net decrease in revaluation reserve - - -
Foreign currency translation reserve 13 5 (15)
Cash flow hedges recognised in other comprehensive
income 1 483 (289) (1 075)
Cash flow hedges released to derivative losses as hedge
ineffectiveness (3) 12 82
Cash flow hedges released to financing costs 1 033 985 443
Cash flow hedges released to foreign exchange (gain)/loss (2 215) (838) 304
Cash flow hedges released due to discontinued hedge
accounting 570
Tax impact of cash flow hedges (note 32.2) (244) 37 69
Balance at the end of the period (51) (688) (600)

79
Notes to the Consolidated Financial Statements of Edcon Holdings Limited (continued)
2013 30 March
Rm
2012 31 March
Rm
2011 2 April
Rm
15. OTHER RESERVES (continued)
Comprising:
Revaluation reserve net of deferred taxation 3 3 3
Foreign currency translation reserve (17) (30) (35)
Cash flow hedges net of tax (37) (661) (568)
(51) (688) (600)
The foreign denominated floating and fixed rate notes
expose the Group to both interest rate risk and foreign
exchange risk. Derivative instruments have been executed
to limit the exposure to both interest rate and/or foreign
exchange risk. Certain derivative instruments have been
designated as a cash flow hedge. Refer to note 36.2 for
details of the hedging strategy.
The foreign currency translation reserve is used to
record exchange differences arising from the translation of
the financial statements of foreign subsidiaries. It is also
used to record the effect of hedging net investments in
foreign operations.
16. RETAINED (LOSS)/SURPLUS
Comprising:
Holding company - Edcon Holdings Limited 2 357 2 084 2 070
Consolidated subsidiaries (14 265) (8 971) (7 042)
(11 908) (6 887) (4 972)
17. FOREIGN SUBSIDIARY DISTRIBUTIONS
Distributions by certain foreign subsidiaries will give rise to
withholding taxes of R26 million (2012: R21 million and
2011: R70 million). No deferred tax is raised until dividends
are declared as the Group controls the timing of the reversal
and it is probable that there will be no reversal in the
foreseeable future. Deferred tax not raised was R68 million
(2012: R82 million and 2011: R242 million).

80
Notes to the Consolidated Financial Statements of Edcon Holdings Limited (continued)
2013 30 March
Rm
2012 31 March
Rm
2011 2 April
Rm
18. SHAREHOLDER’S LOAN
Loan recognised in equity 8 290 8 290
Loan recognised in non-current liabilities 801 659 8 184
Loan by Edcon (BC) S.A.R.L. 9 091 8 949 8 184
Comprising:
Principal at the beginning of the period 8 949 8 184 6 597
Interest capitalised during the period 765 831
Interest accrued during the period 756
Loan derecognised (8 949)
Loan recognised in equity 8 290
Loan recognised in non-current liabilities 659
Notional interest charged for the period 142
Principal at the end of the period 9 091 8 949 8 184
Principal at the end of the period excluding notional
interest 8 949 8 949 8 184
The loan is denominated in South African Rands and
accrued interest at the South African prime rate plus 2% p.a.
on the principal up to and including 7 February 2012.
Thereafter, no interest will accrue up to and including the
date of repayment. The principal is repayable in May 2037.
This shareholder’s loan is regarded as capital for IAS 1
purposes (note 35).
As a result of the fact that the loan became interest-free the
terms of the loan are substantially different and as a result it
was necessary to derecognise the loan in terms of IAS 39.
Applying initial measurement in terms of IAS 39 resulted in
R8 290 million being recognised in equity and R659 million
being recognised in non-current liabilities.
The directors’ have considered the going concern
assumption and have included the total shareholder’s loan of
R9 091 million in the assessment (refer to note 35,
management of capital). To the extent required to maintain
the solvency of the Group, the shareholder’s loan has been
subordinated to the claims of all of the creditors of the
Group.

81
Notes to the Consolidated Financial Statements of Edcon Holdings Limited (continued) 2013
30 March
Rm
2012
31 March
Rm
2011
2 April
Rm
19. NON-CURRENT INTEREST-BEARING DEBT
Super senior secured notes (note 19.1) 1 010 1 010
Senior secured floating rate notes (note 19.2) 4 543 11 559 11 094
Senior floating rate notes (note 19.3) 4 406 3 802 3 527
Senior secured fixed rate notes (note 19.4) 9 178 5 012 4 534
Senior notes 19 137 21 383 19 155
OtC receivables-backed notes (note 19.5) 2 150 4 300
Super senior secured term loan (note 19.6) 985
19 137 23 533 24 440
19.1 Super senior secured notes
Notes issued 1 010 1 010
1 010 1 010
During the 2012 financial period, super senior secured
notes of R1 010 million were issued by Edcon Limited and
guaranteed on a super senior secured basis, and are
secured along with the revolving credit facility, the senior
secured term loan, the senior secured floating rate notes
and the senior secured fixed rate notes by security
interests over the assets of Edcon Holdings Limited and its
subsidiaries. Interest is payable quarterly in arrears at a
rate of three-month JIBAR, plus 6.25%. The notes mature
on 4 April 2016, subject to a springing maturity structure:
- Investors have a put back to Edcon Limited on 31
March 2015 to the extent that the 2015 senior floating
rate notes are not refinanced to 30 June 2016 or
beyond, or have been redeemed in full.
There have been no defaults or breaches of the principal or
interest during the period.
19.2 Senior secured floating rate notes
Notes issued 3 698 10 890 11 259
Foreign currency 867 781 (9)
Fees capitalised (22) (112) (156)
4 543 11 559 11 094
Balance at the beginning of the period 11 559 11 094 11 397
Foreign currency movement 1 795 795 (340)
Fees amortised 90 44 37
Repurchased (8 901) (374)
Balance at end of period 4 543 11 559 11 094

82
Notes to the Consolidated Financial Statements of Edcon Holdings Limited (continued) 2013
30 March
Rm
2012
31 March
Rm
2011
2 April
Rm
19. NON-CURRENT INTEREST-BEARING DEBT
(continued)
19.2 Senior secured floating rate notes (continued)
The senior secured floating notes of €387 million (2012:
€1 141 million and 2011: €1 180 million) are issued by Edcon
Limited and guaranteed on a senior secured basis and are
secured, along with the revolving credit facility, the super
senior secured notes, the senior secured term loan and the
senior secured fixed rate notes, by security interests over
substantially all the assets of Edcon Holdings Limited and its
subsidiaries.
Interest is payable quarterly in arrears at a rate of three
month EURIBOR, reset quarterly, plus 3.25%. The notes
mature on 15 June 2014. There have been no defaults or
breaches of the principal or interest during the period. The
market value of the senior secured floating rate notes at 30
March 2013 was R4 542 million (2012: R10 234 million and
2011: R9 618 million).
On 14 February 2013, the Group completed a note
repurchase of the senior secured floating rate notes with a
nominal value of €754 million being 100.1% of the face
value. The notes were redeemed out of the combined
proceeds raised from the issuance of new senior secured
fixed rate notes (refer note 19.4), a portion of the proceeds
from the sale of the Group’s private label store card portfolio
to Absa and through proceeds received on termination of
certain in-the-money derivative contracts over the related
notes being repurchased.
In May 2011, the Group completed a note repurchase of the
senior secured floating rate notes with a nominal value of
€39 million being 90% of the face value.
19.3 Senior floating rate notes
Notes issued 3 606 3 606 3 606
Foreign currency 846 259 (2)
Fees capitalised (46) (63) (77)
4 406 3 802 3 527
Balance at the beginning of the period 3 802 3 527 3 623
Foreign currency movement 587 261 (108)
Fees amortised 17 14 12
Balance at end of period 4 406 3 802 3 527
The senior floating notes of €378 million are issued by
Edcon Holdings Limited and guaranteed on a senior
subordinated basis and secured by a third ranking pledge
of the proceeds of the loan between Edcon Holdings
Limited and Edcon Limited.
Interest is payable quarterly in arrears at a rate of three
month EURIBOR, reset quarterly, plus 5.5%. The notes
mature on 15 June 2015. There have been no defaults or
breaches of the principal or interest during the period. The
market value of the senior floating rate notes at 30 March
2013 was R4 059 million and (2012: R3 200 million and
2011: R3 009 million).

83
Notes to the Consolidated Financial Statements of Edcon Holdings Limited (continued) 2013
30 March
Rm
2012
31 March
Rm
2011
2 April
Rm
19. NON-CURRENT INTEREST-BEARING DEBT (continued)
19.4 Senior secured fixed rate notes
Notes issued 8 379 4 781 4 781
Foreign currency 1 179 376 (86)
Fees capitalised (380) (145) (161)
9 178 5 012 4 534
Balance at the beginning of the period 5 012 4 534
Notes issued 3 598 4 781
Foreign currency movement 803 462 (86)
Fees and discount capitalised (261) (165)
Fees and discount amortised 26 16 4
Balance at end of period 9 178 5 012 4 534
On 13 February 2013, Edcon Limited issued new senior
secured fixed rate notes which mature in March 2018, with a
face value of €300 million. The notes were issued at 96.5%
of the face value, are guaranteed on a senior secured basis
and are secured, along with the revolving credit facility, the
super senior secured notes, the senior secured floating rate
notes and the senior secured term loan, by security interests
over substantially all the assets of Edcon Holdings Limited
and its subsidiaries.
The senior secured fixed rate notes of €317 million and
US$250 million were issued by Edcon Limited in March 2011
respectively and guaranteed on a senior secured basis and
are secured, along with the revolving credit facility, the super
senior secured notes, the senior secured floating rate notes
and the senior secured term loan, by security interests over
substantially all the assets of Edcon Holdings Limited and its
subsidiaries.
Interest is payable semi-annually in arrears at a rate of 9.5%
per annum for all the above notes and they mature in March
2018.
The market value of the senior secured fixed rate notes at 30
March 2013 was R3 695 million (2012: R2 939 million and
2011: R2 886 million) for the €317 million notes, R2 274
million (2012: R1 745 million and 2011: R1 623 million) for
the US$250 million notes and R3 496 million for the €300
million notes. There have been no defaults or breaches of
the principal or interest during the period.
19.5 OtC receivables-backed notes
Notes issued 4 300 4 300
Current (2 150)
Non-current 2 150 4 300
On 31 October 2012, OtC completed an early redemption of
all its Class A and Class B notes in issue, in accordance with
the terms and conditions of its R6 500 million Receivables
Backed Domestic Medium Term Note Program. The notes
redemption was necessary so that OtC’s receivables asset
could be sold to Edcon Limited, and as such, facilitate the
sale of the Group’s private label store card portfolio to Absa.
As from 31 October 2012 OtC became dormant.

84
Notes to the Consolidated Financial Statements of Edcon Holdings Limited (continued)
19. NON-CURRENT INTEREST-BEARING DEBT (continued)
19.5 OtC receivables-backed notes (continued)
The receivables backed notes comprised unlisted notes and
notes listed on the Johannesburg Securities Exchange. The
applicable interest rate and margin, maturity date and fair value
is detailed below:
OtC receivables – backed notes
Amount and Fair Value 31 March
2012 Rm
Maturity Date
Applicable Interest
Margin %
Current
Listed 555 31 Jul 2012 3m Jibar 2.5
Unlisted 1 545 31 Oct 2012 3m Jibar 2.5
Unlisted 50 31 Oct 2012 3m Jibar 4.5
Total Current 2 150
Non - Current
Listed 427 30 Apr 2013 3m Jibar 2.3
Listed 968 30 Apr 2013 3m Jibar 2.2
Listed 323 30 Apr 2014 3m Jibar 2.5
Listed 182 30 Apr 2014 3m Jibar 2.3
Listed 250 30 Apr 2017 Fixed 10.09%
Total non-current 2 150
Total receivables-backed notes 4 300
OtC receivables – backed notes
Amount and Fair Value
2 April 2011 Rm
Maturity Date
Applicable Interest
Margin %
Non-current
Listed 555
31 Jul
2012 3m Jibar 2.5
Unlisted 1 545 31 Oct 2012 3m Jibar 2.5
Unlisted 50 31 Oct 2012 3m Jibar 4.5
Listed 427 30 Apr 2013 3m Jibar 2.3
Listed 968 30 Apr 2013 3m Jibar 2.2
Listed 323 30 Apr 2014 3m Jibar 2.5
Listed 182 30 Apr 2014 3m Jibar 2.3
Listed 250 30 Apr 2017 Fixed 10.09%
Total receivables-backed notes 4 300

85
Notes to the Consolidated Financial Statements of Edcon Holdings Limited (continued)
2013
30 March
Rm
2012
31 March
Rm
2011
2 April
Rm
19. NON-CURRENT INTEREST-BEARING DEBT (continued)
19.6 Super senior secured term loan
Balance at the beginning of the period 985
Loan raised 985
Loan repaid (985)
Balance at end of period 985
During the 2011 financial period a loan of R985 million was raised by
Edcon Limited and guaranteed on a super senior secured basis, and
was secured along with the revolving credit facility, the super senior
notes, the senior secured floating rate notes and the senior secured
fixed rate notes by security interests over the assets of Edcon
Holdings Limited and its subsidiaries. Interest was payable quarterly in
arrears at a rate of three-month JIBAR, plus 4.0%. The loan was
repaid with the proceeds of the super senior secured notes on 4 April
2011 (refer note 19.1).
19.7 Super senior secured term loan
On 28 March 2013, Edcon Limited concluded an agreement with
certain financial institutions to provide a R4 120 million term loan,
guaranteed on a senior secured basis and secured, along with the
revolving credit facility, the super senior secured notes, the senior
secured floating rate notes and the senior secured fixed rate notes, by
security interests over substantially all the assets of Edcon Holdings
Limited and its subsidiaries. The proceeds from the senior secured
term loan will be used to repurchase all outstanding senior secured
floating rate notes. The loan is repayable four years from drawdown,
while interest is payable quarterly at an initial rate of three-month
JIBAR, plus 7.0%.
At the reporting date this facility had not been utilised due to certain
conditions precedent to draw down that were in the process of being
fulfilled (refer to note 38, Events after the reporting period).
19.8 Foreign exchange (loss)/gain and fees amortised
Foreign exchange (loss)/gain (3 186) (1 518) 534
Released from other comprehensive income (note 15) 2 215 838 (304)
Foreign exchange (loss)/gain (971) (680) 230
Fees amortised recognised in financing costs (note 31.1) 133 74 53
20. DEFERRED OPTION PREMIUM
Deferred option premium raised during the period 351
Deferred option premium settled during the period (51)
Effective interest 5
305
Current 36
Non-current 269
305

86
Notes to the Consolidated Financial Statements of Edcon Holdings Limited (continued)
2013
30 March
Rm
2012
31 March
Rm
2011
2 April
Rm
20. DEFERRED OPTION PREMIUM (continued)
In December 2012, a series of foreign currency call options were
entered into, with notional values of €150 million and US$250 million to
buy foreign currency and sell Rand. These foreign currency call
options hedge a portion of our principal obligations on the senior
secured fixed rate notes. The premiums payable on the foreign
currency call options have been deferred to between March 2014 and
April 2014 and are interest-free.
21. CURRENT INTEREST-BEARING DEBT
Revolving credit facility 1 456 751
OtC receivables-backed notes (note 19.5) 2 150
1 456 2 901
The revolving credit facility provides senior secured financing of up to
R3 967 million (2012 and 2011: R3 117 million) for general corporate
and working capital purposes. All obligations under the facility are
secured by substantially all the assets of Edcon Holdings Limited and
its subsidiaries. The revolving credit facility accrues interest at
applicable JIBAR plus a margin of 4% (2012 and 2011: 4%) for
Tranche B, payable monthly in arrears and 2.5% for Tranche A in 2012
and 2011. The facility includes R2 700 million (2012: R1 450 million
and 2011: R2 100 million) borrowing capacity available for bank
guarantees, letters of credit, forward exchange contracts and for
borrowings under bilateral ancillary facilities. These ancillary facilities
accrue interest at ruling over-night market related lending rates.
On 31 October 2012, OtC completed an early redemption of all of its
Class A and Class B notes in issue, in accordance with the terms and
conditions of its R6 500 million Receivables Backed Domestic Medium
Term Note Program. The notes redemption was necessary so that
OtC’s receivables asset could be sold to Edcon Limited, and as such
facilitate the sale of the Group’s private label store card portfolio to
Absa. As from 31 October 2012, OtC became dormant and its short-
term facilities cancelled.
There have been no defaults or breaches of principal, interest or
redemption terms during the current or prior periods.
22. LEASE OBLIGATIONS
22.1 Operating lease obligations
The Group leases the majority of its properties and computer
equipment under operating leases whereas other operating assets are
generally owned. The lease agreements of certain of the Group's store
premises provide for a minimum annual rental payment and additional
payments determined on the basis of turnover. Lease agreements have
an option of renewal in terms of the lease agreement ranging between
5 to 10 years.

87
Notes to the Consolidated Financial Statements of Edcon Holdings Limited (continued) 2013
30 March
Rm
2012
31 March
Rm
2011
2 April
Rm
22. LEASE OBLIGATIONS (continued)
22.1
Operating lease obligations (continued)
The future minimum property operating lease commitments are
due as follows: 8 926 7 553 6 654
Within one year 1 606 1 492 1 323
Between two and five years 4 746 4 266 3 808
In more than five years 2 574 1 795 1 523
The future revenue expected from sub-leases is estimated to be R19
million (2012: R22 million and 2011: R24 million).
The Group also leases certain computer equipment. The agreements
provide for minimum annual rental payments and additional payments
depending on usage.
The future minimum computer equipment operating lease commitments
are due as follows: 288 436 312
Within one year 148 137 139
Between two and five years 140 299 173
22.2 Finance lease liability
The finance lease is recognised in respect of a building and information
technology (“IT”) equipment for which the present value of the minimum
lease payments due in terms of the lease agreements amounted
substantially to the fair value of the building and IT equipment at the
time the agreement was entered into. The average borrowing rate on
the lease of the building is 11.0% and the average borrowing rate on the
IT equipment is 8.6%.
Minimum lease payments 537 586
Within one year 72 62
Between two and five years 162 177
In more than five years 303 347
The present value of the lease obligation is due as follows: 313 329
Within one year 40 28
Between two and five years 51 60
In more than five years 222 241
The present value of the interest payments is due as follows: 224 257
Within one year 32 34
Between two and five years 111 116
In more than five years 81 107

88
Notes to the Consolidated Financial Statements of Edcon Holdings Limited (continued) 2013
30 March Rm
2012 31 March
Rm
2011 2 April
Rm
23. TRADE AND OTHER PAYABLES
Trade accounts payable 3 218 2 858 2 752
Sundry accounts payable and accrued expenses 1 194 971 940
Lease equalisation 1 5 9
Leave pay accrual 149 143 139
Value added taxation payable 28 57 83
Interest accrued 115 268 186
4 705 4 302 4 109
The trade and sundry payables amounts are interest-free and
mature no later than 30 to 60 days. Other payables mature no
later than one year.
24. DEFERRED REVENUE
Balance at the beginning of the period 80
Loyalty points earned 252 80
Loyalty points redeemed (140) -
Balance at the end of the period 192 80
Current 106 80
Non-current 86
192 80
The deferred revenue arises from the Thank U rewards
program that was launched during February 2012.
25. FUTURE CAPITAL EXPENDITURE
Contracted:
Properties, fixtures, equipment and vehicles 835 315 244
Authorised by the directors but not yet contracted:
Properties, fixtures, equipment and vehicles 191 778 572
1 026 1 093 816
2013 52 weeks to
30 March Rm
Re-presented 2012
52 weeks to 31 March
Rm
Re-presented 2011
52 weeks to 2 April
Rm
26. REVENUE
Retail sales 25 169 24 664 22 716
Club fees 524 483 433
Finance charges on trade receivables 69 154 91
Revenue from joint ventures 662 474 487
Finance income (note 31.1) 114 68 60
Administration fee 81
Manufacturing sales to third parties 100 82 57
26 719 25 925 23 844

89
Notes to the Consolidated Financial Statements of Edcon Holdings Limited (continued) 2013
52 weeks to 30 March
Rm
2012 52 weeks to
31 March Rm
2011 52 weeks to
2 April Rm
27. OTHER INCOME
Club fees 524 483 433
Finance charges on trade receivables1 69 154 91
Administration fee 81
Manufacturing sales to third parties 100 82 57
774 719 581
12012 and 2011 have been re-presented for the discontinued
operation (note 13).
28.
OTHER OPERATING COSTS
Trading profit is stated after taking account inter alia the following
items:
28.1
Amortisation of trademarks
Charge for the period (note 4) 319 417 418
28.2
Depreciation of properties, fixtures, equipment and vehicles
Buildings - - 1
Leased assets 23 16
Leasehold improvements 86 88 97
Fixtures and fittings 387 389 418
Computer equipment and software 215 242 259
Machinery 19 20 23
Total charge for the period (note 3) 730 755 798
28.3 Fees payable
Managerial, technical, administrative and secretarial fees paid
outside the Group
481 456 158
Outsourcing of IT function 373 345 317
854 801 475
28.4 Operating lease expenses
Properties:
Minimum lease payments 1 544 1 414 1 312
Turnover clause payments 21 9 13
Operating lease adjustment 29 3 (2)
Sublease rental income (35) (47) (39)
Equipment 227 187 204
1 786 1 566 1 488
28.5
Net (loss)/gain on disposal of properties, fixtures,
equipment and vehicles (22) (22) 8
29. FOREIGN EXCHANGE (LOSSES)/GAINS
Foreign exchange (loss)/gain on foreign notes 19.8 (3 186) (1 518) 534
Foreign exchange gain/(loss) on cash flow hedge 19.8 2 215 838 (304)
Other foreign exchange loss (137)
(1 108) (680) 230

90
Notes to the Consolidated Financial Statements of Edcon Holdings Limited (continued)
2013 52 weeks to
30 March Rm
2012 52 weeks to
31 March Rm
2011 52 weeks to
2 April Rm
30. DIRECTORS AND EMPLOYEES
30.1 Employees
The aggregate remuneration and associated cost of permanent and
casual employees including directors was:
Salaries and wages 2 989 2 832 2 392
Retirement benefit costs 291 278 258
Medical aid contributions:
Current 60 59 62
Post-retirement 8 6 7
3 348 3 175 2 719
2013 52 weeks to
30 March R 000
2012 52 weeks to
31 March R 000
2011 52 weeks to
2 April R 000
30.2 Directors’ and prescribed officers remuneration
Directors and
prescribed
officers
Directors and
prescribed
officers
Directors and
prescribed
officers
Non-executive directors:
Fees 668 326 295
668 326 295
Executive directors and prescribed officers:
Remuneration 23 148 34 957 21 498
Retirement, medical, accidental and death benefits 2 449 2 848 2 534
Relocation payment 1 830 1 744 1 660
Performance bonuses 18 241 4 631
Loyalty bonuses 4 685 4 400 4 400
Other benefits 14 272 13 577 480
46 384 75 767 35 203
Retired ex-directors 85 80 76
Total 47 137 76 173 35 574
1.
Prescribed officers are members of the executive committee. 2.
The comparatives have been restated to include prescribed officers
and to reflect the performance bonuses in the period it was
accrued.

91
Notes to the Consolidated Financial Statements of Edcon Holdings Limited (continued)
30.
DIRECTORS AND EMPLOYEES (continued)
30.2 Directors’ and prescribed officers remuneration (continued)
30.2.1 Directors emoluments
2013
Name Non-executive directors
Fees R000
Remu-eration
R000
Retire- ment,
medical, accident
and death benefits
R000
Relocat-ion
R000
Perfor-mance bonus
R000
Loyalty bonus
R000
Other benefits
R000 Total R000
ZB Ebrahim
DH Brown
TF Mosololi
468
100
100
468
100
100
Total 668
Executive
directors and
prescribed
officers
Months
paid
J Schreiber 12 11 059 66 11 125
SM Ross 2 824 6 1 035 7 058 8 923
MR Bower 12 4 367 954 1 700 7 021
Dr U Ferndale 12 2 635 572 350 96 3 653
SR Binnie 3 516 126 350 89 1 081
C Claassen 12 2 480 478 2 958
H Witvoet 5 1 267 247 1 830 1 250 7 029 11 623
46 384
47 052
Pension for past managerial services - retired ex directors 85
Total emoluments 47 137
Executive directors
The executive board members at 30 March 2013 are the Group Chief Executive Officer (CEO), the deputy CEO and Chief
Financial Officer and the Chief Operations Officer. The remuneration committee has set their remuneration with due
consideration to their performance, experience and responsibility after conducting extensive benchmarking of similar roles in
companies comparable to the Group’s size, industry and risk profile.
Jurgen Schreiber, the CEO, entered into a five year employment contract with the Group to 1 April 2016. In terms of his
contract, he is entitled to a basic annual remuneration, payment in lieu of benefits and annual performance bonus. The
employment of the CEO can be terminated by either party upon 6 months prior notice.
Mark R. Bower, the Deputy CEO and CFO, entered into a contract with the Group to 1 July 2017. In terms of his contract, he
is entitled to a basic annual remuneration, loyalty bonus and annual performance bonus. His employment can be terminated
by either party upon 6 months prior notice.
Dr Urin Ferndale, the COO, entered into a five year contract with the Group to 1 July 2017. In terms of his contract, he is
entitled to a basic annual remuneration, loyalty bonus and annual performance bonus. The employment of the COO can be
terminated by either party upon 6 months prior notice.
Executive Management
Christo Claassen, the Chief Executive of Discount Division, entered into a non-fixed term contract with the Group effective
1 December 2011. In terms of his contract, he is entitled to a basic annual remuneration and annual performance bonus. The
employment of the Executive can be terminated by either party upon 1 months prior notice.

92
Notes to the Consolidated Financial Statements of Edcon Holdings Limited (continued)
30.
DIRECTORS AND EMPLOYEES (continued)
30.2 Directors’ and prescribed officers remuneration (continued)
30.2.1 Directors emoluments (continued)
2012
Name Non-executive directors
Fees R000
Remun- eration
R000
Retire- ment,
medical, accident
and death benefits
R000
Re-location
fee R000
Perfor-mance Bonus
R000
Loyalty bonus
R000
Other benefits
R000 Total R000
ZB Ebrahim
326
326
Total 326
Executive directors and prescribed officers
Months paid
J Schreiber 12 10 588 64 11 543 13 4821 35 677
SM Ross 12 10 942 36 10 978
MR Bower 12 3 379 756 1 994 700 6 829
Dr U Ferndale 12 2 350 518 1 300 350 95 4 613
SR Binnie 12 2 125 518 1 197 350 4 190
C Claassen 12 2 187 435 1 192 3 814
H Witvoet 12 3 386 521 1 744 1 015 3 000 9 666
75 767
76 093
Pension for past managerial services - retired ex directors 80
Total emoluments 76 173
1Represents sign-on fee.

93
Notes to the Consolidated Financial Statements of Edcon Holdings Limited (continued)
30.
DIRECTORS AND EMPLOYEES (continued)
30.2 Directors’ and prescribed officers remuneration (continued)
30.2.1 Directors emoluments (continued)
2011
Name Non-executive directors
Fees R000
Remun- eration
R000
Retire- ment,
medical, accident
and death benefits
R000
Relocati-on fee
R000
Perfor-mance bonus
R000
Loyalty bonus
R000
Other benefits
R000 Total R000
ZB Ebrahim
295
295
Total 295
Executive
directors
Months
paid
SM Ross 12 9 374 35 1 728 11 137
MR Bower 12 2 994 672 1 173 700 2 5 541
Dr U Ferndale 12 2 162 473 463 350 92 3 540
SR Binnie 12 1 964 481 608 350 3 403
C Claassen 12 2 061 414 378 2 853
H Witvoet 12 2 943 459 1 660 281 3 000 386 8 729
35 203
35 498
Pension for past managerial services - retired ex directors 76
Total emoluments 35 574

94
Notes to the Consolidated Financial Statements of Edcon Holdings Limited (continued)
2013 52 weeks to
30 March Rm
2012 52 weeks to
31 March Rm
2011 52 weeks to
2 April Rm
30. DIRECTORS AND EMPLOYEES (continued)
30.3 Employee benefit asset
The Edcon Pension Fund is a defined benefit fund that offers,
amongst other benefits, a pension of 2% of final pensionable
salary per year of service at retirement for 14 active members.
A statutory valuation of the Fund as of 31 December 2002 was
carried out by Alexander Forbes Financial Services, using the
projected unit method of valuation. The actuarial value of
liabilities for all pensioners and members was R328 million and
the contingency reserves were determined at R60 million. The
fair value of the assets calculated by reference to the market
value was R644 million. The fund was accordingly fully funded
and showed a surplus of R256 million. The Group is required to
contribute at a rate of 19.1% of salaries.
In the current period an actuarial estimate was performed using
the projected unit credit method, and the fair value of the assets
and liabilities is reflected below. The actuarial estimate was
based on the principle assumptions as set out in note 30.3.6.
The main risks associated with the Fund are as follows:
- Risk of underfunding. The Fund is currently in a
significant surplus position.
- Longevity risk: The Fund has purchased annuities from
a registered insurer to provide monthly pensions to
pensioners.
- Risk of insurer default on pension payments: Should
the insurer default on the pension payments, the Fund
would still be liable for the monthly pensions.
Edcon Pension Fund
Actuarially determined amounts recognised in profit or loss:
Current service cost (2) - -
Finance income 13 - -
Net gain recognised in profit or loss 11 - -
The contribution for the 2014 financial period is estimated to be
approximately R1 million.
Actuarially determined amounts recognised in other
comprehensive income:
Actuarial (loss)/gain on plan assets (59) 71 (11)
Actuarial loss on defined benefit obligation (50) (320) (6)
Change in the effect of limiting the net benefit to the asset ceiling 117 403 17
Net amount recognised in other comprehensive income for the period 8 154 -
Total cumulative gain recognised in other comprehensive
income 162 154 -
2013
30 March
Rm
2012
31 March
Rm
2011
2 April
Rm
30.3.1 Analysis of net defined benefit asset – pension fund
Defined benefit obligation (739) (808) (494)
Fair value of plan assets 915 1 075 966
Effect of the asset ceiling (4) (113) (472)
Net asset 172 154 -

95
Notes to the Consolidated Financial Statements of Edcon Holdings Limited (continued)
2013 52 weeks to
30 March Rm
2012 52 weeks to
31 March Rm
2011 52 weeks to
2 April Rm
30.
DIRECTORS AND EMPLOYEES (continued)
30.3 Employee benefit asset (continued)
30.3.2 Reconciliation of defined benefit obligation
Balance at the beginning of the period 808 494 490
Current service cost 2 - -
Finance cost 59 43 45
Actuarial loss in other comprehensive income - financial
adjustments 50 320 6
Benefits paid (180) (49) (47)
Balance at the end of the period 739 808 494
30.3.3 Reconciliation of fair value plan assets
Balance at the beginning of the period 1 075 966 941
Finance income 81 87 85
Employer contributions 1 1 1
Benefits paid (180) (49) (47)
Actuarial (loss)/gain in other comprehensive income - financial
adjustments (59) 71 (11)
Expenses and premiums (3) (1) (3)
Balance at the end of the period 915 1 075 966
The assets of the Edcon Pension Fund were invested
as follows:
Cash 336 291 290
Equity 10 12 8
Bonds 78 224 208
International offshore assets 2
Property and other 491 548 458
915 1 075 966
30.3.4 Reconciliation of the effect of the asset ceiling –
pension fund
Balance at the beginning of the period 113 473 452
Interest on asset ceiling 9 43 30
Change in the effect of limiting the net defined benefit asset
to the asset ceiling (118) (403) (9)
Balance at the end of the period 4 113 473

96
Notes to the Consolidated Financial Statements of Edcon Holdings Limited (continued)
30. DIRECTORS AND EMPLOYEES (continued)
30.3 Employee benefit asset (continued)
30.3.5 Surplus apportionment
As reported in the previous period, proposals were submitted to the Financial Services Board (FSB) in 2002 to offer pensioners
an enhanced pension in exchange for assuming all their medical aid liabilities. Similarly, a portion of the surplus was to be
utilised to pay the lump sum to medical aid members’ provident fund accounts to meet the existing post-retirement medical aid
liability for service rendered to date.
The FSB did not accept the proposal and therefore a formal surplus apportionment scheme was prepared in accordance with
Section 15B of the Pension Fund Act. The aim of the scheme was to distribute the surplus as at 31 December 2002 between the
various stakeholders of the fund. This surplus scheme was submitted to the Financial Services Board for consideration in
January 2011 and it was approved in February 2012. On completion of the surplus apportionment, the statutory valuations
subsequent to 31 December 2002 have been prepared and are in the process of approval.
The surplus scheme showed a total surplus of R256 million as at 31 December 2002, which corresponds with the statutory
valuation of the fund at the same date. Of this surplus, Edcon Limited was apportioned with R100 million and members and
former members were apportioned R156 million.
The surplus apportioned to members and former members has been increased with the returns earned on the surplus assets
since the surplus apportionment scheme. The balance as at 30 March 2013 amounted to R209 million. This amount has been
included in the assets and liabilities of the fund.
The surplus apportioned to Edcon Limited has increased with the returns earned on the surplus assets since the surplus
apportionment date and adjusted for estimated amounts of the surplus utilised by Edcon Limited after the surplus apportionment
date and amounts to R214 million as at 30 March 2013.
Following the approval of the surplus scheme in February 2012, the Group is entitled to the amount that was apportioned to the
employer surplus account, which was estimated to be R214 million. However, the economic benefit available to Edcon Limited
as a refund in future contributions, as described in paragraph 20 of IFRIC 14, was determined to be R172 million. The total asset
recognised on the statement of financial position therefore amounts to R172 million (2012: R154 million and 2011: RNil).
30.3.6 Valuation assumptions used
The valuation is based on assumptions which include a discount rate of 9.5% (2012: 8.25% and 2011: 9.25%) per annum, an
inflation rate and pension increase rate of 7.1% (2012: 5.5% and 2011: 6%) per annum, a salary increase rate of 8.1% plus age-
related merit increases (2012: 6.5% and 2011: 7%) per annum. The discount rate is determined at the reporting date with
reference to the yield curve for South African government bonds. The inflation rate assumes an underlying future rate of
consumer price inflation of 7.1% per annum based on the relationship between current conventional bond yields and current
index-linked bond yields. The inflation assumption was calculated as the difference between discount rate and a real bond yield
and adjusted for an inflation risk premium which was assumed to be 0.5%. The salary increase is based on the assumption that
the increase will be 1% above inflation. The Fund has adopted a pension increase policy that targets 100% of inflation and, as a
result, a pension increase of 7.1% is used in the valuation.
30.3.7 Sensitivity analysis
The defined benefit obligation is largely insensitive to changes in the assumptions as the majority of the liabilities are in respect
of outsourced pensioners, where the liabilities have been set equal to the annuity values provided by the insurer.
The sensitivity results below were calculated using an approximate formula to estimate the impact of a change in the
assumptions.
Central assumption
2013 2012 2011 2013 2012 2011 2013 2012 2011
Inflation rate
sensitivity 7.1% 5.5% 6.0% Decrease 1% Increase 1%
Defined benefit
obligation Rm 739 808 494 735 805 490 746 814 499
Discount
Rate sensitivity 9.5% 8.25% 9.25% Decrease 1% Increase 1%
Defined benefit
obligation Rm 739 808 494 746 814 499 735 805 490

97
Notes to the Consolidated Financial Statements of Edcon Holdings Limited (continued)
30. DIRECTORS AND EMPLOYEES (continued)
30.4 Defined contribution plans
Contributions to the Group's significant defined contribution funds are at a rate of 17.3% of benefit salary and where
funds are contributory, members pay a maximum of 7.5%. The employer's portion is charged against profit or loss.
Separate funds, independent of the Group, provide retirement and other benefits for all permanent employees and their
dependants. During the period there were three defined contribution funds of significance, namely Edcon Provident
Fund, SACCAWU National Provident Fund and FEDCRAW Provident Fund. A defined contribution fund is available to
employees in Namibia, Botswana, Swaziland and Zambia, namely Edcon Namibia Retirement Fund, Edcon Botswana
Retirement Fund, Swaziland Provident Fund and Zambia Provident Fund.
Pensioners
Number
Members
Number
Contributions
Rm
Membership of, and employer contributions to each of the
funds were:
2013 at 30 March
Edcon Pension Fund 1 032 15 1
Edcon Provident Fund 15 438 266
Edcon Namibia Retirement Fund 777 3
Botswana Retirement Fund 435 1
SACCAWU National Provident Fund 1 181 6
FEDCRAW Provident Fund 216 2
Swaziland Provident Fund 552 -
Zambia Provident Fund 69 -
1 032 18 683 279
2012 at 31 March
Edcon Pension Fund 1 067 15 1
Edcon Provident Fund 15 306 241
Edcon Namibia Retirement Fund 645 2
Botswana Retirement Fund 409 1
SACCAWU National Provident Fund 1 182 6
FEDCRAW Provident Fund 225 2
Swaziland Provident Fund 525 -
1 067 18 307 253
2011 at 2 April
Edcon Pension Fund 1 141 17 1
Edcon Provident Fund 14 556 217
Edcon Namibia Retirement Fund 600 2
Botswana Retirement Fund 300 1
SACCAWU National Provident Fund 1 297 6
FEDCRAW Provident Fund 134 2
1 141 16 904 229

98
Notes to the Consolidated Financial Statements of Edcon Holdings Limited (continued)
30. DIRECTORS AND EMPLOYEES (continued)
30.4 Defined contribution plans (continued)
All funds are subject to the Pension Funds Acts of the various
countries and, where required by law, actuarial valuations are
conducted every three years. The market value of investments of
the various Edcon funds as at 30 March 2013 was R3 825 million
(2012: R3 512 million and 2011: R3 430 million).
30.5 Employee benefit liability
The Group operates a defined benefit medical aid scheme for the
benefit of permanent employees. Effective 1 January 2012 the
Group amalgamated this scheme with Discovery Health. The
contributions of the short-term benefit for current employees
amounted to R60 million for the period ending 30 March 2013
(2012: R59 million and 2011: R62 million). Membership of the
medical aid scheme is voluntary for all employees. Total
membership currently stands at 4 356 principal members.
In terms of employment contracts and the rules of the schemes
certain post-retirement medical benefits are provided to 1 334
current and past employees by subsidising a portion of the
medical aid contribution of members, after retirement. The
medical aid payments for these employees for 2014 are
estimated to be approximately R9 million. The actuarial valuation
was based on the main assumptions set out in note 30.5.4.
2013 52 weeks to
30 March Rm
2012 52 weeks to
31 March Rm
2011 52 weeks to
2 April Rm
30.5.1 Actuarially determined amounts recognised in profit or loss:
Current service cost 3 3 3
Financing costs 15 11 19
18 14 22
30.5.2
Actuarially determined amounts recognised in other
comprehensive income:
Actuarial gain/(loss) recognised in other comprehensive income for
the period 2 (38) -
Total cumulative loss recognised in other comprehensive
income (36) (38) -
30.5.3 The status of the Edcon Medical Aid Fund liability determined
in terms of IAS 19 is as follows:
Reconciliation of employee benefit liability:
Balance at the beginning of the period 182 130 114
Current service cost 3 3 3
Financing cost 15 11 19
Actuarial (gain)/loss in other comprehensive income – demographic
changes (24)
Actuarial (gain)/loss in other comprehensive income – financial
adjustments 22 44 -
Employee benefit payments (14) (6) (6)
Recognised employee benefit liability 184 182 130

99
Notes to the Consolidated Financial Statements of Edcon Holdings Limited (continued)
30. DIRECTORS AND EMPLOYEES (continued)
30.5 Employee benefit liability (continued)
30.5.4 Employee benefit liability valuation assumptions
The valuation is based on assumptions which include a discount rate of 8.6% (2012: 8.25% and 2011: 9%) per
annum, inflation rate of 6.3% (2012: 5.5% and 2011: 5.8%) per annum, income at retirement would increase by 7.8%
(2012: 7% and 2011: 7.25%) per annum, demographic assumptions based on a standard set of best estimate
demographic assumptions, membership continuation and an expected retirement age of 63. The discount rate is
based on current bond yields with an average term of 16 years, gross of tax and is primarily determined by reference
to current market yields on government bonds in South Africa. The inflation rate is based on the relationship between
current conventional bond yields and current index-linked bond yields. The inflation risk premium is assumed to be
0.5% and the future rate of the consumer price index inflation will be 6.3%. It was assumed that health care cost
inflation would be the same as CPI inflation and that remuneration increases, including promotional increases would
exceed inflation by 1.5% over the long-term and that income at retirement would be 60% of final salary. It was further
assumed that no current in-service members eligible for benefits would discontinue membership upon reaching
retirement with the Group and that they would retire on their current medical scheme option and no changes would
occur on retirement.
30.5.5 Sensitivity analysis
The valuation results are extremely sensitive to the assumptions used. The value of the liability could turn out to be overstated or understated depending on the extent to which actuarial experience differs from the above assumptions.
Central assumption
2013 2012 2011 2013 2012 2011 2013 2012 2011
Inflation (CPI and health
care costs) sensitivity 6.3% 5.5% 5.8% Decrease 1% Increase 1%
Accrued liability – Rm 184 182 130 161 158 113 214 212 151
Current service and interest
cost – Rm 18 14 13 15 12 11 21 17 15
Retirement age sensitivity 63 years One year younger One year older
Accrued liability – Rm 184 182 130 192 190 135 177 174 124
Discount rate sensitivity 8.6% 8.25% 9% Decrease 1% Increase 1%
Accrued liability – Rm 184 182 130 214 212 150 161 158 113
Post employment
mortality tables sensitivity
PA (90) ult rated down 1 year to
0.75% improvement p.a. from
2006
PA (90) ult rated down 2 years
with 1% improvement p.a. from
2006
Accrued liability – Rm 184 182 130 195 203 136
30 March 2013
Rm
31 March 2012
Rm
2 April 2011 Rm
30.5.6 Analysis of employee benefit liability
Accrued liability for post-retirement medical aid 184 182 130

100
Notes to the Consolidated Financial Statements of Edcon Holdings Limited (continued)
2013 52 weeks to
30 March Rm
2012 52 weeks to
31 March Rm
2011 52 weeks to
2 April Rm
31. FINANCING INCOME AND COSTS
31.1 Finance income
Interest received from independent third parties 101 68 60
Employee benefits 13 - -
114 68 60
31.2 Financing costs
Interest on senior secured floating rate notes 1 310 1 466 808
Interest on senior floating rate notes 403 382 302
Interest on senior secured fixed rate notes 602 465 48
Interest on other facilities 403 467 457
Interest on super senior secured term loan 9
Interest on super senior secured term notes 119 119
Interest accrued on shareholder’s loan (note 18) 765 843
Notional interest charged on shareholder’s loan (note 18) 142
Fees amortised on senior secured floating rate notes (note 19.2) 90 44 37
Fees amortised on senior floating rate notes (note 19.3) 17 14 12
Fees and discount amortised on senior secured fixed rate notes
(note 19.4) 26 16 4
Employee benefits 15 15 13
Foreign currency losses 3 24
3 127 3 756 2 557
32. TAXATION
32.1
Taxation charge
Current taxation - this year (2) 62 43
- prior years 226 (19) (23)
Total current taxation income/(expense) 224 43 20
Deferred taxation - this year 697 490 696
- prior years (2 028) 5 (3)
- rate change (362)
Total deferred taxation (expenses)/income (1 331) 133 693
Total (1 107) 176 713
Comprising:
South African normal taxation (1 045) 294 802
Foreign taxes (62) (118) (89)
(1 107) 176 713
1.
Re-presented for the discontinued operation (note 13)

101
Notes to the Consolidated Financial Statements of Edcon Holdings Limited (continued)
2013 52 weeks to
30 March Rm
2012 52 weeks to
31 March Rm
2011 52 weeks to
2 April Rm
32. TAXATION (continued)
32.2 Taxation charge to other comprehensive income
Current income tax related to items charged or credited
directly to other comprehensive income:
Unrealised gain on cash flow hedges 11 5 (27)
Deferred income tax related to items charged or credited
directly to other comprehensive income:
Unrealised gain on cash flow hedges 233 (42) (42)
Employee benefits 3 32
Income tax expense reported in other comprehensive income 247 (5) (69)
32.3 Deferred income tax comprises:
Arising on deferred tax assets (note 8)
Provision for impairment of receivables (177) 22 (99)
Other payables 21 37 6
Leave pay accrual 1 1 1
Operating lease adjustment 15 (8) (1)
Interest rate hedges - (31) 43
Deferred option premium 77
Assessed loss (1 507) 332 459
Finance lease (4) -
Other (7) (3) 22
Arising on deferred tax liabilities (note 8)
Appro sales 13 1
Property, fixtures, equipment and vehicles 25 38 150
Intangible assets 159 (233) 117
Prepayments 1 - (2)
Unearned finance income 38 (18) (1)
Interest rate hedges -
Other 27 (22)
(1 331) 128 696
Prior year adjustment - 5 (3)
Net deferred tax movement (expense)/income (1 331) 133 693
32.4 Reconciliation of rate of taxation (%)
Standard rate – South Africa (28) (28) (28)
Adjusted for:
Equity accounted revenue of joint venture (3) 2 1
Disallowable expenditure 14 4
Prior year charges 44 1 -
Capital gain tax inclusion rate change 18
Foreign taxes - 3 2
Effective tax rate 27 - (25)

102
Notes to the Consolidated Financial Statements of Edcon Holdings Limited (continued)
32. TAXATION (continued)
32.5 Section 24I application
In terms of section 24I of the Income Tax Act, the ruling exchange rate to be used in determining the foreign exchange
gains/losses on currency swaps, foreign currency forward contracts and forward exchange contracts (forward
exchange contracts) on translation, is the market related forward rate for the remaining period of the forward exchange
contract or such alternative rate used for accounting purposes in terms of IFRS, as prescribed by the Commissioner
(“alternative rate”). Refer to tax settlement note below.
32.6 Tax Settlement
On 31 August 2012, the South African Revenue Service (“SARS”) notified us that it was considering the issuance of an
income tax assessment primarily in connection with our tax treatment of interest payable on the financing of the
acquisition of the Group by Bain Capital. We challenged SARS’s position and we believe that we were in compliance
with applicable South African tax laws and regulations. Nevertheless, we perceived it to be beneficial to engage in
settlement discussions and we entered into a settlement agreement with SARS in relation to the matters in dispute on
14 December 2012 in order to avoid protracted litigation with SARS.
The agreement addresses the tax treatment of the issues in dispute for financial periods since the acquisition of the
Group by Bain Capital, being financial periods 2008 through 2013, as well as future financial periods. Pursuant to the
settlement, no cash outflow in relation to tax payments due will be required until September 2014. However, as a result
of the settlement, the Group is likely to pay income tax earlier than was anticipated prior to the entering into of the
settlement. We believe that our cash flows should allow us to satisfy the additional income tax payments that may
result from the settlement.
The main terms of the settlement agreement are as follows:
for the financial period 2008 through to 2013, we agreed to reduce our tax losses carry forward by approximately
R9 billion;
for the financial period from the beginning of 2014 until an initial public offering or an issuance of securities
representing 20% or more of the Group’s equity (if any), we agreed to limit the deduction for tax purposes of
interest payable on the senior secured floating rate notes and the senior floating rate notes or any refinancing
thereof (the “acquisition indebtedness”) to 50% of such interest, on an aggregate principal amount of
indebtedness of approximately €1.3 billion or the equivalent thereof in rand or U.S. dollars, subject to certain
adjustments. Interest on the portion, if any, of the acquisition indebtedness exceeding such cap will not be
deductible for tax purposes. As at 30 March 2013 acquisition indebtedness amounted to €1 billion and therefore
was in compliance with this cap;
for the period following an initial public offering or an issuance of securities representing 20% or more of the
Group’s equity (if any), we agreed that interest payable on the acquisition indebtedness would be fully deductible
for tax purposes, up to an aggregate principal amount of indebtedness of approximately €711.1 million or the
equivalent thereof in rand or U.S. dollars. Interest on the portion, if any, of the acquisition indebtedness exceeding
approximately €711.1 million or the equivalent thereof in rand or U.S. dollars will not be deductible for tax
purposes; and
for the period from and following the 2014 financial period, interest payable on the shareholder’s loan, if any, will
not be deductible for tax purposes.
The settlement is without prejudice to future changes in applicable South African tax legislation and does not relate to
any matter other than those in connection with the acquisition of the Group by Bain Capital. SARS has notified the
Group that it is reviewing certain other tax matters, none of which we believe are material to the Group.
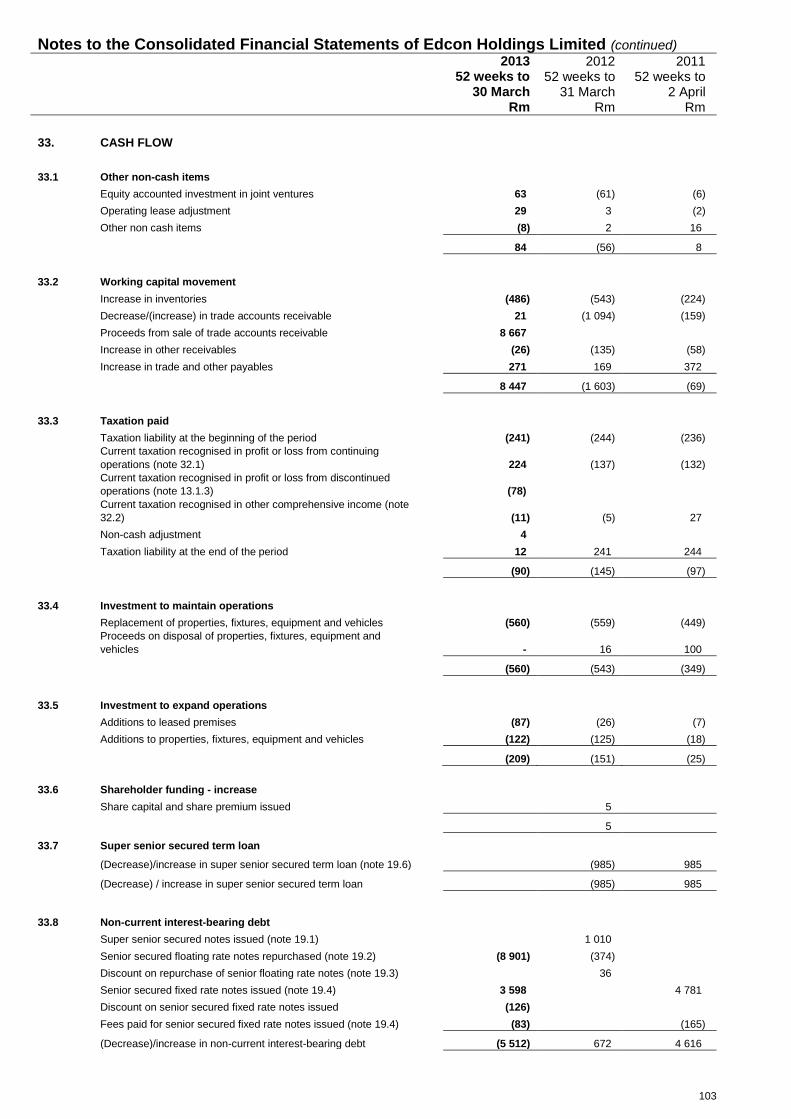
103
Notes to the Consolidated Financial Statements of Edcon Holdings Limited (continued)
2013 52 weeks to
30 March Rm
2012 52 weeks to
31 March Rm
2011 52 weeks to
2 April Rm
33. CASH FLOW
33.1 Other non-cash items
Equity accounted investment in joint ventures 63 (61) (6)
Operating lease adjustment 29 3 (2)
Other non cash items (8) 2 16
84 (56) 8
33.2 Working capital movement
Increase in inventories (486) (543) (224)
Decrease/(increase) in trade accounts receivable 21 (1 094) (159)
Proceeds from sale of trade accounts receivable 8 667
Increase in other receivables (26) (135) (58)
Increase in trade and other payables 271 169 372
8 447 (1 603) (69)
33.3 Taxation paid
Taxation liability at the beginning of the period (241) (244) (236)
Current taxation recognised in profit or loss from continuing
operations (note 32.1) 224 (137) (132)
Current taxation recognised in profit or loss from discontinued
operations (note 13.1.3) (78)
Current taxation recognised in other comprehensive income (note
32.2) (11)
(5)
27
Non-cash adjustment 4
Taxation liability at the end of the period 12 241 244
(90) (145) (97)
33.4 Investment to maintain operations
Replacement of properties, fixtures, equipment and vehicles (560) (559) (449)
Proceeds on disposal of properties, fixtures, equipment and
vehicles - 16 100
(560) (543) (349)
33.5 Investment to expand operations
Additions to leased premises (87) (26) (7)
Additions to properties, fixtures, equipment and vehicles (122) (125) (18)
(209) (151) (25)
33.6 Shareholder funding - increase
Share capital and share premium issued 5
5
33.7 Super senior secured term loan
(Decrease)/increase in super senior secured term loan (note 19.6) (985) 985
(Decrease) / increase in super senior secured term loan (985) 985
33.8 Non-current interest-bearing debt
Super senior secured notes issued (note 19.1) 1 010
Senior secured floating rate notes repurchased (note 19.2) (8 901) (374)
Discount on repurchase of senior floating rate notes (note 19.3) 36
Senior secured fixed rate notes issued (note 19.4) 3 598 4 781
Discount on senior secured fixed rate notes issued (126)
Fees paid for senior secured fixed rate notes issued (note 19.4) (83) (165)
(Decrease)/increase in non-current interest-bearing debt (5 512) 672 4 616

104
Notes to the Consolidated Financial Statements of Edcon Holdings Limited (continued)
2013 52 weeks to
30 March Rm
2012 52 weeks to
31 March Rm
2011 52 weeks to
2 April Rm
33. CASH FLOW (continued)
33.9 Settlement of derivatives
Settlement of derivatives (note 7.5) 1 021 (5 001)
33.10 Receivables-backed notes - (decrease)/increase
Receivables-backed notes issued (note 19.5 and 21) 1 400
Repurchase of receivables-backed notes (note 19.5) (4 300) (1 400)
(4 300) -
33.11 Current interest-bearing debt - increase/(decrease)
Current interest-bearing debt 705 751 (350)
705 751 (350)
33.12 Capitalised finance lease – (decrease)/increase
Capitalised finance lease (34) 4
(34) 4
33.13 Cash and cash equivalents – (decrease)/increase
Cash on hand 121 (1 105) 299
Cash on deposit (535) (127) 891
Currency adjustments (1) - 11
(415) (1 232) 1 201
34. FINANCIAL INSTRUMENTS BY CATEGORY
34.1
The accounting policies for financial instruments have been
applied to the line items below:
Financial assets by category
Loans and
receivables
Fair value through other
compre-hensive income
Fair value through profit or
loss Available -
for-sale Total
Rm Rm Rm Rm Rm
At 30 March 2013
Derivative financial instruments (note
36.8) 166 941 1 107
Trade receivables (note 10) 181 181
Sundry receivables and prepayments
(note 11) 455 455
Cash and equivalents (note 12) 669 669
1 305 166 941 2 412

105
Notes to the Consolidated Financial Statements of Edcon Holdings Limited (continued)
34.
FINANCIAL INSTRUMENTS BY CATEGORY (continued)
34.1 Financial assets by category (continued)
Loans and
receivables
Rm
Fair value
through other
comprehen-
sive income
Rm
Fair value
through profit
or loss
Rm
Available-
for sale
Rm
Total
Rm
At 31 March 2012
Derivative financial instruments (note
36.8) 472 472
Trade receivables (note 10) 10 002 10 002
Sundry receivables and prepayments
(note 11) 424 424
Cash and cash equivalents (note12) 1 083 1 083
11 509 472 11 981
At 2 April 2011
Derivative financial instrument (note
36.8) 30 30
Trade receivables (note 10) 8 853 8 853
Other receivables and prepayments
(note 11) 342 342
Cash and cash equivalents (note 12) 2 315 2 315
11 510 30 11 540
34.2 Financial liabilities by category
Financial
liabilities at
amortised
cost
Rm
Fair value
through
profit or loss
Rm
Fair value
through
other
compre-
hensive
income
Rm
Total
Rm
At 30 March 2013
Shareholder’s loan (note 18) 801 801
Interest-bearing debt (note 19 and 21) 20 593 20 593
Derivative financial instruments (note 36.8) 11 68 79
Deferred option premium (note 20) 305 305
Trade and other payables (note 23) 4 705 4 705
Finance lease (note 22.2) 313 313
26 717 11 68 26 796
At 31 March 2012
Shareholder’s loan (note 18) 659 659
Interest-bearing debt (note 19 and 21) 26 434 26 434
Derivative financial instruments (note 36.8) 860 860
Trade and other payables (note 23) 4 097 4 097
Finance lease (note 22.2) 329 329
31 519 860 32 379
At 2 April 2011
Shareholder’s loan (note 18) 8 184 8 184
Interest-bearing debt (note 19 and 21) 24 440 24 440
Derivative financial instruments (note 36.8) 120 1 134 1 254
Trade and other payables (note 23) 3 878 3 878
36 502 120 1 134 37 756

106
Notes to the Consolidated Financial Statements of Edcon Holdings Limited (continued)
35. MANAGEMENT OF CAPITAL
The Group considers share capital including ordinary and preference shares, share premium, the shareholder’s loan,
reserves and interest-bearing debt as capital.
The shareholder’s loan is considered to be capital as the amount is repayable in May 2037 and all notional interest is
capitalised. The “A” and “B” preference shares are cumulative and redeemable at the option of the issuer and are
therefore regarded as capital. The long-term interest-bearing debt primarily consists of:
Senior secured floating rate notes, maturing June 2014;
Senior floating rate notes, maturing June 2015;
Senior secured fixed rate notes, maturing March 2018; and
Super senior secured notes, maturing April 2016.
The senior secured floating rate notes and the senior floating rate notes were issued to finance the purchase of the
assets from Edgars Consolidated Stores Proprietary Limited and as such are regarded as permanent capital. The senior
secured fixed rate notes issued during the 2011 financial period and the super senior secured notes were issued to
finance the settlement of the negative mark-to-market positions on the foreign currency swap contracts, which hedged
the foreign currency exposure on the principal of the senior secured and the senior floating rate notes. The senior
secured fixed rate notes issued in the current period were used to repay a portion of the senior secured floating rate
notes. The senior secured term loan will be utilised to repay the remaining senior secured floating rate notes during the
2014 financial period.
The objectives in managing this capital are to:
Ensure appropriate access to equity debt markets.
Ensure sufficient resilience against economic turmoil.
Safeguard the Group’s ability to continue as a going concern, be flexible and take advantage of opportunities that
are expected to provide an adequate return to shareholders.
Optimise weighted average cost of capital, given inherent constraints.
The Group manages its capital and makes adjustments to it, in light of changes in economic conditions. No changes
were made in the objectives, policies or processes during the current period.
The notes and banking facilities contain substantially the same covenants and events of default, other than the senior
secured term loan which contains its own facility specific maintenance covenants. Covenants are set out in the Offering
Memorandum for the floating rate notes dated 8 June 2007, the Offering Memoranda for the senior secured fixed rate
notes dated 22 February 2011 and 8 February 2013 and the Program Memorandum for the super senior secured notes
dated 31 March 2011. During the period there have been no defaults.
The Group takes cognisance of select rating agency ratios that evaluate the ability of the capital to absorb losses and the
flexibility that a combination of capital instruments provide. The value placed on the corporate rating is important as the
Group has issued notes on the Irish Stock Exchange and the Johannesburg Securities Exchange.
36. FINANCIAL RISK MANAGEMENT
36.1 Treasury risk management
The Group’s activities expose it to a variety of financial risks: market risk (including currency risk, fair value interest rate
risk, cash flow interest rate risk and price risk), credit risk and liquidity risk. The Group’s overall risk management program
focuses on the unpredictability of financial markets and seeks to minimise potential adverse effects on the Group’s
financial performance. The Group uses derivative financial instruments to moderate certain risk exposures.

107
Notes to the Consolidated Financial Statements of Edcon Holdings Limited (continued) 36. FINANCIAL RISK MANAGEMENT (continued)
36.1 Treasury risk management (continued)
A treasury workgroup consisting of senior management meets on a regular basis to update treasury policies and
objectives, analyse currency and interest rate exposures and re-evaluate treasury management strategies against
revised economic forecasts. Compliance with Group Treasury policies and objectives of the Board and exposure limits is
reviewed at meetings of the Risk Management Workgroup.
36.2 Hedging strategy
The foreign denominated floating and fixed rate notes expose the Group to both interest rate risk and/or foreign
exchange risk. The Group has executed the following hedging strategy:
Euro Denominated Senior Secured Floating Rate Notes due 2014
From June 2007 to February 2011
A series of interest rate swaps were entered into at a swap rate of pay of 4.529% fixed, receive three months EURIBOR,
quarterly. Settlement dates match the quarterly payment dates for coupons on the notes up to 15 June 2011. The
transaction hedges the interest rate risk on the cash flows occurring during the first four years of the senior secured
floating rate notes (note 19) and was designated as a cash flow hedge.
A series of foreign currency forward contracts were entered into to buy EUR and sell ZAR corresponding to the EUR
scheduled payments on the fixed leg of the interest rate swap above at each payment date up to 15 June 2011.
Settlement dates match the payment dates of the interest rate swap. These foreign currency forward contracts therefore
hedge the EUR/ZAR currency risk on the combined cash flows of the interest rate swap and the first four years of
anticipated interest payments on the senior secured floating rate notes and were designated as a cash flow hedge.
A foreign currency swap was entered into to hedge the repayment of the €1,180 million principal on the senior secured
floating rate notes and matures on 15 June 2012. This swap was early-settled, and its mark-to-market position
extinguished, on 2 March 2011.
February 2011 onwards
Cross currency swaps were entered into which, (i) protect against interest rate variability in future interest cash flows on
liabilities, (ii) protect against variability in future interest cash flows that are subject to fluctuations based on foreign
exchange rates, and (iii) hedges the repayment of €963 million in principal on the notes to 15 March 2014 and €178
million to 15 June 2014. The hedges create an effective annual average fixed interest rate of 13.96% over the period of
cover. The cross currency swaps have been designated as a cash flow hedge up to 2 February 2013, when hedge
accounting was discontinued on the basis that it became highly probable that the underlying hedged transaction would
not occur. On 13 February 2013 cross currency swaps with a notional value of €754 million were terminated immediately
prior to the repurchase of the related amount of senior secured floating rate notes (note 19.2). The remaining cross
currency swap with a notional value of €387 million is hedging the outstanding principal at an effective annual interest
rate of 12.86%.
Euro Denominated Senior Floating Rate Notes due 2015
From June 2007 to February 2011
A series of interest rate swaps were entered into at a swap rate of pay of 4.529% fixed, receive three months EURIBOR,
quarterly. Settlement dates match the quarterly payment dates for coupons on the notes up to 15 June 2011. The
transaction hedges the interest rate risk on the cash flows occurring during the first four years of the senior floating rate
notes (note 19) and was designated as a cash flow hedge.

108
Notes to the Consolidated Financial Statements of Edcon Holdings Limited (continued)
36. FINANCIAL RISK MANAGEMENT (continued)
36.2 Hedging strategy (continued)
Euro Denominated Senior Floating Rate Notes due 2015 (continued)
From June 2007 to February 2011 (continued)
A series of foreign currency forward contracts were entered into to buy EUR and sell ZAR corresponding to the EUR
scheduled payments on the fixed leg of the interest rate swap above at each payment date. Settlement dates match the
payment dates of the interest rate swap. These foreign currency forward contracts hedge the EUR/ZAR currency risk on
the combined cash flows of the interest rate swap and the first four years of anticipated interest payments on the senior
floating rate notes and were designated as a cash flow hedge.
A foreign currency swap was entered into to economically hedge the repayment of the €378 million principal on the
senior floating rate notes and matures on 15 June 2012. This swap was early-settled, and its mark-to-market position
extinguished, on 2 March 2011.
From February 2011 onwards
Based on a notional value of €303 million, an interest rate swap was entered into at a swap rate of pay of 2.3437% fixed,
receive three months EURIBOR, quarterly. Settlement dates match the quarterly payment dates for coupons on the
notes up to 15 March 2014. The transaction hedges the interest rate risk on the cash flows occurring during the three
years of the senior floating rate notes (note 19) and have been designated as a cash flow hedge.
Based on a notional value of €303 million, a series of foreign currency forward contracts were entered into to buy EUR
and sell ZAR corresponding to the EUR scheduled payments on the fixed leg of the interest rate swap above at each
payment date up to 15 March 2014. Settlement dates match the payment dates of the interest rate swap. These foreign
currency forward contracts therefore hedge the EUR/ZAR currency risk on the combined cash flows of the interest rate
swap and the three years of anticipated interest payments on the senior floating rate notes and have been designated as
a cash flow hedge.
A cross currency swap was entered into which, (i) protects against interest rate variability in future interest cash flows on
liabilities, (ii) protects against variability in future interest cash flows that are subject to fluctuations based on foreign
exchange rates, and (iii) hedges the repayment of €75 million in principal on the notes to 15 March 2014. The hedges
create an effective annual average fixed interest rate of 17.29% over the period of cover. The cross currency swaps have
been designated as a cash flow hedge.
Euro Denominated Senior Secured Fixed Rate Notes due 2018
From February 2011 onwards
A series of cross currency swaps were entered into which protect against variability in future interest cash flows that are
subject to fluctuations based on foreign exchange rates. The notional value of the hedge is €317 million and provides
cover on the coupon of the notes up to 15 March 2014. The hedges create an effective annual average fixed interest rate
of 10.86% over the period of cover. The cross currency swaps have been designated as a cash flow hedge.
In December 2012 a series of foreign currency call options were entered into which hedge the repayment of €150 million
in principal on the notes to 31 March 2014. The premiums payable on the option contracts have been deferred to
between March and April 2014 (note 20). The foreign currency call options have not been designated as cash flow
hedges.
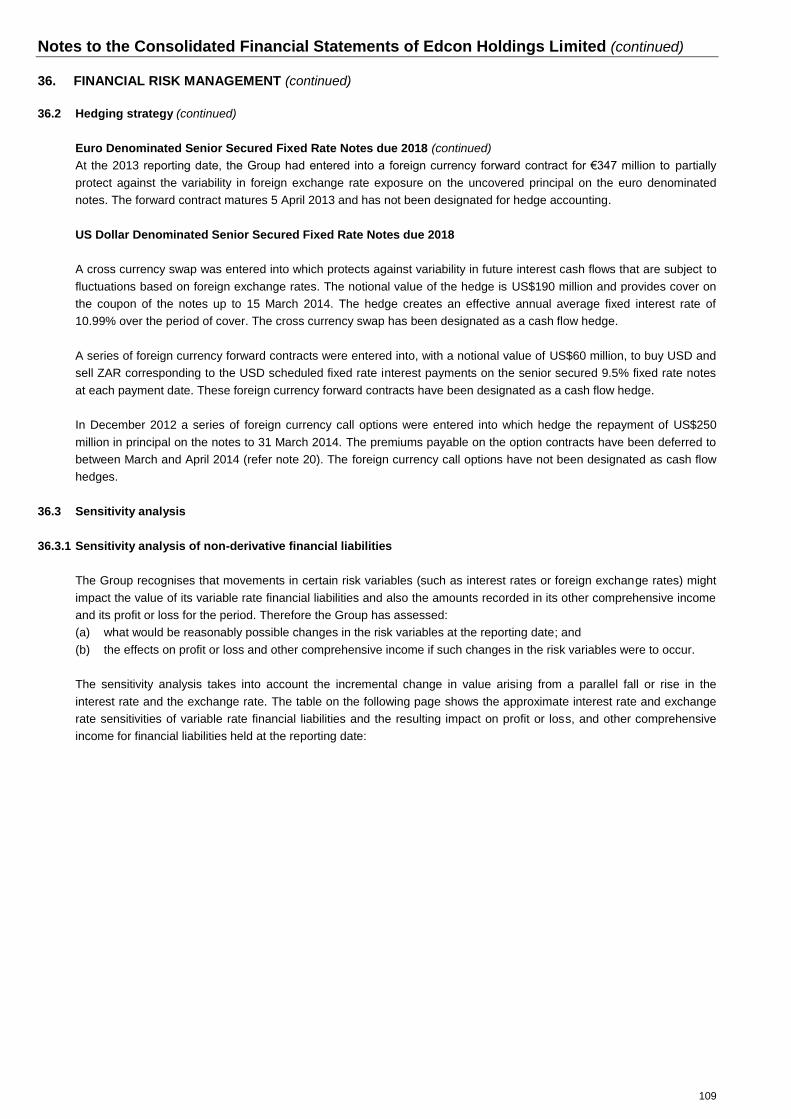
109
Notes to the Consolidated Financial Statements of Edcon Holdings Limited (continued)
36. FINANCIAL RISK MANAGEMENT (continued)
36.2 Hedging strategy (continued)
Euro Denominated Senior Secured Fixed Rate Notes due 2018 (continued)
At the 2013 reporting date, the Group had entered into a foreign currency forward contract for €347 million to partially
protect against the variability in foreign exchange rate exposure on the uncovered principal on the euro denominated
notes. The forward contract matures 5 April 2013 and has not been designated for hedge accounting.
US Dollar Denominated Senior Secured Fixed Rate Notes due 2018
A cross currency swap was entered into which protects against variability in future interest cash flows that are subject to
fluctuations based on foreign exchange rates. The notional value of the hedge is US$190 million and provides cover on
the coupon of the notes up to 15 March 2014. The hedge creates an effective annual average fixed interest rate of
10.99% over the period of cover. The cross currency swap has been designated as a cash flow hedge.
A series of foreign currency forward contracts were entered into, with a notional value of US$60 million, to buy USD and
sell ZAR corresponding to the USD scheduled fixed rate interest payments on the senior secured 9.5% fixed rate notes
at each payment date. These foreign currency forward contracts have been designated as a cash flow hedge.
In December 2012 a series of foreign currency call options were entered into which hedge the repayment of US$250
million in principal on the notes to 31 March 2014. The premiums payable on the option contracts have been deferred to
between March and April 2014 (refer note 20). The foreign currency call options have not been designated as cash flow
hedges.
36.3 Sensitivity analysis
36.3.1 Sensitivity analysis of non-derivative financial liabilities
The Group recognises that movements in certain risk variables (such as interest rates or foreign exchange rates) might
impact the value of its variable rate financial liabilities and also the amounts recorded in its other comprehensive income
and its profit or loss for the period. Therefore the Group has assessed:
(a) what would be reasonably possible changes in the risk variables at the reporting date; and
(b) the effects on profit or loss and other comprehensive income if such changes in the risk variables were to occur.
The sensitivity analysis takes into account the incremental change in value arising from a parallel fall or rise in the
interest rate and the exchange rate. The table on the following page shows the approximate interest rate and exchange
rate sensitivities of variable rate financial liabilities and the resulting impact on profit or loss, and other comprehensive
income for financial liabilities held at the reporting date:

110
Notes to the Consolidated Financial Statements of Edcon Holdings Limited (continued)
36. FINANCIAL RISK MANAGEMENT (continued) 36.3 Sensitivity analysis (continued) 36.3.1 Sensitivity analysis of non-derivative financial liabilities (continued)
30 March 2013
Floating rate liabilities
Index
Sensitivity
Other comprehensive
income Rm
Profit or loss effect Rm
ZAR denominated JIBAR -50bps 12
JIBAR +50bps (12)
EUR denominated
EUR-ZAR -10% 1 628
EUR-ZAR -5% 814 EUR-ZAR 5% (814)
EUR-ZAR 10% (1 628)
USD denominated
USD-ZAR -10% 229 USD-ZAR -5% 115
USD-ZAR 5% (115) USD-ZAR 10% (229)
31 March 2012
Floating rate liabilities
Index
Sensitivity
Other comprehensive
income Rm
Profit or loss effect Rm
ZAR denominated JIBAR -50bps 25
JIBAR +50bps (25)
EUR denominated
EUR-ZAR -10% 638
EUR-ZAR -5% 319 EUR-ZAR 5% (319) EUR-ZAR 10% (638)
USD denominated
USD-ZAR -10% 193 USD-ZAR -5% 96
USD-ZAR 5% (96) USD-ZAR 10% (193)
2 April 2011
Floating rate liabilities
Index
Sensitivity
Other comprehensive
income Rm
Profit or loss effect Rm
ZAR denominated JIBAR -50bps 26
JIBAR +50bps (26)
EUR denominated
EUR-ZAR -10% 1 789 EUR-ZAR -5% 894
EUR-ZAR 5% (894) EUR-ZAR 10% (1 789)
USD denominated
USD-ZAR -10% 167 USD-ZAR -5% 84
USD-ZAR 5% (84)
USD-ZAR 10% (167) The impact of changes in interest rates on profit or loss relating to the foreign denominated senior secured floating rate notes and the senior floating rate notes, after considering the effect of the hedging instruments which hedge the coupon payments, is nil (2012 and 2011: Nil).

111
Notes to the Consolidated Financial Statements of Edcon Holdings Limited (continued)
36. FINANCIAL RISK MANAGEMENT (continued)
36.3 Sensitivity analysis (continued) 36.3.2 Sensitivity analysis of derivatives
The Group recognises that movements in certain risk variables (such as interest rates or foreign exchange rates) might impact the value of its derivatives and also the amounts recorded in its other comprehensive income and its profit or loss for the period. Therefore the Group has assessed: (a) what would be reasonably possible changes in the risk variables at the reporting date; and (b) the effects on profit or loss and other comprehensive income if such changes in the risk variables were to occur. The sensitivity analysis takes into account the incremental change in value arising from a parallel fall or rise in the yield curve and the exchange rate. The table considers sensitivities to forward interest rate curves, of +/- 50 and +/-100 basis points respectively. If these sensitivities were to occur, the impact on the profit or loss, and other comprehensive income for each category of financial instrument held at the reporting date is shown below:
30 March 2013
Index Sensitivity
Derivative asset /
(liability)
Rm
Other
Comprehensive
income
Rm
Profit or
loss effect
Rm
Interest rate
swaps
EURIBOR -100bps (8) 8
EURIBOR -50bps (8) 8
EURIBOR +50bps 14 (14)
EURIBOR +100bps 27 (27)
Cross currency
swaps
EURIBOR -100bps (42) 7 35
EURIBOR -50bps (19) 3 16
EURIBOR +50bps 16 (3) (13)
EURIBOR +100bps 31 (5) (26)
Cross currency
swaps
EUR-ZAR -10% (599) 128 471
EUR-ZAR -5% (299) 64 235
EUR-ZAR 5% 299 (64) (235)
EUR-ZAR 10% 599 (128) (471)
Cross currency
swaps
USD-ZAR -10% (16) 16
USD-ZAR -5% (8) 8
USD-ZAR 5% 8 (8)
USD-ZAR 10% 16 (16)
EUR-ZAR -10% (78) 78
Foreign currency EUR-ZAR -5% (45) 45
call options EUR-ZAR 5% 57 (57)
EUR-ZAR 10% 124 (124)
USD-ZAR -10% (110) 110
Foreign currency USD-ZAR -5% (63) 63
call options USD-ZAR 5% 77 (77)
USD-ZAR 10% 166 (166)
Foreign currency
forward contracts
EUR-ZAR -10% (436) 27 409
EUR-ZAR -5% (218) 14 204
EUR-ZAR 5% 218 (14) (204)
EUR-ZAR 10% 436 (28) (408)
Foreign currency
forward contracts
USD-ZAR -10% (5) 5
USD-ZAR -5% (3) 3
USD-ZAR 5% 3 (3)
USD-ZAR 10% 5 (5)

112
Notes to the Consolidated Financial Statements of Edcon Holdings Limited (continued)
36. FINANCIAL RISK MANAGEMENT (continued)
36.3 Sensitivity analysis (continued)
36.3.2 Sensitivity analysis of derivatives (continued)
31 March 2012
Index Sensitivity
Derivative asset /
(liability)
Rm
Other
Comprehensive
income
Rm
Profit or
loss effect
Rm
Interest rate swaps
EURIBOR -100bps (56) 56
EURIBOR -50bps (27) 27
EURIBOR +50bps 27 (27)
EURIBOR +100bps 53 (53)
Cross currency
swaps
EURIBOR -100bps (220) 220
EURIBOR -50bps (103) 103
EURIBOR +50bps 102 (102)
EURIBOR +100bps 202 (202)
Cross currency
swaps
EUR-ZAR -10% (1 384) 1 384
EUR-ZAR -5% (692) 692
EUR-ZAR 5% 692 (692)
EUR-ZAR 10% 1 384 (1 384)
Cross currency
swaps
USD-ZAR -10% (27) 27
USD-ZAR -5% (14) 14
USD-ZAR 5% 14 (14)
USD-ZAR 10% 27 (27)
Foreign currency
forward contracts
EUR-ZAR -10% (45) 45
EUR-ZAR -5% (23) 23
EUR-ZAR 5% 23 (23)
EUR-ZAR 10% 46 (46)
Foreign currency
forward contracts
USD-ZAR -10% (8) 8
USD-ZAR -5% (4) 4
USD-ZAR 5% 4 (4)
USD-ZAR 10% 8 (8)
1.
The above table assumes all designated hedges will change in fair value through other comprehensive income.

113
Notes to the Consolidated Financial Statements of Edcon Holdings Limited (continued)
36. FINANCIAL RISK MANAGEMENT (continued)
36.3 Sensitivity analysis (continued)
36.3.2 Sensitivity analysis of derivatives (continued)
2 April 2011
Index Sensitivity
Derivative asset /
(liability)
Rm
Other
Comprehensive
income
Rm
Profit or
loss effect
Rm
Interest rate swaps
EURIBOR -100bps (76) 76
EURIBOR -50bps (38) 38
EURIBOR +50bps 37 (37)
EURIBOR +100bps 73 (73)
Cross currency
swaps
EURIBOR -100bps (312) 312
EURIBOR -50bps (154) 154
EURIBOR +50bps 151 (151)
EURIBOR +100bps 300 (300)
Cross currency
swaps
EUR-ZAR -10% (1 330) 1 330
EUR-ZAR -5% (665) 665
EUR-ZAR 5% 665 (665)
EUR-ZAR 10% 1 330 (1 330)
Cross currency
swaps
USD-ZAR -10% (36) 36
USD-ZAR -5% (18) 18
USD-ZAR 5% 18 (18)
USD-ZAR 10% 36 (36)
Foreign currency
forward contracts
EUR-ZAR -10% (86) 9 77
EUR-ZAR -5% (43) 4 39
EUR-ZAR 5% 43 (4) (39)
EUR-ZAR 10% 86 (9) (77)
Foreign currency
forward contracts
USD-ZAR -10% (10) 10
USD-ZAR -5% (5) 5
USD-ZAR 5% 5 (5)
USD-ZAR 10% 10 (10)
1.
The above table assumes all designated hedges will change in fair value through other comprehensive income.

114
Notes to the Consolidated Financial Statements of Edcon Holdings Limited (continued)
36. FINANCIAL RISK MANAGEMENT (continued)
36.4 Foreign currency management
Material foreign currency forward contracts, cross currency swaps and foreign currency call options at 30 March 2013
are summarised below. Foreign currency call options are only purchased as a cost-effective alternative to forward
exchange contracts.
Foreign
currency
Derivative
fair value
Contract
equivalent
Average
rate
m Rm Rm
Foreign currency exposure against Rand
hedged import forward orders
2013 US dollar 50 5 456 9.12
2012 US dollar 50 26 407 8.14
2011 US dollar 46 12 328 7.12
Foreign currency exposure against Rand
hedged notes
2013 Euro 733 9001 7 571 10.33
2012 Euro 1 682 (297)1 16 557 9.84
2011 Euro 1 882 (1 088)1 18 655 9.92
2013 US dollar 277 196 2 512 9.07
2012 US dollar 53 (8) 399 7.51
2011 US dollar 81 (55) 603 7.46
1 Included in the fair value are cross currency swaps of R648 million (2012: R224 million and 2011: R778 million) hedging the senior
secured floating rate notes, R115 million (2012: R24 million and 2011: R67 million) hedging the senior floating rate notes, which
also hedges the interest rate risk on the floating rate notes.
The Group, in terms of approved policy limits, manages short-term foreign currency exposures relating to trade
imports and exports. Net uncovered Rand transaction exposures to the US dollar at 30 March 2013 amounted to RNil
million (2012: RNil million and 2011: RNil million). The Group policy is to restrict the net aggregate cover to between
80% and 145% of total foreign order exposure.
At 30 March 2013, in respect of future import commitments, if the South African Rand had weakened 5% against the
US dollar, with all other variables held constant, profit or loss for the period would have increased by R20 million
(2012: R19 million and 2011: R15 million). Conversely at 30 March 2013, in respect of future import commitments, if
the South African Rand had strengthened by 5% against the US dollar, with all other variables held constant, profit or
loss for the period would have decreased by R20 million (2012: R19 million and 2011: R15 million). Changes in the
Rand/US dollar exchange rates of foreign currency creditors are largely offset by fair value changes on the forward
exchange contracts.
The principal on the floating rate notes up to a nominal of €462 million, have been hedged through cross currency
swaps. The principal on fixed rate notes up to a nominal value of €497 million and US$250 million, have been hedged
through a combination of foreign currency call options and a foreign currency forward contract (note 7). The interest
cash flows payable quarterly on the floating rate notes maturing 2014 and 2015, and interest payable semi-annually
for the €317 million, US$250 million and €300 million of senior secured fixed rate notes maturing in 2018, have been
hedged (note 7 and 36.2).
At 30 March 2013, in respect of the notes exposures, if the South African Rand had weakened 5% against the Euro
and US dollar, with all other variables held constant, profit or loss for the period would have decreased by R814
million (2012: R1 035 million and 2011: R977 million). Conversely, at 30 March 2013, in respect of the notes
exposures, if the South African Rand had strengthened 5% against other currencies, with all other variables held
constant, profit or loss for the period would have increased by R814 million (2012: R1 035 million and 2011: R977
million). Gains and losses on translation of the floating and fixed rate notes will be offset by foreign exchange gains
and losses on the cross currency swaps, foreign currency forward contracts and all foreign currency call options to
the extent hedges are in place.

115
Notes to the Consolidated Financial Statements of Edcon Holdings Limited (continued)
36. FINANCIAL RISK MANAGEMENT (continued)
36.5 Interest rate management
As part of the process of managing the Group's fixed and floating rate interest-bearing debt and cash and cash
equivalents mix, the interest rate characteristics of new and the refinancing of existing loans are positioned according to
expected movements in interest rates. The maximum interest rate exposure and the repricing profile is summarised as
follows:
Fixed Rate Floating Rate
Short-term
Rm
Long-term
Rm
Short-term
Rm
Long-term
Rm
30 March 2013
Interest-bearing debt 8 379 1 456 8 308
Rate % Refer to note 19 Refer to note 21 Refer to note 19
31 March 2012
Interest-bearing debt 4 781 2 901 17 656
Rate % Refer to note 19 Refer to note 21 Refer to note 19
Interest-bearing debt 4 781 20 150
2 April 2011
Rate % Refer to note 19
Refer to notes 19
and 21 Refer to note 19
At 30 March 2013, if all interest rates on local borrowings had been 100 basis points lower, with all other variables held
constant, profit or loss would have been R28 million (2012: R55 million and 2011: R45 million) higher. Conversely, at 30
March 2013, if all interest rates on local borrowings had been 100 basis points higher with all other variables held
constant, profit or loss would have been R28 million (2012: R55 million and 2011: R45 million million) lower.
At 30 March 2013, if all interest rates on interest-bearing trade receivables and short-term cash investments at that date
had been 100 basis points lower, with all other variables held constant, profit or loss would have been R18 million (2012:
R102 million and 2011: R101 million) lower. Conversely, at 30 March 2013, if all interest rates at that date had been 100
basis points higher, with all other variables held constant, the profit or loss would have been R18 million (2012: R102
million and 2011: R101 million) higher. This sensitivity is due to the high value of trade receivables attracting the Usury
rate interest income.

116
Notes to the Consolidated Financial Statements of Edcon Holdings Limited (continued)
36. FINANCIAL RISK MANAGEMENT (continued)
36.5 Interest rate management (continued)
Cash and cash equivalents are held as follows:
Total
Rm
Floating rate
Rm
2013
Cash and cash equivalents by currency
US dollar - -
Chinese Yuan Renminbi 5 5
Mozambican Metical 6 6
Bangladeshi Taka 1 1
Botswana Pula 26 26
Zambian Kwacha 1 1
South African Rand 630 630
2012
Cash and cash equivalents by currency
US dollar 6 6
Euro 1 1
Sterling 5 5
Botswana Pula 9 9
Zambian Kwacha 4 4
South African Rand 1 058 1 058
2011
Cash and cash equivalents by currency
US dollar 16 16
Euro 515 515
Sterling (4) (4)
Botswana Pula 46 46
South African Rand 1 742 1 742
The following interest rate swaps and cross currency swaps are in place to hedge against interest rate risk exposures:
Notes notional amount hedged
Rm
Notes fixed interest
% payable
Fair value of the
interest rate hedges
Rm
2013 2012 2011 2013 2012 2011 2013 2012 2011
Pay fixed / receive
floating interest rate
hedges > 1 year-
Senior secured
floating rate notes 3 698 10 890 11 259 12.86 13.96 13.981 648
2 224
2 854
2
Pay fixed / receive
floating interest rate
hedges > 1 year-
Senior floating rate
notes
Cross currency
swaps 714 714 714 17.29 17.29 17.291 115
2 24
2 67
2
Interest rate swaps 2 892 2 892 2 892 9.43 9.43 9.431 (68) (84) 6
Refer to note 36.2 for details of hedging strategy.
1Effective rate from 16 June 2011. There is still one payment due in June 2011 with an effective rate of 10.03% on the 2015 Senior floating rate notes and
7.78% on the 2014 Senior secured floating rate notes.
2Included in the fair value are cross currency swaps of R648 million (2012: R224 million and 2011: R778 million), hedging the Senior secured floating rate
notes and R115 million (2012: R24 million and 2011: R67 million), hedging the Senior floating rate notes, which also hedges the foreign currency risk on
the principle on the floating rate notes (note 36.4).

117
Notes to the Consolidated Financial Statements of Edcon Holdings Limited (continued)
36. FINANCIAL RISK MANAGEMENT (continued)
36.6 Credit risk management
Maximum exposure to credit risk is represented by the carrying amounts of derivative assets, trade accounts receivable
and assets held for sale and short-term cash investments in the Consolidated Statement of Financial Position. The
Group only deposits short-term cash surpluses with financial institutions of high-quality credit standing. Credit limits per
financial institution are established within the Group’s treasury policies and are approved by the Risk Management
Workgroup. Trade accounts receivable and the assets held for sale comprise a large, widespread customer base and
risk exists on delinquent accounts and possible defaults by customers. The Group performs ongoing credit evaluations
of the financial condition of customers. The granting of credit is controlled by application and behavioural scoring
models, and the assumptions therein are reviewed and updated on an ongoing basis.
At 30 March 2013, 31 March 2012 and 2 April 2011, the Group did not consider there to be any material concentration
of credit risk.
The derivatives are held with four counterparties of high credit worthiness. The credit worthiness is assessed on a
regular basis. At period end all counterparties were classified as investment grade.
36.7 Liquidity risk
2013
30 March
Rm
2012
31 March
Rm
2011
2 April
Rm
The Group has minimised risk of working capital illiquidity as
shown by its substantial banking facilities and reserve borrowing
capacity.
Total banking and loan facilities 3 967 7 605 7 605
Actual borrowings (notes 19 and 21) (1 456) (5 051) (4 300)
Unutilised borrowing facilities 2 511 2 554 3 305
Total banking and loan facilities of the Group comprise:
Revolving credit facility – Tranche A 650 6503
Revolving credit facility – Tranche B1 250 250 250
Revolving credit facility – Tranche B2 3 7171 2 217
2 2 217
4
OtC receivables-backed notes 4 300 4 300
Receivable purchase facility 43 43
OtC liquidity facility 145 145
3 967 7 605 7 605
¹Includes R2 700 million ancillary facilities.
2Includes R1 450 million ancillary facilities.
3Includes R350 million ancillary facilities.
4Includes R1 750 million ancillary facilities.
The maturity dates of the facilities are:
Revolving credit facility - Tranche A June 2012 June 2012
- Tranche B1 December 2013 December 2013 December 2013
- Tranche B2 March 2014 March 2014 March 2014
Revolving credit ancillary facilities
Reviewed
annually
Reviewed
annually
Reviewed
annually
OtC receivables-backed notes (note 19.5)
July 2012 to April
2017
July 2012 to April
2017
Receivables purchase facility April 2017 April 2017
OtC liquidity facility April 2017 April 2017

118
Notes to the Consolidated Financial Statements of Edcon Holdings Limited (continued)
36. FINANCIAL RISK MANAGEMENT (continued)
36.7 Liquidity risk (continued)
36.7.1 Maturity analysis of derivative financial instruments’ cash flows
2013
30 March
Rm
2012
31 March
Rm
2011
2 April
Rm
Cash outflows
Due within one year 10 152 2 561 2 580
Total due within one year 10 152 2 561 2 580
After one year but within two years 4 118 12 741 2 472
After two years but within three years 1 810 12 536
After three years but within four years 1 810
Total due after one year 4 118 14 551 16 818
Total 14 270 17 112 19 398
Cash inflows
Due within one year 10 920 1 326 1 443
Total due within one year 10 920 1 326 1 443
After one year but within two years 4 269 13 235 1 490
After two years but within three years 2 081 12 940
After three years but within four years 2 032
Total due after one year 4 269 15 316 16 462
Total 15 189 16 642 17 905
Net cash inflows/(outflows)
Due within one year 768 (1 235) (1 137)
Total due within one year 768 (1 235) (1 137)
After one year but within two years 151 494 (982)
After two years but within three years 271 404
After three years but within four years 222
Total due after one year 151 765 (356)
Total 919 (470) (1 493)
The maturity analysis of derivative financial instruments’ cash flows reflects the expected cash outflows and
inflows of the Group using undiscounted cash flows, settlement terms and expected movements in floating rates.
36.7.2 Maturity analysis of non-derivative financial liabilities (including interest payments)
Trade and other payables (note 23) 4 527 4 097 3 878
Deferred option premium (note 20) 36
Short-term interest-bearing debt (note 21) 3 268 4 709 1 799
Total due within one year 7 831 8 806 5 677
After one year but within two years 5 440 3 087 3 940
After two years but within three years 5 428 12 722 3 143
After three years but within four years 1 987 4 566 12 924
After four years but within five years 10 544 1 597 4 154
After 5 years 9 252 15 179 14 034
Total due after one year 32 651 37 151 38 195
Total debt 40 482 45 957 43 872

119
Notes to the Consolidated Financial Statements of Edcon Holdings Limited (continued)
36. FINANCIAL RISK MANAGEMENT (continued)
36.7 Liquidity risk (continued)
36.7.2 Maturity analysis of non-derivative financial liabilities (including interest payments) (continued)
The maturity analysis of non-derivative financial liabilities are prepared on an undiscounted cash flow basis. The
contractual maturity of the hedged coupon cash flows of the foreign denominated notes are calculated using
forward Euribor rates (where applicable) and the exchange of principal at the derivative hedged rate. In respect
of the cash flows that are not hedged, and subsequent to the hedge maturing, the period end floating interest
rates and foreign exchange rates are used to calculate the cash flows of the foreign denominated notes.
36.8 Fair value of financial instruments
The Group uses a three-level hierarchy to prioritise the inputs used in measuring fair value. The levels within the
hierarchy are described below with level 1 having the highest priority and level 3 having the lowest. Fair value is
principally applied to financial assets and financial liabilities. These are measured at fair value on a recurring
basis as of 30 March 2013, aggregated by the level in the fair value hierarchy within which these measurements
fall.
The following table presents the Group’s assets and liabilities that are measured at fair value at the period end:
Fair value measurement using
Total
Rm
Level 1 (a)
Rm
Level 2 (b)
Rm
Level 3 (c)
Rm
30 March 2013
Financial assets
Cross currency swaps 813 813
Foreign currency call options 292 292
Foreign currency forward contracts 2 2
Total financial assets 1 107 1 107
Financial liabilities
Interest rate swaps 68 68
Foreign currency forward contracts 11 11
Total financial liabilities 79 79
31 March 2012
Financial assets
Interest rate swaps 472 472
Total financial assets 472 472
Financial liabilities
Interest rate swaps 84 84
Foreign currency forward contracts 45 45
Cross currency swaps 731 731
Total financial liabilities 860 860
2 April 2011
Financial assets
Interest rate swaps 30 30
Total financial assets 30 30
Financial liabilities
Interest rate swaps 111 111
Foreign currency forward contracts 201 201
Foreign currency swaps 942 942
Total financial liabilities 1 254 1 254

120
Notes to the Consolidated Financial Statements of Edcon Holdings Limited (continued)
36. FINANCIAL RISK MANAGEMENT (continued)
36.8 Fair value of financial instruments (continued)
a) Level 1 - Based on quoted market prices in active markets.
b) Level 2 - Based on observable inputs other than Level 1 prices, such as quoted prices for similar financial assets or
financial liabilities, or other inputs that are observable or can be corroborated by observable market data for
substantially the full term of the financial assets or financial liabilities.
c) Level 3 - Based on unobservable inputs that are supported by little or no market activity and are financial instruments
whose value is determined using pricing models, discounted cash flow methodologies, or similar techniques, as well
as instruments for which the determination of fair value requires significant judgement or estimation.
All financial instruments have been recognised in the statement of financial position and there is no material difference
between their fair values and carrying values, except for the notes issued.
The following methods and assumptions were used by the Group in establishing fair values:
Liquid resources, trade accounts receivable and loans: the carrying amounts reported in the statement of financial
position approximate fair values due to the short period to maturity of these instruments.
Short-term interest-bearing debt: the fair values of the Group’s loans are estimated using discounted cash flow
analyses applying the RSA yield curve. The carrying amount of short-term borrowings approximates their fair value, due
to the short period to maturity of these instruments.
Notes issued: the notes issued are fair valued based on the exchange rate ruling at the reporting date. The market
values are disclosed in note 19 and have been determined based on the closing prices of the relevant stock exchange.
Derivative financial instruments: foreign currency forward exchange contracts are entered into to cover import orders,
and fair values are determined using foreign exchange market rates at 30 March 2013. Foreign currency forward
contracts, foreign currency call options, cross currency swaps and interest rate swaps are entered into to hedge interest
rate and foreign exchange rate exposure of interest-bearing debt and fair values are determined using market related
rates at 30 March 2013.
37. RELATED-PARTY TRANSACTIONS
The Consolidated Financial Statements include the financial statements of Edcon Holdings Limited and its subsidiaries
and equity accounted earnings. Related party relationships exist within the Group. During the period all purchasing and
selling transactions were concluded at arm’s length. Edcon Holdings Limited is the ultimate South African parent entity
and the ultimate parent of the Group is Edcon (BC) S.A.R.L. (“Bain Capital”). The following table provides the total
amount of transactions, which have been entered into with related parties:
2013
Fee paid to
related parties
Rm
Amounts owed to
related parties
Rm
Loan including interest to shareholder – recognised in
non-current liabilities
801
Loan including interest to shareholder – recognised in
equity 8 290
Fees paid to Bain Capital affiliate for consulting fees 241

121
Notes to the Consolidated Financial Statements of Edcon Holdings Limited (continued)
37. RELATED-PARTY TRANSACTIONS (continued)
2012
Paid to
related parties
Rm
Amounts owed to
related parties
Rm
Loan including interest to shareholder – recognised in
non-current liabilities
659
Loan including interest to shareholder – recognised in
equity
8 290
Fee paid to Bain Capital affiliate for consulting fees 134
2011
Paid to
related parties
Rm
Amounts owed to
related parties
Rm
Loan including interest to shareholder 8 184
Fee paid to Bain Capital affiliate for consulting fees 39
Transactions with joint ventures are detailed in note 6.
37.1 Compensation relating to key management
personnel
52 weeks to
30 March
2013
52 weeks to
31 March
2012
52 weeks to
2 April
2011
Total including
directors and
prescribed
officers
Rm
Total including
directors and
prescribed
officers
Rm
Total including
directors an
prescribed
officers
Rm
Remuneration 36 50 31
Retirement, medical, accident and death benefits 5 5 4
Relocation 2 2 2
Loyalty bonus 5 6 6
Performance bonus1 26 5
Other benefits 14 14 -
62 103 48
Comprising:
Short-term employee benefits 57 98 44
Post-employment benefits 5 5 4
1 The comparatives have been restated to include the performance bonus
accrued in the period.
2 Key management personnel includes directors and prescribed officers (note 30.2.1) and members of the Chief Executive’s Forum.

122
Notes to the Consolidated Financial Statements of Edcon Holdings Limited (continued)
38. EVENTS AFTER THE REPORTING PERIOD
Repayment of senior secured floating rate notes
On 20 May 2013, the Group completed the repurchase of all its senior secured floating rate notes at the face value of
€387 million. The repurchase was funded from the proceeds drawn from the senior secured term loan (refer note 19.7),
as well as net proceeds derived on termination of the derivative contracts that were hedging the exchange rate risk on
the notes repurchased.
RCF extension
On 17 May 2013, the Group received commitments of R 3 717 million from certain financial institutions to extend the
revolving credit facility from a maturity of 31 March 2014 at reporting date to 31 December 2016. The other terms of the
facility remain substantially the same (refer note 21).
Update to long term hedging strategy
In April 2013, a series of derivative contracts were entered into to increase the extent of hedge cover on the euro
denominated senior secured fixed rate notes:
Cross currency swaps was entered into which, (i) protects against interest rate variability in future interest cash
flows on liabilities, (ii) protects against variability in future interest cash flows that are subject to fluctuations based
on foreign exchange rates, and (iii) hedges the repayment of €230 million in principal and interest on the notes to
15 March 2015. The hedges create an effective annual average fixed interest rate of 15.55% over the period of
cover. The cross currency swaps have been designated as cash flow hedges.
A cross currency swap was entered into which protects against variability in future interest cash flows that are
subject to fluctuations based on foreign exchange rates. The notional value of the hedge is €70 million and
provides cover on the coupon of the notes up to 15 March 2015. The hedge creates an effective annual average
fixed interest rate of 10.2% over the period of cover. The cross currency swap has been designated as a cash flow
hedge.
Foreign currency call options were entered into which hedge the repayment of €237 million in principal on the
notes to 12 March 2015. The premiums payable on the foreign currency call options of R317 million have been
deferred to 13 March 2015. These options have not been designated as cash flow hedges.
Sale of trade accounts receivable
On 30 April 2013, we sold an additional R469 million of the South African trade receivables to Absa. We expect to
complete the sale of all the remaining eligible trade accounts receivables of R1 134 million, classified as held-for-sale
on the Consolidated Statement of Financial Position of Edcon Holdings Limited in the 2014 financial period (refer to
note 13).

123
Notes to the Consolidated Financial Statements of Edcon Holdings Limited (continued)
1 In November 2009, OtC issued R78 million of three-year receivables-backed notes to Edcon Limited. These notes matured on
31 October 2012 and accrued interest at applicable JIBAR plus a margin of 4.5% payable quarterly in arrears. Refer to note 19.5.
2013 30 March
Rm
2012 31 March
Rm
2011 2 April
Rm
39.
CONSOLIDATION OF ONTHECARDS INVESTMENTS II
PROPRIETARY LIMITED (OtC)
Included in the Consolidated Statement of Financial Position
by line are the following balances relating to the consolidation
of OtC:
ASSETS
Non-current assets
Intangible assets 79 79
Held-to-maturity investments (78)1
Loan-Edcon Limited (2 062) (2 062)
Deferred tax 53 117
Total non-current assets (1 930) (1 944)
Current assets
Held-to-maturity investments (78)1
Trade, other receivables and prepayments 5 708 5 646
Cash and cash equivalents 818 639
Total current assets 6 448 6 285
Total assets 4 518 4 341
EQUITY AND LIABILITIES
Equity attributable to shareholders
Retained profit/(loss) 33 (92)
Total equity 33 (92)
Non-current liabilities – third parties
Interest-bearing debt 2 150 4 300
Total non-current liabilities 2 150 4 300
Current liabilities
Interest-bearing debt 2 150
Trade and other payables 185 133
Total current liabilities 2 335 133
Total equity and liabilities 4 518 4 341
Total managed capital per IAS 1 4 333 4 208

124
Notes to the Consolidated Financial Statements of Edcon Holdings Limited (continued)
2013
52 weeks to 30 March
Rm
Re-presented 2012
52 weeks to 31 March
Rm
Re-presented 2011
52 weeks to 2 April
Rm
39.
CONSOLIDATION OF ONTHECARDS
INVESTMENTS II PROPRIETARY LIMITED (OtC)
(continued)
Included in the Consolidated Statement of Comprehensive
Income by line, are the following amounts relating to the
consolidation of OtC:
Continuing operations
Total revenues 66 33 29
Finance income(1)
66 33 29
Write off of intangible assets (79)
(Loss)/profit before financing costs (13) 33 29
Financing costs (259) (353) (398)
Loss before taxation (272) (320) (369)
Taxation 65 90 103
Loss for the period from continuing operations (207) (230) (266)
Discontinued operations
Profit for the period from discontinued operations 419 493 434
Taxation (112) (138) (120)
Profit for the period 100 125 48
1Comprises interest earned on cash balances.

125
Notes to the Consolidated Financial Statements of Edcon Holdings Limited (continued)
2013 52 weeks to
30 March Rm
Re-presented
2012 52 weeks to
31 March Rm
Re-presented
2011 52 weeks to
2 April Rm
39.
CONSOLIDATION OF ONTHECARDS INVESTMENTS II
PROPRIETARY LIMITED (OtC) (continued)
Included in the Consolidated Statement of Cash Flows by line, are
the following amounts relating to the consolidation of OtC:
Cash retained from operating activities
Loss before taxation from continuing operations (272) (320) (369)
Profit before taxation from discontinued operations 419 493 434
Finance income (66) (33) (29)
Financing costs 259 353 398
Write-off of intangible assets 79
Other non-cash items 29
Operating cash inflow before changes in working capital 419 493 463
Working capital movement 5 523 6 377
Trade accounts receivables 5 708 (62) 309
Trade and other payables (185) 68 68
Cash inflow from operating activities 5 942 499 840
Finance income received 66 33 29
Financing costs paid (259) (353) (398)
Dividends paid (133) - -
Taxation refund 6 - -
Net cash inflow from operating activities 5 622 179 471
Cash utilised in investing activities
Held-to-maturity investments (78)
Net cash outflow from investing activities (78)
Cash effects of financing activities
Proceeds from receivables-backed notes issued 1 400
Buy-back of receivables backed notes (4 300) (1 400)
Purchase of trade receivables (516)
Decrease in group company loans (2 062)
Net cash outflow from financing activities (6 362) (516)
(Decrease)/increase in cash and cash equivalents (818) 179 (45)
Cash and cash equivalents at the beginning of the period 818 639 684
Cash and cash equivalents at the end of the period 818 639

126
Company Annual Financial Statements
Edcon Holdings Limited
For the period ended 30 March 2013

127
Company Statement of Financial Position
Note
2013 30 March
Rm
2012 31 March
Rm
ASSETS
Non-current assets
Loans owing by subsidiary 1 7 057 6 519
Investment in subsidiaries 2 8 350 8 350
Investment in joint venture 3 367
Derivative financial instruments 4.1 35
Deferred tax 5 29 41
Total non-current assets 15 803 14 945
Current-assets
Loans owing by subsidiaries 6 3 174 3 174
Current taxation 4
Derivative financial instruments 4.2 115
Cash and cash equivalents 7 111 -
Total current assets 3 404 3 174
Total assets 19 207 18 119
EQUITY AND LIABILTIES
Equity attributable to shareholders
Share capital 8.7 - -
Share premium 8.7 2 973 2 973
Cash flow hedges 9 (74) (129)
Retained profit 2 357 2 084
Shareholder’s loan - equity 10 8 290 8 290
Total equity 13 546 13 218
Non-current liabilities – shareholder’s loan
Shareholder’s loan 10 801 659
Total equity and shareholder’s loan 14 347 13 877
Non-current liabilities – third parties
Interest-bearing debt 11 4 406 3 802
Derivative financial instruments 4.3 61
4 406 3 863
Total non-current liabilities 5 207 4 522
Current liabilities
Loans owing to subsidiaries 12 368 1
Current taxation 240
Derivative financial instruments 4.4 68 121
Sundry payables 13 18 17
Total current liabilities 454 379
Total equity and liabilities 19 207 18 119
Total managed capital per IAS 1 18 18 753 17 679

128
Company Statement of Comprehensive Income
Note
2013 52 weeks to
30 March Rm
2012 52 weeks to
31 March Rm
Total revenues 14 1 053 1 407
Derivative loss 4.6 - (5)
Foreign exchange loss 11.1 (471) (210)
Foreign exchange loss on notes issued 11.1 (587) (261)
Foreign exchange gain on cash flow hedge 11.1 116 51
Dividend income 111
Loss before interest received (360) (215)
Finance income 15.1 942 1 407
Profit before financing costs 582 1 192
Financing costs 15.2 (562) (1 161)
Profit before taxation 20 31
Taxation 16 253 (17)
Profit for the period 273 14
Other comprehensive income after tax:
Gain/(loss) on cash flow hedges 55 (45)
Other comprehensive income for the period, after tax 55 (45)
TOTAL COMPREHENSIVE INCOME FOR THE PERIOD 328 (31)
Profit attributable to:
Owners of the parent 273 14
Total comprehensive income attributable to:
Owners of the parent 328 (31)

129
Company Statement of Changes in Equity
Share capital
Rm
Share premium
Rm
Cash flow
hedging reserve
Rm
Retained profit
Rm
Share- holders
loan Rm
Total Rm
Balance at 2 April 2011 - 2 968 (84) 2 070 4 954
Profit for the period 14 14
Other comprehensive income for
the period
(45) (45)
Total comprehensive income (45) 14 (31)
Ordinary shares issued - -
Preferences shares issued - 5 5
Shareholder’s loan 8 290 8 290
Balance at 31 March 2012 - 2 973 (129) 2 084 8 290 13 218
Profit for the period 273 273
Other comprehensive income for
the period
55 55
Total comprehensive income 55 273 328
Balance at 30 March 2013 - 2 973 (74) 2 357 8 290 13 546
Note 8.7 8.7 9 10

130
Company Disclosure of Tax Effects on Other Comprehensive Income
Note
2013 52 weeks to
30 March Rm
2012
52 weeks to
31 March
Rm
Disclosure of tax effects relating to each component of other
comprehensive income:
Before tax amount
Cash flow hedges 76 (63)
Other comprehensive income for the period before tax 76 (63)
Tax (expense)/income
Cash flow hedges 9 (21) 18
Tax (expense)/income (21) 18
After tax amount
Cash flow hedges 55 (45)
Other comprehensive income for the period after tax 55 (45)

131
Company Statement of Cash Flows
Note
2013 52 weeks to
30 March Rm
2012
52 weeks to
31 March
Rm
Cash from operating activities
Profit before taxation 20 31
Finance income 15.1 (942) (1 407)
Financing costs 15.2 562 1 161
Foreign exchange loss 11.1 471 210
Derivative losses 4.6 - 5
Dividends received 14 (111)
Operating cash before changes in working capital - -
Decrease in sundry payables - (6)
Net cash outflow from operating activities - (6)
Finance income received 403 465
Financing costs paid (403) (455)
Taxation paid 17.1 - (9)
Net cash inflow/(outflow) - (5)
Cash effects of investing activities
Dividends received 17.2 111
Net cash inflow 111
Cash effects of financing activities
Increase in share capital and premium 5
Net cash inflow 5
Increase in cash and cash equivalents 17.3 111 -
Cash and cash equivalents at the beginning of the period - -
Cash and cash equivalents at the end of the period 111 -

132
Notes to the Company Financial Statements 2013
30 March
Rm
2012
31 March
Rm
1.
NON-CURRENT LOANS OWING BY SUBSIDIARY
Interest-free loan owing by Edcon Limited, shareholder’s loan advanced 581 477
Interest-bearing loan owing by Edcon Limited 6 476 6 042
7 057 6 519
The interest-free loan with Edcon Limited comprises:
Principal at beginning of the period 477 6 859
Loan recognised in investments in subsidiaries (note 2) (6 382)
Notional interest charged 104 -
Principal at the end of the period 581 477
Loan recognised in investments in subsidiaries (note 2) 6 382 6 382
Total principal loan at the end of the period 6 963 6 859
Total principal loan at the end of the period excluding notional interest 6 859 6 859
The interest-bearing loan with Edcon Limited comprises:
Principal at beginning of the period 6 042 5 100
Interest capitalised during the period 657 970
Settlement during the period (223) (28)
Principal at the end of the period 6 476 6 042
Total principal loans owing by Edcon Limited 13 335 12 901
In June 2007, the Company advanced R5 057 million from the proceeds of the initial shareholder’s loan from Edcon
(BC) S.A.R.L. to Edcon Limited. Interest accrued daily at prime plus 2.25% p.a. up to and including 7 February 2012.
From 7 February 2012, the terms of the loan were changed and the loan accrued interest of 0% as from that date up to
and including the date of repayment. The loan is repayable by no later than 25 May 2037. As a result of the change to
the terms of the loan, R6 859 million was derecognised on that date and R6 382 million recognised in investments in
subsidiaries and R477 million in non-current assets in accordance with the principles of IAS 39.
The proceeds raised of R6 250 million on the issuance of the senior floating rate notes were advanced to Edcon
Limited on 1 June 2007. Interest accrues on the outstanding amount as agreed between the parties from time to time
but shall at least be equal to the aggregate of the following:
a) interest incurred by the lender;
b) foreign exchange differences incurred by or accrued to the lender;
c) any amounts incurred by or accrued to the lender in respect of interest rate agreement or option contracts that are
taken out by the lender as hedging arrangements in relation to the debt; and
d) a 25 point basis premium to the amounts in a) to c) above.
The interest, as set out in a) to c) above, is payable 5 business days prior to the date that the corresponding amounts
fall due by the lender. The interest, as set out in d) above is payable 5 business days after payment by the lender. The
lender pays interest quarterly in arrears. The principal amount becomes due on the day it becomes payable by the
lender, i.e. the note matures on 15 June 2015.
To the extent required to maintain the solvency of Edcon Limited, these loans are subordinated to the claims of all of
the creditors of Edcon Limited.

133
Notes to the Company Financial Statements (continued)
2013
30 March
Rm
2012
31 March
Rm
2. INVESTMENT IN SUBSIDIARIES
100% holding in Edcon Acquisition Proprietary Limited 1 968 1 968
Loan advanced to Edcon Limited recognised in investments (note 1) 6 382 6 382
Total investment in subsidiaries 8 350 8 350
3. INVESTMENT IN JOINT VENTURE
Hollard Business Partners Proprietary Limited (HBP) 367
367
On 2 January 2013 Edcon Limited sold the HBP shares to the Company for R367
million. A loan was created against the Company on that date in favour of Edcon
Limited (note 12).
4. DERIVATIVE FINANCIAL INSTRUMENTS
4.1 Non-current derivative assets
Cross currency swaps 35
35
4.2 Current derivative assets
Cross currency swaps 115
115
4.3 Non-current derivative liabilities
Interest rate swaps (43)
Foreign currency forward contracts (18)
(61)
4.4 Current derivative liabilities
Cross currency swaps (60)
Interest rate swaps (68) (40)
Foreign currency forward contracts - (21)
(68) (121)
4.5 Total derivatives
Cross currency swaps liability 115 (25)
Interest rate swaps liability (68) (83)
Foreign currency forward contracts liability - (39)
47 (147)
Credit risk valuation adjustments
Cross currency swaps 1 (5)
Interest rate swaps (4) (9)
Foreign currency forward contracts - (4)
(3) (18)
Total derivatives before credit risk valuation adjustments
Cross currency swaps liability 116 (30)
Interest rate swaps liability (72) (92)
Foreign currency forward contracts liability - (43)
44 (165)
4.6 Derivative losses - (5)

134
Notes to the Company Financial Statements (continued)
2013
30 March
Rm
2012
31 March
Rm
5. DEFERRED TAXATION
Balance at the beginning of the period – deferred tax asset 41 34
Deferred tax expense in profit or loss (note 16.1 and note 16.3) (1) (17)
Cash flow hedges (note 16.2) (11) 24
Balance at the end of the period – deferred tax asset 29 41
Comprising:
Fair value loss on interest rate hedges 29 41
Deferred tax asset 29 41
6. CURRENT LOANS OWING BY SUBSIDIARIES
Edcon Limited 820 820
Edgars Consolidated Stores Proprietary Limited 2 354 2 354
3 174 3 174
The loans are interest-free and payable on demand by the lender Edcon Holdings
Limited.
7. CASH AND CASH EQUIVALENTS
Cash on deposit 111 -
111 -
8. SHARE CAPITAL AND PREMIUM
8.1 Authorised ordinary share capital
1 000 000 000 “A “ordinary shares with a par value of R0.00001 each - -
100 000 000 “B” ordinary shares with a par value of R0.00001 each - -
1 000 000 000 “C” ordinary shares with a par value of R0.00001 each - -
1 000 000 000 “D” ordinary shares with a par value of R0.00001 each - -
1 000 000 000 “E” ordinary shares with a par value of R0.00001 each - -
- -
8.2 Authorised preference share capital
1 000 000 000 “A” preference shares of R0.00001 each - -
1 000 000 000 “B” preference shares of R0.00001 each - -
- -
8.3 Number of ordinary shares in issue
2013
30 March
Number
2012
31 March
Number
Number of ordinary shares in issue comprise:
A ordinary shares issued 500 133 500 133
B ordinary shares issued 69 213 69 213
C ordinary shares issued 21 414 21 414
D ordinary shares issued 21 414 21 414
E ordinary shares issued 21 414 21 414
633 588 633 588

135
Notes to the Company Financial Statements (continued)
2013
30 March
Rm
2012
31 March
Rm
8.
SHARE CAPITAL AND PREMIUM (continued)
8.4 Number of preference shares in issue
“A” preference shares of R0.00001 each 200 866 200 866
“B” preference shares of R0.00001 each 55 841 55 841
256 707 256 707
8.5 Voting rights of ordinary and preference shares
Each “A” Ordinary Share shall entitle the holder thereof to 1 000 votes on all
matters upon which shareholders have the right to vote.
Each “A” redeemable cumulative preference Share shall not entitle the holders
thereof to receive notice of or to attend or vote at any general meeting of the
Company save in the circumstances prescribed by the Companies Act of South
Africa.
The total “B” Ordinary Shares at any time shall, in aggregate, have the right to
exercise such number of votes as is equal to 10.6% of the aggregate voting
rights of the total “A” Ordinary Shares then in issue.
Each “B” redeemable cumulative preference Share shall not entitle the holders
thereof to receive notice of or to attend or vote at any general meeting of the
Company, save in the circumstances prescribed by the Companies Act of South
Africa.
Each “C”, “D” and “E” Ordinary Share shall entitle the holder thereof to one vote
on all matters upon which shareholders have the right to vote.
8.6 Redemption of Preference Shares
The “A” and “B” Preference Shares may not be redeemed within three years
and one day of their date of issue and will thereafter be redeemed at a date
fixed by the Company.
The Company shall pay to the member, all monies payable in respect of the
redemption of such “A” and “B” Preference Shares as calculated in
accordance with the provisions of the articles of the Company.
The “A” and “B” Preference Shares shall not confer on the holders thereof
any further rights to participate in the profits or assets of the Company.
8.7 Issued share capital and premium
Balance at the beginning of the period 2 973 2 968
Ordinary shares issued – share capital -
Preference shares issued – share capital -
Preference shares issued – share premium 5
Balance at the end of the period 2 973 2 973
Comprising:
Share capital - -
Share premium 2 973 2 973
2 973 2 973
During the prior financial period the Company issued 4 258 “B” preference
shares with a par value of R0.00001, at a premium of R1 174 per share, and 1
414 “C”, “D” and “E” ordinary shares with a par value of R0.00001 each, at par
value.

136
Notes to the Company Financial Statements (continued)
2013
30 March
Rm
2012
31 March
Rm
9. CASH FLOW HEDGING RESERVE
Balance at the beginning of the period – net of tax (129) (84)
Movements
Cash flow hedges recognised in other comprehensive income 40 (126)
Ineffective portion of cash flow hedges, released to derivative losses as hedge
ineffectiveness - 5
Cash flow hedges released to financing costs 152 109
Cash flow hedges released to foreign exchange gain (116) (51)
Tax impact of cash flow hedges (note 16.2) (21) 18
Balance at the end of the period (74) (129)
Comprising
Cash flow hedges net of tax (74) (129)
The foreign denominated floating rate notes expose the Company to both
interest rate risk and foreign exchange risk. Derivative instruments have been
executed to limit the exposure to both interest rate risk and foreign exchange
risk. These derivative instruments have been designated as a cash flow hedge.
Refer to note 19.2 for details of the hedging strategy.
10. SHAREHOLDER’S LOAN
Loan recognised in equity 8 290 8 290
Loan recognised in non-current liabilities 801 659
Loan by Edcon (BC) S.A.R.L. 9 091 8 949
Comprising:
Principal at the beginning of the period 8 949 8 184
Interest capitalised during the period 765
Notional interest charged for the period 142
Loan derecognised (8 949)
Loan recognised in equity 8 290
Loan recognised in non-current liabilities 659
Principal at the end of the period 9 091 8 949
Principal at the end of the period excluding notional interest 8 949 8 949
In June 2007 the parent company, Edcon (BC) S.A.R.L., provided a shareholder
loan for R5 057 million as proceeds of capital investment into the Company.
The loan is denominated in South African Rands and accrued interest at the
South African prime rate plus 2% p.a. up to and including 7 February 2012.
Thereafter, no interest will accrue up to and including the date of repayment. The
principal is repayable in May 2037.
As a result of the loan being interest-free, the terms of the loan are substantially
different and it was necessary to derecognise the loan in terms of IAS 39.
Applying initial measurement in terms of IAS 39, resulted in R8 290 million being
recognised in equity and R659 million being recognised in non-current liabilities.
This shareholder’s loan is regarded as capital for IAS 1 purposes (note 18). To
the extent required to maintain the solvency of the Edcon Holdings Limited
Group, the shareholder’s loan is subordinated to the claims of all of the creditors
of the Edcon Holdings Limited Group.

137
Notes to the Company Financial Statements (continued)
2013
30 March
Rm
2012
31 March
Rm
11. NON-CURRENT INTEREST-BEARING DEBT
Senior floating rate notes issued 3 606 3 606
Foreign currency on senior floating rate notes 846 259
Fees capitalised on senior floating rate notes (46) (63)
4 406 3 802
11.1 Reconciliation of non-current interest-bearing debt:
Balance at the beginning of the period 3 802 3 527
Foreign currency movement on senior floating rate notes 587 261
Fees amortised on senior floating rate notes 17 14
Balance at the end of the period 4 406 3 802
Foreign exchange loss on notes issued (587) (261)
Release from other comprehensive income 116 51
Total (471) (210)
Fees amortised recognised in financing costs (note 15.2) 17 14
The senior floating notes of €378 million are issued by the Company and
guaranteed on a senior subordinated basis and secured by a third ranking
pledge of the proceeds of the loan between the Company and Edcon
Limited. Interest is payable quarterly in arrears at a rate of three month
EURIBOR, reset quarterly, plus 5.5%. The notes mature on 15 June 2015.
There have been no defaults or breaches of the principal or interest during
the period. The market value of the senior floating rate notes at 30 March
2013 was R4 059 million (2012: R3 200 million).
12. CURRENT LOANS OWING TO SUBSIDIARIES
Edcon Acquisition Proprietary Limited 1 1
Edcon Limited 367
368 1
On 2 January 2013, a loan was granted to the Company by Edcon Limited
for the purchase of the HBP shares sold by Edcon Limited to the Company.
The loan bears interest at a rate determined by the board of the Company
(currently 0%) and is repayable as cash is available. The Company shall
utilise any distributions received on or disposed of the HBP shares towards
repayment of the loan.
The loan with Edcon Acquisition Proprietary Limited is interest-free and
payable on demand.
13. SUNDRY PAYABLES
Sundry payables - -
Interest accrued on senior floating notes 18 17
18 17
The sundry payables are interest-free and mature no later than one year.
Interest accrued is settled quarterly.

138
Notes to the Company Financial Statements (continued)
2013 52 weeks to
30 March Rm
2012 52 weeks to
31 March Rm
14. TOTAL REVENUES Finance income 942 1 407
Dividends received 111
1 053 1 407
15. FINANCE INCOME AND FINANCE COSTS
15.1 Finance income
Interest received from subsidiaries 942 1 407
942 1 407
15.2 Finance costs
Interest on shareholder’s loan 765
Notional interest on shareholder’s loan 142
Interest on senior notes 403 382
Fees amortised on senior floating rate notes 17 14
562 1 161
16. TAXATION
16.1 Taxation income/(expense)
Current taxation this period 10 5
Current taxation prior period 244 (5)
Total current tax income 254 -
Deferred taxation this period - (17)
Deferred taxation prior period (1)
Total deferred taxation expense (1) (17)
Total 253 (17)
Comprising:
South African normal taxation income/(expense) 253 (17)
16.2 Taxation charge to other comprehensive income
Current income tax related to items charged or credited
directly to other comprehensive income:
Unrealised gain on cash flow hedges 10 6
Deferred income tax related to items charged or credited
directly to other comprehensive income:
Unrealised gain/(loss) on cash flow hedges 11 (24)
Income tax expense reported in other comprehensive income 21 (18)
16.3 Deferred income tax comprises
Interest rate swaps (1)
Other payables -
Cash flow hedges 18
Net deferred tax expense 17
Prior year adjustment - -
Net deferred tax expense - 17

139
Notes to the Company Financial Statements (continued)
2013 52 weeks to
30 March Rm
2012 52 weeks to
31 March Rm
16. TAXATION (continued)
16.4 Reconciliation of rate of taxation (%) % %
Standard rate – South Africa 28 28
Adjusted for:
Non-taxable income (301)
Disallowable expenditure 223 11
Prior year (1 215) 16
Effective tax rate (1 265) 55
16.5 Tax settlement
On 31 August 2012, the South African Revenue Service (“SARS”) notified us
that it was considering the issuance of an income tax assessment primarily in
connection with our tax treatment of interest payable on the financing of the
acquisition of the Group by Bain Capital. We challenged SARS’s position and
we believe that we were in compliance with applicable South African tax laws
and regulations. Nevertheless, we perceived it to be beneficial to engage in
settlement discussions and we entered into a settlement agreement with
SARS in relation to the matters in dispute on 14 December 2012 in order to
avoid protracted litigation with SARS.
The agreement addresses the tax treatment of the issues in dispute for
financial periods since the acquisition of the Group by Bain Capital, being
financial periods 2008 through 2013, as well as future financial periods and in
relation to both Edcon Holdings Limited and Edcon Limited. The terms of the
agreement cannot be bifurcated between both companies and needs to be
viewed holistically.
17.
CASH FLOW
17.1 Taxation paid
Taxation liability at the beginning of the period (240) (243)
Current taxation recognised in profit or loss 254 -
Current taxation provided in other comprehensive income (10) (6)
Taxation (asset)/liability at the end of the period (4) 240
- (9)
17.2 Dividends received 111
17.3 Increase in cash and cash equivalents
Cash on deposit 111 -
111 -

140
Notes to the Company Financial Statements (continued)
18. MANAGEMENT OF CAPITAL
The Company considers share capital including ordinary and preference shares, share premium, the shareholder’s loan
and interest-bearing debt as capital.
The shareholder’s loan is repayable in May 2037. The “A” and “B” preference shares are cumulative and redeemable at
the option of the issuer and are therefore regarded as capital. Long-term interest-bearing debt consists of the senior
floating rate notes which have a maturity of June 2015. These notes were issued to finance the purchase of Edgars
Consolidated Stores Proprietary Limited and as such are regarded as permanent capital.
The objectives in managing this capital are to:
— Ensure appropriate access to other comprehensive income debt markets.
— Ensure sufficient resilience against economic turmoil.
— Safeguard the Company’s ability to continue as a going concern, be flexible and take advantage of opportunities that
are expected to provide an adequate return to shareholders.
— Optimise weighted average cost of capital, given inherent constraints.
The Company manages its capital and makes adjustments to it in light of the changes in economic conditions. No
changes were made in the objectives, policies or processes during the current period. The notes contain substantially the
same covenants and events of default as set out in the Offering Memorandum for the notes dated 8 June 2007. During
the period there have been no defaults.
The Company takes cognisance of select rating agency ratios that evaluate the ability of the capital to absorb losses and
the flexibility that a combination of capital instruments provide. The value placed on the corporate rating is important as
the Company has issued notes on the Irish Stock Exchange to facilitate funding.
19. FINANCIAL RISK MANAGEMENT
19.1 Treasury risk management
The Company’s activities expose it to a variety of financial risks: market risk (including currency risk, fair value interest
rate risk, cash flow interest rate risk and price risk), credit risk and liquidity risk. The Company’s overall risk
management program focuses on the unpredictability of financial markets and seeks to minimise potential adverse
effect on the Company’s financial performance. The Company uses derivative financial instruments to moderate
certain risk exposures.
A treasury workgroup consisting of senior management meets on a regular basis to update treasury policies and
objectives, analyse currency and interest rate exposures and re-evaluate treasury management strategies against
revised economic forecasts. Compliance with Company Treasury policies and objectives of the Board and exposure
limits is reviewed at meetings of the Risk Management Workgroup.
19.2 Hedging strategy
Euro Denominated Senior Floating Rate Notes due 2015
Based on a notional value of €303 million, an interest rate swap was entered into at a swap rate of pay 2.3437% fixed;
receive three months EURIBOR, quarterly. Settlement dates match the quarterly payment dates for coupons on the
notes up to 15 March 2014. The transaction hedges the interest rate risk on the cash flows occurring during three
years of the senior floating rate notes (note 11) and have been designated as a cash flow hedge.
Based on a notional value of €303 million, a series of foreign currency forward contracts were entered to buy EUR and
sell ZAR corresponding to the EUR scheduled payments on the fixed leg of the interest rate swap above at each
payment date up to 15 March 2014. Settlement dates match the payment dates of the interest rate swap. These
foreign currency forward contracts therefore hedge the EUR/ZAR currency risk on the combined cash flows of the
interest rate swap and three years of anticipated interest payments on the senior floating rate notes and have been
designated as a cash flow hedge.
A cross currency swap was entered which, (i) protects against interest rate variability in future interest cash flows on
liabilities, (ii) protects against variability in future interest cash flows that are subject to fluctuations based on foreign
exchange rates, and (iii) hedges the repayment of €75 million in principal on the notes to 15 March 2014. The hedges
create an effective annual fixed interest rate of 17.29% over the period of cover. The cross currency swaps have been
designated as a cash flow hedge.

141
Notes to the Company Financial Statements (continued)
19. FINANCIAL RISK MANAGEMENT (continued)
19.3.1 Sensitivity analysis of non-derivative financial liabilities
The Company recognises that movements in certain risk variables (such as interest rates or foreign exchange rates)
might impact the value of its variable rate financial liabilities and also the amounts recorded in its other comprehensive
income and its profit or loss for the period. Therefore the Company has assessed:
a) what would be reasonably possible changes in the risk variables at the reporting date; and
b) the effects on profit or loss and other comprehensive income if such changes in the risk variables were to occur.
The sensitivity analysis takes into account the incremental change in value arising from a parallel fall or rise in the
interest rate and the exchange rate. The following table shows the approximate interest rate and exchange rate
sensitivities of variable rate financial liabilities and the resulting impact on profit or loss, and other comprehensive
income for financial liabilities held at the reporting date:
30 March 2013
Floating rate liabilities
Index
Sensitivity
Other
comprehensive
income
Rm
Profit or
loss effect
Rm
EUR denominated
EUR-ZAR -10% 445
EUR-ZAR -5% 223
EUR-ZAR 5% (223)
EUR-ZAR 10% (445)
31 March 2012
Floating rate liabilities
Index
Sensitivity
Other
comprehensive
income
Rm
Profit or
loss effect
Rm
EUR denominated
EUR-ZAR -10% 312
EUR-ZAR -5% 156
EUR-ZAR 5% (156)
EUR-ZAR 10% (312)
The impact of changes in interest rates on profit or loss relating to the foreign denominated senior floating rate notes,
after considering the effect of the hedging instruments which hedge the coupon payments, is nil.
19.3.2 Sensitivity analysis of derivatives
The Company recognises that movements in certain risk variables (such as interest rates or foreign exchange rates)
might impact the value of its derivatives and also the amounts recorded in its other comprehensive income and its
profit or loss for the period. Therefore the Company has assessed:
a ) what would be reasonably possible changes in the risk variables at the reporting date; and
b) the effects on profit or loss and other comprehensive income if such changes in the risk variables were to
occur.
The sensitivity analysis takes into account the incremental change in value arising from a parallel fall or rise in the
yield curve and the exchange rate. The following table assumes all designated hedges will change in fair value
through other comprehensive income (100% effective), and considers sensitivities to forward interest rate curves, of
+/- 50 and +/-100 basis points respectively. If these sensitivities were to occur, the impact on profit or loss, and
other comprehensive income for each category of financial instrument held at the reporting date is shown on the
following page:

142
Notes to the Company Financial Statements (continued)
19.
FINANCIAL RISK MANAGEMENT (continued)
19.3.2 Sensitivity analysis of derivatives (continued)
31 March 2013
Index
Sensitivity
Derivative
asset/
(liability)
Rm
Other
comprehen-
sive income
Rm
Profit or loss
effect
Rm
Interest rate swaps
EURIBOR -100bps (8) 8
EURIBOR -50bps (8) 8
EURIBOR +50bps 13 (13)
EURIBOR +100bps 27 (27)
Cross currency
swaps
EURIBOR -100bps (7) 7
EURIBOR -50bps (3) 3
EURIBOR +50bps 3 (3)
EURIBOR +100bps 5 (5)
Cross currency
swaps
EUR-ZAR -10% (93) 93
EUR-ZAR -5% (46) 46
EUR-ZAR 5% 46 (46)
EUR-ZAR 10% 93 (93)
Foreign currency
forward contracts
EUR-ZAR -10% (27) 27
EUR-ZAR -5% (14) 14
EUR-ZAR 5% 14 (14)
EUR-ZAR 10% 28 (28)
30 March 2012
Index
Sensitivity
Derivative
asset /
(liability)
Rm
Other
comprehen-
sive income
Rm
Profit or loss
effect
Rm
Interest rate swaps
EURIBOR -100bps (56) 56
EURIBOR -50bps (27) 27
EURIBOR +50bps 27 (27)
EURIBOR +100bps 53 (53)
Cross currency
swaps
EURIBOR -100bps (13) 13
EURIBOR -50bps (6) 6
EURIBOR +50bps 6 (6)
EURIBOR +100bps 12 (12)
Cross currency
swaps
EUR-ZAR -10% (85) 85
EUR-ZAR -5% (42) 42
EUR-ZAR 5% 42 (42)
EUR-ZAR 10% 85 (85)
Foreign currency
forward contracts
EUR-ZAR -10% (45) 45
EUR-ZAR -5% (23) 23
EUR-ZAR 5% 23 (23)
EUR-ZAR 10% 46 (46)

143
Notes to the Company Financial Statements (continued)
19.
FINANCIAL RISK MANAGEMENT (continued)
19.4
Foreign currency management
Material forward exchange contracts at 30 March 2013 are summarised below. Currency options are only purchased as a
cost-effective alternative to forward exchange contracts. Currently no currency options are in place.
Foreign currency against Rand
hedged floating rate notes exposure
Foreign
currency
Derivative
fair value
Contract
equivalent
Average
rate
€m Rm Rm
2013 Euro 112 1151 1 151 10.28
2012 Euro 149 (63)1 1 555 10.44
1Included in the fair value are cross currency swaps of R115 million asset (2012: R25 million liability) hedging the senior
floating rate notes, which also hedges the interest rate risk on the senior floating rate notes.
A cross currency swap was entered into, which cash flow hedges the repayment of €75 million in principal on the notes to
15 March 2014. The interest cash flows payable quarterly on the €378 million notes have been comprehensively hedged
to 15 March 2014 through the €75 million cross currency swap and foreign currency forward contracts.
At 30 March 2013, in respect of the floating rate notes exposures, if the South African Rand had weakened 5% against
the Euro, with all other variables held constant, profit for the period would have decreased by R223 million (2012: R194
million). Conversely, at 30 March 2013, in respect of the floating rate notes exposures, if the South African Rand had
strengthened 5% against other currencies, with all other variables held constant, profit for the period would have
increased by R223 million (2012: R194 million). Foreign exchange gains and losses on the foreign currency issues would
be partially offset by gains and losses on the foreign currency derivatives.
19.5 Interest rate management
As part of the process of managing the Company's floating rate interest-bearing debt and cash and cash equivalents mix,
the interest rate characteristics of new and the refinancing of existing loans are positioned according to expected
movements in interest rates. The interest rate repricing profile is summarised as follows:
Floating
rate
Total interest-
bearing debt
30 March 2013
Interest-bearing debt (Rm) – non-current 3 606 3 606
% of total interest-bearing debt 100 100
31 March 2012
Interest-bearing debt (Rm) – non-current 3 606 3 606
% of total interest-bearing debt 100 100
The following interest rate swaps and cross currency swaps are in place to hedge against interest payment exposures:
al
Notes notional
amount hedged –
Rm
Notes fixed interest
% payable
Fair value of the
interest rate hedges -
Rm
2013
2012 2013 2012 2013 2012
Interest rate hedges
Cross currency swaps 714 714 17.291 17.29
1 115
1 (25)
1
Interest rate swaps 2 892 2 892 9.431 9.43
1 (68) (83)
1 The cross currency swaps of R115 million asset (2012: R25 million liability) hedges the interest rate risk as well
as the foreign currency risk on the principal of the senior floating rate note.

144
Notes to the Company Financial Statements (continued)
19.
FINANCIAL RISK MANAGEMENT (continued)
19.6 Credit risk management
Potential concentrations of credit risk consist principally of short-term cash investments. The Company only deposits
short-term cash surpluses with financial institutions of high-quality credit standing. Credit limits per financial institution are
established within the Group’s treasury policies approved by the Risk Management Workgroup.
The derivatives are held with one counterparty of high credit worthiness. The credit worthiness is assessed on a regular
basis. At period end this counterparty was classified as investment grade.
19.7 Liquidity risk
The Company has minimised risk of liquidity as shown by its substantial banking facilities and reserve borrowing
capacity at a consolidated level.
19.7.1 Maturity analysis of derivative financial instruments’ cash flows
2013
30 March
Rm
2012
31 March
Rm
Cash outflows
Due within one year 1 239 480
Total due within one year 1 239 480
After one year but within two years 1 231
Total due after one year 1 231
Total 1 239 1 711
Cash inflows
Due within one year 1 281 331
Total due within one year 1 281 331
After one year but within two years 1 201
Total due after one year 1 201
Total 1 281 1 532
Net cash flows
Due within one year 42 (149)
Total due within one year 42 (149)
After one year but within two years (30)
Total due after one year (30)
Total 42 (179)

145
Notes to the Company Financial Statements (continued)
19.
FINANCIAL RISK MANAGEMENT (continued)
19.7 Liquidity Risk (continued)
19.7.2 Maturity analysis of non-derivative financial liabilities (including interest
payments)
2013
30 March
Rm
2012
31 March
Rm
Sundry payables (note 13) 18 17
Interest-bearing debt 356 331
Total due within one year 374 348
After one year but within two years 257 350
After two years but within three years 4 367 246
After three years but within four years 3 894
After four years but within five years -
After five years 8 949 8 949
Total due after one year 13 573 13 439
Total debt 13 947 13 787
The maturity analysis of non-derivative financial liabilities are prepared on an
undiscounted cash flow basis. The contractual maturity of the hedged coupon cash
flows of the foreign denominated notes are calculated using forward Euribor rates
(where applicable) and the exchange of principal at the derivative hedged rate. In
respect of the cash flows that are not hedged, and subsequent to the hedge
maturing, the period end floating interest rates and foreign exchange rates are used
to calculate the cash flows of the foreign denominated notes.
19.8 Fair value of financial instruments
The Company uses a three-level hierarchy to prioritise the inputs used in measuring
fair value. The levels within the hierarchy are described in the table below with level
1 having the highest priority and level 3 having the lowest. Fair value is principally
applied to financial assets and financial liabilities. These are measured at fair value
on a recurring basis, aggregated by the level in the fair value hierarchy within which
these measurements fall.
The following table presents the company’s assets and liabilities that are measured
at fair value at the period end:
Fair value measurement using
30 March 2013
Total
Rm
Level 1 (a)
Rm
Level 2 (b)
Rm
Level 3 (c)
Rm
Financial assets
Cross currency swaps 115 115
Total financial assets 115 115
Financial liabilities
Interest rate swaps 68 68
Foreign currency forward contracts - -
Total financial liabilities 68 68

146
Notes to the Company Financial Statements (continued)
19.
FINANCIAL RISK MANAGEMENT (continued)
19.8 Fair value of financial instruments (continued)
Total
Rm
Fair value measurement using
Level 1 (a)
Rm
Level 2 (b)
Rm
Level 3 (c)
Rm
31 March 2012
Financial assets
Interest rate swaps 35 35
Total financial assets 35 35
Financial liabilities
Cross currency swaps 60 60
Interest rate swaps 83 83
Foreign exchange forwards 39 39
Total financial liabilities 182 182
Level 1 – Based on quoted market prices in active markets.
Level 2 – Based on observable inputs other than Level 1 prices, such as quoted prices for similar financial
assets or financial liabilities, or other inputs that are observable or can be corroborated by observable
market data for substantially the full term of the financial assets or financial liabilities.
Level 3 – Based on unobservable inputs that are supported by little or no market activity and are financial
instruments whose value is determined using pricing models, discounted cash flow methodologies, or
similar techniques, as well as instruments for which the determination of fair value requires significant
judgement or estimation.
All financial instruments have been recognised in the statement of financial position and there is no material difference
between their fair values and carrying values, except for the notes issued.
The following methods and assumptions were used by the Company in establishing fair values:
Liquid resources, investments and loans: the carrying amounts reported in the statement of financial position
approximate fair values due to the short period to maturity of these instruments.
Notes issued: the floating rate notes issued are fair valued based on the exchange rate ruling at the reporting date. The
market values are disclosed in note 11.1.
Forward instruments: Foreign currency forward contracts, interest rate swaps and cross currency swaps are entered
into to hedge interest rate and foreign exchange rate exposure of interest-bearing debt and fair values are determined
using market related derivative rates at 30 March 2013.

147
Notes to the Company Financial Statements (continued)
20. FINANCIAL INSTRUMENTS BY CATEGORY
The accounting policies for financial instruments have been applied to the line items below:
Financial assets by category
Loans and
receivables
Fair value
through
other
compre-
hensive
income
Held-to-
maturity
investments
Available-
for-sale Total
Rm Rm Rm Rm Rm
At 30 March 2013
Derivative financial instruments (note 4.2) 115 115
Non-current loans owing by subsidiary (note 1) 7 057 7 057
Current loans owing by subsidiaries (note 6) 3 174 3 174
Cash and equivalents (note 7) 111 111
10 342 115 10 457
At 31 March 2012
Derivative financial instruments (note 4.1) 35 35
Non-current loans owing by subsidiary (note 1) 6 519 6 519
Current loans owing by subsidiaries (note 6) 3 174 3 174
Cash and cash equivalents (note 7) - -
9 693 35 9 728
Financial liabilities by category
Financial
liabilities at
amortised cost
Rm
Fair value
through profit
or loss
Rm
Fair value
through other
compre-
hensive income
Rm
Total
Rm
At 30 March 2013
Shareholder’s loan (note 10) 801 801
Interest-bearing debt (note 11) 4 406 4 406
Loans owing to subsidiaries (note 12) 368 368
Derivative financial instruments (note 19.8) 68 68
Sundry payables (note 13) 18 18
5 593 68 5 661
At 31 March 2012
Shareholder’s loan (note 10) 659 659
Interest-bearing debt (note 11) 3 802 3 802
Loans owing to subsidiaries (note 12) 1 1
Derivative financial instruments (note 19.8) 182 182
Sundry payables (note 13) 17 17
4 479 182 4 661

148
Notes to the Company Financial Statements (continued)
21.
RELATED-PARTY TRANSACTIONS
Related party relationships exist within the Company. During the period all purchasing and selling transactions were concluded at arm’s
length. Edcon Holdings Limited is the ultimate South African parent entity and the ultimate parent of the Company is Edcon (BC)
S.A.R.L. The following table provides the total amount of transactions, which have been entered into with related parties:
2013
Received/(charged)
from/to related
parties
Rm
Amounts owed by
related parties
Rm
Amounts
owed to
related
parties
Rm
Loan including interest to Edcon (BC) S.A.R.L -
recognised in non-current liabilities 801
Loan including interest to Edcon (BC) S.A.R.L -
recognised in equity 8 290
Interest-free loan owing to Edcon Acquisition Proprietary Limited 1
Interest-free loan owing to Edcon Limited 367
Interest-free loan owing by Edcon Limited 820
Interest-free loan owing by Edgars Consolidated Stores Proprietary Limited 2 354
Interest-bearing loan receivable from Edcon Limited 6 476
Interest-free loan receivable from Edcon Limited – recognised in non-current
assets 581
Interest-free loan receivable from Edcon Limited – recognised in investments 6 382
Interest charged to Edcon Limited 942
Notional interest charged by Edcon (BC) S.A.R.L (142)
2012
Received/(charged)
from/to related parties
Rm
Amounts owed by
related parties
Rm
Amounts
owed to
related
parties
Rm
Loan including interest to Edcon (BC) S.A.R.L -
recognised in non-current liabilities 659
Loan including interest to Edcon (BC) S.A.R.L -
recognised in equity 8 290
Interest-free loan owing to Edcon Acquisition Proprietary Limited 1
Interest-free loan owing by Edcon Limited 820
Interest-free loan owing by Edgars Consolidated Stores Proprietary Limited 2 354
Interest-bearing loan receivable from Edcon Limited 6 042
Interest-free loan receivable from Edcon Limited – recognised in non-current
assets 477
Interest-free loan receivable from Edcon Limited – recognised in investments 6 382
Interest charged to Edcon Limited 1 407
Interest charged by Edcon (BC) S.A.R.L (765)

149
Notes to the Company Financial Statements (continued)
22.
GUARANTEES
The Company has guaranteed the following interest-bearing debt of Edcon Limited:
— the super senior secured notes of R1 010 million on a super senior secured basis;
— the senior secured floating rate notes of €387 million on a senior secured basis;
— the senior secured fixed rate notes of €617 million and US$250 million on a senior secured basis;
— the revolving credit facility of R1 456 million on a super senior secured basis; and
— the senior secured term loan of R4 120 million on a senior secured basis.

150
ANNEXURE 1 – INTERESTS IN SIGNIFICANT SUBSIDIARIES
Nature
of business*
Issued ordinary capital % interest in capital Book value-shares
2013 2012 2013 2012 2013 2012
R R % % Rm Rm
Direct investment in
subsidiaries
Edcon Acquisition Proprietary
Limited A 1 1 100 100 1 968 1 968
Indirect investment in
subsidiaries
Celrose Proprietary Limited M 100 100 49 49 51 51
Edcon Limited R 897 897 100 100 5 429 5 429
National Security Corporation
Proprietary Limited
G 2 000 2 000 100 100 7 7
Edgars Consolidated Stores
Proprietary Limited R 5 435 097 5 435 097 100 100 6 6
Incorporated in Botswana P P
Jet Supermarkets Botswana
Proprietary Limited
R 300 000 300 000 100 100 405 405
Incorporated in Namibia N$ N$
Edgars Stores (Namibia)
Limited
R 1 050 000 1 050 000 100 100 264 264
Incorporated in Swaziland L L
Edgars Stores Swaziland
Limited R 1 500 000 1 500 000 100 100 136 136
Incorporated in Lesotho M M
Edgars Stores Lesotho (Pty)
Limited R 200 000 200 000 100 100 - -
Incorporated in Zambia K K
Jet Supermarkets Zambia
Limited R 5 000 5 000 100 100 - -
Incorporated in
Mozambique MZM
Edcon Limitada R 50 000 100 -
Interest in subsidiaries 8 266 8 266
* Nature of business A: Acquisition company, M: Manufacturing, R: Retailing, G: Group Services, D: Dormant.

151
Corporate Information
Edcon Holdings Limited
Incorporated in the Republic of South Africa
Registration number 2006/036903/06
Non-executive directors
DM Poler* (Chairman), EB Berk*, MS Levin*, ZB Ebrahim₸,
MMV Valentiny**, DH Brown₸ (appointed 1 January 2013),
TF Mosololi₸ (appointed 1 January 2013), LL von Zeuner₸
(appointed 1 April 2013).
Executive directors
J Schreiber *** (Managing Director and Chief Executive Officer),
MR Bower (Deputy Chief Executive Officer and Chief Financial
Officer), Dr U Ferndale (Chief Operations Officer).
*USA ** BELGIUM ***GERMAN
₸ Independent Non – Executive Director
Group Secretary
CM Vikisi
Registered office
Edgardale, Press Avenue
Crown Mines, Johannesburg, 2092
Telephone: +27 11 495-6000
Fax: +27 11 837-5019
Web site: www.edcon.co.za
Postal address
PO Box 100, Crown Mines, 2025
Auditors
Ernst & Young Inc.
Wanderers Office Park
52 Corlett Drive, Illovo, 2196
Private Bag X14, Northlands, 2116
Telephone: +27 11 772-3000
Fax: +27 11 772-4000
Trustee, Transfer Agent and Principal Paying Agent
The Bank of New York Mellon Limited
1 Canada Square
London E14 5AL
United Kingdom
Listing Agent & Irish Paying Agent
The Bank of New York Mellon (Ireland) Limited
Hanover Building,
Windmill Lane, Dublin 2,
Republic of Ireland
Telephone: + 353 1 900 6991
JSE Debt Sponsor
Rand Merchant Bank (a division of
FirstRand Bank Limited)
1 Merchant Place
Cnr Fredman and Rivonia Road
Sandton
Republic of South Africa
Telephone: +27 11 282-8118


![PROJECT EXPERIENCE AND PROFESSIONAL RESUMES · 10/3/2018 · www. econdevconsult.com warren@econdevconsult.com. 805.390.3985 [fka – edcon] project experience . and . professional](https://img.pdfslide.us/doc/110x75/5f8ab113010f0f58a5443295/project-experience-and-professional-resumes-1032018-www-warren-8053903985.jpg)