Embed Size (px)
Citation preview

UNIVERSITY OF HELSINKIDIVISION OF GEOPHYSICS
REPORT SERIES IN GEOPHYSICS
No 49
SNOW CHARACTERISTICS IN DRONNING MAUD LAND,ANTARCTICA
Eija Kanto
HELSINKI 2006

2
ISBN 952-10-3313-4 (paperback)ISSN 0355-8630
Helsinki 2006Yliopistopaino
ISBN 952-10-3314-2 (PDF)Helsinki 2006
http://ethesis.helsinki.fi

3
SNOW CHARACTERISTICS INDRONNING MAUD LAND, ANTARCTICA
Eija Kanto (née Kärkäs)
ACADEMIC DISSERTATION IN GEOPHYSICS
To be presented, with the permission of the Faculty of Science of the University ofHelsinki for public criticism in the Auditorium D101 of Physicum, Gustaf Hällströmin
katu 2, on September 15th, 2006, at 12 o’clock noon.
Helsinki 2006
4
We came to probe the Antarctic’s mystery, to reduce this landin terms of science, but there is always the indefinable whichholds aloof yet which rivets our souls.
Sir Douglas Mawson, The Home of the Blizzard
Antarctica left a restless longing in my heart beckoning towardsan incomprehensible perfection forever beyond the reach ofmortal man. Its overwhelming beauty touches one so deeply thatit is like a wound.
Edwin Mickleburgh, Beyond the Frozen Sea

5
Contents
Abstract 7
Acknowledgements 8
1. Introduction 92. Glaciochemical properties of snow cover 11
2.1 Snow formation and metamorphosis 112.2 Physical properties of snow 12
2.2.1 Grain size and shape 122.2.2 Density 132.2.3 Dielectric properties and wetness 142.2.4 Temperature 152.2.5 Stratigraphy 15
2.3 Snow mass balance 162.4 Snow chemistry 17
2.4.1 Oxygen isotope ratio 172.4.2 Deposition and sources of ions 182.4.3 Acidity 202.4.4 Electrical conductivity 20
3. Methods 204. Summary of articles 25
4.1 Article I 254.2 Article II 264.3 Article III 264.4 Article IV 274.5 Article V 284.6 Author’s contribution 28
5. Synthesis of results 296. References 31
Original articles

6
This thesis is based on the following five articles, which are referred to in the text bytheir Roman numerals:
I Kärkäs, E., H.B. Granberg, C. Lavoie, K. Kanto, K. Rasmus and M.Leppäranta. 2002. Physical properties of the seasonal snow cover inDronning Maud Land, East-Antarctica. Annals of Glaciology 34, 89-94.
II Kärkäs, E., T. Martma and E. Sonninen. 2005. Surface snow propertiesand stratigraphy during the austral summer in western Dronning MaudLand, Antarctica. Polar Research 24(1-2), 55-67.
III Kärkäs, E., K. Teinilä, A. Virkkula and M. Aurela. 2005. Spatialvariations of surface snow chemistry during two austral summers inwestern Dronning Maud Land, Antarctica. Atmospheric Environment 39,1405-1416.
IV Kanto, E., K. Teinilä, H. Timonen and E. Sonninen. Stratigraphy andspatial variations of snow chemistry in western Dronning Maud Land,Antarctica. Submitted to Nordic Hydrology.
V Kärkäs, E. 2004. Meteorological conditions of the Basen nunatak inwestern Dronning Maud Land, Antarctica, during the years 1989-2001.Geophysica 40(1-2), 39-52.
Article I is reprinted from Annals of Glaciology with permission from the InternationalGlaciological Society. Article II is reprinted from Polar Research with permission fromthe Norwegian Polar Institute. Article III is reprinted from Atmospheric Environmentwith permission from Elsevier. Article IV has been submitted to Nordic Hydrology.Article V is reprinted from Geophysica with permission from the Finnish GeophysicalSociety.

7
Abstract
Snow cover is very sensitive to climate change and has a large feedback effect on theclimate system due to the high albedo. Snow covers almost all surfaces in Antarcticaand small changes in snow properties can mean large changes in absorbed radiation. Inthe ongoing discussion of climatic change, the mass balance of Antarctica has receivedincreasing focus during recent decades, since its reaction to global warming stronglyinfluences sea-level change.
The aim of the present work was to examine the spatial and temporal variationsin the physical and chemical characteristics of surface snow and annual accumulationrates in western Dronning Maud Land, Antarctica. The data were collected along a 350-km-long transect from the coast to the plateau during the years 1999-2004 as a part ofthe Finnish Antarctic Research Programme (FINNARP). The research focused on themost recent annual accumulation in the coastal area.
The results show that the distance from the sea, and the moisture source, was themost predominant factor controlling the variations in both physical (conductivity, grainsize, δ18O ratio and accumulation) and chemical snow properties. The sea-salt andsulphur-containing components predominated in the coastal region. The local influencesof nunataks and topographic highs were also visible on snow. The variations in allmeasured properties were wide within single sites mostly due to redistribution by windsand sastrugi topography, which reveals the importance of the spatially representativemeasurements. The mean accumulations occurred on the ice shelf, in the coastal regionand on the plateau: 312 ± 28, 215 ± 43 and 92 ± 25 mm w.e., respectively. Depth hoarlayers were usually found under the thin ice crust and were associated with a lowdielectric constant and high concentrations of nitrate. Taking into account the vast sizeof the Antarctic ice sheet and its geographic characteristics, it is important to extendinvestigation of the distribution of surface snow properties and accumulation to providewell-documented data.

8
Acknowledgements
There are several people and groups I like and should thank and without whom thisthesis would have never been completed:
My supervisor Professor Matti Leppäranta gave me the privilege of working inthe Antarctic project. He has given me a lot of independence, responsibilities andguidance during this journey, as well as my other supervisor Professor Hardy Granberg,who introduced me to snow business in the first place. They are both gratefullyacknowledged.
Doc. Aki Virkkula and Dr. Kimmo Teinilä led me into the field of snowchemistry. They have both shown tireless supervision and the true meaning ofcollaboration.
Mr. Tonu Martma and Ms. Eloni Sonninen have undertaken a huge task inanalysing the oxygen isotope ratios and also acting as coauthors. My other coauthors,field companions and people responsible for analyses are warmly thanked.
Doc. Esko Kuusisto and Professor Petri Pellikka provided critical andconstructive comments while reviewing the manuscript of the thesis.
The Department of Physical Sciences and Division of Geophysics providedworking facilities. The Finnish Antarctic Research Programme was responsible forlogistics to Antarctica, especially the members of the FINNARP 1999, 2000 and 2003expeditions who I thank and whose shared moments I cherish.
This work was funded by the Academy of Finland (project no. 43925 and54086), Snow and Ice Graduate School of the Department/Division of Geophysics, andfinanced by the Ministry of Education, the Vilho, Yrjö and Kalle Väisälä Foundation ofthe Finnish Academy of Science and Letters and the Sohlberg Delegation of the FinnishSociety of Sciences and Letters.
My husband Kimmo stood beside me during this work and he is the one whounderstands without any doubts my love of the polar regions. I want to thank my closestrelatives for encouraging but never questioning my choices. And my friends havesometimes found my topic even more fascinating than I have.

9
1. Introduction
Polar regions (Fig. 1), dominated by ice sheets and sea ice, are universally recognized asextremely important for cooling the climate of our planet (Bindschadler, 1998). Thehemispherical reflectance of ice sheets can exceed 90%, making them the brightestsurfaces on Earth. The most obvious climatic effect of ice sheets resides in theirinfluence on the earth's heat budget through changes in the planetary albedo (i.e. ratio ofreflected to incident solar radiation) (Muszynski and Birchfield, 1985). Their lowtemperatures, combined with the heat of the tropics, create a temperature gradient thatcontributes to the meridional exchange of heat by atmospheric circulation(Bindschadler, 1998). Ice sheets are the largest freshwater reservoirs on Earth andconstitute a unique archive of past climate and environmental changes (e.g. Petit et al.,1999).
Snow and ice cover make the Antarctic continent one of the principal components ofour global climate system. Snow covers 98% of all surfaces in Antarctica and has amajor effect on the continent’s cold climate due to its high albedo. Precipitated snowalso represents the input into the mass balance of the continent. The changes in massbalance are important but difficult to quantify. They influence sea levels and currentsworldwide. The estimates place 70-80% of the world's freshwater in ice sheets andglaciers and Antarctica is, by far, the largest component with 89% (~30*106 km3;Delaygue et al., 2000) of this frozen fraction (Bindschadler, 1998). In view of thepredicted changes in mass balance of Antarctic snow, we need to understand thedetailed spatial variations in it and its annual accumulation much better than wecurrently do.
The properties of surface snow give the continent its important climatic role anddetermine its energy and mass balance. To better understand these relationships it isessential to understand the properties of snow with their spatial variations. Since snowcovers nearly everything in Antarctica, it is the snow cover that generates the signaldetected by a variety of remote sensing satellites. To better understand these signals, itis essential to know the physical properties of the snow cover that influence itsabsorption, backscatter and emission properties. The surface properties of snow arevaluable ground-truth data for satellite remote sensing and large-scale numericalmodelling, which allow us to study large and otherwise inaccessible areas (König et al.,2001).
Antarctica provides the cleanest atmospheric environment available for study of thechemicals stored in snow and accumulated on the polar ice sheet, although theatmosphere of the polar regions is already affected by human activities (Legrand andMayewski, 1997). Ice cores give access to palaeoclimate records that include localtemperature and precipitation rate, moisture source conditions, wind strength andaerosol fluxes of marine, volcanic, terrestrial, cosmogenic and anthropogenic origin(Petit et al., 1999). Understanding the spatial variability of ion concentrations in thesnow cover is essential for interpreting the climate records from deep ice cores.
The physical and chemical properties of the snow cover interact with each other, as wellas with the meteorological conditions that influence this complex system. Themeteorological conditions of Antarctica are characterized by pronounced seasonal

10
cycles with a long polar night, very cold temperatures, strong winds and dryness of theair (King and Turner, 1997).
In 1999 the project ‘Seasonal snow in Antarctica’ was initiated and was funded by theAcademy of Finland in two phases: 1999-2001 and 2002-2005. The project resultedfrom collaboration between the Division of Geophysics from the University of Helsinkiand the Centre d’Applications et de Recherches en Télédétection (CARTEL), Universitéde Sherbrooke, Québec, Canada. The general objective was to increase the level ofunderstanding of the surface snow cover in Dronning Maud Land, Antarctica, and itsrole in the Antarctic as well as global climate. The project’s strategy was to developdetailed knowledge of the physical properties of snow, solar radiation of the snowsurface, snow temperature evolution during the Antarctic winter and further forgenerating these properties to use remote sensing and modelling and to expand thisknowledge to Antarctica as a whole.
Figure 1. Snow- and ice-covered polar areas seen from space during thecorresponding summer (Satellite data provided by The Living Earth® Inc./Earth Imaging © 2005).

11
The present study concerns the physical and chemical properties of the surface snowcover in the western Dronning Maud Land area and is a part of the ‘Seasonal snow inAntarctica’ project. The primary objective was to observe the spatial and temporalvariations in surface snow properties and annual accumulation in the measurement area.The aim was to determine the properties of surface snow in the area and examine whatenvironmental factors produce them and provide a data that could be used in remotesensing as well as in interpreting the ice cores.
The physical properties of snow and its annual accumulation rates (I, II) constitute theleading glaciological foundations of this work. During the time span of thisinvestigation knowledge of the associated problems increased and it seemed importantto expand the study to include the chemical properties (III, IV). Snow properties aredependent on the prevailing meteorological conditions in the area. A general overviewof these meteorological conditions is outlined (V).
2. Glaciochemical properties of snow cover
2.1 Snow formation and metamorphosis
Formation of snow in the atmosphere begins when the temperature is less than 0 °C andsupercooled waters and foreign nucleation sites (e.g. sea-salt, dust and mineral particles)are present. Water vapour condenses around nuclei. Once an ice crystal is nucleated, itgrows through aggregation of small ice crystals and riming from water droplets into thesnowflake form, and finally lands on the ground as snowfall. The temperature at whichit grows determines the basic shape of an ice crystal. The rate of growth and secondarycrystal features are determined by the degree of supersaturation. The falling snow formsa porous cover consisting of ice crystals, with liquid water and moist air in its pores. Bythe time snow reaches the ground it has already undergone a number of transformations.After the snow is deposited thermodynamical processes known as metamorphismmodify the particle shapes. Changes in snow properties are driven by the energy, massand momentum exchange in the surface and bottom boundaries of the snowpack.
During the early lifetime of a freshly fallen snowflake, both wind and new snow resultin mechanical rounding of grains. Dry snow is characterized by the absence of liquidwater. Temperature gradients drive metamorphism in dry snow through the process ofvapour diffusion along a vapour density gradient. In equilibrium growth metamorphismthe sharp edges of new stellar snow crystals are changed into rounded grains due tosublimation from the convex grain surfaces and transport of water vapour to theconcave parts (Colbeck, 1982a). Sintering between the snow grains forms strong icebonds (Colbeck, 1997). Kinetic growth metamorphism changes the rounded grains intofaceted crystals by evaporation and recondensation of water molecules (Colbeck,1982b).
Wet snow is characterized by a significant amount of liquid water in snow. Liquid waterbecomes mobile when the irreducible water content is exceeded (about 2-5% byvolume; Colbeck, 1982a, 1983). At low liquid-water contents the crystals join togetherby ice-to-ice contacts and at higher liquid contents there is no intergranular bonding inwet snow metamorphism (Colbeck, 1997).

12
Melting and refreezing cycles create hard, strong ice layers and grain clusters (Colbeck,1982a). Firnification slowly changes snow into glacier ice due to melt-freezemetamorphism and the overburden pressure of falling snow (Fig. 2). When snow haschanged into ice, the snow density attains a value of 830 kg m-3 and the air pores haveencapsulated air bubbles (Paterson, 1994).
Figure 2. The transition from snow crystals to firn (= snow that has survived onesummer) and further to glacier ice (after Hambrey and Alean, 2004). Thetime scale is dependent on the location (Paterson, 1994).
2.2 Physical properties of snow
2.2.1 Grain size and shape
From the time a snowflake forms until its destruction, it undergoes metamorphismwhich alters the size and shape of the grain (Fig. 3). Snow-grain size is used to describethe texture and roughness of the snow. One common definition for the grain size is thegreatest extension of the grain (usually measured in millimetres) or classification from‘very fine’ to ‘very coarse’ (Colbeck et al., 1990). Snow-grain size and shape influencethe snow density and amount of free water in the snow cover. The determination ofsnow-grain type and size is crucial for validating snow models and interpreting remote-sensing data (Lesaffre et al., 1998).
Colbeck et al. (1990) collaborated to develop an international classification for seasonalsnow on the ground, dividing snow grains into nine different classes based onmorphological features with additional information on physical processes and strength(Table 1). Depth hoar is an extreme example of the faceted crystals that are formed insnow when the snow is subjected to a large temperature gradient (Colbeck, 1989).Water vapour moves in the snow cover from the warmer parts to the colder parts.Layers of faceted crystals observed growing immediately below the surface of high-altitude snow covers and polar snow they are explained by a combination of high-temperature gradients associated with the fluctuations of surface temperature and theincreased temperature and temperature gradients due to solar radiation input (Colbeck,1989). Depth hoar formation occurs at temperature gradients of about -10 to –25 °C m-1
and snow densities less than 350 kg m-3 (Akitaya, 1974; Colbeck, 1982a).

13
Figure 3. Different snow grains: a) stellar precipitation crystals, b) 12-sidedprecipitation crystals can sometimes also be seen, c) partly roundedprecipitation particles on the ground, d) faceted surface hoar grains, e-f)rounded grains, g-h) cup-shaped depth hoar grains and i) ice crystals fromthe ice layer found in firn. (Snow-grain photos taken during FINNARP 2000expedition and firn core sample taken during FINNARP 1999 expedition).
Table 1. Grain shape classification after Colbeck et al. (1990).
2.2.2 Density
Densification of snow can be influenced by many different external conditions,particularly in the uppermost portion of the snow cover; e.g. wind-packing, sublimation,melting and freezing may cause a temporary increase or decrease in snow density
14
(Kojima, 1964). Snow density may vary among different regions, due to localmeteorological conditions. The vertical density profile of the uppermost 10-20 m ofpolar firn is usually described as a function of overburden pressure and local physicalquantities such as annual mean temperature, wind speed and accumulation. Highertemperatures enhance grain growth, increasing the densification rate, while mechanicalrounding of snow particles by wind action facilitates settling and enhances density inthe upper metres; the latter effect is dampened by high accumulation (Craven andAllison, 1998). As snow is deposited at the surface of a snowpack, compaction occurs intwo stages (Gray and Morland, 1995). First, there is an initial period of settling whenthe rate of volume decrease is dominated by thermal processes, reflecting the rapidmetamorphism as branched crystals break down (Gray and Morland, 1995). This isfollowed by a slower densification as pores collapse, which is largely caused by theoverburden (Gray and Morland, 1995). Densities increase more slowly at this stage untilthe intercommunicating air passages become closed off, forming individual bubbles at adensity of 830 kg m-3 while firn changes to glacier ice (Paterson, 1994). In glacierfurther densification occurs by compression of the bubbles (Paterson, 1994).
Many of the physical processes occurring in a snowpack are related to snow density.For example, density is an important factor in heat and mass transport; high densityfavours heat conduction through the ice-grain lattice, while low density favours theprocesses of diffusion and convection (Colbeck, 1993). The density also influences themechanical behaviour of snow (Mellor, 1975). Most other snow properties are alsorelated to the density. Snow density affects the effective thermal conductivity andpermeability of gases and determines the snow-water equivalent and dielectricproperties of snow (Hallikainen and Winebrenner, 1992).
Snow is a granular medium in which a continuum approach is used for length scaling.Thus, continuum quantities such as density are defined for continuum length scalesonly. Therefore the length scale and variations in grain size are much smaller than weare able to measure with manual density measurements.
2.2.3 Dielectric properties and wetness
The relative dielectric constant of a medium ε is a dimensionless complex number andconsists of a real (ε’) and an imaginary part (ε’’),
''' εεε j−= (1)
where 1−=j . The term ε’ is usually referred to as the permittivity of the material andε’’ the dielectric loss factor (Ulaby et al., 1986). The real part ε’ gives the contrast withrespect to free space (ε’
air = 1), whereas the imaginary part ε’’ gives the electromagneticloss of the material. Treatments of the dielectric properties of snow usually result indivision of the snow into two groups: a) dry snow, which is a mixture of ice and air andcontains no free (liquid) water and b) wet snow, which does contain free water (Ulabyet al., 1986). Electromagnetically, dry snow is a dielectric mixture of ice and air and,therefore, its complex permittivity is governed by the dielectric properties of ice, snowdensity and ice-particle shape (Hallikainen and Winebrenner, 1992). Since the real partof the permittivity of ice is ε’
ice = 3.17 at frequencies between 10 MHz and 1000 GHzand is practically independent of temperature, the dielectric constant of dry snow is only

15
a function of density ε’= ε’(ρ) (Ulaby et al., 1986). Wet snow is a three-componentdielectric mixture of ice particles, air and liquid water, and its permittivity is a functionof frequency, temperature, volumetric water content, snow density, and the shapes ofice particles and water inclusions (Hallikainen and Winebrenner, 1992). Since thepermittivity of water (ε’
water = 80) is substantially higher than that of ice and air, thedielectric behaviour of wet snow is governed by the volume fraction of water(Hallikainen and Winebrenner, 1992).
Snow wetness or free-water (liquid) water content is typically obtained usingcalorimetry, dilution or dielectric measurements. Colbeck et al. (1990) gave a generalclassification of liquid-water content: snow is said to be dry when the percentage ofliquid water is 0% by volume, moist at 3%, wet at 3-8%, very wet at 8-15% andsaturated slush at >15%. Liquid water is mobile only if the so-called irreducible watercontent is exceeded and surface forces cannot hold the water against the gravity. Theirreducible water content is about 3% and is dependent significantly on snow texture,grain size and grain shape (Colbeck et al., 1990).
2.2.4 Temperature
A snowpack exchange heat with the environment. The heat exchanges either modify thetemperature distribution or result in phase changes. If there is no horizontal transfer ofheat, the components of the energy budget include net radiation at the snow surface,sensible heat flux, latent heat flux and a term accounting for melting and refreezing. Thesources and sinks of the energy budget, along with the radiative and thermal propertiesof the snow, determine the temperature structure below the surface (Brandt and Warren,1993). Within an ice sheet, heat is transferred primarily by conduction but other heat-transfer mechanisms can also contribute to varying degrees. Nonconductive processesare limited to the uppermost few metres of snow and can include wind-generatedventilation of the snowpack (wind-pumping), latent-heat transfer by water-vapourmigration, convection of air in the pore spaces and solar radiative heating (Brandt andWarren, 1997). In wet snow, internal heat fluxes are controlled by conduction and bylatent-heat release due to freezing. Observations of temperature maxima at depths ofabout 10 cm in cold Antarctic snow during summer were explained by proposing thatsolar heating is distributed with depth, whereas thermal infrared cooling is localized atthe surface (the 'solid-state greenhouse') (Brandt and Warren, 1993).
2.2.5 Stratigraphy
The layered character of snow cover results from a sequence of weather events andmetamorphic processes (Fig. 4). The upper layers are largely influenced by solarradiation penetration and diurnal reversals of the temperature gradient (Colbeck, 1991).Hoar layers, crusts and ice layers are examples of layers found in the snowpack. Even ifmetamorphic processes did not occur, a typical snow cover would be layered justbecause of varying meteorological conditions (Colbeck, 1991).
Depth hoar and buried surface hoar are usually uniform layers. The development ofdepth hoar due to vertical vapour transport is dependent not only on the temperaturegradient but also on the length of the period it remains near the surface, reflecting theperiod of nonaccumulation (Mosley-Thompson et al., 1985). Goodwin (1991) observedthree distinct seasonal snow surfaces forming in autumn, spring and summer; the

16
autumn and spring wind-glazed ice crusts formed during a hiatus in the snow supply,while the summer surface was characterized by a thin ice layer that formed whenmaximum radiation melts a thin film over wind-laminated drifting snow. Percolatingmeltwaters form thick ice layers and lenses. As percolating water reaches a buried windcrust, it is likely to spread along that crust due to its high capillarity and reduced thepermeability associated with its small grains and high density (Colbeck, 1991).Snowmelt in Antarctica is limited and occurs occasionally during favourablemeteorological conditions; thus the melting phenomena detected may be sensitive toclimate change and could be used as climate indicators (Winther, 1993).
Figure 4. Layered structure of snow cover (photo taken during FINNARP 2000expedition).
2.3 Snow mass balance
The surface mass balance is the difference between gross accumulation rate (fromprecipitation, drifting snow deposition, condensation, vapour-to-solid sublimation andsuperimposed ice formation) and gross ablation rate (from snow deflation, evaporation,sublimation and surface melt runoff) (Giovinetto et al., 1990). The annual accumulationlayer is, additionally, subjected to evaporation and melting, especially in the coastalareas. Usually in Antarctica, the meltwater refreezes within the annual layer, whichmeans no loss for the mass balance (Schlosser, 1999) and, except in the coastal zone,melting is small (Van den Broeke et al., 1999).
Snow accumulation (expressed in mm w.e. a-1 or kg m-2 a-1) is controlled primarily byatmospheric conditions and the elevation and slope of the terrain. A decrease in airtemperature usually leads to a decrease in accumulation rates, since colder air can holdless moisture than warmer air, so precipitation amounts tend to decrease, even if thenumber of precipitation events does not change (Schlosser and Oerter, 2002a).
Precipitated snow is strongly affected by snowdrift, and hence an originally smoothsnow cover can be redistributed into a complicated accumulation pattern. The windredistribution of snow includes erosion of snow cover by the shear force of the wind,transport of blowing snow from exposed sites with low aerodynamic roughness,sublimation of blowing snow in transit and deposition of snow at sites with higher

17
aerodynamic roughness or less exposure to wind (McKay and Gray, 1981). Threemodes of drift transport have been distinguished: surface creep, saltation and turbulentsuspension (Granberg, 1998). Sublimation from blowing snow constitutes a significantloss of surface snow in dry air.
Intranival air movements are important in snow-drifting, because they aid in themobilization of drifting snow (Granberg, 1998). They are also important for heat,moisture and gas transfer in the snow cover and, as such, are important for snowpackmetamorphism (Granberg, 1998). Wind-pumping driven by air pressure gradients cangenerate rapid variations in temperature and vapour pressure in snowpack (Granberg,1998).
Giovinetto and Zwally (2000) showed that the mean accumulation for Antarctica is 159kg m-2a-1 and when taking into account the coastal deflation (the mass loss due to snowremoval by wind and sublimation) and ablation (the mass loss due to runoff andevaporation) it is 149 kg m-2a-1. The contribution of sublimation in blowing snow to thesurface mass balance of the Antarctic ice sheet is significant in the coastal area (0.087mm w.e. d-1, Gallée, 1998; up to 17 cm w.e. a-1, Bintanja, 1998). Iceberg calving andbasal melting are the main ablation processes in the Antarctic ice sheet.
Many authors have studied changes in accumulation rates in various parts of Antarctica.Schlosser and Oerter (2002a) compiled some of these results and concluded that there isno uniform trend found over Antarctica. The West Antarctic Ice Sheet is probablythinning overall, with thickening in the west and thinning in the north. The massimbalance of the East Antarctic Ice Sheet is likely to be small, but even its sign cannotyet be determined (Rignot and Thomas, 2002).
2.4 Snow chemistry
2.4.1 Oxygen isotope ratio
The stable oxygen isotope (δ18O) ratios of snow are fairly well correlated with theannual mean air temperature at the deposition site, although they are dependent in acomplex way on the source and distance to the source of precipitation and onfractionation processes during the transport of moisture to the deposition site of snow(Dansgaard, 1964). The δ18O value, expressed in ‰ , describes the relative deviation of18O in the precipitation compared with that in Standard Mean Ocean Water (SMOW)(Dansgaard, 1964):
)(/)(/)(/
1618
16181618
SMOWOOSMOWOOsampleOO
OX−
=δ (2)
To use the δ18O profile for calculating annual accumulation, it is essential that there isprecipitation during both the warm and the cold seasons so that the difference inisotopic distribution will be discernable despite losses by wind-scouring andfirnification processes (Isaksson and Karlén, 1994a).
Mass exchange by diffusion of water vapour and sintering in the upper layers of the firnsmoothes the isotopic profile over a period ranging from months to decades (Johnsen,

18
1977). Johnsen (1977) showed that this process is no longer important when the densityexceeds 550 kg m-3. Schlosser and Oerter (2002b) found that the main part ofattenuation of the seasonal signal of δ18O occurs during the first months of snowmetamorphism.
Several natural processes result in isotopic fractionation, or separation of heavier fromlighter isotopes, in a sample. Fractionation processes occur at most of the phase changesof water during its atmospheric cycle and can often obscure seasonal or annualvariations in the isotopic content of precipitation (Jouzel et al., 1997). The condensedphase (either liquid or solid) is, at equilibrium, isotopically enriched with respect to thevapour phase (Jouzel et al., 1997).
2.4.2 Deposition and sources of ions
The most important sinkage mechanisms for aerosols are precipitation (scavengingprocesses), dry deposition of particles and adsorption of gases (Fig. 5). The two lattermechanisms result in the snow surface having higher ion contents than in the ‘original’precipitation (Gjessing, 1984). On the Antarctic plateau the dry deposition andadsorption of gases are the most important sinkage mechanisms, due to their lowprecipitation rates, while in the coastal areas scavenging processes predominate(Gjessing, 1984). Dry deposition is the direct deposition of particles from theatmosphere to the snow surface. Aerosols may be directly deposited, whereas gaseousspecies may also be adsorbed.
In Figure 6 are seen the main origins and sources of soluble impurities found in polarsnow. Sea salt is produced by wind action over the open ocean surface (Mulvaney et al.,1993). In atmospheric chemistry studies, either sodium (Na+) or chloride (Cl-) isgenerally chosen as the marine reference element, but magnesium (Mg2+) has also beenused (Legrand and Delmas, 1988). HCl was proposed as the major source for excess Cl-
in Antarctica, which is formed by the reaction of excess sulphate with sea-salt particlesin the aerosol phase (Legrand and Delmas, 1988). The reaction is more efficient whenweather conditions are calm, usually during summer. More than 90% of anthropogenicHCl emissions are confined to the Northern Hemisphere and only a tiny fraction of theemitted amounts of HCl is probably able to reach high southern latitudes (Legrand andDelmas, 1988).
Calcium (Ca2+) and potassium (K+) have two sources, a marine source as well ascontinental dust (Legrand and Mayewski, 1997). Ca2+ in precipitation is derived fromsoil dust (primarily as CaCO3), while other Ca2+ sources in Antarctica include themarine aerosols (Gjessing, 1984). The crustal source appears to be less important to K+
than Ca2+ (Proposito et al., 2002).
Various natural sources contribute to the natural sulphate (SO42-) burden of the
atmosphere, in addition to anthropogenic SO2 emissions (Legrand and Pasteur, 1998).Atmospheric sources of nonsea-salt sulphate (nssSO4
2-) and dimethyl sulphide (DMS,CH3SCH3) emissions from the marine biota represent a major natural source in theremote marine atmosphere (Andreae and Raemdonck, 1983). In contrast to SO4
2-, theonly atmospheric source for methanesulphonic acid (MSA, CH3SO3
-) is the oxidation ofDMS (Legrand and Pasteur, 1998). The MSA to nssSO4
2- ratio has been used inevaluating the contribution of biogenic sources to total SO4
2- over the area and typically

19
shows a summer maximum and a winter minimum. Colder temperatures favour theformation of MSA and could have played a crucial role in controlling the finalcomposition of the high southern latitude atmosphere over the last climatic cycle(Legrand et al., 1992). High MSA concentrations appear to correlate with major ENSO(El Ninõ-Southern Oscillation) events (Legrand and Feniet-Saigne, 1991).
Figure 5. The main physical and chemical processes that influence the chemicalcomposition of cold, dry snow cover (modified after Tranter and Jones,2001).
Figure 6. Various soluble impurities trapped in polar snow layers and theircorresponding origins and sources (after Legrand and Mayewski, 1997).

20
Nitrate (NO3-) in polar snow is mainly due to the deposition of gaseous nitric acid
(HNO3), an acid that is the end product of the oxidation of various nitrogenous tracegases (NOx) (Delmas, 1992). Jones et al. (2000) recorded the photochemical productionof nitric oxide and nitrogen dioxide (NO and NO2) in Antarctic snow cover. On theother hand NO3
- has found to be affected by post-depositional losses at locations of lowaccumulation (Röthlisberger et al., 2000).
Ammonium (NH4+) is mainly released from combustion, bacterial decombustion of
plant matter in soils and bacterial decomposition of excreta (Legrand et al., 1998). In thehigh southern latitudes the primary natural source of NH4
+ is biogenic oceanicemissions (Legrand et al., 1998) and, to a lesser extent also, animal waste.
2.4.3 Acidity
Snow acts as a reservoir for acids and storage of aerosols. Falling snow collectsimpurities that accumulate on the snow cover from the dry deposition of gases andatmospheric particles. The acidity of a melted sample is determined by the pH(hydrogen ion potential), defined as the hydrogen ion activity:
[ ]+−= HpH log (3)
where [H+] is the hydrogen ion concentration in an aqueous solution.
The pH value can also be estimated from the ionic balance:
[ ])(10lg 6 cationsanionspH ∑−∑−= − (4)[ ] [ ] [ ] [ ] [ ][ ] [ ] [ ] [ ] [ ] [ ]+++++
−−−−
++++=
+++=22
4
324
MgCaKNaNHcationsClNOMSASOanions
2.4.4 Electrical conductivity
Electrical conductivity (κ, expressed as µS cm-1) measurements of melted samplesreflect the conductivity of all ions present in the meltwater (Hammer, 1983).Conductivity shows the ability of an aqueous solution to carry an electrical current andis used especially for melt-water quality control. Dissolved salts in solution carry thecurrent and the conductivity is also dependent on the temperature. It is also partlyinfluenced by the pH and the amount of atmospheric carbon dioxide, which has beendissolved in the water to form ions. The conductivity of snow cover is dependent on theseason and is helpful in exact dating (Schlosser, 1999). Conductivity records mayreflect individual storm events (higher NaCl), but the signals may be damped by vapourdiffusion deeper in the firn (Mosley-Thompson et al., 1985).
3. Methods
The field campaigns were performed in western Dronning Maud Land as a part of theFinnish Antarctic Research Programme (FINNARP) expeditions during the australsummers of 1999/2000, 2000/2001 and 2003/2004. The measurements were conducted

21
along a 350-km transect from the seaward edge of the small Riiser-Larsen ice shelf,along the Ritscherflya ice sheet to Amundsenisen on the plateau (Fig. 7). Snow in theKvitkuven ice rise and the Högisen ice dome was also investigated. The location of theFinnish Aboa research station and the land routes used determined the measurementsites. Kvitkuven and Högisen were chosen due to lower backscattering observed in theRADARSAT mosaic (Fig. 7). Aboa (73°03'S, 13°24'W) is located on the Basen nunatakat an elevation of 484 m above sea level (a.s.l.). Basen is the northernmost nunatak ofthe Vestfjella mountain range near the grounding line. Vestfjella and Heimefrontfjellamountain ranges are located approximately parallel to the coast. The measurementswere made approximately during a one-month time period. The geographic positions ofthe snow measurement sites were determined with a hand-held global positioningsystem device (Garmin, Olathe, KS, USA) with a precision of ±100 m or better.
Figure 7. Map of the measurement area in western Dronning Maud Land, showing thelocations of snow pit sites 1-17, automatic weather station (AWS) sites andsea ice sites (0, SI1 and SI2). The Finnish Aboa research station (73°03'S,13°24'W) is located on the Basen nunatak. Locations of Buoy 5895 and theGerman Neumayer research station have also been marked (article V). Partof the RADARSAT mosaic (Jezek, 1999) was used as background(RADARSAT data © Canadian Space Agency 1997).

22
Isaksson and Karlén (1994b) have summarized the previous glaciological work done inwestern Dronning Maud Land before the season 1988/1989. The Norwegian-British-Swedish Antarctic Expedition (1949-1952) started the glaciological research in this area(Schytt, 1958) and the research has continued through decades as mentioned in thearticle II.
A total of 17 snow pit sites were measured in 1999/2000, 11 sites in 2000/2001 and 10sites in 2003/2004 on the continent (Table 2). Additionally, there were three sites (SI 1,SI 2 and 0) on the sea ice in 1999/2000 and snow cover on sea ice was measured.
The measurements were conducted in situ in shallow snow pits (1-2 m; Fig. 8) andconsisted of profiles at 2-10-cm intervals of visible stratigraphy, temperature, density,grain size and shape, dielectric constant and wetness. The samples were collected forconductivity, pH, δ18O ratio and chemical analyses (Fig. 9). The temperature profileswere measured using a Pt1000 temperature sensor with ±0.2 °C accuracy. The snowdensity was measured to an accuracy of ±10 kg m-3, using a cylindrical sampling kitwith a volume of 0.5 dm3 (diameter 6 cm) in 1999/2000 and 0.25 dm3 (diameter 5 cm)in 2000/2001 and 2003/2004, and a spring balance. In 1999/2000 some missing densitydata were replaced with values obtained by drilling while installing automated snowsensors at the sites. The error of density measurements σρ was calculated in thefollowing:
22
∂∂
+
∂∂
=Vm Vmρσρσσ ρ (5)
including density (ρ), mass (m), volume (V), mass error (σm = 10-3 kg) and volume error(σV) that includes an estimate for a depression of 0.5 cm in the snow. The density errorwas estimated to be 3% using the cylindrical sampling kit with a volume of 0.5 dm3 and4% using the kit with a volume of 0.25 dm3.
Snow grains were photographed in the field using a special camera stand (Pihkala andSpring, 1985; Figs. 3 and 10) and classified according to Colbeck et al. (1990). Therecorded snow-grain size is the greatest extension of the grain (Colbeck et al., 1990).Here the grain sizes were determined from digital images using ImageJ image-processing software.
The dielectric constant was measured with a TEL 051 dielectric probe (LEAS,Grenoble, France) in 1999/2000 and with the Finnish Snow Fork device in 2000/2001and 2003/2004 (Sihvola and Tiuri, 1986; Fig. 11). The Snow Fork F9901 sensor wasused in 2000/2001 and the FK0101 sensor was also used in 2003/2004. The TEL 051 isa cylindrical probe with a diameter of 6 cm. It measures the real part of the dielectricconstant and requires a manually measured density as an input to give the liquid-watercontent of the snow. The Snow Fork measures both the real and imaginary parts of thedielectric constant to an accuracy of ± 0.02 for the real part and ± 0.002 for theimaginary part. It also provides the density and liquid-water content using an empiricalformula with an accuracy of ± 5 kg m-3 for density and ± 0.3% for wetness. Theaccuracies are determined by the manufacturer. The Snow Fork is a fork-type sensor,and near the surface the distance to the interface should be about 5 cm to obtain reliable
23
results; the results of the first 4 cm were omitted. The liquid-water content (wetness) isexpressed as a percentage by volume.
The conductivity, pH and δ18O ratio were analysed from the melted samples. Theconductivity was determined with handylab LF 513 T (Schott Glas, Mainz, Germany) in1999/2000 and 2000/2001, and with a CDM210 conductivity meter (MeterLab,Radiometer Analytical, Lyon, France) in 2003/2004, while the pH was determined witha handylab BlueLine 24 pH meter (Schott Glas).
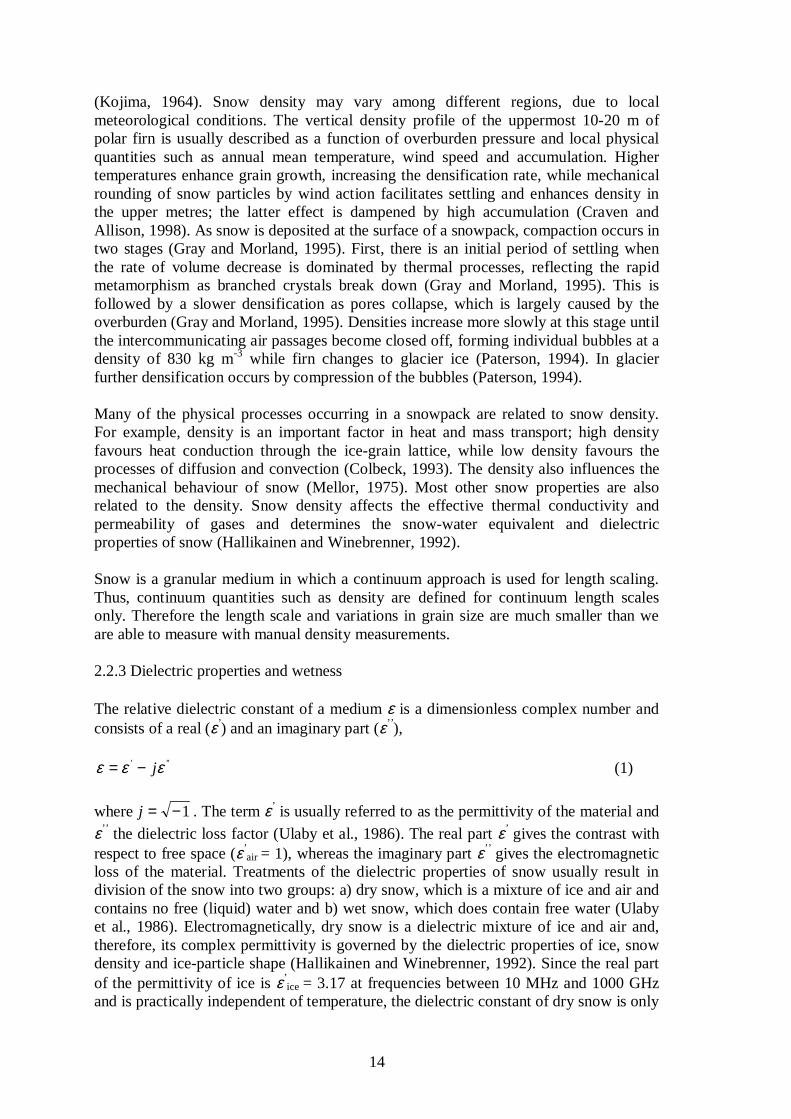
Figure 8. Snow profiles were measured in the excavated snow pits at 100-200-cmdepths (photo taken by H. Granberg during FINNARP 1999 expedition).
Figure 9. Snow samples for chemical analyses were collected using sterile overalls(photo taken during FINNARP 2003 expedition).
The δ18O ratios were analysed for 1999/2000 and 2000/2001 at the Institute of Geology,Tallinn Technical University, using a Delta-E mass spectrometer (Finnigan-MAT,Bremen, Germany) and for 2003/2004 at the Dating Laboratory, University of Helsinki,using a Delta+XL mass spectrometer connected on-line to GasBench II(Thermofinnigan, Bremen, Germany). The samples were measured against laboratoryinternal reference waters, which were calibrated on the Vienna Standard Mean OceanWater/Standard Light Antarctic Precipitation (V-SMOW/SLAP) scale. The
24
reproducibility of the replicate analyses was generally better than ± 0.15‰ . The δ18Oand density profiles and snow layering were used to determine the annual layers andannual accumulation.
All snow samples for ion analyses were stored frozen and melted shortly beforeprocessing. The anions and cations were analysed simultaneously, using two Dionex-500 ion-chromatography systems at the Finnish Meteorological Institute. The analyticalerrors were typically 5% of the measured concentrations. In some cases the measuredconcentrations of certain ions were near their detection limit and the analytical error islarger in these cases (10%). The sample-handling procedure (e.g. melting of the snowsamples) also added some error to the measured concentrations.
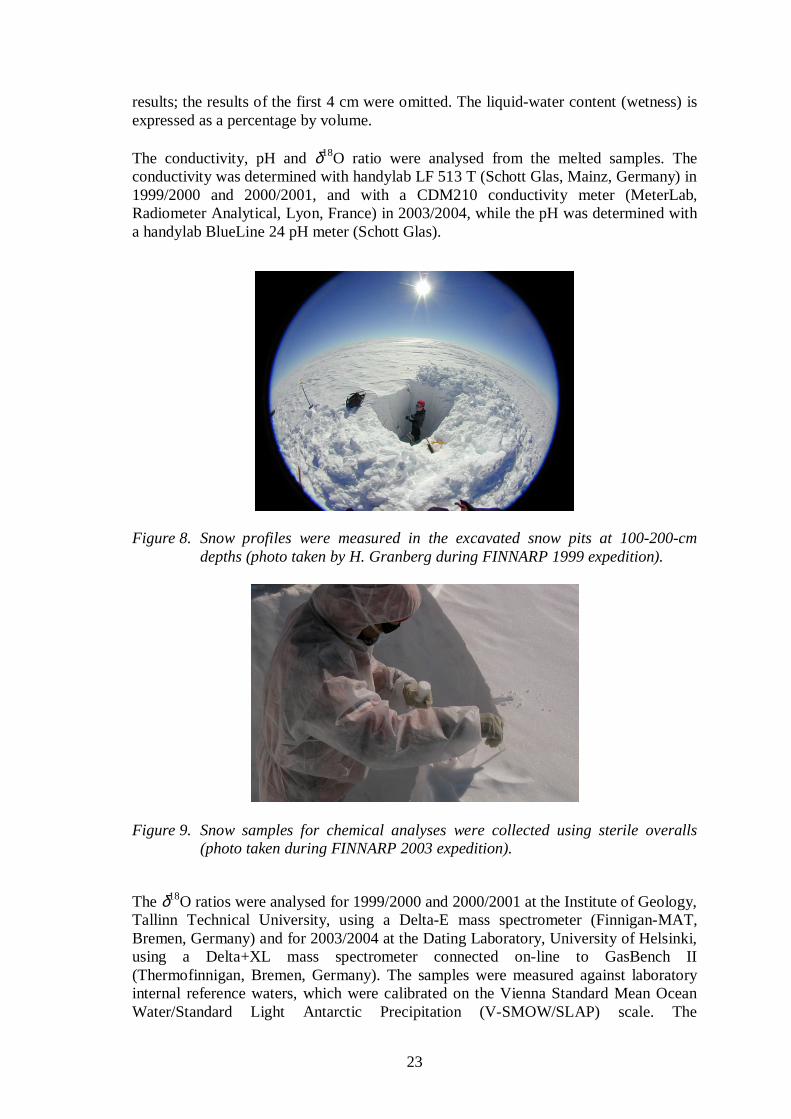
Figure 10. The special camera stand with light source was used to take snow-grainimages (photo taken during FINNARP 2003 expedition).
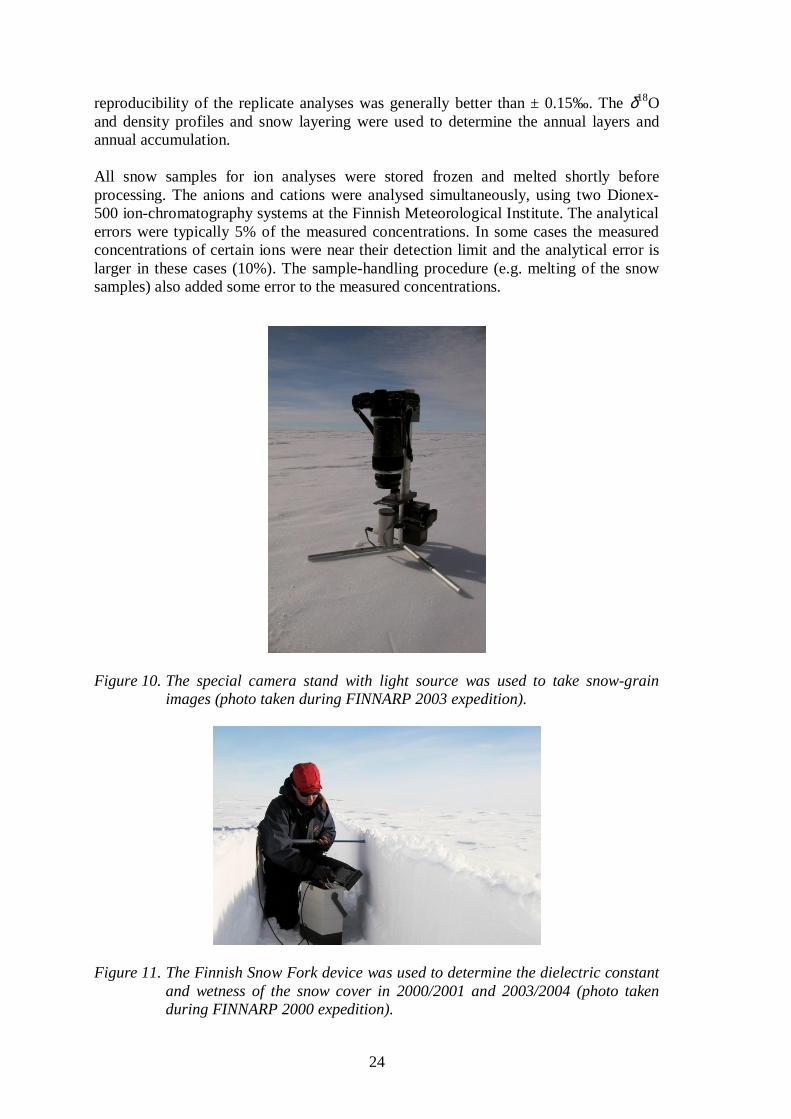
Figure 11. The Finnish Snow Fork device was used to determine the dielectric constantand wetness of the snow cover in 2000/2001 and 2003/2004 (photo takenduring FINNARP 2000 expedition).

25
Table 2. Snow pit site coordinates with elevation, distance from the coast and snow pitdepth. SI refers to sea ice and AWS refers to automatic weather station in thearea (Reijmer, 2001) and adjacent snow pit sites.
Site Latitude Longitude Approx.elevationm a.s.l.
Distancefrom coast
km
Pit depth1999/2000
cm
Pit depth2000/2001
cm
Pit depth2003/2004
cm
SI1 70°07.4'S 05°23.1'E 0 17SI2 70°07.0'S 05°20.7'E 0 200 72°29.3'S 16°31.6'W 0 0 251 72°32.0'S 16°34.0'W 30 3 100 120 1522 72°36.6'S 16°18.6'W 250 15 150 120 -3a 72°40.0'S 16°41.9'W 55 20 100 - -3b 72°45.0'S 16°00.1'W 60 30 - 130 -3c 72°45.0'S 16°30.0'W 60 25 1124 72°45.2'S 14°18.3'W 70 70 200 - 1005 72°57.9'S 13°34.7'W 270 110 150 115 1006 73°02.0'S 13°19.5'W 250 120 200 - -7 73°03.6'S 13°21.8'W 250 120 100 - -8 73°05.3'S 13°20.2'W 240 120 120 - -9 73°04.1'S 13°28.2'W 235 120 150 115 -10 73°12.5'S 13°13.0'W 375 140 150 115 10011 73°26.3'S 14°26.7'W 990 130 200 150 -12 73°27.4'S 12°33.3'W 905 170 150 100 10013 73°43.0'S 12°18.6'W 930 195 110 - -14 74°00.8'S 12°01.1'W 980 230 150 110 10015 74°14.0'S 11°48.0'W 1000 250 130 - -16 74°28.7'S 11°33.1'W 1100 275 220 110 -17 74°59.9'S 10°00.5'W 2550 355 160 105 -
AWS4 72°45.1'S 15°30.0'W 60 45 - - 4 x 100AWS5 73°06.2'S 13°09.8'W 370 130 - - 4 x 100AWS6 74°29.0'S 11°31.2'W 1100 275 - - 4 x 100
4. Summary of articles
This thesis consists of four articles published and one submitted in 2002-2006. Thearticles present the physical and chemical stratigraphic results from the upper 1-2 m ofthe snow pits and evaluate the spatial variations and seasonal signals of the parametersin western Dronning Maud Land. The annual accumulation rates in the measurementarea were calculated. In addition the meteorological conditions near the Aboa stationwere reported.
4.1 Article I
Kärkäs, E., H.B. Granberg, C. Lavoie, K. Kanto, K. Rasmus and M. Leppäranta. 2002.Physical properties of the seasonal snow cover in Dronning Maud Land, East-Antarctica. Annals of Glaciology 34, 89-94.

26
In this study the physical properties of the most recent annual snow accumulation wereinvestigated along a 350-km transect from the sea ice to the polar plateau in DronningMaud Land during the austral summer of 1999/2000 for the presence of spatial andtemporal variations. The optical measurements were included and studied together withthe other properties. Three of the measurement sites were in very remote locations(Kvitkuven ice rise, Högisen ice dome and Amundsenisen on the plateau).
The results showed widespread spatial variations in snow property profiles and layering,and five principal snow zones with different characteristics in the area were suggested.The seaward edge of the ice shelf was clearly distinguished from the rest of the ice shelfand the local topographic highs were distinct from the nearby ice sheet. The studyrevealed that the distance from the sea and moisture source affect the snow properties inthis coastal location. The small-scale variations were influenced especially by localtopography, due to the reduced speed of the katabatic winds.
4.2 Article II
Kärkäs, E., T. Martma and E. Sonninen. 2005. Surface snow properties and stratigraphyduring the austral summer in western Dronning Maud Land, Antarctica. Polar Research24(1-2), 55-67.
This paper compared the physical properties of the surface snow and annualaccumulation rates measured in shallow snow pits (1-2 m) during three austral summers(1999/2000, 2000/2001 and 2003/2004) in coastal Dronning Maud Land along a 350-km transect from the ice edge to the plateau. The δ18O ratios, stratigraphies and annualaccumulation rates were examined in detail. A large number of snow-grain images wereanalysed to determine the snow-grain sizes.
The results reveal wide spatial and temporal variations in the measurement area that arethe key to understanding the results obtained from deep ice cores and remote sensingapplications. Some measured quantities remained fairly constant with increasingdistance from the ice edge to the polar plateau, while the elevation varied from 30 to2550 m a.s.l. Although some of the properties showed no visible trends from the coastto inland regions, they varied widely at individual sites, reflecting the great importanceof these spatial studies. The δ18O profiles were the most effective tools available fordating the annual accumulation layers. Our results confirmed that conductivity, grainsize, δ18O ratio and accumulation rate clearly decreased with increasing distance inlandfrom the ice edge. The snow temperature correlated most favourably with the surfaceelevation, which in Antarctica increases with increasing distance from the ice edge. Thedepth hoar layers, when they occurred, were usually found below the thin, hard ice crustand the Snow Fork device was able to detect these low-density layers. The frequencydistribution of the snow-grain sizes was skewed to the right, with the mean grain sizevarying seasonally between 1.5 and 1.8 mm.
4.3 Article III
Kärkäs, E., K. Teinilä, A. Virkkula and M. Aurela. 2005. Spatial variations of surfacesnow chemistry during two austral summers in western Dronning Maud Land,Antarctica. Atmospheric Environment 39, 1405-1416.
27
In this paper the glaciochemical properties of the most recent precipitation, includingthe topmost 5 cm, of surface snow were measured and their spatial variationsinvestigated during two austral summers in 1999/2000 and 2000/2001, along ameasurement transect from the sea ice to the plateau in western Dronning Maud Land.The nss fractions, enrichment factors and ionic balances were calculated and detailedstatistical analyses conducted. The ionic concentrations were combined with aerosolmeasurements performed simultaneously at the Aboa station to determine the fraction ofdry deposition in the ionic concentrations.
The results showed that in the summer surface snow the sea-salt components, MSA andnssSO4
2- decreased exponentially with increasing distance from the ice edge, with ratesof decrease of 48 - 64% per 100 km and correlation coefficients of –0.77 to –0.89.There was no trend for NO3
- in the surface snow. Spatial variations within single siteswere large, most possible due to wind redistribution. Crustal sources were visible nearthe nunataks. The results revealed that usually less than 10% of the depositionoriginated from dry deposition near the Aboa station.
4.4 Article IV
Kanto, E., K. Teinilä, H. Timonen and E. Sonninen. Stratigraphy and spatial variationsof snow chemistry in western Dronning Maud Land, Antarctica. Submitted to NordicHydrology.
In this study the ionic concentrations of the most recent annual accumulation wereanalysed and investigated together with snow stratigraphy in coastal Dronning MaudLand in 2003/2004. The measurement area was located on the ice shelf and on the icesheet between two mountain ranges. The high-resolution samples were collected in 19snow pits. A total of four adjacent pits at each of three AWS locations were measured todetermine the local spatial variation. Here we combined the chemical, isotopic andphysical stratigraphic profiles to investigate their seasonal and spatial variations. Thenss fractions and ionic balances were also calculated.
The results showed that the sea-salt components predominated in the coastal region andthat the widest spatial and temporal variations with the most pronounced exponentialdecreases occurred at progressive distances inland from the ice edge. The ionicconcentrations of sea salts at the site on the seaward edge of the ice shelf wereanomalous high compared with those at other sites. For the less studied oxalate (Ox2-)the ocean is apparently a major source and its concentrations also clearly decreased withincreasing distance from the ice edge. The NO3
- concentration increased linearly withdistance from the coast, in contrast to our earlier results. Seasonal sea-salt variations aremore visible behind the grounding line, indicating the interference of strong summerstorms in the flat ice shelf area. The concentrations and seasonal cycles varied widelyamong pits at single sites mainly due to the redistribution of snow by wind and sastrugitopography, thus revealing the necessity for further detailed investigations of spatialvariations. The mean NO3
- values of the annual layers increased linearly with increasingdistance from the ice edge and the highest concentrations were detected in associationwith the depth hoar layers. Distinct summer surface peaks were observed with thenitrogen- and sulphur-containing compounds and were good dating tools for use in the

28
measurement area. About two thirds of the sea-salt peaks occurred during wintershowing the uncertainty of the use of sea salts for accurate dating.
4.5 Article V
Kärkäs, E. 2004. Meteorological conditions of the Basen nunatak in western DronningMaud Land, Antarctica, during the years 1989-2001. Geophysica 40(1-2), 39-52.
In this paper, the meteorological data from the Aboa station covering the time period1989-2001 and showing the special microclimate conditions in the nunatakenvironment, were statistically analysed. In 2001 this old AWS broke down and a newstation was set up during the 2002/2003 season at a different location. This studycomprises the whole existing dataset from the previous weather station. The monthlyand annual mean values as well as the recorded extremes were reported. The data werecompared with some other AWSs in Dronning Maud Land.
The data showed that the wind directions were locally redistributed due to the nunatakand that the nunatak also affected the summer air temperature values. A total of 77% ofthe observed wind speeds were 10 m s-1; highest wind speeds were recorded duringJune and August and were connected with cyclonic storms. The mean annual airtemperature at Aboa was –15 C; the air temperature and wind speed displayed annualcycles and a semiannual oscillation was seen in the air pressure data. The GermanNeumayer station was also a good reference for the Aboa area, even though it is locatedabout 330 km away on the ice shelf.
4.6 Author’s contribution
The author's own contribution to each publication mentioned above is shown in Table 3,classified into three categories: theory, technique (includes sample collection,preparation and analytical work) and writing (includes data analysis and writing of thearticles).
Table 3. Percentages of author's own contribution to each publication:
Paper Theory Technique Writing
I >70 70 70II 100 50-70 100III 50-70 50-70 70IV >70 50-70 >70V 100 - 100
In I, the first author was responsible for collecting and processing all data, except theradiation measurements and the δ18O analysis, and for most of the writing except theradiation measurements and part of the Introduction; the other authors were responsiblefor Figures 1 and 4. The general background behind the study was based on theMaster’s thesis of the first author.

29
In II, the first author performed the field measurements and collected the snow samplesfor the δ18O analyses, and was responsible for the data analysis, interpretation, allfigures and the writing. The other authors were responsible for the δ18O analysis.
In III, the first author collected the snow samples and was responsible for the dataprocessing, figures and most of the writing. The other authors were responsible for thechemical analyses, for collecting and analysing the filter samples and suggested thatcalculating the rate of decrease would aid in interpretation of the data.
In IV, the first author collected the snow samples and was responsible for the snowstratigraphy studies, most of the interpretation, writing, all calculations and the figures.The other authors were responsible for the chemical (including δ18O) analyses.
In V, the author was not involved in data collecting, but received the rawmeteorological data from the Finnish Institute of Marine Research.
5. Synthesis of results
The variation in all measured properties was wide at single sites, mostly due to theredistribution of snow by winds and sastrugi topography, thus revealing the importanceof spatially representative measurements. Detailed measurements of the spatialvariations in snow properties and in the annual accumulation of snow on the ice sheetare needed to obtain spatially representative results and to further use them ininterpreting ice cores and satellite images.
In the coastal area of western Dronning Maud Land with a gentle surface slope, thedistance from the coast is more important factor controlling the variations in snowproperties than the surface elevation. Physical properties that are strongly affected bythe moisture source (conductivity, grain size, δ18O ratio and accumulation rate) clearlydecreased continuously from the ice edge to the polar plateau. Also the ionicconcentrations of sea salts (Na+, Cl- and Mg2+), MSA and nssSO4
2- tended to decreasefrom the ice edge to the inland regions. The concentrations of sea-salt ions of the wholeaccumulation layer showed more rapid decrease from the ice shelf edge to inlandregions than those found earlier in the same area only for summer surface snow. Theopposite was found for the MSA and nssSO4
2- concentrations with more rapid decreaseof the summer surface values than those found for the whole accumulation year. TheNO3
- concentration showed inconsistent results; while investigating only the summersurface in 1999/2000 and 2000/2001 there was no visible trend from the coast to inlandbut in 2003/2004 the NO3
- concentration of accumulation layer increased from the coastto the inland regions. The post-depositional processes might change the NO3
-
concentrations in the snow cover and also the clear seasonality might cause thesedifferent results. During the austral summer, the nunataks locally affected on the ionicconcentrations of nssK+ and nssCa2+ and the pH values.
Many of the measured ionic profiles showed seasonal signals and the chemical recordsare generally used for dating snow and ice layers. Before interpreting the past, thecomposition and the origin of the present chemical impurities deposited in polar snowhave to be understood. The scavenging processes predominate in the area; usually less

30
than 10% of the total deposition of surface snow was dry deposition near the Aboastation, with the exception of Ca2+. The observed seasonality in the chemical profileswas most pronounced in the nitrogen (NO3
- and NH4+)- and sulphur-containing
(nssSO42- and MSA) compounds. The nssSO4
2- and δ18O profiles were the mosteffective dating tools. Based on measurements performed during three different seasonsand the δ18O profiles the mean snow accumulation on the ice shelf was 312 ± 28 mmw.e., on the ice sheet between two coastal mountain ranges 215 ± 43 mm w.e. and onthe plateau 92 ± 25 mm w.e.
The stratigraphy in the coastal area was very diverse and several ice layers and depthhoar layers were found within a single accumulation year. The depth hoar layers wereassociated with low dielectric constant values. The highest concentration of NO3
- wasdetected in association with those low-density, coarse-grained depth hoar layers thatusually form under thin ice crust during the hiatus in accumulation in the australsummer or that represent buried surface hoar. The ice layers were thick near the coastand consisted mostly of thin crusts behind the grounding line.
Based on the results the snow properties varied among the ice shelf, coastal region andpolar plateau. Heimefrontfjella forms a steep step in the landscape and causes changesin the gradients of the properties studied in the direction of the plateau. In addition tothese three snow zones two subgroups could be distinguished: local topographic highsand the edge of the ice shelf. Snow was less densely packed and had a smooth surfacedue to the reduced effect of wind on the local topographic highs. The seaward edge ofthe ice shelf was an abnormal site that clearly influenced snow properties (highconductivity and ionic concentrations) and summer melting in the vicinity of sea.
From the visual interpretation of the RADARSAT mosaic a significantly lower intensityof backscattered signal (appearing darker) was observed for the local topographic highs,Kvitkuven ice rise and Högisen ice dome. Both sites had visible smoother surface,lower dielectric constant and snow density values than nearby valleys due to lighterwind action. There were no thick ice layers indicating melting-refreezing on the highs.Heterogeneous snowpacks appear brighter than homogeneous ones. That was alsoobserved at the most coastal site (1) where bigger snow grains, higher dielectricconstant values and thick ice layers caused visible stronger backscattering compared tothe rest of the measurement area. Backscattering over dry snow is dependent on snowdensity, grain size, free liquid water content and stratification. The observed snowproperties could be used as the validation data in remote sensing applications.
The measured wind speed values from Aboa verify that the snow-drifting could causenotable amount of removal and sublimation from the snow surface and has an effect onthe surface mass balance. The maximum air temperatures show that there occursmelting and melt water refreezing in snow cover during summer near the groundingline. Even though the effect of the Basen nunatak could be seen in the AWS data(especially air temperature, wind speed and direction) from Aboa, it could be used todescribe the general meteorological conditions in the measurement area and the resultscorrelated well with the data obtained from the German Neumayer station.
31
6. References
Akitaya, E. 1974. Studies on depth hoar. Contribution from the Institute of LowTemperature Science A26, 1-67.
Andreae, M.O. and H. Raemdonck. 1983. Dimethylsulfide in the surface ocean and themarine atmosphere: A global view. Science 221, 744-747.
Bindschadler, R. 1998. Monitoring ice sheet behavior from space. Reviews ofGeophysics 36(1), 79-104.
Bintanja, R. 1998. The contribution of snowdrift sublimation to the surface massbalance of Antarctica. Annals of Glaciology 27, 251-259.
Brandt, R. E. and S.G. Warren. 1993. Solar-heating rates and temperature profiles inAntarctic snow and ice. Journal of Glaciology 39(131), 99-110.
Brandt, R.E. and S.G. Warren. 1997. Temperature measurements and heat transfer innear-surface snow at the South Pole. Journal of Glaciology 43(144), 339-351.
Colbeck, S.C. 1982a. An overview of seasonal snow metamorphism. Reviews ofGeophysics and Space Physics 20(1), 45-61.
Colbeck, S.C. 1982b. Growth of faceted crystals in a snow cover. CRREL Report 82-29.27 pp.
Colbeck, S.C. 1989. Snow crystal growth with varying surface temperatures andradiation penetration. Journal of Glaciology 35(119), 23-29.
Colbeck, S.C. 1997. A review of sintering in seasonal snow cover. CRREL Report 97-10. 11 pp.
Colbeck, S.C. 1991. The layered character of snow covers. Reviews of Geophysics29(1), 81-96.
Colbeck, S.C. 1993. The vapour diffusion coefficient for snow. Water ResourcesResearch 29(1), 109,115.
Colbeck, S., E. Akitaya, R. Armstrong, H. Gubler, J. Lafeuille, K. Lied, D. McClungand E. Morris. 1990. The international classification for seasonal snow onthe ground. Wallingford, Oxon, International Association of ScientificHydrology. International Commission on Snow and Ice.
Craven, M. and I. Allison. 1998. Firnification and the effects of wind-packing onAntarctic snow. Annals of Glaciology 27, 239-245.
Dansgaard, W. 1964. Stable isotopes in precipitation. Tellus 16(4), 436-468.Delaygue, G., V. Masson, J. Jouzel, R.D. Koster and R.J. Healy. 2000. The origin of
Antarctic precipitation: a modelling approach. Tellus 52B(2000), 19-36.Delmas, R.J. 1992. Environmental information from ice cores. Reviews of Geophysics
30(1), 1-21.Gallée, H. 1998. Simulation of blowing snow over the Antarctic ice sheet. Annals of
Glaciology 26, 203-206.Giovinetto, M.B. and H.J. Zwally. 2000. Spatial distribution of net surface
accumulation on the Antarctic ice sheet. Annals of Glaciology 31, 171-178.Giovinetto, M.B., N.M. Waters and C.R. Bentley. 1990. Dependence of Antarctic
surface mass balance on temperature, elevation, and distance to open ocean.Journal of Geophysical Research 95(D4), 3 517-3 531.
Gjessing, Y. 1984. Marine and non-marine contribution to the chemical composition ofsnow at the Riiser-Larsenisen ice shelf in Antarctica. AtmosphericEnvironment 18(4), 825-830.

32
Goodwin, I.D. 1991. Snow-accumulation variability from seasonal surface observationsand firn-core stratigraphy, eastern Wilkes Land, Antarctica. Journal ofGlaciology 37(127), 383-387.
Granberg, H.B. 1998. Snow cover on sea ice. In Leppäranta, M. (ed.) Physics of ice-covered seas Vol. 2. IAPSO Sea Ice Commission. University of Helsinki,605-649.
Gray, J.M.N.T. and L.W. Morland. 1995. The compaction of polar snow packs. ColdRegion Science and Technology 23(1995), 109-119.
Hallikainen, M. and D. Winebrenner. 1992. The physical basis for sea ice remotesensing. In Carsey, F.D. and 7 others (eds.) Microwave remote sensing ofsea ice. Washington, DC, American Geophysical Union, GeophysicalMonograph Series 68, 29-46.
Hambrey, M. and J. Alean. 2004. Glaciers, 2nd edition. New York, CambridgeUniversity Press. 376 pp.
Hammer, C. U. 1983. Initial direct current in the build-up of space charges and theacidity of ice cores. Journal of Physical Chemistry 87, 4 099-4 103.
Isaksson, E. and W. Karlén. 1994a. High resolution climatic information from short firncores, western Dronning Maud Land, Antarctica. Climatic Change 26, 421-434.
Isaksson, E. and W. Karlén. 1994b. Spatial and temporal patterns in snow accumulation,western Dronning Maud Land, Antarctica. Journal of Glaciology 40(135),399-409.
Jezek, K.C. 1999. Glaciologic properties of the Antarctic ice sheet from spacebornesynthetic aperture radar observations. Annals of Glaciology 29, 286-290.
Johnsen, S.J. 1977. Stable isotope homogenization of polar firn and ice. InternationalAssociation of Hydrological Sciences Publication 118, 210-219.
Jones, A.E., R. Weller, E.W. Wolff and H.-W. Jacobi. 2000. Speciation and rate ofphotochemical NO and NO2 production in Antarctic snow. GeophysicalResearch Letters 27, 345-348.
Jouzel, J., R. B. Alley, K. M. Cuffey, W. Dansgaard, P. Grootes, G. Hoffmann, S. J.Johnsen, R. D. Koster, D. Peel, C. A. Shuman, M. Stievenard, M. Stuiverand J. White. 1997. Validity of the temperature reconstruction from waterisotopes in ice cores. Journal of Geophysical Research 102(C12), 26 471-26487.
King J. C. and W.M. Turner. 1997. Antarctic meteorology and climatology. CambridgeUniversity Press, New York. 409 pp.
Kojima, K. 1964. Densification of snow in Antarctica. In Mellor, M. (ed.) Antarcticsnow and ice studies. Washington, DC, American Geophysical Union,Antarctic Research Series Vol. 2, 157-218.
König, M., J.-G. Winther and E. Isaksson. 2001. Measuring snow and glacier iceproperties from satellite. Reviews of Geophysics 39, 1-27.
Legrand, M.R. and R.J. Delmas. 1988. Formation of HCl in the Antarctic atmosphere.Journal of Geophysical Research 93(D6), 7 153-7 168.
Legrand, M. and C. Feniet-Saigne. 1991. Methanesulfonic acid in south polar snowlayers: a record of strong El Nino? Geophysical Research Letters 18(2),187-190.
Legrand, M., C. Feniet-Saigne, E. S. Saltzman and C. German. 1992. Spatial andtemporal variations of methanesulfonic acid and non sea salt sulphate inAntarctic ice. Journal of Atmospheric Chemistry 14, 245-260.

33
Legrand, M. and P. Mayewski. 1997. Glaciochemistry of polar ice cores: a review.Reviews of Geophysics 35(3), 219-243.
Legrand, M., F. Ducroz, D. Wagenbach, R. Mulvaney and J. Hall. 1998. Ammonium incoastal Antarctic aerosol and snow: Role of polar ocean and penguinemissions. Journal of Geophysical Research 103(D9), 11 043-11 056.
Legrand, M. and E. C. Pasteur. 1998. Methane sulfonic acid to non-sea-salt sulphateratio in coastal Antarctic aerosol and surface snow. Journal of GeophysicalResearch 103(D9), 10 991-11 006.
Lesaffre, B., E. Pougatch and E. Martin. 1998. Objective determination of snow-graincharacteristics from images. Annals of Glaciology 26, 112-118.
McKay, G.A. and D. M. Gray. 1981. The distribution of snowcover. In Gray, D.M. andD.H. Male (eds.) Handbook of Snow. Pergamon Press. Canada, 153-190.
Mellor, M. 1975. A review of basic snow mechanics. International Association ofHydrological Sciences Publication 114, 251-291.
Mosley-Thompson, E., P.D. Kruss, L.G. Thompson, M. Pourchet and P. Grootes. 1985.Snow stratigraphic record at South Pole: potential for paleoclimaticreconstruction. Annals of Glaciology 7, 26-33.
Mulvaney, R., G. F. J. Coulson and H. F. J. Corr. 1993. The fractionation of sea salt andacids during transport across an Antarctic ice shelf. Tellus 45B, 179-187.
Muszynski, I. and G. E. Birchfield. 1985. The dependence of Antarctic accumulationrates on surface temperature and elevation. Tellus 37A, 204-208.
Paterson, W.S.B. 1994. The physics of glaciers, 3rd edition. Tarrytown, New York,Pergamon/Elsevier Science, Inc. 480 pp.
Petit, J.R., J. Jouzel, D. Raynaud, N.I. Barkov, J.-M. Barnola, I. Basile, M. Bender, J.Chappellaz, M. Davis, G. Delaygue, M. Delmotte, V.M. Kotlyakov, M.Legrand, V.Y. Lipenkov, C. Lorius, L. Pépin, C. Ritz, E. Saltzman and M.Stievenard. 1999. Climate and atmospheric history of the past 420,000 yearsfrom the Vostok ice core, Antarctica. Nature 399, 429-436.
Pihkala, P. and E. Spring. 1985. A practical method for photographing snow samples.Report Series in Geophysics 20. 11 pp.
Proposito, M., S. Becagli, E. Castellano, O. Flora, L. Genoni, R. Gragnani, B. Stenni, R.Traversi, R. Udisti and M. Frezzotti. 2002. Chemical and isotopic snowvariability along the 1998 ITASE traverse from Terra Nova Bay to Dome C,East Antarctica. Annals of Glaciology 35, 187-194.
Reijmer, C. H. 2001. Antarctic meteorology -A study with automatic weather stations.PhD thesis, University of Utrecht. 158 pp.
Rignot, E. and R.H. Thomas. 2002. Mass balance of polar ice sheets. Science297(5586), 1502-1506.
Röthlisberger, R., M.A. Hutterli, S. Sommer, E.W. Wolff and R. Mulvaney. 2000.Factors controlling nitrate in ice cores: evidence from the Dome C deep icecore. Journal of Geophysical Research 105(D16), 20 565-20 572.
Schlosser, E. 1999. Effects of seasonal variability of accumulation on yearly mean δ18Ovalues in Antarctic snow. Journal of Glaciology 45(151), 463-468.
Schlosser, E. and H. Oerter. 2002a. Shallow firn cores from Neumayer, Ekströmisen,Antarctica: a comparison of accumulation rates and stable-isotope ratios.Annals of Glaciology 35, 91-96.
Schlosser, E. and H. Oerter. 2002b. Seasonal variations of accumulation and the isotoperecord in ice cores: a study with surface snow samples and firn cores fromNeumayer station, Antarctica. Annals of Glaciology 35, 97-101.

34
Schytt, V. 1958. Glaciology II. Snow and ice temperatures in Dronning Maud Land.Norwegian-British-Swedish Antarctic Expedition, 1949-52. ScientificResults IV, 153-179.
Sihvola, A. and M. Tiuri. 1986. Snow fork for field determination of the density andwetness profiles of a snow pack. IEEE Transactions on Geoscience andRemote Sensing GE-24(5), 717-720.
Tranter, M. and H.G. Jones. 2001. The chemistry of snow: processes and nutrientcycling. In Jones, H.G., J.W. Pomeroy, D.A. Walker and R.W. Hoham(eds). Snow ecology. Cambridge University press, 127-167.
Ulaby, F.T., R.K. Moore and A.K. Fung. 1986. Microwave remote sensing, active andpassive Vol. 3. From theory to applications. Addison-Wesley Publishing Co,Reading, MA. 1120 pp.
Van den Broeke, M.R., J.-G. Winther, E. Isaksson, J. F. Pinglot, L. Karlöf, T. Eiken andL. Conrads. 1999. Climate variables along a traverse line in Dronning MaudLand, East Antarctica. Journal of Glaciology 45(150), 295-302.
Winther, J.-G. 1993. Studies of snow surface characteristics by Landsat TM inDronning Maud Land, Antarctica. Annals of Glaciology 17, 27-34.