Embed Size (px)
Citation preview
Assam Jurisdictional REDD+ Project: Stakeholder map
Report on the RS/GIS Analysis to map Land Use
and Land Use Change in Nagaon
Lowering Emissions and Enhancing Forests (LEEF) in
Nagaon, Assam
Lowering Emissions and
Enhancing Forests (LEEF) in
Nagaon, Assam
Report on the RS/GIS Analysis to map Land Use and Land Use
Change in Nagaon
Assam Project on Forest and Biodiversity Conservation
&
IORA Ecological Solutions
pg. 3
Abbreviations
AFOLU Agriculture, Forestry and Other Land Use
APFBC Assam Project on Forest and Biodiversity Conservation
DoEF Department of Environment and Forests
EE Executive Entity
ER Emission Reductions
FDA French Development Agency
GHG Greenhouse Gas
GPS Global Positioning System
IPCC Inter-governmental Panel on Climate Change
LEEF Lowering Emissions, Enhancing Forests
LULC Land Use Land Cover
REDD Reducing Emissions from Deforestation and Forest Degradation
RS/GIS Remote Sensing/Geographic Information System
SDG Sustainable Development Goals
UNFCCC United Nations Framework Convention on Climate Change
Contents
ABBREVIATIONS ............................................................................................................................................................. 3
CONTENTS ....................................................................................................................................................................... 4
LIST OF FIGURES ............................................................................................................................................................ 4
LIST OF TABLES .............................................................................................................................................................. 4
EXECUTIVE SUMMARY ...................................................................................... ERROR! BOOKMARK NOT DEFINED.
1 INTRODUCTION ........................................................................................... ERROR! BOOKMARK NOT DEFINED.
2 DEVELOPMENT OF FOREST REFERENCE EMISSION LEVEL ............................................................................ 6
2.1 INTRODUCTION ........................................................................................................................................................... 6
2.2 LAND USE LAND COVER (LULC) CHANGES OVER THE HISTORICAL REFERENCE PERIOD ................................................ 6
2.3 METHODOLOGY .......................................................................................................................................................... 6
2.4 ANCILLARY DATA ...................................................................................................................................................... 12
2.5 PRE-PROCESSING OF REMOTE SENSING DATA ............................................................................................................ 12
3 ANALYSIS AND RESULTS ..................................................................................................................................... 13
4 QUANTIFICATION OF EMISSION REDUCTION ......................................... ERROR! BOOKMARK NOT DEFINED.
4.1 HISTORICAL REFERENCE PERIODS ........................................................................... ERROR! BOOKMARK NOT DEFINED.
4.2 ORGANIC MATTER CONTENT .................................................................................... ERROR! BOOKMARK NOT DEFINED.
4.3 EMISSION FACTORS ................................................................................................. ERROR! BOOKMARK NOT DEFINED.
4.4 BASELINE SCENARIO ................................................................................................ ERROR! BOOKMARK NOT DEFINED.
4.5 EMISSION REDUCTIONS AND SEQUESTRATION FROM IDENTIFIED INTERVENTIONS ....... ERROR! BOOKMARK NOT DEFINED.
4.6 NET EMISSION REDUCTIONS .................................................................................... ERROR! BOOKMARK NOT DEFINED.
4.7 LEAKAGE ................................................................................................................. ERROR! BOOKMARK NOT DEFINED.
List of Figures
Figure 1: Overview of REDD+ (Courtesy WWF) .............................................................. Error! Bookmark not defined. Figure 1: AFOLU represents largest emitting sector after energy (Source: adapted from IPCC AR5)Error! Bookmark not defined. Figure 16: Forest type map Nagaon, 2000 ........................................................................................................................ 8 Figure 17: Forest type map Nagaon, 2006 ........................................................................................................................ 9 Figure 18: Forest type map Nagaon, 2010 ........................................................................................................................ 9 Figure 19: Forest type map Nagaon, 2015 ...................................................................................................................... 10 Figure 20: Forest density map of Nagaon, 2000 ............................................................................................................. 10 Figure 21: Forest density map Nagaon, 2006 ................................................................................................................. 11 Figure 22: Forest density map Nagaon, 2010 ................................................................................................................. 11 Figure 23: Forest density map Nagaon, 2015 ................................................................................................................. 12 Figure 24: Detailed methodology for analysis of satellite imagery .................................................................................. 13 Figure 25: Forest change map of Nagaon, 2000 – 2006 ................................................................................................. 14 Figure 26: Forest change map of Nagaon, 2006 - 2010.................................................................................................. 14 Figure 27: Forest change map of Nagaon, 2010 - 2015.................................................................................................. 15 Figure 28: Forest change map of Nagaon, 2000 – 2006 ................................................................................................. 17 Figure 29: Forest change map of Nagaon, 2006 – 2010 ................................................................................................. 17 Figure 30: Forest change map of Nagaon, 2010 - 2015.................................................................................................. 18
List of Tables
Table 14: Characteristics of the satellite imagery used ..................................................................................................... 7
pg. 5
Table 15: Organic carbon content in various forest stratum ............................................................................................ 15 Table 34: Baseline Emissions ........................................................................................... Error! Bookmark not defined. Table 35: Activities planned towards Carbon sequestration ............................................ Error! Bookmark not defined. Table 36: Emissions Reductions from the LEEF REDD+ Project .................................... Error! Bookmark not defined.
1 Development of Forest Reference Emission Level
1.1 Introduction
Reference emission levels are the benchmark compared to which the removals and emissions from all the
carbon pools of the project will be compared and is measured in terms of carbon dioxide equivalent
(CO2e). Due to deforestation and forest degradation, there will be change/decrease in the land use type
and canopy density while conservation, enhancement and sustainable management will lead to increase
in the forest canopy density and quality. The baseline emissions in the year 2000 is considered as the
reference year and emissions or reductions of CO2e will be a benchmark to calculate any reductions that
will happen until the baseline is updated, and is termed the Reference Forest Emission Level. This section
details how the land use change has been mapped for this project to estimate the reference emission level
for this REDD+ project.
1.2 Land Use Land Cover (LULC) Changes over the Historical Reference Period
Detailed geospatial and on ground field analysis was undertaken to identify and assess the actual and
accurate changes in land use and forest canopy density in the project area over the selected historical
reference period. Analysis on remote sensing platforms, backed up by field data validation, has been
undertaken to accurately classify the LULC types in the district. This has enabled the development of maps
for various aspects of analysis – LULC maps, forest strata maps and Fractional Cover maps, to map the
deforestation and degradation over the historical reference period.
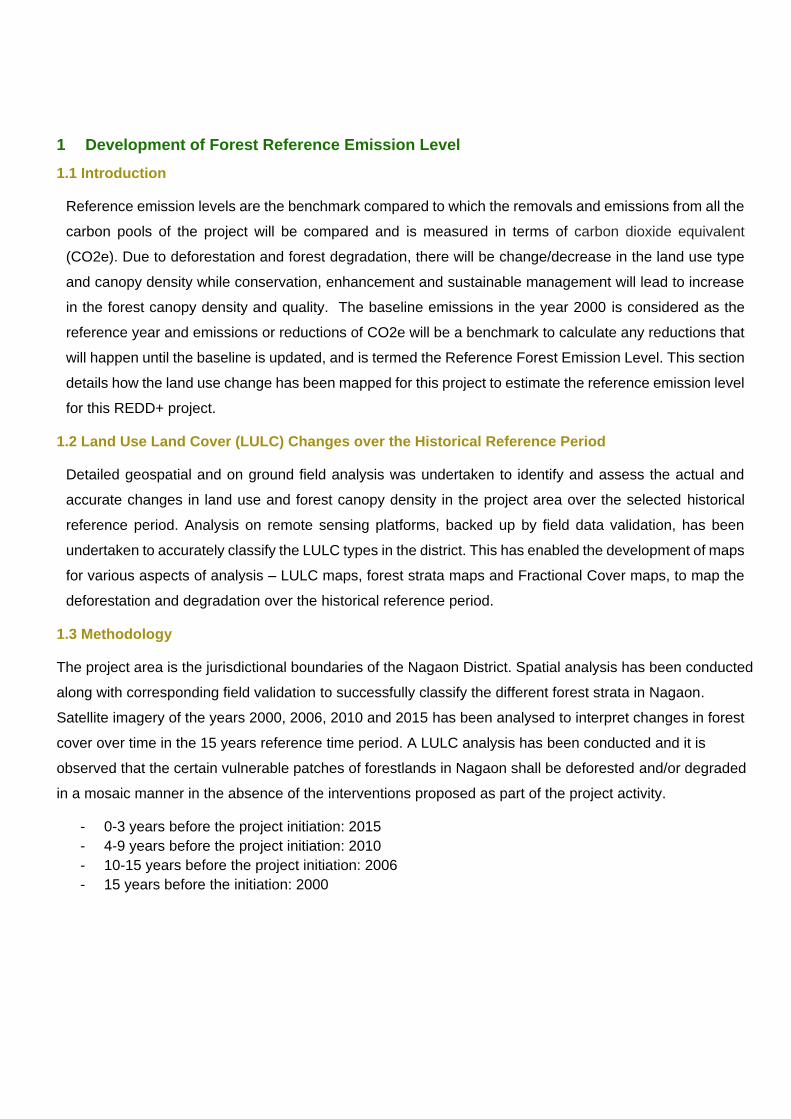
1.3 Methodology
The project area is the jurisdictional boundaries of the Nagaon District. Spatial analysis has been conducted
along with corresponding field validation to successfully classify the different forest strata in Nagaon.
Satellite imagery of the years 2000, 2006, 2010 and 2015 has been analysed to interpret changes in forest
cover over time in the 15 years reference time period. A LULC analysis has been conducted and it is
observed that the certain vulnerable patches of forestlands in Nagaon shall be deforested and/or degraded
in a mosaic manner in the absence of the interventions proposed as part of the project activity.
- 0-3 years before the project initiation: 2015
- 4-9 years before the project initiation: 2010
- 10-15 years before the project initiation: 2006
- 15 years before the initiation: 2000
pg. 7
Table 1: Characteristics of the satellite imagery used
Data Source Main Use
of Data Information about data collected
Medium resolution of 30 m LANDSAT data of at least one image for 4-time periods
Time Frame
His
torica
l a
naly
sis
of d
efo
resta
tio
n a
nd
fo
rest
de
gra
da
tio
n
0-3 years before
project start date
4-9 years before project
start date
10-15 years before
project start date.
Year of Satellite
Imagery
2015 (Landsat –
8) 2010 (Landsat-TM)
2006 and 2000 (Landsat
– TM )
Sources USGS
Earth Explorer
Type and
Resolution (spatial
and spectral)
Satellite imagery using visible (Green, Red), near-infrared bands (NIR),
Shortwave infrared (SWIR). It is a multi-spectral data with a spatial
resolution of 30m, operating in the visible, near infra-red, shortwave infra-
red and thermal region.
Coordinate system
and pre-processing
(If different sources
of remote sensing
data are used, a
formal comparison
of the sensors
should be added to
the monitoring
report to ensure
consistency)
WGS 84 – UTM zone 46N
Layer Extent: 599872.62 690630.18
3113204.24 2995881.73
LANDSAT multi-spectral sensor with a spatial resolution of 30 m,
operating in the visible, and near infra-red bands the shortwave infra-red
band, with a swath 185 km.
Minimum Mapping
Unit (ha)
Tra
inin
g o
f cla
ssific
ation
pro
ced
ure
s
Ind
ep
en
den
t ve
rifica
tio
n o
f th
e a
na
lysis
of h
isto
rica
l
ima
ges
≥1 hectare
Description of
method used to
produce these data
The LULC maps for historical baseline have been classified using
supervised approach with Maximum Likelihood Classifier (MLC).
Descriptions of the
LULC classes
and/or LULC-
change categories
The LULC classes or categories described are as follows:
1. App. Kamrup Sal Forest (AKS)
2. East Himalayan Mixed Deciduous Forest (EMMD)
3. Cachar Semi-Evergreen Forest (CSE)
4. Bamboo Brakes
5. Cropland
6. Waterbodies
7. Grassland
8. Other Land
9. Settlements
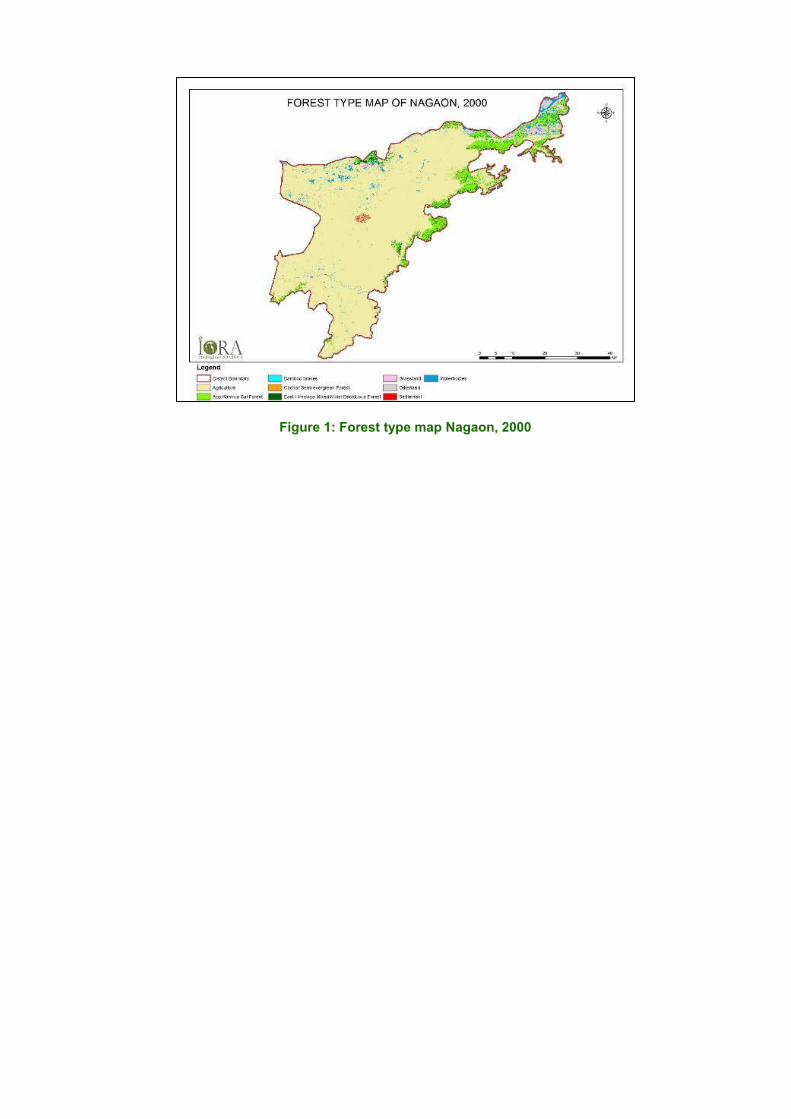
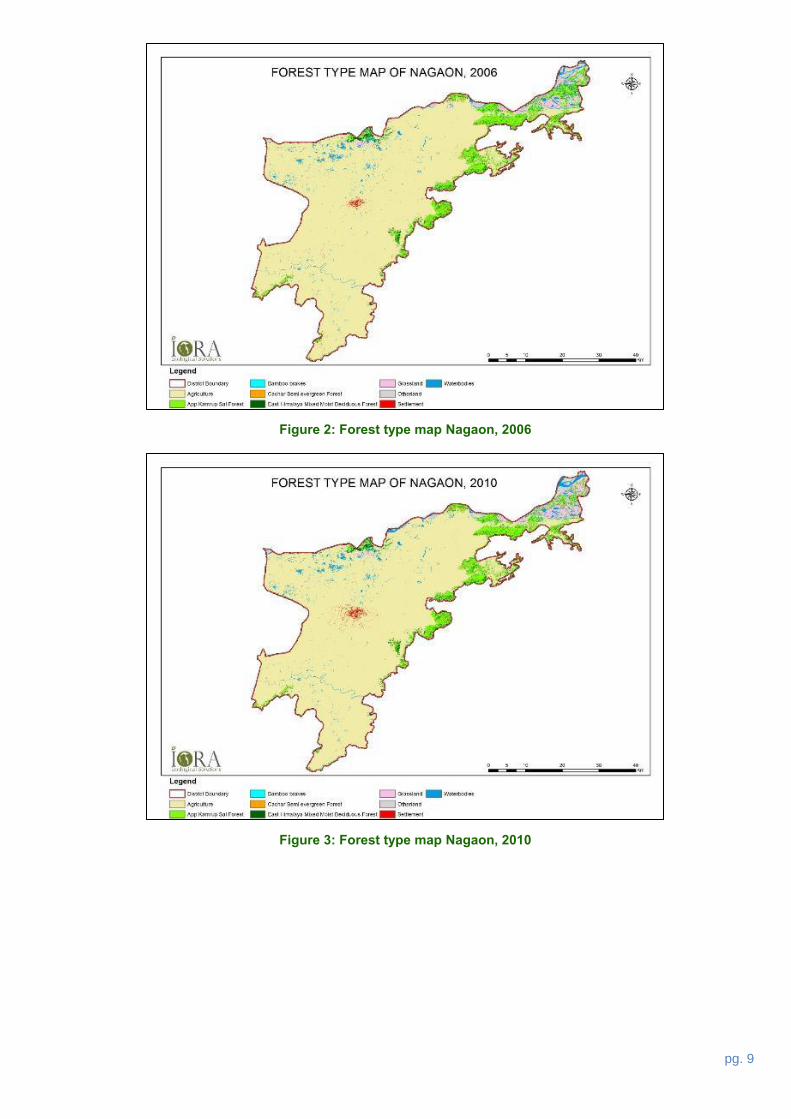
Figure 1: Forest type map Nagaon, 2000
pg. 9
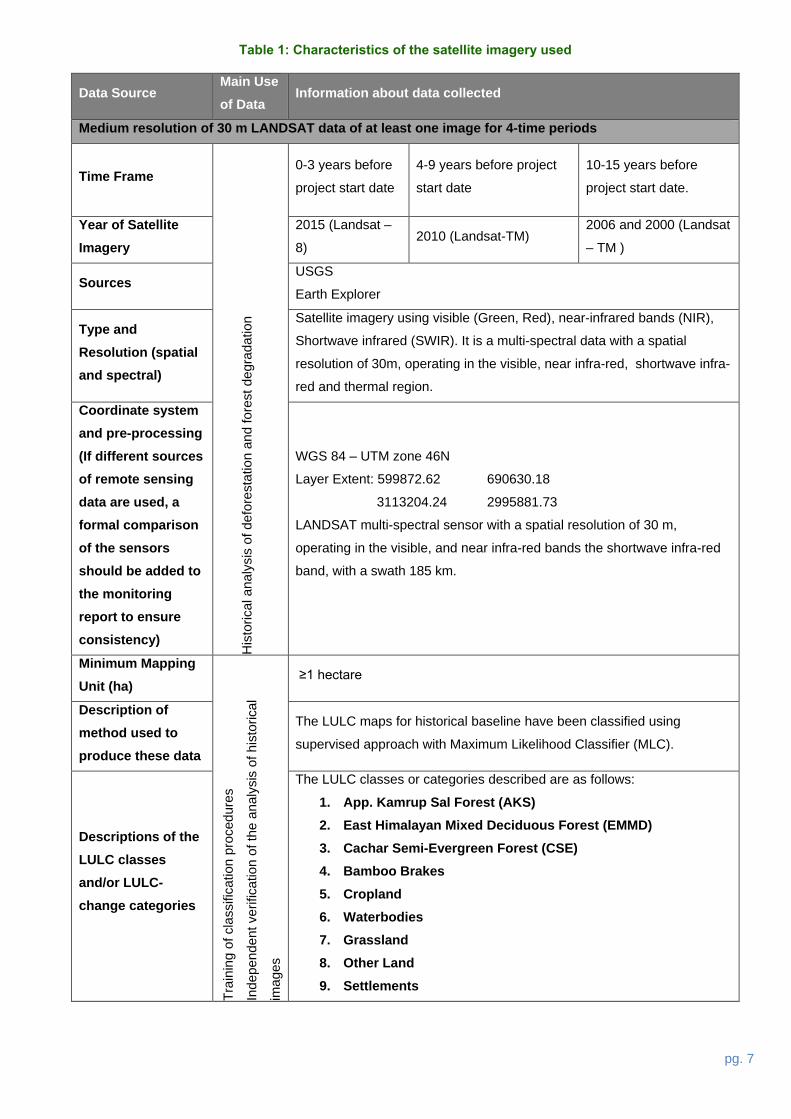
Figure 2: Forest type map Nagaon, 2006
Figure 3: Forest type map Nagaon, 2010
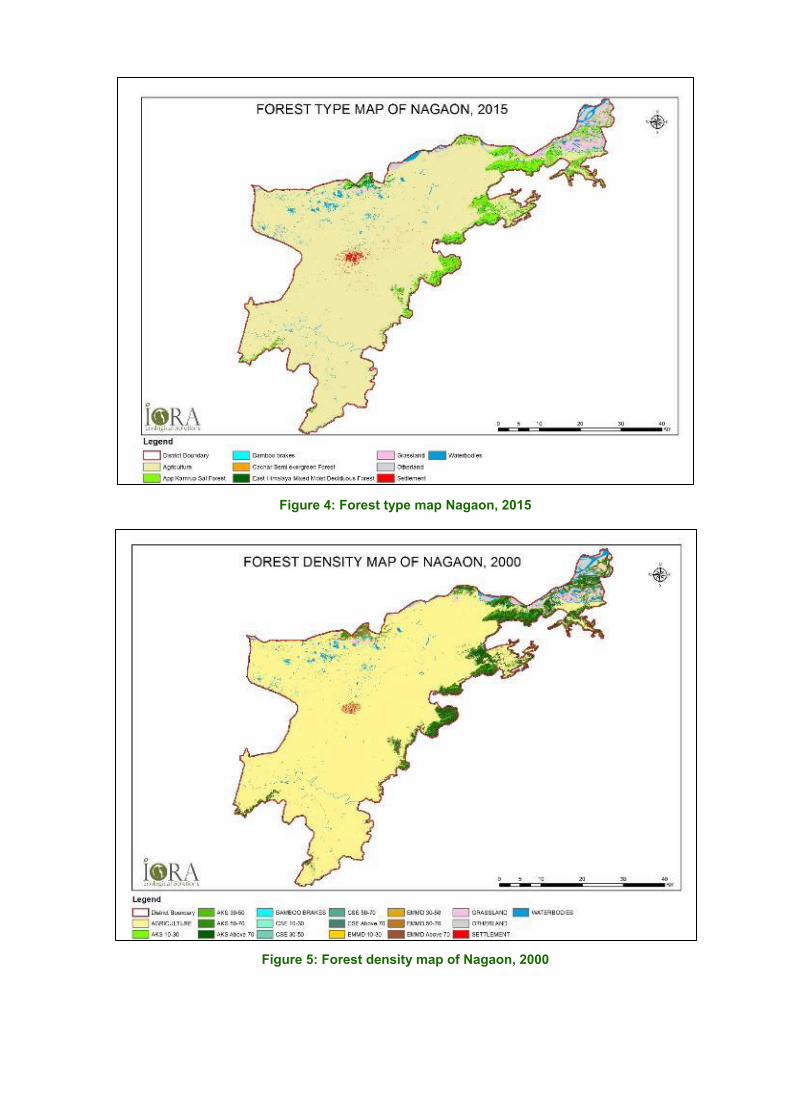
Figure 4: Forest type map Nagaon, 2015
Figure 5: Forest density map of Nagaon, 2000
pg. 11
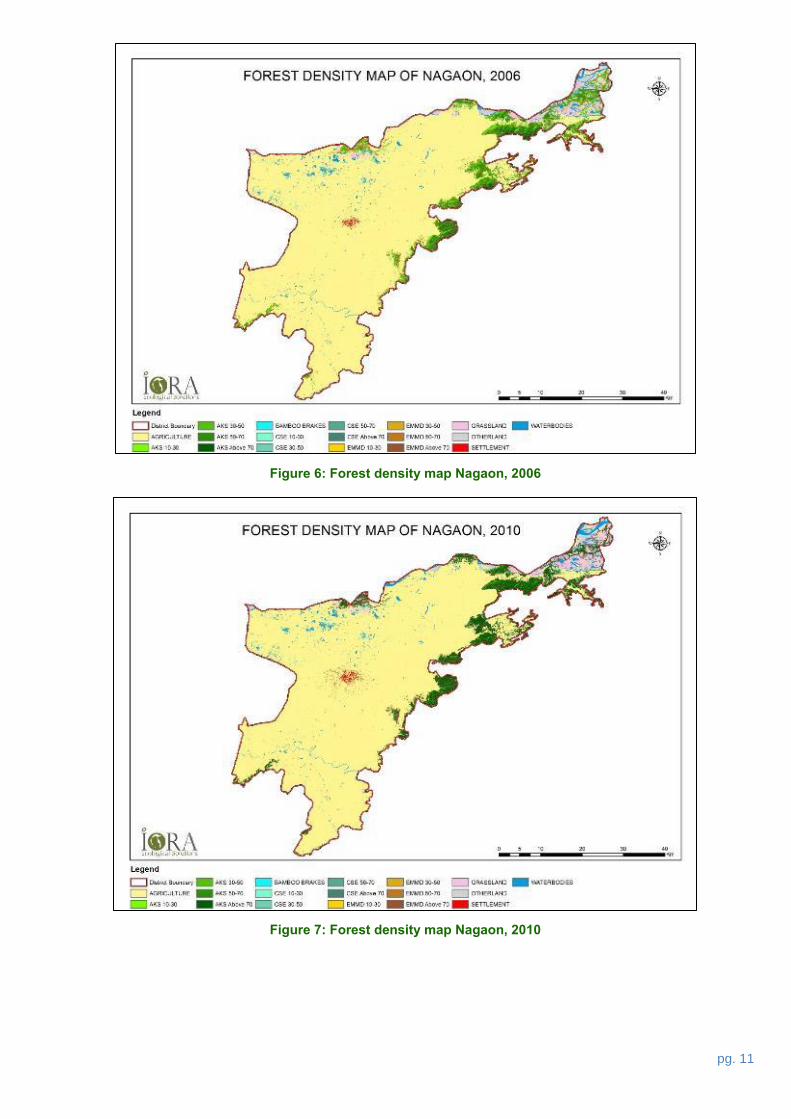
Figure 6: Forest density map Nagaon, 2006
Figure 7: Forest density map Nagaon, 2010
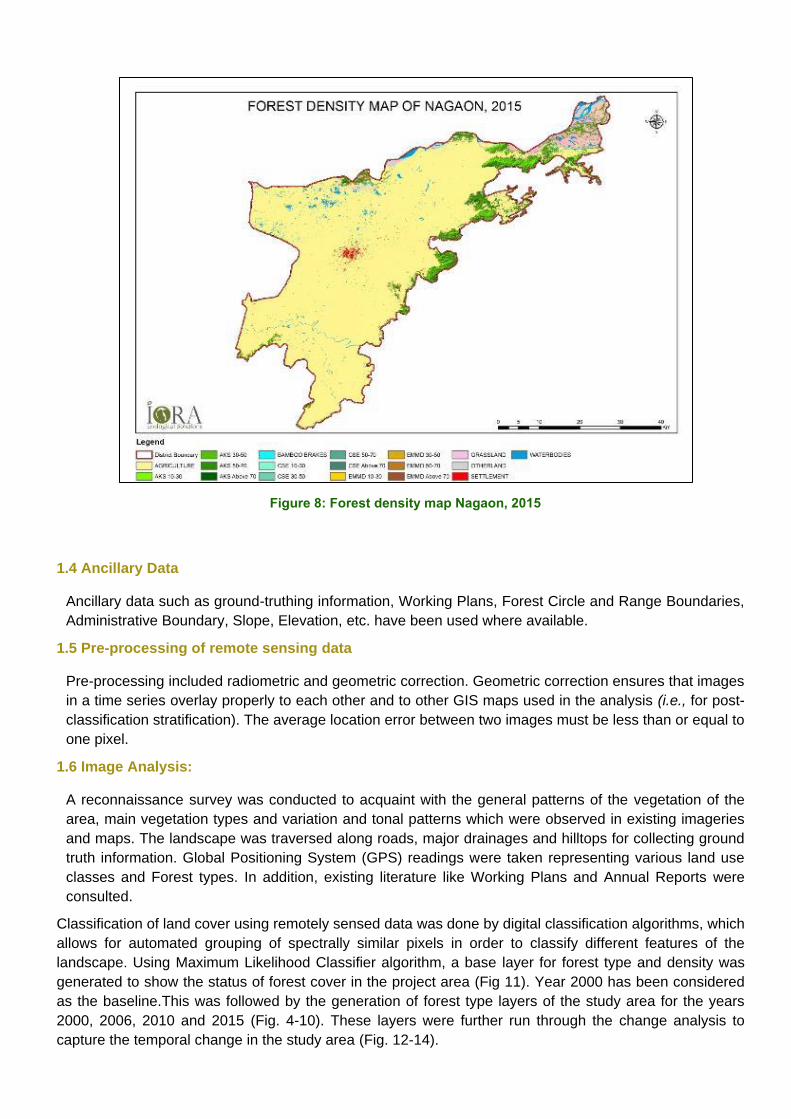
Figure 8: Forest density map Nagaon, 2015
1.4 Ancillary Data
Ancillary data such as ground-truthing information, Working Plans, Forest Circle and Range Boundaries,
Administrative Boundary, Slope, Elevation, etc. have been used where available.
1.5 Pre-processing of remote sensing data
Pre-processing included radiometric and geometric correction. Geometric correction ensures that images
in a time series overlay properly to each other and to other GIS maps used in the analysis (i.e., for post-
classification stratification). The average location error between two images must be less than or equal to
one pixel.
1.6 Image Analysis:
A reconnaissance survey was conducted to acquaint with the general patterns of the vegetation of the
area, main vegetation types and variation and tonal patterns which were observed in existing imageries
and maps. The landscape was traversed along roads, major drainages and hilltops for collecting ground
truth information. Global Positioning System (GPS) readings were taken representing various land use
classes and Forest types. In addition, existing literature like Working Plans and Annual Reports were
consulted.
Classification of land cover using remotely sensed data was done by digital classification algorithms, which
allows for automated grouping of spectrally similar pixels in order to classify different features of the
landscape. Using Maximum Likelihood Classifier algorithm, a base layer for forest type and density was
generated to show the status of forest cover in the project area (Fig 11). Year 2000 has been considered
as the baseline.This was followed by the generation of forest type layers of the study area for the years
2000, 2006, 2010 and 2015 (Fig. 4-10). These layers were further run through the change analysis to
capture the temporal change in the study area (Fig. 12-14).
pg. 13
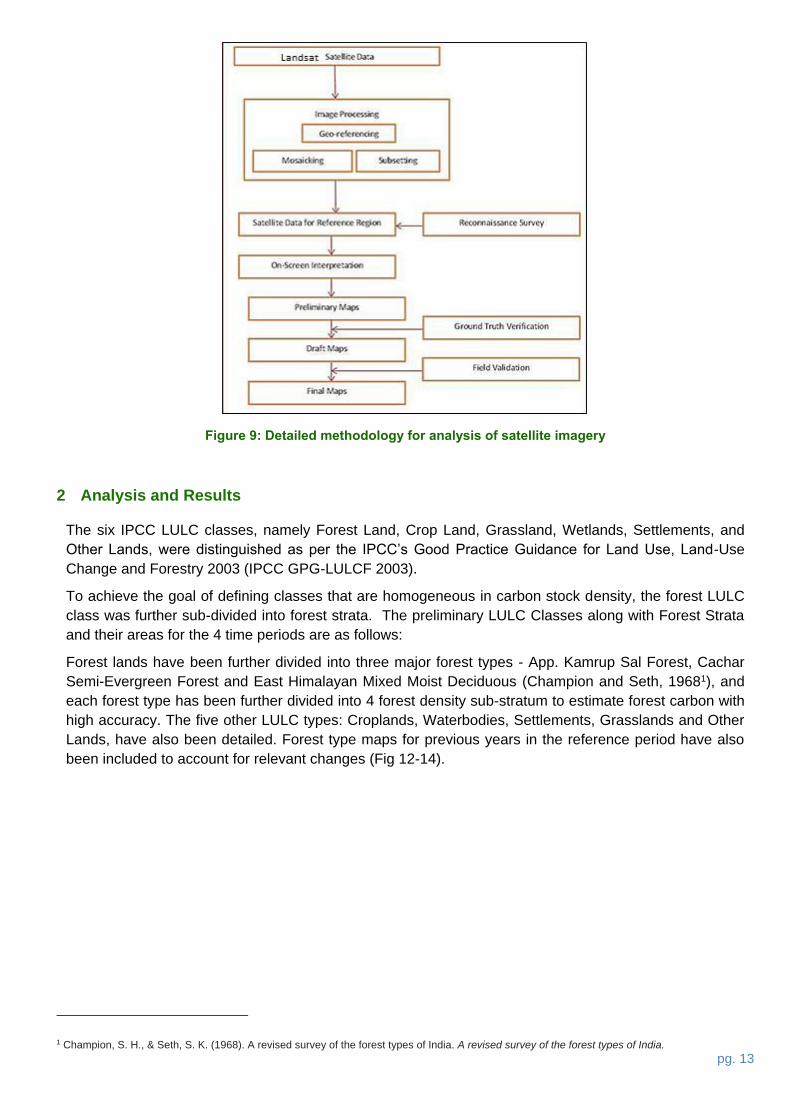
Figure 9: Detailed methodology for analysis of satellite imagery
2 Analysis and Results
The six IPCC LULC classes, namely Forest Land, Crop Land, Grassland, Wetlands, Settlements, and
Other Lands, were distinguished as per the IPCC’s Good Practice Guidance for Land Use, Land-Use
Change and Forestry 2003 (IPCC GPG-LULCF 2003).
To achieve the goal of defining classes that are homogeneous in carbon stock density, the forest LULC
class was further sub-divided into forest strata. The preliminary LULC Classes along with Forest Strata
and their areas for the 4 time periods are as follows:
Forest lands have been further divided into three major forest types - App. Kamrup Sal Forest, Cachar
Semi-Evergreen Forest and East Himalayan Mixed Moist Deciduous (Champion and Seth, 19681), and
each forest type has been further divided into 4 forest density sub-stratum to estimate forest carbon with
high accuracy. The five other LULC types: Croplands, Waterbodies, Settlements, Grasslands and Other
Lands, have also been detailed. Forest type maps for previous years in the reference period have also
been included to account for relevant changes (Fig 12-14).
1 Champion, S. H., & Seth, S. K. (1968). A revised survey of the forest types of India. A revised survey of the forest types of India.
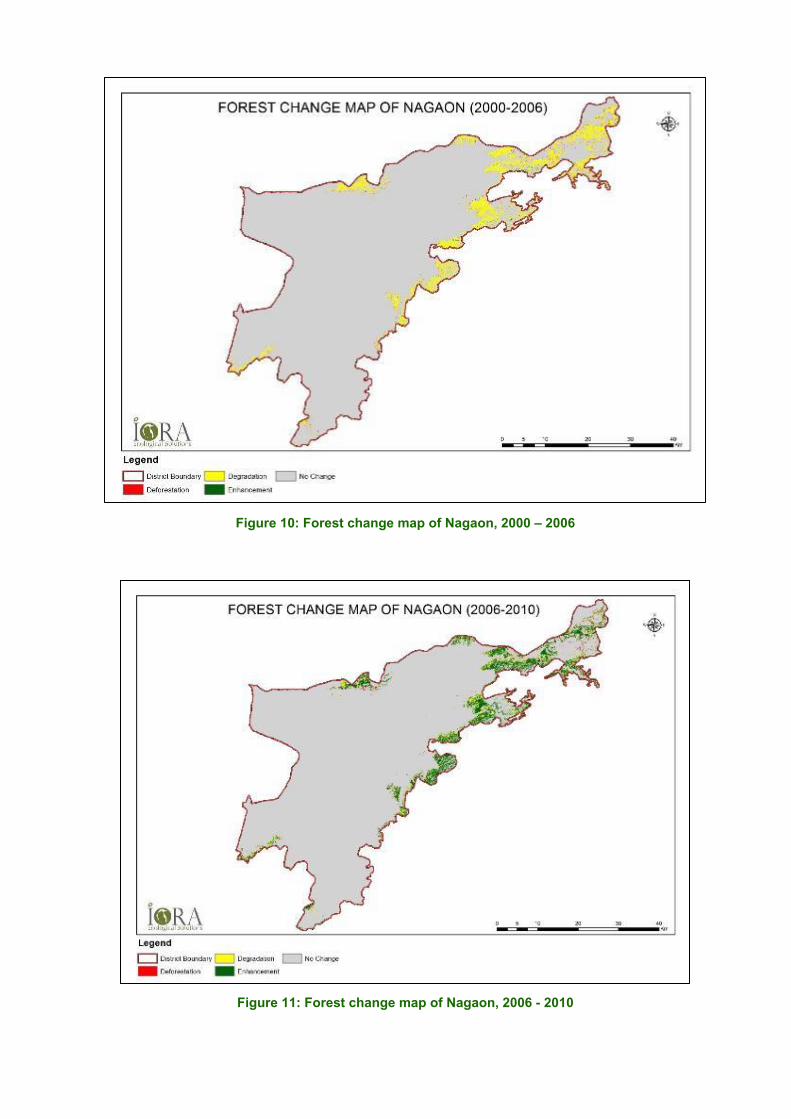
Figure 10: Forest change map of Nagaon, 2000 – 2006
Figure 11: Forest change map of Nagaon, 2006 - 2010
pg. 15
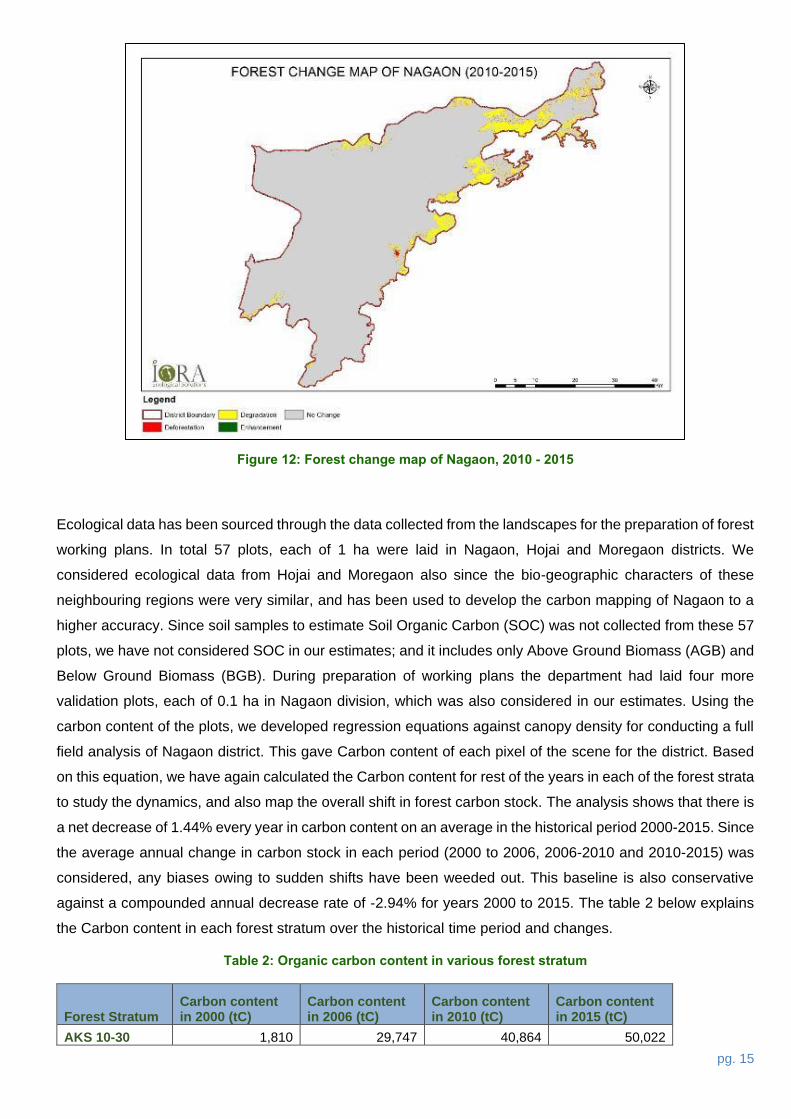
Figure 12: Forest change map of Nagaon, 2010 - 2015
Ecological data has been sourced through the data collected from the landscapes for the preparation of forest
working plans. In total 57 plots, each of 1 ha were laid in Nagaon, Hojai and Moregaon districts. We
considered ecological data from Hojai and Moregaon also since the bio-geographic characters of these
neighbouring regions were very similar, and has been used to develop the carbon mapping of Nagaon to a
higher accuracy. Since soil samples to estimate Soil Organic Carbon (SOC) was not collected from these 57
plots, we have not considered SOC in our estimates; and it includes only Above Ground Biomass (AGB) and
Below Ground Biomass (BGB). During preparation of working plans the department had laid four more
validation plots, each of 0.1 ha in Nagaon division, which was also considered in our estimates. Using the
carbon content of the plots, we developed regression equations against canopy density for conducting a full
field analysis of Nagaon district. This gave Carbon content of each pixel of the scene for the district. Based
on this equation, we have again calculated the Carbon content for rest of the years in each of the forest strata
to study the dynamics, and also map the overall shift in forest carbon stock. The analysis shows that there is
a net decrease of 1.44% every year in carbon content on an average in the historical period 2000-2015. Since
the average annual change in carbon stock in each period (2000 to 2006, 2006-2010 and 2010-2015) was
considered, any biases owing to sudden shifts have been weeded out. This baseline is also conservative
against a compounded annual decrease rate of -2.94% for years 2000 to 2015. The table 2 below explains
the Carbon content in each forest stratum over the historical time period and changes.
Table 2: Organic carbon content in various forest stratum
Forest Stratum Carbon content in 2000 (tC)
Carbon content in 2006 (tC)
Carbon content in 2010 (tC)
Carbon content in 2015 (tC)
AKS 10-30 1,810 29,747 40,864 50,022
Forest Stratum Carbon content in 2000 (tC)
Carbon content in 2006 (tC)
Carbon content in 2010 (tC)
Carbon content in 2015 (tC)
AKS 30-50 33,412 1,90,973 2,30,143 1,43,396
AKS 50-70 7,92,612 621,996 517,565 5,58,565
AKS Above 70 7,36,273 2,96,166 355,247 3,65,660
EMMD 10-30 138 1,816 3,985 790
EMMD 30-50 1,599 56,272 79,594 11,193
EMMD 50-70 2,03,580 2,28,725 2,39,683 3,13,935
EMMD Above 70 766,431 1,19,601 2,49,458 1,80,007
CSE 10-30 10 44 168 29
CSE 30-50 417 520 1,081 457
CSE 50-70 15,694 9,847 17,535 16,080
CSE Above 70 2,37,423 1,09,142 1,80,470 1,65,738
BAMBOO BRAKES 1,17,601 42,157 24,244 51,841
Total 29,06,999 17,07,007 19,40,036 18,57,712
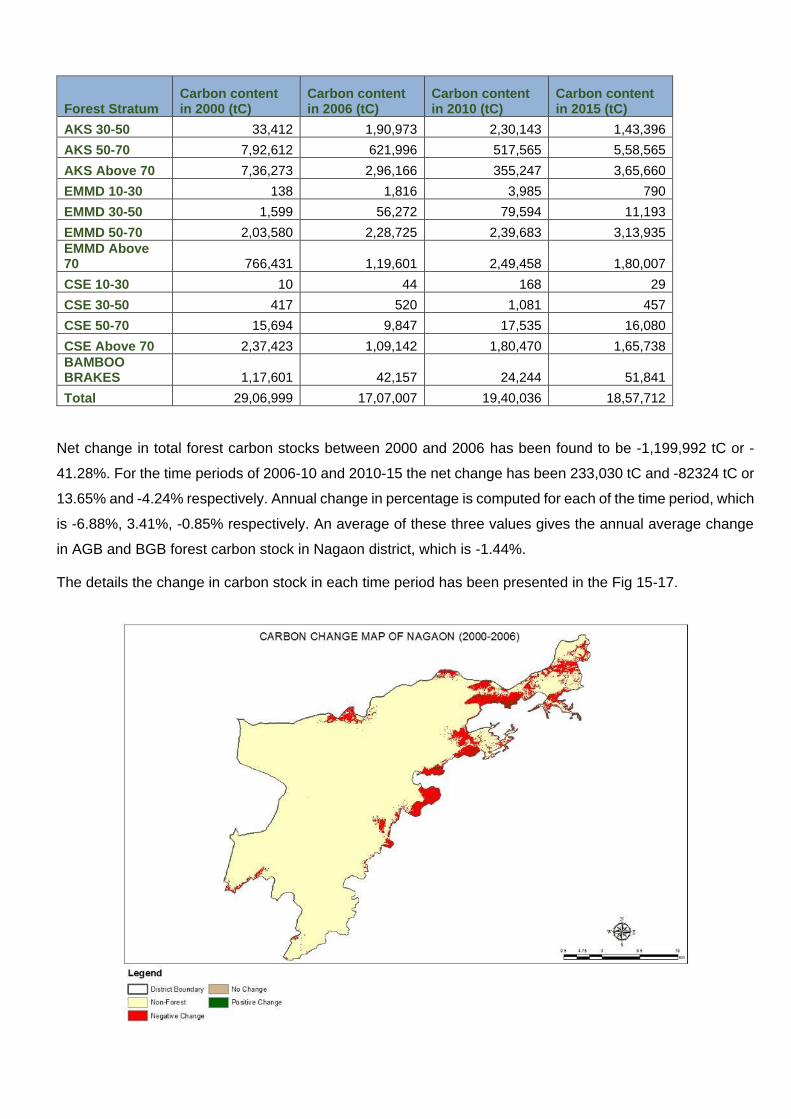
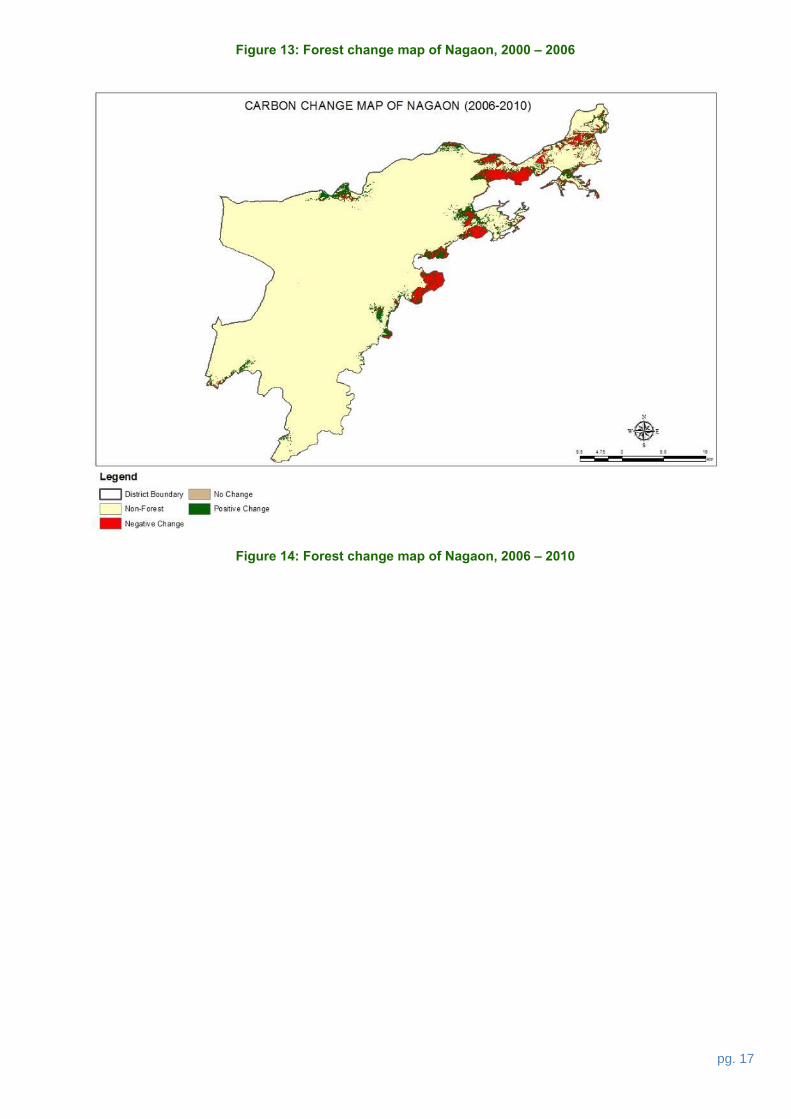
Net change in total forest carbon stocks between 2000 and 2006 has been found to be -1,199,992 tC or -
41.28%. For the time periods of 2006-10 and 2010-15 the net change has been 233,030 tC and -82324 tC or
13.65% and -4.24% respectively. Annual change in percentage is computed for each of the time period, which
is -6.88%, 3.41%, -0.85% respectively. An average of these three values gives the annual average change
in AGB and BGB forest carbon stock in Nagaon district, which is -1.44%.
The details the change in carbon stock in each time period has been presented in the Fig 15-17.
pg. 17
Figure 13: Forest change map of Nagaon, 2000 – 2006
Figure 14: Forest change map of Nagaon, 2006 – 2010
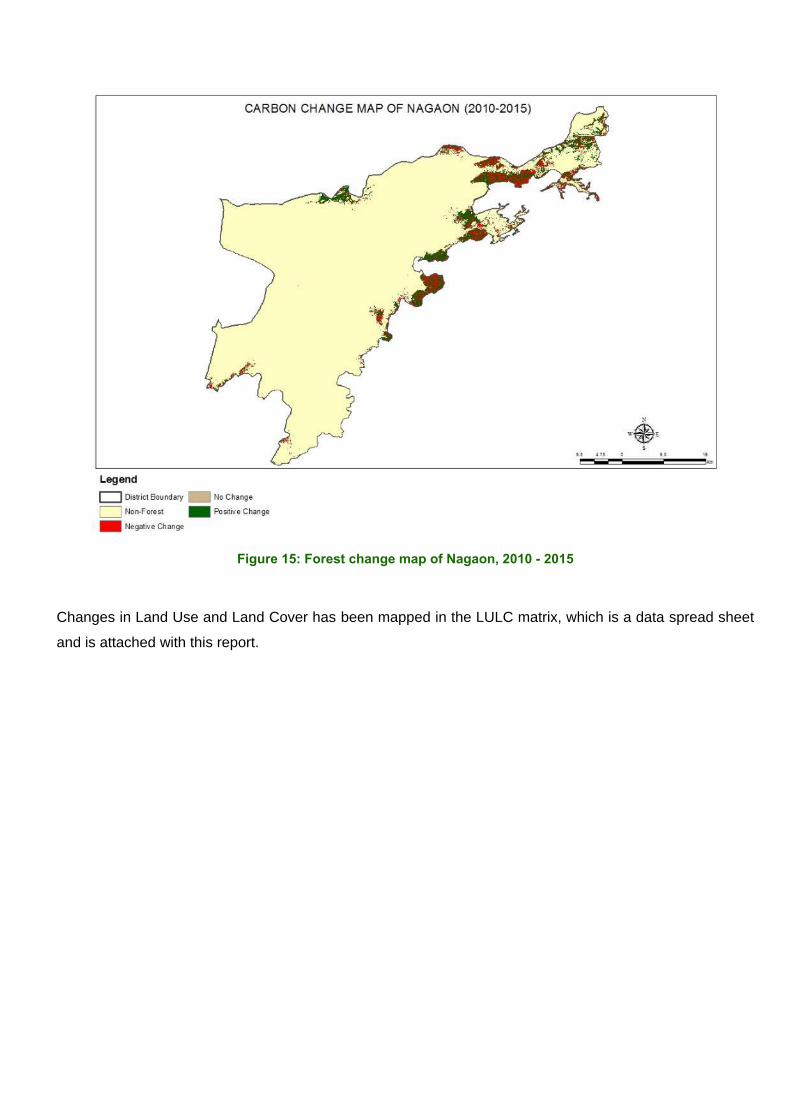
Figure 15: Forest change map of Nagaon, 2010 - 2015
Changes in Land Use and Land Cover has been mapped in the LULC matrix, which is a data spread sheet
and is attached with this report.
pg. 19
IORA Ecological Solutions Pvt. Ltd.
225 B, Indraprastha Gyanmandir Complex,
Lado Sarai Village, New Delhi – 110030
Tel: +91-11-41077549
Fax: +91-11-41023126
Email: [email protected]