Embed Size (px)
Citation preview

1
“Strengthening Regional Support to National Forest Monitoring Systems for
REDD+ in the Pacific”
Report on the National Forest Inventory Capacity
Building Workshop for Fiji
23rd-27th May, 2016.

2
Report By:
Sairusi Bulai, Jalesi Mateboto, Senilolia Tuiwawa,
Loraini B. Kasainaseva and Bale Wilikibau
Sustainable Resource Management Programme (SRMP)
Land Resource Division (LRD), Pacific Community (SPC)
Narere, Fiji.
Photo Credit:
Cover Photo: Group photo of the participants with the Honourable Minister of Fisheries and
Forest of Fiji at the 2016 Fiji Inventory Data Analysis workshop. Photo by Vinesh Prasad.
Workshop Photos:
Figure 1: Official opening of the Fiji Forest Inventory workshop by His Honourable Minister
of Fisheries and Forest, Mr Osea Naiqama. Photo:Vinesh Prasad.
Figure 2: Forestry Officers and GIZ counterparts attentive to the presentation by Dr Garcia-
Perez. Photo: Senilolia Tuiwawa
Figure 3: Dr Garcia-Perez illustrating the statistical formulas using datasets on the excel sheet.
Photo: Senilolia Tuiwawa
Figure 4: Dr Garcia-Perez presenting on the CDM AIR methodological tool. Photo: Senilolia
Tuiwawa.
Figure 5: Workshop participants running statistical exercises on Microsoft Excel. Photos:
Senilolia Tuiwawa.
Figure 6: Mr Mateboto and Mr Senivasa with closing remarks of the five days’ workshop.
Photo: Senilolia Tuiwawa

3
Acknowledgements
This workshop and report has been possible through the co-operation and support lent by
these individuals: the Honourable Minister of Fisheries and Forest for Fiji, the Conservator of
Forest (CF) for the Department of Forest in Fiji, the attending and participating Forestry
officers and affiliated colleagues of the Department of Forest in Fiji and; the resource
personnel from the Food and Agriculture Organization of the United Nations (UN-FAO); the
staff at the Land Resource Division (LRD) of the Pacific Community (SPC) under the
Sustainable Resource Management Programme (SRMP).
List of Abbreviations
AGB-Above Ground Biomass;
BGB-Below Ground Biomass;
CDMAR-Clean Development Mechanism Afforestation Reforestation
CF-Conservator of Forest;
Dbh-diameter at breast height;
EU-European Union;
UN-FAO-Food and Agriculture Organization of the United Nations;
FIDA-Forest Inventory Data Analysis;
FRELs- Forest Reference Emission Level for Deforestation and Forest Degradation;
FRLs-Forest Reference Levels;
GDP-Gross Domestic Product;
GIZ-Deutsche Gesellschaft für Internationale Zusammenarbeit
Ha-hectare;
H-height;
IPCC-Intergovernmental Panel on Climate Change;
JICA-Japan International Cooperation Agency
LoA-Letter of Agreement;
MFF-Ministry of Fisheries and Forests;
MRV-Measurement, Reporting and Verification systems;
NFMS-National Forest Monitoring System;
PICs-Pacific Island Countries;
PNG-Papua New Guinea;

4
PPS-Probability Proportional to Size sampling;
PSP-Permanent Sampling Plot;
QA/QC-Quality Assurance/Quality Control;
QGIS-Quantum Geographic Information System;
REDD+- Reducing emissions from deforestation and forest degradation in developing
countries; and the role of conservation, sustainable management of forests and
enhancement of forest carbon stocks in developing countries
SPC-LRD-Pacific Community, Land Resource Division;
SRMP-Sustainable Resource Management Programme;
UNFCCC-United Nations Framework Convention on Climate Change;
UN-REDD-United Nations Collaborative Programme on Reducing Emissions from
Deforestation and Forest Degradation in Developing Countries.

5
Table of Contents Acknowledgements .................................................................................................................... 3
List of Abbreviations .................................................................................................................. 3
Executive Summary ................................................................................................................... 6
Introduction ................................................................................................................................ 7
Objective .................................................................................................................................... 7
Day 1 .......................................................................................................................................... 8
Day 2 ........................................................................................................................................ 14
Day 3 ........................................................................................................................................ 15
Day 4 ........................................................................................................................................ 15
Day 5 ........................................................................................................................................ 15
Conclusion ................................................................................................................................ 19
Annex ....................................................................................................................................... 20
Annex 1: Workshop Photos .................................................................................................. 20
Annex 2: Workshop Feedback ............................................................................................. 21
Annex 3: Agenda .................................................................................................................. 27
Annex 4: List of Workshop Participants ............................................................................. 29
Annex 5: Registration Form ................................................................................................ 31
Annex 6: Template of the Evaluation Form ........................................................................ 34

6
Executive Summary
A total of 13 participants, one facilitator and four supporting facilitators were intermittently
present at the five-day training workshop, held in Nabua, Fiji from the 23rd -27th May of 2016.
The participants were made up of two female and eleven male forestry officers from the Fiji
Department of Forest. The training focussed on capacity building activities for participants,
who are involved in the analysis and reporting of national forest inventory data.
Training components included concepts, principals and statistical parameters used to analyse
forest carbon inventory datasets. From the theoretical concepts of the UN-REDD program to
the forest inventory design, planning and implementation, the participants were demonstrated
with the different phases of REDD+ initiatives. The statistical influxes entwined within the
pillars of carbon calculations were also identified and elaborated upon using Fiji’s inventory
datasets. With these calculations, common statistical parameters such as standard error,
standard deviation, confidence interval and percentage uncertainties were demonstrated. It is
important to note that without these parameters, inventory datasets will most likely be
unsound and therefore reporting could be misleading.
The training was led by a national forest inventory (NFI) resource expert of the UN-FAO
based in Rome-Italy, who presented on the Statistical tools and pertaining theoretical REDD+
concepts and principals. The training was held at the SPC complex in Nabua where
participants were: introduced to the concepts of the UN-REDD program, the role of MRV and
NFMS systems under the REDD+ banner; calculation routes for forest stock assessment;
informed of the recent inventory activities the Department of Forestry is involved with e.g.
Collect Earth and addressing issues of the forest carbon stock assessment; and the basic
sampling and measurement for biomass assessment.
The participants were appreciative of the workshop and suggested more time would be needed
given the complexities of the concepts involved and the scope of the topic covered.

7
Introduction
Since May 2014, the project “Strengthening Regional Support to National Forest Monitoring
Systems (NFMS) for REDD+ in the Pacific” under the leadership of the Secretariat for the
Pacific Community’s (SPC) with funding support through the UN-REDD, has been
addressing the technical and capacity-related barriers faced by Pacific Island Countries (PICs)
in implementing a National Forest Monitoring System.
A NFI data analysis phase is a vital component of the MRV function in a National Forest
Monitoring System. In the case of Fiji, there is a need for robust and validated datasets of
national forest inventories that have taken place in the past and in the most recent
years. This is critical to the assessment of forest carbon in both its management and
economic sector as this would be the essential basis for guiding the sectors towards
sustainable management practices.
The training workshop used Fiji’s forest inventory datasets to carry out its practical
exercises. These were:
1. The 2007 national forest inventory (NFI) (>1000 plots) with the aim to calculate
timber volumes;
2. A network of permanent sample plots (PSP) (approx. 100) aiming to calculate carbon
and wood biomass stocks;
3. Two REDD+ pilot sites in Emalu and Vunivia (30 plots each) for carbon and biomass.
The five-day training workshop was held at the SPC complex in Nabua, Suva, Fiji with 13
participants from the Fiji Department of Forest, GIZ and four supporting facilitators. The
main resource person was Dr Garcia-Perez (UN-FAO, Rome-Italy) who was supported by
Mr Jalesi Mateboto, Ms Senilolia Tuiwawa, Ms Loraini Baleilomaloma and Ms Bale
Wilikibau (LRD-SPC, Suva-Fiji).
Objective
The objective of the workshop was to continue capacity development towards data analysis
techniques on the estimation of forest stocks based on past national forest inventory (NFI) of
the Fiji forestry department, the network of permanent sample plots (PSP) and the two
REDD+ sites. Specifically, the workshop was aimed at building capacity on integrating
permanent sample plots (PSP) and REDD+ data with the national forest inventory (NFI) to

8
produce national volume and carbon calculations. The processing chain was provided, as well
as basic estimates and different procedures towards achieving UNFCCC based estimates.
Specific objectives of the workshop activities were to:
1. Integrate different data sets to produce forest stock estimates;
2. Provide preliminary results;
3. Discuss decision trees towards the processing of data;
4. Draft a preliminary calculation chain for NFI results.
5. QA/QC training-conducted on their datasets.
Day 1
On the 23rd of May 2016, the Pacific Community (SPC) in collaboration with the Food and
Agriculture Organization of the United Nations (UN-FAO) held the third training course of
the three national backstopping events on national forest inventory at the Pacific Community
(SPC) complex in Nabua, Fiji. Commencing with high expectations, the meeting was attended
by the Honourable Minister of Forest and Fisheries for Fiji Mr Osea Naiqama, the
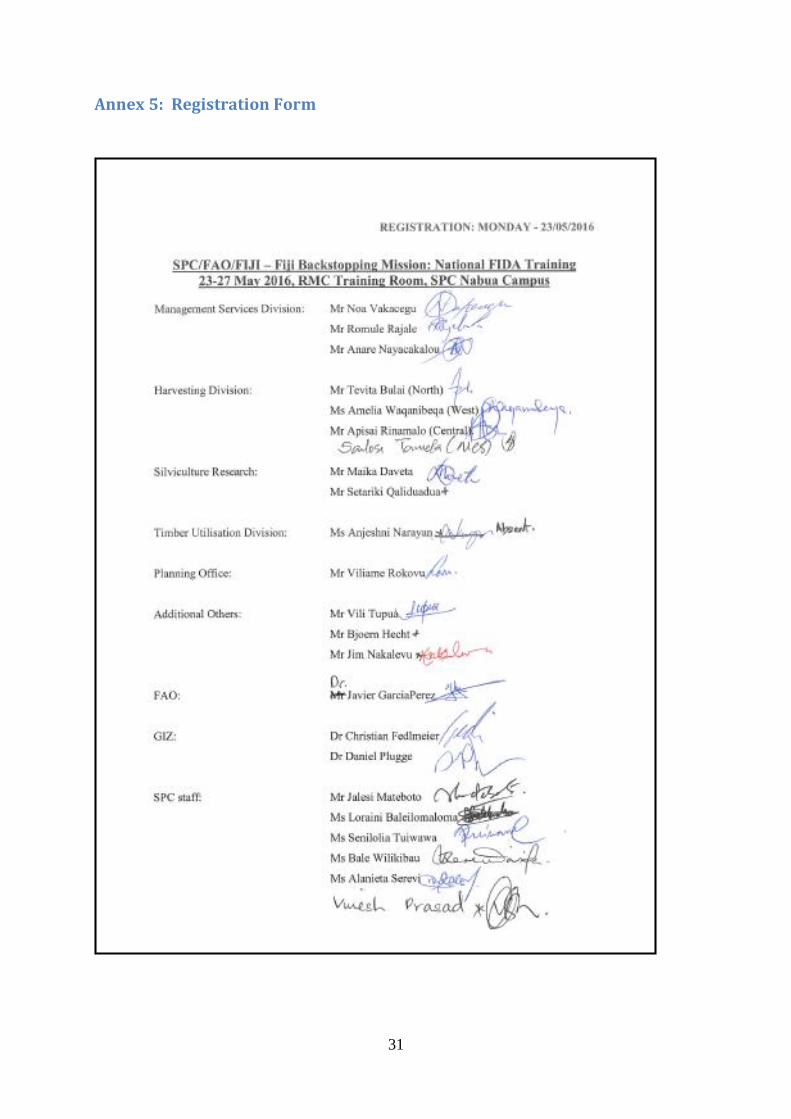
Conservator of Forest for Fiji (CF) Mr Eliki Senivasa, the SPC representative Mr Jalesi
Mateboto, the 13 invited participants and SPC support staff (Annex 2).
Mr Mateboto addressed the audience with a commencement remark. He stated that “this
workshop was very important in building capacity for forest inventory in Fiji…and
participants should make use of the available resources in the five day training”. The
Honourable Minister was given the opportunity to officially open the workshop. In his
opening remarks he stated “… Fiji’s forest sector contributes 3.8% in total exports and 0.6%
for National GDP. Much of what the forest offers is not recognized in our books because no
one knows how to put economic values on them. We know fully well their absence will spell
economic disaster…
I believe that part of addressing this challenge is to keep on broadening what we
capture and analyse in our datasets and also broadening the economic indicators that
we’ll link our forest against. We are now able to broaden our forest data collection
and data analysis techniques to include quantity of carbon. This information in the
management of carbon stocks and creating an economic value for the carbon
contained in our forest…the information generated from data analysis has the

9
capacity to be fed into database and the information system that provides the bearing
block to generate many other information forming a vital component of the
contribution of the forest sector to moving Fiji towards an information based society.
This information will in turn be used to guide policy decision towards achieving the
overall objective of conservation and Sustainable Management of forest resources….
Fiji REDD+ has recently received funding from Forest Carbon Facility under the
World Bank to undertake REDD+ Readiness Activity. A major requirement in both
this activity is the provision of robust information of datasets that will withstand
international scrutiny and verification. This training is therefore relevant to Fiji and
the region in improving the forest and Climate Change related data collection and
analysis capability and preparing Fiji and the region towards its reporting obligation
on nationally determined contribution which is mandatory under the UNFCCC.
I am sure this training is important to all other participating countries in this
workshop. I therefore thank UN-REDD and the SPC for seeing the need and giving
priority to this training and capacity building and allocating the necessary resources
to enable this training to help them. I have the honour to declare this workshop open”.
Mr Mateboto then proceeded to elaborating on the importance of statistical package and how
it is used in forest carbon calculation. He emphasized that these were the parameters needed
to quantify and verify forest dataset(s). The audience were then given the opportunity to
introduce themselves to members of the workshop as well as mention their expectations in the
five day training.
Dr Javier Garcia-Perez, the UN-FAO-REDD resource personnel, then introduced himself, the
objectives and the workshop layout of the five day training. In his outline he indicated that the
primary objectives of the training were to introduce the statistical basics of forest assessment
such as volume, biomass, carbon stocks and biodiversity. On the first day, members of the
workshop would be shown, and hopefully learn as much about, the UN-REDD program and
the theoretical concepts to the pillars of carbon forest inventory, with its practical component
defined and complemented by relevant statistical exercises using the Microsoft Excel
package, he added. He also mentioned that FAO would be more than willing to support
country request on REDD+ issues.

10
Mr Mateboto then presented on the role of the Regional Facility at the Pacific Community
(SPC) in the scope of supporting the UN-REDD Program in the South Pacific. In his
presentation, he introduced the role of the Regional Support Facility on Forest Inventory and
stated “… at this time most of our forest resources are facing the greatest threat in
comparison to the times before. This can be attributed to the main development taking place
and many unsustainable practices not only in Fiji but the Pacific as well. And so everyone has
a role to do this.
And now in the face of climate change it’s only very important for us to be able to
manage our forest resources well. Some of the issues that has been discussed by our
leaders in previous heads of forestry meetings i.e. forest degradation and forest
resource management. Two of the things I’d like to discuss are the lack of capacity
and resource and the lack of up to date forestry data.
For Sustainable Forest Management to be materialised and effective, we need updated
and correct forest data because without that we will have a hard time managing the
forest resources in a sustainable manner. So it’s important that we have good forest
information which will be attributed to forest analysis and data reporting for people
you will be serving or those who will be managing or the people who own the
resources.
In driving home the point of sustainable forest management, the design of project must
correspond to the natural utilisation management. And also, the sustainability
approach should be economically viable but money is not everything you should
balance it out. Of course the last to consider is the cost and benefits is important to be
shared inter and intra-generation.
Future generations will face the consequences of the decisions we make today, so it is
important we make good decisions. To be able to do this, you need good inventory
data. On the aspects, of national forest inventory (NFI) in the Pacific, this is where the
facility comes in. For Fiji, they have d two-three inventories in the past. The first was
done and supported by the British back in the 90’s followed by the Germans in 1992
and the most recent was in 2007 which was supported by the Fiji Government with
consultants coming in and out to assist us in those designs and data analysis. For
Vanuatu, there first inventory was done 1989 funded by the Australian Aid and in
2014, the regional REDD+ has been supporting them in trialling out a methodology to
11
carry out the NFI. In Samoa, it’s New Zealand and Japan assisting them and for PNG,
it’s Japan and the European Union (EU) supporting them with funds to carry out their
activities.
So as you can see, we’re very dependent on overseas aid and consultants to come and
help us in all these activities. So the facility is really to fill in the gaps, to try and
conduct more capacity building to try and design our own inventory, analyse our own
data and report on the work we do. So most of the information we’re doing now is
been cooked for us but we want you to cook your own information.
In addressing these issues that have been identified by heads of Forestry, we’ve tried
with JICA and GIZ in establishing the forest inventory facility whereby we’ve run
some basic trainings but it has not been to the extent we want it to be. Collaboration
with the UN-REDD allowed for the establishment of the facility that now has staff to
be advisors and respond to country requests.The role of the facility is to support
capacity supplementation. In a way it is trying to promote the regional cooperation
within the region-so the facility is going to facilitate this. It is only in the areas that we
really lack in terms of resource and capacity that we will then resort to overseas
assistance to come in and facilitate the area of need. On capacity substitution, where
the country is in need, the facility will mobilise a team (if it’s in Fiji, Solomon Islands
or Vanuatu) and move them to the regional country (e.g. Wallis and Futuna) in need
to address their request.
Trainings that have been supported by UN-FAOREED, the development of NFI
booklets which should be published before the end of June. Thank you”.
Dr Garcia-Perez then presented on the biomass assessment within the framework of REDD+.
He highlighted that forest assessments were carried out for various NFI purposes but the
popularly adopted NFI was the multi-purpose national forest inventory (NFI), which
comprised of field sampling and mapping using satellite images. As a component of the MRV
in REDD+, the results-based implementation is made up of three REDD+ phases which
entirely comprises of technical activities that interactively make up the Monitoring and MRV
phases. For REDD+ countries, the majority are at the preparations stage of REDD readiness
(phase 1) that involves the development of a national strategy or action plan; the design and
implementation of a national forest monitoring system (NFMS) for REDD+ activities; and the
establishment of a national forest emission levels and the development of a system that

12
ensures the safeguards are addressed and respected. FAO’s role in the UN-REDD programme
was also highlighted, which is to provide technical support and capacity building to two of the
four elements of REDD+ readiness; identify the function of national forest inventory (NFI) in
the National Forest Monitoring System (NFMS) for REDD+. Under the REDD+ MRV
system, NFI data can also be used to estimate emission factors for various land use types then
combined with activity data to produce emission factors. Different Tier systems were also
represented in the MRV function. The Forest Reference Emission Levels (FRELs) and Forest
Reference Levels (FRLs) calculated from historical datasets were also discussed as
“benchmarks for assessing each country’s performance in implementing REDD+ activities”.
Initiatives of the UN-REDD program in West Africa were also introduced along with the
IPCC good practices.
Dr Garcia-Perez then presented on the “Calculation routes for forest stock assessment”. The
presentation looked at the accumulated errors in an inventory and satellite based on above
ground biomass estimates. Factors that were taken into consideration were those of the plot
measurements and land cover classes between the sharing of information such as the use of
above ground biomass from the stratified and multiple estimates to develop above ground
biomass algorithm and parameterisation in satellite estimates. This is demonstrated in
Permanent Sample Plots (PSP) based estimation where the areas of land cover classes are an
important component of satellite based calculation. In a chain of errors in PSP estimation, a
range of error sources against the uncertainties in carbon stock estimate and carbon change
estimate is demonstrated with varying degree of uncertainty. To produce a NFI, both the
parameters of field data and satellite data can be used interchangeably to demonstrate the
spatial scale of Green House Gas emission at the national and plot scale.
Mr Viliame Tupua, Forestry Officer at the Fiji’s Department of Forestry, then presented on
the Collect Earth Program that the Department has been using as one of its main tool in forest
assessments. He added “… that a lot of the data analysis during the last inventories has been
based on Land sat images.
So last year when the UN-REDD came up with the training on Collect Earth, the
department managed to assess land-sat images using this program. It’s a very
powerful tool to use to analyse forest inventory data and socio-economic survey but it
is advisable to have high and good speed internet connection that would allow for
SAIKO analysis to capture datasets. So with google earth engine, the land-sat images

13
used were land-sat 5 and 7. So in instances where there is a cloudy cover image, we
also have an alternative image available for the analysis.
The land use classification Fiji has is based on the IPCC guideline (six categories). So
sampling plots are spread throughout Fiji’s coastlines using the free source open
software in QGIS to capture the changes over time. The drivers for deforestation were
identified as the settlements, cropland, forest, wetland and grassland and these are
defined by certain ruleset to make the assessment.
The first 5000 points were sent to Rome and they would send back the results. This has
been completed and we’re waiting on the other 5000 point to be completed by the
Ministry of Agriculture but until last month, we’ve received instructions that we will
do it instead. So currently, all the collect earth activity is being conducted at the Geo-
Science in Nabua”.
Mr Noa Vakacegu, Forestry Officer at the Fiji’s Department of Forest, then presented on
Fiji’s 2011 National Forest Carbon Stock Assessment. From these previous assessments, there
were issues that needed addressing to ensure that the carbon estimates for Fiji’s forest are
valid. These concerns were as follows: proper measurement of tree height using height
diameter relationships; looking at the systematic sampling of wood density, targeting species
the largest of carbon stock trees; the regular measurement of deadwood for commercial
species (e.g. mahogany and pine) in PSP of an indigenous forest as well as the changes in its
stand age; assessing the carbon stock in an indigenous and plantation forest and; the
development of soil carbon model to provide the national estimates of carbon stock changes
in Fiji soil.
Dr Garcia-Perez then elaborated on the MRV and FRELS. Using historical datasets, it was
important that uncertainties and confidence levels, along with other statistical parameters,
were included so that data can robustly be interpreted in its influxes over the millennia.
He then presented on the ‘Basic sampling consideration and field measurements for forest
biomass assessment”. The objective and scope of forest carbon inventories, its design and
planning phase were presented in detail. The principals of basic statistics in simple random
sampling and its application on excel were demonstrated, as well as the IPCC guideline on
stratified random sampling. There were different phases of NFI and factored to its parameters
for consideration includes: equations for stratified sampling, cost effectiveness of sampling

14
design, number of plots needed, accuracy, precision and confidence interval; determining
sample sizes, sample calculations for single and non-single strata as well as its sample size
allocations; the different plot layout and design (e.g. nested circular plots) according to IPCC
guidelines and also taking into account the concepts and application of scaling factors. Upon
identifying the different carbon pools to measure, it is important to consider the destructive
and non-destructive methods .and the steps involved in converting field measurements to
biomass and into specific models or allometric equations (e.g. the above ground and below
ground biomass; standing dead and lying dead wood and soil carbon). For carbon stock
monitoring and land use change, the different temporary and permanent plots were discussed
in guideline retrospect as well as the stock change estimation methods in PSP plots for
instance.
Day 2
Day two commenced with recapping of the lessons learnt from day one. The participants also
looked at the CDMAR methodological tools to discuss at least four equations for the total
number of plots. This was further reinforced with an exercise on Fiji’s forestry data in the
excel sheets whereby the participants were demonstrated with and tasked to do calculations on
carbon plots (biomass of trees per hectare (ha)) and carbon present within a hectare (ha).
Dr Garcia-Perez then presented on the structure of the database. In improving tree
assessments, forest volume, biomass and carbon stocks, there are a couple of factors to
consider i.e. database of allometric equation, manuals and tutorials in allometric equation and
operating software. Databases of allometric equations can contain other information such as
species name and taxonomic information for a region or country for instance. These have
continuously improved with upgrading features with the inclusion of wood density database
and data sharing between users, to list a few. Taking the standing deadwood for instance, the
allometric equation to estimate biomass uses the measured diameter at breast height (dbh) and
height (h) using decomposition class 1. The information required would include measurement
at diameter of tree, diameter at tree top, tree bole height, the wood density for sound and
deadwood and the scaling factor. These could be tabulated with comparative and contrasting
information between the decomposition classes.

15
Day 3
Day three began with the participants downloading the NFI training datasets and tasked to
calculate soil biomass and carbon. They were then split into groups of four to discuss the
various points with a team member who then presented on the outcomes after 10-15 minutes
of group discussion. The exercises took up the entire morning.
Dr. Garcia-Perez then discussed on the NFI data and PSP data. The points put forward for
discussion by the participants were:
Mr Tupua: Carbon analysis uses the PSP data because it includes everything. We want
to establish plots using stratified sampling. In the next session the class can perhaps
use the PSP data not the entire country data.
Day 4
Day four began with the participants downloading calculations of the Fiji forest data looking
at residual analysis and z scores. The aim of the exercise was to graph out a diameter-height
relationship at first branch using the z-score and PSP data in the excel files. The participants
were then introduced to features of Microsoft Excel such as pivot table and pivot charts,
which would enable users to filter datasets, particularly very large datasets, and point out
outliers. It was also one way of ‘cleaning’ or correcting field datasets. They were then tasked
to do similar calculations for timber volume (looking a merchantable timber species), Below
Ground Biomass (BGB) and Above Ground Biomass (AGB), scaling factors for small,
medium and large plots, and then using pivot table to aggregate results. Dr Garcia-Perez
reiterated that users of the software package could select whichever parameter to put in the
pivotal report but it was more important that they understood the selection and relationships
between the forest parameters and the outcomes of these relationships. Similarly, there are
statistical parameters that users of the excel package need to know about and use. These
statistical parameters are important to test the quality of data: - standard deviation, standard
error, confidence interval, uncertainty, mean/average, sum and count, upper and lower
percentiles to list the few most popular and commonly used ones.
Day 5
Day five of the training began with discussions by Dr Garcia-Perez on basic uncertainties and
propagation rules together with a recap of the last four days of training. The participants were

16
then asked about doubts and gaps they’d identified in the workshop and these were randomly
put forward for discussion:
Participant: With the Collect Earth package, there are doubts in the accuracy of
sampling points on grids and the land sat data used by the user.
o Dr Garcia-Perez: Sampling points is very good to know the intensity of the
grids – relies in the strength in numbers; confidence interval for collect earth –
use collect earth as a reference for the evaluation of the remote sensing, or if
it’s not a reference point; accuracy (separate team to carry out the workshop)
Participant: Knowing which statistical package to use is very difficult and confusing.
o Dr Garcia-Perez: suggest having a look at the IPCC guidelines and the
statistical functions in differing excel worksheet. It is also important to
organize and practice on the functions as often as you can.
o Ms Tuiwawa: the statistical package is pretty straight forward. The users of the
package will simply have to run the analysis as often as they can to be familiar
and confident in its use on large datasets.
Participant: There is going to be a lot of difficulty in the interpretation of statistic
results and data.
o Dr Garcia-Perez: this is going to have to be done by the country itself (country
experts) with international consultants as secondary resource.
o Ms Tuiwawa: be good to have technical expertise, particularly with an
ecological background, to do the data interpretation and reporting.
o Mr Tupua: as it is, a lot of our data is being analysed by the IT people in the
department and they use Access to do all the analysis. When the data reaches
us, it is already in a result format but we are not clear on how they reached
those results or how they analysed a data. On this context, can there be a future
workshop on how to do analysis on Access.
o Dr Garcia-Perez: Assessor don’t necessarily need to have a technical
ecological background just have someone who knows how to do reporting;
also note that data collection and data management are critical to proper and
accurate interpretations.
Participant: There was not enough time to go through the pivot table.
o Dr Garcia-Perez: before doing the pivot table and charts it is important to
visualise what parameters goes in the columns, filters and rows.

17
Participant: There was too much of information in a week.
o Dr Garcia-Perez: cannot do much on that, it is more important that you
understand and not memorise the steps involved. You also might want to
consider the role of each function as understanding this is more important than
just completing the tasks
Participant: It would be very helpful if a manual was provided.
o Dr Garcia-Perez: totally agree.
Participant: How to use the confidence level at the reporting?
o Dr Garcia-Perez: maybe have a workshop on reporting but summary
results/annexes and expand a bit more (put together by the consultants)
Participant: how to go about determining conversion factors?
o Dr Garcia-Perez: might want to consider destructive sampling topic and the
IPCC default values.
Participant: which statistics data is most important?
o Dr Garcia-Perez: confidence interval and uncertainty in percentage (upper and
lower)
Some of the gaps the participants thought there were during the workshop are as follows:
Calculation of constants and coefficients;
Designing methods for national forest inventory (NFI):
o Fiji has to have a national forest inventory (NFI) done every ten years (for post
stratification for the purposes of reporting);
o It was recommended that if the original design and data are good then it is good
that they stick with it;
o In attempts to do re-stratification, it would mean reducing strength in numbers;
and in trying to intensify the grid would mean more money.
The workshop training was fairly short and it could at least run for two weeks,
especially with the formula learning:
o Regional workshops in the past/problems with changing participation in these
workshops;
o National workshop is better than a regional one with the same participant.
Mr Mateboto then brought the workshop to a close. In his closing remarks he stated “… data
analysis is not an easy topic to cover and so thank you everyone for the support to make the

18
workshop a success. This training is very important to the sustainable management of the
forest and more so, building the skills, knowledge and capacity to the region as well…” He
then welcomed the Conservator of Forest (CF) and thanked him for making the time to attend
the workshop and also for officially closing the five days training.
Dr Garcia-Javier was then given the opportunity to say a few words. He then thanked the
participatory group and the support group of the workshop. He also mentioned that he is
available to work on any doubts the participants may have on the workshop and the work that
had been done in the five days training. He would be looking at the potential gaps that were
needed for Fiji.
Mr Senivasa was then given the opportunity to address the audience. In his closing remarks he
states “… “Thinking of the REDD+ in Fiji and we want to scale it up. This training is very
important to move forward with the program.
From where I am sitting, I need information to make positive decision, make policy
intervention, so it is important that you know this training is useful unless if it’s not
used at the normal operation level so that you can create information that makes good
decision and policy decision making. So this training is also really important. I would
think you are strategically located to do this training.
Data is not only management because the focus was NFI, but NFI at the national level
we do inventory, day in day out. And fill operation, this is what we need we need to
analyse this data. We need to make good decisions because we want to promote
sustainable forest management unless we analyse the data properly will never make
good choice in sustaining forest. This is one of the tools we use to study data.
Another important tool is data gathering and analysis to create valid information that
we make the right choice is decision making policy. I hope you will be assisting the
bigger programs and this for Fiji at the moment is the REDD+ program. We want to
upscale this at the national level and this is where I need your skill. Wherever you are,
you will be able to contribute to this because it is a national program. And we are
aiming for other funding opportunity.
We are currently in the reduction emission pipeline which means a lot of work,
thinking analytical skills. This is where we need your input, your contribution so don’t

19
see this as a one off training or just training. In fact this is a capacity building
program towards our objectives such as diameter limit table, national reporting and
national development program.
I want to thank Javier for the whole week and hope you will be able to connect with
our people if they need help and assistance. Also like to thank SPC and team for
organizing this training and I do hope this training will assist us as we move forward
with national forest inventory program and other programs.
So I am happy to close this workshop”.
Conclusion
The third training course of the three national backstopping events on forest inventory was an
important milestone for SPC-LRD under its current LoA with FAO. The workshop was
strictly targeting the forestry officers involved in the analysis, interpretation and reporting of
the inventory datasets. The importance of this training was emphasised and reiterated by
management and the technical staff as a pillar to forest carbon inventory. The invited
participants, therefore, were to make the best of the resources available as the lessons and
skills attained would be helpful to not only themselves as individuals, but for the country and
the region as well, as they would be what the managerial sector would rely on to make
informed and good decision towards the sustainable management of forests and forest
resources.
There were minor suggestions, that the workshop be prolonged in future given the
complexities of concepts and exercises dealing with equations and algorithms for instance.
With the aim of upgrading and expanding their skills and knowledge on the statistical
packages used for the assessment, the training was appreciated by the overall audience.

20
Annex
Annex 1: Workshop Photos
Day 1: Official opening of the Fiji Forest Inventory
workshop by His Honourable Minister of Fisheries
and Forest, Mr Osea Naiqama.
Day 1: Forestry Officers and GIZ counterparts
attentive to the presentation by Dr Garcia-Perez
Day 2: Dr Garcia-Perez illustrating the statistical
formulas using datasets on the excel sheet.
Day 2: Dr Garcia-Perez presenting on the CDM AIR
methodological tool.

21
Day 3: Workshop participants running statistical
exercises on Microsoft Excel Day 5: Mr Mateboto and Mr Senivasa with closing
remarks of the five days’ workshop
Annex 2: Workshop Feedback
23-27 May, 2016: Forest Inventory Data Analysis Workshop, Nabua, Fiji
Age: 26-45
[Males <30 =3; Males >30 = 3; Males [UNKW] = 4; [Females<30 =1: Females >30 =1]
Gender: 2 Females; 10 Males
The age category of the workshop trainees ranged from 26 to 45 years of age. Of the 12
survey feedbacks, there were ten males (three males who were 30 years below and three
males above the 30 years and four males who did not indicate their age) and two females (one
below the age of 30 and one above the age of 30).
Occupation: The survey feedback consisted of Forestry officers (nine participants), Project
Assistant (one participant) and the FAO resource person (one person).
Q1. How would you rate the overall training? (Venue, Catering) Please explain.
22
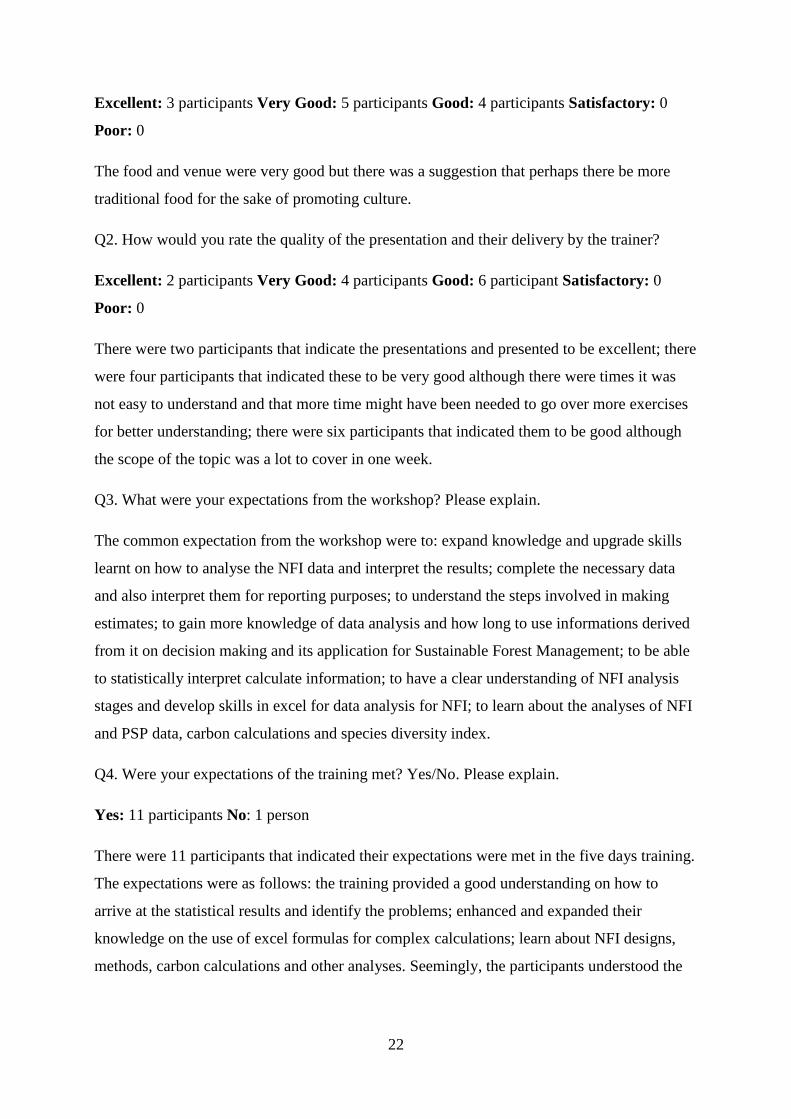
Excellent: 3 participants Very Good: 5 participants Good: 4 participants Satisfactory: 0
Poor: 0
The food and venue were very good but there was a suggestion that perhaps there be more
traditional food for the sake of promoting culture.
Q2. How would you rate the quality of the presentation and their delivery by the trainer?
Excellent: 2 participants Very Good: 4 participants Good: 6 participant Satisfactory: 0
Poor: 0
There were two participants that indicate the presentations and presented to be excellent; there
were four participants that indicated these to be very good although there were times it was
not easy to understand and that more time might have been needed to go over more exercises
for better understanding; there were six participants that indicated them to be good although
the scope of the topic was a lot to cover in one week.
Q3. What were your expectations from the workshop? Please explain.
The common expectation from the workshop were to: expand knowledge and upgrade skills
learnt on how to analyse the NFI data and interpret the results; complete the necessary data
and also interpret them for reporting purposes; to understand the steps involved in making
estimates; to gain more knowledge of data analysis and how long to use informations derived
from it on decision making and its application for Sustainable Forest Management; to be able
to statistically interpret calculate information; to have a clear understanding of NFI analysis
stages and develop skills in excel for data analysis for NFI; to learn about the analyses of NFI
and PSP data, carbon calculations and species diversity index.
Q4. Were your expectations of the training met? Yes/No. Please explain.
Yes: 11 participants No: 1 person
There were 11 participants that indicated their expectations were met in the five days training.
The expectations were as follows: the training provided a good understanding on how to
arrive at the statistical results and identify the problems; enhanced and expanded their
knowledge on the use of excel formulas for complex calculations; learn about NFI designs,
methods, carbon calculations and other analyses. Seemingly, the participants understood the
23
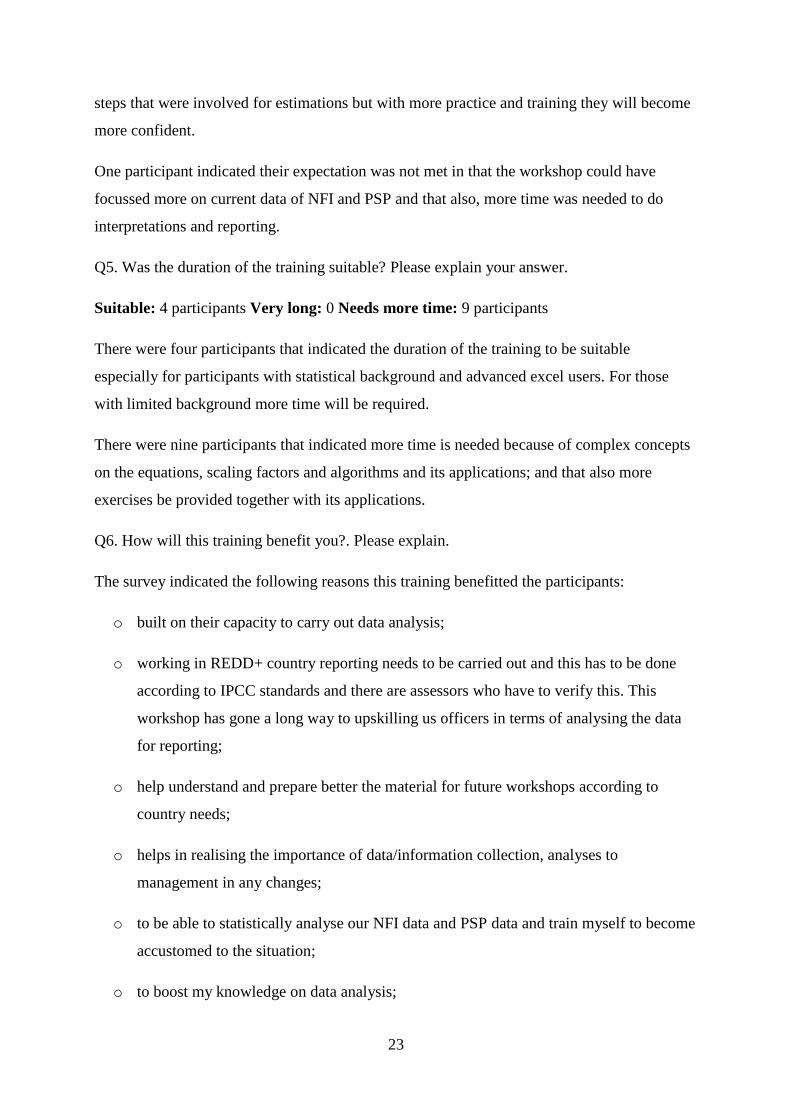
steps that were involved for estimations but with more practice and training they will become
more confident.
One participant indicated their expectation was not met in that the workshop could have
focussed more on current data of NFI and PSP and that also, more time was needed to do
interpretations and reporting.
Q5. Was the duration of the training suitable? Please explain your answer.
Suitable: 4 participants Very long: 0 Needs more time: 9 participants
There were four participants that indicated the duration of the training to be suitable
especially for participants with statistical background and advanced excel users. For those
with limited background more time will be required.
There were nine participants that indicated more time is needed because of complex concepts
on the equations, scaling factors and algorithms and its applications; and that also more
exercises be provided together with its applications.
Q6. How will this training benefit you?. Please explain.
The survey indicated the following reasons this training benefitted the participants:
o built on their capacity to carry out data analysis;
o working in REDD+ country reporting needs to be carried out and this has to be done
according to IPCC standards and there are assessors who have to verify this. This
workshop has gone a long way to upskilling us officers in terms of analysing the data
for reporting;
o help understand and prepare better the material for future workshops according to
country needs;
o helps in realising the importance of data/information collection, analyses to
management in any changes;
o to be able to statistically analyse our NFI data and PSP data and train myself to become
accustomed to the situation;
o to boost my knowledge on data analysis;

24
o it has enhanced my knowledge in statistical analysis and provided a useful template to
analyse similar datasets;
o future decision making will be based on accurate analysis of data.
Q7. What did you learn from the workshop? (List 3 lessons learnt from the workshop) Please
explain.
The thirteen surveys listed the following points as lessons learnt from the five days training:
o Pivot table and pivot charts;
o New formula in excel;
o To calculate BGB, total carbon and 95% confidence interval;
o That templates are good to leave as outputs for the country that more written
extra material is needed for the uncertainty of concepts;
o Importance of data collection, its statistical analyses and its contribution to the
effective and efficient implementation of any work;
o How to statistically analyse data;
o How to interpret data;
o Procedures to follow;
o Calculation of standard deviation, uncertainty level and clean data;
o Learnt to use the equations for calculating biomass-carbon tc/ha and extrapolate
for national area/ how to do the quality assurance of the data-detect outliers or
suspicious/strange entries and correct them/how to calculate
uncertainties/confidence intervals while doing analysis (where +/- of datasets,
use of constant and + or – is required);
o How to calculate total carbon, how to conduct NFI, NFI design, google earth
and how to use excel to conduct the analyses;
o Excel spreadsheet with extra function/basic calculations;

25
o Carbon pool composition;
o No of plot calculations/species diversity scale and pivot table.
Q8. How can we improve the workshop? Explain.
The survey indicated the following points as areas to improve the workshop:
o More hands on exercises on excel;
o More practical and examples;
o More extra materials;
o More understanding of concepts;
o Allocate more time and need to elaborate more on data information;
o For me to improve we need to organise it at national level;
o By providing a manual/documented steps where analyses on excel is required
and more interactive sessions;
o Need more time to look at the procedures for determining conversion factor,
learn about these excel function, determining which formula and constant to use
or continue to be followed to help us decide;
o Have a national (Fiji) workshop on the multi database inventory training for 2
weeks.
Q9. Do you wish to participate in a future hands-on training that would provide more
focussed skills into NFI field data collection, analysis and reporting? Please explain.
Yes: 10 participants No: 0 Not sure: 1 person
There were ten participants who expressed interests to participate in future hands on training
for the following reasons:
- to build on skills and knowledge from this workshop;
- this will help in building my capacity in collection, analysis and reporting;
- directly involved in NFI;

26
- since most data analysis requires complex formulas hands on is best for learning.
One of the survey indicated they were not sure of future participations given the number of
missions they are currently involved in.
Q10. Any other comments regarding this training?
The workshop was very good and informative capacity building workshop but more time is
needed to re-do exercises and its application to current work.

27
Annex 3: Agenda
Programme for Fiji NFI workshop (tentative)
Day One: (Monday)
Time Event Organization Speaker
8:30-9:00 Arrival and registration
9:00-9:15
Opening remarks
Introduction of participants
Fiji MFFR Fiji MFFR
9:15-10:00
Welcoming remarks and objectives of the
workshop and Introduction to FAO and SPCs
role in assisting Pacific countries with NFI
SPC/UN-REDD SPC/ Javier Garcia
Perez
10:00-11:00 Calculation routes for forest stock
assessment.
UN-REDD Javier Garcia-Perez
11:00-12:00 Biomass assessment within the framework
of REDD+
UN-REDD Javier Garcia-Perez
12:00-13:00 Area estimates in Fiji (Collect
Earth/others?)
Fiji MFFR Fiji MFFR
13:00-14:00 Lunch
14:00- 15:00 Emission factors/NFI previous assessment
exercises in Fiji Fiji MFFR
Fiji MFFR
15:00- 17:00 Area estimates: Statistical basis and exercise UN-REDD Javier Garcia-Perez
17:00-17:30 General discussion and review of day 1
Day Two: Tuesday
Time Event Organization Speaker
8:30-9:00 Arrival and registration
28
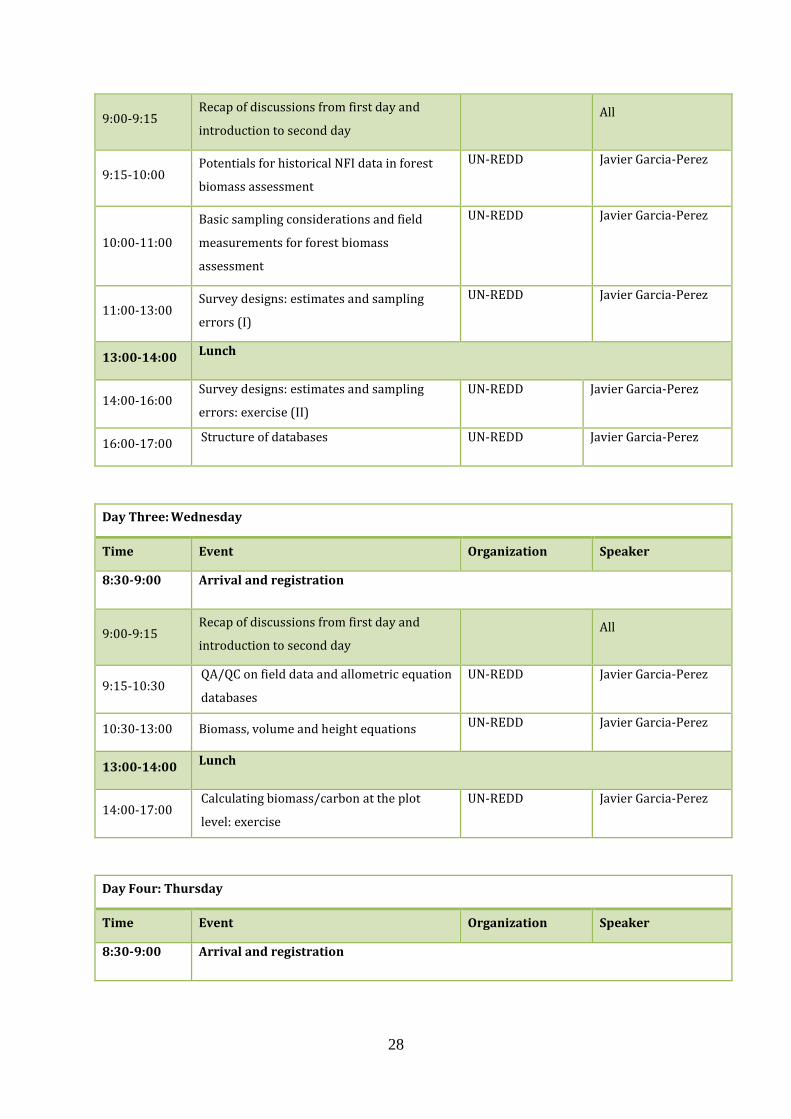
9:00-9:15 Recap of discussions from first day and
introduction to second day All
9:15-10:00 Potentials for historical NFI data in forest
biomass assessment
UN-REDD Javier Garcia-Perez
10:00-11:00
Basic sampling considerations and field
measurements for forest biomass
assessment
UN-REDD Javier Garcia-Perez
11:00-13:00 Survey designs: estimates and sampling
errors (I)
UN-REDD Javier Garcia-Perez
13:00-14:00 Lunch
14:00-16:00 Survey designs: estimates and sampling
errors: exercise (II)
UN-REDD Javier Garcia-Perez
16:00-17:00 Structure of databases UN-REDD Javier Garcia-Perez
Day Three: Wednesday
Time Event Organization Speaker
8:30-9:00 Arrival and registration
9:00-9:15 Recap of discussions from first day and
introduction to second day
All
9:15-10:30 QA/QC on field data and allometric equation
databases
UN-REDD Javier Garcia-Perez
10:30-13:00 Biomass, volume and height equations UN-REDD Javier Garcia-Perez
13:00-14:00 Lunch
14:00-17:00 Calculating biomass/carbon at the plot
level: exercise
UN-REDD Javier Garcia-Perez
Day Four: Thursday
Time Event Organization Speaker
8:30-9:00 Arrival and registration

29
9:00-9:15 Recap of discussions from first day and
introduction to second day All
9:15-10:30 Woody debris biomass and carbon
estimation
UN-REDD Javier Garcia-Perez
10:30-13:00 Error propagation across scales (I) UN-REDD Javier Garcia-Perez
13:00-14:00 Lunch
14:00-15:00 Error propagation across scales (II) UN-REDD Javier Garcia-Perez
Day Five: Friday
Time Event Organization Speaker
8:30-9:00 Arrival and registration
9:00-9:15 Recap of discussions from first day and
introduction to second day
All
9:15-11:00
Combining area estimates with plot-based
biomass/carbon estimates and measuring
change
UN-REDD Javier Garcia-Perez
11:00-13:00
Discussion: Steps for Fiji biomass/carbon
estimation All
13:00-14:00 Lunch followed by departure
Annex 4: List of Workshop Participants
Management Services Division: Mr Noa Vakacegu
Mr Romule Rajale
Mr Anare Nayacakalou
Harvesting Division: Mr Tevita Bulai (North)
Ms Amelia Waqanibeqa (West)
Mr Apisai Rinamalo (Central).

30
Silviculture Research: Mr Maika Daveta
Mr Setariki Qaliduadua
Timber Utilisation Division: Ms Anjeshni Narayan
Planning Office: Mr Viliame Rokovu
Additional Others: Mr Vili Tupua
Mr Bjoern Hecht
Mr Jim Nakalevu
SPC staff: Mr Sairusi Bulai
Mr Jalesi Mateboto
Ms Loraini Baleilomaloma
Ms Senilolia Tuiwawa
Ms Bale Wilikibau
31
Annex 5: Registration Form

32

33
34
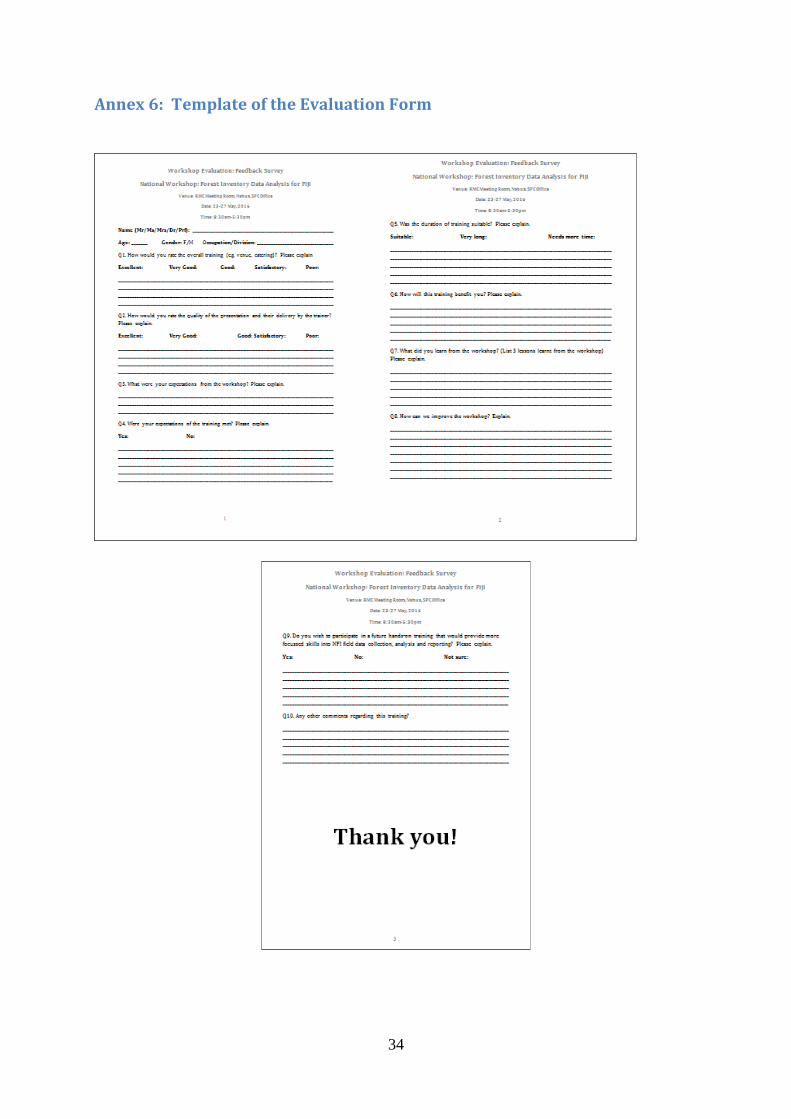
Annex 6: Template of the Evaluation Form

35