Embed Size (px)
Citation preview
May 20, 2015
Tokyo Electric Power Company, Inc.
Report on the Investigation and Examination of
Unconfirmed/Unclear Matters
on the Development Mechanism of the Fukushima Nuclear Accident
Progress Report No.3
1
■Overview
1. Overview of the Fukushima Nuclear Accident
2. Positioning of this report
3. Investigation/Deliberation History
4. Progress made in the study of ten high-priority issues
5. Main points of the third progress report
6. Sharing insights and engaging in discussion with researchers from overseas
■Matters studied
Overview of the third progress report
1. Success or failure of Unit 2 containment vessel venting
2. Regarding the dose rate increase seen around March 20th
3. Unit 1 measurement data and accident development assumptions made based
on past analysis results
4. Explanation on Unit 2 CAMS measurement data
Terminology
Table of Contents
P 3
P 4
P 5
P 6
P 8
P10
P11
P17
P23
P30
P 7
P33
Report on the Results of the Examination and Review of
Unconfirmed/Unclear Matters
Progress Report No.3
Overview
3
1. Overview of the Fukushima Nuclear Accident
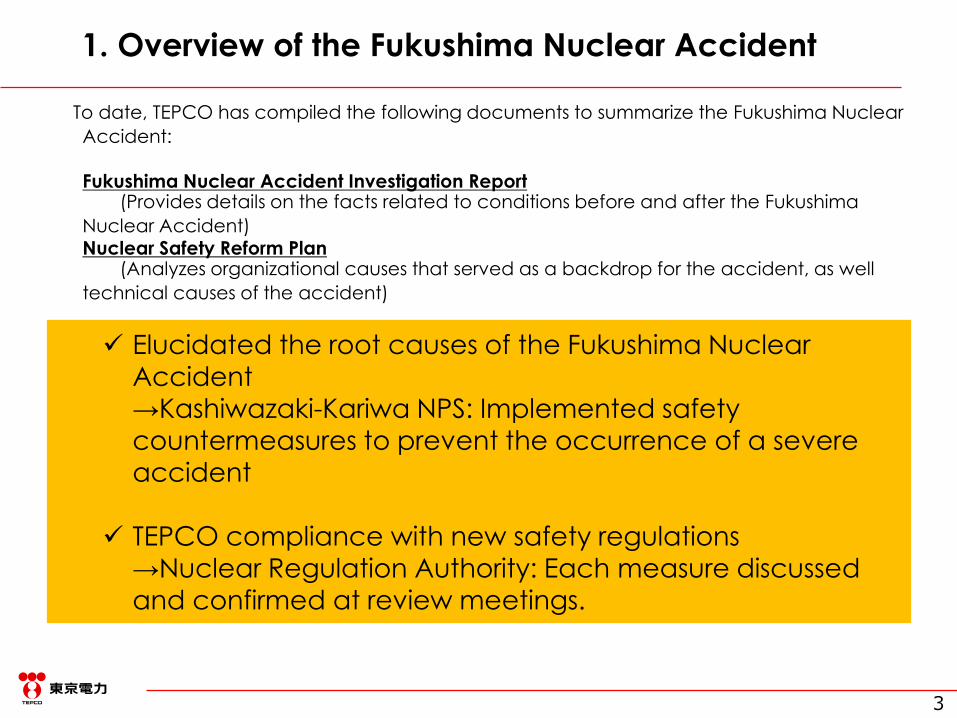
To date, TEPCO has compiled the following documents to summarize the Fukushima Nuclear
Accident:
Fukushima Nuclear Accident Investigation Report(Provides details on the facts related to conditions before and after the Fukushima
Nuclear Accident)Nuclear Safety Reform Plan
(Analyzes organizational causes that served as a backdrop for the accident, as well
technical causes of the accident)
Elucidated the root causes of the Fukushima Nuclear
Accident
→Kashiwazaki-Kariwa NPS: Implemented safety
countermeasures to prevent the occurrence of a severe
accident
TEPCO compliance with new safety regulations
→Nuclear Regulation Authority: Each measure discussed and confirmed at review meetings.

4
2. Positioning of this report
Understanding the unsolved issues of details of how the incident developed after the initial accident is not only the responsibility of the parties involved in the accident but also important in order to:
・predict the state of field debris and accumulate knowledge required for decommissioning
・provide knowledge for contributing to the improvement of precision of accident simulation models used by countries all over the world
・continually improve nuclear power station safety technology
Accident investigations to date have made it clear that the accident occurred because of a widespread loss of safety function caused by the tsunami that occurred after all external power had been cut off by the earthquake, and that escalation of the accident thereafter was not able to be stopped due to the lack of advanced accident prevention preparation.
⇒The Kashiwazaki-Kariwa NPS has implemented safety countermeasures based on these results
After reviewing the details of various accident investigations conducted by other agencies and organizations, including TEPCO, the Nuclear Regulatory Agency’s accident analysis review committee determined that the primary causes of the accident are the same as those above determined by TEPCO.
This report compiles the results of investigations and deliberations conducted from the viewpoints mentioned above. This is the third progress report following those given in December 2013 and August 2014
Scope c
overe
d b
y d
elib
era
tions
and in
vestig
atio
ns in
to u
nso
lved
issues
Accid
ent ro
ot c
ause
s (c
larifie
d)
Deta
iled a
ccid
ent
develo
pm
ent m
echanism
Scope c
overe
d b
y th
e a
ccid
ent
investig
atio
n re
port a
nd th
e n
ucle
ar
safe
ty re
form
pla
n
Effo
rts to e
nsu
re th
at a
n a
ccid
ent
like th
e F
ukush
ima D
aiic
hi N
ucle
ar
Accid
ent n
ever o
ccurs a
gain
Contin
uous e
fforts to
furth
er
impro
ve s
afe
ty

5
52 issues were identified as being unsolved events related to the
detailed development of the incident following the accident
Issues examined in the first report Issues examined at the second report and thereafter
Approx. 10 issues*
3. Investigation/Deliberation History
Two of these issues are still being examined
Issues under examination related to the second report: 4
Issues under examination related to the third report: 2(one of these issues is the
subject of field survey)
Issues under examination related to the second and third
reports: 5(examining cooperation with
external researchers)
Issues important to solving the
development mechanism(high priority)
10
Issues that will help to understand the development
mechanism (not very high priority)
34
* Includes causes that have been revisited through additional investigations. The second report and reports thereafter examine the development mechanism.
Issues important to solving the
development
mechanism:
5
Issues that will help to
understand the development mechanism:
5

6
2.Progress made in the study of ten high-priority issues
Study of safety relief valve operation after reactor core damage
Improving the accuracy of our estimate of the volume of cooling
water injections from fire engines into the nuclear reactor
Evaluation of HPCI system operational state at Unit 3 and its
impact on the accident’s progression
Melted core material behavior when dropping to the lower plenum
Identification of causes for the high-dose contamination of pipes
in the reactor cooling water system at Unit 1
Rise in reactor pressure following forced depressurization at
Unit2
Factors in the shutdown of the reactor core isolation cooling
system at Unit 3
Thermal stratification in the suppression pool at Unit 3
Issues reported on
in the second
progress report
Issues under
review
(investigated by
TEPCO)
Issues for which
review has yet to
begin
Common-2
Unit 2-7
Unit 3-1
Unit 3-5
Common-1
Common-6
Unit 3-3
Unit 1-9
Issues under
review
(government R&D
projects, etc.)
Success or failure of Unit 2 containment vessel venting (Rupture disk status of Unit 2) Unit 2-9
Cause investigation of dose increase around March 20th Common-9
Issues covered
in the current
report

7
5. Major Points of the Third Progress Report
1. Success or failure of Unit 2 containment vessel venting (priority issue)Field investigations have revealed that radiation levels around the rupture discs were low, quite low even when compared to SGTS filters (downstream side) which are thought to have been affected by Unit 1 venting. This suggests that the rupture discs did not activate.
2. Investigation into the cause of site dose rate increases around March 20, 2011 (priority issue)It was reconfirmed that conditions inside the plant did not change greatly during the time period when site dose levels increased. Given the changes in wind direction experienced on that day investigation results suggest that radioactive substances that were being discharged continually from the containment vessel were detected as a result of the change in wind direction.
3. Presumed accident development at Unit 1 based on new analysis resultsUnit 1 accident development behavior was examined based on Unit 1 water level measurements and the results of accident development analyses. This has provided a certain degree of clarity in regards to the timing and location of leaks from the reactor pressure vessel.
4. Presumed accident development based on Unit 2 CAMS measurement dataUnit 2 CAMS measurement data was analyzed in order to examine accident development. This data suggests that it is highly possible that a large change in status occurred on the evening of March 15, and that there was a monotonic decrease in dose rates after March 15 thereby suggesting that reheating and melting will not occur again.
8
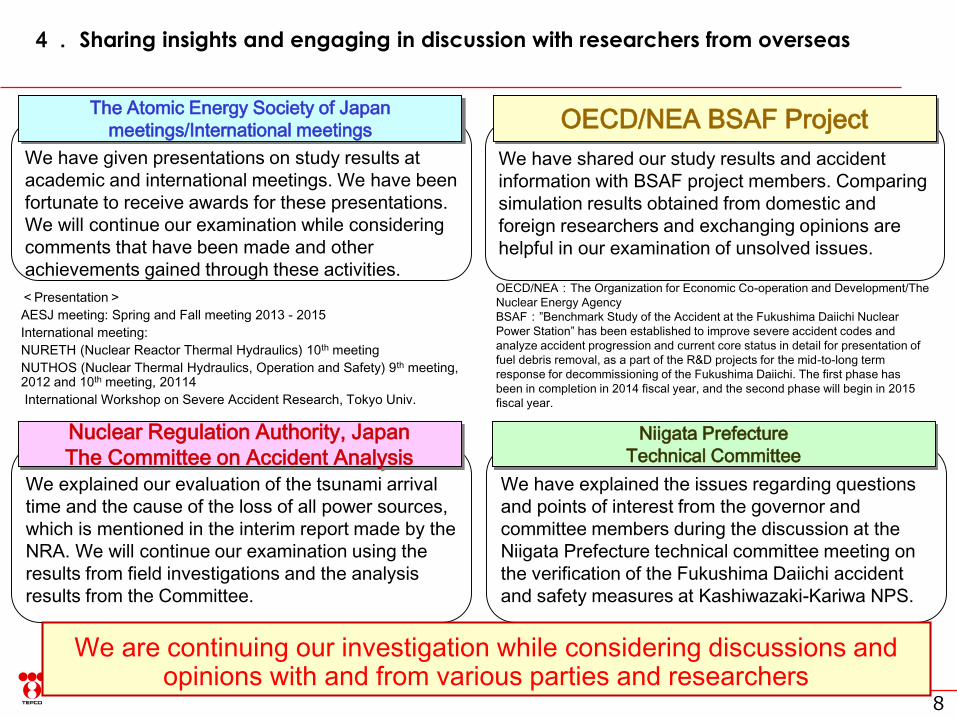
4. Sharing insights and engaging in discussion with researchers from overseas
<Presentation>
AESJ meeting: Spring and Fall meeting 2013 - 2015
International meeting:
NURETH (Nuclear Reactor Thermal Hydraulics) 10th meeting
NUTHOS (Nuclear Thermal Hydraulics, Operation and Safety) 9th meeting, 2012 and 10th meeting, 20114
International Workshop on Severe Accident Research, Tokyo Univ.
We have given presentations on study results at
academic and international meetings. We have been
fortunate to receive awards for these presentations.
We will continue our examination while considering
comments that have been made and other
achievements gained through these activities.
The Atomic Energy Society of Japan
meetings/International meetings
We have shared our study results and accident
information with BSAF project members. Comparing
simulation results obtained from domestic and
foreign researchers and exchanging opinions are
helpful in our examination of unsolved issues.
OECD/NEA BSAF Project
We explained our evaluation of the tsunami arrival
time and the cause of the loss of all power sources,
which is mentioned in the interim report made by the
NRA. We will continue our examination using the
results from field investigations and the analysis
results from the Committee.
Nuclear Regulation Authority, Japan
The Committee on Accident Analysis
We have explained the issues regarding questions
and points of interest from the governor and
committee members during the discussion at the
Niigata Prefecture technical committee meeting on
the verification of the Fukushima Daiichi accident
and safety measures at Kashiwazaki-Kariwa NPS.
Niigata Prefecture
Technical Committee
OECD/NEA:The Organization for Economic Co-operation and Development/The
Nuclear Energy Agency
BSAF:”Benchmark Study of the Accident at the Fukushima Daiichi Nuclear
Power Station” has been established to improve severe accident codes and
analyze accident progression and current core status in detail for presentation of
fuel debris removal, as a part of the R&D projects for the mid-to-long term
response for decommissioning of the Fukushima Daiichi. The first phase has
been in completion in 2014 fiscal year, and the second phase will begin in 2015
fiscal year.
We are continuing our investigation while considering discussions and opinions with and from various parties and researchers
Report on the Results of Examination and Review on
Unconfirmed/Unclear Matters
Progress Report No.3
Matters studied
10
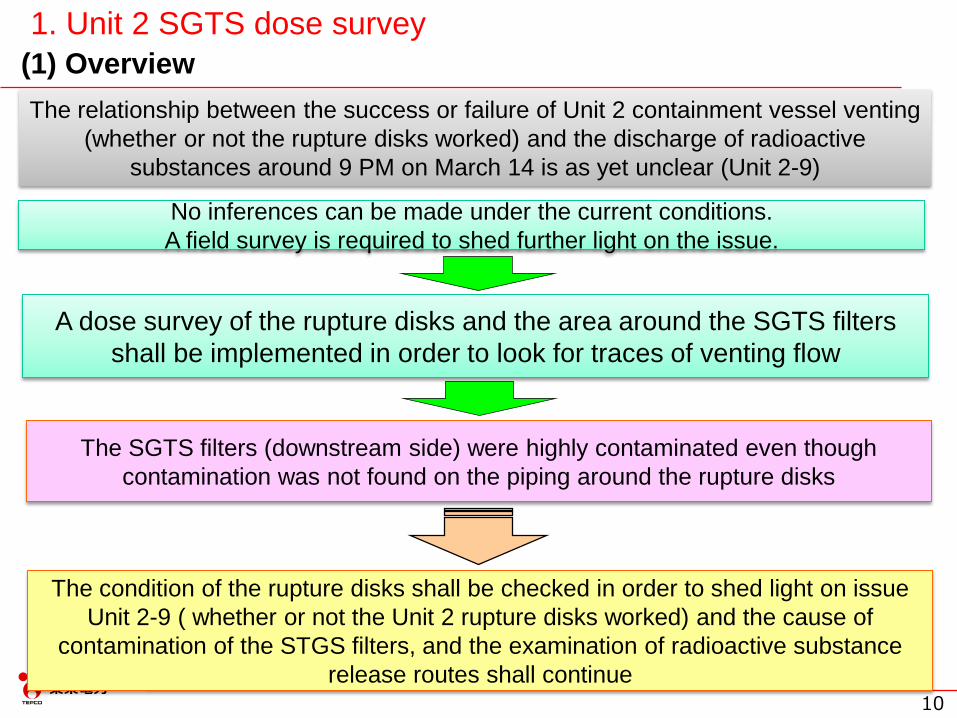
No inferences can be made under the current conditions.
A field survey is required to shed further light on the issue.
The condition of the rupture disks shall be checked in order to shed light on issue
Unit 2-9 ( whether or not the Unit 2 rupture disks worked) and the cause of
contamination of the STGS filters, and the examination of radioactive substance
release routes shall continue
A dose survey of the rupture disks and the area around the SGTS filters
shall be implemented in order to look for traces of venting flow
The SGTS filters (downstream side) were highly contaminated even though
contamination was not found on the piping around the rupture disks
1. Unit 2 SGTS dose survey
(1) Overview
The relationship between the success or failure of Unit 2 containment vessel venting
(whether or not the rupture disks worked) and the discharge of radioactive
substances around 9 PM on March 14 is as yet unclear (Unit 2-9)

11
SGTS
From ventilation and air-conditioning
system inside the R/B
3/1325% opened
Rupture disk
SGTS
Unit 1/2 main exhaust stack
From Unit 1
SGTS
Rupture disk contaminated?To main exhaust
stack/purge line
What is the dose
distribution around the
SGTS filter train?
Vent line
filter
train
Opened 3/14
Isolation valve
contaminated?
Containment
vesselDotted lines: Areas
inside the SGTS room
(2nd floor of the R/B)
S/C
Gravity
damper
AO-218
AO-217
MO-271
(2) Unit 2 SGTS system schematic and survey location
1. Unit 2 SGTS dose survey
■Purge line
■Ventilation and air-conditioning system line inside the R/B
■Vent line
■Emergency ventilation and air-conditioning system line
12
SGTS
From ventilation and air-conditioning
system inside the R/B
Rupture disk
SGTS
Unit 1/2 main exhaust stack
From Unit 1 SGTS
To main exhaust stack
Vent line
Filter trainOpened 3/14
Containment vesselS/C
Gravity
damper
AO-218
AO-217Full open confirmed
MO-271
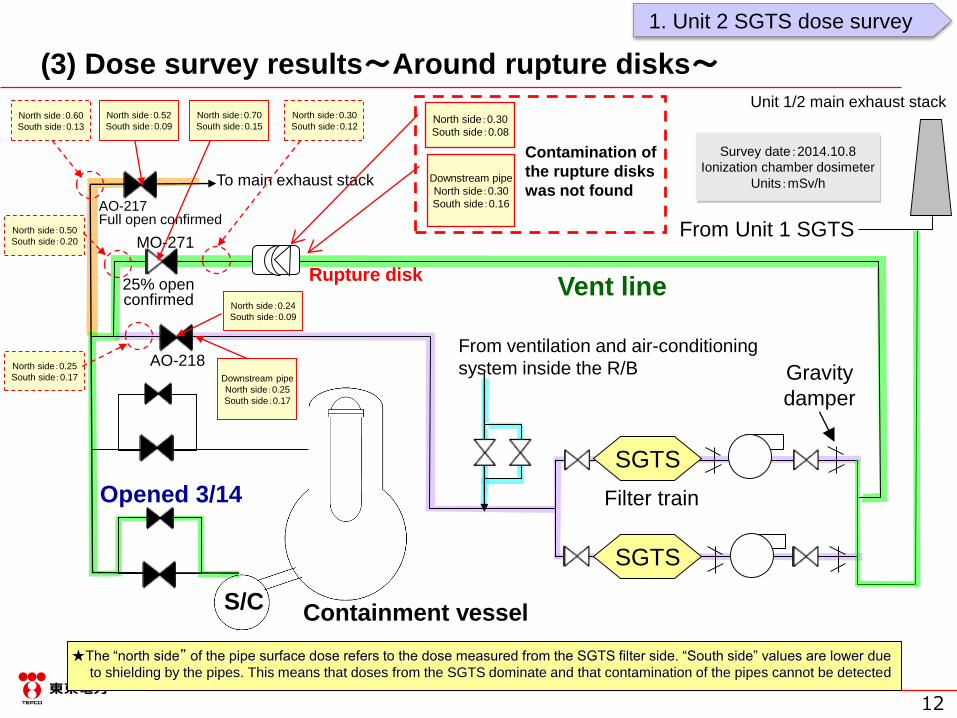
(3) Dose survey results~Around rupture disks~
1. Unit 2 SGTS dose survey
North side:0.30
South side:0.08
Downstream pipe
North side:0.30
South side:0.16
25% open confirmed
Contamination of
the rupture disks
was not found
★The “north side” of the pipe surface dose refers to the dose measured from the SGTS filter side. “South side” values are lower due
to shielding by the pipes. This means that doses from the SGTS dominate and that contamination of the pipes cannot be detected
Survey date:2014.10.8
Ionization chamber dosimeter
Units:mSv/h
North side:0.60
South side:0.13
North side:0.50
South side:0.20
North side:0.52
South side:0.09
North side:0.70
South side:0.15
North side:0.30
South side:0.12
North side:0.24
South side:0.09
Downstream pipe
North side:0.25
South side:0.17
North side:0.25
South side:0.17

13
eastwest ②③④⑤⑥ ①
⑦
⑧
east west
Entrance
Exit
Measurement location
⑧-A ⑦-A ⑥-A ⑤-A ④-A ③-A ②-A ①-A
Outlet pipe Outlet pipe Outlet HEPA filter Charcoal filter HEPA filter Pre- filter Inlet
Measurement height
2170mm 1150mm 1150mm 1150mm 1150mm 1150mm 1150mm 1150mm
Dose rate 79mSv/h 85mSv/h 400mSv/h 1Sv/h * 460mSv/h 220mSv/h 140mSv/h 69mSv/h
Survey date:2014.11.12
Dosimeter attached to robot
Robot used:PackBot
Measured dose on north side
*) Dose rate measured at a location approximately 20 cm away from the surface of the filter train ( approximately 65 cm from the center of the filter)
1150mm
Running pathway
of robot
(4) Dose survey results~SGTS filter train(A)~
1. Unit 2 SGTS dose survey
14
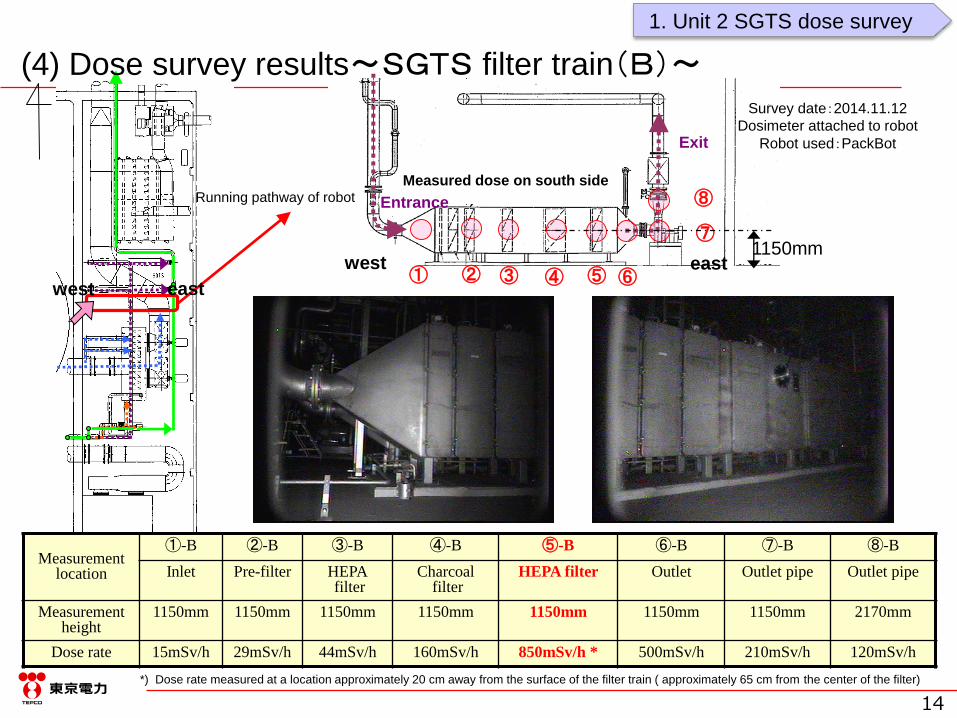
Survey date:2014.11.12
Dosimeter attached to robot
Robot used:PackBot
② ③ ④ ⑤ ⑥
⑦
⑧
①
Entrance
Exit
west east
Measurement location
①-B ②-B ③-B ④-B ⑤-B ⑥-B ⑦-B ⑧-B
Inlet Pre-filter HEPAfilter
Charcoal filter
HEPA filter Outlet Outlet pipe Outlet pipe
Measurement height
1150mm 1150mm 1150mm 1150mm 1150mm 1150mm 1150mm 2170mm
Dose rate 15mSv/h 29mSv/h 44mSv/h 160mSv/h 850mSv/h * 500mSv/h 210mSv/h 120mSv/h
west east
Measured dose on south side
*) Dose rate measured at a location approximately 20 cm away from the surface of the filter train ( approximately 65 cm from the center of the filter)
1150mm
Running pathway of robot
(4) Dose survey results~SGTS filter train(B)~
1. Unit 2 SGTS dose survey
15
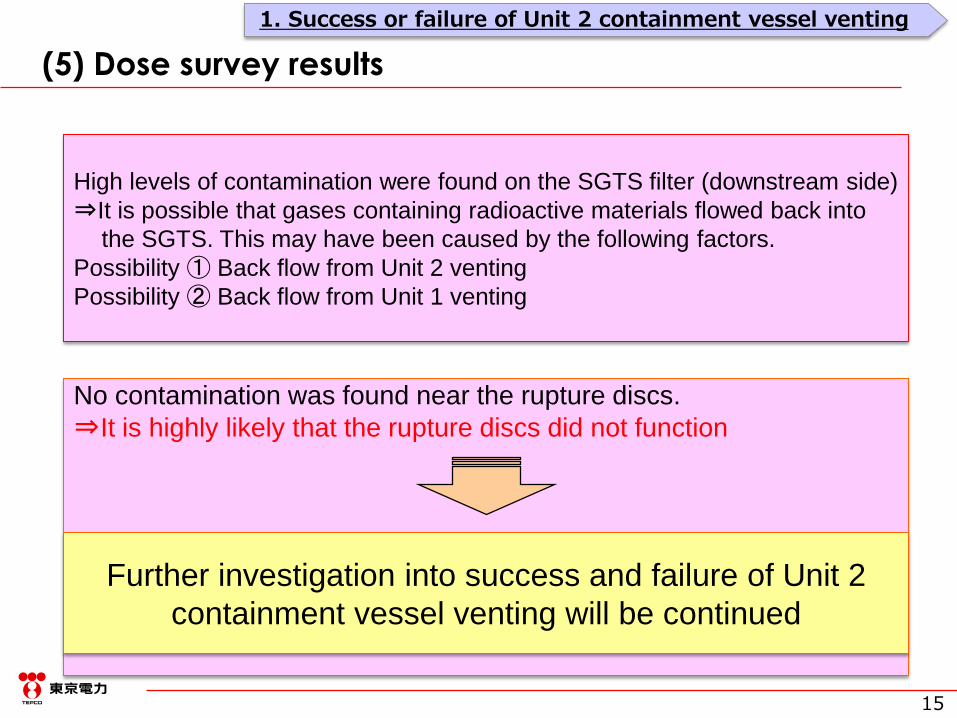
(5) Dose survey results
No contamination was found near the rupture discs.
⇒It is highly likely that the rupture discs did not function
High levels of contamination were found on the SGTS filter (downstream side)
⇒It is possible that gases containing radioactive materials flowed back into
the SGTS. This may have been caused by the following factors.
Possibility ① Back flow from Unit 2 venting
Possibility ② Back flow from Unit 1 venting
Further investigation into success and failure of Unit 2
containment vessel venting will be continued
1. Success or failure of Unit 2 containment vessel venting
16
2. The causes of the dose increase seen around March 20th
(1) Overview
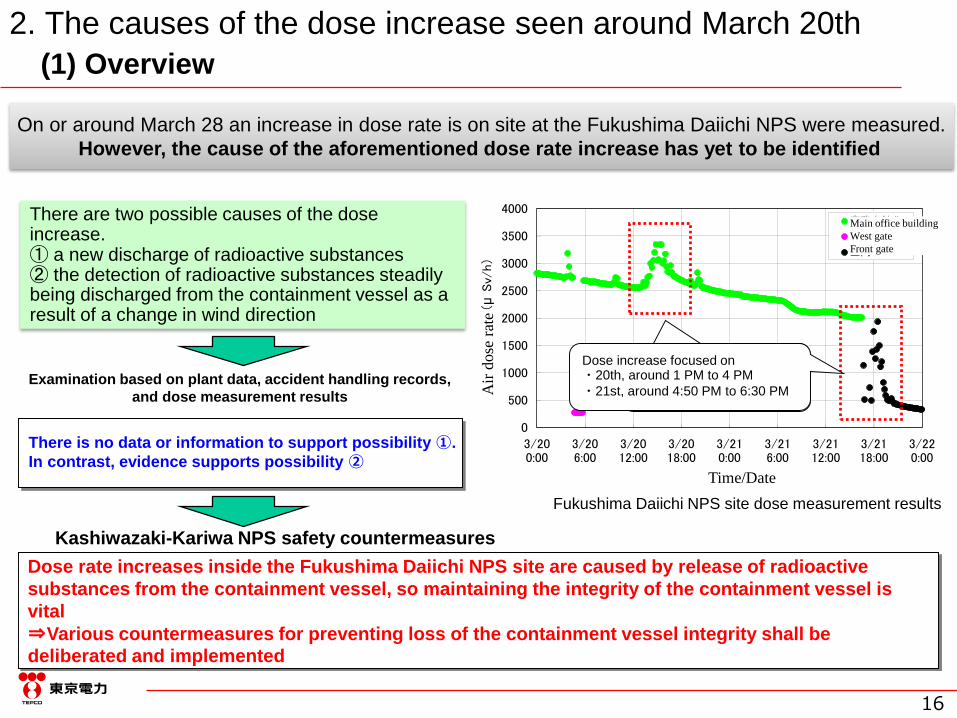
On or around March 28 an increase in dose rate is on site at the Fukushima Daiichi NPS were measured.
However, the cause of the aforementioned dose rate increase has yet to be identified
There are two possible causes of the dose increase.① a new discharge of radioactive substances② the detection of radioactive substances steadily being discharged from the containment vessel as a result of a change in wind direction
Kashiwazaki-Kariwa NPS safety countermeasures
Dose rate increases inside the Fukushima Daiichi NPS site are caused by release of radioactive
substances from the containment vessel, so maintaining the integrity of the containment vessel is
vital
⇒Various countermeasures for preventing loss of the containment vessel integrity shall be
deliberated and implemented
Examination based on plant data, accident handling records,
and dose measurement results
There is no data or information to support possibility ①.
In contrast, evidence supports possibility ②
Fukushima Daiichi NPS site dose measurement results
0
500
1000
1500
2000
2500
3000
3500
4000
3/200:00
3/206:00
3/2012:00
3/2018:00
3/210:00
3/216:00
3/2112:00
3/2118:00
3/220:00
日時空間線量率(μSv/h)
事務本館北
西門
正門
Dose increase focused on・20th, around 1 PM to 4 PM
・21st, around 4:50 PM to 6:30 PM
Time/DateA
ir d
ose
rat
e
Main office building
West gate
Front gate
17
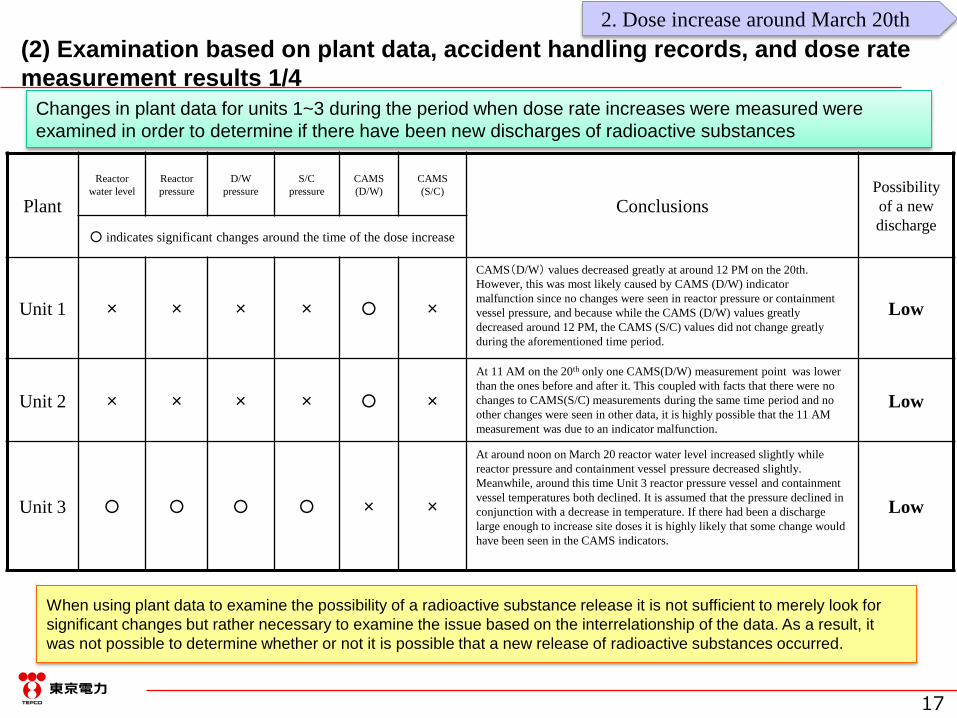
(2) Examination based on plant data, accident handling records, and dose rate
measurement results 1/4
2. Dose increase around March 20th
Plant
Reactor
water level
Reactor
pressure
D/W
pressure
S/C
pressure
CAMS
(D/W)
CAMS
(S/C)
ConclusionsPossibility
of a new
discharge○ indicates significant changes around the time of the dose increase
Unit 1 × × × × ○ ×
CAMS(D/W) values decreased greatly at around 12 PM on the 20th.
However, this was most likely caused by CAMS (D/W) indicator
malfunction since no changes were seen in reactor pressure or containment
vessel pressure, and because while the CAMS (D/W) values greatly
decreased around 12 PM, the CAMS (S/C) values did not change greatly
during the aforementioned time period.
Low
Unit 2 × × × × ○ ×
At 11 AM on the 20th only one CAMS(D/W) measurement point was lower
than the ones before and after it. This coupled with facts that there were no
changes to CAMS(S/C) measurements during the same time period and no
other changes were seen in other data, it is highly possible that the 11 AM
measurement was due to an indicator malfunction.
Low
Unit 3 ○ ○ ○ ○ × ×
At around noon on March 20 reactor water level increased slightly while
reactor pressure and containment vessel pressure decreased slightly.
Meanwhile, around this time Unit 3 reactor pressure vessel and containment
vessel temperatures both declined. It is assumed that the pressure declined in
conjunction with a decrease in temperature. If there had been a discharge
large enough to increase site doses it is highly likely that some change would
have been seen in the CAMS indicators.
Low
Changes in plant data for units 1~3 during the period when dose rate increases were measured were
examined in order to determine if there have been new discharges of radioactive substances
When using plant data to examine the possibility of a radioactive substance release it is not sufficient to merely look for
significant changes but rather necessary to examine the issue based on the interrelationship of the data. As a result, it
was not possible to determine whether or not it is possible that a new release of radioactive substances occurred.

18
(2) Examination based on plant data, accident handling records, and dose rate
measurement results 2/4
2. Dose increase around March 20th
Accident response records (details of teleconferences between Fukushima Daiichi and the
Head Office) were used to examine whether or not a new release of radioactive substances
occurred.
However, it was assumed that this was caused by the ignition by some means of oil in the
PLR pump speed controller on the fourth floor of the reactor building. Since the unit was in
operation at the time of the accident there were very few flammable materials inside the
power station so it is quite possible that the aforementioned clause is accurate.
⇒An examination of the accident handling records did not yield any evidence to support that
there was a new release of radioactive substances
Black smoke was seen emanating from
the southeast side of the Unit 3 R/B at
around 4 PM on March 21
Unit 3 (March 21, 2011)
19
(2) Examination based on plant data, accident handling records, and
dose rate measurement results 3/4
2. Dose increase around March 20th
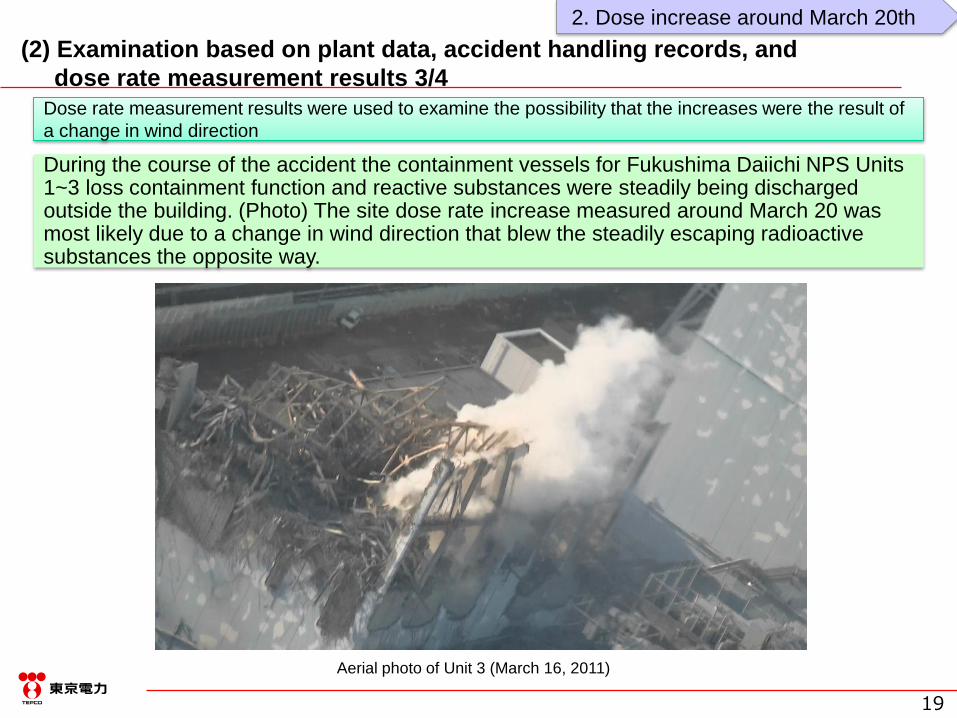
Dose rate measurement results were used to examine the possibility that the increases were the result of
a change in wind direction
During the course of the accident the containment vessels for Fukushima Daiichi NPS Units 1~3 loss containment function and reactive substances were steadily being discharged outside the building. (Photo) The site dose rate increase measured around March 20 was most likely due to a change in wind direction that blew the steadily escaping radioactive substances the opposite way.
Aerial photo of Unit 3 (March 16, 2011)

20
(2) Examination based on plant data, accident handling records, and dose rate
measurement results 4/4
2. Dose increase around March 20th
0
200
400
600
800
1000
1200
1400
1600
1800
2000
2200
2400
2600
2800
3000
3200
3400
3/200:00
3/206:00
3/2012:00
3/2018:00
3/210:00
3/216:00
3/2112:00
3/2118:00
3/220:00
日時
空間線量率(μSv/h)
風向
事務本館北西門正門風向(事務本館北)風向(西門)風向(正門)
北
北北東
北北西
北西
西北西
西
西南西
南西
南南西
南
南南東
南東
東南東
東
東北東
北東
The results of the analysis show that a large percentage of the measurement points were downwind during the increase in dose
levels, and in contrast when the dose levels decreased most of the measurement points were not downwind.
⇒It is highly possible that because of the dose increase was due to a change in wind direction
Fukushima Daiichi NPS Site Dose Measurement Results and Wind Direction at Each Measurement Point
Dose measurement point diagram
Analysis of the percentage of measurement points that were downwind during the dose increase, and the
percentage of measurement points that were in directions other than downwind thereafter when dose
levels decreased.
Wind direction
that puts
measurement
points
downwind
Wind direction
that puts
measurement
points
downwind
Main office building
West gate
Front gate
Wind direction (north side of main
office building)
Wind direction (West gate)
When the direction (for front gate)
North
North Northwest
Northwest
West Northwest
West
West Southwest
Southwest
South Southwest
South
South Southeast
Southeast
East Southeast
East
East Northeast
Northeast
North Northeast
Win
d d
irec
tion
Time/Date
Air
dose
rat
e

21
(3) Kashiwazaki-Kariwa safety countermeasures
It is possible that containment function was lost during the Fukushima Daiichi NPS accident because silicon rubber that is used for hatch seals (gaskets) and the top-end flange of the containment vessel deteriorated because of the harsh environment to which it was exposed during the accident, such as high temperature steam. The following containment vessel rupture prevention countermeasures, which include countermeasures other than just preventing damage from high temperatures, are currently being deliberated and implemented, and safety measures will continue to be improved based on new knowledge that is obtained.
耐環境性の素材の採用
Primary filter vent systemSecondary filter vent system
Containment vessel leak prevention: top head cooling, substitute spray systems for the containment vessel, coolant injection into the bottom of the containment vessel, filter event sealed material backups and material improvementsSuppressing the discharge of radioactive substances: Filter ventsPreventing hydrogen explosions: Filter vents, static catalyst recombination equipment
防火水槽
2. Dose increase around March 20th
Preventing leaks from the containment vessel
Catalytic static hydrogen
recombination equipment
Containment vessel flange seal
Materials highly resistant to
the environment employed
Top head flange cooling line
Substitute containment
vessel spray system
Suppression of radioactive
substance discharge and
hydrogen discharge
Fire extinguishing
water tank
Hydrogen processing
22
-10
-8
-6
-4
-2
0
2
4
6
3/1115:00
3/1118:00
3/1121:00
3/120:00
3/123:00
3/126:00
3/129:00
3/1212:00
3/1215:00
日時
原子炉水位(m)
実測値(原子炉水位(燃料域)(A))
実測値(原子炉水位(燃料域)(B))
実測値(広帯域水位計)
ダウンカマ内水位(MAAP5.01)
シュラウド内水位(MAAP5.01)
有効燃料頂部(TAF)
有効燃料底部(BAF)
原子炉圧力容器破損以降の水位(解析値)は水位を維持していることを意味するものではない
原子炉圧力容器破損(解析)
3. Unit 1 measurement data and accident development assumptions made based on past analysis results
(1) Overview
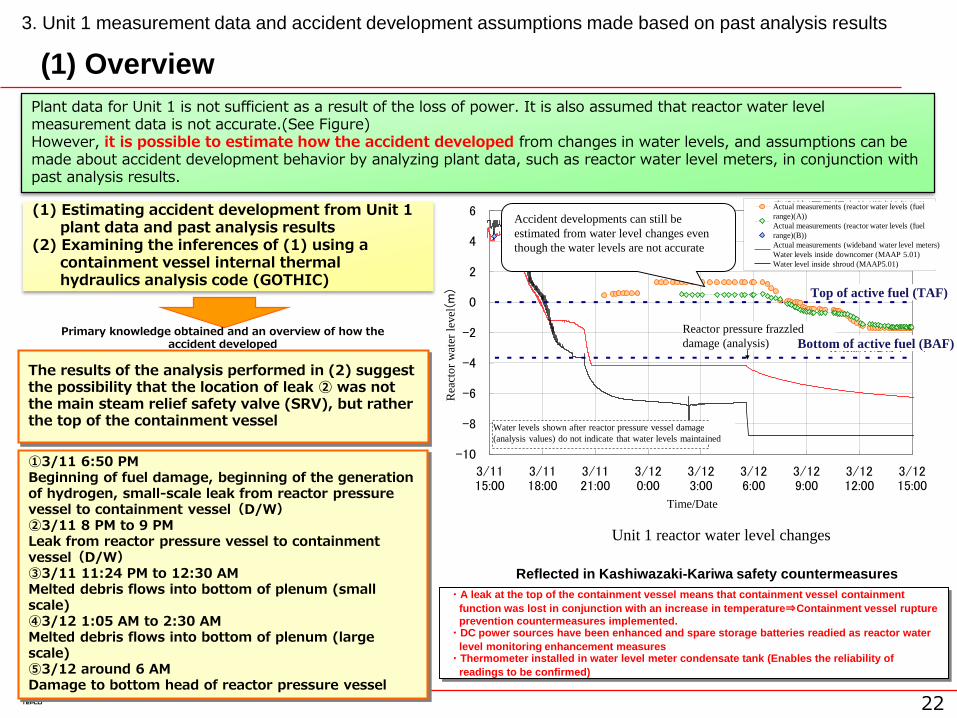
Plant data for Unit 1 is not sufficient as a result of the loss of power. It is also assumed that reactor water level measurement data is not accurate.(See Figure)However, it is possible to estimate how the accident developed from changes in water levels, and assumptions can be made about accident development behavior by analyzing plant data, such as reactor water level meters, in conjunction with past analysis results.
(1) Estimating accident development from Unit 1 plant data and past analysis results
(2) Examining the inferences of (1) using a containment vessel internal thermal hydraulics analysis code (GOTHIC)
Reflected in Kashiwazaki-Kariwa safety countermeasures
・A leak at the top of the containment vessel means that containment vessel containment
function was lost in conjunction with an increase in temperature⇒Containment vessel rupture
prevention countermeasures implemented.・DC power sources have been enhanced and spare storage batteries readied as reactor water
level monitoring enhancement measures・Thermometer installed in water level meter condensate tank (Enables the reliability of
readings to be confirmed)
Primary knowledge obtained and an overview of how the accident developed
①3/11 6:50 PMBeginning of fuel damage, beginning of the generation of hydrogen, small-scale leak from reactor pressure vessel to containment vessel(D/W)②3/11 8 PM to 9 PMLeak from reactor pressure vessel to containment vessel(D/W)③3/11 11:24 PM to 12:30 AMMelted debris flows into bottom of plenum (small scale)④3/12 1:05 AM to 2:30 AMMelted debris flows into bottom of plenum (large scale)⑤3/12 around 6 AMDamage to bottom head of reactor pressure vessel
Unit 1 reactor water level changes
Accident developments can still be
estimated from water level changes even
though the water levels are not accurate
The results of the analysis performed in (2) suggest the possibility that the location of leak ② was not the main steam relief safety valve (SRV), but rather the top of the containment vessel
Actual measurements (reactor water levels (fuel
range)(A))
Actual measurements (reactor water levels (fuel
range)(B))
Actual measurements (wideband water level meters)
Water levels inside downcomer (MAAP 5.01)
Water level inside shroud (MAAP5.01)
Water levels shown after reactor pressure vessel damage
(analysis values) do not indicate that water levels maintained
Reactor pressure frazzled
damage (analysis) Bottom of active fuel (BAF)
Top of active fuel (TAF)
Rea
cto
r w
ater
lev
el
Time/Date
23
(2) Water level meter construction
3. Unit 1 accident development
Containment vessel
Reactor side piping
Reference leg
side piping
Reference leg
Reference leg
water level
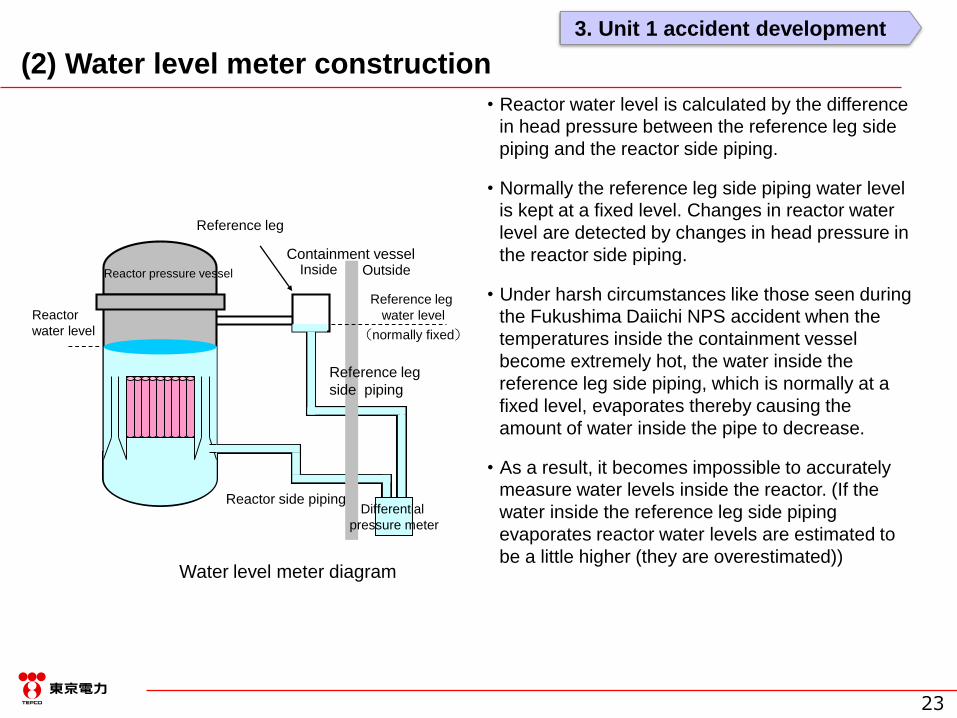
・Reactor water level is calculated by the difference
in head pressure between the reference leg side
piping and the reactor side piping.
・Normally the reference leg side piping water level
is kept at a fixed level. Changes in reactor water
level are detected by changes in head pressure in
the reactor side piping.
・Under harsh circumstances like those seen during
the Fukushima Daiichi NPS accident when the
temperatures inside the containment vessel
become extremely hot, the water inside the
reference leg side piping, which is normally at a
fixed level, evaporates thereby causing the
amount of water inside the pipe to decrease.
・As a result, it becomes impossible to accurately
measure water levels inside the reactor. (If the
water inside the reference leg side piping
evaporates reactor water levels are estimated to
be a little higher (they are overestimated))
Reactor pressure vessel
Reactor
water level
Inside Outside
(normally fixed)
Water level meter diagram
Differential
pressure meter
24
-5
-4
-3
-2
-1
0
1
2
3
4
5
3/1115:00
3/1118:00
3/1121:00
3/120:00
3/123:00
3/126:00
3/129:00
3/1212:00
3/1215:00
日時
原子炉水位
[m
]
実測値(燃料域(A))
実測値(燃料域)(B)
解析値(燃料域)(A)
解析値(燃料域)(B)
(3) Results of analysis using the GOTHIC code 1/3
3. Unit 1 accident development
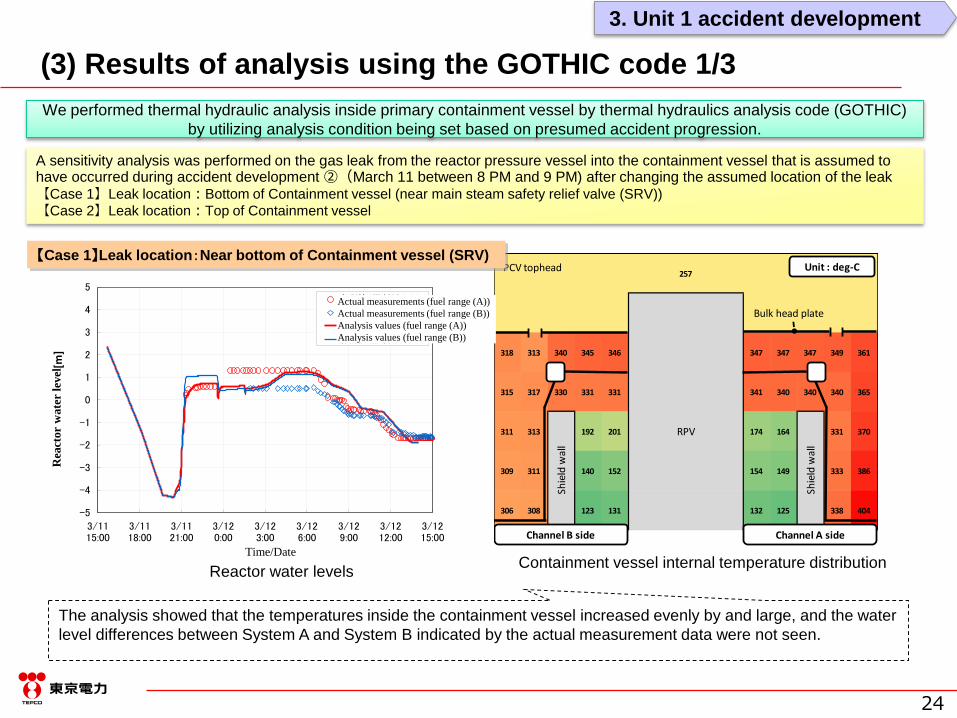
A sensitivity analysis was performed on the gas leak from the reactor pressure vessel into the containment vessel that is assumed to have occurred during accident development ②(March 11 between 8 PM and 9 PM) after changing the assumed location of the leak【Case 1】Leak location:Bottom of Containment vessel (near main steam safety relief valve (SRV))
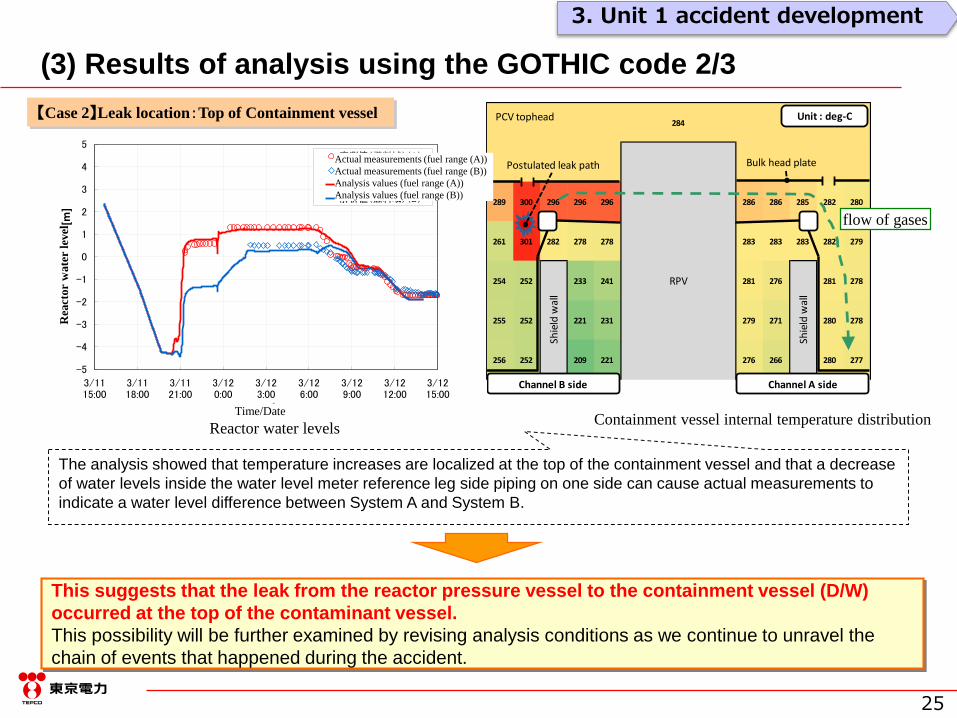
【Case 2】Leak location:Top of Containment vessel
Reactor water levels
We performed thermal hydraulic analysis inside primary containment vessel by thermal hydraulics analysis code (GOTHIC)
by utilizing analysis condition being set based on presumed accident progression.
257 257 257 257 257 257 257 257 257 257 257
257 257 257 257 257 257 257 257 257 257
318 313 340 345 346 347 347 347 349 361
315 317 330 331 331 341 340 340 340 365
311 313 192 201 RPV 174 164 331 370
309 311 140 152 154 149 333 386
306 308 123 131 132 125 338 404
Shie
ld w
all
Shie
ld w
all
PCV tophead
Bulk head plate
Unit : deg-C
Channel A sideChannel B side
The analysis showed that the temperatures inside the containment vessel increased evenly by and large, and the water
level differences between System A and System B indicated by the actual measurement data were not seen.
Containment vessel internal temperature distribution
Actual measurements (fuel range (A))
Actual measurements (fuel range (B))
Analysis values (fuel range (A))
Analysis values (fuel range (B))
Time/Date
Rea
ctor
wate
r le
vel
【Case 1】Leak location:Near bottom of Containment vessel (SRV)
25
-5
-4
-3
-2
-1
0
1
2
3
4
5
3/1115:00
3/1118:00
3/1121:00
3/120:00
3/123:00
3/126:00
3/129:00
3/1212:00
3/1215:00
日時
原子炉水位
[m
]
実測値(燃料域)(A)
実測値(燃料域)(B)
解析値(燃料域)(A)
解析値(燃料域)(B)
(3) Results of analysis using the GOTHIC code 2/3
3. Unit 1 accident development
Reactor water levels
【Case 2】Leak location:Top of Containment vessel
The analysis showed that temperature increases are localized at the top of the containment vessel and that a decrease
of water levels inside the water level meter reference leg side piping on one side can cause actual measurements to
indicate a water level difference between System A and System B.
Containment vessel internal temperature distribution
284 284 284 284 284 284 284 284 284 284 284
284 284 284 284 284 284 284 284 284 284
289 300 296 296 296 286 286 285 282 280
261 301 282 278 278 283 283 283 282 279
254 252 233 241 RPV 281 276 281 278
255 252 221 231 279 271 280 278
256 252 209 221 276 266 280 277
Shie
ld w
all
Shie
ld w
all
PCV tophead
Bulk head platePostulated leak path
Unit : deg-C
Channel A sideChannel B side
This suggests that the leak from the reactor pressure vessel to the containment vessel (D/W)
occurred at the top of the contaminant vessel.
This possibility will be further examined by revising analysis conditions as we continue to unravel the
chain of events that happened during the accident.
flow of gases
Actual measurements (fuel range (A))
Actual measurements (fuel range (B))
Analysis values (fuel range (A))
Analysis values (fuel range (B))
Time/Date
Rea
ctor
wate
r le
vel

26
0.0
0.1
0.2
0.3
0.4
0.5
0.6
0.7
0.8
0.9
1.0
3/1115:00
3/1118:00
3/1121:00
3/120:00
3/123:00
3/126:00
3/129:00
3/1212:00
3/1215:00
日時
格納容器圧力
(M
pa[
abs])
格納容器(D/W)圧力(実測値)
格納容器(S/C)圧力(実測値)
格納容器(D/W)圧力(解析値)
格納容器(S/C)圧力(解析値)
(3) Results of analysis using the GOTHIC code 3/3
3. Unit 1 accident development
In this analysis results, we could reproduce certain degree of reactor water level and primary containment vessel pressure
Supports the validity of the accident developments inferred
from plant parameters and past analysis results
-5
-4
-3
-2
-1
0
1
2
3
4
5
3/1115:00
3/1118:00
3/1121:00
3/120:00
3/123:00
3/126:00
3/129:00
3/1212:00
3/1215:00
日時
原子炉水位
[m
]
実測値(燃料域)(A)
実測値(燃料域)(B)
解析値(燃料域)(A)
解析値(燃料域)(B)
Reactor water levels
(Leak location:Top of Containment vessel)Containment vessel pressure
(Leak location:Top of Containment vessel)
Actual measurements (fuel range (A))
Actual measurements (fuel range (B))
Analysis values (fuel range (A))
Analysis values (fuel range (B))
Time/Date
Rea
ctor
wate
r le
vel
Time/Date
Containment vessel (D/W) pressure (actual measurements)
Containment vessel (S/C) pressure (actual measurements)
Containment vessel (D/W) pressure (analysis values)
Containment vessel (S/C) pressure (analysis values)
Con
tain
men
t ves
sel
pre
ssu
re
27
(4) Kashiwazaki-Kariwa Safety Countermeasures
3. Unit 1 accident development
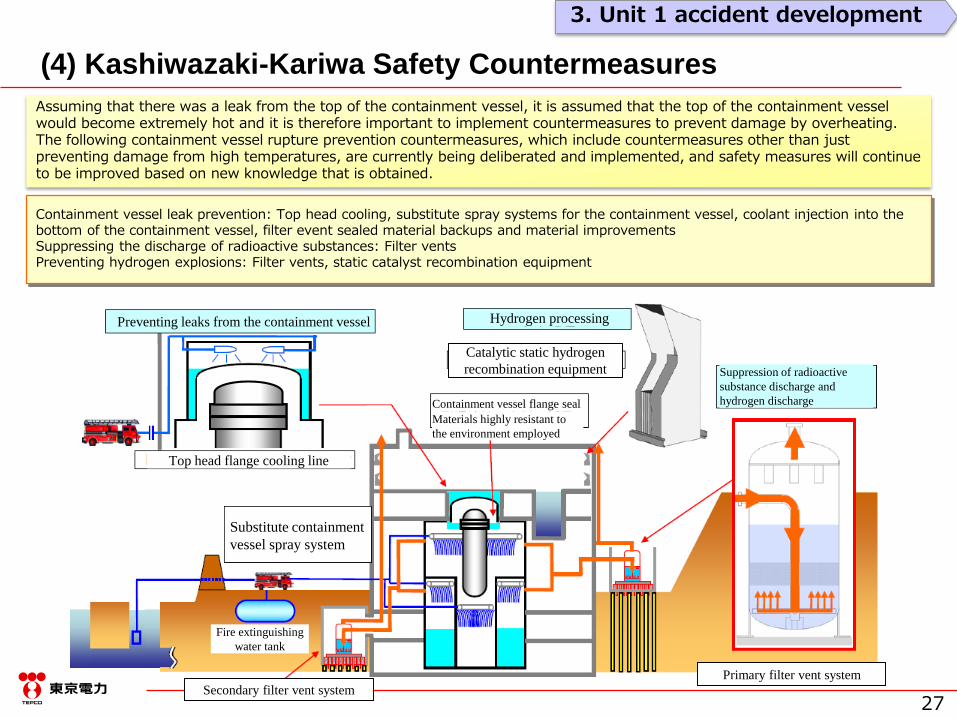
Assuming that there was a leak from the top of the containment vessel, it is assumed that the top of the containment vessel would become extremely hot and it is therefore important to implement countermeasures to prevent damage by overheating.The following containment vessel rupture prevention countermeasures, which include countermeasures other than just preventing damage from high temperatures, are currently being deliberated and implemented, and safety measures will continue to be improved based on new knowledge that is obtained.
耐環境性の素材の採用
Primary filter vent system
Secondary filter vent system
Containment vessel leak prevention: Top head cooling, substitute spray systems for the containment vessel, coolant injection into the bottom of the containment vessel, filter event sealed material backups and material improvementsSuppressing the discharge of radioactive substances: Filter ventsPreventing hydrogen explosions: Filter vents, static catalyst recombination equipment
防火水槽
Preventing leaks from the containment vessel
Catalytic static hydrogen
recombination equipment
Materials highly resistant to
the environment employed
Top head flange cooling line
Substitute containment
vessel spray system
Suppression of radioactive
substance discharge and
hydrogen discharge
Fire extinguishing
water tank
Hydrogen processing
Containment vessel flange seal
28
(4) Kashiwazaki-Kariwa Safety Countermeasures
3. Unit 1 accident development
Differential Pressure
gauge
PCV
Reactor side piping
Reference plane device side piping
Reference leg
Reference plane water level
Thermometer installed
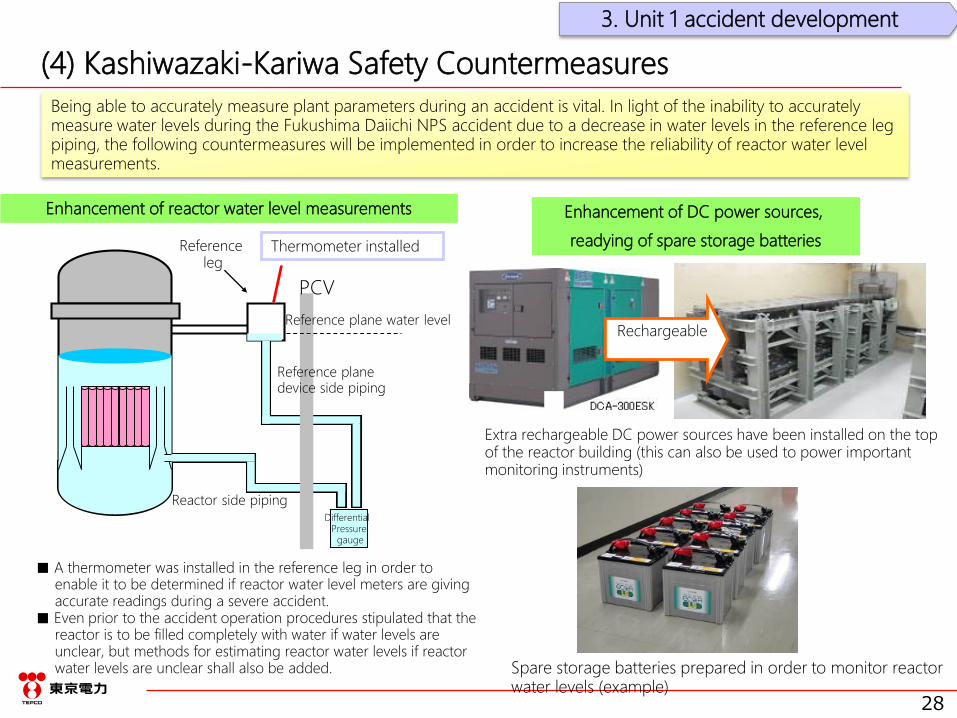
Enhancement of reactor water level measurements
Being able to accurately measure plant parameters during an accident is vital. In light of the inability to accurately measure water levels during the Fukushima Daiichi NPS accident due to a decrease in water levels in the reference leg piping, the following countermeasures will be implemented in order to increase the reliability of reactor water level measurements.
■ A thermometer was installed in the reference leg in order to enable it to be determined if reactor water level meters are giving accurate readings during a severe accident.
■ Even prior to the accident operation procedures stipulated that the reactor is to be filled completely with water if water levels are unclear, but methods for estimating reactor water levels if reactor water levels are unclear shall also be added.
Enhancement of DC power sources,
readying of spare storage batteries
Spare storage batteries prepared in order to monitor reactor water levels (example)
Rechargeable
Extra rechargeable DC power sources have been installed on the top of the reactor building (this can also be used to power important monitoring instruments)
29
4. Results of examination of Unit 2 CAMS measurement data
(1) Overview
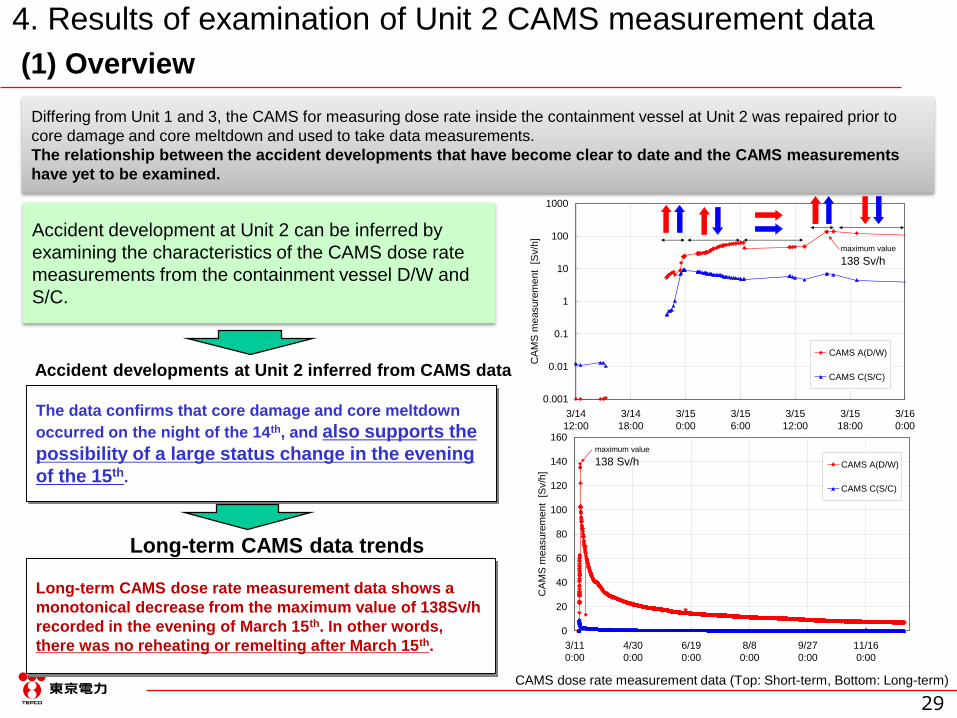
Differing from Unit 1 and 3, the CAMS for measuring dose rate inside the containment vessel at Unit 2 was repaired prior to
core damage and core meltdown and used to take data measurements.
The relationship between the accident developments that have become clear to date and the CAMS measurements
have yet to be examined.
Accident development at Unit 2 can be inferred by
examining the characteristics of the CAMS dose rate
measurements from the containment vessel D/W and
S/C.
Long-term CAMS data trends
Long-term CAMS dose rate measurement data shows a
monotonical decrease from the maximum value of 138Sv/h
recorded in the evening of March 15th. In other words,
there was no reheating or remelting after March 15th.
Accident developments at Unit 2 inferred from CAMS data
The data confirms that core damage and core meltdown
occurred on the night of the 14th, and also supports the
possibility of a large status change in the evening
of the 15th.
0.001
0.01
0.1
1
10
100
1000
3/14
12:00
3/14
18:00
3/15
0:00
3/15
6:00
3/15
12:00
3/15
18:00
3/16
0:00
CA
MS
me
asu
rem
ent
[S
v/h
]
CAMS A(D/W)
CAMS C(S/C)
maximum value
138 Sv/h
0
20
40
60
80
100
120
140
160
3/11
0:00
4/30
0:00
6/19
0:00
8/8
0:00
9/27
0:00
11/16
0:00
CA
MS
me
asu
rem
ent
[S
v/h
]
CAMS A(D/W)
CAMS C(S/C)
maximum value
138 Sv/h
CAMS dose rate measurement data (Top: Short-term, Bottom: Long-term)
30
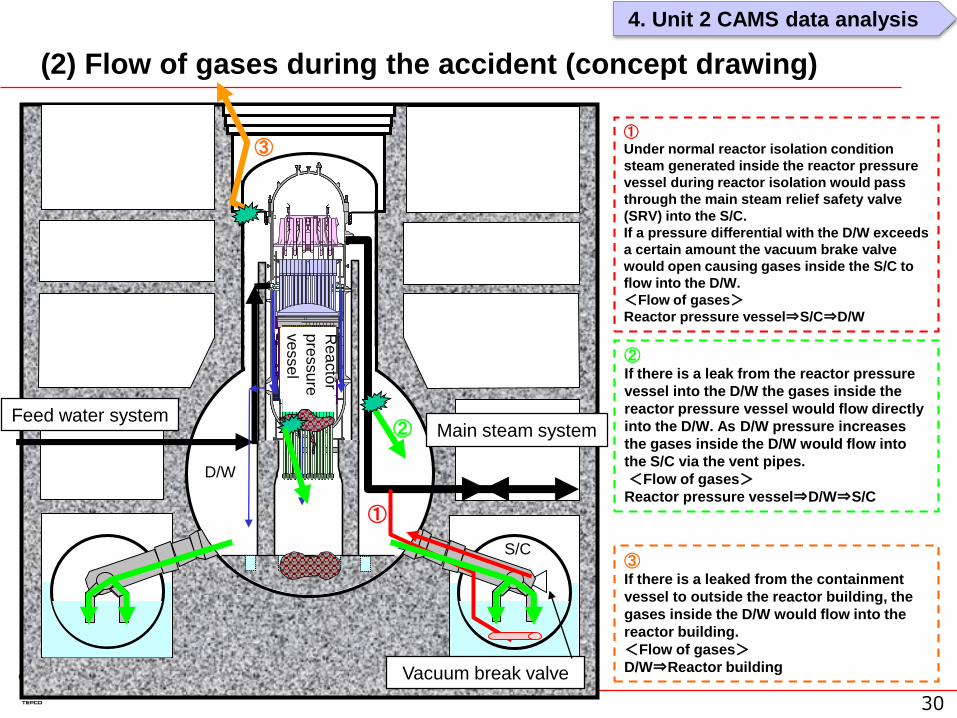
(2) Flow of gases during the accident (concept drawing)
Feed water systemMain steam system
①
①Under normal reactor isolation condition
steam generated inside the reactor pressure
vessel during reactor isolation would pass
through the main steam relief safety valve
(SRV) into the S/C.
If a pressure differential with the D/W exceeds
a certain amount the vacuum brake valve
would open causing gases inside the S/C to
flow into the D/W.
<Flow of gases>Reactor pressure vessel⇒S/C⇒D/W
②If there is a leak from the reactor pressure
vessel into the D/W the gases inside the
reactor pressure vessel would flow directly
into the D/W. As D/W pressure increases
the gases inside the D/W would flow into
the S/C via the vent pipes.
<Flow of gases>Reactor pressure vessel⇒D/W⇒S/C
Vacuum break valve
S/C
D/W
Rea
cto
r
pre
ssu
re
ve
sse
l
③
③If there is a leaked from the containment
vessel to outside the reactor building, the
gases inside the D/W would flow into the
reactor building.
<Flow of gases>D/W⇒Reactor building
②
4. Unit 2 CAMS data analysis
31
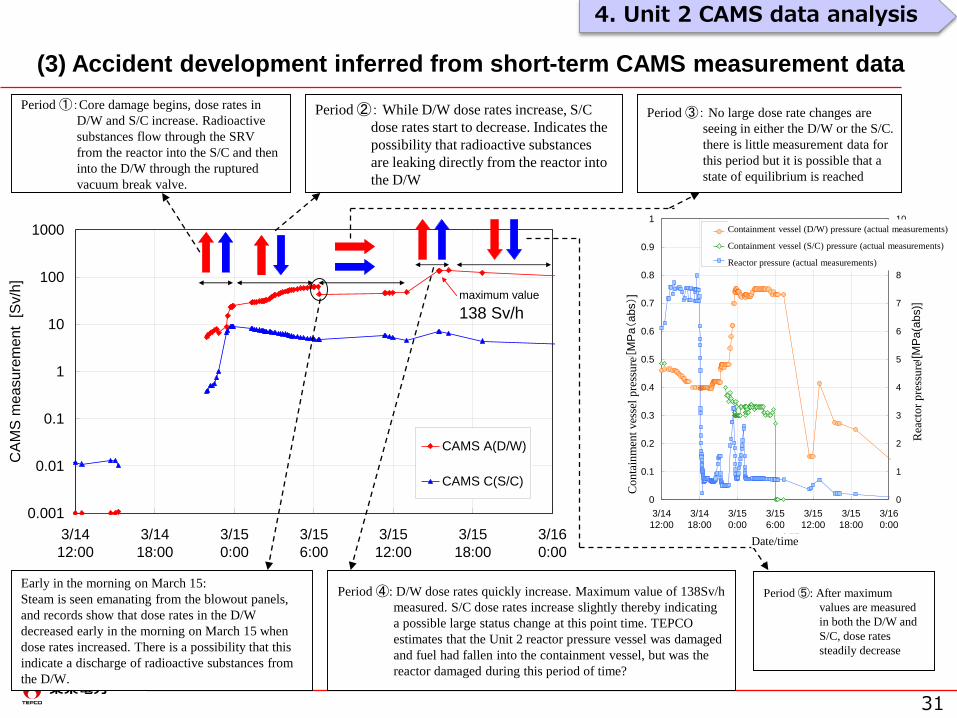
(3) Accident development inferred from short-term CAMS measurement data
0.001
0.01
0.1
1
10
100
1000
3/14
12:00
3/14
18:00
3/15
0:00
3/15
6:00
3/15
12:00
3/15
18:00
3/16
0:00
CA
MS
me
asu
rem
ent
[S
v/h
]
CAMS A(D/W)
CAMS C(S/C)
maximum value
138 Sv/h
Period ①:Core damage begins, dose rates in
D/W and S/C increase. Radioactive
substances flow through the SRV
from the reactor into the S/C and then
into the D/W through the ruptured
vacuum break valve.
Period ②: While D/W dose rates increase, S/C
dose rates start to decrease. Indicates the
possibility that radioactive substances
are leaking directly from the reactor into
the D/W
Period ③: No large dose rate changes are
seeing in either the D/W or the S/C.
there is little measurement data for
this period but it is possible that a
state of equilibrium is reached
Period ④: D/W dose rates quickly increase. Maximum value of 138Sv/h
measured. S/C dose rates increase slightly thereby indicating
a possible large status change at this point time. TEPCO
estimates that the Unit 2 reactor pressure vessel was damaged
and fuel had fallen into the containment vessel, but was the
reactor damaged during this period of time?
Period ⑤: After maximum
values are measured
in both the D/W and
S/C, dose rates
steadily decrease
Early in the morning on March 15:
Steam is seen emanating from the blowout panels,
and records show that dose rates in the D/W
decreased early in the morning on March 15 when
dose rates increased. There is a possibility that this
indicate a discharge of radioactive substances from
the D/W.
4. Unit 2 CAMS data analysis
0
0.1
0.2
0.3
0.4
0.5
0.6
0.7
0.8
0.9
1
3/14
12:00
3/14
18:00
3/15
0:00
3/15
6:00
3/15
12:00
3/15
18:00
3/16
0:00
日付/時間
格納容器圧力
[MP
a(abs)]
0
1
2
3
4
5
6
7
8
9
10
原子炉圧力
[MP
a(a
bs)]
格納容器圧力(D/W)(実測値)格納容器圧力(S/C)(実測値)原子炉圧力(実測値)
Containment vessel (D/W) pressure (actual measurements)
Containment vessel (S/C) pressure (actual measurements)
Reactor pressure (actual measurements)
Co
nta
inm
ent
ves
sel
pre
ssu
re
Rea
cto
r p
ress
ure
Date/time
32
BAF Bottom of Active FuelBottom pellet level in fuel assembliesHeat is generated from decay heat in between BAF and TAF.
CAMS Containment Atmospheric Monitoring SystemContainment vessel atmosphere monitoring system. Device for measuring dose rates (Units: Sv/h) inside the containment vessel(D/W,S/C)
D/W Dry WellSpace inside the reactor containment vessel, excluding the suppression chamber
GOTHIC Generation of Thermal-Hydraulic Information for Containments
Computer software for analyzing thermal hydraulics inside the containment vessel. Can analyze target areas more specific than MAAP.
Lower Plenum
Part located below the core in reactor pressure vessels
MAAP Analysis Modular Accident Analysis ProgramAnalysis employing MAAP, a severe accident analysis code
MCCI Molten Core Concrete InteractionReaction whereby a molten core fallen into the PCV reacts with concrete, resulting in decomposition and erosion
PCV Primary Containment Vessel
Pedestal
Space located below reactor pressure vessels inside the PCV
Glossary
RPV Reactor Pressure Vessel
Rupture disk
Stoppage plate installed in vent lines that only rupture at certain
pressures. They prevent external discharges of gases from
inside the containment vessel in the event that the vent valve is
mistakenly opened.
S/C Suppression Chamber
SGTS Stand by Gas Treatment SystemRemoves radioactive substances using filters in the event of a discharge of radioactive substances inside the containment vessel or inside the R/B
SRV Safety Relief ValveValve that releases steam in order to prevent the reactor pressure vessel from being damaged by over-pressurization.
TAF Top of Active FuelTop pellet level in fuel assemblies
Vacuum break valve
This valve is installed to release pressure and make pressures
equal if the pressure inside the suppression chamber exceeds
that of the dry well.
Zirconium-water reaction
Heating reaction whereby high-temperature zirconium (used for
cladding, etc.) reacts with water vapor, generating hydrogen. At
temperatures above 1200 degrees core temperature increases
accelerate due to positive feedback.