Embed Size (px)
Citation preview

Report on Short-term Power Market in India: 2013-14
Economics Division Central Electricity Regulatory Commission
Report on Short-term Power Market in India, 2013-14 Page 2
The contents from the report can be freely copied/used with due
acknowledgement to CERC

Report on Short-term Power Market in India, 2013-14 Page 3
Preface
The power sector has grown significantly since the enactment of the Electricity Act
in 2003. However, it still faces the daunting challenge of providing adequate power to meet
the growing needs of the economy. The mandate of the Central Electricity Regulatory
Commission (CERC) is to promote competition, efficiency and economy in the power
markets and improve the quality of supply, which necessitates the development of a
healthy short-term power market. A short- term power market can help electricity
providers to meet unplanned and fluctuating power requirements, and on the sellers' side,
enable power producers as well as procurers to sell their surplus power. In India, the short-
term power market, which covers contracts of less than a year through bilateral agreements
and power exchanges are well developed, constituting approximately 11 % (about 104 BU)
of the total electricity market in 2013-14, though this includes power transactions through
unscheduled interchange (UI) as well. Access to information is one of the key elements to
ensure efficient markets and faith of the stakeholders in the system. CERC therefore
brings out monthly and annual short-term power market reports to keep market participants
as well as stakeholders aware and updated on the state of the power market. The annual
reports give a snapshot of the short-term power transactions through different mechanisms
by various market participants. These reports can be useful to a broader category of
audience interested in the power market in India. The annual power market report also
contains analysis of RECs transacted through power exchanges. In order to ensure ease of
access, the short-term and annual power market reports are available on the CERC website
www.cercind.gov.in. As in the past, we are confident that market participants and
stakeholders will find the Annual Report for 2013-14 useful.


Report on Short-term Power Market in India, 2013-14 Page 5
Contents
S.No Particulars Page No
Preface 3
Contents 5
List of Tables 7
List of Figures 9
Abbreviations 11
Executive Summary 15
Introduction 19
1 Yearly Trends in Short-term Transactions of Electricity (2008-09
To 2013-14)
20
1.1 Total Short-term Transactions of Electricity with Respect to Total
Electricity Generation
20
1.1.1 Electricity Transacted through Trading Licensees and Power
Exchanges
21
1.1.2 Electricity Transacted through UI 24
1.1.3 Electricity Transacted Directly Between DISCOMs 25
2 Monthly Trends in Short-term Transactions of Electricity (April
2013-March 2014)
27
2.1 Volume of Short-term Transactions of Electricity 28
2.2 Price of Short-term Transactions of Electricity 32
2.3 Volume of Electricity Transacted in Various Price Slabs 34
3 Daily Trends in Short-term Transactions of Electricity (1st April 13
to 31st March 14)
36
3.1 Volume of Short-term Transactions of Electricity 36
3.2 Price of Short-term Transactions of Electricity 36
3.2.1 Trends in Price of Electricity Transacted through Power Exchanges 36
3.2.2 Trends in Price of Electricity Transacted through UI 38
4 Time of the Day Variation in Volume and Price of Electricity
Transacted through Traders and Power Exchanges
39

Report on Short-term Power Market in India, 2013-14 Page 6
S.No Contents Page No
4.1 Time of the Day Variation in Volume and Price of Electricity
Transacted through Traders
39
4.2 Time of the Day Variation in Volume and Price of Electricity
Transacted through Power Exchanges
40
5 Trading Margin Charged by Trading Licensees for Bilateral
Transactions
42
6 Analysis of Open Access Consumers on Power Exchanges 44
6.1 Analysis of Various Types of Participants in Power Exchanges 44
6.2 Analysis of Open Access Consumers in Power Exchanges 44
7 Major Sellers and Buyers of Electricity in the Short term market 48
8 Effect of Congestion on Volume of Electricity Transacted through
Power Exchanges
52
9 Tariffs of Long-term Sources of Power for Various Distribution
Companies
54
9.1 Tariff of Central Government power generating companies 54
9.2 Levelised tariff of power projects under Case-I Bidding 58
9.3 Average Cost of Supply and Average Revenue of State Power Utilities 58
10 Analysis of transactions of Renewable Energy Certificates (RECs)
through Power Exchanges
59
Annexure-I: List of Trading Licensees as on 31.03.2014 62
Annexure-II: Historic Volatility Calculation 67
Annexure-III: Herfindahl-Hirschman Index (HHI) Calculation 68

Report on Short-term Power Market in India, 2013-14 Page 7
List of Tables
Table No. Details Page No.
Table-1 Total Volume of Short-term Transactions of Electricity with
Respect to Total Electricity Generation
21
Table-2 Volume of Electricity Transacted through Traders and Power
Exchanges
22
Table-3 Electricity Transacted through Traders and Power Exchanges as
Percentage of Total Volume of Short-Term
22
Table-4 Price of Electricity Transacted through Traders and Power
Exchanges
23
Table-5 Size of the Bilateral Trader and Power Exchange Market in
Monetary Terms
24
Table-6 Volume and Price of Electricity Transacted through UI 25
Table-7 Volume of Electricity Transacted Directly Between Discoms 26
Table-8 Volume of Short-term Transactions of Electricity (MUs) 28
Table-9 Volume of Short-term Transactions of Electricity as % of Total
Electricity Generation
29
Table-10 Percentage Share of Electricity Traded by Traders and HHI in
2013-14
30
Table-11 Price of Short-term Transactions of Electricity (`/kWh), 2013-14 32
Table-12 Weighted Average Trading Margin Charged by Trading Licensees
during 2004-05 to 2013-14
42
Table-13 Weighted Average Trading Margin Charged by Trading Licensees
during 2013-14
43
Table-14 Number of Open Access Consumers in Power Exchanges, 2013-14 46
Table-15 Participation by volume of Open Access Consumers in Day Ahead
Market of Power Exchanges, 2013-14
47
Table-16 Major Sellers of Electricity through Bilateral Trader Segment,
2013-14
48
Table-17 Major Buyers of Electricity through Bilateral Trader Segment,
2013-14
49
Table-18 Major Sellers of Electricity in the Day Ahead Market of IEX,
2013-14
49

Report on Short-term Power Market in India, 2013-14 Page 8
Table No. Details Page No.
Table-19 Major Buyers of Electricity in the Day Ahead Market of IEX,
2013-14
50
Table-20 Major Sellers of Electricity in the Day Ahead Market of PXIL,
2013-14
51
Table-21 Major Buyers of Electricity in the Day Ahead Market of PXIL,
2013-14
51
Table-22 Annual Details of Congestion in Power Exchanges 52
Table-23 Power Exchange wise details of Congestion, 2013-14 53
Table-24 Tariff of Central Thermal Power Stations, 2013-14 55
Table-25 Composite Tariff of Central Hydro Power Stations, 2013-14 57
Table-26 Capacity Contracted under Case-I Bidding Route during 2012-13. 58
Table-27 Average Cost of Supply and Average Revenue (without subsidy) of
State Power Utilities
58
Table-28 Annual details of Renewable Energy Certificates transacted through
Power Exchanges
60
Table-29 Volume and Price of Renewable Energy Certificates transacted
through Power Exchanges, 2013-14
60

Report on Short-term Power Market in India, 2013-14 Page 9
List of Figures
Figure No. Details Page No.
Figure-1 Total Volume of Electricity Transacted through Traders
and Power Exchanges
22
Figure-2 Electricity Transacted through Traders and Power
Exchanges as Percentage of Total Volume of Short-term
Transactions
23
Figure-3 Price of Electricity Transacted through Traders and Power
Exchanges
24
Figure-4 Volume and Price of Electricity Transacted through UI 25
Figure-5 Volume of Electricity Transacted Directly between
DISCOMs
26
Figure-6 Share of Different Segments in Total Electricity
Generation, 2013-14
27
Figure-7 Share of Different Segments in Short-term Transactions,
2013-14
27
Figure-8 Volume of Short-term Transactions of Electricity, 2013-14 29
Figure-9 Percentage Share of Electricity Transacted by Traders,
2013-14
31
Figure-10 Concentration of Market Power: Number of Traders and
HHI based on Volume of Electricity Transacted by the
Traders
31
Figure-11 Comparison of Price of Bilateral, Power Exchange and UI
Transactions in 2013-14
33
Figure-12 Price of Electricity Transacted through Traders during
Round the Clock, Peak and Off-peak Periods
34
Figure-13 Volume of Bilateral Transactions at different Price Slabs,
2013-14
35
Figure-14 Volume of Transactions in Power Exchanges at different
Price Slabs, 2013-14
35
Figure-15 Volume of Short-term Transactions of Electricity, 2013-14 36
Figure-16 Price and its Volatility in IEX during 2013-14 37
Figure-17 Price and its Volatility in PXIL during 2013-14 37

Report on Short-term Power Market in India, 2013-14 Page 10
Figure No. Details Page No.
Figure-18 Daily Price of Electricity Transacted through UI during
2013-14
38
Figure-19 Volume (Excluding Banking) and Price of Electricity
Transacted through Traders during RTC, Peak and Other
Than RTC & Peak, 2013-14
39
Figure-20 Block-wise Market Clearing Volume and Price in Power
Exchanges during 2013-14
40
Figure-21 Region-wise and Block-wise Price of Electricity
Transacted through IEX, 2013-14
41
Figure-22 Region-wise and Block-wise Price of Electricity
Transacted through PXIL, 2013-14
41
Figure-23 Trading Margin Charged by Trading Licensees, 2004-05 to
2013-14
43
Figure-24 Sell and Buy Volume of Various Types of Participants in
Power Exchanges, 2013-14
44
Figure-25 State-Wise Number of Open Access Consumers in IEX in
March 2014
45
Figure-26 State-Wise Number of Open Access Consumers in PXIL in
March 2014
45
Figure-27 Participation of Open Access Consumers in Power
Exchanges, 2013-14
46
Figure-28 Open Access Consumer Purchase Volume and Total
Volume in Power Exchanges, 2013-14
47

Report on Short-term Power Market in India, 2013-14 Page 11
Abbreviations
Abbreviation Expanded Version
ADHPL Allain Duhangan Hydro Power Limited ADHPL (GOHP) Allain Duhangan Hydro Power Limited (GOHP Share) APCPDCL Central Power Distribution Company of Andhra Pradesh Ltd APL Adani Power Limited APM Administered Price Mechanism APNRL Adhunik Power and Natural Resources Ltd
APPCC Andhra Pradesh Power Coordination Committee Block 15 Minutes Time Block BRPL BSES Rajdhani Power Limited BSEB Bihar State Electricity Board BU Billion Units (Billion kWh) BUDHIL Lanco Budhil Hydro Power Private Limited BYPL BSES Yamuna Power Limited CCGT Combined Cycle Gas Turbine CERC Central Electricity Regulatory Commission CGS Central Generating Stations CGSEB Chhattisgarh State Electricity Board CPP Captive Power Producer/Plant CSPDCL Chhattisgarh State Power Distribution Company Limited CSPTCL Chhatisgarh State Power Trading Company Limited DAM Day Ahead Market DISCOMs Distribution Companies DVC Damodar Valley Corporation ER Eastern Region FGUTPP Firoz Gandhi Unchahar Thermal Power Project GOHP/GoHP Government of Himachal Pradesh GPS Gas Power Station GRIDCO Grid Corporation of Orissa Limited GUVNL Gujarat Urja Vikas Nigam Limited HEP Hydro Electric Project HHI Herfindahl-Hirschman Index HPPC Haryana Power Purchase Centre HPSEB Himachal Pradesh State Electricity Board HSD High Speed Diesel IEX Indian Energy Exchange Limited ISGS Inter State Generating Station J&K Jammu & Kashmir JPL Jindal Power Limited JSL Jindal Steel Limited JSWEL JSW Energy Limited
Report on Short-term Power Market in India, 2013-14 Page 12
Abbreviation Expanded Version
JVVNL Jaipur Vidyut Vitaran Nigam Limited KSEB Kerala State Electricity Board kWh Kilo Watt Hour KWHEP/S Karcham Wangtoo Hydro Electric Power Station KWHEPS (GOHP)
Karcham Wangtoo Hydro Electric Power Station (GOHP Share)
LBHPPL LANCO Budhil Hydro Power Private Limited LNG Liquefied Natural Gas LOI Letter of Intent Ltd Limited MALANA2 Malana2 (Everest Power Private Limited) MCP Market Clearing Price MPPMCL M P Power Management Company Limited MU Million Units MW Mega Watts MWh Mega Watt Hour NCTP National Capital Thermal Power Plant (Dadri) NDMC New Delhi Municipal Corporation NEEPCO North Eastern Electric Power Corporation Limited NER North Eastern Region NEW Grid Northern, Eastern, Western and North-Eastern Region Grid NHDC National Hydro Development Corporation Limited NHPC National Hydro-Electric Power Corporation Limited NLC Neyveli Lignite Corporation Limited NLDC National Load Dispatch Centre NR Northern Region NTPC National Thermal Power Corporation Limited OA Open Access OAC Open Access Consumer OTP Other than RTC and Peak period PPA Power Purchase Agreement PSPCL Punjab State Power Corporation Limited PX/PXs Power Exchange/Power Exchanges PXIL Power Exchange India Limited RDPPC Rajasthan Discoms Power Procurement Centre REC Renewable Energy Certificates REL Reliance Energy Limited RLNG Re-gasified Liquefied Natural Gas ROR Run of River RTC Round The Clock S1 Southern Region 1 S2 Southern Region 2

Report on Short-term Power Market in India, 2013-14 Page 13
Abbreviation Expanded Version
SEB/SEBs State Electricity Board SEL Sterlite Energy Limited SJVNL Sutlej Jal Vidyut Nigam Limited SR Grid Southern Region Grid St Stage STPS Super Thermal Power Station TAM Term Ahead Market TANGEDCO Tamil Nadu Generation & Distribution Company THDC Tehri Hydro Development Corporation Limited TNEB Tamil Nadu Electricity Board TPCL Tata Power Company Limited TPDDL Tata Power Delhi Distribution Limited TPS Thermal Power Station UI Unscheduled Interchange UPCL Uttarakhand Power Corporation Limited UPPCL Uttar Pradesh Power Corporation Limited UT Union Territory W1 Western Region 1 W2 Western Region 2 W3 Western Region 3 WBSEDCL West Bengal State Electricity Distribution Company Ltd WR Western Region


Report on Short-term Power Market in India, 2013-14 Page 15
Executive Summary
An analysis of short-term transactions of electricity in India has been made in this
Report on Short-term Power Market1 for the year 2013-14. Here, “short-term transactions
of electricity” refers to contracts of less than one year period for electricity transacted
under bilateral transactions through Inter-State Trading Licensees (only inter-state part)
and directly by the Distribution Licensees (also referred as Distribution Companies or
DISCOMs), Power Exchanges (Indian Energy Exchange Ltd (IEX) and Power Exchange
India Ltd (PXIL)), and Unscheduled Interchange (UI). The analysis includes (i)
Yearly/monthly/daily trends in short-term transactions of electricity; (ii) Time of the day
variation in volume and price of electricity transacted through traders and power
exchanges; (iii) Trading margin charged by trading licensees for bilateral transactions (iv)
Analysis of open access consumers on power exchanges; (v) Major sellers and buyers of
electricity in the short term market; (vi) Effect of congestion on volume of electricity
transacted through power exchanges; (vii) Tariffs of long-term sources of power for
various distribution companies; and (viii) Analysis of transactions of Renewable Energy
Certificates (RECs) through power exchanges.
Salient features of the report that are discussed in detail in subsequent sections are
listed below.
1. Of the total electricity procured in India in 2013-14, the short-term power market
comprised 11 per cent. The balance 89 % of generation was procured mainly by
distribution companies through long-term contracts and short-term intra-state
transactions.
2. In terms of volume, the size of the short-term market in India was 104.64 BU (units) in
the year 2013-14. As compared to the volume of electricity transacted through short-
1 Although unscheduled interchange (UI) is not a market mechanism, electricity transacted
under UI is often considered a part of short-term transactions. Also, electricity transacted
bilaterally directly between the distribution companies (without involving trading licensees
or power exchanges) is also considered a part of short-term market. In the year 2013-14,
the volume of UI was about 21.47 BU and that of bilateral transactions between
distribution companies was about 17.38 BU.

Report on Short-term Power Market in India, 2013-14 Page 16
term market in the year 2012-13 (98.94 BU), this was about 6 % higher. Majority of
this growth in volume of 5.70 BU was accounted for by growth in transactions through
power exchanges (7.13 BU), followed by direct bilateral transactions between the
DISCOMs (2.86 BU). The bilateral transactions through the inter-state trading
licensees and the transactions through UI declined by 1.01 BU and 3.29 BU
respectively. A caveat, however, needs to be added; in case of traders only inter-state
transactions have been considered.
3. Excluding UI and direct bilateral sale between the DISCOMs, the volume of electricity
transacted was 65.78 BU in 2013-14. This was about 10 % higher than in 2012-13.
Volume of electricity transacted through power exchanges witnessed a sharp increase
of about 30% over 2012-13 volume. On the other hand, the volume of electricity
transacted through inter-state trading licensees witnessed decrease of -2.8%. In
monetary terms, the size of this segment of the short-term market was `23,952 crore in
the year 2013-142, which was 1% less than in the year 2012-13. Of this, `8,891 crore
was the value of electricity transacted through power exchanges (3% more than in
2012-13), and the balance of `15,061 crore was the value of inter-state transaction of
electricity through trading licensees (about 4% less than in 2012-13).
4. In absolute terms, the volume of UI in the year 2013-14 decreased by 13% over 2012-
13. The share of UI as a percentage of total volume of short-term transaction of
electricity continued the downward trend of past years and was about 21% in 2013-
14, down from 39%, 34%, 29% and 25% respectively in the years 2009-10, 2010-11,
2011-12 and 2012-13.
5. The share of direct bilateral transactions between DISCOMs as a percentage of total
short term transaction volume remains the same at about 15% in the year 2013-14
when compared with the previous year 2012-13. In terms of volume, these direct
bilateral transactions between DISCOMs witnessed an increase of about 20% in 2013-
14 as compared to 2012-13.
2 Excluding transactions pertaining to banking transactions.
Report on Short-term Power Market in India, 2013-14 Page 17
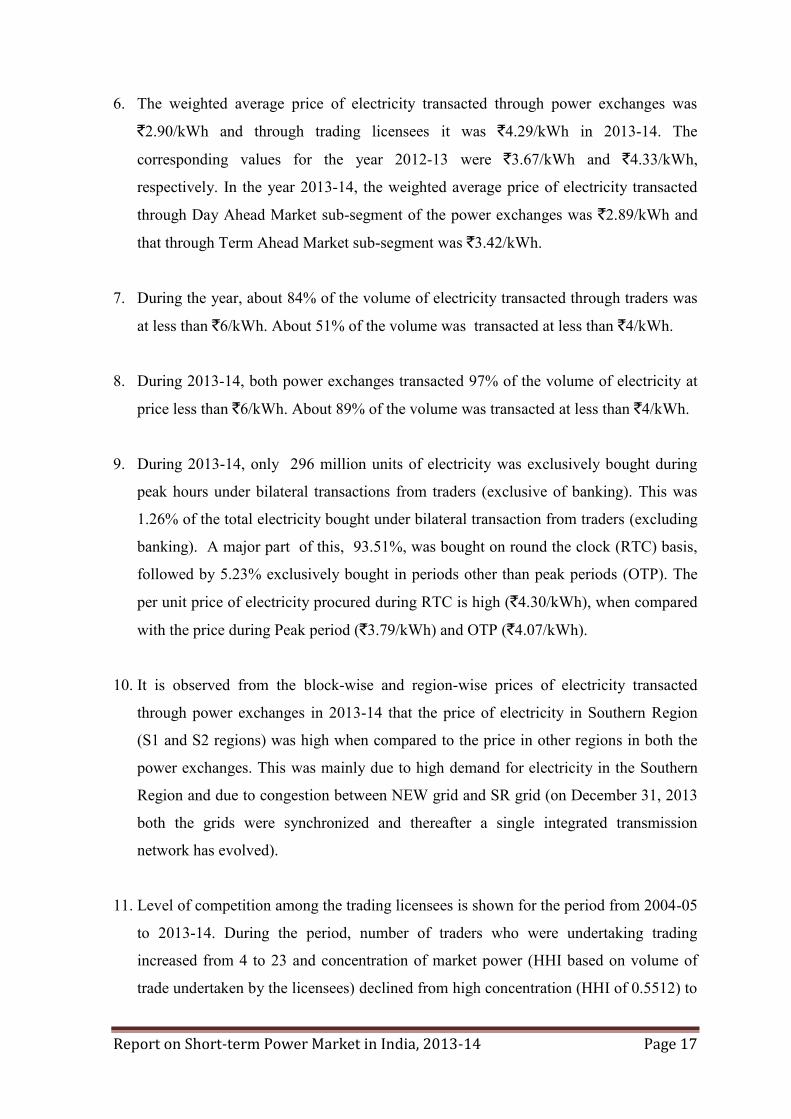
6. The weighted average price of electricity transacted through power exchanges was
`2.90/kWh and through trading licensees it was `4.29/kWh in 2013-14. The
corresponding values for the year 2012-13 were `3.67/kWh and `4.33/kWh,
respectively. In the year 2013-14, the weighted average price of electricity transacted
through Day Ahead Market sub-segment of the power exchanges was `2.89/kWh and
that through Term Ahead Market sub-segment was `3.42/kWh.
7. During the year, about 84% of the volume of electricity transacted through traders was
at less than `6/kWh. About 51% of the volume was transacted at less than `4/kWh.
8. During 2013-14, both power exchanges transacted 97% of the volume of electricity at
price less than `6/kWh. About 89% of the volume was transacted at less than `4/kWh.
9. During 2013-14, only 296 million units of electricity was exclusively bought during
peak hours under bilateral transactions from traders (exclusive of banking). This was
1.26% of the total electricity bought under bilateral transaction from traders (excluding
banking). A major part of this, 93.51%, was bought on round the clock (RTC) basis,
followed by 5.23% exclusively bought in periods other than peak periods (OTP). The
per unit price of electricity procured during RTC is high (`4.30/kWh), when compared
with the price during Peak period (`3.79/kWh) and OTP (`4.07/kWh).
10. It is observed from the block-wise and region-wise prices of electricity transacted
through power exchanges in 2013-14 that the price of electricity in Southern Region
(S1 and S2 regions) was high when compared to the price in other regions in both the
power exchanges. This was mainly due to high demand for electricity in the Southern
Region and due to congestion between NEW grid and SR grid (on December 31, 2013
both the grids were synchronized and thereafter a single integrated transmission
network has evolved).
11. Level of competition among the trading licensees is shown for the period from 2004-05
to 2013-14. During the period, number of traders who were undertaking trading
increased from 4 to 23 and concentration of market power (HHI based on volume of
trade undertaken by the licensees) declined from high concentration (HHI of 0.5512) to

Report on Short-term Power Market in India, 2013-14 Page 18
no concentration (HHI of 0.1475). The competition among the trading licensees
resulted in increase in volume and decrease in prices in the short-term bilateral market.
12. The weighted average trading margin charged by the trading licensees in 2013-14 was
4 paise/kWh or less, which is in line with the CERC Trading Margin Regulations,
2010.
13. The procurement of power by the industrial consumers through power exchanges
began in the year 2009. In both power exchanges, Open Access industrial consumers
bought 18.07 BU of electricity, which formed 60.20% of the total day ahead volume
transacted in the power exchanges during 2013-14.
14. The weighted average price of electricity bought by open access consumers at IEX was
lower (`2.88/kWh) compared to the weighted average price of total electricity
transacted through IEX (`2.90/kWh). The weighted average price of electricity bought
by open access consumers at PXIL was lower (`2.59/kWh) compared to the weighted
average price of total electricity transacted through PXIL (`2.60/kWh).
15. The year also witnessed constraints on the volume of electricity that could be
transacted through power exchanges, mainly due to transmission congestion. During
2013-14, the actual transacted volume was about 16 % less than unconstrained volume.
Because of congestion and the splitting of day ahead market at both the power
exchanges, the congestion amount collected during the year was `392.33 crore.
16. In 2013-14, the number of Solar RECs transacted on IEX and PXIL were 53,056 and
13,624 respectively and the market clearing prices of these RECs were `9725/MWh
and `9666/MWh on IEX and PXIL respectively. During the year, market clearing
volume of Non-Solar RECs transacted on IEX and PXIL were 12,71,267 and 14,10,747
respectively and the market clearing price of these RECs was `1500/MWh on both IEX
and PXIL.

Report on Short-term Power Market in India, 2013-14 Page 19
Introduction
A brief analysis of the short-term transactions of electricity in India has been done
in this Report on Short-term Power Market3 for the year 2013-14. Here, “short-term
transactions of electricity” refers to the contracts less than one year for the following
trades:
(a) Electricity traded under bilateral transactions through Inter-State Trading
Licensees (only inter-state trades),
(b) Electricity traded directly by the Distribution Licensees (also referred as
Distribution Companies or DISCOMs),
(c) Electricity traded through Power Exchanges (Indian Energy Exchange Ltd
(IEX) and Power Exchange India Ltd (PXIL)), and
(d) Unscheduled Interchange (UI).
The analysis includes:
(i) Yearly/monthly/daily trends in short-term transactions of electricity;
(ii) Time of the day variation in volume and price of electricity transacted
through traders and power exchanges;
(iii) Trading margin charged by trading licensees for bilateral transactions;
(iv) Analysis of open access consumers on power exchanges;
(v) Major sellers and buyers of electricity in the short term market;
(vi) Effect of congestion on volume of electricity transacted through power
exchanges;
(vii) Tariffs of long-term sources of power for various distribution companies;
and
(viii) Analysis of transactions of Renewable Energy Certificates (RECs) through
power exchanges.
3 Although unscheduled interchange (UI) is not a market mechanism, electricity transacted
under UI is often considered a part of short-term transaction. Also, electricity transacted
bilaterally directly between the distribution companies (without involving trading licensees
or power exchanges) is also considered a part of short-term market. In the year 2013-14,
the volume of UI was about 21.47 BU and that between distribution companies was about
17.38 BU.

Report on Short-term Power Market in India, 2013-14 Page 20
1. Yearly Trends in Short-term Transactions of Electricity
(2008-09 to 2013-14)
The analysis on yearly trends in short-term transactions includes the electricity
transacted through the following segments:
trading licensees (inter-state part only) under bilateral transactions or “bilateral
trader” segment ,
power exchange segment with transactions in both Day Ahead and Term
Ahead Markets,
UI segment, and
direct transactions of electricity between DISCOMs.
Inter-state trading licensees (traders) have been undertaking trading in electricity
since 2004 and the power exchanges started operating since 2008. The two power
exchanges, IEX and PXIL started their operations in June 2008 and October 2008
respectively. As of March 2014, there were 42 inter-state trading licensees (list is enclosed
at Annexure-I) and two power exchanges.
1.1. Total Short-term Transactions of Electricity with respect to Total
Electricity Generation
Total volume of short-term transactions of electricity increased from 65.90 BU in
2009-10 to 104.64 BU in 2013-14. The annual growth in volume was 24% from 2009-10
to 2010-11, 16% from 2010-11 to 2011-12, 5% from 2011-12 to 2012-13 and 6% from
2012-13 to 2013-14. Total volume of short-term transactions of electricity as percentage of
total electricity generation has increased from 9% in 2009-10 to 11% in 2013-14 (Table-1).

Report on Short-term Power Market in India, 2013-14 Page 21
Table-1: Total Volume of Short-term Transactions of Electricity with respect to
Total Electricity Generation
Year Total Volume of Short-term
Transactions of Electricity (BU)
Total Electricity Generation (BU)
Total volume of Short-term Transactions of Electricity as
% of Total Electricity Generation
2009-10 65.90 764.03 9% 2010-11 81.56 809.45 10% 2011-12 94.51 874.17 11% 2012-13 98.94 907.49 11% 2013-14 104.64 962.90 11%
Source: NLDC
The analysis of yearly trends of short-term transactions of electricity for various
segments, i.e. electricity transacted through traders and power exchanges, UI, and directly
between DISCOMs is included in the sections that follow.
1.1.1 Electricity Transacted through Traders and Power Exchanges
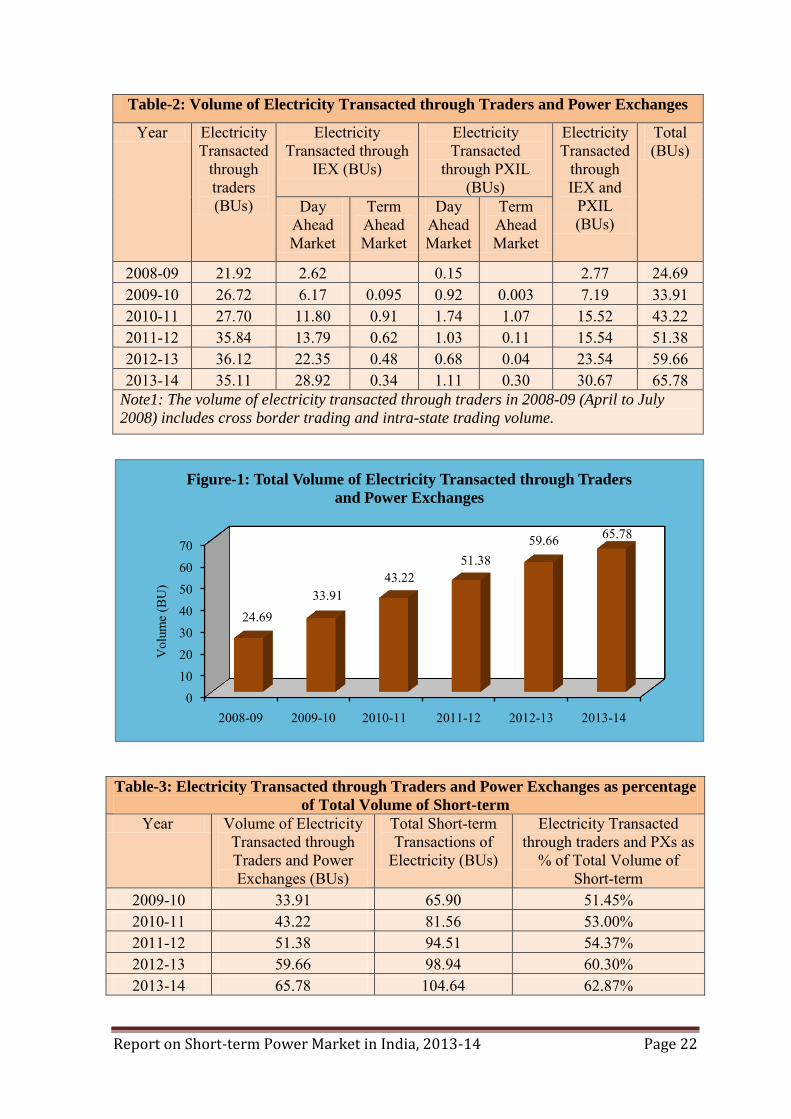
Table-2, Table-3, Figure-1 & Figure-2 show details of volume of electricity
transacted through traders under bilateral transactions and through power exchanges for the
period from 2008-09 to 2013-14. The volume of electricity transacted through traders and
power exchanges increased from 24.69 BU in 2008-09 to 65.78 BU in 2013-14. The share
of electricity transacted through traders and power exchanges (in volume terms) as a
percentage of total short-term transactions of electricity has increased from 51.45% in
2009-10 to 62.87% in 2013-14. The growth in volume for this segment during the year
2013-14 as compared to 2012-13 was 6.12 BU (10%). The increase in power exchange
segment volume was 7.13 BU (30%) whereas bilateral trader segment volume declined by
1.01 BU (-2.79%).
Report on Short-term Power Market in India, 2013-14 Page 22
Table-2: Volume of Electricity Transacted through Traders and Power Exchanges
Year Electricity Transacted
through traders (BUs)
Electricity Transacted through
IEX (BUs)
Electricity Transacted
through PXIL (BUs)
Electricity Transacted
through IEX and
PXIL (BUs)
Total (BUs)
Day Ahead Market
Term Ahead Market
Day Ahead Market
Term Ahead Market
2008-09 21.92 2.62 0.15 2.77 24.69 2009-10 26.72 6.17 0.095 0.92 0.003 7.19 33.91 2010-11 27.70 11.80 0.91 1.74 1.07 15.52 43.22 2011-12 35.84 13.79 0.62 1.03 0.11 15.54 51.38 2012-13 36.12 22.35 0.48 0.68 0.04 23.54 59.66 2013-14 35.11 28.92 0.34 1.11 0.30 30.67 65.78
Note1: The volume of electricity transacted through traders in 2008-09 (April to July
2008) includes cross border trading and intra-state trading volume.
Table-3: Electricity Transacted through Traders and Power Exchanges as percentage
of Total Volume of Short-term
Year Volume of Electricity Transacted through Traders and Power Exchanges (BUs)
Total Short-term Transactions of
Electricity (BUs)
Electricity Transacted through traders and PXs as
% of Total Volume of Short-term
2009-10 33.91 65.90 51.45% 2010-11 43.22 81.56 53.00% 2011-12 51.38 94.51 54.37% 2012-13 59.66 98.94 60.30% 2013-14 65.78 104.64 62.87%
0
10
2030
40
5060
70
2008-09 2009-10 2010-11 2011-12 2012-13 2013-14
24.6933.91
43.2251.38
59.66 65.78
Vol
ume
(BU
)
Figure-1: Total Volume of Electricity Transacted through Traders
and Power Exchanges

Report on Short-term Power Market in India, 2013-14 Page 23
The price of electricity transacted through traders and Power Exchanges is shown
in Table-4 and Figure-3. The weighted average price of electricity transacted through
traders and power exchanges declined from `7.29/kWh and `7.49/kWh respectively in
2008-09 to `4.29/kWh and `2.90/kWh respectively in 2013-14.
The decreasing trend in weighted average prices affected the market size of this
segment in monetary terms (Table-5). In volume terms (BU terms) the size of this segment
increased by about 10 % in the year 2013-14 compared to 2012-13, whereas in monetary
terms the growth has declined by about 1%. The power exchange sub-segment registered a
high growth of about 30% in volume terms and a low growth of about 3% in monetary
terms. The bilateral trader segment registered a negative growth in both volume terms (-
3%) and monetary terms (-4%).
Table-4: Price of Electricity Transacted through Traders & Power Exchanges
Year Price of Electricity transacted through Traders (`/kWh)
Price of Electricity transacted through Power Exchanges
(DAM+TAM) (`/kWh)
2008-09 7.29 7.49 2009-10 5.26 4.96 2010-11 4.79 3.47 2011-12 4.18 3.57 2012-13 4.33 3.67 2013-14 4.29 2.90
40%
45%
50%
55%
60%
65%
2009-10 2010-11 2011-12 2012-13 2013-14
51.45%53.00% 54.37%
60.30%62.87%
Figure-2: Electricity Transacted through Traders and Power
exchanges as Percentage of Total Volume of Short-term
Transactions

Report on Short-term Power Market in India, 2013-14 Page 24
Table-5: Size of the Bilateral Trader and Power Exchange Market in Monetary Terms
Year Electricity Transacted
through traders (BU)
Price of Electricity Transacted
through traders
(`/kWh)
Size of bilateral trader
Market (` Crore)
Electricity Transacted
through Power
Exchanges (BU)
Price of Electricity Transacted
through Power
Exchanges (`/kWh)
Size of Power
Exchange Market
(` Crore)
Total Size of the
bilateral trader + Power
Exchange Market
(` Crore) 2009-10 26.72 5.26 14055 7.19 4.96 3563 17617 2010-11 27.7 4.79 13268 15.52 3.47 5389 18657 2011-12 35.84 4.18 14979 15.54 3.57 5553 20532 2012-13 36.12 4.33 15624 23.54 3.67 8648 24272 2013-14 35.11 4.29 15061 30.67 2.90 8891 23952
1.1.2 Electricity Transacted through UI
The volume and price of electricity transacted through UI is shown in Table-6 and
Figure-4. The volume and price of electricity transacted through UI in 2008-09 represents
the period from August 2008 to March 2009. It can be observed from Table-6 that the
volume of electricity transacted through UI declined from 25.81 BU in 2009-10 to 21.47
BU in 2013-14, and the volume of UI as percentage of total short-term volume declined to
21% in 2013-14 from 39% in 2009-10. It can also be observed from the table that the
average price of UI (NEW Grid and SR Grid) declined from `4.62/kWh in 2009-10 to
`2.05/kWh in 2013-14.
7.29
5.264.79 4.18 4.33 4.29
7.49
4.963.47 3.57 3.67
2.90
0
2
4
6
8
10
2008-09 2009-10 2010-11 2011-12 2012-13 2013-14
Pric
e (`
/kW
h)
Figure-3: Price of Electricity Transacted through Traders & Power
Exchanges
Price of Electricity Transacted through Traders
Price of Electricity Transacted through Power Exchanges

Report on Short-term Power Market in India, 2013-14 Page 25
Table-6: Volume and Price of Electricity transacted through UI
Year Volume of UI (BU)
Total Volume of Short term (BU)
Volume of UI as % of total volume of
Short term
Price of UI (`/kWh)
2008-09 14.39 35.27 41% 6.70 2009-10 25.81 65.90 39% 4.62 2010-11 28.08 81.56 34% 3.91 2011-12 27.76 94.51 29% 4.09 2012-13 24.76 98.94 25% 3.86 2013-14 21.47 104.64 21% 2.05
Note: The data for the year 2008-09, represents the period from August 2008 to March
2009.
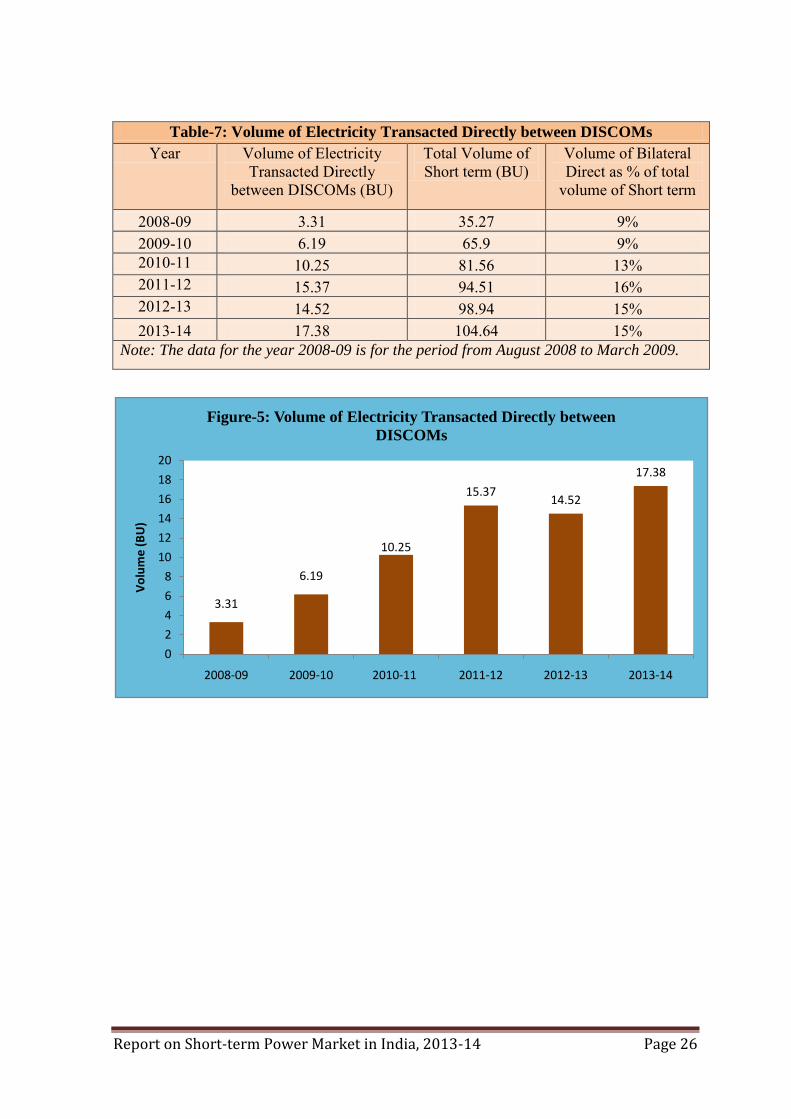
1.1.3 Electricity Transacted Directly Between DISCOMs
The volume of electricity transacted directly between DISCOMs is shown in Table-
7 and Figure-5. It can be observed from the table that the volume of electricity transacted
directly between DISCOMs increased from 6.19 BU in 2009-10 to 17.38 BU in 2013-14. It
can also be observed that, the share of electricity transacted directly between DISCOMs as
percentage to total volume of short-term transaction of electricity also increased from 9%
to 15% in the same period. However, compared to 2012-13, the volume of electricity
transacted directly between DISCOMs increased, whereas the share of electricity
transacted directly between DISCOMs as percentage of total volume of short-term
transaction of electricity remained the same in 2013-14.
14.39
25.81 28.08 27.76 24.7621.47
6.70
4.623.91 4.09 3.86
2.05
012345678910
05
10152025303540
2008-09 2009-10 2010-11 2011-12 2012-13 2013-14
Pric
e ( `
/kW
h)
Vol
ume
(BU
)
Figure-4: Volume and Price of Electricity transacted through UI
Volume of UI Price of UI
Report on Short-term Power Market in India, 2013-14 Page 26
Table-7: Volume of Electricity Transacted Directly between DISCOMs
Year Volume of Electricity Transacted Directly
between DISCOMs (BU)
Total Volume of Short term (BU)
Volume of Bilateral Direct as % of total
volume of Short term
2008-09 3.31 35.27 9% 2009-10 6.19 65.9 9% 2010-11 10.25 81.56 13% 2011-12 15.37 94.51 16% 2012-13 14.52 98.94 15% 2013-14 17.38 104.64 15%
Note: The data for the year 2008-09 is for the period from August 2008 to March 2009.
3.31
6.19
10.25
15.3714.52
17.38
0
2
4
6
8
10
12
14
16
18
20
2008-09 2009-10 2010-11 2011-12 2012-13 2013-14
Vo
lum
e (
BU
)
Figure-5: Volume of Electricity Transacted Directly between
DISCOMs

Report on Short-term Power Market in India, 2013-14 Page 27
2. Monthly Trends in Short-term Transactions of Electricity
(April 2013-March 2014)
During 2013-14, the share of the total short-term transactions in volume terms,
including UI as a percentage of total electricity generation in the country was about 11 %
(Figure-6 and Table-8).
The share of different segments within the total short-term transaction for the year
2013-14 has been shown in the Figure-7 below.
4% 2%3%
2%
89%
Figure-6: Share of Different Segments in Total Electricity
Generation, 2013-14
Bilateral Transactions through traders Bilateral Transactions between DISCOMS
Power Exchange Transactions UI Transactions
Long Term Transactions
33.6%
16.6%29.3%
20.5%
Figure-7: Share of Different Segments in Short Term
Transactions, 2013-14
Bilateral through Traders Bilateral between DISCOMS
Power Exchange Transactions UI Transactions

Report on Short-term Power Market in India, 2013-14 Page 28
2.1. Volume of Short-term Transactions of Electricity
The volume of short-term transactions of electricity during different months of 2013-
14 with break-up for different segments is shown in Table-8 and Figure-8.
Table-8: Volume of Short-term Transactions of Electricity (MUs), 2013-14
Period Bilateral through Traders
Bilateral between
DISCOMS
Total Bilateral transac-
tions
Power Exchange
transactions (DAM+TAM)
UI transac-tions
Total Short-term
transac-tions
Total Electricity Generatio
n
Apr-13 2669 752 3422 2604 1580 7606 77557 May-13 2945 1271 4216 2578 1806 8599 83943 Jun-13 3258 1459 4717 2184 1944 8845 76108 Jul-13 4079 2053 6132 2388 2030 10550 80522
Aug-13 2870 1867 4737 2436 1935 9107 79481 Sep-13 2319 1468 3787 3242 1669 8698 82614 Oct-13 2514 1671 4185 2778 1739 8702 79431 Nov-13 2001 2228 4229 2719 1613 8561 77305 Dec-13 2624 1717 4341 2576 1789 8707 82235 Jan-14 3100 1374 4473 2488 2506 9468 83123 Feb-14 3116 876 3992 2300 1398 7690 75945 Mar-14 3616 646 4263 2379 1461 8102 84637 Total 35112 17381 52494 30671 21471 104635 962902
% share in total genera-
tion 4% 2% 5% 3% 2% 11% 100%
% share in
Short-term
Volume
33.6% 16.6% 50.2% 29.3% 20.5% 100%
It is observed from Figure-8 that there is a cyclical trend in the total volume of
short-term transactions of electricity. It is also observed from the figure that the volume
of all segments of the short-term transactions of electricity does not reflect any trend of
increase or decrease.

Report on Short-term Power Market in India, 2013-14 Page 29
The volume of short-term transactions of electricity as percentage of total
electricity generation varied between 9.57% and 13.10% during the period (Table-9).
Table-9: Volume of Short-term transactions of electricity as % of total electricity
generation
Period Short-term transactions as % of total electricity generation
Apr-13 9.81% May-13 10.24% Jun-13 11.62% Jul-13 13.10%
Aug-13 11.46% Sep-13 10.53% Oct-13 10.96% Nov-13 11.07% Dec-13 10.59% Jan-14 11.39% Feb-14 10.13% Mar-14 9.57%
There were 42 inter-state trading licensees as on 31.3.2014. However, of these,
only 23 trading licensees actively traded during the year 2013-14 (Table-10).
0
2000
4000
6000
8000
10000
12000V
olu
me
(MU
)
Figure-8: Volume of Short-term Transactions of Electricity,
2013-14
Bilateral Transactions (Traders+Discoms) Power Exchange transactions (DAM+TAM)
UI transactions Total Short-term transac-tions

Report on Short-term Power Market in India, 2013-14 Page 30
The volume of electricity transacted through traders (traders inter-state bilateral
transactions + traders transactions through Power Exchanges) has been analysed using the
Herfindahl-Hirschman Index (HHI) for measuring the competition among the traders
(Table-10). Increase in the HHI generally indicates a decrease in competition and an
increase of market power, whereas decrease indicates the opposite. A HHI value below
0.15 indicates no concentration of market power, the value between 0.15 to 0.25 indicates
moderate concentration, the value above 0.25 indicates high concentration of market
power. The HHI, based on the volume of electricity transacted through traders during
2013-14 was 0.1449, which indicated non-concentration of market power among the
traders.
Table-10: Percentage Share of Electricity Transacted by Traders and HHI, 2013-14
Sr No
Name of the Trading Licensee Share of Electricity transacted by traders
in 2013-14
Herfindahl Hirschman
Index (HHI) 1 PTC India Ltd. 31.68% 0.1004 2 JSW Power Trading Company Ltd 12.40% 0.0154 3 Tata Power Trading Company (P) Ltd. 11.04% 0.0122 4 Reliance Energy Trading (P) Ltd 7.12% 0.0051 5 NTPC Vidyut Vyapar Nigam Ltd. 6.13% 0.0038 6 Adani Enterprises Ltd. 5.02% 0.0025 7 Mittal Processors (P) Ltd. 4.87% 0.0024 8 Shree Cement Ltd. 4.66% 0.0022 9 GMR Energy Trading Ltd. 3.33% 0.0011
10 Knowledge Infrastructure Systems (P) Ltd 2.83% 0.0008 11 Jaiprakash Associates Ltd. 2.80% 0.0008 12 Manikaran Power Ltd. 1.59% 0.0003 13 National Energy Trading & Services Ltd. 1.50% 0.0002 14 Instinct Infra & Power Ltd. 1.21% 0.0001 15 Pune Power Development Pvt. Ltd. 1.20% 0.0001 16 RPG Power Trading Company Ltd. 1.09% 0.0001 17 Essar Electric Power Development Corp. Ltd. 0.88% 0.0001 18 Arunachal Pradesh Power Corporation Pvt. Ltd. 0.37% 0.0000 19 Indrajit Power Technology (P) Ltd. 0.13% 0.0000 20 Customized Energy Solutions India (P) Ltd. 0.10% 0.0000 21 Ambitious Power Trading Company Ltd. 0.04% 0.0000 22 HMM Infra Ltd. 0.03% 0.0000 23 My Home Power Private Ltd. 0.00% 0.0000
Total Volume 100.00% 0.1475
Share of the Top 5 Trading 68.37% Note: Percentage share in total volume traded by Licensees in 2013-14 computed based on the
volume which includes the volume traded by inter-state trading licensees through bilateral and
power exchanges. Source: Information submitted by Trading Licensees.

Report on Short-term Power Market in India, 2013-14 Page 31
The percentage share of electricity transacted by major traders in the total volume
of electricity transacted by all the traders is shown in Figure-9.
Level of competition among the traders (HHI based on volume of trade undertaken
by the traders) is shown in Figure-10 for the period 2004-05 to 2013-14. Number of
traders, who were undertaking trading bilaterally or through power exchanges, increased
from 4 in 2004-05 to 23 in 2013-14. It can be observed from the figure that there is an
inverse relationship between number of traders and the HHI. The concentration of market
power declined from high concentration (HHI of 0.55) in 2004-05 to non-concentration
(HHI of 0.1475) in 2013-14. The competition among the traders resulted in increase in
volume and decrease in prices in the short-term bilateral market (Table-5).
32%
12%
11%7%
6%
32%
Figure-9: Percentage Share of Electricity Traded by Trading
Licensees in 2013-14
PTC India Ltd. JSW Power Trading Company LtdTata Power Trading Company (P) Ltd. Reliance Energy Trading (P) LtdNTPC Vidyut Vyapar Nigam Ltd. Others
47
912
15 14
1917
22 230.55
0.41
0.25 0.26
0.160.24
0.19 0.170.14 0.15
0.00
0.10
0.20
0.30
0.40
0.50
0.60
0369
121518212427
2004
-05
2005
-06
2006
-07
2007
-08
2008
-09
2009
-10
2010
-11
2011
-12
2012
-13
2013
-14
No
. o
f T
rad
ers
HH
I
Figure-10: Concentration of Market Power: Number of traders and HHI
based on volume of electricity transacted by the traders
Number of Traders undertaking trading Herfindahl Hirschman Index (HHI)

Report on Short-term Power Market in India, 2013-14 Page 32
2.2. Price of Short-term Transactions of Electricity
The monthly trends in price of short-term transactions of electricity are shown in
Table-11 and Figure-11 & 12. The price analysis is mainly based on the average price of
UI and the weighted average price of other short-term transactions of electricity. The price
of bilateral trader transactions represents the price of electricity transacted through traders.
The trends in price of electricity transacted through traders (bilateral trader transactions)
were studied separately for total transactions as well as for the transactions undertaken
Round the Clock (RTC), during Peak, and during Off-peak periods.
Table-11: Price of Short-term Transactions of Electricity (`/kWh)
Period Bilateral through Traders Power Exchange UI RTC Peak Off-
peak Total IEX PXIL NEW
Grid SR
Grid Apr-13 4.60 4.63 4.12 4.55 3.74 2.71 2.27 4.29 May-13 4.53 6.02 4.62 4.54 3.26 2.44 1.73 3.45 Jun-13 4.37 3.98 4.06 4.36 2.52 2.15 1.64 2.67 Jul-13 4.27 4.92 4.14 4.27 2.54 2.11 1.43 2.26
Aug-13 4.16 4.98 3.57 4.15 2.07 1.89 1.30 1.98 Sep-13 4.45 4.67 3.24 4.41 2.98 2.82 1.62 1.69 Oct-13 4.14 4.02 4.21 4.15 2.65 2.41 1.76 2.60 Nov-13 3.48 4.54 3.84 3.53 2.69 2.59 2.04 2.02 Dec-13 4.35 4.22 3.76 4.31 3.16 3.05 2.09 1.81 Jan-14 4.15 3.68 3.54 4.12 3.05 3.02 1.87 2.22 Feb-14 4.50 3.61 3.53 4.43 3.17 2.94 1.55 1.59 Mar-14 4.47 3.62 3.51 4.41 2.86 2.76 1.69 1.69

Report on Short-term Power Market in India, 2013-14 Page 33
It can be observed from the above figure that the price of electricity transacted
through traders was relatively high when compared with the price of electricity transacted
through power exchanges and UI during all the months in 2013-14.4
The trends in price of electricity transacted by traders during RTC, Peak and Off-
peak periods are shown in Table-11 & Figure-12. It can be observed from the figure that
the price of electricity during peak period is higher in most of the months from April to
November 2013 when compared with the price during RTC and off peak periods. The
price of electricity during RTC is high from December 2013 to March 2014 when
compared with the price during peak and off peak periods.
4 The comparison between the price of power exchanges and the price of bilateral transactions should also be seen in the light that the delivery point for transactions of power exchanges is the periphery of regional transmission system in which the grid connected entity is located whereas the delivery point for bilateral transactions may vary from transaction to transaction. The delivery point may be state or regional periphery or any other point as per the contract executed.
1.01.52.02.53.03.54.04.55.0
Pric
e (`
/kW
h)
Figure-11: Comparison of price of Bilateral, Power Exchange and
UI transactions in 2013-14
Price of Bilateral Transactions through tradersPrice of Power Exchange Transactions (TAM+DAM)Average Price of UI Transactions (NEW Grid+SR Grid)

Report on Short-term Power Market in India, 2013-14 Page 34
2.3 Volume of Electricity Transacted in Various Price Slabs
Volume of electricity transacted in various price slabs is shown for bilateral trader
segment and power exchange segment separately. In the case of power exchanges, it is the
Day Ahead Market sub-segment that has been considered.
Volume of bilateral transactions at different price slabs in 2013-14 is depicted in
Figure -13. The figure shows that 51% of the volume of electricity was transacted through
traders at less than `4/kWh and 84% of the volume was transacted through traders at less
than `6/kWh.
2.53.03.54.04.55.05.56.06.5
Pri
ce `
/(k
Wh
)
Figure-12: Price of Electricity Transacted through Traders during
Round the Clock, Peak and Off Peak periods
RTC Peak Off-peak

Report on Short-term Power Market in India, 2013-14 Page 35
Volume of transactions in power exchanges at different price slabs in 2013-14 is
depicted in Figure -14. The figure shows that 89% of the volume of electricity was
transacted through power exchanges at less than `4/kWh and 97% of the volume was
transacted through power exchanges at less than `6/kWh.
0-2 2-3 3-4 4-5 5-6 6-7 7-8 8-9
Cumulative Volume (%) 0% 4% 51% 72% 84% 100% 100% 100%Volume in Price Range (%) 0% 4% 47% 20% 12% 16% 0% 0%
0%5%10%15%20%25%30%35%40%45%50%
0%
20%
40%
60%
80%
100%
120%
Vol
ume
in P
rice
Ran
ge (%
)
Cum
ulat
ive V
olum
e (%
)
Figure-13: Volume of Bilateral Transactions at different Price
Slabs, 2013-14
0-2 2-4 4-6 6-8 8-10 10-12 12-14 14-16 16-18 18-20
Cumulative Volume (%) 25% 89% 97% 99% 100% 100% 100% 100% 100% 100%Volume in Price Range (%) 25% 63% 8% 2% 0% 0% 0% 0% 0% 0%
0%
10%
20%
30%
40%
50%
60%
70%
0%
20%
40%
60%
80%
100%
120%
Vol
ume
in P
rice
Ran
ge (%
)
Cum
ulat
ive V
olum
e (%
)
Figure-14: Volume of Transactions in Power Exchanges at
different Price Slabs, 2013-14

Report on Short-term Power Market in India, 2013-14 Page 36
3. Daily Trends in Short-term Transactions of Electricity (1st
April 2013 to 31st March 2014)
3.1 Volume of Short-term Transactions of Electricity
Trends in daily volume of short-term transactions are shown in Figure-15. It can be
observed from the figure that there was an increasing trend in the volume of electricity
transacted through bilateral transactions from April to July 2013 and then a declining trend
from July to September 2013. It can also be observed that there is low volatility in the
volume of electricity transacted through power exchanges and through UI during the year.
3.2 Price of Short-term Transactions of Electricity
Trends in daily price of short-term transactions have been illustrated in this section
for power exchanges and UI.
3.2.1 Trends in Price of Electricity Transacted through Power Exchanges
The weighted average price of electricity transacted through IEX and its volatility
is shown in Figure-16. Volatility in the Price of electricity transacted through IEX has been
0
50
100
150
200
250
1-A
pr-1
3
15-A
pr-1
3
29-A
pr-1
3
13-M
ay-1
3
27-M
ay-1
3
10-J
un-1
3
24-J
un-1
3
8-Ju
l-13
22-J
ul-1
3
5-A
ug-1
3
19-A
ug-1
3
2-Se
p-13
16-S
ep-1
3
30-S
ep-1
3
14-O
ct-1
3
28-O
ct-1
3
11-N
ov-1
3
25-N
ov-1
3
9-D
ec-1
3
23-D
ec-1
3
6-Ja
n-14
20-J
an-1
4
3-Fe
b-14
17-F
eb-1
4
3-M
ar-1
4
17-M
ar-1
4
31-M
ar-1
4
Vol
ume
(MU
)
Figure-15: Volume of Short-term Transactions of Electricity,
2013-14
Bilateral Transactions (Traders+Direct) PX Transactions (IEX+PXIL) UI Transactions

Report on Short-term Power Market in India, 2013-14 Page 37
computed using daily data for 2013-14 and it works out to 7.16%. (See Annexure-II for
historic volatility formula).
The weighted average price of electricity transacted through PXIL and its volatility
is shown in Figure-17. Volatility in the Price of electricity transacted through PXIL has
been computed using daily data for 2013-14 and it works out to 10.46%.
-30%
-20%
-10%
0%
10%
20%
30%
40%
0123456789
1011121314
01/0
4/13
15/0
4/13
29/0
4/13
13/0
5/13
27/0
5/13
10/0
6/13
24/0
6/13
08/0
7/13
22/0
7/13
05/0
8/13
19/0
8/13
02/0
9/13
16/0
9/13
30/0
9/13
14/1
0/13
28/1
0/13
11/1
1/13
25/1
1/13
09/1
2/13
23/1
2/13
06/0
1/14
20/0
1/14
03/0
2/14
17/0
2/14
03/0
3/14
17/0
3/14
31/0
3/14
Vol
atili
ty (%
)
Pric
e (`
/kw
h)
Figure-16: Price and its Volatility in IEX during 2013-14
Price Volatility
-50%-40%-30%-20%-10%0%10%20%30%40%50%
0123456789
1011121314
01/0
4/13
15/0
4/13
29/0
4/13
13/0
5/13
27/0
5/13
10/0
6/13
24/0
6/13
08/0
7/13
22/0
7/13
05/0
8/13
19/0
8/13
02/0
9/13
16/0
9/13
30/0
9/13
14/1
0/13
28/1
0/13
11/1
1/13
25/1
1/13
09/1
2/13
23/1
2/13
06/0
1/14
20/0
1/14
03/0
2/14
17/0
2/14
03/0
3/14
17/0
3/14
31/0
3/14
Vol
atili
ty (%
)
Pric
e (`
/kw
h)
Figure-17: Price and its Volatility in PXIL during 2013-14
Price Volatility

Report on Short-term Power Market in India, 2013-14 Page 38
3.2.2 Trends in Price of Electricity Transacted through UI
Trends in daily price of electricity transacted through UI, both in the NEW Grid
and SR Grid, are shown in Figure-18.
Till December 2013, there were two separate transmission networks (NEW Grid
and SR Grid) in India which had separate frequency profiles, therefore, there were two UI
prices. On December 31 2013, both NEW Grid and SR Grid were synchronized and
thereafter a single integrated transmission network has been evolved. A single UI price can
be seen after synchronization.
It can be observed from the above figure that there was divergence in the price of
UI in the NEW Grid and SR Grid from April to September 2013 (prices in SR Grid higher
than prices in NEW Grid), while there was convergence in the price of UI in the rest of the
months. The divergence was due to higher demand in the two Southern states of Tamil
Nadu and Kerala. It can also be observed from the above figure that there was single UI
price after synchronization of both NEW Grid and SR Grid in December 2013.
0
1
2
3
4
5
6
UI P
rice
(`/K
wh)
Figure-18: Daily Price of Electricity Transacted through UI
during 2013-14
Average Price of UI (NEW Grid) Average Price of UI (SR Grid)

Report on Short-term Power Market in India, 2013-14 Page 39
4. Time of the Day Variation in Volume and Price of Electricity
Transacted through Traders and Power Exchanges
In this section, time of the day variation in volume and price of electricity
transacted through traders has been illustrated for RTC (Round the Clock), Peak period and
other than RTC & Peak period. Time of the day variation in volume and price of
electricity transacted through power exchanges is shown block-wise. Price of electricity
transacted through power exchanges is also shown region-wise and block-wise.
4.1 Time of the Day Variation in Volume and Price of Electricity
Transacted through Traders
Time of the day variation in volume and price of electricity transacted through
bilateral trader transactions is shown in Figure-19. The volume of the traders represents
inter-state transaction volume i.e. excluding banking transaction volume. Time of the day
variation in volume is shown during RTC (Round the Clock), Peak period and OTP (other
than RTC & Peak period). Of the total volume, 93.50% was transacted during RTC
followed by 5.20% during OTP, and 1.30% during peak period. It can be observed from
the figure that there is hardly any volume transacted during peak period. It can also be
observed that the weighted average price during RTC is high (`4.30/kWh), when compared
with the price during Peak period (`3.79/kWh) and OTP (`4.07/kWh).
22018
296 1232
4.30
3.79
4.07
3.3
3.5
3.7
3.9
4.1
4.3
4.5
0
5000
10000
15000
20000
25000
30000
RTC Peak OTP
Pri
ce i
n `
/kW
h
Vo
lum
e (M
U)
Type of Transaction
Figure-19: Volume (Excluding banking) and Price of Electricity Transacted
through Traders during RTC, Peak and Other Than RTC & Peak
(OTP), 2013-14

Report on Short-term Power Market in India, 2013-14 Page 40
4.2 Time of the Day Variation in Volume and Price of Electricity
Transacted through Power Exchanges
Time of the day variation in volume and price of electricity transacted through
power exchanges (Day ahead market) are shown block-wise in Figure-20. It can be
observed from the figure that during peak period (between hours 18:00 to 23:00), the
weighted average price of power exchanges was higher when compared to the weighted
average price in rest of the hours. It can also be observed that volume of electricity
transacted during peak period was higher when compared to the volume of electricity
transacted in rest of the hours, indicating that there is more demand during peak period.
Region-wise and hour-wise prices of electricity transacted through power
exchanges are shown in Figure-21 and Figure-22. It can be observed from the figures that
during the entire 2013-14, the price of electricity in Southern region (S1 and S2 regions)
was high when compared with the price in other regions in both the power exchanges. It
can also be observed that in the evening peak period the price in the southern region was
even much higher when compared with other regions. This is mainly due to high demand
for electricity in the southern region. The prices were high due to congestion between
NEW Grid and SR Grid, accompanied by market splitting on the power exchanges.
0
1
2
3
4
5
250265280295310325340
1 5 9 13 17 21 25 29 33 37 41 45 49 53 57 61 65 69 73 77 81 85 89 93
Pric
e(`
/kW
h)
Vol
ume
(MU
)
15 Minute Blocks
Figure-20: Block-wise Market Clearing Volume and Price in
Power Exchanges during 2013-14
Market Clearing Volume Market Clearing Price

Report on Short-term Power Market in India, 2013-14 Page 41
1.5
2.5
3.5
4.5
5.5
6.5
7.5
8.5
9.51 4 7 10 13 16 19 22 25 28 31 34 37 40 43 46 49 52 55 58 61 64 67 70 73 76 79 82 85 88 91 94
Pric
e (`
/kW
hr)
Figure-21: Region-wise and Block-wise Price of Electricity
Transacted through IEX, 2013-14
MCP S1 S2 NR
WR (W1+W2) WR (W3) ER NER
1.5
2.0
2.5
3.0
3.5
4.0
1 4 7 10 13 16 19 22 25 28 31 34 37 40 43 46 49 52 55 58 61 64 67 70 73 76 79 82 85 88 91 94
Pric
e (`
/kW
hr)
Figure-22: Region-wise and Block-wise Price of Electricity
Transacted through PXIL, 2013-14
MCP S1 S2 NR
WR (W1+W2) WR (W3) ER NER

Report on Short-term Power Market in India, 2013-14 Page 42
5. Trading Margin Charged by Trading Licensees for Bilateral
Transactions
During the year 2004-05 (when trading started), the licensees voluntarily charged 5
paise/kWh or less as the trading margin. However, trading margin increased in 2005 and
the weighted average trading margin charged by the licensees went up to 10 paise/kWh
during April to September 2005 period. The Commission then decided to regulate the
margin and fixed the trading margin at 4 paise/kWh vide "CERC (Fixation of Trading
Margin) Regulations" notification dated 26.1.2006. As a result of these trading margin
regulations, the licensees charged trading margin of 4 paise or less from 26.1.2006
onwards until revised Trading Margin Regulations, 2010 on 11.1.2010 (see Table-12,
Table-13 & Figure-23) were issued.
Based on feedback and experience with 2006 regulations and considering various
risks associated with the electricity trading business, CERC revised the trading margin in
2010. As per the CERC (Fixation of Trading Margin) Regulations, 2010, the trading
licensees are allowed to charge trading margin up to 7 paise/kWh in case the sale price
exceeds `3/kWh, and 4 paise/kWh where the sale price is less than or equal to `3/kWh.
The trading licensees have been charging the trading margin accordingly, and weighted
average trading margin for bilateral transactions during 2004-05 to 2013-14 is given in
Table-12 and Figure-23.
Table -12: Weighted Average Trading Margin Charged by Trading Licensees,
2004-05 to 2013-14
Period Trading Margin (`/kWh) 2004-05 0.06 2005-06 0.09 2006-07 0.04 2007-08 0.04 2008-09 0.04 2009-10 0.04 2010-11 0.05 2011-12 0.05 2012-13 0.04 2013-14 0.035
Note 1: Weighted Average Trading Margin is computed based on all Inter-state Trading
Transactions excluding Banking Transactions

Report on Short-term Power Market in India, 2013-14 Page 43
Weighted average trading margin charged by the trading licensees for bilateral
transactions for different sale price ranges during 2013-14 is provided in Table-13 below.
Table -13: Weighted Average Trading Margin Charged by Trading Licensees
during 2013-14
Sale Price of Electricity Transacted by Trading Licensees(`/kWh)
Weighted Average Trading Margin Charged by Trading Licensees(`/kWh)
When Sale Price is less than or Equal to `3/kWh 0.02
When Sale Price is greater than `3/kWh 0.04
Note 1: Weighted Average Trading Margin is computed based on all Inter-state Trading
Transactions excluding Banking Transactions
0.06
0.09
0.04 0.04 0.04 0.04
0.05 0.050.04
0.035
0.02
0.03
0.04
0.05
0.06
0.07
0.08
0.09
0.10Tr
adin
g M
argi
n (`
/kW
h)
Figure-23: Trading Margin Charged by Trading Licensees,
2004-05 to 2013-14 CERC
Trading Margin
Regulations 2006 CERC
Trading Margin
Regulations 2010

Report on Short-term Power Market in India, 2013-14 Page 44
6. Analysis of Open Access Consumers on Power Exchanges
This section contains analysis of various types of participants and analysis of open
access consumers in day ahead market of power exchanges.
6.1 Analysis of Various Types of Participants in Power Exchanges
There are seven types of participants in both the power exchanges, as shown in
Figure-24. It can be observed from the figures that major sellers of electricity through
power exchanges were state utilities followed by independent private producers, private
distribution licensees and captive power plants. It can also be observed that major buyers
of electricity through power exchanges were industrial consumers, state utilities and
private distribution licensees.
6.2 Analysis of Open Access Consumers in Power Exchanges
The year 2010-11 witnessed collective open access transactions, a significant
development in procurement of power by the industrial consumers through power
exchanges. It can be observed that 2958 Open Access (OA) Consumers were procuring
part of their power requirements through IEX at the end of March 2014. These consumers
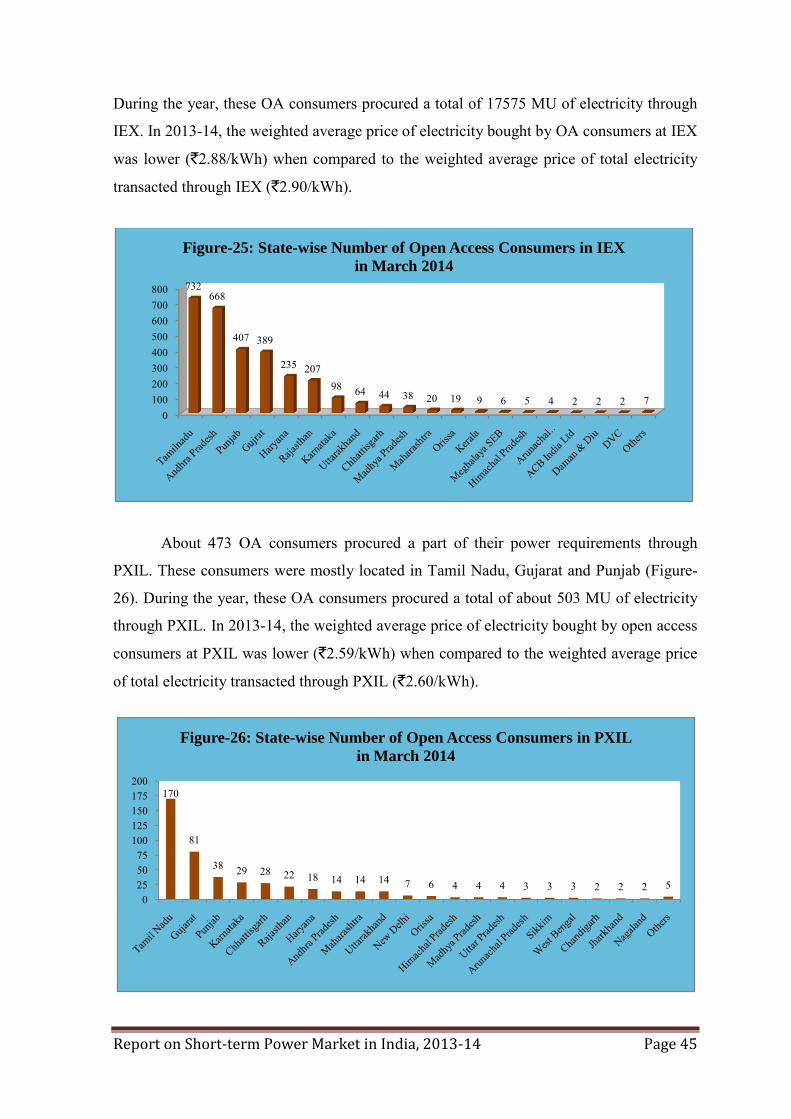
were mostly located in Tamil Nadu, Andhra Pradesh, Punjab and Gujarat (Figure-25).
0300060009000
120001500018000
Captive Power Plants
(CPP)
Industrial Consumers
owning CPP
Industrial consumers
Independent Power
Producers
ISGS/CGS Private Distibution Licensees
State Utilities
Vol
ume
(MU
)
Figure-24: Sell and Buy Volume of Various Types of Participants in
Power Exchanges, 2013-14
Sell volume (MU) Buy volume (MU)
Report on Short-term Power Market in India, 2013-14 Page 45
During the year, these OA consumers procured a total of 17575 MU of electricity through
IEX. In 2013-14, the weighted average price of electricity bought by OA consumers at IEX
was lower (`2.88/kWh) when compared to the weighted average price of total electricity
transacted through IEX (`2.90/kWh).
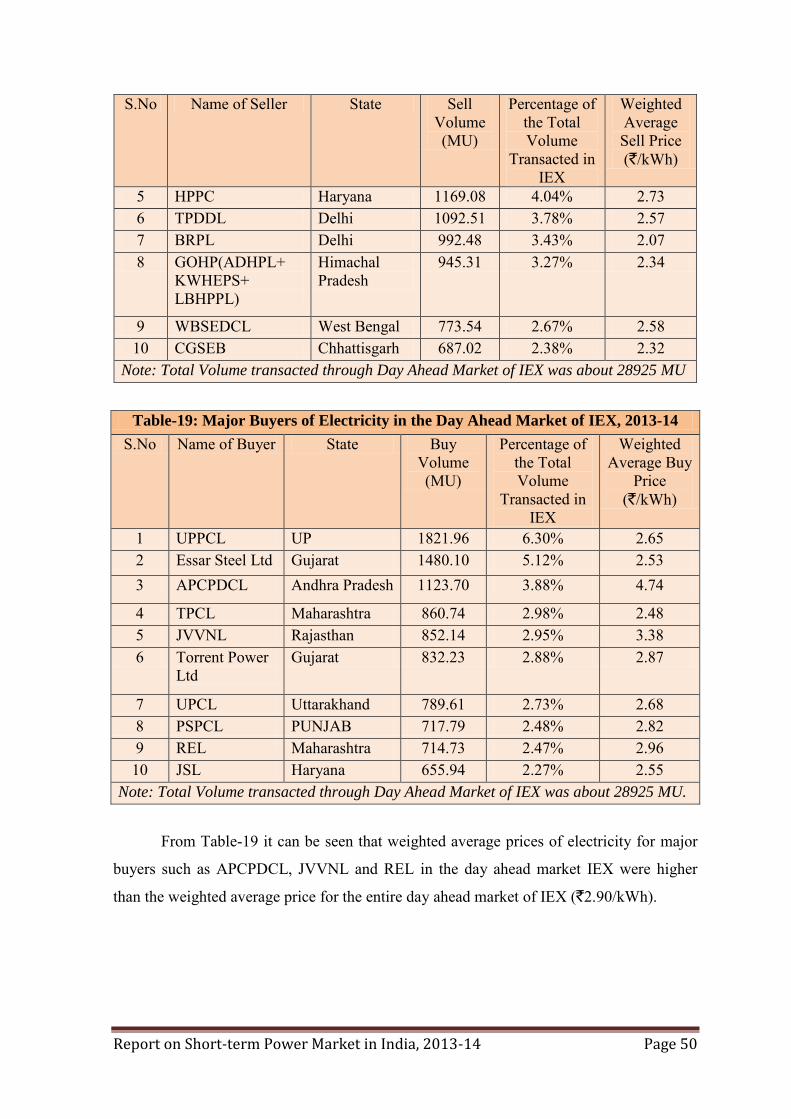
About 473 OA consumers procured a part of their power requirements through
PXIL. These consumers were mostly located in Tamil Nadu, Gujarat and Punjab (Figure-
26). During the year, these OA consumers procured a total of about 503 MU of electricity
through PXIL. In 2013-14, the weighted average price of electricity bought by open access
consumers at PXIL was lower (`2.59/kWh) when compared to the weighted average price
of total electricity transacted through PXIL (`2.60/kWh).
0100200300400500600700800 732
668
407 389
235 20798 64 44 38 20 19 9 6 5 4 2 2 2 7
Figure-25: State-wise Number of Open Access Consumers in IEX
in March 2014
170
81
38 29 28 22 18 14 14 14 7 6 4 4 4 3 3 3 2 2 2 50
255075
100125150175200
Figure-26: State-wise Number of Open Access Consumers in PXIL
in March 2014

Report on Short-term Power Market in India, 2013-14 Page 46
In Table-14 & Figure-27, a month-wise comparison is made between the number of
OA consumer participants and the total number of portfolios in Power Exchanges. It can be
seen that the number of OA consumers as a percentage of total number of portfolios in
Power Exchanges was varying between 76.66% and 79.26% during 2013-14. It can be
observed from the figure that there is an increasing trend in the number of OA consumers
and total number of portfolios in both power exchanges.
Table-14: Number of Open Access Consumers in Power Exchanges, 2013-14
Month No. of Open Access Consumers
Total No. of Portfolios in Power
Exchanges
% of Open Access Consumers
Apr-13 2668 3378 78.98% May-13 2768 3501 79.06% Jun-13 2866 3619 79.19% Jul-13 2951 3736 78.99%
Aug-13 3021 3815 79.19% Sep-13 3081 3894 79.12% Oct-13 3144 3976 79.07% Nov-13 3206 4045 79.26% Dec-13 3256 4114 79.14% Jan-14 3318 4211 78.79% Feb-14 3369 4324 77.91% Mar-14 3431 4482 76.55%
2000
2500
3000
3500
4000
4500
5000
Figure-27: Participation of Open Access Consumers in Power
Exchanges, 2013-14
No. of Open Access Consumers Total No. of Portfolios in Power Exchanges

Report on Short-term Power Market in India, 2013-14 Page 47
In Table-15 & Figure-28, a month-wise comparison is shown between purchase volume of
OA consumers and total volume of Power Exchanges. During 2013-14, volume of
electricity procured by OA consumers as a percentage of total volume transacted in Power
Exchanges was varying between 46.37% and 75.41%. For the year as a whole, the volume
procured by OA consumers as a percentage of total volume transacted in Power Exchanges
was 60.20%.
Table-15: Participation by Volume of Open Access Consumers in Day Ahead
Market of Power Exchanges, 2013-14
Month OAC Purchase Volume (MU)
Power Exchanges Total Volume (MU)
% OAC Purchase Participation
Apr-13 1411.82 2576.54 54.80% May-13 1595.75 2572.52 62.03% Jun-13 1634.74 2167.76 75.41% Jul-13 1500.07 2357.72 63.62%
Aug-13 1762.30 2429.77 72.53% Sep-13 1363.28 2939.84 46.37% Oct-13 1529.93 2754.64 55.54% Nov-13 1593.39 2653.75 60.04% Dec-13 1462.01 2543.14 57.49% Jan-14 1370.08 2441.82 56.11% Feb-14 1284.77 2236.98 57.43% Mar-14 1570.06 2356.78 66.62% Total 18078.20 30031.26 60.20%
0500
100015002000250030003500
Vol
ume
(MU
)
Figure-28: Open Access Consumer Purchase Volume and Total
Volume in Power Exchanges, 2013-14
OAC Purchase Volume (MU) Total Volume of Power Exchanges (MU)

Report on Short-term Power Market in India, 2013-14 Page 48
7. Major Sellers and Buyers of Electricity in the Short term
market
Table-16 and Table-17 show top 10 sellers and buyers of electricity through traders
(bilateral trader segment transactions). The same data for IEX is shown in Table-18 and
Table-19 and for PXIL in Table-20 and Table-21. It can be seen that the dominant sellers,
both at the power exchanges and traders, are a mixed group comprising of independent
power producers, distribution companies, state government agencies, and captive power
plants. The major buyers from traders and at power exchanges are mostly state distribution
companies.
Table-16: Major Sellers of Electricity through Traders, 2013-14
S.No Seller State Volume (MU)
Approximate percentage of total volume transacted
through traders
Weighted Average
Sale Price in `/kWh
1 JSWEL Karnataka 3744.02 15.90% 6.06 2 GOHP(ADHPL+
Malana2+KWHEPS+Budhil)
Himachal Pradesh
2529.38 10.74% 3.52
3 APL Gujarat 2327.53 9.88% 3.99 4 SEL Orissa 2306.17 9.79% 3.96 5 KWHEPS Himachal
Pradesh 1748.81 7.43% 3.79
6 JPL Chhattisgarh 1548.03 6.57% 3.42 7 APNRL Jharkhand 987.76 4.19% 3.58 8 GRIDCO Orissa 864.60 3.67% 5.56 9 CSPTC+CSPDC
+ Chhattisgarh Chhattisgarh 767.57 3.26% 4.07
10 MEL Orissa 763.22 3.24% 5.78
Note: Volume sold by major sellers and total volume transacted through traders does
not include the volume through banking arrangement.

Report on Short-term Power Market in India, 2013-14 Page 49
Table-17: Major Buyers of Electricity through Traders, 2013-14
S.No Buyer State Volume (MU)
Approximate percentage of total volume transacted
through traders
Weighted Average Purchase Price in `/kWh
1 APPCC+ APCPDCL
Andhra Pradesh
5723.07 24.31% 5.64
2 PSPCL Punjab 2451.51 10.41% 3.89 3 KSEB Kerala 2424.30 10.30% 5.27 4 RDPPC+
JVVNL Rajasthan 2180.09 9.26% 3.32
5 WBSEDCL West Bengal 1907.33 8.10% 3.60 6 UPPCL Uttar Pradesh 1304.81 5.54% 3.45 7 BSEB Bihar 1159.13 4.92% 4.65 8 TNEB+
TANGEDCO Tamil Nadu 1112.54 4.72% 4.62
9 HPSEB Himachal Pradesh
1011.83 4.30% 3.22
10 UPCL Uttarakhand 705.42 3.00% 3.47 Note: Volume bought by major buyers and total volume transacted through traders
does not include the volume through banking arrangement.
From Table-17 it can be seen that weighted average purchase prices of electricity of
major buyers such as APPCC, KSEB BSEB and TNEB from traders (bilateral transactions)
were higher than the weighted average price for the entire bilateral trader segment
(`4.29/kWh).
Table-18: Major Sellers of Electricity in the Day Ahead Market of IEX, 2013-14
S.No Name of Seller State Sell Volume (MU)
Percentage of the Total Volume
Transacted in IEX
Weighted Average Sell Price (`/kWh)
1 GUVNL Gujarat 3501.52 12.11% 2.83 2 MPPMCL Madhya
Pradesh 2595.84 8.97% 2.58
3 KWHEP Himachal Pradesh
1783.36 6.17% 2.32
4 JPL Jindal Power 1261.03 4.36% 2.29
Report on Short-term Power Market in India, 2013-14 Page 50
S.No Name of Seller State Sell Volume (MU)
Percentage of the Total Volume
Transacted in IEX
Weighted Average Sell Price (`/kWh)
5 HPPC Haryana 1169.08 4.04% 2.73 6 TPDDL Delhi 1092.51 3.78% 2.57 7 BRPL Delhi 992.48 3.43% 2.07 8 GOHP(ADHPL+
KWHEPS+ LBHPPL)
Himachal Pradesh
945.31 3.27% 2.34
9 WBSEDCL West Bengal 773.54 2.67% 2.58 10 CGSEB Chhattisgarh 687.02 2.38% 2.32
Note: Total Volume transacted through Day Ahead Market of IEX was about 28925 MU
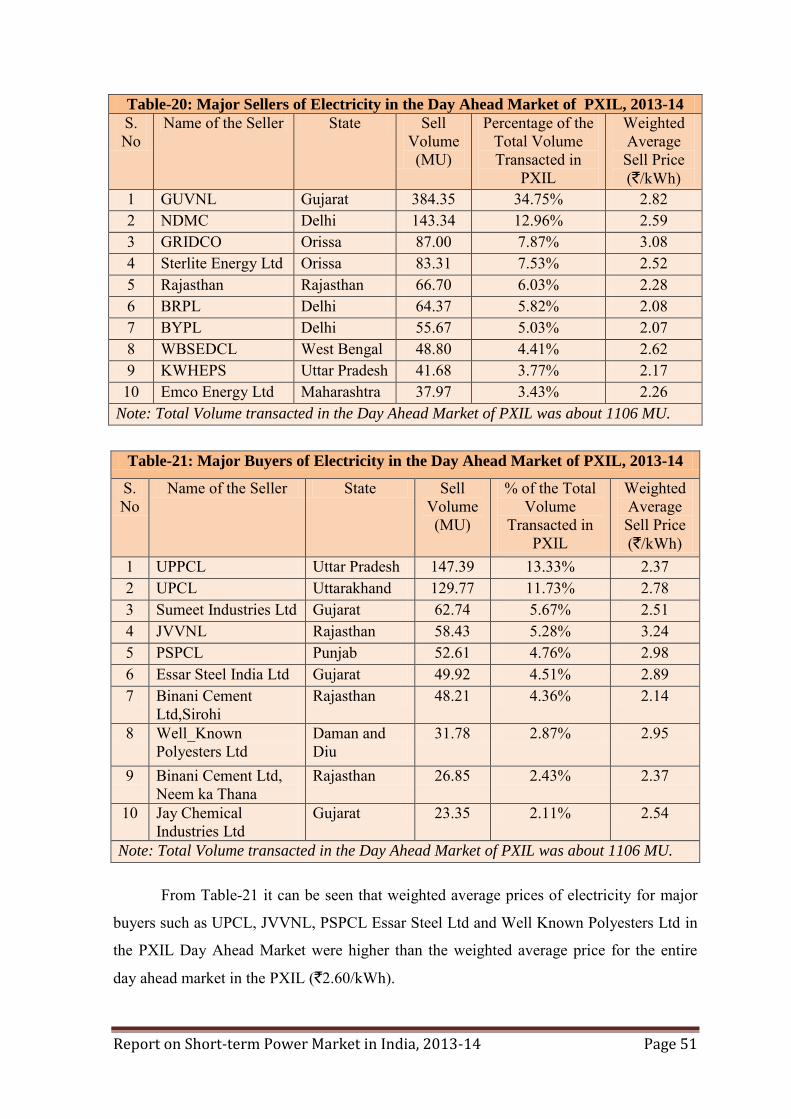
Table-19: Major Buyers of Electricity in the Day Ahead Market of IEX, 2013-14
S.No Name of Buyer State Buy Volume (MU)
Percentage of the Total Volume
Transacted in IEX
Weighted Average Buy
Price (`/kWh)
1 UPPCL UP 1821.96 6.30% 2.65 2 Essar Steel Ltd Gujarat 1480.10 5.12% 2.53 3 APCPDCL Andhra Pradesh 1123.70 3.88% 4.74
4 TPCL Maharashtra 860.74 2.98% 2.48 5 JVVNL Rajasthan 852.14 2.95% 3.38 6 Torrent Power
Ltd Gujarat 832.23 2.88% 2.87
7 UPCL Uttarakhand 789.61 2.73% 2.68 8 PSPCL PUNJAB 717.79 2.48% 2.82 9 REL Maharashtra 714.73 2.47% 2.96 10 JSL Haryana 655.94 2.27% 2.55
Note: Total Volume transacted through Day Ahead Market of IEX was about 28925 MU.
From Table-19 it can be seen that weighted average prices of electricity for major
buyers such as APCPDCL, JVVNL and REL in the day ahead market IEX were higher
than the weighted average price for the entire day ahead market of IEX (`2.90/kWh).
Report on Short-term Power Market in India, 2013-14 Page 51
Table-20: Major Sellers of Electricity in the Day Ahead Market of PXIL, 2013-14
S. No
Name of the Seller State Sell Volume (MU)
Percentage of the Total Volume Transacted in
PXIL
Weighted Average Sell Price (`/kWh)
1 GUVNL Gujarat 384.35 34.75% 2.82 2 NDMC Delhi 143.34 12.96% 2.59 3 GRIDCO Orissa 87.00 7.87% 3.08 4 Sterlite Energy Ltd Orissa 83.31 7.53% 2.52 5 Rajasthan Rajasthan 66.70 6.03% 2.28 6 BRPL Delhi 64.37 5.82% 2.08 7 BYPL Delhi 55.67 5.03% 2.07 8 WBSEDCL West Bengal 48.80 4.41% 2.62 9 KWHEPS Uttar Pradesh 41.68 3.77% 2.17 10 Emco Energy Ltd Maharashtra 37.97 3.43% 2.26
Note: Total Volume transacted in the Day Ahead Market of PXIL was about 1106 MU.
Table-21: Major Buyers of Electricity in the Day Ahead Market of PXIL, 2013-14
S. No
Name of the Seller State Sell Volume (MU)
% of the Total Volume
Transacted in PXIL
Weighted Average Sell Price (`/kWh)
1 UPPCL Uttar Pradesh 147.39 13.33% 2.37 2 UPCL Uttarakhand 129.77 11.73% 2.78 3 Sumeet Industries Ltd Gujarat 62.74 5.67% 2.51 4 JVVNL Rajasthan 58.43 5.28% 3.24 5 PSPCL Punjab 52.61 4.76% 2.98 6 Essar Steel India Ltd Gujarat 49.92 4.51% 2.89 7 Binani Cement
Ltd,Sirohi Rajasthan 48.21 4.36% 2.14
8 Well_Known Polyesters Ltd
Daman and Diu
31.78 2.87% 2.95
9 Binani Cement Ltd, Neem ka Thana
Rajasthan 26.85 2.43% 2.37
10 Jay Chemical Industries Ltd
Gujarat 23.35 2.11% 2.54
Note: Total Volume transacted in the Day Ahead Market of PXIL was about 1106 MU.
From Table-21 it can be seen that weighted average prices of electricity for major
buyers such as UPCL, JVVNL, PSPCL Essar Steel Ltd and Well Known Polyesters Ltd in
the PXIL Day Ahead Market were higher than the weighted average price for the entire
day ahead market in the PXIL (`2.60/kWh).

Report on Short-term Power Market in India, 2013-14 Page 52
8. Effect of Congestion on Volume of Electricity Transacted
through Power Exchanges
The volume of electricity transacted/sold through power exchanges is sometimes
constrained due to transmission congestion. The details of congestion in both the power
exchanges are shown in Table-22 and Table-23.
Annual details of congestion in power exchanges are shown in Table-22. It can be
observed from the table that there is an increasing trend in the unconstrained cleared
volume and actual volume transacted. Unconstrained cleared volume and actual volume
transacted increased from 8.10 BU and 7.09 BU respectively in 2008-09 to 35.62 BU and
30.03 BU respectively in 2013-14. Volume of electricity that could not be cleared (i.e. the
difference of unconstrained cleared volume and actual volume transacted) as % to
unconstrained cleared volume declined from 12% in 2009-10 to 5% in 2010-11 and then
increased to 16% in 2013-14.
Table-22: Annual Details of Congestion in Power Exchanges
Year Unconstrained Cleared Volume*
(MU)
Actual Cleared
Volume and hence
scheduled (MU)
Volume of electricity that
could not be cleared due to congestion
(MU)
Volume of electricity that could not be
cleared as % to Unconstrained
Cleared Volume 1 2 3 4 (2-3) 5 (4/2)
2009-10 8098.74 7087.10 1011.65 12% 2010-11 14263.45 13540.75 722.70 5% 2011-12 17084.28 14827.68 2256.61 13% 2012-13 27672.30 23024.41 4647.89 17% 2013-14 35621.04 30029.62 5591.42 16%
* This power would have been scheduled had there been no congestion.
Source: IEX, PXIL & NLDC
During 2013-14, in the IEX, the unconstrained cleared volume and the actual
volume transacted were 34.23 BU and 28.92 BU respectively (Table-23). The actual
transacted volume was 15.50% less than unconstrained volume. During the same year, in
PXIL, the unconstrained cleared volume and the actual volume transacted were 1.39 BU

Report on Short-term Power Market in India, 2013-14 Page 53
and 1.11 BU respectively. The actual transacted volume was 20.44% lesser than
unconstrained volume.
Table-23: Power Exchange wise Details of Congestion, 2013-14
Details of Congestion IEX PXIL A Unconstrained Cleared Volume* (MU) 34230.41 1390.62 B Actual Cleared Volume and hence scheduled (MU) 28923.23 1106.39 C Volume of electricity that could not be cleared and
hence not scheduled because of congestion (MU) (A-B)
5307.18 284.24
D Volume of electricity that could not be cleared as % to Unconstrained Cleared Volume
15.50% 20.44%
* This power would have been scheduled had there been no congestion.
Source: IEX, PXIL & NLDC
Congestion, consequent market splitting, and the resultant difference in market
prices in different regions give rise to congestion charges. The congestion amount
collected during the year 2013-14 was `392.33 crore.

Report on Short-term Power Market in India, 2013-14 Page 54
9. Tariff of Long-term Sources of Power for Various
Distribution Companies
It can be seen that short-term market, which includes UI, power transacted through
traders (inter-state part), bilateral power transactions directly between DISCOMs, and
power transacted through power exchanges, met about 11 % of the power requirement of
the distribution companies in the year 2013-14. The balance 89 % power requirement of
the distribution companies was met from power procured under long-term contracts with
state and central government owned power generating companies and independent power
producers, and also intra-state power purchases from traders under bilateral transactions.
The details on tariff of central government power generating companies, tariff
(levelised tariff) of power projects under Case-1 bidding, and the details on average cost of
supply and average revenue of state power utilities have been provided below.
9.1 Tariff of Central Government power generating companies
The central government power generating companies in 2013-14, accounted for
about 31 percent of the total power generation in the country.
The prices paid by distribution companies to procure power from central
government owned generating companies in 2013-14 (under long-term Power Purchase
Agreements) are shown in Table-24 and 25. It can be seen that, on an average, the
distribution companies paid between `1.47 and `5.29 per kWh for procuring power from
coal and lignite based stations, between `3.36 and `12.88 per kWh from gas/RLNG based
power stations, between `8.46 and `13.67 per kWh from liquid fuel based power stations
(Table-24), and between `0.79 per kWh and `5.91 per kWh from hydro stations (Table-
25).

Report on Short-term Power Market in India, 2013-14 Page 55
Table-24: Tariff of Central Thermal Power Stations, 2013-14
Sl. No.
Name of the Generating Station
Installed Capacity (MW),
March 2014
Fixed charges
(Paise/kWh)
Energy Charges
(Paise/kWh), March 2014
Total Tariff (Paise/ kWh)
I: Coal Based thermal generating Stations of NTPC
A. Pit head Generating Stations
1 Rihand STPS (St-I) 1000 83 150 233 2 Rihand STPS (St-II) 1000 93 147 241 3 Rihand STPS (St-III) 1000 179 143 322 4 Singrauli STPS 2000 54 121 175 5 Vindhyachal STPS (St-I) 1260 65 138 203 6 Vindhyachal STPS (St-II) 1000 65 130 195 7 Vindhyachal STPS (St-III) 1000 113 130 243 8 Vindhyachal STPS (St-IV) 1000 152 130 282 9 Korba STPS (St-I & II) 2100 56 92 147
10 Ramagundam STPS (St-I&II) 2100 60 221 281 11 Ramagundam STPS (St-III) 500 97 288 385 12 Talcher TPS 460 73 121 194 13 Talcher STPS (St-I) 1000 83 170 252 14 Talcher STPS (St-II) 2000 87 170 257 15 Sipat STPS (St-I) 1980 141 153 294 16 Sipat STPS (St-II) 1000 124 158 282 17 Korba STPS (St-III) 500 162 91 252 Sub-Total (A) 20900
B. Non-Pit head Generating Stations
18 FGUTPP TPS (St-I) 420 88 324 412 19 FGUTPP (St-II) 420 91 328 419 20 FGUTPP (St-III) 210 139 329 468 21 NCTP Dadri (St-I) 840 90 339 429 22 NCTP Dadri (St-II) 980 159 335 494 23 Farrakka STPS (St-I&II) 1600 81 299 380 24 Farrakka STPS (St-III) 500 152 296 448 25 Tanda TPS 440 111 388 498 26 Badarpur TPS 705 90 439 529 27 Kahalgaon STPS (St-I) 840 96 312 408 28 Kahalgaon STPS (St-II) 1500 116 295 410 29 Simhadri (St-I) 1000 104 271 375 30 Simhadri (St-II) 1000 169 273 441 31 Mauda-I 1000 187 308 495 Sub-Total (B) 11455 Total Coal (A+B) 32355

Report on Short-term Power Market in India, 2013-14 Page 56
Sl. No.
Name of the Generating Station
Installed Capacity (MW),
March 2014
Fixed charges (Paise/ kWh)
Energy Charges
(Paise/kWh), March 2014
Total Tariff (Paise/ kWh)
II: Natural Gas (APM & Non-APM)/LNG/Liquid Fuel based generating stations of NTPC
A: Using Natural Gas(APM) as Fuel
1 Dadri CCGT 830 54 345 399 2 Faridabad 431 79 266 345 3 Anta CCGT 419 70 290 360 4 Auraiya GPS 663 53 332 385 5 Gandhar GPS 657 100 246 346 6 Kawas GPS 656 79 257 336 Total APM Gas 3657
B: Using Natural Gas(Non-APM) as Fuel
1 Gandhar GPS 657 100 339 439 2 Kawas Gas 656 79 344 423 Total Non-APM Gas 1314
C: Using LNG as Fuel
1 Dadri CCGT 830 54 1057 1111 2 Anta CCGT 419 70 879 949 3 Auraiya GPS 663 53 1067 1120 4 Faridabad 431 79 841 920 5 Gandhar GPS 657 100 1172 1272 6 Kawas Gas 656 79 1209 1288 Total LNG 3657
D: Using Liquid Fuel (Naphtha/HSD) as Fuel
1 Dadri CCGT 830 54 793 847 2 Faridabad 431 79 767 846 3 Anta CCGT 419 70 815 885 4 Auraiya GPS 663 53 1038 1091 5 Kayamkulam CCGT 360 87 1280 1367 6 Kawas Gas 656 79 886 965 Total Naphtha/HSD 3359
III: Lignite Based thermal generating Stations of NLC
1 TPS-I 600 88 257 345 2 TPS-II Stage-I 630 63 217 279 3 TPS-II Stage-II 840 64 217 281 4 TPS-I (Expansion) 420 124 203 327 5 Barsingsar 250 291 110 401 Total NLC 2740
IV: Gas/Liquid Fuel based generating Stations of NEEPCO
1 Agartala GPS 84 125 259 383 2 Assam GPS 291 147 198 345 Total NEEPCO 375

Report on Short-term Power Market in India, 2013-14 Page 57
Table-25: Composite Tariff of Central Hydro Power Stations, 2013-14
Name of Generating Company
Name of the Generating
Station
Type Installed Capacity
(MW)
Annual Fixed Charges
(`/Lakhs)
Composite Tariff
(`/kWh)
NHPC
1 Baira siul Pondage 180 10292.94 1.51 2 Loktak Storage 105 10695.13 2.73 3 Salal ROR 690 24669.15 0.92 4 Tanakpur ROR 123 8837.69 2.24 5 Chamera-I Pondage 540 27669.56 1.91 6 Uri-I ROR 480 33853.30 1.50 7 Rangit Pondage 60 8134.24 2.76 8 Chamera-II Pondage 300 33603.01 2.58 9 Dhauliganga-I Pondage 280 27569.10 2.79 10 Dulhasti ROR 390 95214.01 5.74 11 Teesta-V Pondage 510 49709.79 2.22 12 Sewa-II Pondage 120 18790.14 4.05 13 Chamera-III* Pondage 231 33375.42 3.53 14 Chutak* ROR 44 10378.95 5.61 15 Uri-II* ROR 240 32772.26 3.35 16 Nimoo Bazgo* Pondage 45 12326.06 5.91
Total 4338 NHDC
1 Indira Sagar Storage 1000 50756.03 2.59 2 Omkareshwar Storage 520 39699.92 4.76 Total 1520 THDC
1 Tehri Stage-I* Storage 1000 110842.71 4.60 2 Koteshwar* 400 38316.27 3.81 1400 SJVNL
1 Naptha Jhakri RoR 1500 155755.70 2.59 NEEPCO
1 Khandong Storage 50 3251.75 1.34 2 Kopili Stage-I Storage 200 8170.63 0.79 3 Doyang Storage 75 8041.32 4.06 4 Ranganadi Pondage 420 29535.47 1.81 5 Kopili Stage-II Storage 25 1322.83 1.76 Total 770 * Provisional Tariff

Report on Short-term Power Market in India, 2013-14 Page 58
9.2 Levelised tariff of power projects under Case-I Bidding
Table-26 indicates long-term levelised tariff for power available from power
projects bid in the year 2012-13 under Case-I. The price of the power projects under Case-I
for long-term varied in the range of `4.48 per kWh to `5.84 per kWh.
Table-26: Capacity Contracted under Case-I Bidding Route during 2012-13
Sr. No. State
Name of the Developer/
Plant
Name of the
Procurer
Capacity (MW)
Fuel Type
Levelized Tariff
(`/kWh)
Date of Bidding Deadline
Medium/ Long-Term
1 Uttar Pradesh
Navyuga Power, Krishnapat-nam, A.P
UPPCL 800 Imported Coal 5.84 Sep-12
Long-Term
2 Uttar Pradesh
NSL Power, Odisha UPPCL 300 Blended
Coal 4.48 Sep-12
Source: Forum of Regulators
9.3 Average Cost of Supply and Average Revenue of State Power Utilities
The data on average cost of supply to state power utilities (SEBs, Power Deptts.,
DISCOMs) and average revenue (revenue from sale of power by state power utilities)
without subsidy has been taken from "Performance Report of State Power Utilities"
published by Power Finance Corporation (Table-27).
Table-27: Average Cost of Supply and Average Revenue (without subsidy) of
State Power Utilities
Average Cost of Supply Average Revenue (without subsidy)
2008 - 09 3.40 2.63 2009 - 10 3.55 2.68 2010 - 11 3.97 3.03 2011 - 12 4.39 3.31
Source: PFC, "The Performance of State Power Utilities for the years, 2008-09 to
2010-11 and 2009-10 to 2011-12.
The average cost of supply increased from `3.40/kWh in 2008-09 to `4.39/kWh in 2011-
12. The average revenue (without considering subsidy booked) increased from `2.63/kWh
in 2008-09 to `3.31/kWh in 2011-12.

Report on Short-term Power Market in India, 2013-14 Page 59
10. Analysis of transactions of Renewable Energy Certificates
(RECs) through power exchanges.
The concept of Renewable Energy Certificates (RECs) seeks to address mismatch between
geographical availability of renewable energy sources and the requirement of the obligated
entities to meet their renewable purchase obligation by purchasing green attributes of
renewable energy. The REC mechanism is a market based instrument, to promote
renewable sources of energy and development of market in electricity.
One REC is equivalent to 1 MWh of electricity injected into the grid from
renewable energy sources. The REC is exchanged only in the power exchanges approved
by CERC within the band of a floor price and forbearance (ceiling) price as notified by
CERC from time to time. The forbearance price and floor price notified by CERC for the
period from 1st April 2012 is as under:
Forbearance and Floor Price w.e.f 1st April 2012
Type of REC Floor Price (`/MWh) Forbearance Price (`/MWh)
Solar 9300.00 13400.00 Non-Solar 1500.00 3300.00
The first REC trading session was held on power exchanges in March 2011. The
details of REC transactions are shown in Table-28 and Table-29. The market clearing
volume of Solar RECs transacted in 2013-14 on IEX and PXIL were 53056 and 13624
respectively and the weighted average of market clearing price of these RECs were
`9725/MWh and `9666/MWh on IEX and PXIL respectively. Market clearing volume of
Non-Solar RECs transacted in 2013-14 on IEX and PXIL were 1271267 and 1410747
respectively and the weighted average of market clearing price of these RECs was
`1500/MWh on both IEX and PXIL.
The gap between the volume of buy and sell bids of RECs placed through power
exchanges shows that there was less demand for both Solar RECs and Non-Solar RECs.
For Solar RECs, the ratio of buy and sell bids was 0.09 and 0.10 in IEX and PXIL
respectively. For Non-Solar RECs, the ratio of buy and sell bids was 0.05 and 0.08 in IEX
and PXIL respectively.

Report on Short-term Power Market in India, 2013-14 Page 60
Table-28 : Annual details of Renewable Energy Certificates transacted through
Power Exchanges
Sr.No.
Details of REC Transactions IEX PXIL
Type of REC Solar Non-Solar Solar Non-Solar
Year 2013-14 2013-14 A Volume of Buy Bid 54238 1271267 14043 1410747 B Volume of Sell Bid 585976 25165246 135000 17233135 C Ratio of Buy Bid to
Sell Bid Volume 0.09 0.05 0.10 0.08
D Market Clearing Volume (MWh)
53056 1271267 13624 1410747
E Market Clearing Price (`/MWh)
9725 1500 9666 1500
Month-wise volume and price of RECs transacted through power exchanges are
shown in the following table (Table-29).
Table-29 : Volume and Price of Renewable Energy Certificates Transacted through
Power Exchanges, 2013-14
Month
IEX PXIL Volume of REC
Transactions (MWh)
Weighted Average Price of
REC Transactions
(`/MWh)
Volume of REC Transactions
(MWh)
Weighted Average Price of
REC Transactions
(`/MWh)
Solar
Apr-13 1005 12206 1212 12000 May-13 669 11490 1034 10990
Jun-13 797 9300 682 9300 Jul-13 1983 9300 46 9300
Aug-13 1754 9300 605 9300 Sep-13 5880 9300 832 9300 Oct-13 6548 9300 2709 9300 Nov-13 6983 9300 371 9300 Dec-13 6893 9300 989 9300 Jan-14 5517 9300 844 9300 Feb-14 7816 9300 492 9300 Mar-14 7211 9300 3808 9300

Report on Short-term Power Market in India, 2013-14 Page 61
Month IEX PXIL Month IEX
Volume of REC Transactions
(MWh)
Weighted Average Price of
REC Transactions
(`/MWh)
Volume of REC Transactions
(MWh)
Non-Solar
Apr-13 10670 1500 33789 1500 May-13 18543 1500 34425 1500 Jun-13 36147 1500 36339 1500 Jul-13 72321 1500 89081 1500
Aug-13 31101 1500 9788 1500 Sep-13 38195 1500 11636 1500 Oct-13 98921 1500 51719 1500 Nov-13 97743 1500 211185 1500 Dec-13 250722 1500 153140 1500 Jan-14 78955 1500 280042 1500 Feb-14 176107 1500 202718 1500 Mar-14 361842 1500 296885 1500
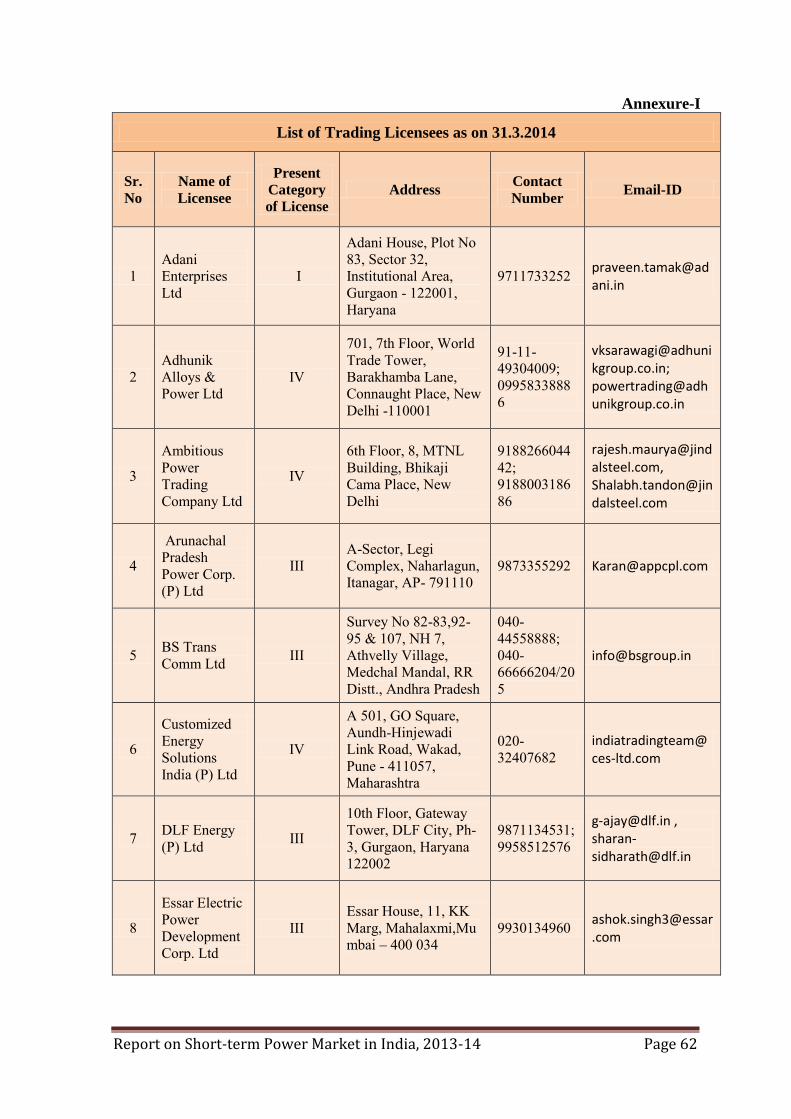
Report on Short-term Power Market in India, 2013-14 Page 62
Annexure-I
List of Trading Licensees as on 31.3.2014
Sr.
No Name of
Licensee
Present
Category
of License Address
Contact
Number Email-ID
1 Adani Enterprises Ltd
I
Adani House, Plot No 83, Sector 32, Institutional Area, Gurgaon - 122001, Haryana
9711733252 [email protected]
2 Adhunik Alloys & Power Ltd
IV
701, 7th Floor, World Trade Tower, Barakhamba Lane, Connaught Place, New Delhi -110001
91-11-49304009; 09958338886
[email protected]; [email protected]
3 Ambitious Power Trading Company Ltd
IV 6th Floor, 8, MTNL Building, Bhikaji Cama Place, New Delhi
918826604442; 918800318686
[email protected], [email protected]
4 Arunachal Pradesh Power Corp. (P) Ltd
III A-Sector, Legi Complex, Naharlagun, Itanagar, AP- 791110
9873355292 [email protected]
5 BS Trans Comm Ltd III
Survey No 82-83,92-95 & 107, NH 7, Athvelly Village, Medchal Mandal, RR Distt., Andhra Pradesh
040-44558888; 040-66666204/205
6 Customized Energy Solutions India (P) Ltd
IV
A 501, GO Square, Aundh-Hinjewadi Link Road, Wakad, Pune - 411057, Maharashtra
020-32407682
7 DLF Energy (P) Ltd III
10th Floor, Gateway Tower, DLF City, Ph-3, Gurgaon, Haryana 122002
9871134531; 9958512576
[email protected] , [email protected]
8 Essar Electric Power Development Corp. Ltd
III Essar House, 11, KK Marg, Mahalaxmi,Mumbai – 400 034
9930134960 [email protected]

Report on Short-term Power Market in India, 2013-14 Page 63
Sr.
No Name of
Licensee
Present
Category
of License Address
Contact
Number Email-ID
9 Gemac Engineering Services (P) Ltd
IV
3rd Floor, Wescare Towers, No. 16, Cenotaph Road, Teynompet, Chennai - 600018
044- 24343753
10 Global Energy (P) Ltd I
1st Floor, Shangri La's Eros Corporate Plaza, 19 Ashoka Road, Connaught Place, New Delhi-11001
011-47334444
11 GMR Energy Trading Ltd 1
GMR Energy Trading Limited, New Udaan Bhawan, Terminal-3, Opp. ATS Complex, International Terminal, Indira Gandhi International Airport, New Delhi- 110037
91-11-46084156; 91-8527190252; Fax:91-11-46084180
12 Green Fields Power Services (P) Ltd
IV 101, Sri Guru Krupa,7-1-54/2/c, D.K. Road, Ameerpet, Hyderabad – 500 016
91-40-23731823; 9160619000
13 Greenko Energies (P) Ltd
IV #1366, Road No. 45, Jubilee Hills, Hyderabad - 500033, India
91-040-40301000, 32915858
14 HMM Infra Ltd III
#2350/3, Mariwala Town, Manimajra, Chandigarh-160101
0184-2261212; 09996136454
15 Indiabulls Power Trading Ltd
IV "Indiabulls House" 448-451, Udyog Vihar, Phase-V, Gurgaon-122016
9650338839 [email protected]
16 Indrajit Power Technology (P) Ltd
III
Trade world 'C' Wing 16th floor, Kamala City, Senapti Bapat marg, Lower Parel, Mumbai.-400013.
022-30418146; 9960053675

Report on Short-term Power Market in India, 2013-14 Page 64
Sr.
No Name of
Licensee
Present
Category
of License Address
Contact
Number Email-ID
17 Instinct Infra & Power Ltd III
C-201, Naraina Industrial Area, Phase - 1, New Delhi - 110028
9910555026 [email protected]
18 Jaiprakash Associates Ltd
I Sector 128 Noida 201304
9654891985; 9910968663; 9717150984
[email protected], [email protected], [email protected]
19 JSW Power Trading Company Ltd
I Upper Ground Floor, NBCC Tower, 15 Bhikaji Cama Place, New Delhi-110066
011-26192275; 26767020; 09873352917
20 Karam Chand Thapar & Bros (CS) Ltd
I KCT Block, 85-A, Panchkuian Road, New Delhi-110001
011-23366590; 23747629; 9810434862; 9310434862
[email protected], [email protected]
21 Knowledge Infrastructure Systems (P) Ltd
I G 2, Salcon Aurum, 4 Commercial Centre, Jasola, N Delhi 25
011-46067070; 9810518133; Fax: 011-46027217
[email protected], [email protected]
22 Manikaran Power Ltd II
3/A, Aastha, 460, E.M. Bye Pass, Kolkata -700107
91-33-40610165; 24433994
23 Mittal Processors (P) Ltd
II
Corporate office: #1004, Antriksh Bhawan, 10th Floor, Connaught Place, 22 KG Marg, New Delhi-110001
91-11-666666999; 8588865346; 8950003381
[email protected], [email protected]
24 MY Home Power (P) Ltd III
3rd,Block, 5th Floor, My Home Hub, Hitec City, Madhapur, Hyderabad-500 081
040-66222700; 9010262683
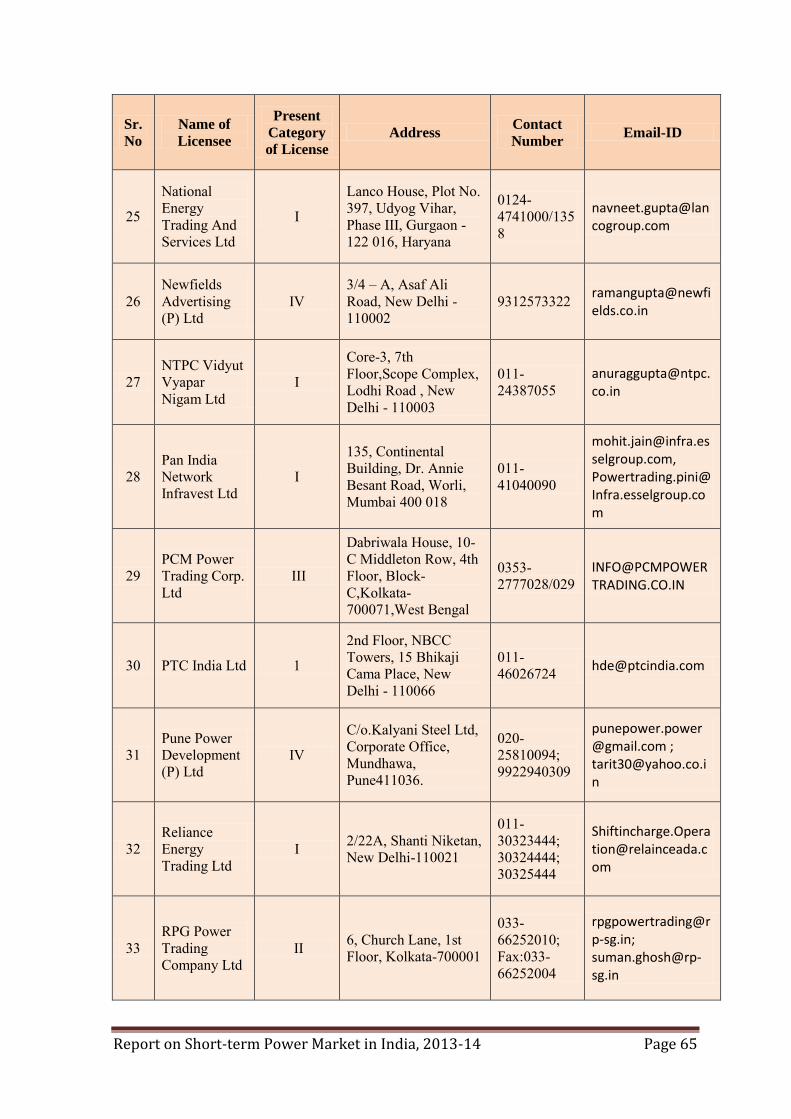
Report on Short-term Power Market in India, 2013-14 Page 65
Sr.
No Name of
Licensee
Present
Category
of License Address
Contact
Number Email-ID
25 National Energy Trading And Services Ltd
I Lanco House, Plot No. 397, Udyog Vihar, Phase III, Gurgaon - 122 016, Haryana
0124-4741000/1358
26 Newfields Advertising (P) Ltd
IV 3/4 – A, Asaf Ali Road, New Delhi - 110002
9312573322 [email protected]
27 NTPC Vidyut Vyapar Nigam Ltd
I Core-3, 7th Floor,Scope Complex, Lodhi Road , New Delhi - 110003
011-24387055
28 Pan India Network Infravest Ltd
I 135, Continental Building, Dr. Annie Besant Road, Worli, Mumbai 400 018
011-41040090
[email protected], [email protected]
29 PCM Power Trading Corp. Ltd
III
Dabriwala House, 10-C Middleton Row, 4th Floor, Block-C,Kolkata-700071,West Bengal
0353-2777028/029
30 PTC India Ltd 1 2nd Floor, NBCC Towers, 15 Bhikaji Cama Place, New Delhi - 110066
011-46026724 [email protected]
31 Pune Power Development (P) Ltd
IV C/o.Kalyani Steel Ltd, Corporate Office, Mundhawa, Pune411036.
020-25810094; 9922940309
[email protected] ; [email protected]
32 Reliance Energy Trading Ltd
I 2/22A, Shanti Niketan, New Delhi-110021
011-30323444; 30324444; 30325444
33 RPG Power Trading Company Ltd
II 6, Church Lane, 1st Floor, Kolkata-700001
033-66252010; Fax:033-66252004

Report on Short-term Power Market in India, 2013-14 Page 66
Sr.
No Name of
Licensee
Present
Category
of License Address
Contact
Number Email-ID
34 Shree Cement Ltd I
Room No.114, Hans Bhawan, 1 Bhadurshah Zafar marg, Delhi-110002
011-23370320; Ext-365
[email protected]; [email protected]
35 Shyam Indus Power Solutions (P) Ltd
IV 129,Transport Centre, Rohtak Road, Punjabi Bagh New Delhi-35
011-45764444
[email protected], [email protected]
36 SN Power Markets (P) Ltd
I 4th Floor, MGF Metropolitan Mall, Saket District Center, New Delhi-110017
011-60050116; 9654309003
[email protected], [email protected]
37 Subhash Kabini Power Corp. Ltd
IV
Mfar Silverline Techpark, 2nd Floor,Plot No. - 180, EPIP Zone - 2nd Phase, Whitefield, Bangalore - 560066
080-41229491
38 Suryachakar Power (P) Corp. Ltd.
IV
Suryachakra Power Corporation Limited, Plot no: 304-L-III, Road No.78, Film Nagar, Jubilee Hills, Hyderabad – 500096
91-40-30823000; 91-40-23550597/98
39 Tata Power Trading Company (P) Ltd
I
Tata Power Trading Company Ltd., C - 43, Sector 62, Noida 201 307, Uttar Pradesh, India
91-120-6663000
40 Vandana Vidhyut Ltd IV
Vandana Bhawan;M. G.Road,Raipur-492001,Chhattisgarh
0771-4006000
41 Vedprakash Power Private Ltd
IV
Vedprakash Power Private Limited, Ground Floor, Ismail Building, D.N Road, Flora Fountain, Mumbai-400001
9711344115 [email protected]
42 VISA Power Trading Company Ltd
IV VISA House, 8/10, Alipore Road, Kolkata - 700027
91-33-30119000

Report on Short-term Power Market in India, 2013-14 Page 67
Annexure-II
Historic Volatility Calculation Volatility = Standard deviation of daily prices returns.
1. Daily prices returns = Ln (y i / yi-1).
2. y i is price today; y i-1 is price on previous day.
3. Ln is natural logarithm
4. n is the number of observations
5. u is the average daily returns
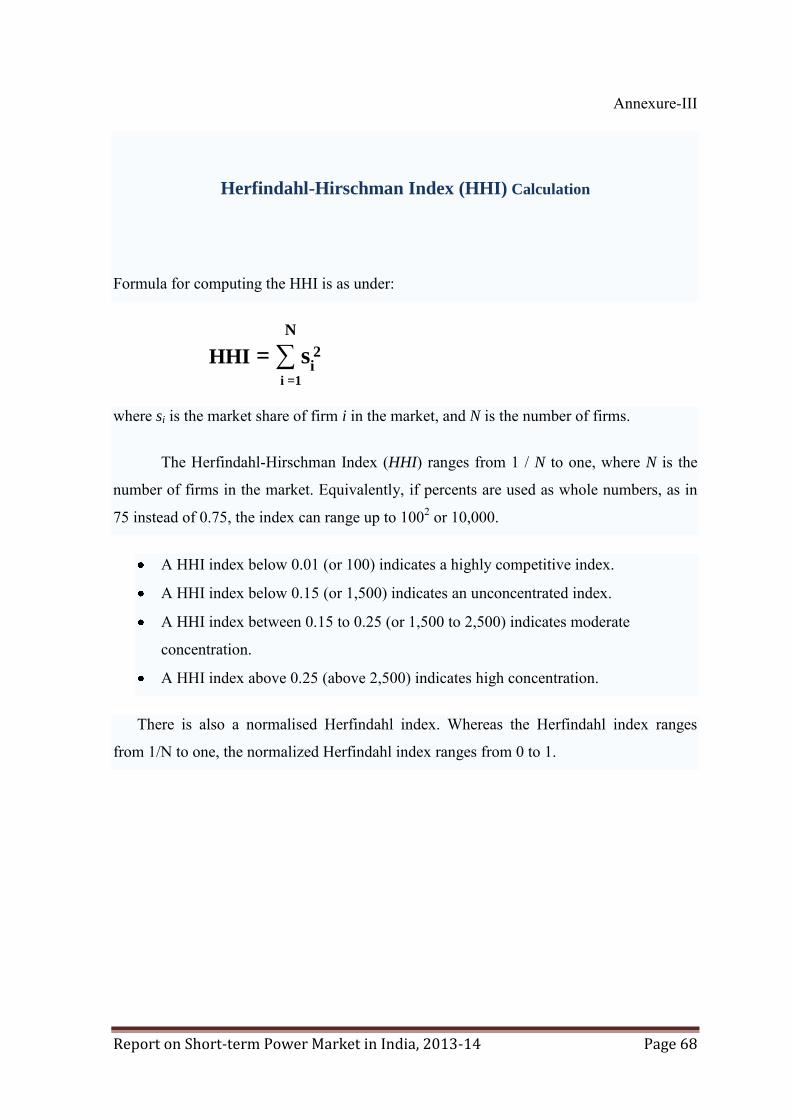
Report on Short-term Power Market in India, 2013-14 Page 68
Annexure-III
Herfindahl-Hirschman Index (HHI) Calculation
Formula for computing the HHI is as under:
N
HHI = ∑ si2
i =1
where si is the market share of firm i in the market, and N is the number of firms.
The Herfindahl-Hirschman Index (HHI) ranges from 1 / N to one, where N is the
number of firms in the market. Equivalently, if percents are used as whole numbers, as in
75 instead of 0.75, the index can range up to 1002 or 10,000.
A HHI index below 0.01 (or 100) indicates a highly competitive index.
A HHI index below 0.15 (or 1,500) indicates an unconcentrated index.
A HHI index between 0.15 to 0.25 (or 1,500 to 2,500) indicates moderate
concentration.
A HHI index above 0.25 (above 2,500) indicates high concentration.
There is also a normalised Herfindahl index. Whereas the Herfindahl index ranges
from 1/N to one, the normalized Herfindahl index ranges from 0 to 1.