Embed Size (px)
Citation preview

Report onSalinity Investigation and Management Plan
Tranches 7, 8 and Anthony ReserveOran Park
Prepared forLandcom
Project 40740.99June 2011


Salinity Assessment and Salinity Management Plan Project 40740.99 Tranches 7, 8 and Anthony Reserve, Oran Park June 2011
Table of Contents
Page
1. Introduction ...................................................................................................................... 1
2. Scope of Works ............................................................................................................... 1
3. Background Information .................................................................................................. 2
4. Site Description and Regional Geology ........................................................................... 3 4.1 Site Identification ................................................................................................ 3 4.2 Site Description ................................................................................................... 3
5. Geology and Hydrogeology ............................................................................................. 3
6. Classification ................................................................................................................... 4 6.1 Salinity ................................................................................................................ 4 6.2 Aggressivity ........................................................................................................ 5 6.3 Sodicity ............................................................................................................... 6
7. Fieldwork ......................................................................................................................... 6
8. Results ............................................................................................................................ 7 8.1 Test Pit Excavation and Site Inspection.............................................................. 7 8.2 Laboratory Testing and Assessment .................................................................. 7 8.3 Spatial Analysis ................................................................................................ 11
9. Proposed Development ................................................................................................. 11
10. Salinity Management Plan ............................................................................................. 12
11. Additional Recommendations and Conclusion .............................................................. 14
12. Limitations ..................................................................................................................... 14
Appendix A: About this Report
Appendix B: Extracts from Land Capability Report (40740)
Appendix C: Drawings (1 – 4)
Appendix D: Test Pit Logs
Appendix E: Laboratory Summary Results
Appendix F: NATA Laboratory Report
Appendix G: Bulk Earthworks Plan

Page 1 of 15
Salinity Assessment and Salinity Management Plan Project 40740.99 Tranches 7, 8 and Anthony Reserve, Oran Park June 2011
Report on Salinity Investigation and Management Plan
Tranches 7, 8 and Anthony Reserve
Oran Park
1. Introduction
This report presents the results of a salinity investigation and provides a salinity management plan for Tranches 7, 8 and Anthony Reserve at Oran Park. The combined area is approximately 30 hectares which is herein referred to as "the Site". The work was commissioned by Landcom. Saline soils affect much of the Western Sydney Region. Buildings and infrastructure located on shales of the Wianamatta Group are particularly at risk. Salinity can affect urban structures in a number of ways, including corrosion of concrete, break down of bricks and mortar, corrosion of steel (including reinforcement), break up of roads, attack on buried infrastructure, reduced ability to grow vegetation and increased erosion potential. It is understood that a residential subdivision is proposed and that an assessment of soil salinity is required for submission to Camden Council with the subdivision application and to assist in conceptual planning of the development. The investigation comprised excavation of test pits, followed by laboratory testing of selected samples, engineering analysis and reporting. Details of the work undertaken and the results obtained are given within this report, together with comments relating to design and construction practice. A site survey plan was provided by the client for the investigation. 2. Scope of Works
The current study includes two parts: 1. A salinity assessment based upon:
Collection of samples at regular depth intervals from 90 test pits;
Inspection of the Site for signs of salinity;
Analysis of electrical conductivity (EC1:5), pH and soil texture on 326 soil samples at a NATA accredited analytical laboratory, for determination of salinity and soil aggressivity;
Laboratory analysis of additional salinity, aggressivity and erodibility indicators, including chloride and sulphate concentrations (50% of samples), sodicities (25% of samples) and Emerson Crumb dispersibilities (5% of samples), at a NATA accredited analytical laboratory;
Assessment of the results with respect to potential for impacts on the development.

Page 2 of 15
Salinity Assessment and Salinity Management Plan Project 40740.99 Tranches 7, 8 and Anthony Reserve, Oran Park June 2011
2. Formation of a Salinity Management Plan (SMP) providing guidance on management methods to reduce the impact of saline materials (if and where found) and based upon:
Review of the salinity investigation results;
Review of the following documents as per Council requirements:
o 'Building in Salinity Prone Environments', Camden Council, 2004;
o 'Map of Salinity Potential in Western Sydney', DNR (2002);
o 'Guidelines to Accompany Map of Salinity Potential in Western Sydney', DNR (2002);
o 'Western Sydney Salinity Code of Practice' (amended January 2004), Rebecca Nicholson for WSROC, DNR and Natural Heritage Trust;
o 'Guide to Residential Slabs and Footings in a Saline Environment', Cement, Concrete and Aggregates, Australia (2005);
o 'Introduction to Urban Salinity', DNR (2003);
o 'Building in a Saline Environment' DNR (2003);
o 'Roads and Salinity', DNR (2003);
o 'Indicators of Urban Salinity', DNR (2002);
o 'Site Investigations for Urban Salinity', DNR (2002);
o 'Urban Salinity Processes', DNR (2004);
o 'Waterwise Parks and Gardens', DNR (2004); and
o 'Broad Scale Resources for Urban Salinity Assessment' DNR (2002). 3. Background Information
A previous investigation within the subject Site and its immediate surrounds was undertaken by Douglas Partners Pty Ltd in 2006 as part of the land capability assessment of the Oran Park Precinct. The results of the investigation were formalised in a report entitled "Report on Land Capability and Contamination Assessment, Oran Park Precinct, Oran Park and Cobbitty" (Project 40740) dated 28 February 2007. The investigation comprised site history searches, site inspection, non-intrusive and intrusive site investigation, laboratory testing of selected samples, engineering analysis and reporting. An electromagnetic (EM) survey was undertaken, and results were assessed taking into account salinity analyses on 218 samples from 176 test pits (with 11 test pits which lie within the Site boundary) throughout the Oran Park Precinct. Soils in the area of the Site were identified generally as non-saline to very saline with a highly saline result in the north-western corner of Anthony Reserve. Extracts of maps from the Land Capability Assessment showing sampling locations and findings (including Tranche 7, 8 and Anthony Reserve) are provided in Appendix B.

Page 3 of 15
Salinity Assessment and Salinity Management Plan Project 40740.99 Tranches 7, 8 and Anthony Reserve, Oran Park June 2011
4. Site Description and Regional Geology
4.1 Site Identification
The Site is identified as follows:
Tranche 7 is identified as Part 992 D.P. 1149179 and Part 3155 D.P. 1159092 and has an approximate area of 16.3 ha;
Tranche 8 is identified as Part 3155 D.P. 1159092 and Part 3156 D.P. 115902 and has an approximate area of 7.6 ha;
Anthony Reserve is identified as Part 992 D.P. 1149179 and has an approximate area of 5.7 ha. All three portions of the Site are located in the northern section of the Oran Park Precinct. The Site location is shown on Drawing 1, Appendix C. It is understood, however, that the Lots and D.P. identifiers are in the process of being redefined and up-dated as part of the redevelopment process for the larger Oran Park Precinct.
4.2 Site Description
The Site is a part of three paddocks which are used for cattle grazing and at the time of the investigation the Site was grass covered. There are two drainage lines located within the Site:
A north south drainage line running along the Anthony Reserve eastern boundary, through the centre of Tranche 8 and curving to the west along the southern boundary of Tranche 7; and
A south-west to north-east drainage line forming the north-western boundary of Anthony reserve. Bare earth was noted within the north-eastern corner of Tranche 7 and also along the drainage line in the south of Tranche 7. 5. Geology and Hydrogeology
Reference to the Wollongong – Port Hacking and Penrith 1:100 000 Geological Series Sheets indicates that the Site is underlain by Bringelly Shale (mapping unit Rwb) of the Wianamatta Group of Triassic age. This formation typically comprises shale, carbonaceous claystone, laminite and some minor coaly bands. Alluvial sediment of Quaternary age is also shown to be located in the far north of Anthony Reserve and consists of fine grain sand, silts and clays. The results of the investigation were consistent with the geological mapping, with shale encountered in the pits that intersected rock. The published mapping also indicates the strata is gently deformed by the Camden Syncline which is aligned approximately north-south to the west of the Oran Park Precinct, with the axis located near the alignment of The Northern Road.

Page 4 of 15
Salinity Assessment and Salinity Management Plan Project 40740.99 Tranches 7, 8 and Anthony Reserve, Oran Park June 2011
Additional reference to the Map of Salinity Potential in Western Sydney indicates that the Site is predominantly located in an area of "moderate salinity potential" where "saline areas may occur .... which have not yet been identified or may occur if risk factors change adversely". However along both the north-south and east-west drainage lines it is indicated to comprise a zone of "high salinity potential". The classification is based on the landform and geology which comprises alluvial terraces and drainage lines in Quaternary alluvium. It is noted that due to the resolution at the scale of the mapping, it is not possible to delineate the zone boundaries with precision. McNally (2005) describes some general features of the hydrogeology of Western Sydney which are relevant to this Site. The shale terrain of much of Western Sydney is known for saline groundwater, resulting either from the release of connate salt in shales of marine origin or from the accumulation of windblown sea salt. Seasonal groundwater level changes of 1 – 2 m can occur in a shallow regolith aquifer or a deeper shale aquifer due to natural influences. Groundwater investigations undertaken by DP in the Camden area and previous studies of areas underlain by the Wianamatta Group and Quaternary river alluvium indicate that:
the shales have a very low intrinsic permeability, hence groundwater flow is likely to be dominated by fracture flow with resultant low yields (typically < 1 L/s) in bores; and
the groundwater in the Wianamatta Group is typically brackish to saline with total dissolved solids (TDS) in the range 4000 – 5000 mg/L (but with cases of TDS up to 31750 mg/L being reported). The dominant ions are typically sodium and chloride and the water being generally unsuitable for livestock or irrigation.
6. Classification
6.1 Salinity
Soil salinity is often assessed with respect to electrical conductivity of a 1:5 soil:water extract (EC 1:5). This value can be converted to ECe (electrical conductivity of a saturated extract) by multiplication with a factor dependent of soil texture ranging from 6 to 17 depending on soil type. Richards (1954) and Hazelton and Murphy (1992) classify soil salinity on the basis of ECe, and describe the implications of the salinity classes on agriculture as provided in Table 1. Table 1: Soil Salinity Classification
Class ECe (dS/m) Implication
Non-saline < 2 Salinity effects mostly negligible
Slightly Saline 2 – 4 Yields of sensitive crops affected
Moderately Saline 4 – 8 Yields of many crops affected
Very Saline 8 – 16 Only tolerant crops yield satisfactorily
Highly Saline > 16 Only a few very tolerant crops yield satisfactorily
Note: This classification scheme is based on agricultural sensitivity. At this point in time no structure-based classification system exists.

Page 5 of 15
Salinity Assessment and Salinity Management Plan Project 40740.99 Tranches 7, 8 and Anthony Reserve, Oran Park June 2011
Apparent conductivity, obtained from the EM Survey, is variously referred to as ground conductivity, terrain conductivity, bulk conductivity or bulk electrical conductivity and is generally designated as a or ECa. Although measurement of apparent conductivities can include contributions from a variety of sources, including groundwater, conductive soil, and rock minerals and metals, it has been estimated (Baden Williams in Spies and Woodgate, 2004) that in 75 – 90% of cases in Australia, apparent conductivity anomalies can be explained by the presence of soluble salts. Apparent conductivity can therefore be considered, in the majority of cases, as a good indicator of soil salinity. Most portable instruments measure apparent conductivity in milliSiemens per metre (mS/m) and typical measurement ranges (Table 2) have been suggested as indicative of salinity classes (Chhabra 1996). Table 2: Salinity Classes in Relation to Apparent Conductivity
Class ECa (mS/m)
Non-saline < 50
Slightly Saline 50 – 100
Moderately Saline 100 – 150
Very Saline 150 – 200
Extremely Saline > 200
6.2 Aggressivity
Tables 3 and 4, after AS 2159 – 2009 Piling Design and Installation (Standards Australia), were used to classify the soils for aggressivity. Table 3: Exposure Classification for Concrete piles
Exposure conditions Exposure Classification (Aggressivity)
Sulfates SO3
% in soil pH
Chlorides ppm (in water)
Soil conditions – B (low permeability soils such as silts and clays)
< 0.5 > 5.5 < 6000 Non-aggressive
0.5 – 1.0 4.5 – 5.5 6000 – 12000 Mild
1.0 – 2.0 4 – 4.5 12000 – 30000 Moderate
> 2.0 < 4 > 30000 Severe

Page 6 of 15
Salinity Assessment and Salinity Management Plan Project 40740.99 Tranches 7, 8 and Anthony Reserve, Oran Park June 2011
Table 4: Exposure Classification for Steel piles
Exposure conditions Exposure Classification (Aggressivity)
Chlorides % in Soil
pH Resistivity
Ohms
Soil conditions – B (low permeability soils such as silts and clays)
< 0.5 > 5 > 5000 Non-aggressive
0.5 – 2.0 4 – 5 2000 – 5000 Non-aggressive
2.0 – 5.0 3-4 1000 – 2000 Mild
> 5.0 < 3 < 1000 Moderate
Note: In this assessment, resistivities are calculated by inversion of the EC 1:5 results.
6.3 Sodicity
The sodicity of soil (proportion of exchangeable sodium cations as a percentage of total exchangeable cations) can be elevated due to salt content and can affect properties such as dispersion, erodibility and permeability. Sodic soils may be affected by very severe surface crusting, very low infiltration and hydraulic conductivity, very hard and dense subsoils, high susceptibility to gully erosion and tunnel erosion. Sodicity also affects the shrink – swell properties of a soil. The general rating of sodicity (after McNally, 2005) is given in Table 5. Table 5: Sodicity Rating
ESP% Rating
< 5 Non-sodic
5 – 15 Sodic
> 15 Highly sodic
7. Fieldwork
The current field work comprised the excavation of 90 test pits, to depths of up to 3 m, with a Komatsu WB97R backhoe fitted with a 450 mm bucket. The pits were logged on site by a geo-environmental engineer, who collected representative disturbed samples to assist in strata identification and for laboratory testing. At the conclusion of each test pit, the surface was reinstated to its previous level. The approximate locations of the field tests are shown on Drawing 1 (Appendix C). The surface levels shown on the test pit logs were determined by contour interpolation from the survey plan provided for the investigation and as such, are approximate only.

Page 7 of 15
Salinity Assessment and Salinity Management Plan Project 40740.99 Tranches 7, 8 and Anthony Reserve, Oran Park June 2011
8. Results
8.1 Test Pit Excavation and Site Inspection
The test pit logs are included in Appendix D, together with notes defining classification methods and descriptive terms. Relatively uniform conditions were encountered underlying the Site, comprising topsoil to depths of 0.45 m; overlying clays, silty clays and gravelly clays in excess of 3 m; overlying extremely weathered, extremely low strength shales with increasing strength with depth. Free groundwater was observed in TP 3, 4 and 6 at depths of 3.2 m, 3.1 m and 2.5 m respectively. No signs of efflorescence were noted during the inspection. The change in observed salt impact from the previous assessments may result from recent wet weather, which would have acted to dissolve the surface salt. Possible salt scalding or bare ground was noted in the north-east corner of Tranche 7.
8.2 Laboratory Testing and Assessment
Selected samples were tested for electrical conductivity (EC1:5), pH, chloride and sulphate concentrations, exchangeable sodium (Na) and CEC (cation exchange capacity). A summary of laboratory results is provided in Appendix E and NATA laboratory reports are provided in Appendix F, with summary statistics provided in Tables 6 and 7 (below and following page). Table 6: Summary of Test Results
Parameter Units Samples Minimum Maximum
pH pH units 326 4.6 8.9
Chlorides (mg/kg) 158 9.7 3481
Sulphates (mg/kg) 158 <20 430
Aggressivity to Concrete [AS2159] - non-aggressive mild
to Steel [AS2159] - non-aggressive moderate
Exchangeable Sodium (Na) (meq/100g) 83 0.1 7.7
Cation Exchange Capacity (meq/100g) 83 1 23
Sodicity [Na/CEC] (ESP%) 83 1.9 58
Sodicity Class [after DLWC] - non-sodic highly sodic
EC1:5 [Lab.] (mS/cm) 326 20 1900
Resistivity Ω.cm 326 526.3 50000
ECe [M x EC1:5] 1 (dS/m) - 0 18
Salinity Class [Richards 1954] - non-saline highly saline
1 M is soil textural group factor

Page 8 of 15
Salinity Assessment and Salinity Management Plan Project 40740.99 Tranches 7, 8 and Anthony Reserve, Oran Park June 2011
Table 7: Salinity Class Distribution
Salinity Class ECe (dS/m) Number of Samples 1
Percentage of Measurements
non-saline < 2 148 45.4
slightly saline 2 – 4 62 19.0
moderately saline 4 – 8 84 25.8
very saline 8 – 16 30 9.2
highly saline > 16 2 0.6
Total - 326 100%
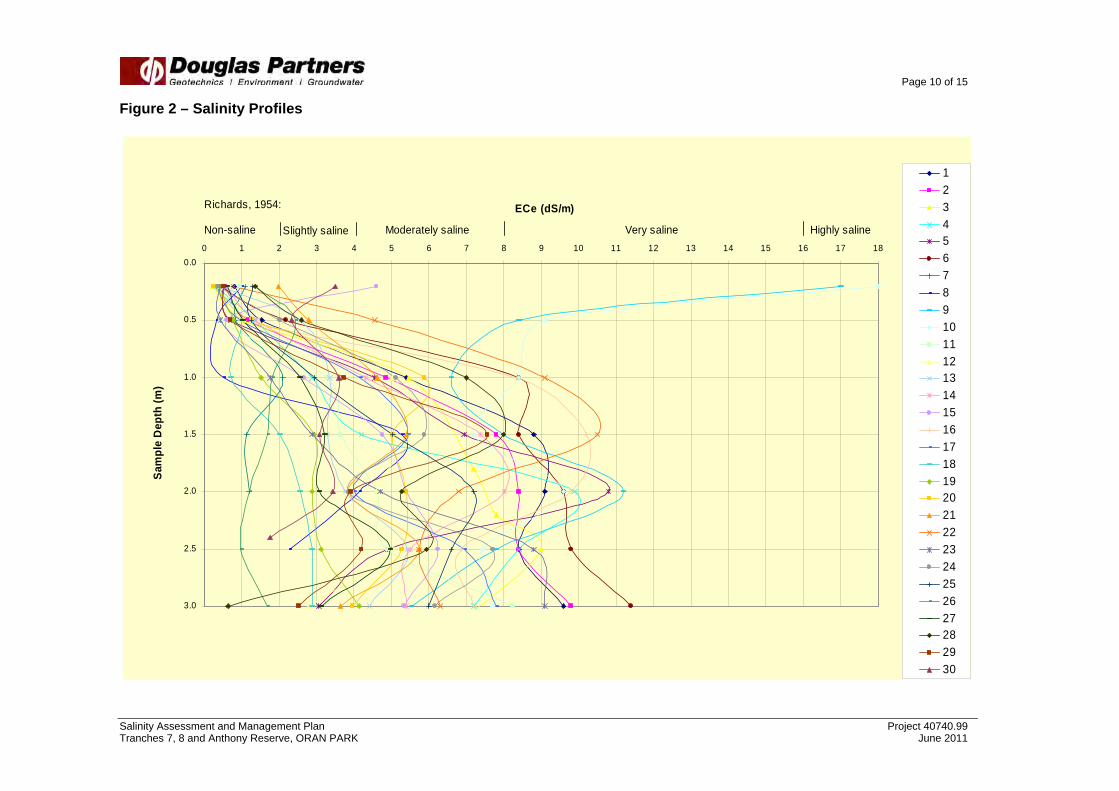
The results of the Emerson crumb tests (uniformly Emerson Class Number 4) indicate that the soils tested are non-dispersive. Figures 1 to 2 (following pages) show the distributions of pH and salinity in the soil profiles. In general, from Appendix D, Tables 6 and 7 and Figures 1 and 2, the following assessmentsd were made:
pH for the samples ranged from 4.6 to 8.9, and generally became neutral to slightly basic with depth;
Based on pH criteria (AS 2159 – 2009) samples were classified as non-aggressive to mildly aggressive to concrete;
Samples were classified as non-aggressive to moderately aggressive to steel, with all mild and moderate samples being deep samples (ie: below 0.5 m) with the exception of two pits (TP 9 and TP 10) which had both mild and moderate aggressivity to steel at depths of 0.2 m and 0.5 m;
Sodicities were within the non-sodic to highly sodic range, with the majority of the samples highly sodic;
Samples from two pits (TP 9 and TP 10) were highly saline at a depth of 0.2 m bgl. These samples were collected from test pits located on a saline scald;
Samples from 12 pits (TP 1, 2, 3, 4, 5, 6, 9, 10, 14, 16, 27 and 23) were very saline, generally within the depth range of 1.0 m to 3.0 m bgl; with the exception of samples collected at TP 9 and 10 which were very saline at a depths of 0.5 m; and
Salinities from the remainder of the Site were all within the non-saline to moderately saline classes.
The results of the current investigation are similar to results from previous investigations in the vicinity of the Site, where very saline soils were noted in the vicinity of the north-south and east-west drainage lines.

Page 9 of 15
Salinity Assessment and Management Plan Project 40740.99 Tranches 7, 8 and Anthony Reserve, ORAN PARK June 2011
Figure 1 – pH Profiles
0.0
0.5
1.0
1.5
2.0
2.5
3.0
1 2 3 4 5 6 7 8 9 10 11 12 13 14
Sam
ple
Dep
th (
m)
1
2
3
4
5
6
7
8
9
10
11
12
13
14
15
16
17
18
19
20
21
22
23
24
25
26
27
28
29
30
pHAggressivity to concrete : Severe Mod Mild Non
Aggressivity to steel Mild NonModerate
AS2159 - 2009
Page 10 of 15
Salinity Assessment and Management Plan Project 40740.99 Tranches 7, 8 and Anthony Reserve, ORAN PARK June 2011
Figure 2 – Salinity Profiles
0.0
0.5
1.0
1.5
2.0
2.5
3.0
0 1 2 3 4 5 6 7 8 9 10 11 12 13 14 15 16 17 18
ECe (dS/m)
Sam
ple
Dep
th (
m)
1
2
3
45
6
7
8
9
10
11
1213
14
15
16
17
18
1920
21
22
23
24
25
26
2728
29
30
Non-saline Slightly saline Moderately saline Very saline Highly saline
Richards, 1954:

Page 11 of 15
Salinity Assessment and Management Plan Project 40740.99 Tranches 7, 8 and Anthony Reserve, ORAN PARK June 2011
8.3 Spatial Analysis
The results in this assessment were generally consistent with the land capability assessment results but provided additional detail specific to Tranche 7, Tranche 8 and Anthony Reserve. Minor differences occur between the mapped 2006 and 2011 distributions of aggressivity and salinity, related largely to the change in standard for aggressivity
1 and to the refinement of the salinity mapping due to the additional test pitting information. Due to the extent of the bulk earthworks to be conducted within the Site, a worst case scenario was used to classify the extent of salinity and aggressivity within the Site. This was achieved by utilising a maxima/minima analysis within the depth zone of 0 – 3 m. Drawing 2 (Appendix C) shows the expected distribution of aggressivity to concrete over the entire site, assuming completion of earthworks (Cut / Fill) as proposed, including the import of mildly aggressive material from Tranche 3. Soils throughout the site have been classified as mildly aggressive to concrete within the depth zone 0 – 3 m. Drawing 3 (Appendix C) shows areas classified as highly saline (ECe > 16dS/m), very saline (8 – 16 dS/m), moderately saline (4 – 8 dS/m), slightly saline (2 – 4 dS/m) and non-saline within the site, within depths of 0 – 3 m. Moderately saline and very saline soils dominate the salinity distribution within the Site. Drawing 4 (Appendix C) shows areas of the Site where soil is classified as mildly aggressive (1000 – 2000 Ohm-cm) and moderately aggressive (< 1000 Ohm-cm) to steel, within depths of 0 – 3 m. 9. Proposed Development
It is understood that the proposed development comprises residential allotments and roadways. The bulk earthworks plan is included in Appendix G and shows that 1.5 m of cut is required. The locations requiring cut are situated within the western portion of the Site and within a small area near the eastern boundary. Fill is required over the majority of the remainder of the Site.
1 In the land capability assessment, aggressivity was defined using AS 2159 – 1995, whereas in the current assessment aggressivity was defined using the AS 2159 – 2009. The latter standard extends the classification for mild aggressivity to concrete to soils with a pH up to 5.5 units, thereby incorporating some soils previously classified as non-aggressive to concrete. It should also be noted that aggressivity to steel was also calculated using the calculated resistivity of the soil within this assessment, whereas previous assessments based aggressivity to steel purely on the pH of the soil.

Page 12 of 15
Salinity Assessment and Management Plan Project 40740.99 Tranches 7, 8 and Anthony Reserve, ORAN PARK June 2011
10. Salinity Management Plan
This salinity investigation classifies soils within the depth zone 0 – 3 m as non-saline to highly saline. Testing of other parameters associated with salinity indicates that the soils are non-aggressive to moderatly aggressive to steel (by the resistivity and chloride criteria of AS2159) and mildly aggressive to concrete over the entire site (by the pH and sulphate criteria of AS2159). In addition, shallow soils range from non-sodic to highly sodic but with no observed dispersion potential. The following management strategies are confined to the management of those factors with a potential to impact on the development, namely: moderately saline to highly saline soils; mild aggressivity to concrete and mild to moderate aggressivity to steel. A. Management should focus on capping of the upper surface of the sodic soils, both exposed by
excavation and placed as filling, with a more permeable material to prevent ponding, to reduce capillary rise, to act as a drainage layer and to reduce the potential for erosion.
B. When possible placement of excavated soils in fill areas in areas with similar salinity characteristics (ie: to place material on to in-situ soils with a similar or higher aggressivity or salinity classification). With respect to imported fill material, testing should be undertaken prior to importation, to determine the salinity characteristics of the material.
C. Sodic soils can also be managed by maintaining vegetation where possible and planting new salt tolerant species. The addition of organic matter, gypsum and lime can also be considered where appropriate. After gypsum addition, reduction of sodicity levels may require some time for sufficient infiltration and leaching of sodium into the subsoils, however capping of exposed sodic material should remain the primary management method. Topsoil added at the completion of bulk earthworks is, in effect, also adding organic matter which may help infiltration and leaching of sodium.
D. Avoiding water collecting in low lying areas, in depressions, or behind fill. This can lead to water logging of the soils, evaporative concentration of salts, and eventual breakdown in soil structure resulting in accelerated erosion.
E. Any pavements should be designed to be well drained of surface water. There should not be excessive concentrations of runoff or ponding that would lead to waterlogging of the pavement or additional recharge to the groundwater through any more permeable zones in the underlying filling material.
F. Surface drains should generally be provided along the top of batter slopes to reduce the potential for concentrated flows of water down slopes possibly causing scour.
G. Salt tolerant grasses and trees should be considered for landscaping, to reduce soil erosion as in Strategy A above and to maintain the existing evapo-transpiration and groundwater levels. Reference should be made to an experienced landscape planner or agronomist.
The following additional strategies are recommended for completion of services installation and for house construction. These strategies should be complementary to standard good building practices recommended within the Building Code of Australia, including cover to reinforcement within concrete and correct installation of a brick damp course, so that it cannot be bridged to allow moisture to move into brick work and up the wall.

Page 13 of 15
Salinity Assessment and Management Plan Project 40740.99 Tranches 7, 8 and Anthony Reserve, ORAN PARK June 2011
H. Where soils are classified as non-aggressive to concrete, piles should nevertheless have a minimum strength of 32 MPa and a minimum cover to reinforcement of 45 mm (as per AS2159) to limit the corrosive effects of the surrounding soils (in accordance with AS2159).
I. Where soils are classified as mildly aggressive to concrete, piles should have a minimum strength of 32 MPa and a minimum cover to reinforcement of 60 mm (as per AS2159) to limit the corrosive effects of the surrounding soils (in accordance with AS2159)..
J. With regard to concrete structures, for soils with salinities less than 4 dS/m (refer Drawing 3):
o Where soils are classified as non aggressive to concrete (Drawing 2), slabs and foundations should have a minimum strength of 20 MPa, and should be allowed to cure for a minimum of three days (as per AS3600) to limit the corrosive effects of the surrounding soils; and
o Where soils are classified as mildly aggressive to concrete (Drawing 2), slabs and foundations should have a minimum strength of 25 MPa, and should be allowed to cure for a minimum of three days (as per AS3600) to limit the corrosive effects of the surrounding soils.
K. For soils with salinities of 4 – 8 dS/m (Drawing 3) slabs and foundations should have a minimum strength of 25 MPa, a minimum cover to reinforcement of 45 mm from unprotected ground and should be allowed to cure for a minimum of three days (as per AS3600) to limit the corrosive effects of the surrounding soils.
L. For soils with salinities of 8 - 16 dS/m (Drawing 3) concrete structures should have a minimum strength of 32 MPa, a minimum cover to reinforcement of 50 mm from unprotected ground and should be allowed to cure for a minimum of seven days (as per AS3600) to limit the corrosive effects of the surrounding soils.
M. For soils with salinities of >16 dS/m (Drawing 3) concrete structures should have a minimum strength of 40 MPa, a minimum cover to reinforcement of 55 mm from unprotected ground and should be allowed to cure for a minimum of seven days (as per AS3600) to limit the corrosive effects of the surrounding soils.
N. Any future installation of concrete pipes, in the defined areas of moderately saline or mildly aggressive soil at services depths, should employ FRC pipes. Alternatively, concrete pipes in these areas should be encased in outer PVC conduits or should have a minimum equivalent strength as defined in K above.
O. Any future installation of concrete pipes, in the defined areas of very and highly saline soil at services depths, should employ FRC pipes. Alternatively, concrete pipes in these areas should be encased in outer PVC conduits or should have a minimum equivalent strength as defined in L and M above.

Page 14 of 15
Salinity Assessment and Management Plan Project 40740.99 Tranches 7, 8 and Anthony Reserve, ORAN PARK June 2011
P. Resistivity results indicate soils that are aggressive to steel (Drawing 4, Appendix C). This drawing identifies mild aggressivity to steel (1000 – 2000 Ohm-cm) over the site and identifies the area of moderate aggressivity to steel (< 1000 Ohm-cm). For these areas of soil identified as mildly or moderately aggressive to steel, the following corrosion allowances (as per AS 2159 – 2009) should be taken into account by the designer:
o Mild: uniform corrosion allowance 0.01 – 0.02 mm/year; and
o Moderate: uniform corrosion allowance 0.02 – 0.04 mm/year.
In instances where a coating is applied to the pile, if the design life of the pile is greater than the design life for the coating, consideration must be given to corrosion of the pile in accordance with the above list.
11. Additional Recommendations and Conclusion
If changes to the bulk earthworks levels are made additional investigation should be undertaken in development areas which are to be excavated deeper than 3 m, where direct sampling and testing of salinity has not been carried out. Salinity management strategies herein may need to be modified or extended following additional investigations by deep test pitting and/or drilling, sampling and testing for soil and water pH, electrical conductivity, TDS, sodicity, sulphates and chlorides. Such works, if required, could be conducted when final cut and fill requirements have been determined. It is considered that the management strategies described herein when incorporated into the design and construction works are appropriate to mitigate the levels of salinity, aggressivity and sodicity identified at the Site. 12. Limitations
Douglas Partners Pty Ltd (DP) has prepared this report for a project at Tranches 7, 8 and Anthony Reserve, Oran Park, NSW in accordance with DP's proposal dated 5 January 2011 and acceptance received from Mr Greg Poole of Landcom. The report is provided for the exclusive use of Landcom for this project only and for the purpose(s) described in the report. It should not be used for other projects or by a third party. In preparing this report DP has necessarily relied upon information provided by the client and/or their agents. The results provided in the report are indicative of the subsurface conditions only at the specific sampling or testing locations, and then only to the depths investigated and at the time the work was carried out. Subsurface conditions can change abruptly due to variable geological processes and also as a result of anthropogenic influences. Such changes may occur after DP's field testing has been completed. DP's advice is based upon the conditions encountered during this investigation. The accuracy of the advice provided by DP in this report may be limited by undetected variations in ground conditions between sampling locations. The advice may also be limited by budget constraints imposed by others or by site accessibility.

Page 15 of 15
Salinity Assessment and Management Plan Project 40740.99 Tranches 7, 8 and Anthony Reserve, ORAN PARK June 2011
This report must be read in conjunction with all of the attached notes and should be kept in its entirety without separation of individual pages or sections. DP cannot be held responsible for interpretations or conclusions made by others unless they are supported by an expressed statement, interpretation, outcome or conclusion given in this report.
Douglas Partners Pty Ltd

Appendix A
About this Report
July 2010
Introduction These notes have been provided to amplify DP's report in regard to classification methods, field procedures and the comments section. Not all are necessarily relevant to all reports. DP's reports are based on information gained from limited subsurface excavations and sampling, supplemented by knowledge of local geology and experience. For this reason, they must be regarded as interpretive rather than factual documents, limited to some extent by the scope of information on which they rely. Copyright This report is the property of Douglas Partners Pty Ltd. The report may only be used for the purpose for which it was commissioned and in accordance with the Conditions of Engagement for the commission supplied at the time of proposal. Unauthorised use of this report in any form whatsoever is prohibited. Borehole and Test Pit Logs The borehole and test pit logs presented in this report are an engineering and/or geological interpretation of the subsurface conditions, and their reliability will depend to some extent on frequency of sampling and the method of drilling or excavation. Ideally, continuous undisturbed sampling or core drilling will provide the most reliable assessment, but this is not always practicable or possible to justify on economic grounds. In any case the boreholes and test pits represent only a very small sample of the total subsurface profile. Interpretation of the information and its application to design and construction should therefore take into account the spacing of boreholes or pits, the frequency of sampling, and the possibility of other than 'straight line' variations between the test locations.
Groundwater Where groundwater levels are measured in boreholes there are several potential problems, namely: • In low permeability soils groundwater may
enter the hole very slowly or perhaps not at all during the time the hole is left open;
• A localised, perched water table may lead to an erroneous indication of the true water table;
• Water table levels will vary from time to time with seasons or recent weather changes. They may not be the same at the time of construction as are indicated in the report; and
• The use of water or mud as a drilling fluid will mask any groundwater inflow. Water has to be blown out of the hole and drilling mud must first be washed out of the hole if water measurements are to be made.
More reliable measurements can be made by installing standpipes which are read at intervals over several days, or perhaps weeks for low permeability soils. Piezometers, sealed in a particular stratum, may be advisable in low permeability soils or where there may be interference from a perched water table.
Reports The report has been prepared by qualified personnel, is based on the information obtained from field and laboratory testing, and has been undertaken to current engineering standards of interpretation and analysis. Where the report has been prepared for a specific design proposal, the information and interpretation may not be relevant if the design proposal is changed. If this happens, DP will be pleased to review the report and the sufficiency of the investigation work. Every care is taken with the report as it relates to interpretation of subsurface conditions, discussion of geotechnical and environmental aspects, and recommendations or suggestions for design and construction. However, DP cannot always anticipate or assume responsibility for: • Unexpected variations in ground conditions.
The potential for this will depend partly on borehole or pit spacing and sampling frequency;
• Changes in policy or interpretations of policy by statutory authorities; or
• The actions of contractors responding to commercial pressures.
If these occur, DP will be pleased to assist with investigations or advice to resolve the matter.

July 2010
Site Anomalies In the event that conditions encountered on site during construction appear to vary from those which were expected from the information contained in the report, DP requests that it be immediately notified. Most problems are much more readily resolved when conditions are exposed rather than at some later stage, well after the event.
Information for Contractual Purposes Where information obtained from this report is provided for tendering purposes, it is recommended that all information, including the written report and discussion, be made available. In circumstances where the discussion or comments section is not relevant to the contractual situation, it may be appropriate to prepare a specially edited document. DP would be pleased to assist in this regard and/or to make additional report copies available for contract purposes at a nominal charge. Site Inspection The company will always be pleased to provide engineering inspection services for geotechnical and environmental aspects of work to which this report is related. This could range from a site visit to confirm that conditions exposed are as expected, to full time engineering presence on site.

July 2010
Sampling Sampling is carried out during drilling or test pitting to allow engineering examination (and laboratory testing where required) of the soil or rock. Disturbed samples taken during drilling provide information on colour, type, inclusions and, depending upon the degree of disturbance, some information on strength and structure. Undisturbed samples are taken by pushing a thin-walled sample tube into the soil and withdrawing it to obtain a sample of the soil in a relatively undisturbed state. Such samples yield information on structure and strength, and are necessary for laboratory determination of shear strength and compressibility. Undisturbed sampling is generally effective only in cohesive soils. Test Pits Test pits are usually excavated with a backhoe or an excavator, allowing close examination of the in-situ soil if it is safe to enter into the pit. The depth of excavation is limited to about 3 m for a backhoe and up to 6 m for a large excavator. A potential disadvantage of this investigation method is the larger area of disturbance to the site.
Large Diameter Augers Boreholes can be drilled using a rotating plate or short spiral auger, generally 300 mm or larger in diameter commonly mounted on a standard piling rig. The cuttings are returned to the surface at intervals (generally not more than 0.5 m) and are disturbed but usually unchanged in moisture content. Identification of soil strata is generally much more reliable than with continuous spiral flight augers, and is usually supplemented by occasional undisturbed tube samples. Continuous Spiral Flight Augers The borehole is advanced using 90-115 mm diameter continuous spiral flight augers which are withdrawn at intervals to allow sampling or in-situ testing. This is a relatively economical means of drilling in clays and sands above the water table. Samples are returned to the surface, or may be collected after withdrawal of the auger flights, but they are disturbed and may be mixed with soils from the sides of the hole. Information from the drilling (as distinct from specific sampling by SPTs or undisturbed samples) is of relatively low
reliability, due to the remoulding, possible mixing or softening of samples by groundwater. Non-core Rotary Drilling The borehole is advanced using a rotary bit, with water or drilling mud being pumped down the drill rods and returned up the annulus, carrying the drill cuttings. Only major changes in stratification can be determined from the cuttings, together with some information from the rate of penetration. Where drilling mud is used this can mask the cuttings and reliable identification is only possible from separate sampling such as SPTs.
Continuous Core Drilling A continuous core sample can be obtained using a diamond tipped core barrel, usually with a 50 mm internal diameter. Provided full core recovery is achieved (which is not always possible in weak rocks and granular soils), this technique provides a very reliable method of investigation. Standard Penetration Tests Standard penetration tests (SPT) are used as a means of estimating the density or strength of soils and also of obtaining a relatively undisturbed sample. The test procedure is described in Australian Standard 1289, Methods of Testing Soils for Engineering Purposes - Test 6.3.1. The test is carried out in a borehole by driving a 50 mm diameter split sample tube under the impact of a 63 kg hammer with a free fall of 760 mm. It is normal for the tube to be driven in three successive 150 mm increments and the 'N' value is taken as the number of blows for the last 300 mm. In dense sands, very hard clays or weak rock, the full 450 mm penetration may not be practicable and the test is discontinued. The test results are reported in the following form.
• In the case where full penetration is obtained with successive blow counts for each 150 mm of, say, 4, 6 and 7 as:
4,6,7 N=13
• In the case where the test is discontinued before the full penetration depth, say after 15 blows for the first 150 mm and 30 blows for the next 40 mm as:
15, 30/40 mm

July 2010
The results of the SPT tests can be related empirically to the engineering properties of the soils.
Dynamic Cone Penetrometer Tests / Perth Sand Penetrometer Tests Dynamic penetrometer tests (DCP or PSP) are carried out by driving a steel rod into the ground using a standard weight of hammer falling a specified distance. As the rod penetrates the soil the number of blows required to penetrate each successive 150 mm depth are recorded. Normally there is a depth limitation of 1.2 m, but this may be extended in certain conditions by the use of extension rods. Two types of penetrometer are commonly used.
• Perth sand penetrometer - a 16 mm diameter flat ended rod is driven using a 9 kg hammer dropping 600 mm (AS 1289, Test 6.3.3). This test was developed for testing the density of sands and is mainly used in granular soils and filling.
• Cone penetrometer - a 16 mm diameter rod with a 20 mm diameter cone end is driven using a 9 kg hammer dropping 510 mm (AS 1289, Test 6.3.2). This test was developed initially for pavement subgrade investigations, and correlations of the test results with California Bearing Ratio have been published by various road authorities.

July 2010
Introduction These notes summarise abbreviations commonly used on borehole logs and test pit reports. Drilling or Excavation Methods C Core Drilling R Rotary drilling SFA Spiral flight augers NMLC Diamond core - 52 mm dia NQ Diamond core - 47 mm dia HQ Diamond core - 63 mm dia PQ Diamond core - 81 mm dia
Water Water seep Water level
Sampling and Testing A Auger sample B Bulk sample D Disturbed sample E Environmental sample U50 Undisturbed tube sample (50mm) W Water sample pp pocket penetrometer (kPa) PID Photo ionisation detector PL Point load strength Is(50) MPa S Standard Penetration Test V Shear vane (kPa)
Description of Defects in Rock The abbreviated descriptions of the defects should be in the following order: Depth, Type, Orientation, Coating, Shape, Roughness and Other. Drilling and handling breaks are not usually included on the logs. Defect Type B Bedding plane Cs Clay seam Cv Cleavage Cz Crushed zone Ds Decomposed seam F Fault J Joint Lam lamination Pt Parting Sz Sheared Zone V Vein
Orientation The inclination of defects is always measured from the perpendicular to the core axis. h horizontal v vertical sh sub-horizontal sv sub-vertical Coating or Infilling Term cln clean co coating he healed inf infilled stn stained ti tight vn veneer Coating Descriptor ca calcite cbs carbonaceous cly clay fe iron oxide mn manganese slt silty Shape cu curved ir irregular pl planar st stepped un undulating Roughness po polished ro rough sl slickensided sm smooth vr very rough Other fg fragmented bnd band qtz quartz

July 2010
Graphic Symbols for Soil and Rock General
Soils
Sedimentary Rocks
Metamorphic Rocks
Igneous Rocks
Road base
Filling
Concrete
Asphalt
Topsoil
Peat
Clay
Conglomeratic sandstone
Conglomerate
Boulder conglomerate
Sandstone
Slate, phyllite, schist
Siltstone
Mudstone, claystone, shale
Coal
Limestone
Porphyry
Cobbles, boulders
Sandy gravel
Laminite
Silty sand
Clayey sand
Silty clay
Sandy clay
Gravelly clay
Shaly clay
Silt
Clayey silt
Sandy silt
Sand
Gravel
Talus
Gneiss
Quartzite
Dolerite, basalt, andesite
Granite
Tuff, breccia
Dacite, epidote

July 2010
Description and Classification Methods The methods of description and classification of soils and rocks used in this report are based on Australian Standard AS 1726, Geotechnical Site Investigations Code. In general, the descriptions include strength or density, colour, structure, soil or rock type and inclusions. Soil Types Soil types are described according to the predominant particle size, qualified by the grading of other particles present:
Type Particle size (mm)
Boulder >200
Cobble 63 - 200
Gravel 2.36 - 63
Sand 0.075 - 2.36
Silt 0.002 - 0.075
Clay <0.002 The sand and gravel sizes can be further subdivided as follows:
Type Particle size (mm)
Coarse gravel 20 - 63
Medium gravel 6 - 20
Fine gravel 2.36 - 6
Coarse sand 0.6 - 2.36
Medium sand 0.2 - 0.6
Fine sand 0.075 - 0.2
The proportions of secondary constituents of soils are described as:
Term Proportion Example
And Specify Clay (60%) and Sand (40%)
Adjective 20 - 35% Sandy Clay
Slightly 12 - 20% Slightly Sandy Clay
With some 5 - 12% Clay with some sand
With a trace of 0 - 5% Clay with a trace of sand
Definitions of grading terms used are:
• Well graded - a good representation of all particle sizes
• Poorly graded - an excess or deficiency of particular sizes within the specified range
• Uniformly graded - an excess of a particular particle size
• Gap graded - a deficiency of a particular particle size with the range
Cohesive Soils Cohesive soils, such as clays, are classified on the basis of undrained shear strength. The strength may be measured by laboratory testing, or estimated by field tests or engineering examination. The strength terms are defined as follows:
Description Abbreviation Undrained shear strength
(kPa)
Very soft vs <12
Soft s 12 - 25
Firm f 25 - 50
Stiff st 50 - 100
Very stiff vst 100 - 200
Hard h >200
Cohesionless Soils Cohesionless soils, such as clean sands, are classified on the basis of relative density, generally from the results of standard penetration tests (SPT), cone penetration tests (CPT) or dynamic penetrometers (PSP). The relative density terms are given below:
Relative Density
Abbreviation SPT N value
CPT qc value (MPa)
Very loose vl <4 <2
Loose l 4 - 10 2 -5
Medium dense
md 10 - 30 5 - 15
Dense d 30 - 50 15 - 25
Very dense
vd >50 >25

July 2010
Soil Origin It is often difficult to accurately determine the origin of a soil. Soils can generally be classified as:
• Residual soil - derived from in-situ weathering of the underlying rock;
• Transported soils - formed somewhere else and transported by nature to the site; or
• Filling - moved by man. Transported soils may be further subdivided into:
• Alluvium - river deposits
• Lacustrine - lake deposits
• Aeolian - wind deposits
• Littoral - beach deposits
• Estuarine - tidal river deposits
• Talus - scree or coarse colluvium
• Slopewash or Colluvium - transported downslope by gravity assisted by water. Often includes angular rock fragments and boulders.

July 2010
Rock Strength Rock strength is defined by the Point Load Strength Index (Is(50)) and refers to the strength of the rock substance and not the strength of the overall rock mass, which may be considerably weaker due to defects. The test procedure is described by Australian Standard 4133.4.1 - 1993. The terms used to describe rock strength are as follows:
Term Abbreviation Point Load Index Is(50) MPa
Approx Unconfined Compressive Strength MPa*
Extremely low EL <0.03 <0.6
Very low VL 0.03 - 0.1 0.6 - 2
Low L 0.1 - 0.3 2 - 6
Medium M 0.3 - 1.0 6 - 20
High H 1 - 3 20 - 60
Very high VH 3 - 10 60 - 200
Extremely high EH >10 >200
* Assumes a ratio of 20:1 for UCS to Is(50) Degree of Weathering The degree of weathering of rock is classified as follows:
Term Abbreviation Description
Extremely weathered EW Rock substance has soil properties, i.e. it can be remoulded and classified as a soil but the texture of the original rock is still evident.
Highly weathered HW Limonite staining or bleaching affects whole of rock substance and other signs of decomposition are evident. Porosity and strength may be altered as a result of iron leaching or deposition. Colour and strength of original fresh rock is not recognisable
Moderately weathered
MW Staining and discolouration of rock substance has taken place
Slightly weathered SW Rock substance is slightly discoloured but shows little or no change of strength from fresh rock
Fresh stained Fs Rock substance unaffected by weathering but staining visible along defects
Fresh Fr No signs of decomposition or staining
Degree of Fracturing The following classification applies to the spacing of natural fractures in diamond drill cores. It includes bedding plane partings, joints and other defects, but excludes drilling breaks.
Term Description
Fragmented Fragments of <20 mm
Highly Fractured Core lengths of 20-40 mm with some fragments
Fractured Core lengths of 40-200 mm with some shorter and longer sections
Slightly Fractured Core lengths of 200-1000 mm with some shorter and loner sections
Unbroken Core lengths mostly > 1000 mm

July 2010
Rock Quality Designation The quality of the cored rock can be measured using the Rock Quality Designation (RQD) index, defined as:
RQD % = cumulative length of 'sound' core sections ≥ 100 mm long total drilled length of section being assessed
where 'sound' rock is assessed to be rock of low strength or better. The RQD applies only to natural fractures. If the core is broken by drilling or handling (i.e. drilling breaks) then the broken pieces are fitted back together and are not included in the calculation of RQD. Stratification Spacing For sedimentary rocks the following terms may be used to describe the spacing of bedding partings:
Term Separation of Stratification Planes
Thinly laminated < 6 mm
Laminated 6 mm to 20 mm
Very thinly bedded 20 mm to 60 mm
Thinly bedded 60 mm to 0.2 m
Medium bedded 0.2 m to 0.6 m
Thickly bedded 0.6 m to 2 m
Very thickly bedded > 2 m

Appendix B
Extracts from Land Capability Report 40740


!"!!!#$ %&&'(')%*(+!,+!
(%)%)%('
)-(.'
*(/)' !!,)%0.' )-((
-1"23 "3
43"" "
11"( ".3"
""-
5 5
6
7
!
!
!
!
!
! !!"8"#9$% " !!!!
&$%!'( !!!% :!$% $
!!'"!!)#98	$% %&8"$*%
!!!!')#98&$%
+!!!'", %
-"!!!"$%
+!'"!!;)#9$%
!!!!'"&8	$%
'! '
:!$!%
- !.%'":!!
-!	$%
!!'";&$%
/"$!!!'"
(
!!'"!&$% .$
+!'"!!
+!!!'
+!!'&8"$%
+!'"!!;&$%
<!
!!
< !
!!
<$!
!!
==!
!!
<!!
!!
=<!
!!
> $,!!!(
> $+!!!(
> $>!!!(
> $0!!!(
1
19
11
12
13
142)
2&
2"
25
2
29
&2
&3")
"&
""
"5"
"9"1
"2 "3
54
)
&5
1 3
9"
95
991
1)
1"
15
-
2.
.1
6.1
422)7
<+?4<+@A0>B
3.# 2222#2)2
> $,!!!(

)%*(+!,+!
(%)%)%('
)-(.'
)%0.'
!"!!!#$
*(/)' !!,
%&&'('
)-((
-1"23 "3
43"" "
11"( ".3"
""-
/ 5 5
2
6
7
::!! %* !:'"
!!$!::!
::! ! : !!)#5$!!*:
! !)#9$!!*:
::!!! ! %C !% $
::!!! !: %C !% $
<!
!!
< !
!!
<$!
!!
==!
!!
<!!
!!
=<!
!!
> $,!!!(
> $+!!!(
> $>!!!(
> $0!!!(
1
19
11
12
13
142)
2&
2"
25
2
29
&2
&3")
"&
""
"5"
"9"1
"2"3
54
)
&5
1 3
9"
95
9
9194
1"
15
-
0@$$42$B
77
61
% 1
.1
6.1
422)7
<+?4<+@A0>B> $,!!!(

)-(.'*
&.)/)' !!,
)%*(+!,+!
(%)%)%('
)%0.'
!"!!!#$ %&&'('
)-((
+5& 5 5
-1"23 "3
43"" "
11"( ".3"
""-
&
<!
!!
< !
!!
<$!
!!
==!
!!
<!!
!!
=<!
!!
> $,!!!(
> $+!!!(
> $>!!!(
> $0!!!(
6
7
<+?4<+@A0>B
272317
31
424$2731@B
424$2731D@B
631
-
> $ !!!(

)%*(+!,+!
(%)%)%('
)-(.'*
)%0.'
!"!!!#$
&.)/)' !!,
%&&'('
)-((
-1"23 "3
43"" "
11"( ".3"
""-
/++5&- 5 5
&9
<!
!!
< !
!!
<$!
!!
==!
!!
<!!
!!
=<!
!!
> $,!!!(
> $+!!!(
> $>!!!(
> $0!!!(
6
7
")&
")" ")5
")
")9
")1
")2
")3
")4
"&)
"&&
"&"
"&5
"&
"&9
"&1
"&2
"&3
"&4"")
&
"
5
9
1
2
3
4
&)
&&
&"
&5
&
&9
&1
&2
&3
&4
")
"&
""
"5
"
"9
"1
"2
"3
"4
5)
5&
5"
55
5
59
51
52
53
54
)
&
"
5
9
1
2
3
4
9)
9&
9"
95
9
99
91
92
93
94
1)
1&
1"
15
1
19
11
12
13
14
2)
2&
2"
25
2
29
21
22
23
24
3)
3&
3"
35
3
39
31
32
33
34
4)
4&
4"
45
4
49
41
42
43
44
&))
&)&
&)"
&)5
&)
&)9
&)1
&)2
&)3
&)4
&&)
&&&
&&"
&&5
&&
&&9
&&1
&&2
&&3
&&4
&")
&"&
&""
&"5
&"
&"9
&"1
&"2
&"3
&"4
&5)
&5&
&5"
&55
&5
&59
&51
&52
&53
&54
&)
&&
&"
&5
&
&9
&1
&2
&3
&4
&9)
&9&
&9"
&95
&9
&99
&91
&92
31
2
2
712
<+?4<+@A0>B
-
> $ !!!(
!>
!
&'(&)*)++
&+'&,-
-.-)&-
(..
-.(-.'
),(
&.*
.*),'(/',&'&/
221@?B

)%*(+!,+!
(%)%)%('
)-(.'*
)%0.'
!"!!!#$
&.)/)' !!,
%&&'('
)-((
-1"23 "3
43"" "
11"( ".3"
""-
++5&+ 5 5
&1
6
7
<!
!!
< !
!!
<$!
!!
==!
!!
<!!
!!
=<!
!!
> $,!!!(
> $+!!!(
> $>!!!(
> $0!!!(
"
5 1
2
&4
"&
""
"5
"9
"2
"4
5)
5&
5"
55
51
53
"
5
9
9"
95
99
91
29
33
4"
&)9
&)4
&&3
&"&
&""
&"9
&"1
&55
&5
&52
&&
&"
&
&9)
&9&
&9"
&9
")&
")5
")
"&2
"&3
2
42
44 &5&
&4
&92
")9")3
"&&
"&5
"&
4&
7$02 E>?@1B
7$02 =8>?@1B
7$02 +8=?@1B
7$02 8+?@1B 7$02 9 ?@8B
<+?4<+@A0>B
31
631
4&
-
> $ !!!(
0$0<0$,$0$<
0$ <0$+0
>$
+$=+0
+$>=
0$0
!+$++
>$=,
>$++>$ =
!
>$0<
?
>?=?
+?
61
01
41
1
(8
17@)"<0+B221@?B
@7F2<B

)%*(+!,+!
(%)%)%('
)-(.'*
)%0.'
!"!!!#$
&.)/)' !!,
%&&'('
)-((
-1"23 "3
43"" "
11"( ".3"
""-
5 5
&2
<!
!!
< !
!!
<$!
!!
==!
!!
<!!
!!
=<!
!!
> $,!!!(
> $+!!!(
> $>!!!(
> $0!!!(
"
5 1
2
&4
"&
""
"5
"9
"2
"4
5)
5&
5"
55
5
51
53
&
"
5
9
9"
95
99
91
12
29
33
4"
&)&
&)9
&)3
&)4
&&5
&&9
&&1
&&3
&&4
&"&
&""
&"
&"9
&"1
&"2 &55
&5
&51
&52
&&
&"
&
&9)
&9&
&9"
&9
")&
")5")5")5")5")5
")2
"&2
"&3
"")
2
42
44 &5&
&4
&92
")
")9
"&&
"&
4&
")3"&5
-,
-, -,
-,
-,
-,
-,
-,
-,
-,
-,
-,
-,
-,
-,
-
-,
-,
-
-,
-,
-,
-,
-,
-,
-,
-,
-
-,
-,
-,
-
-,
-
-/,
-
.)
-
-,
-
-/
-,
-
-'
-,
.) -,
-,
-
-,
-,
-,
-,
-,
-,
-,
-,
++,
-',+++,+,+',
.,
-,
-,
.,
-,
-*
-, -,
-,
-,
(
-+,
-,
-,
-,
.,.,
%37778
22F7% 1@32782"() !! B 21371
22F 213311
2 77+8=?@1B
22F 213311
21371
277
277
2 77=8>?@1B2@"B 77E>?@1B
<+?4<+@A0>B
4&
-
> $ !!!(
-,
71@B,&3!,@17B

)%*(+!,+!
(%)%)%('
)-(.'*
)%0.'
!"!!!#$
&.)/)' !!,
%&&'('
)-((
-1"23 "3
43"" "
11"( ".3"
""-
--/8)#9$ 5 5
&3
6
7
<!
!!
< !
!!
<$!
!!
==!
!!
<!!
!!
=<!
!!
> $,!!!(
> $+!!!(
> $>!!!(
> $0!!!(14
39
41
")1
")2
")3
"&)
"&3
"&&
"&"
267!$02 +$080@1B
267!$02 9+$0@1B
267!$02 E0@8B
<+?4<+@A0>B
31
631
!>
-
> $ !!!(

)%*(+!,+!
(%)%)%('
)-(.'*
)%0.'
!"!!!#$
&.)/)' !!,
%&&'('
)-((
-1"23 "3
43"" "
11"( ".3"
""-
--/ 8	$ 5 5
&4
6
7
<!
!!
< !
!!
<$!
!!
==!
!!
<!!
!!
=<!
!!
> $,!!!(
> $+!!!(
> $>!!!(
> $0!!!(
1
2
&4
"&
"2
"4
9
1
4
9)
9&
9"
95
99
19
11
3&
32
33
4)
4"
&)9
&)4
&")
&"&
&55
&52
&54
&)
&
&9)
&9"
&9
&92
")1
"&4
&"
267!$02 9+$0@1B
267!$02 +$080@1B
22F 2133117277$0
22F 2133117277$0
631
<+?4<+@A0>B
31
!>
-
> $ !!!(
71@B,&3!,@17B

)%*(+!,+!
(%)%)%('
)-(.'*
)%0.'
!"!!!#$
&.)/)' !!,
%&&'('
)-((
-1"23 "3
43"" "
11"( ".3"
""-
8)#9$ 5 5
")
<!
!!
< !
!!
<$!
!!
==!
!!
<!!
!!
=<!
!!
> $,!!!(
> $+!!!(
> $>!!!(
> $0!!!(
")"
")1
"&)
"&3
")&
")5
")
")9
")2
")3
")4
"&&
"&"
"&5
"&9
"&2
"")
17!$02 E0@1B
17!$02 080@B
17!$02 90@8B
<+?4<+@A0>B
31
631
-
> $ !!!(
"&"

)%*(+!,+!
(%)%)%('
)-(.'*
)%0.'
!"!!!#$
&.)/)' !!,
%&&'('
)-((
-1"23 "3
43"" "
11"( ".3"
""-
8	$ 5 5
"&
<!
!!
< !
!!
<$!
!!
==!
!!
<!!
!!
=<!
!!
> $,!!!(
> $+!!!(
> $>!!!(
> $0!!!(
")&
")5
")
")9
")1
")3
"&&
"&5
"&
"&9
"&2
"&3
"")
17$02 E0@1B
17!$02 90@8B
631
<+?4<+@A0>B
31
")9
-
> $ !!!(

Appendix C
Drawings 1 – 4


TITLE:
OFFICE:
DATE:SCALE:
DRAWN BY:
CLIENT:
REVISION:
PROJECT No:
DRAWING No: 2
Distribution of pH & Aggressivity to Concrete in the Depth Zone 0 - 3 mLandcom
As shown
BAHCampbelltown
03.06.2011 B
40740.99
Salinity Investigation and Management Plan
Tranches 7, 8 and Anthony Reserve, ORAN PARKMGA
N
2
2
2
291,5
00 m
E
22 2
2
2 2 2
2
2
2
2
2
2
2
2
2
2
2
2
2
291,3
00 m
E
291,4
00 m
E
2
2
2
2
2
2
2
2
2
2
2
291,2
00 m
E
2
2 2
2
2
2
291,0
00 m
E
291,1
00 m
E
2
22
2
2
2
2
2
2
2
2
22
2 2
2
2
2
2
2
2
2
2
2
2
2
2
2
290,7
00 m
E
290,8
00 m
E
290,9
00 m
E
2
2
2
2
2
2
2
6,235,700 mN
2
2 2
2
2
6,235,800 mN
6,235,900 mN
6,236,000 mN
6,236,200 mN
2
2
6,236,100 mN
2
2
6,235,500 mN
6,235,600 mN
2
290,6
00 m
E
6,235,400 mN
2
2
2
2
2
#########
######################################################
####################################
#########
#########
##################
######################################################
###########################
#########
#########
##################
##################
##################
#########
##################
##################
##################
##################
##################
##################
##################
##################
##################
##################
#################################### ##################
##################
####################################
##################
########################### ##################
################## ##################
##################
#########
##################
##################
##################
####################################
##################
##################
#########
##################
#########
##################
##################
##################
####################################
##################
#########
################## ##################
##################
##################
##################
##################
#########
##################
################## ################## ##################
#########
################## ##################
#########
################## ##################
#########
#########
##################
###########################
##################
##################
####################################
##################
#########
##################
##################
##################
##################
####################################
##################
##################
##################
##################
#########
2
LEGEND
Mildly aggressive to concrete
Test Pit
Anthony Reserve
Tranche 8
Tranche 7
Grid:GDA94 / MGA94 (Zone 56)

TITLE:
OFFICE:
DATE:SCALE:
DRAWN BY:
CLIENT:
REVISION:
PROJECT No:
DRAWING No: 3
Landcom
As shown
BAHCampbelltown
03.06.2011 B
40740.99
MGA
LEGEND
Highly Saline Zone >16 dS/m
Very Saline Zone 8-16 dS/m
Moderately Saline Zone 4-8 dS/m
Slightly Saline Zone 2-4 dS/m
Test Pit
Anthony Reserve
Tranche 8
Tranche 7
Grid: GDA94 / MGA94 (Zone 56)
29
1,5
00
mE
29
1,3
00
mE
29
1,4
00
mE
29
1,2
00
mE
29
1,0
00
mE
29
1,1
00
mE
29
0,7
00
mE
29
0,8
00
mE
29
0,9
00
mE
6,235,700 mN
6,235,800 mN
6,235,900 mN
6,236,000 mN
6,236,200 mN
6,236,100 mN
6,235,500 mN
6,235,600 mN
29
0,6
00
mE
6,235,400 mN

TITLE:
OFFICE:
DATE:SCALE:
DRAWN BY:
CLIENT:
REVISION:
PROJECT No:
DRAWING No: 4
Distribution of Aggressivity to Steel in the Depth Zone 0 - 3 mLandcom
As shown
JLCampbelltown
15.2.2011 B
40740.99
Salinity Investigation and Management Plan
Tranches 7, 8 and Anthony Reserve, ORAN PARKMGA
N
2
2
2
291,5
00 m
E
22 2
2
2 2 2
2
2
2
2
2
2
2
2
2
2
2
2
2
291,3
00 m
E
291,4
00 m
E
2
2
2
2
2
2
2
2
2
2
2
291,2
00 m
E
2
2 2
2
2
2
291,0
00 m
E
291,1
00 m
E
2
22
2
2
2
2
2
2
2
2
22
2 2
2
2
2
2
2
2
2
2
2
2
2
2
2
290,7
00 m
E
290,8
00 m
E
290,9
00 m
E
2
2
2
2
2
2
2
6,235,700 mN
2
2 2
2
2
6,235,800 mN
6,235,900 mN
6,236,000 mN
6,236,200 mN
2
2
6,236,100 mN
2
2
6,235,500 mN
6,235,600 mN
2
290,6
00 m
E
6,235,400 mN
2
2
2
2
2
2
LEGEND
Area where soil is classified as moderately aggressive to steel within the depth zone 0 - 3m
Area where soil is classified as mildly aggressive to steel within the depth zone 0 - 3m
Anthony Reserve
Tranche 8
Tranche 7
Grid: GDA94 / MGA94 (Zone 56)

Appendix D
Test Pit Logs

0.3
3.1
TOPSOIL - brown silty clay with trace rootlets
CLAY - brown mottled orange clay with trace rootlets
- becoming grey brown clay below 0.9m
- becoming dark brown mottled light brown clay below1.4m
- becoming wet below 2.0m
- becoming grey and brown clay below 2.4m
Pit discontinued at 3.1m- limit of investigation
Results &Comments
Sampling & In Situ Testing
1
2
3
Wat
er
Dep
th
Sam
ple
Description
of
Strata Gra
phic
Log
Typ
e
CLIENT:PROJECT:
SAMPLING & IN SITU TESTING LEGEND
LandcomSalinity Management Plan
1
2
3
RL
RIG: Komatsu WB97R - 450 bucket
LOCATION:
88
87
86
85
REMARKS:
WATER OBSERVATIONS: No free groundwater observed
TEST PIT LOG
Depth(m)
LOGGED: BAH
Tranche 7, 8 and Anthony ReserveOran Park
SURVEY DATUM:
A Auger sample G Gas sample PID Photo ionisation detector (ppm)B Bulk sample P Piston sample PL(A) Point load axial test Is(50) (MPa)BLK Block sample Ux Tube sample (x mm dia.) PL(D) Point load diametral test Is(50) (MPa)C Core drilling W Water sample pp Pocket penetrometer (kPa)D Disturbed sample Water seep S Standard penetration testE Environmental sample Water level V Shear vane (kPa)
SURFACE LEVEL: 88 mAHDEASTING: 290829.9NORTHING: 6236168.51DIP/AZIMUTH: 90°/--
PIT No: 1PROJECT No: 40740.99DATE: 27/1/2011SHEET 1 OF 1
* 40740.98 samples collected
5 10 15 20
Sand Penetrometer AS1289.6.3.3
Cone Penetrometer AS1289.6.3.2
Dynamic Penetrometer Test(blows per mm)
0.2
0.5
1.0
1.5
2.0
2.5
3.0
D*
D*
D
D
D
D
D