Embed Size (px)
Citation preview
1
Report on Optimal Use of DIBANET
Feedstocks and Technologies
Version for Public Distribution
Document Identifier: Deliverable Number: D.5.3
Version: 1.0
Contractual Deadline: Month 45
Date: 29th Mar 2013
Author: Daniel Hayes (UL)
Dissemination Status: PU
With the support of the Seventh Framework Programme.
2
Executive Summary
The DIBANET process chain, as a result of its patented pre-treatment stage, has significantly
increased the yields of levulinic acid, formic acid, and furfural beyond what was considered to
be the state of the art. By fractionating lignocellulosic biomass into its three main polymers
(cellulose, hemicellulose, lignin) it has also allowed for lignin to be recovered and sold as a
higher-value product. These developments have meant that the amount of acid hydrolysis
residues (AHRs) that have been produced are significantly (up to 88%) less than in the
Biofine process. These AHRs are required to provide process heat for DIBANET. Direct
combustion is the most efficient means for doing this. If such combustion does not occur and
the AHRs are instead used in other processes, e.g. pyrolysis and gasification, then more
biomass will need to be purchased to fuel the core DIBANET process. The AHRs have not
been proven to be superior to virgin biomass when put through these thermochemical
processes. Indeed, many of the results from DIBANET Work Package 4 indicate the opposite.
Hence, given that DIBANET, and the modelling of its optimal configuration, is designed on
the basis of an integrated process, centred on the core element of the acid hydrolysis of
biomass, then combustion is the only viable end use for the AHRs.
Given that realisation, the focus of this modelling Deliverable is on what the optimal
configuration of the process chain would be regarding the three core stages (pretreatment,
hydrolysis, and the esterification of levulinic acid with ethanol). It has been demonstrated that
a scenario incorporating only the first stage can be profitable in its own right and allow for
commercial development at much lower capital costs. In this instance bagasse is a much more
attractive feedstock, compared with Miscanthus, due to its higher pentose content.
Integrating the second stage increases capital costs but improves the net present value. The
esterification step is somewhat capital intensive but an integrated DIBANET biorefinery that
incorporates all three stages can still be highly profitable providing the furfural is sold at its
current market price and the lignin is sold rather than used as a fuel for process needs.
Indeed, the DIBANET process should not be considered only in the context of biofuels but as
a true biorefinery that produces lower value fuels (e.g. ethyl-levulinate) in addition to high
value chemicals and bio-products (e.g. furfural and lignin).
The energy and carbon balances of the various DIBANET scenarios have been investigated
and are highly positive with values significantly superior to those for the energy-intensive
Biofine process. A socioeconomic survey has also been carried out and has shown that there
can be a positive effect on employment, both direct and indirect, particularly when
Miscanthus is used as the feedstock. The DIBANET integrated process also holds up well
when its environmental and social performances are ranked for a range of important
parameters.
The development of the core DIBANET IP towards commercial deployment appears to be
warranted, based on data provided from the models developed. Indeed, these models present
possible scenarios whereby even demonstration-scale DIBANET facilities could operate at
significant profits and provide healthy returns on the capital invested.
3
Contents
1 Concept for Model Development ....................................................................................... 5
1.1 Original DIBANET Process Chain .............................................................................. 5
1.2 Original DIBANET Scientific Objectives ................................................................... 7
1.3 Targets for Modelling the DIBANET Process ............................................................ 7
2 Relevant Results and Conclusions from Other DIBANET Deliverables ........................... 9
2.1 The Pre-treatment of Biomass ..................................................................................... 9
2.2 The Acid Hydrolysis of Biomass and Pretreated Biomass ........................................ 10
2.3 The Fast Pyrolysis of AHRs ...................................................................................... 12
2.4 The Gasification of AHRs ......................................................................................... 13
2.5 The Slow Pyrolysis of AHRs ..................................................................................... 13
3 Methodology .................................................................................................................... 15
3.1 Aspen+ Modelling ..................................................................................................... 15
3.2 Excel Financial Modelling ......................................................................................... 15
3.3 Feedstock Data .......................................................................................................... 16
3.4 Energy Balance .......................................................................................................... 19
3.5 Carbon Balance .......................................................................................................... 20
3.6 Socioeconomic Evaluation ........................................................................................ 21
3.7 Revised Set of Scenarios ........................................................................................... 23
4 Results .............................................................................................................................. 29
4.1 Process Inputs and Outputs ........................................................................................ 29
4.2 Energy Balance .......................................................................................................... 35
4.2.1 Process Energy Requirements and Provision by Residues ................................ 35
4.2.2 Full Energy Analysis .......................................................................................... 38
4.3 Alternative Uses for the AHRs .................................................................................. 47
4.3.1 Slow Pyrolysis for Biochar Production .............................................................. 47
4.4 Carbon Balance .......................................................................................................... 48
4.5 Socioeconomic Evaluation ........................................................................................ 49
4.6 Economics ................................................................................................................. 60
4.6.1 Financial Evaluation of the Base Case ............................................................... 60
4.6.2 Effects of Facility Size ....................................................................................... 67
4.6.3 Use of Process Residues ..................................................................................... 70
4.7 Case Study: Facility Owned and Operated by Sugar Mill ......................................... 72
5 Examination of Other Feedstocks .................................................................................... 75
6 Comparisons with Other Technologies ............................................................................ 79

4
7 Conclusion ........................................................................................................................ 81
8 References ........................................................................................................................ 84
5
1 Concept for Model Development
1.1 Original DIBANET Process Chain
The original concept of DIBANET was based upon the Biofine process, which was
considered, at the time of writing the proposal, to be the state of the art for the production of
levulinic acid (LvA) from lignocellulosic biomass. That technology uses a two stage process
for the production of LvA. Carbohydrate feedstock and sulphuric acid catalyst solution are
mixed, and the slurry is supplied continuously to a tubular reactor. This reactor is operated at
a temperature of 210–220 °C, a pressure of 30 atm, and a residence time of 12 s in order to
initially hydrolyse the carbohydrate polysaccharides into their soluble monomers (hexose and
pentose). The product of the first reactor is fed to a continuously stirred tank reactor operated
at a lower temperature and pressure (190–200 °C, 12-14 atm) but with a longer residence time
of 20 min. LvA is removed by drawing-off liquid from the second reactor. The reaction
conditions in the second reactor are chosen as such to vaporise formic acid (FA) and furfural
(FF), and the vapour is externally condensed to collect these side products. Solid by-products
are removed from the LvA solution in a filter-press unit.
The solid by-products include the majority of the lignin (only a small fraction is acid-soluble)
and the portion of the hydrolysed sugars that did not end up as LvA, FA, or FF but instead
formed condensation products (humins). In the Biofine process these acid hydrolysis residues
(AHRs) are the major product, in terms of mass, with estimates of approximately 500kg of
residues being produced per dry tonne of feedstock for biomass such as Miscanthus and
sugarcane bagasse (SB). This is a significant quantity and, while the activities that were
planned in Work Package (WP) 3 of DIBANET targeted improving the yields of levulinic
acid from cellulose and furfural from hemicellulose (and so reduce the amount of humins
produced), it was considered that the AHRs would still contain nearly all of the lignin (~250
kg per tonne of biomass for such feedstocks as Miscanthus and SB) as well as some humins
(it is not possible for there to be no humin production based on the acid treatment of
polysaccharides).
Hence, a major focus of the DIBANET concept was that the AHRs should be used effectively
and sustainably. Some would be required for the production of process heat/steam/power but
it was considered that there could be a surplus of AHRs beyond this requirement. Hence,
DIBANET planned for experimental work on the utilisation of AHRs as a (fast) pyrolysis
feedstock for producing bio-oils that could be upgraded to diesel miscible biofuels (DMBs).
In addition to bio-oils, a biogas and a biochar would also be produced from the pyrolysis
process. The biochar could have value as a plant growth promoter and as a means for
sequestering carbon. At a later point in the project, the use of AHRs in gasification processes
was examined and the production of biochar, rather than bio-oil, was also considered by
employing slow-pyrolysis (rather than fast-pyrolysis) of the AHRs.
Levulinic acid and furfural are valuable platform chemicals which have applications in a
range of industries, either directly, or through catalytic conversions to other chemicals.
However, since the DIBANET proposal was addressing an FP7 call relating to the production
of second generation biofuels from lignocellulosic biomass, it was necessary to present
options for the production of biofuels to be a target. Hence, there was a focus on ethyl
levulinate (EL), an ester of levulinic acid and ethanol. EL had been tested, by Texaco, as a

6
diesel additive in a 79% diesel, 20% EL, and 1% co-additive mixture. This blend met ASTM
D-975 and EN590 specifications and had an oxygen content of 6.9%, giving a cleaner burn.
EL has a high octane number and, hence, can also be used as a petrol additive. It also has
value as a co-factor in fatty acid methyl esters to improve the viscosity of conventional
biodiesels. Its value has been hindered in the past due to the high price of levulinic acid
production but it was foreseen that the work to be conducted in DIBANET would make
levulinic acid production highly economical and, hence, EL a viable biofuel.
The original DIBANET proposal presented a Process Chain that encapsulated all the concepts
described above. A version of this process flow is presented in Figure 1.
Figure 1: A version of the original Process Chain concept for the DIBANET project.
The original Process Chain involved the following steps:
1. Biomass is ground and then pre-treated so that it is more amenable to acid hydrolysis.
2. The acid hydrolysis and subsequent degradation of biomass. This can produce: (i)
levulinic acid; (ii) furfural (which can theoretically be converted to levulinic acid via
hydrogenation); (iii) formic acid; and (iv) solid residues (SR).
3. The esterification of levulinic acid with (sustainable) ethanol to produce the DMB
ethyl-levulinate.
4. Pyrolysis of some or all of the SR to produce a bio-oil, gas, and a biochar.
Thermochemical processing could be enhanced by using the formic acid produced in
(2) as a co-feed.
5. Upgrading of the bio-oil to produce an upgraded fuel that could be suitable for the
addition to diesel.
6. Utilisation of the biochar as a soil-amender for plant-growth promotion or to fuel the
processes.

7
1.2 Original DIBANET Scientific Objectives
The DIBANET project included the following 5 key Scientific Objectives (SOs) that were
focused on optimising each step of the Process Chain. For each of these SOs the planned
means for achieving these improvements are described.
1. Optimise the yields of levulinic acid (and co-products), from the conversion of
biomass, while minimising chemical/energy requirements.
Improved reactor design.
Improved process conditions, based on the development of kinetic models
for the acid conversion of lignocellulosic biomass.
Pretreatments that allow for the heterogeneities and complexities in the
lignocellulosic matrix to be decreased.
2. Improve the energy balance of the production of levulinic acid and any by-
products from feedstock by sustainably utilising the AHRs in processes that will
maximise commercial viability.
Fast pyrolysis of the residues to produce a bio-oil, gas, and biochar.
Utilise catalysts, either during the pyrolysis process or in subsequent
treatment of the bio-oil, to produce upgraded bio-oils that could be suitable
for blending with transport fuels.
Explore gasification as a means for producing a syngas from the AHRs.
Consider the production of biochar, through fast- or slow-pyrolysis, from
AHRs. Determine the value of this biochar as a plant-growth promoter and
for the sequestration of carbon.
3. Reduce the energy and chemical costs involved in producing ethyl-levulinate from
levulinic acid and ethanol.
Consider the use of various catalysts, such as solid acid catalysts and
Amberlyst.
4. Select key biomass feedstocks for conversion to levulinic acid, analyse these, and
develop rapid analytical methods that can be used in an online process.
Evaluate the use of near infrared (NIR) spectroscopy as a rapid analytical
tool for a number of lignocellulosic feedstocks from Latin America and
Europe.
5. Analyse the DMBs and any biofuels produced for their compliance to EN590
requirements and, if non-compliant, suggest means to achieve compliance.
1.3 Targets for Modelling the DIBANET Process
Figure 1 was considered to be one configuration of the technologies and processes to be
developed under DIBANET. There were a number of variables involved in designing such a
Process Chain. These variables, and their various options, are listed below with the option
chosen for Figure 1 underlined.
8
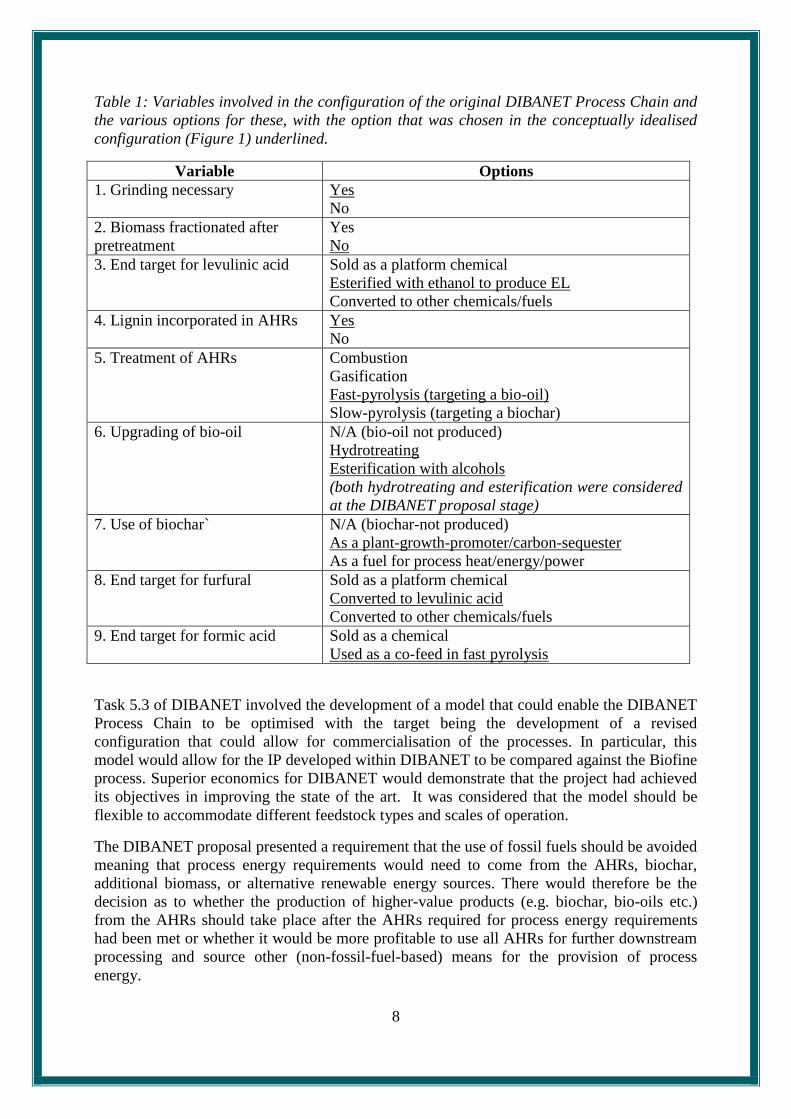
Table 1: Variables involved in the configuration of the original DIBANET Process Chain and
the various options for these, with the option that was chosen in the conceptually idealised
configuration (Figure 1) underlined.
Variable Options
1. Grinding necessary Yes
No
2. Biomass fractionated after
pretreatment
Yes
No
3. End target for levulinic acid Sold as a platform chemical
Esterified with ethanol to produce EL
Converted to other chemicals/fuels
4. Lignin incorporated in AHRs Yes
No
5. Treatment of AHRs Combustion
Gasification
Fast-pyrolysis (targeting a bio-oil)
Slow-pyrolysis (targeting a biochar)
6. Upgrading of bio-oil N/A (bio-oil not produced)
Hydrotreating
Esterification with alcohols
(both hydrotreating and esterification were considered
at the DIBANET proposal stage)
7. Use of biochar` N/A (biochar-not produced)
As a plant-growth-promoter/carbon-sequester
As a fuel for process heat/energy/power
8. End target for furfural Sold as a platform chemical
Converted to levulinic acid
Converted to other chemicals/fuels
9. End target for formic acid Sold as a chemical
Used as a co-feed in fast pyrolysis
Task 5.3 of DIBANET involved the development of a model that could enable the DIBANET
Process Chain to be optimised with the target being the development of a revised
configuration that could allow for commercialisation of the processes. In particular, this
model would allow for the IP developed within DIBANET to be compared against the Biofine
process. Superior economics for DIBANET would demonstrate that the project had achieved
its objectives in improving the state of the art. It was considered that the model should be
flexible to accommodate different feedstock types and scales of operation.
The DIBANET proposal presented a requirement that the use of fossil fuels should be avoided
meaning that process energy requirements would need to come from the AHRs, biochar,
additional biomass, or alternative renewable energy sources. There would therefore be the
decision as to whether the production of higher-value products (e.g. biochar, bio-oils etc.)
from the AHRs should take place after the AHRs required for process energy requirements
had been met or whether it would be more profitable to use all AHRs for further downstream
processing and source other (non-fossil-fuel-based) means for the provision of process
energy.

9
2 Relevant Results and Conclusions from Other DIBANET Deliverables
Section 1 describes the concepts outlined in the DIBANET project proposal. This Deliverable
(D.5.3) is being finalised at the conclusion of the project. Hence it is possible, and important,
to summarise the outputs of the experimental work that took place over the course of the
project, since these informed greatly the final form taken by the model developed in Task 5.3.
2.1 The Pre-treatment of Biomass
The DIBANET proposal suggested that ionic liquids (ILs) could be used for the pre-treatment
of biomass prior to acid hydrolysis and LvA production. However, the review carried out by
UFRJ, and the experiments conducted at UL, resulted in the conclusion that these were not
suitable. Instead a new, patented, method of biomass pre-treatment was developed
(DIBANET Deliverable D.3.2). This involved the use of hydrogen peroxide which, in
combination with formic acid yields a per-acid that is an effective dissolution medium for
lignin. The peroxide can be catalytically triggered (via iron, transition metals, pH adjustment)
to decompose rapidly and exothermically, resulting in the generation of a high pressure
environment without the need for high pressure steam (which is required in the Biofine
process). The outputs from the DIBANET pre-treatment were a cellulosic pulp and a liquid
medium containing the formic acid as well as the dissolved lignin and the partially hydrolysed
monomers/oligomers of hemicellulose in addition to some of the degradation products of
these sugars (principally furfural).
Most importantly, the pretreatment process has been demonstrated on biomass (Miscanthus
chips collected by the combine harvester, sugarcane bagasse collected from the sugar mill)
that had not been ground down. The cellulosic residue that was obtained post-pre-treatment
was of a much finer particle size that the original biomass due to the high pressure conditions
resulting from the decomposition of the peroxide.
The hemicellulosic sugars in the pre-treatment liquor can be treated with acid in a
conventional CSTR reactor to allow for the production of furfural from the pentosans, and the
lignin can be recovered. This lignin has been tested and is of a high quality; comparable to
organosolv lignins.
The cellulose obtained from the pre-treatment has also been tested as a feedstock for
enzymatic hydrolysis and the rate of glucose release was found to be in the order of 20 times
greater than that for the raw biomass. Importantly, traces of the pre-treatment liquor within
the pulp did not provide any inhibiting action or toxicity toward the microbial enzymes. This
removes the requirement for additional processing prior to hydrolysis.
The pre-treatment has been tested at solid loadings of up to 15%.

10
2.2 The Acid Hydrolysis of Biomass and Pretreated Biomass
In the course of DIBANET a large number of acid hydrolysis experiments were carried out on
lignocellulosic biomass. In these the temperatures and acid concentrations were varied and the
effects on the hydrolysis of the polysaccharides and the subsequent acid degradations of the
liberated monomers were monitored. As a result of this a series of kinetic equations were
developed, DIBANET Deliverable D.3.1. The kinetic study simplified the acid-catalysed
degradation of cellulose into three separate steps, Figure 2.
Figure 2: The different stages in the acid catalysed degradation of cellulose. LA = levulinic
acid, FA = formic acid, TAR = humins.
Following the development of the kinetic models, the following conclusions were reached:
Cellulose hydrolysis (K1) is a limiting reaction due to its high activation energy.
The rate of K1 is increased by increasing the swelling of the biomass (increasing the
surface area) and by removing hydrophobicity (lignin).
As temperature is increased K3 gets faster relative to K2.
Therefore, for optimal LvA yields it is best to operate at the lowest practicable
temperature.
An increased mass loading can be used to compensate for the reduced reaction rates
at lower temperatures. Hence, the aim is to operate at the highest practicable biomass
loadings.
An increased acid concentration increased the rates for all reactions, and so the aim is
for the highest practicable acid concentration.
Hemicellulose behaves very differently to cellulose; much milder conditions are
required for its hydrolysis. Also, furfural will degrade to formic acid under the
conditions required for the production of levulinic acid from the cellulosic portion of
biomass since it will degrade to formic acid. Therefore, for optimal yields of LvA
and FF the cellulose and hemicellulose should be processed separately.
11
The pre-treatment described in Section 2.1 allows for many of these optimal conditions to be
achieved. It separates the cellulose from the lignin and hemicellulose. Hence the
hydrophobicity of the lignin is no longer an issue in the hydrolysis of cellulose and separate
conditions can be employed for the treatment of the cellulose and hemicellulose. Furthermore,
since the solid residue is now mostly composed (~80%) of cellulose it allows for a much
higher solids loading of cellulosic sugars than would be possible if the raw biomass had been
processed.
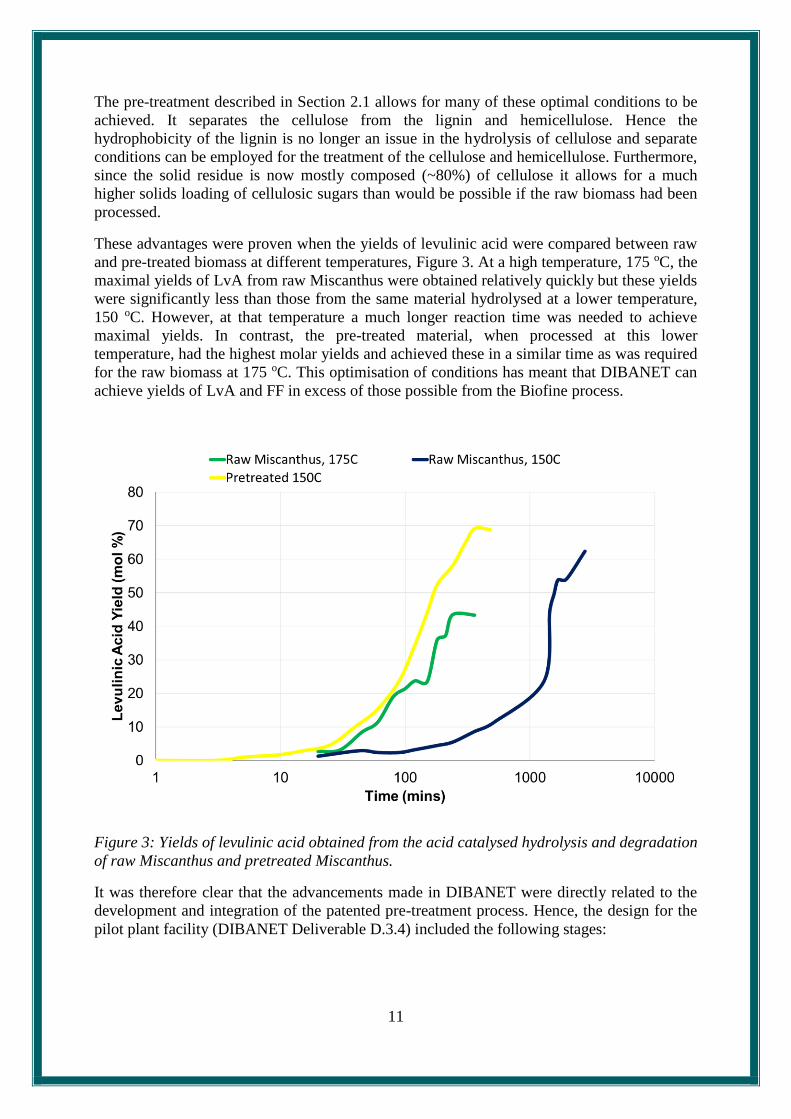
These advantages were proven when the yields of levulinic acid were compared between raw
and pre-treated biomass at different temperatures, Figure 3. At a high temperature, 175 oC, the
maximal yields of LvA from raw Miscanthus were obtained relatively quickly but these yields
were significantly less than those from the same material hydrolysed at a lower temperature,
150 oC. However, at that temperature a much longer reaction time was needed to achieve
maximal yields. In contrast, the pre-treated material, when processed at this lower
temperature, had the highest molar yields and achieved these in a similar time as was required
for the raw biomass at 175 oC. This optimisation of conditions has meant that DIBANET can
achieve yields of LvA and FF in excess of those possible from the Biofine process.
Figure 3: Yields of levulinic acid obtained from the acid catalysed hydrolysis and degradation
of raw Miscanthus and pretreated Miscanthus.
It was therefore clear that the advancements made in DIBANET were directly related to the
development and integration of the patented pre-treatment process. Hence, the design for the
pilot plant facility (DIBANET Deliverable D.3.4) included the following stages:
12
1. Pretreatment to yield two streams:
A cellulose-rich sludge.
The FA liquor with dissolved C5 sugars and lignin.
2. The liquor is sent to a CSTR for conversion of C5 sugars to furfural.
3. The mixture is cleaned of humins and silicates.
4. Various evaporation and water addition steps are used to precipitate the lignin.
5. A liquid stream containing FA, Furfural and Water is sent for product recovery and
recycling.
6. The cellulose is sent for conventional hydrolysis at 150 C in a series of CSTRs.
2.3 The Fast Pyrolysis of AHRs
DIBANET partners CERTH and Aston obtained from UL various AHRs, produced under a
number of hydrolysis conditions of varying severities, and these were processed by the
partners in fast pyrolysis rigs under both thermal and catalytic conditions. The pyrolysis
products (char, gas and bio-oil) were quantified and characterised. The results of these
analyses are presented in the WP4 section of the second DIBANET Periodic Report.
In summary, it was found that the yields of bio-oil (the targeted product) were significantly
less for AHRs than for the virgin biomass. Furthermore, the yields of bio-oil were inversely
correlated to the degree of removal of the polysaccharides in the hydrolysis stage. Those
AHRs which had greater quantities of cellulose and hemicellulose intact tended to produce
reasonable yields of bio-oil but hydrolysis experiments that removed most of these (e.g. 200
°C, 5% H2SO4 for 2 hours) produced very little bio-oil and much more char when pyrolysed.
It was also found that the catalytic pyrolysis experiments, carried out using a commercial
ZSM-5 catalyst, produced more water, less organic oil (albeit an oil with a lower oxygen
content), more gases, and more char than the thermal pyrolysis experiments on AHRs. Indeed,
the AHR obtained under some of the most severe hydrolysis conditions produced 69% char,
by weight, when subjected to catalytic pyrolysis.
It was concluded that, in order to provide a feedstock suitable for fast-pyrolysis and the
production of bio-oils in reasonable yields, it would be necessary to limit the degree of
hydrolysis in the main DIBANET process to such an extent that the yields of levulinic acid,
formic acid, and furfural from that stage would be so low as to make the process unviable in
economic terms. This would be unacceptable given that the DIBANET hydrolysis/pre-
treatment stages are central to the project. During a project meeting in Thessaloniki in 2011
the external evaluator suggested that the fast-pyrolysis experiments be cancelled and that
further work on the utilisation of AHRs should focus on their gasification.
Hence, due to the results obtained from the fast pyrolysis of AHRs and the suggestions by the
project evaluator, the utilisation of AHRs in fast pyrolysis technologies for the production of
bio-oils (that may potentially be further upgraded) will not be considered in this Deliverable.

13
2.4 The Gasification of AHRs
DIBANET partners CERTH and Aston carried out gasification trials using AHRs produced at
UL. The results obtained are presented in detail in the DIBANET Final Report for WP4.
Compositional data for some AHRs (obtained via the acid hydrolysis of virgin biomass) are
presented in Table 2. It can be seen that, while the AHRs have a greater heating value than the
original feedstock from which they are derived, the H/C molar ratio falls significantly after
hydrolysis. This is a result of the conversions of sugars and the formation of condensed
products during the hydrolysis. This low H/C ratio mitigates against the use of AHRs as
useful feedstocks for pyrolysis as there is insufficient hydrogen present to produce useful
liquid fuels. In the case of gasification, large quantities of steam and high temperatures (900 oC) are required in order to produce a useful product gas stream. High temperature steam
would render such a conversion process uneconomic compared to direct combustion,
particularly given the process energy requirements for DIBANET (see Section 4.2). The
reader is referred to Section 7 for further elaboration on this point.
Table 2: Some properties of Miscanthus before and after acid hydrolysis. AHR1-4 represent
acid hydrolysis residues prepared under different hydrolysis conditions.
Miscanthus AHR1 HR2 HR3 HR4
HHV, MJ·kg-1 18.7 21.4 25.9 25.8 20.2
C, wt.% 46.6 62.6 65.1 64.8 55.7
H, wt.% 6.36 3.37 5.29 5.32 4.75
N, wt.% 0.41 0.23 0.58 0.61 0.37
O, wt.% 46.63 33.80 29.03 29.27 39.18
H/C molar ratio 0.82 0.32 0.48 0.49 0.51
2.5 The Slow Pyrolysis of AHRs
The slow pyrolysis work was carried out by DIBANET partner EMBRAPA and has been
described in detail in Deliverable D.4.4. The biochar that was obtained from the slow
pyrolysis of AHRs underwent a chemical functionalisation in order to obtain organic
compounds similar to those found in the organic matter of the anthropogenic dark earths of
Amazonia. This was undertaken because it was considered that such a treatment would
improve the quality of the biochar when used as a plant growth promoter and would also
improve their capacity to reduce the losses of potassium by leaching, both of which would
increase the value of the biochar. It was found that this treatment did indeed significantly
reduce the K losses by leaching in sandy soils.
AHRs and biochars were also tested as plant-growth promoters and compared against the
control conditions. It was found that soybean grain production was increased over the control
by 16% with biochar amendment and by 20% with AHR amendment. For tree seedling trials
both amendments increased the dry mass production by 66%.
Biochar also has value as a means for sequestering carbon since the pyrolysis process locks it
in a much less labile state than the original biomass (or AHR) material. EMBRAPA tested the
efficacy of biochar in this regard by carrying out closed chamber experiments that monitored
14
the CO2 that was emitted from soil containing either sugarcane bagasse (the virgin feedstock),
AHRs from sugarcane bagasse (SB), or biochar obtained from the slow-pyrolysis of AHRs
produced from SB. These experiments proved that the biochar was much more stable in the
soil.
The final section of D.4.4 considered how the improvements in plant productivity and carbon
sequestration associated with biochar influenced its value to a farmer. The economic analysis
concluded that the biorefinery operator could sell the biochar to farmers at a price of €19.05
per dry tonne (where only the effects of the biochar in the first year are considered) or at a
price of €63.29 per dry tonne (if the residual effects of biochar over three years are
considered), whilst the AHRs could be sold to farmers for €13.15 per dry tonne (residual
effects would not be possible since the material would decompose in the soil).
These prices need to be put in context of the yields of biochar that would be achieved from
the pyrolysis of AHRs. EMBRAPA achieved a biochar mass yield of approximately 60%
from AHRs. Hence, the value of AHRs to the biorefinery operator as a feedstock for biochar
production (excluding the capital/processing costs for this) would be €11.43 per dry tonne
(only considering the first year of biochar effects) or €37.97 per dry tonne (considering the
residual effects over three years) compared with a potential sales price, to farmers, of €13.15
per dry tonne for the AHRs.
15
3 Methodology
3.1 Aspen+ Modelling
It was of paramount importance to have accurate and verifiable data regarding the energy and
chemical needs of the DIBANET process. Aspen Plus is a standard software tool designed for
this purpose. UL used this tool to model the pre-treatment, hydrolysis, and chemical/product
recovery steps. By modelling the processes to this degree of fidelity, the financial and energy
data presented in this report have sound scientific footing and present a basis for further
development of the commercialisation of the DIBANET IP. For example, the Aspen + models
could be used in the future by interested investors in order to evaluate whether investment in
the scale-up of the technology would be warranted.
Where Aspen+ properties for the relevant compounds already existed these were utilised in
the model and, in cases where they did not, user-defined properties were entered based on the
most appropriate analogue. All of the important conversions were modelled in Aspen+
considering the thermodynamics in both sulphuric acid and formic acid media.
3.2 Excel Financial Modelling
The Aspen+ model provided data for the following variables:
Energy requirement (per tonne of biomass processed).
Yields (after recovery) of levulinic acid, furfural, formic acid.
Recovery efficiencies of the process chemicals used (e.g. formic acid,
sulphuric acid, ethanol, octanol, etc.), resulting in a required net input of these,
on the basis of per tonne of biomass processed.
These were transferred into an Excel spreadsheet for economic, energy-/carbon-balance, and
socioeconomic analyses.
Capital costs for the DIBANET and Biofine processes were estimated for facilities processing
500,000 tonnes per year of biomass. These capital costs were then scaled according to a
power function of 0.6. Estimates for the capital and operational costs of the boiler systems
required for both of these technologies were included, based on the methodology outlined by
Mani et al. (1). The Biofine process requires a high pressure boiler whilst DIBANET only
requires low pressure steam (unless ethyl levulinate production is required). In instances
where DIBANET could produce energy surplus to the requirements of the process the
inclusion of a CHP system, with the provision of electrical power for sale to the grid, was
examined and compared with the standard low pressure boiler option.
Personnel costs for the biorefinery were determined according to a power formula related to
the size of the facility. This was determined after fitting a power function to a scatter plot in
Excel that provided estimated values for the number of employees required (and their mean
salaries) for facilities processing between 600 and 500,000 tonnes of biomass per year. These

16
numbers of direct workers were also used as inputs to the socioeconomic worksheet of the
model.
Operational costs not related to personnel, chemicals, or energy include insurance and the
maintenance of equipment. A total of 3.5% of capital costs were used for these each year,
consistent with other studies (2, 3).
The main financial metrics used for comparing process options and different technologies
were the Net Present Value (NPV), the Internal Rate of Return (IRR), the Return on
Investment (ROI) and the Payback Period (PP). A discount rate of 12% was applied to future
revenues and only the revenues from the first 15 years of operation of the facility were
considered in the economic evaluation (i.e. the NPV and ROI were calculated after 15 years
of operation). For both the DIBANET and Biofine processes it was assumed that construction
would take two years and that two-thirds of the total capital outlay would take place in the
first year, with the remainder in the second.
The user can easily change a number of variables (e.g. feedstock, chemical prices, type of
boiler system used, plant capacity, discount rate, the period used for the financial analysis) in
the Excel spreadsheet and see the effects on the financial parameters and product yields. The
results are presented for a number of variations of the DIBANET process chain (see Section
3.7) as well as for Biofine.
3.3 Feedstock Data
The performances of Biofine and the various configurations of the DIBANET technologies
were evaluated for two feedstocks: Miscanthus (from Ireland), and sugarcane bagasse (from
Brazil). Compositional data for these two feedstocks were provided from the activities in
DIBANET Work Package 2 and are summarised in Table 3. For Miscanthus, the summary
statistics presented in Table 3 were based on the analysis (via wet chemical and near infrared
spectroscopy) of 35 mature Miscanthus plants collected from various plantations in Ireland
over the course of the harvest window (October to April). The summary statistics for the
bagasse samples were calculated from 42 samples collected from sugar mills in Brazil. The
data for the standard deviation and the relative differences between the maximum and
minimum values and the mean value are of importance when considering how greatly samples
can differ from the mean and the effects that these variations may have on economic returns.
There are several important key points regarding the data in Table 3 that are of relevance to
the outputs of the DIBANET model:
Miscanthus has a higher average content of hexoses (3.47% higher in absolute terms
and 8.57% higher in relative terms). Hence, yields of levulinic acid, formic acid, and
ethyl levulinate per tonne of biomass processed will be higher than for bagasse
samples.
Bagasse has a higher average pentose content than Miscanthus (3.59% higher in
absolute terms and 17.13% higher in relative terms), meaning that it will provide
higher yields of furfural in the DIBANET pretreatment process.

17
Miscanthus has a higher average Klason lignin content than bagasse (3.53% higher in
absolute terms and 21.16% higher in relative terms), meaning that it will provide
higher yields of lignin in the pre-treatment.
With the exception of the Klason lignin content, bagasse samples are more variable in
composition than Miscanthus samples (i.e. higher standard deviation values and
greater ranges in composition).
A feedstock price of $32.5 per dry tonne was used, in the base case, for sugarcane bagasse.
This value was reached after considering the potential profit that could be returned from
burning this feedstock in a combined heat and power system for the provision of electrical
power to the grid. Hence, the price paid for this feedstock by the DIBANET facility was used
to cover the opportunity cost of not using it in a CHP system. It was necessary to assign the
higher price of $60 per dry tonne, in the base case, for Miscanthus in order to reflect the
different economic conditions of Ireland and Brazil and the fact that Miscanthus is a dedicated
energy crop.
The selection of either Miscanthus or sugarcane bagasse as the feedstock to be studied in the
DIBANET model also influenced some other financial variables relating to differences
between Brazil and Ireland. For example, the prices that are paid to purchase electricity and
the revenue received from selling electricity.

18
Table 3: Summary statistics of some samples of Miscanthus and sugarcane bagasse that were
analysed in WP2 of DIBANET. For further detail on the compositions of these samples refer
to DIBANET Deliverable D.2.2.
Constituent Statistic Miscanthus Bagasse
# of Samples Analysed 35 42
Hexoses
Mean (%) 43.96 40.49
Standard Deviation (%) 1.42 2.20
Max. Value (%) 47.65 44.04
Min. Value (%) 41.82 34.46
Rel. Difference from Mean for Max Value 8.39% 8.79%
Rel. Difference from Mean for Min Value -4.87% -14.88%
Range for Max-Min Values, Rel. to Mean 13.26% 23.67%
Pentoses
Mean (%) 20.96 24.55
Standard Deviation (%) 0.73 1.24
Max. Value (%) 23.35 27.12
Min. Value (%) 19.95 21.47
Rel. Difference from Mean for Max Value 11.43% 10.48%
Rel. Difference from Mean for Min Value -4.79% -12.57%
Range for Max-Min Values, Rel. to Mean 16.22% 23.04%
Klason Lignin
Mean (%) 20.21 16.68
Standard Deviation (%) 1.18 0.80
Max. Value (%) 23.11 18.03
Min. Value (%) 17.79 14.18
Rel. Difference from Mean for Max Value 14.35% 8.05%
Rel. Difference from Mean for Min Value -11.96% -15.01%
Range for Max-Min Values, Rel. to Mean 26.32% 23.05%
Ash
Mean (%) 3.15 4.39
Standard Deviation (%) 0.75 3.59
Max. Value (%) 4.92 15.84
Min. Value (%) 1.35 0.89
Rel. Difference from Mean for Max Value 55.95% 260.35%
Rel. Difference from Mean for Min Value -57.23% -79.74%
Range for Max-Min Values, Rel. to Mean 113.18% 340.09%
19
3.4 Energy Balance
The energy balances for the DIBANET and Biofine processes were calculated as their energy
requirements (see Section 3.1 for the methodology used to determine these) minus the energy
produced from the utilisation of the process residues (AHRs and, in some process
configurations, lignin). A process that produced more energy than it utilised would have a
surplus of AHRs and/or lignin that could be either sold or used to provide electricity. A
process that could not satisfy its own energy needs via the combustion of its residues would
need to purchase and combust additional biomass (it is a condition of DIBANET that fossil
fuels could not be used to fuel such process needs). This additional biomass requirement was
expressed as a tonnage of extra biomass required per tonne of biomass that was processed
through the main biorefining technology.
The energy analysis also considered the energy expended during the supply cycle of the
feedstock. In the case of sugarcane bagasse this was considered to be zero since this resource
already exists at the point of utilisation. However, Miscanthus is a dedicated energy crop and
will require energy in its cultivation and transport. Felten et al. (4) calculated a mean annual
energy requirement of 5.505 GJ/ha. Under the assumption that the productivity of Miscanthus
in Ireland is 12 dry tonnes per hectare, this is equivalent to a supply-cycle energy cost of
0.459 GJ per dry tonne of received Miscanthus.
The energy analysis also considered the energy value of the products and inputs of the
process. Where specific values for these could not be found in the literature they were
calculated based on elemental composition. The weight of each chemical used/produced per
tonne of biomass processed in the biorefinery was calculated and multiplied by its energy
content.
The final output of the energy analysis was a Table incorporating the total energy inputs, total
energy outputs, and the balance (outputs minus inputs) on the basis of each tonne of biomass
processed (GJ/t). If the balance was greater than zero then the process produced more energy
in saleable products than it required to make these products. This is an important requirement
for second generation biofuels. The Table also presented an energy ratio, determined as the
energy outputs divided by the energy inputs. An energy ratio of 1 would be equivalent to an
energy balance of zero whilst a ratio over one would reflect a positive energy balance and a
ratio less than one would reflect a negative energy balance.
The energy content of the biomass used in the biorefinery was not considered in the energy
analysis, as is common practice. However, the extra biomass that was, in some cases, needed
to fuel the processes could be considered to be an energy input since, if the metrics are based
on each tonne of biomass processed through the biorefinery, this resource would only be
utilised in the boiler and not for the production of biofuels/chemicals. Two alternative
scenarios were examined to represent this additional biomass. In the first scenario its lower
heating value (approximately 15 GJ per dry tonne for sugarcane bagasse and Miscanthus) and
its supply cycle cost (e.g. 0.459 GJ/t for Miscanthus) were considered to be energy inputs.
Hence, if the process required, for energy needs, 20% more biomass than that which would be
processed in the biorefinery, the added energy input this represents (per tonne of biomass
processed) would be equal to 15.459 multiplied by 0.2, i.e. 3.09 GJ/t. In the second scenario
only the supply-side energy costs of this additional biomass were considered (i.e. 0.459 * 0.2
= 0.09 GJ per tonne of biomass processed in the biorefinery). It is important to note that in
20
both cases the full economic prices are paid for this additional biomass ($32.5/t for bagasse
and $60/t for Miscanthus in the base cases).
3.5 Carbon Balance
As a result of the DIBANET process, biomass feedstocks have been used to produce products
such as levulinic acid, ethyl levulinate, formic acid, furfural, and lignin, and these products
can be used to substitute for products derived from oil. For instance, the lignin can be used as
a filler in recycled plastics to substitute for polyethylene, whilst levulinic acid and furfural are
viable fuel precursors to substitute for oil-based transport fuels, and ethyl-levulinate can be
directly substituted for these fuels.
The combustion of ethyl levulinate (EL) will produce 7 moles of carbon dioxide per mole of
EL, meaning that per tonne of EL 2.14 tonnes of CO2 will be emitted. Under the assumption
that the ethanol is provided from a predominately carbon-neutral source (e.g. sugarcane), this
can be considered to substitute for an equivalent amount of petroleum-derived CO2. The same
concept was applied to the DIBANET products levulinic acid, furfural, and lignin with the
quantity of fossil-fuel derived CO2 that they would substitute for being based on their
elemental compositions.
Should there be no supply side CO2 costs associated with the feedstocks being processed in
the biorefinery, then the biofuels/chemicals could be considered to be carbon neutral since the
carbon dioxide liberated on their combustion/decomposition would have been previously
removed from the atmosphere in the production of biomass. This is in contrast to fossil fuels
as their combustion adds to the level of CO2 in the atmosphere. It is reasonable to consider
that the sugarcane bagasse residue that is produced in a sugar mill has not been responsible
for the production of CO2 in its supply-cycle. This assumption can be made because this
biomass is the residue of a plant grown primarily for the production of sucrose. It would exist
at the sugar-mill whether it was going to be utilised in the DIBANET process or not.
Miscanthus, however, is an energy crop that will have been specifically grown for utilisation
in biorefining facilities. Hence, for this feedstock, it is important to consider the carbon
dioxide emitted during various stages in its production. There have been several studies in the
literature that attempt to quantify these costs. An Irish study by Styles and Jones (5) is of
particular relevance. It found that the cultivation costs for Miscanthus were 1,930 kg CO2
equivalent per hectare per year, whilst the transport costs, in terms of CO2, were minor. If it is
assumed that there is a mean yield of 12 dry tonnes of Miscanthus per hectare in Ireland, these
CO2 costs equate to 161 kg CO2 equivalent per tonne. This carbon cost was used in the model
and incurred for all Miscanthus received at the biorefining facility (i.e. the additional biomass
required for combustion was considered as well as the biomass processed in the biorefinery).
It should be noted that the situation regarding the carbon costs of Miscanthus can vary
significantly according to a number of factors. For utilisation in acid hydrolysis processes
such as DIBANET, it can be possible to harvest the crop at an earlier point in the harvest
window, as compared to when the crop is to be burnt for power generation (October versus
April, for example). This has been discussed at length in DIBANET deliverable D.2.2 which
outlines that the harvestable biomass earlier in this window is likely to be in the order of 33%
21
higher (i.e. 16 dry tonnes per hectare). Harvesting at this point would mean that the CO2 cost
per tonne of Miscanthus would be reduced by one third.
Also, since Miscanthus is a perennial grass, it accumulates a significant amount of carbon in
its roots over the life-cycle of the plantation. This can act as an effective means of carbon-
sequestration, depending on what the land was previously used for. Styles and Jones (5) in
their calculations assumed that soil carbon increased by 1.163 tonnes per hectare per year
when the land-use shifted from arable to Miscanthus cultivation, but they considered that
there would be no net change in soil carbon levels if the previous land use was for grassland.
The carbon savings provided by the DIBANET products and the carbon costs associated with
the supply of feedstock allowed for a carbon balance to be determined, on a similar basis as
the energy balance described in Section 3.4. The net carbon balance was expressed on the
basis of tonnes of CO2 saved per tonne of biomass processed in the biorefinery. The economic
analysis considered that there was value in this substitution of fossil-fuel derived CO2 and, in
the base case, assigned a value of $7 per tonne CO2 for the final net carbon balance.
3.6 Socioeconomic Evaluation
First-generation bioenergy projects can have a significant impact in a wide range of areas
including food production, rural development, and poverty alleviation. The projects are often
evaluated on the benefits/risks that they can provide both to the economy and society.
Examples of risks would be that the large-scale use of bioenergy could directly compete with
land use, water resources, and labour, for food production and that these impacts could
adversely affect food security if not properly managed. This could have a detrimental effect
on a country’s economy, particularly in the developing world. Hence, it is essential to
identify, evaluate, and numerate the social and economic impacts associated with bioenergy
production. A number of models and tools1 that allow for such an evaluation of the socio-
economic impacts of projects have been built in this context.
The evaluation of the socio-economic impacts associated with the commercial development of
the, second-generation, DIBANET process is somewhat different from what the available first
generation tools will allow because of two key differences:
a) DIBANET feedstocks are waste materials from the EU and LA (e.g. sugarcane
bagasse) or are energy crops that are not directly competitive with food (e.g.
Miscanthus).
b) The output of the DIBANET processes is an array of different chemicals and bio-
products, in contrast to most first-generation schemes where the focus is on one main
output (e.g. ethanol or biodiesel).
Under the awareness of these limitations, two tools were used to determine the socioeconomic
impacts of a scale-up of the DIBANET process:
1 Bioenergy Assessment Toolkit Technical Report NREL/TP-6A20-56456 October 2012
22
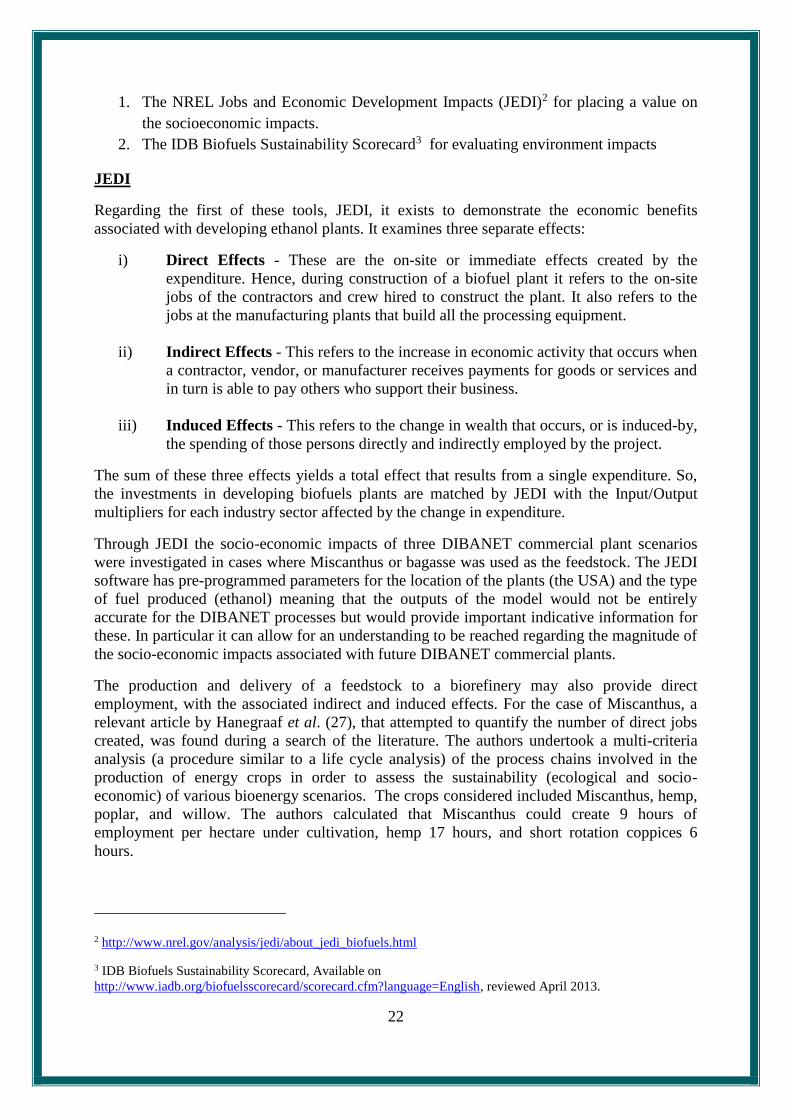
1. The NREL Jobs and Economic Development Impacts (JEDI)2 for placing a value on
the socioeconomic impacts.
2. The IDB Biofuels Sustainability Scorecard3 for evaluating environment impacts
JEDI
Regarding the first of these tools, JEDI, it exists to demonstrate the economic benefits
associated with developing ethanol plants. It examines three separate effects:
i) Direct Effects - These are the on-site or immediate effects created by the
expenditure. Hence, during construction of a biofuel plant it refers to the on-site
jobs of the contractors and crew hired to construct the plant. It also refers to the
jobs at the manufacturing plants that build all the processing equipment.
ii) Indirect Effects - This refers to the increase in economic activity that occurs when
a contractor, vendor, or manufacturer receives payments for goods or services and
in turn is able to pay others who support their business.
iii) Induced Effects - This refers to the change in wealth that occurs, or is induced-by,
the spending of those persons directly and indirectly employed by the project.
The sum of these three effects yields a total effect that results from a single expenditure. So,
the investments in developing biofuels plants are matched by JEDI with the Input/Output
multipliers for each industry sector affected by the change in expenditure.
Through JEDI the socio-economic impacts of three DIBANET commercial plant scenarios
were investigated in cases where Miscanthus or bagasse was used as the feedstock. The JEDI
software has pre-programmed parameters for the location of the plants (the USA) and the type
of fuel produced (ethanol) meaning that the outputs of the model would not be entirely
accurate for the DIBANET processes but would provide important indicative information for
these. In particular it can allow for an understanding to be reached regarding the magnitude of
the socio-economic impacts associated with future DIBANET commercial plants.
The production and delivery of a feedstock to a biorefinery may also provide direct
employment, with the associated indirect and induced effects. For the case of Miscanthus, a
relevant article by Hanegraaf et al. (27), that attempted to quantify the number of direct jobs
created, was found during a search of the literature. The authors undertook a multi-criteria
analysis (a procedure similar to a life cycle analysis) of the process chains involved in the
production of energy crops in order to assess the sustainability (ecological and socio-
economic) of various bioenergy scenarios. The crops considered included Miscanthus, hemp,
poplar, and willow. The authors calculated that Miscanthus could create 9 hours of
employment per hectare under cultivation, hemp 17 hours, and short rotation coppices 6
hours.
2 http://www.nrel.gov/analysis/jedi/about_jedi_biofuels.html
3 IDB Biofuels Sustainability Scorecard, Available on
http://www.iadb.org/biofuelsscorecard/scorecard.cfm?language=English, reviewed April 2013.

23
IDB Biofuels Sustainability Scorecard
The IDB Biofuels Sustainability Scorecard has been created by the Sustainable Energy and
Climate Change Initiative (SECCI) and the Structured and Corporate Finance Department
(SCF) of the Inter-American Development Bank (IDB). It is based on the sustainability
criteria developed as part of the Roundtable on Sustainable Biofuels (RSB).
The DIBANET process, under scenarios where either Miscanthus or sugarcane bagasse was
used as the feedstock, was evaluated using this scorecard.
3.7 Revised Set of Scenarios
According to the research outputs of the DIBANET project, discussed in Section 2, several of
the DIBANET Process Chain options listed in Table 1 could be eliminated on the basis that
they were clearly unsuitable for an economical process.
For example, it was no longer considered appropriate to subject the acid hydrolysis residues to
fast pyrolysis for the production of a bio-oil. This also meant that the formic acid obtained
from the acid hydrolysis of cellulose could not be used as a co-feed in pyrolysis but should
instead be sold as a commodity chemical. Formic acid has a well-established global market of
approximately 2 million tonnes per year at a market price of $450 per tonne (80% grade FA).
It was also clear that the pre-treatment process was integral to the DIBANET technology,
hence no grinding of the biomass would be necessary (in the case-study examples of
Miscanthus and sugarcane bagasse). A review of the literature also suggested that the
mechanism for the conversion of furfural to levulinic acid had not been demonstrated at the
appropriate scales to warrant including this pathway in the economic analysis. Instead furfural
should be considered to be of value as a commodity chemical (its current market price is
approximately $1200 per tonne).
Figure 4 presents the revised Process Chain for the integrated DIBANET process at the point
of production of each of the main primary products (LvA, FF, FA, AHRs, lignin). The process
is considered to be fixed at that point. The yields are based on a theoretical feedstock
containing 45% hexoses, 25% pentoses, and 20% lignin.

24
Figure 4: The fixed part of the final DIBANET Process Chain.
After the production of these primary products there are a revised set of variables to consider.
These relate to how these primary products are utilised and are described in Table 4.
Table 4: Variables involved in the configuration of the final DIBANET Process Chain and the
various options for these.
Variable Options Description
Hydrolysis
Stage
Carry out hydrolysis Process incorporates pretreatment and hydrolysis
No hydrolysis Only the pretreatment is modelled
Furfural sold
as….
Chemical There is an established market of ~ 600,000
tonnes/yr-1 (growing 6% per yr), at a price of
~$1,200 per tonne.
Biofuel precursor Assume $500/tonne is suitable.
Levulinic acid
end-use
Platform chemical Assume $500/tonne is suitable.
Ethyl levulinate Requires ethanol ($2.64/US gallon) and an
esterification step. Sell EL as a fuel extender at
$790/tonne (crude oil, Brent, is $795/tonne).
Lignin end-
use
Sold Assume sold as a sustainable carbon source for
fibre-board/plastics ($125/tonne).
Burn for heat and power Heating value contributes to energy requirements
with surplus energy sold as electricity to grid.
Burn some sell the rest Burn enough to satisfy energy needs and sell the
rest as a fuel
Type of boiler
system
High pressure boiler Required for the Biofine process and
esterification.
Low pressure boiler Enough for DIBANET if no EL production.
Combined heat and
power
High pressure boiler and steam turbine generator
Use of AHRs
Burn for process energy Heating value contributes to energy requirements.
Gasify Ruled out in Section 2.4.
Produce biochar Ruled out in Section 4.3.1.
Process
energy needs
Met by process outputs No additional biomass required.
Not met Requires the combustion of additional biomass.

25
The consideration of these different options led to the formation of a number of different
scenarios for modelling. These are outlined below with summaries in Table 5.
“Pretreatment” Scenario – Here only the pretreatment stage of the DIBANET
process is carried out. The saleable products are furfural, sold at its current market
price, the organosolv lignin, and the cellulosic pulp. The lignin was assumed to be sold
as a sustainable carbon source for fibre-board/plastics. It should be noted that the
value attributed to the lignin ($125/tonne) for this end use in the economic analysis
was quite conservative. Analytical work at UL suggests that this lignin is of a quality
comparable to organosolv lignin, a version of which the Canadian biorefining
company Lignol claims to be able to sell for a price ranging from $500-$2,000 per
tonne.
The cellulosic pulp is considered to be a highly valuable feedstock for second
generation biorefining to ethanol and other products (e.g. via enzymatic hydrolysis and
fermentation of the resulting sugars). Such biorefining companies would be paying for
a feedstock that requires no grinding or pretreatment, has an enhanced surface area, is
virtually free from lignin (a strong inhibitor in enzymatic hydrolysis), and has an
improved carbohydrate content (~85%) which is mostly (~94%) cellulose (the glucan
monomers of cellulose are much easier to ferment than pentoses). Considering all of
this a value of $100 per dry tonne was placed on the pulp.
In the pretreatment, the AHRs are produced from the portion of the pentoses that
produce condensation products (humins) and these are used to provide process heat
with the combustion of additional biomass used to meet the energy shortfall (if it
exists). If AHRs are produced in excess to the process needs then these are sold as fuel
at a price of $40/MT.
“Biorefining Scenario” – This scenario incorporates the DIBANET pre-treatment,
with the same prices applied to the furfural and lignin products. It then incorporates
the DIBANET hydrolysis technology to process the pulp from the pre-treatment. The
FA is sold as a commodity chemical ($450/MT) and the LvA is sold directly as a
platform chemical. For there to be a mass market for LvA as such a chemical, it was
considered that the price should be $500/MT. The AHRs from this scenario would
come from the humins from the pre-treatment and hydrolysis, and these are used to
provide process heat with additional biomass used, or the surplus AHRs sold,
depending on the energy balance, as in the “Pretreatment” scenario. The additional
process stages will mean that the “Biorefining” scenario will have higher capital and
energy costs than the “Pretreatment” scenario.
“Biofuels” Scenario – It was considered that there may be the argument that the
economics of such a “Biorefining” facility would be heavily dependent on selling co-
products in addition to the main levulinic acid product, and with some of these co-
products (e.g. furfural) of significantly greater value. There may be the situation, if
multiple large scale DIBANET biorefineries were built, that the market may become
saturated for some of these products, such as lignin (in its high value applications) and
furfural. UL researchers would contest such arguments. For example, for the sale of
lignin, the highest-value, but lowest-volume, applications for organosolv-type lignins
26
(see some examples in Table 6) are not considered in the “Biorefinery” scenario
whereas the market for recycled plastics is vast.
Furthermore, considering the sale of furfural as a commodity chemical, the market by
2020 is expected to be 1m tonnes per year. That would mean that one large-scale
DIBANET biorefinery (processing 475,000 dry tonnes of sugarcane bagasse per year)
would only take up 5.9% of this market; hence 8 such biorefineries would be required
to take a 50% market share.
Nevertheless, an alternative scenario, given the title “Biofuels”, was formulated. It did
not consider these higher value applications for the co-products of LvA. This scenario
incorporates the pre-treatment, cellulose hydrolysis, and levulinic acid esterification
stages. The furfural is sold for the same value as the LvA ($500/MT) to be used as a
biofuel precursor, for example for the production of methyl-tetrohydrofuran (MTHF),
whilst the lignin is combusted to provide process heat and energy. The price for FA is
equal to that in the “Biorefining” scenario ($450/MT). If there would be a quantity of
lignin in excess to that which would be required to fuel the process, considerations
would be made as to whether the surplus energy could be used to produce electricity
for sale or whether the excess lignin would be sold as a solid fuel (at a value of
$40/MT). These options are discussed in Section 4.6.3. In the base case the surplus
lignin was sold as a fuel.
In the “Biofuels” scenario the LvA from the DIBANET hydrolysis process is
esterified with ethanol to produce ethyl levulinate which is sold at a market price of
(€790/MT). This stage of the process requires high temperatures and pressures,
meaning that low pressure boilers would not be suitable in this scenario. The
additional process stages will mean that the “Biofuels” scenario will have higher
capital and energy costs than the “Biorefining” scenario.
“Combined” Scenario – This scenario has the same products as the “Biofuels”
scenario, but it differs in its use of the lignin (sold at $125/MT, the same value as in
the “Pretreatment” and “Biorefining” scenarios) and in the sales price of furfural (the
current market price of $1200/MT is used, as in the “Pretreatment” and “Biorefining”
scenarios). Whereas the “Biofuels” scenario is unrealistically pessimistic, the
“Combined” scenario represents the most likely configuration of a DIBANET facility
producing ethyl-levulinate. In this configuration high value co-products are sold in
addition to the biofuel, encapsulating the concept of a biofuels biorefinery. This
scenario has the same energy and capital costs as the “Biofuels” scenario. Process
energy needs are supplied by the AHRs that are produced from the hexoses/pentoses
that do not form the saleable products. Additional biomass is combusted or the surplus
AHRs sold ($40/MT), depending on the energy balance at this stage.
Biofine Process – The standard two reactor Biofine system is considered. This
requires the use of a high pressure boiler to supply the process steam and produces
levulinic acid, formic acid, furfural and AHRs that incorporate the lignin content of
the feedstock. The values given to the chemical products are the same as in the
“Biorefining” scenario. The AHRs are used to provide process heat with additional
biomass combusted, or the surplus AHRs sold ($40/MT), depending on the energy
balance at this stage. Estimates for the capital cost of the Biofine process were
27
calculated and included the cost of the biorefining system and the required high
pressure boiler system.
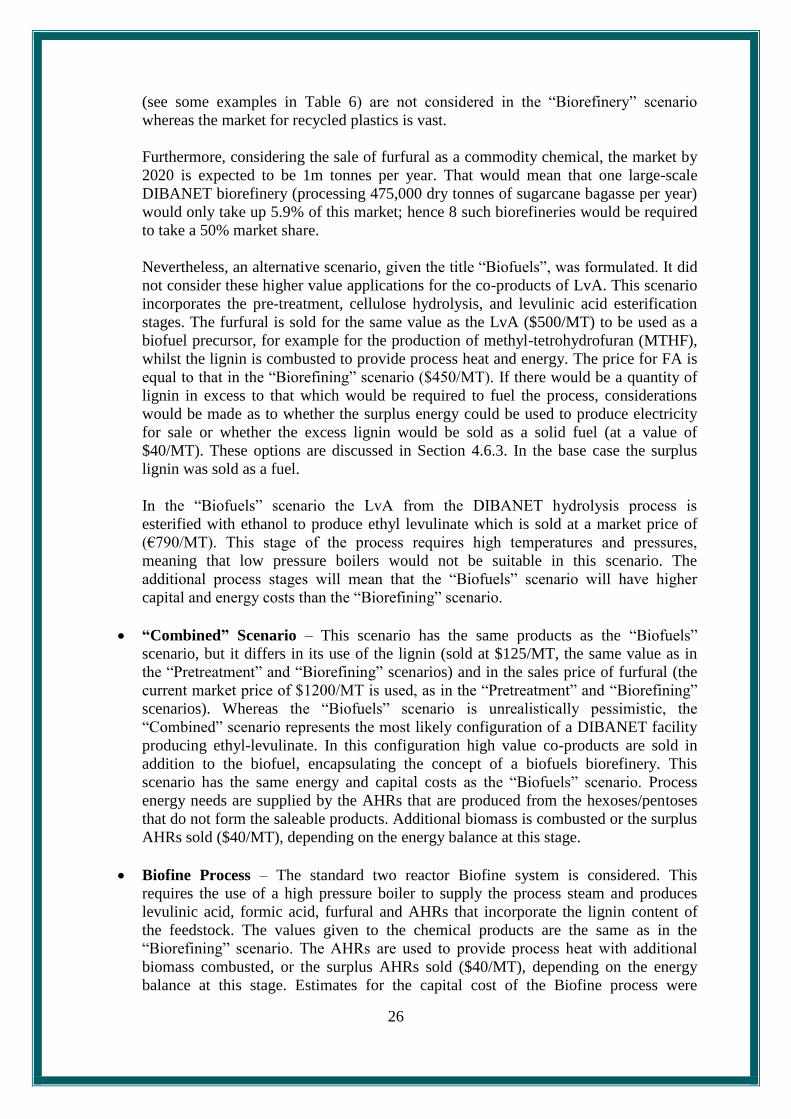
Table 5: The options chosen for Biofine and the different configurations of the DIBANET
Process Chain according to the “Pretreatment”, “Combined”, “Biorefining”, and
“Biofuels” scenarios.
Variable Options Technology/Scenario
Pretreatment Combined Biorefining Biofuels Biofine
Hydrolysis
Stage
Carry out hydrolysis ✓ ✓ ✓ ✓
No hydrolysis ✓
Furfural sold
as….
Chemical ✓ ✓ ✓ ✓
Biofuel precursor ✓
Levulinic acid
end-use
Platform chemical ✓ ✓
Ethyl levulinate ✓ ✓
Lignin end-use
Sold ($125/MT) ✓ ✓ ✓
Burn for heat and power ✓* ✓
Burn some sell the rest ✓*
Type of boiler
system
High pressure boiler ✓ ✓* ✓
Low pressure boiler ✓ ✓
Combined heat and power ✓*
Use of AHRs
Burn for process energy ✓ ✓ ✓ ✓ ✓
Gasify Not considered suitable, see Section 2.4
Produce biochar Not considered suitable, see Section 4.3.1
Process energy
needs
Met by process outputs ✓
Not Met ✓ ✓ ✓ ✓
* both of these options were investigated for this scenario.
Table 6: Some potential applications for derivatives of the lignin obtained in DIBANET.
Chemicals Uses Market Price
Plastics Carbon filler (blended with
recycled polyethylene)
4.8m MT/yr $125/MT
BTX
(Benzene, Toluene,
Xylene)
Solvents 102 m MT/yr
$122 billion/yr
(est. 2020)
$1,200/MT
Phenol Resins, surfactants, epoxy
resins, adhesives, polyester
8 m MT/yr (est. 2015) $1,500/MT
Vanillin Food additives 16,000 MT/yr $600,000/MT
Carbon Fibre 46,000 MT/yr (est. 2020) $34,800/MT
Biocrude Hydro-pyrolysis Transport fuels
28
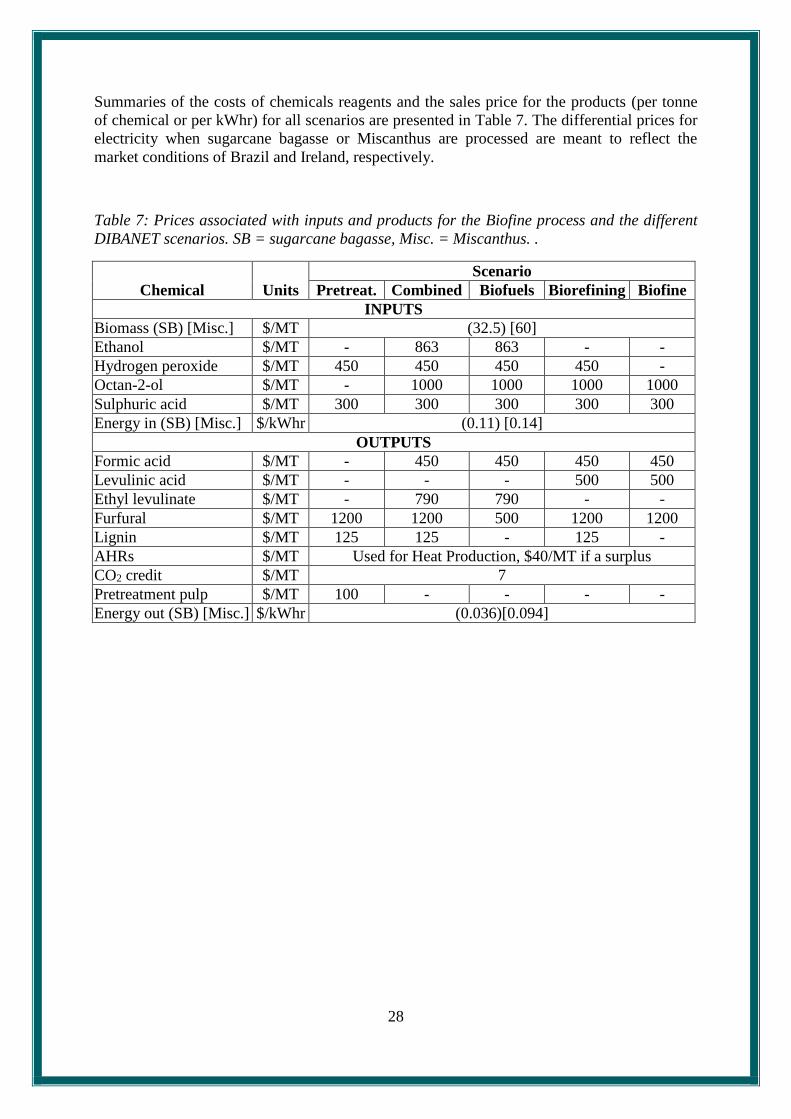
Summaries of the costs of chemicals reagents and the sales price for the products (per tonne
of chemical or per kWhr) for all scenarios are presented in Table 7. The differential prices for
electricity when sugarcane bagasse or Miscanthus are processed are meant to reflect the
market conditions of Brazil and Ireland, respectively.
Table 7: Prices associated with inputs and products for the Biofine process and the different
DIBANET scenarios. SB = sugarcane bagasse, Misc. = Miscanthus. .
Chemical Units
Scenario
Pretreat. Combined Biofuels Biorefining Biofine
INPUTS
Biomass (SB) [Misc.] $/MT (32.5) [60]
Ethanol $/MT - 863 863 - -
Hydrogen peroxide $/MT 450 450 450 450 -
Octan-2-ol $/MT - 1000 1000 1000 1000
Sulphuric acid $/MT 300 300 300 300 300
Energy in (SB) [Misc.] $/kWhr (0.11) [0.14]
OUTPUTS
Formic acid $/MT - 450 450 450 450
Levulinic acid $/MT - - - 500 500
Ethyl levulinate $/MT - 790 790 - -
Furfural $/MT 1200 1200 500 1200 1200
Lignin $/MT 125 125 - 125 -
AHRs $/MT Used for Heat Production, $40/MT if a surplus
CO2 credit $/MT 7
Pretreatment pulp $/MT 100 - - - -
Energy out (SB) [Misc.] $/kWhr (0.036)[0.094]
29
4 Results
Note that, unless otherwise stated, the results in this Section are presented for the “base-case”.
This put the scale of the biorefinery at 500,000 dry tonnes of biomass per annum (used for
capital costs) and assumes that it operates at a 95% availability, meaning that 475,000 tonnes
of feedstock are processed per year. Unless Miscanthus is specifically referred to, the base
case relates to the use of sugarcane bagasse.
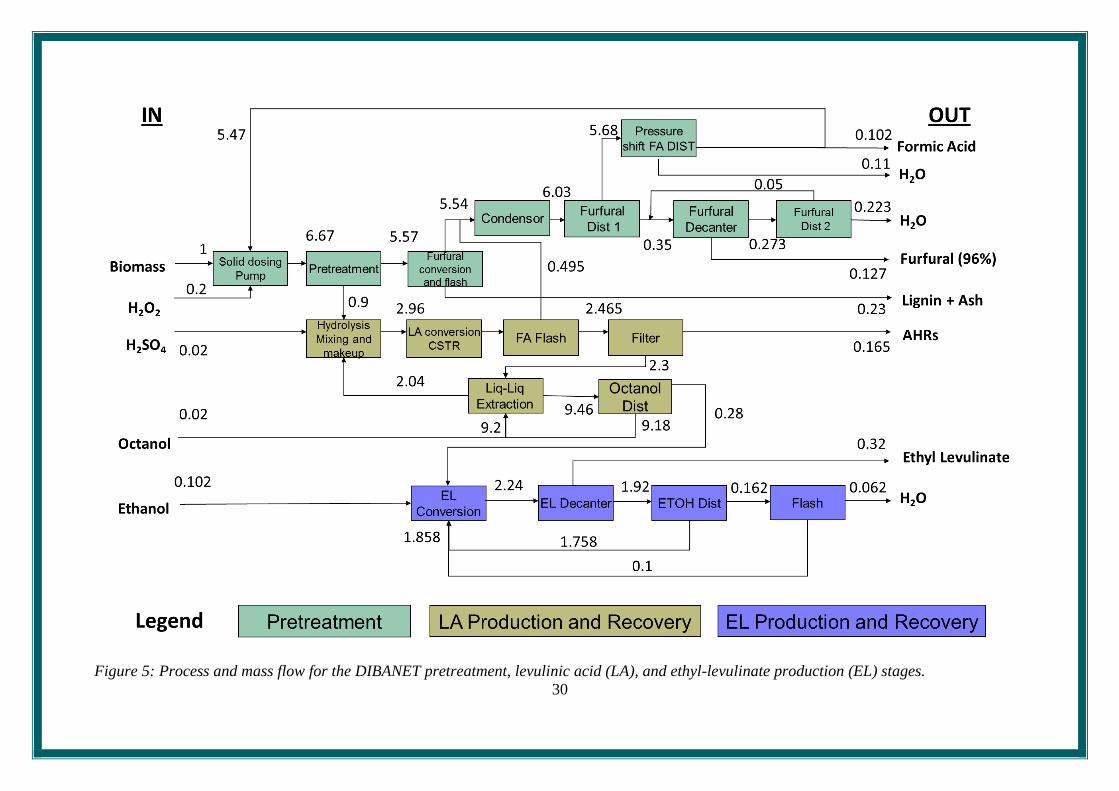
4.1 Process Inputs and Outputs
Figure 5 presents the process mass flow for the integrated DIBANET process producing
furfural, lignin, ethyl levulinate, and formic acid from a theoretical feedstock containing 45%
cellulose, 25% xylose, and 20% lignin. The numbers above each process line represent the
mass input/output from that point. For example, 1 dry tonne of biomass enters the solid
dosing pump and this is joined by 200kg of hydrogen peroxide and 5.47 tonnes of the
recycled formic acid from the pre-treatment, making up a total of 6.67 tonnes of slurry that
goes through the pre-treatment process.
Table 8 presents the process chemical and biomass inputs required by the Biofine process and
the various DIBANET scenarios. These are expressed on the basis of tonnes of material
required per tonne of biomass processed in the biorefinery. The data are for a base-case
facility (a 500,000 tonnes per year facility operating at an availability of 95%, meaning that
475,000 tonnes of biomass are processed per year) processing sugarcane bagasse. Extra
biomass is necessary in cases where the energy needs of the process are not met by the
residues (see Section 4.2.1 for further discussion on this). Table 9 presents the equivalent data
when Miscanthus is used. There are differences between the two feedstocks in terms of the
extra biomass that is needed to fuel the process and the amount of ethanol required in
scenarios (“Combined” and “Biofuels”) where the levulinic acid is esterified with ethanol.
The higher requirement for ethanol in the case of Miscanthus is a reflection of the higher
levulinic acid yields obtained from this feedstock due to its greater hexose content. The
Biofine process has relatively low requirements, by mass, of chemicals compared to the
DIBANET processes; however, it requires a significantly greater amount of biomass to supply
the energy needs of the process.
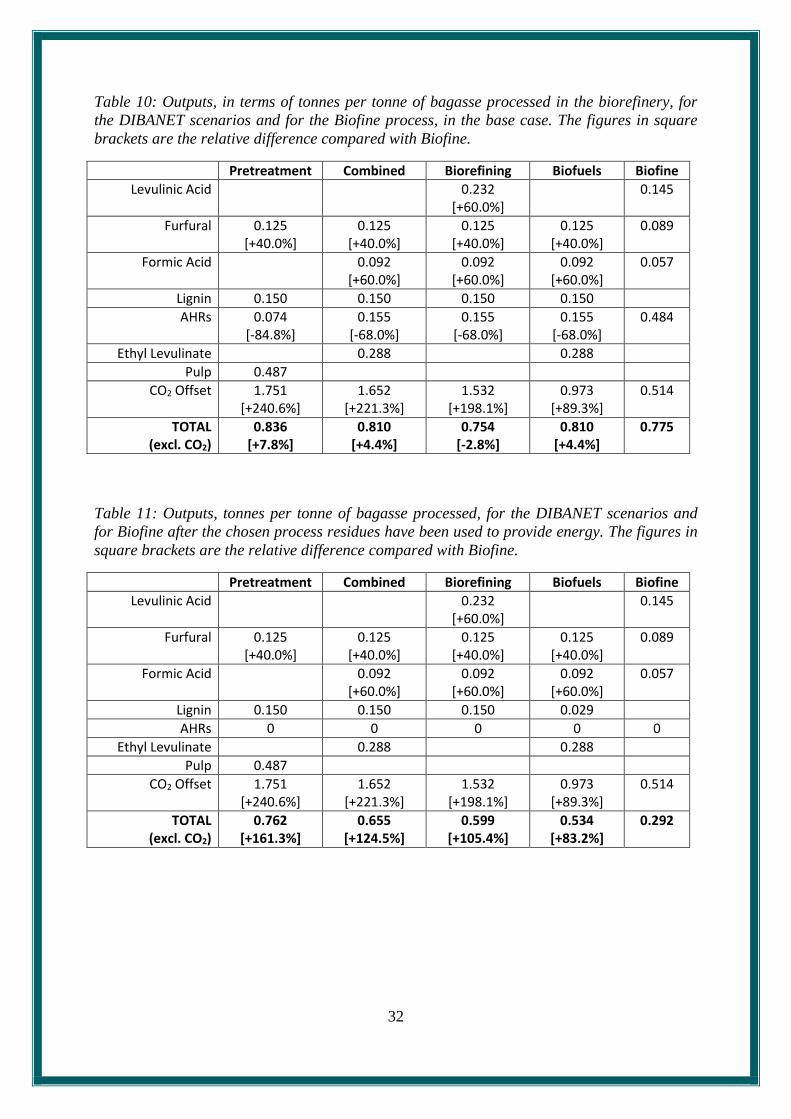
Table 10 shows the primary outputs of Biofine and the different DIBANET scenarios when
sugarcane bagasse is used as the feedstock (see Table 12 for the equivalent data for
Miscanthus). Once again, these values are expressed on the basis of tonnage output per tonne
of biomass processed in the biorefinery and, where applicable, comparisons with the Biofine
process are presented in the values within the square brackets. Some of these outputs are used
internally for process heat (e.g. AHRs and lignin in the case of Biofine and the “Biofuels”
scenarios and the AHRs only for the other DIBANET scenarios). That means they do not
reflect true final outputs. Hence, Table 11 presents the final outputs after the internal use
within the processes have been considered (see Table 13 for the data for Miscanthus). These
Tables also present the tonnes of fossil-based carbon dioxide offset by the production of these
chemicals, as discussed in Sections 3.5 and 4.4. This quantity of CO2 is not considered to
contribute to the total tonnage output of the different processes. Table 10 and Table 11 are
represented in Figure 6 and Table 12 and Table 13 in Figure 7.
30
Figure 5: Process and mass flow for the DIBANET pretreatment, levulinic acid (LA), and ethyl-levulinate production (EL) stages.

31
Table 8: Inputs, in terms of tonnes required per tonne of bagasse processed, for the DIBANET
scenarios and for the Biofine process, in the base-case. The figures in square brackets are the
relative difference compared with Biofine.
Pretreatment Combined Biorefining Biofuels Biofine
Hydrogen Peroxide 0.200 0.200 0.200 0.200
Sulphuric Acid 0.020 [0.0%]
0.020 [0.0%]
0.020 [0.0%]
0.020
Octanol 0.020 [-50.0%]
0.020 [-50.0%]
0.020 [-50.0%]
0.040
Ethanol 0.092 0.092
Extra Biomass 0.050 [-91.3%]
0.185 [-67.7%]
0.107 [-81.3%]
0.000 [-100.0%]
0.572
Table 9: Inputs, in terms of tonnes required per tonne of Miscanthus processed, for the
DIBANET scenarios and for the Biofine process, in the base-case. The figures in square
brackets are the relative difference compared with Biofine.
Pretreatment Combined Biorefining Biofuels Biofine
Hydrogen Peroxide 0.200 0.200 0.200 0.200
Sulphuric Acid 0.020 [0.0%]
0.020 [0.0%]
0.020 [0.0%]
0.020
Octanol 0.020 [-50.0%]
0.020 [-50.0%]
0.020 [-50.0%]
0.040
Ethanol 0.100 0.100
Extra Biomass 0.065 [-87.6%]
0.190 [-63.5%]
0.112 [-78.5%]
0.000 [-100.0%]
0.522
The total output of usable products in Table 10 ranges from 0.754 to 0.836 tonnes per tonne of
bagasse processed in the biorefinery. There is little relative difference between all of the
DIBANET process and Biofine in this case. However, most of the Biofine products are AHRs
(the lignin is also incorporated within the AHRs) and these are of a very low value and are
required to fuel the high energy demands of the process. Hence, these products are no longer
present after the process needs have been considered, as can be seen in Table 11 which also
shows that, after this consideration, there are considerably more useful saleable products from
the DIBANET processes compared with Biofine.
In those processes that produce ethyl levulinate this product is the main output, by mass,
followed by the lignin, furfural, and formic acid. In the “Biorefining” scenario levulinic acid
is the main product, whilst in the “Pretreatment” scenario the pulp represents 58.3% of the
output, by mass, for sugarcane bagasse.
32
Table 10: Outputs, in terms of tonnes per tonne of bagasse processed in the biorefinery, for
the DIBANET scenarios and for the Biofine process, in the base case. The figures in square
brackets are the relative difference compared with Biofine.
Pretreatment Combined Biorefining Biofuels Biofine
Levulinic Acid 0.232 [+60.0%]
0.145
Furfural 0.125 [+40.0%]
0.125 [+40.0%]
0.125 [+40.0%]
0.125 [+40.0%]
0.089
Formic Acid 0.092 [+60.0%]
0.092 [+60.0%]
0.092 [+60.0%]
0.057
Lignin 0.150 0.150 0.150 0.150
AHRs 0.074 [-84.8%]
0.155 [-68.0%]
0.155 [-68.0%]
0.155 [-68.0%]
0.484
Ethyl Levulinate 0.288 0.288
Pulp 0.487
CO2 Offset 1.751 [+240.6%]
1.652 [+221.3%]
1.532 [+198.1%]
0.973 [+89.3%]
0.514
TOTAL (excl. CO2)
0.836 [+7.8%]
0.810 [+4.4%]
0.754 [-2.8%]
0.810 [+4.4%]
0.775
Table 11: Outputs, tonnes per tonne of bagasse processed, for the DIBANET scenarios and
for Biofine after the chosen process residues have been used to provide energy. The figures in
square brackets are the relative difference compared with Biofine.
Pretreatment Combined Biorefining Biofuels Biofine
Levulinic Acid 0.232 [+60.0%]
0.145
Furfural 0.125 [+40.0%]
0.125 [+40.0%]
0.125 [+40.0%]
0.125 [+40.0%]
0.089
Formic Acid 0.092 [+60.0%]
0.092 [+60.0%]
0.092 [+60.0%]
0.057
Lignin 0.150 0.150 0.150 0.029
AHRs 0 0 0 0 0
Ethyl Levulinate 0.288 0.288
Pulp 0.487
CO2 Offset 1.751 [+240.6%]
1.652 [+221.3%]
1.532 [+198.1%]
0.973 [+89.3%]
0.514
TOTAL (excl. CO2)
0.762 [+161.3%]
0.655 [+124.5%]
0.599 [+105.4%]
0.534 [+83.2%]
0.292

33
Table 12: Outputs, tonnes per tonne of Miscanthus processed, for the DIBANET scenarios
and for Biofine, in the base case. The figures in square brackets are the relative difference
compared with Biofine.
Pretreatment Combined Biorefining Biofuels Biofine
Levulinic Acid 0.252 [+60.0%]
0.157
Furfural 0.107 [+40.0%]
0.107 [+40.0%]
0.107 [+40.0%]
0.107 [+40.0%]
0.076
Formic Acid 0.100 [+60.0%]
0.100 [+60.0%]
0.100 [+60.0%]
0.062
Lignin 0.182 0.182 0.182 0.182
AHRs 0.063 [-87.8%]
0.151 [-70.8%]
0.151 [-70.8%] 0.151 [-70.8%]
0.517
Ethyl Levulinate 0.313 0.313
Pulp 0.487
CO2 Offset 1.697 [+538.4%]
1.630 [+513.3%]
1.513 [+469.2%]
0.892 [+235.8%]
0.266
TOTAL (excl. CO2)
0.838 [+3.2%]
0.852 [+4.8%]
0.791 [-2.7%]
0.852 [+4.8%]
0.813
Table 13: Outputs, in terms of tonnes per tonne of Miscanthus processed, for the DIBANET
scenarios and for the Biofine process after the chosen process residues have been used to
provide energy. The figures in square brackets are the relative difference compared with
Biofine.
Pretreatment Combined Biorefining Biofuels Biofine
Levulinic Acid 0.252 [+60.0%]
0.157
Furfural 0.107 [+40.0%]
0.107 [+40.0%]
0.107 [+40.0%]
0.107 [+40.0%]
0.076
Formic Acid 0.100 [+60.0%]
0.100 [+60.0%]
0.100 [+60.0%]
0.062
Lignin 0.182 0.182 0.182 0.058
AHRs 0 0 0 0 0
Ethyl Levulinate 0.313 0.313
Pulp 0.487
CO2 Offset 1.697 [+538.4%]
1.630 [+513.3%]
1.513 [+469.2%]
0.892 [+235.8%]
0.266
TOTAL (excl. CO2)
0.776 [+162.0%]
0.701 [+136.8%]
0.640 [+116.3%]
0.577 [+94.9%]
0.296

34
Figure 6: Products (in tonnes per tonne of biomass input) from processing bagasse in the
Biofine and the DIBANET processes, both before and after process use.
Figure 7: Products (in tonnes per tonne of biomass input) from processing Miscanthus in the
Biofine and the DIBANET processes, both before and after process use.

35
4.2 Energy Balance
4.2.1 Process Energy Requirements and Provision by Residues
Under the assumption that the AHRs, and possibly the lignin in the “Biofuels” scenario, were
combusted (rather than gasified or pyrolysed) to provide process energy requirements, an
energy analysis was undertaken for the various DIBANET scenarios and the Biofine process.
The requirements of each process, the amount of energy provided by the residues, and the
energy balance are presented in Table 14, along with the required amount of extra biomass
that would need to be combusted to satisfy the process needs. These data are for a base-case
facility using sugarcane bagasse as feedstock. All energy values in Table 14 are presented on
the basis of GJ per tonne of biomass processed through the biorefinery. The biomass
requirement is presented on the basis of extra tonnes of biomass required for combustion per
tonne of biomass processed through the biorefinery. Table 14 compares the values for each
DIBANET scenario with those for Biofine and presents, in square brackets, the values for the
relative difference.
Table 14: Energy requirements for the different DIBANET scenarios and for Biofine using
sugarcane bagasse as feedstock. Figures for the amount of energy produced from the process
residues (AHRs and, in some scenarios, lignin) are also presented along with the proportion
of the process energy that these contribute to. The figures in square brackets are the relative
difference compared with Biofine.
Pretreat. Combined Biorefining Biofuels Biofine
Combined - No
Combustion
Energy Required (GJ/t-processed)
1.948 [-88.0%]
5.119 [-68.4%]
4.122 [-74.6%]
5.119 [-68.4%]
16.200 5.119 [-68.4%]
Energy From Residues (GJ/t-processed)
1.315 [-85.2%]
2.760 [-69.0%]
2.760 [-69.0%]
5.695 [-36.0%]
8.903 0.000 [-100.0%]
% of Process Energy from Residues
67.5% [+22.8%]
53.9% [-1.9%]
67.0% [+21.8%]
100.0% [+82.0%]
55.0% 0.0% [-100.0%]
Extra Energy Required (GJ/t-processed)
0.633 [-91.3%]
2.359 [-67.7%]
1.362 [-81.3%]
-0.576 [-107.9%]
7.297 5.119 [-29.8%]
Biomass Required (t/t-processed)
0.050 [-91.3%]
0.185 [-67.7%]
0.107 [-81.3%]
0.000 [-100.0%]
0.572 0.402 [-29.8%]
Table 14 shows that the energy requirement for the “Pretreatment” scenario has been
estimated to be 1.95 GJ per tonne of biomass processed and that 67.5% of this process
requirement can be supplied via the combustion of the AHRs. The “Biorefining” scenario has
a higher energy cost, 4.12 GJ/tonne, as a result of the extra energy required for the hydrolysis
of the pulp from the pretreatment for the recovery of levulinic acid. The “Combined” and
“Biofuels” scenarios have the highest energy requirements, 5.12 GJ/tonne, of the various
options DIBANET energy requirements since extra energy is required for the esterification of
levulinic with ethanol and the subsequent recovery of the EL. For Biofine, the energy required
has been estimated to be 16.2 GJ per tonne of biomass processed. It is most appropriate to
compare the DIBANET “Biorefining” scenario with Biofine since it also produces levulinic
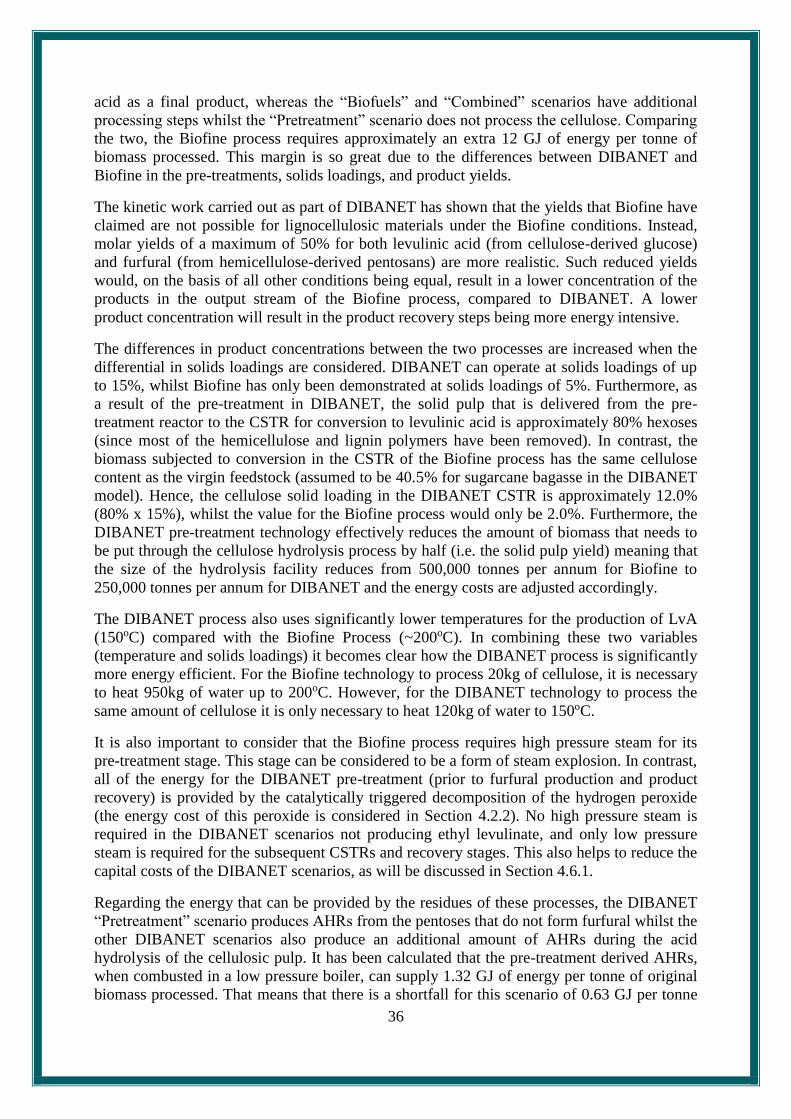
36
acid as a final product, whereas the “Biofuels” and “Combined” scenarios have additional
processing steps whilst the “Pretreatment” scenario does not process the cellulose. Comparing
the two, the Biofine process requires approximately an extra 12 GJ of energy per tonne of
biomass processed. This margin is so great due to the differences between DIBANET and
Biofine in the pre-treatments, solids loadings, and product yields.
The kinetic work carried out as part of DIBANET has shown that the yields that Biofine have
claimed are not possible for lignocellulosic materials under the Biofine conditions. Instead,
molar yields of a maximum of 50% for both levulinic acid (from cellulose-derived glucose)
and furfural (from hemicellulose-derived pentosans) are more realistic. Such reduced yields
would, on the basis of all other conditions being equal, result in a lower concentration of the
products in the output stream of the Biofine process, compared to DIBANET. A lower
product concentration will result in the product recovery steps being more energy intensive.
The differences in product concentrations between the two processes are increased when the
differential in solids loadings are considered. DIBANET can operate at solids loadings of up
to 15%, whilst Biofine has only been demonstrated at solids loadings of 5%. Furthermore, as
a result of the pre-treatment in DIBANET, the solid pulp that is delivered from the pre-
treatment reactor to the CSTR for conversion to levulinic acid is approximately 80% hexoses
(since most of the hemicellulose and lignin polymers have been removed). In contrast, the
biomass subjected to conversion in the CSTR of the Biofine process has the same cellulose
content as the virgin feedstock (assumed to be 40.5% for sugarcane bagasse in the DIBANET
model). Hence, the cellulose solid loading in the DIBANET CSTR is approximately 12.0%
(80% x 15%), whilst the value for the Biofine process would only be 2.0%. Furthermore, the
DIBANET pre-treatment technology effectively reduces the amount of biomass that needs to
be put through the cellulose hydrolysis process by half (i.e. the solid pulp yield) meaning that
the size of the hydrolysis facility reduces from 500,000 tonnes per annum for Biofine to
250,000 tonnes per annum for DIBANET and the energy costs are adjusted accordingly.
The DIBANET process also uses significantly lower temperatures for the production of LvA
(150oC) compared with the Biofine Process (~200oC). In combining these two variables
(temperature and solids loadings) it becomes clear how the DIBANET process is significantly
more energy efficient. For the Biofine technology to process 20kg of cellulose, it is necessary
to heat 950kg of water up to 200oC. However, for the DIBANET technology to process the
same amount of cellulose it is only necessary to heat 120kg of water to 150oC.
It is also important to consider that the Biofine process requires high pressure steam for its
pre-treatment stage. This stage can be considered to be a form of steam explosion. In contrast,
all of the energy for the DIBANET pre-treatment (prior to furfural production and product
recovery) is provided by the catalytically triggered decomposition of the hydrogen peroxide
(the energy cost of this peroxide is considered in Section 4.2.2). No high pressure steam is
required in the DIBANET scenarios not producing ethyl levulinate, and only low pressure
steam is required for the subsequent CSTRs and recovery stages. This also helps to reduce the
capital costs of the DIBANET scenarios, as will be discussed in Section 4.6.1.
Regarding the energy that can be provided by the residues of these processes, the DIBANET
“Pretreatment” scenario produces AHRs from the pentoses that do not form furfural whilst the
other DIBANET scenarios also produce an additional amount of AHRs during the acid
hydrolysis of the cellulosic pulp. It has been calculated that the pre-treatment derived AHRs,
when combusted in a low pressure boiler, can supply 1.32 GJ of energy per tonne of original
biomass processed. That means that there is a shortfall for this scenario of 0.63 GJ per tonne
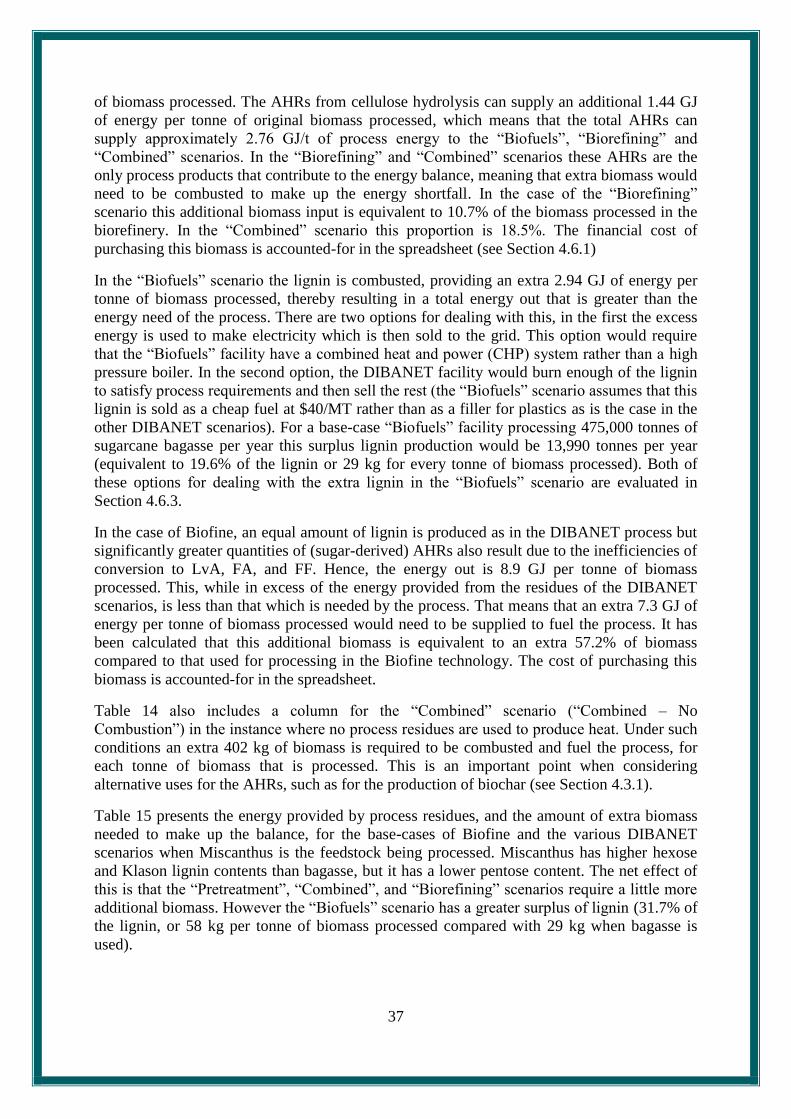
37
of biomass processed. The AHRs from cellulose hydrolysis can supply an additional 1.44 GJ
of energy per tonne of original biomass processed, which means that the total AHRs can
supply approximately 2.76 GJ/t of process energy to the “Biofuels”, “Biorefining” and
“Combined” scenarios. In the “Biorefining” and “Combined” scenarios these AHRs are the
only process products that contribute to the energy balance, meaning that extra biomass would
need to be combusted to make up the energy shortfall. In the case of the “Biorefining”
scenario this additional biomass input is equivalent to 10.7% of the biomass processed in the
biorefinery. In the “Combined” scenario this proportion is 18.5%. The financial cost of
purchasing this biomass is accounted-for in the spreadsheet (see Section 4.6.1)
In the “Biofuels” scenario the lignin is combusted, providing an extra 2.94 GJ of energy per
tonne of biomass processed, thereby resulting in a total energy out that is greater than the
energy need of the process. There are two options for dealing with this, in the first the excess
energy is used to make electricity which is then sold to the grid. This option would require
that the “Biofuels” facility have a combined heat and power (CHP) system rather than a high
pressure boiler. In the second option, the DIBANET facility would burn enough of the lignin
to satisfy process requirements and then sell the rest (the “Biofuels” scenario assumes that this
lignin is sold as a cheap fuel at $40/MT rather than as a filler for plastics as is the case in the
other DIBANET scenarios). For a base-case “Biofuels” facility processing 475,000 tonnes of
sugarcane bagasse per year this surplus lignin production would be 13,990 tonnes per year
(equivalent to 19.6% of the lignin or 29 kg for every tonne of biomass processed). Both of
these options for dealing with the extra lignin in the “Biofuels” scenario are evaluated in
Section 4.6.3.
In the case of Biofine, an equal amount of lignin is produced as in the DIBANET process but
significantly greater quantities of (sugar-derived) AHRs also result due to the inefficiencies of
conversion to LvA, FA, and FF. Hence, the energy out is 8.9 GJ per tonne of biomass
processed. This, while in excess of the energy provided from the residues of the DIBANET
scenarios, is less than that which is needed by the process. That means that an extra 7.3 GJ of
energy per tonne of biomass processed would need to be supplied to fuel the process. It has
been calculated that this additional biomass is equivalent to an extra 57.2% of biomass
compared to that used for processing in the Biofine technology. The cost of purchasing this
biomass is accounted-for in the spreadsheet.
Table 14 also includes a column for the “Combined” scenario (“Combined – No
Combustion”) in the instance where no process residues are used to produce heat. Under such
conditions an extra 402 kg of biomass is required to be combusted and fuel the process, for
each tonne of biomass that is processed. This is an important point when considering
alternative uses for the AHRs, such as for the production of biochar (see Section 4.3.1).
Table 15 presents the energy provided by process residues, and the amount of extra biomass
needed to make up the balance, for the base-cases of Biofine and the various DIBANET
scenarios when Miscanthus is the feedstock being processed. Miscanthus has higher hexose
and Klason lignin contents than bagasse, but it has a lower pentose content. The net effect of
this is that the “Pretreatment”, “Combined”, and “Biorefining” scenarios require a little more
additional biomass. However the “Biofuels” scenario has a greater surplus of lignin (31.7% of
the lignin, or 58 kg per tonne of biomass processed compared with 29 kg when bagasse is
used).

38
Table 15: Energy requirements for the DIBANET scenarios and Biofine using Miscanthus.
Figures for the amount of energy produced from the process residues (AHRs and, in some
scenarios, lignin) are also presented along with the proportion of the process energy that
these contribute to. The figures in square brackets are the relative difference compared with
Biofine.
Pretreatment Combined Biorefining Biofuels Biofine
Energy Required (GJ/t-processed)
1.948 [-88.0%]
5.119 [-68.4%]
4.122 [-74.6%]
5.119 [-68.4%]
16.200
Energy From Residues (GJ/t-processed)
1.122 [-88.2%]
2.692 [-71.8%]
2.692 [-71.8%]
6.248 [-34.6%]
9.548
% of Process Energy from Residues
57.6% [-2.2%]
52.6% [-10.8%]
65.3% [+10.8%]
100.0% [+69.7%]
58.9%
Extra Energy Required (GJ/t-processed)
0.825 [-87.6%]
2.427 [-63.5%]
1.430 [-78.5%]
-1.128 [-117.0%]
6.652
Biomass Required (t/t-processed)
0.065 [-87.6%]
0.190 [-63.5%]
0.112 [-78.5%]
0.000 [-100.0%]
0.522
4.2.2 Full Energy Analysis
4.2.2.1 Products
The full energy analysis considers the energy of the products and the energy of the inputs in
order to determine an energy balance and energy ratio, as discussed in Section 3.4. Table 16
presents the energy values of products of Biofine and the DIBANET scenarios in the base-
case using sugarcane bagasse. The energy values are presented on the basis of GJ per tonne of
biomass processed through the biorefinery. The values from the DIBANET scenarios are
compared to the Biofine process with the values in square brackets. Figure 8 presents pie-
charts showing the energy distribution of the products for each process.
Table 16: Energy value of the products of the Biofine process and DIBANET scenarios, using
bagasse as the feedstock. Values are presented as GJ per tonne of biomass processed. The
DIBANET scenarios are compared to the Biofine process with the values in square brackets.
Pretreatment Combined Biorefining Biofuels Biofine
Levulinic Acid 5.080 [+60.0%]
3.175
Furfural 2.910 [+40.0%]
2.910 [+40.0%]
2.910 [+40.0%]
2.910 [+40.0%]
2.078
Formic Acid 0.478 [+60.0%]
0.478 [+60.0%]
0.478 [+60.0%]
0.299
Lignin 3.453 3.453 3.453 0.678
AHR 0 0 0 0 0
Ethyl Levulinate 7.485 7.485
Pulp 7.978
TOTAL 14.341 [+158.3%]
14.327 [+158.0%]
11.922 [+114.7%]
11.551 [+108.0%]
5.552
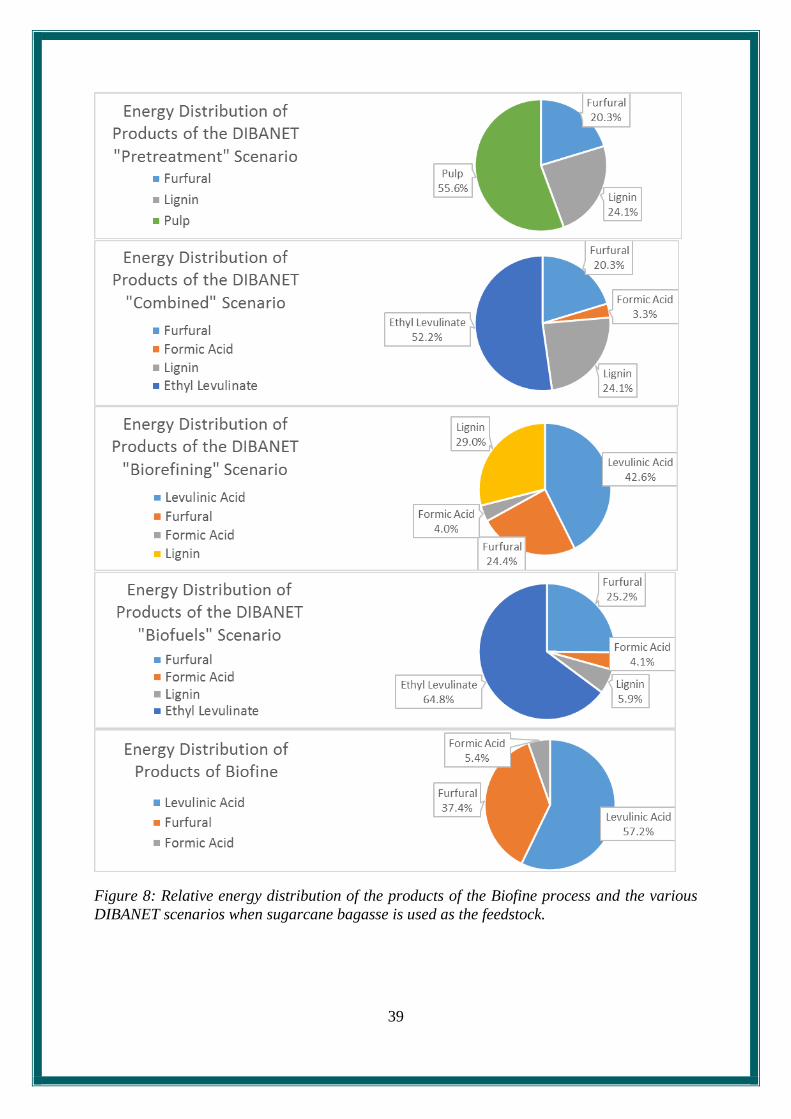
39
Figure 8: Relative energy distribution of the products of the Biofine process and the various
DIBANET scenarios when sugarcane bagasse is used as the feedstock.
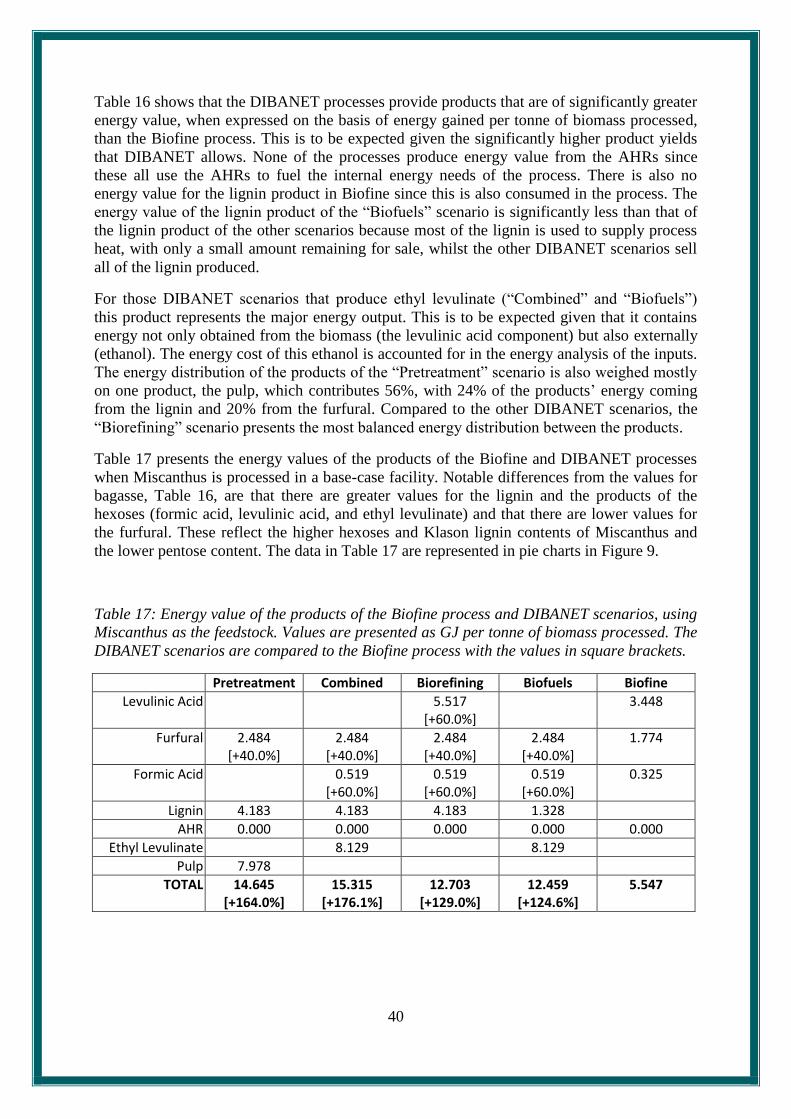
40
Table 16 shows that the DIBANET processes provide products that are of significantly greater
energy value, when expressed on the basis of energy gained per tonne of biomass processed,
than the Biofine process. This is to be expected given the significantly higher product yields
that DIBANET allows. None of the processes produce energy value from the AHRs since
these all use the AHRs to fuel the internal energy needs of the process. There is also no
energy value for the lignin product in Biofine since this is also consumed in the process. The
energy value of the lignin product of the “Biofuels” scenario is significantly less than that of
the lignin product of the other scenarios because most of the lignin is used to supply process
heat, with only a small amount remaining for sale, whilst the other DIBANET scenarios sell
all of the lignin produced.
For those DIBANET scenarios that produce ethyl levulinate (“Combined” and “Biofuels”)
this product represents the major energy output. This is to be expected given that it contains
energy not only obtained from the biomass (the levulinic acid component) but also externally
(ethanol). The energy cost of this ethanol is accounted for in the energy analysis of the inputs.
The energy distribution of the products of the “Pretreatment” scenario is also weighed mostly
on one product, the pulp, which contributes 56%, with 24% of the products’ energy coming
from the lignin and 20% from the furfural. Compared to the other DIBANET scenarios, the
“Biorefining” scenario presents the most balanced energy distribution between the products.
Table 17 presents the energy values of the products of the Biofine and DIBANET processes
when Miscanthus is processed in a base-case facility. Notable differences from the values for
bagasse, Table 16, are that there are greater values for the lignin and the products of the
hexoses (formic acid, levulinic acid, and ethyl levulinate) and that there are lower values for
the furfural. These reflect the higher hexoses and Klason lignin contents of Miscanthus and
the lower pentose content. The data in Table 17 are represented in pie charts in Figure 9.
Table 17: Energy value of the products of the Biofine process and DIBANET scenarios, using
Miscanthus as the feedstock. Values are presented as GJ per tonne of biomass processed. The
DIBANET scenarios are compared to the Biofine process with the values in square brackets.
Pretreatment Combined Biorefining Biofuels Biofine
Levulinic Acid 5.517 [+60.0%]
3.448
Furfural 2.484 [+40.0%]
2.484 [+40.0%]
2.484 [+40.0%]
2.484 [+40.0%]
1.774
Formic Acid 0.519 [+60.0%]
0.519 [+60.0%]
0.519 [+60.0%]
0.325
Lignin 4.183 4.183 4.183 1.328
AHR 0.000 0.000 0.000 0.000 0.000
Ethyl Levulinate 8.129 8.129
Pulp 7.978
TOTAL 14.645 [+164.0%]
15.315 [+176.1%]
12.703 [+129.0%]
12.459 [+124.6%]
5.547
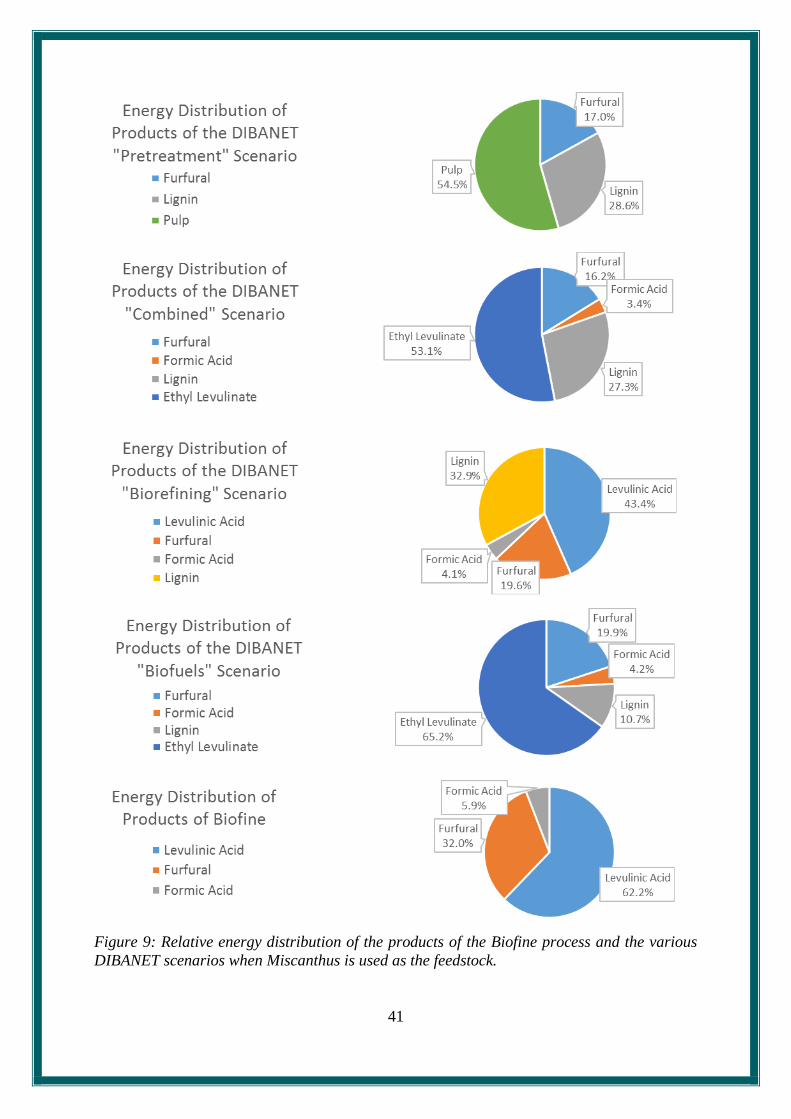
41
Figure 9: Relative energy distribution of the products of the Biofine process and the various
DIBANET scenarios when Miscanthus is used as the feedstock.
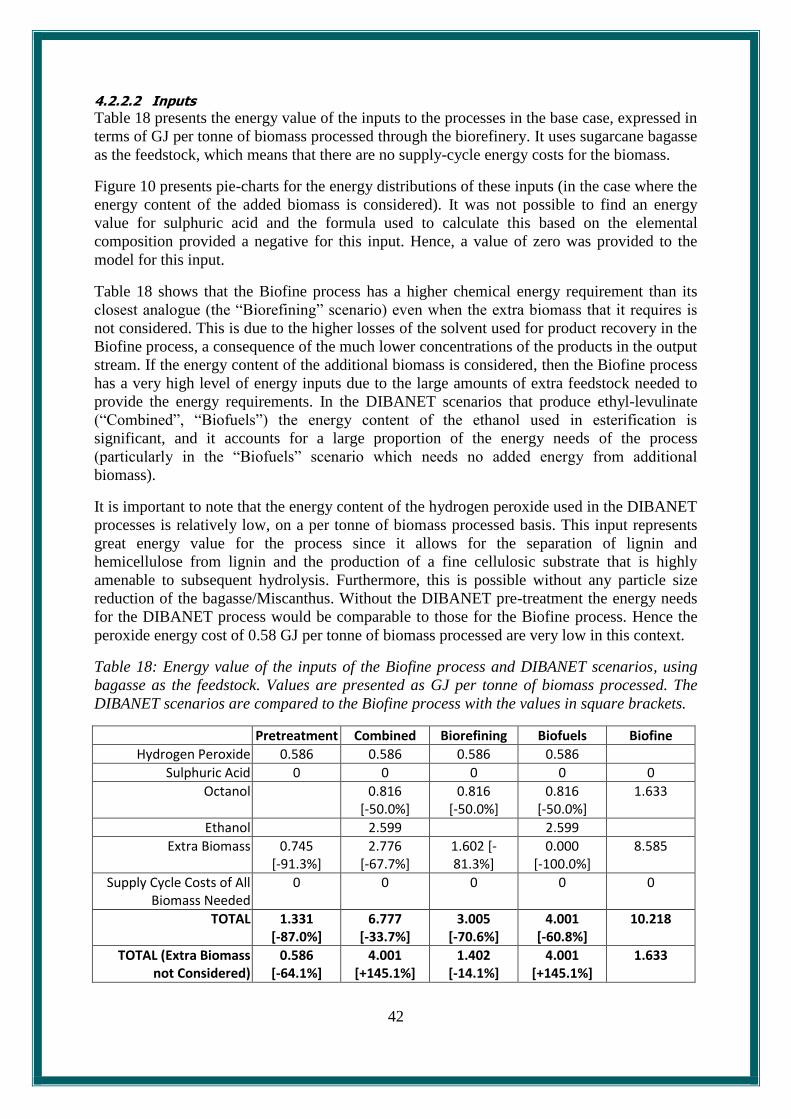
42
4.2.2.2 Inputs
Table 18 presents the energy value of the inputs to the processes in the base case, expressed in
terms of GJ per tonne of biomass processed through the biorefinery. It uses sugarcane bagasse
as the feedstock, which means that there are no supply-cycle energy costs for the biomass.
Figure 10 presents pie-charts for the energy distributions of these inputs (in the case where the
energy content of the added biomass is considered). It was not possible to find an energy
value for sulphuric acid and the formula used to calculate this based on the elemental
composition provided a negative for this input. Hence, a value of zero was provided to the
model for this input.
Table 18 shows that the Biofine process has a higher chemical energy requirement than its
closest analogue (the “Biorefining” scenario) even when the extra biomass that it requires is
not considered. This is due to the higher losses of the solvent used for product recovery in the
Biofine process, a consequence of the much lower concentrations of the products in the output
stream. If the energy content of the additional biomass is considered, then the Biofine process
has a very high level of energy inputs due to the large amounts of extra feedstock needed to
provide the energy requirements. In the DIBANET scenarios that produce ethyl-levulinate
(“Combined”, “Biofuels”) the energy content of the ethanol used in esterification is
significant, and it accounts for a large proportion of the energy needs of the process
(particularly in the “Biofuels” scenario which needs no added energy from additional
biomass).
It is important to note that the energy content of the hydrogen peroxide used in the DIBANET
processes is relatively low, on a per tonne of biomass processed basis. This input represents
great energy value for the process since it allows for the separation of lignin and
hemicellulose from lignin and the production of a fine cellulosic substrate that is highly
amenable to subsequent hydrolysis. Furthermore, this is possible without any particle size
reduction of the bagasse/Miscanthus. Without the DIBANET pre-treatment the energy needs
for the DIBANET process would be comparable to those for the Biofine process. Hence the
peroxide energy cost of 0.58 GJ per tonne of biomass processed are very low in this context.
Table 18: Energy value of the inputs of the Biofine process and DIBANET scenarios, using
bagasse as the feedstock. Values are presented as GJ per tonne of biomass processed. The
DIBANET scenarios are compared to the Biofine process with the values in square brackets.
Pretreatment Combined Biorefining Biofuels Biofine
Hydrogen Peroxide 0.586 0.586 0.586 0.586
Sulphuric Acid 0 0 0 0 0
Octanol 0.816 [-50.0%]
0.816 [-50.0%]
0.816 [-50.0%]
1.633
Ethanol 2.599 2.599
Extra Biomass 0.745 [-91.3%]
2.776 [-67.7%]
1.602 [-81.3%]
0.000 [-100.0%]
8.585
Supply Cycle Costs of All Biomass Needed
0 0 0 0 0
TOTAL 1.331 [-87.0%]
6.777 [-33.7%]
3.005 [-70.6%]
4.001 [-60.8%]
10.218
TOTAL (Extra Biomass not Considered)
0.586 [-64.1%]
4.001 [+145.1%]
1.402 [-14.1%]
4.001 [+145.1%]
1.633
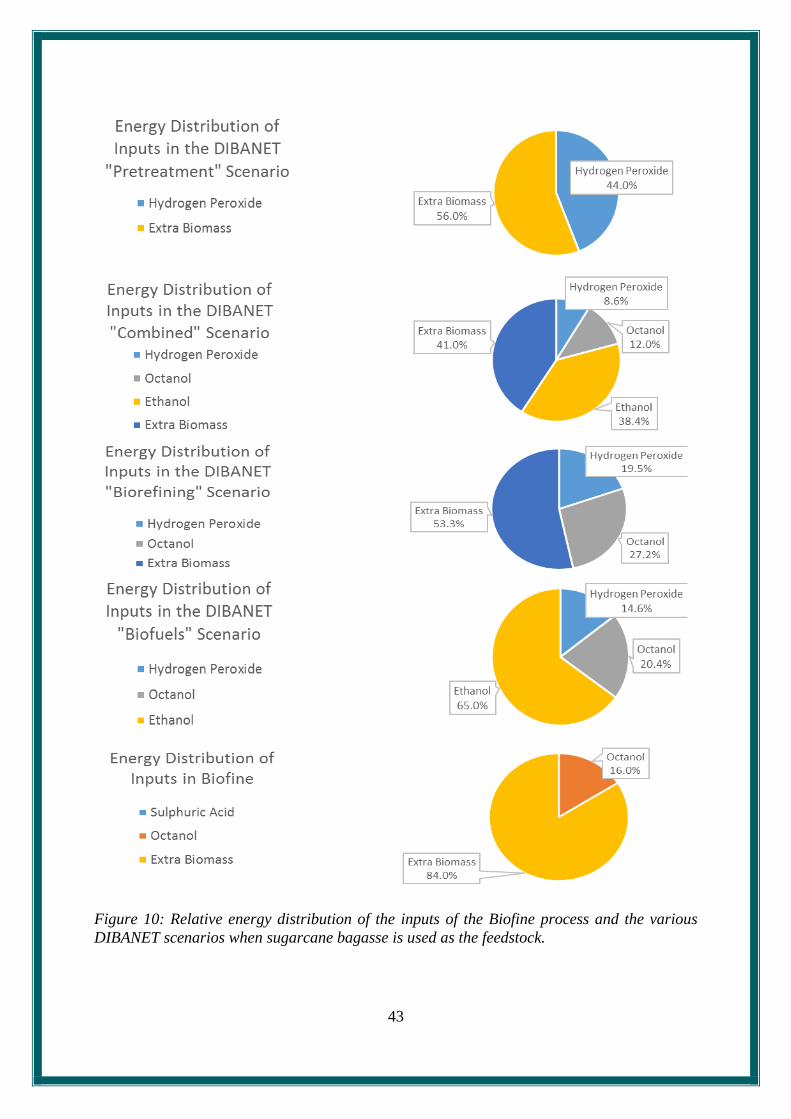
43
Figure 10: Relative energy distribution of the inputs of the Biofine process and the various
DIBANET scenarios when sugarcane bagasse is used as the feedstock.

44
Table 19 presents the energy inputs when Miscanthus is used as the feedstock in the base
case. It separates the energy costs of the biomass between its inherent energy value and that
incurred in its supply cycle and presents two totals, one where there energy content of the
additional biomass is considered and the other where only the supply cycle energy costs of
this additional biomass is considered.
Table 19: Energy value of the inputs of the Biofine process and DIBANET scenarios, using
Miscanthus as the feedstock. Values are presented as GJ per tonne of biomass processed. The
DIBANET scenarios are compared to the Biofine process with the values in square brackets.
Pretreatment Combined Biorefining Biofuels Biofine
Hydrogen Peroxide 0.586 0.586 0.586 0.586
Sulphuric Acid 0.000 0.000 0.000 0.000 0.000
Octanol 0.000 0.816 [-50.0%]
0.816 [-50.0%]
0.816 [-50.0%]
1.633
Ethanol 2.822 2.822
Extra Biomass 0.971 [-87.6%]
2.856 [-63.5%]
1.683 [-78.5%]
0.000 [-100.0%]
7.826
Supply Cycle Costs of All Biomass Needed
0.488 [-30.0%]
0.546 [-21.8%]
0.510 [-26.9%]
0.459 [-34.3%]
0.698
TOTAL 2.046 [-79.9%]
7.627 [-24.9%]
3.595 [-64.6%]
4.684 [-53.9%]
10.157
TOTAL (Only Supply Cycle Costs of Extra Biomass Considered)
1.074 [-53.9%]
4.771 [+104.7%]
1.913 [-17.9%]
4.684 [+100.9%]
2.331
4.2.2.3 Energy Balance and Energy Ratios
Table 20 presents the energy balance and ratios for the Biofine and DIBANET processes
using sugarcane bagasse in the base case. Table 21 presents the corresponding values when
Miscanthus is used as the feedstock. These Tables present energy balances based on the
scenario when the energy content of the additional biomass required for process heat is
considered and also on the scenario when only the supply cycle energy costs of this additional
biomass are considered. The energy balances for both of these scenarios are also represented
graphically for the two feedstocks in Figure 11.
For both feedstocks the Biofine process presents a negative energy balance (i.e. an energy
ratio of less than one) when the energy value of the additional biomass is considered. In
contrast, the DIBANET processes all have positive energy balances in this scenario with
attractive energy ratios ranging from 2.0 for the “Combined” scenario processing Miscanthus
to 10.8 for the “Pretreatment” scenario processing bagasse. With the exception of the
“Biofuels” scenario (which does not require any additional biomass input) all of these energy
balances and ratios increase substantially when only the supply-side energy costs of the
additional biomass are considered. In this instance the energy ratios range from 2.7 for the
“Biofuels” scenario processing Miscanthus to 24.5 for the “Pretreatment” scenario processing
bagasse.
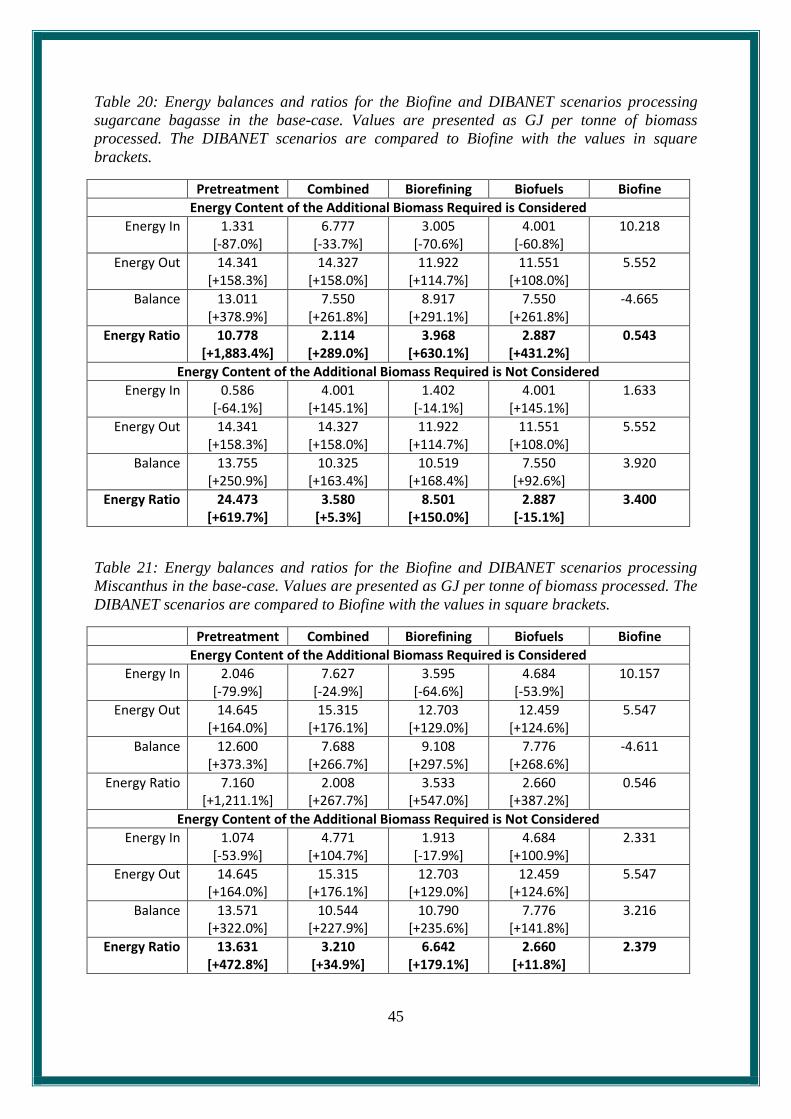
45
Table 20: Energy balances and ratios for the Biofine and DIBANET scenarios processing
sugarcane bagasse in the base-case. Values are presented as GJ per tonne of biomass
processed. The DIBANET scenarios are compared to Biofine with the values in square
brackets.
Pretreatment Combined Biorefining Biofuels Biofine
Energy Content of the Additional Biomass Required is Considered
Energy In 1.331 [-87.0%]
6.777 [-33.7%]
3.005 [-70.6%]
4.001 [-60.8%]
10.218
Energy Out 14.341 [+158.3%]
14.327 [+158.0%]
11.922 [+114.7%]
11.551 [+108.0%]
5.552
Balance 13.011 [+378.9%]
7.550 [+261.8%]
8.917 [+291.1%]
7.550 [+261.8%]
-4.665
Energy Ratio 10.778 [+1,883.4%]
2.114 [+289.0%]
3.968 [+630.1%]
2.887 [+431.2%]
0.543
Energy Content of the Additional Biomass Required is Not Considered
Energy In 0.586 [-64.1%]
4.001 [+145.1%]
1.402 [-14.1%]
4.001 [+145.1%]
1.633
Energy Out 14.341 [+158.3%]
14.327 [+158.0%]
11.922 [+114.7%]
11.551 [+108.0%]
5.552
Balance 13.755 [+250.9%]
10.325 [+163.4%]
10.519 [+168.4%]
7.550 [+92.6%]
3.920
Energy Ratio 24.473 [+619.7%]
3.580 [+5.3%]
8.501 [+150.0%]
2.887 [-15.1%]
3.400
Table 21: Energy balances and ratios for the Biofine and DIBANET scenarios processing
Miscanthus in the base-case. Values are presented as GJ per tonne of biomass processed. The
DIBANET scenarios are compared to Biofine with the values in square brackets.
Pretreatment Combined Biorefining Biofuels Biofine
Energy Content of the Additional Biomass Required is Considered
Energy In 2.046 [-79.9%]
7.627 [-24.9%]
3.595 [-64.6%]
4.684 [-53.9%]
10.157
Energy Out 14.645 [+164.0%]
15.315 [+176.1%]
12.703 [+129.0%]
12.459 [+124.6%]
5.547
Balance 12.600 [+373.3%]
7.688 [+266.7%]
9.108 [+297.5%]
7.776 [+268.6%]
-4.611
Energy Ratio 7.160 [+1,211.1%]
2.008 [+267.7%]
3.533 [+547.0%]
2.660 [+387.2%]
0.546
Energy Content of the Additional Biomass Required is Not Considered
Energy In 1.074 [-53.9%]
4.771 [+104.7%]
1.913 [-17.9%]
4.684 [+100.9%]
2.331
Energy Out 14.645 [+164.0%]
15.315 [+176.1%]
12.703 [+129.0%]
12.459 [+124.6%]
5.547
Balance 13.571 [+322.0%]
10.544 [+227.9%]
10.790 [+235.6%]
7.776 [+141.8%]
3.216
Energy Ratio 13.631 [+472.8%]
3.210 [+34.9%]
6.642 [+179.1%]
2.660 [+11.8%]
2.379
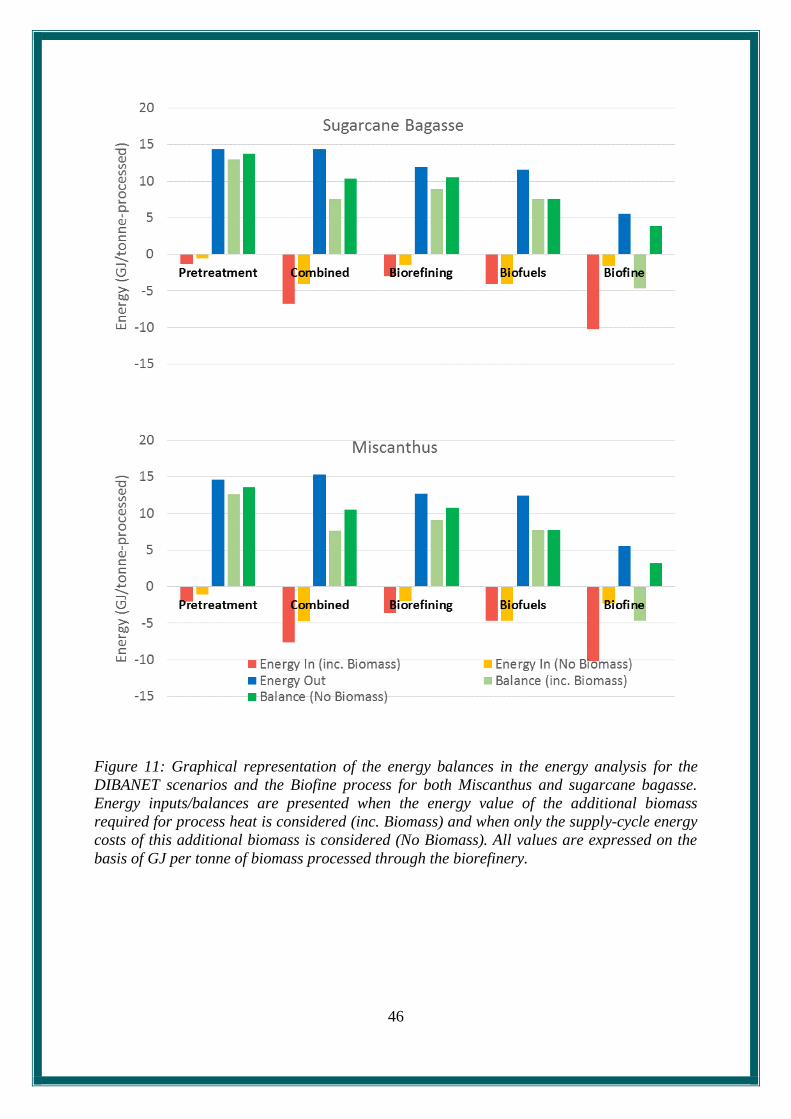
46
Figure 11: Graphical representation of the energy balances in the energy analysis for the
DIBANET scenarios and the Biofine process for both Miscanthus and sugarcane bagasse.
Energy inputs/balances are presented when the energy value of the additional biomass
required for process heat is considered (inc. Biomass) and when only the supply-cycle energy
costs of this additional biomass is considered (No Biomass). All values are expressed on the
basis of GJ per tonne of biomass processed through the biorefinery.
47
4.3 Alternative Uses for the AHRs
4.3.1 Slow Pyrolysis for Biochar Production
The extra biomass requirement of 40.2% (in addition to the biomass needed for processing)
that would be needed to fuel the “Combined” process under the situation whereby neither the
AHRs or lignin are combusted (the “Combined - No Combustion“ scenario in Table 14) is an
important consideration when determining whether alternative uses, other than combustion,
for the AHRs could be viable.
Section 2.5 considered the processing of AHRs in slow-pyrolysis technologies for the
production of biochars that could be sold to farmers as plant growth promoters and as a means
to sequester carbon. It was determined that the maximum value, to the biorefinery operator, of
the AHRs for this purpose would be €37.97 ($49.4) per dry tonne. DIBANET partners were
not able to provide the capital and operating costs required to produce this biochar from
AHRs on an industrial scale. A low operating cost of $15 per tonne of AHR processed for
biochar has been assumed and capital costs have not been considered. In this case the
potential profit from the AHR to biochar route would be $34.4 per tonne of AHR processed.
This is equal to $5.3 profit per tonne of biomass processed (on the basis of AHR yields in the
combined scenario being 15.5%, Table 10).
There is a difference between the “Combined” and “Combined – No Combustion” scenarios
in Table 14 of an additional 217 kg of additional biomass required for combustion in the
latter, on the basis of one tonne of biomass processed through the biorefinery. The cost of this
additional biomass would be $6.9 per tonne of biomass processed, assuming that bagasse is
purchased for this at the same price as for the biorefinery ($32.5 per dry tonne). Moving to a
scenario where the AHRs are used to produce biochar would therefore represent a net loss of
$1.6 per tonne of biomass processed in the biorefinery when compared with the standard
option of using the AHRs. Hence, the value of AHRs for biochar is less than their value for
the provision of process heat.
It is clear, therefore, that the production of biochar from AHRs cannot be justified on an
economic basis. There may be a justification for the biochar option in terms of CO2 balance
since the extra biomass required for combustion would be, in simple terms, carbon neutral
whilst the carbon locked in the biochar would be sequestered. This would mean that this
option would have a superior carbon balance to the standard “Combined” scenario. However,
in order for the biorefinery operator to choose this option and invest significant amounts of
money in constructing the pyrolysis facility, the value of the carbon credits associated with
the sequestration of this biochar would have to be substantially increased and provided with
long-term guarantees.
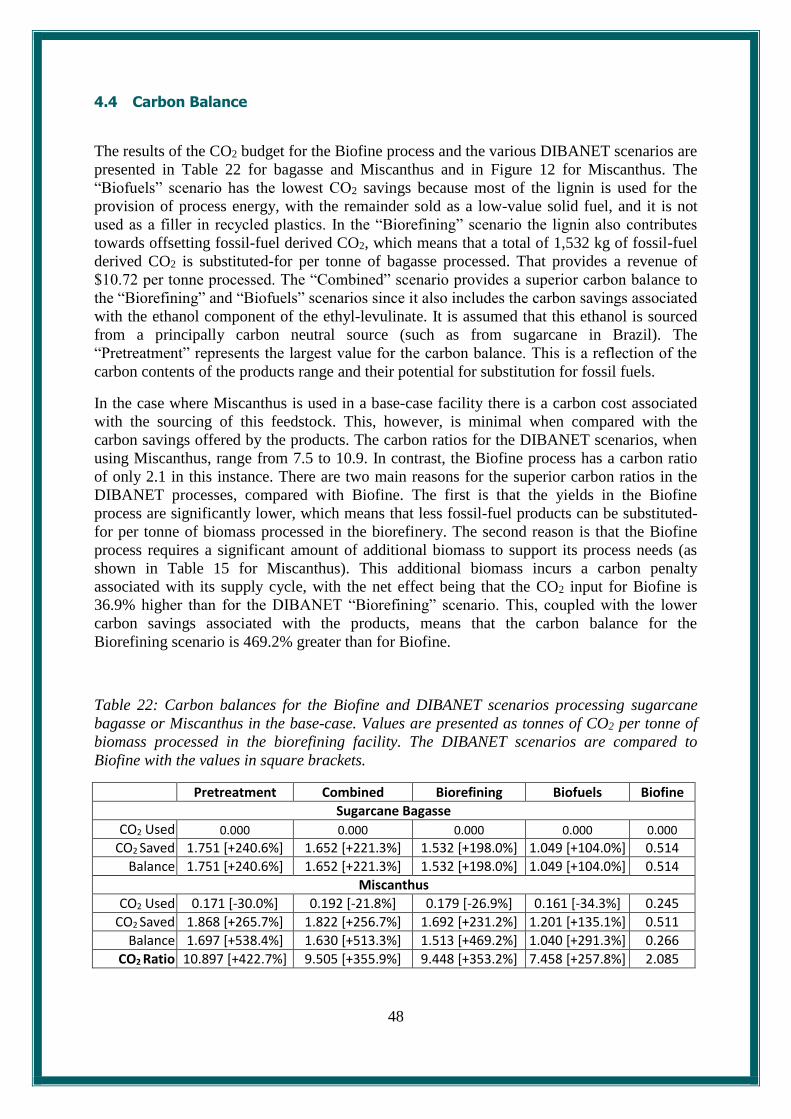
48
4.4 Carbon Balance
The results of the CO2 budget for the Biofine process and the various DIBANET scenarios are
presented in Table 22 for bagasse and Miscanthus and in Figure 12 for Miscanthus. The
“Biofuels” scenario has the lowest CO2 savings because most of the lignin is used for the
provision of process energy, with the remainder sold as a low-value solid fuel, and it is not
used as a filler in recycled plastics. In the “Biorefining” scenario the lignin also contributes
towards offsetting fossil-fuel derived CO2, which means that a total of 1,532 kg of fossil-fuel
derived CO2 is substituted-for per tonne of bagasse processed. That provides a revenue of
$10.72 per tonne processed. The “Combined” scenario provides a superior carbon balance to
the “Biorefining” and “Biofuels” scenarios since it also includes the carbon savings associated
with the ethanol component of the ethyl-levulinate. It is assumed that this ethanol is sourced
from a principally carbon neutral source (such as from sugarcane in Brazil). The
“Pretreatment” represents the largest value for the carbon balance. This is a reflection of the
carbon contents of the products range and their potential for substitution for fossil fuels.
In the case where Miscanthus is used in a base-case facility there is a carbon cost associated
with the sourcing of this feedstock. This, however, is minimal when compared with the
carbon savings offered by the products. The carbon ratios for the DIBANET scenarios, when
using Miscanthus, range from 7.5 to 10.9. In contrast, the Biofine process has a carbon ratio
of only 2.1 in this instance. There are two main reasons for the superior carbon ratios in the
DIBANET processes, compared with Biofine. The first is that the yields in the Biofine
process are significantly lower, which means that less fossil-fuel products can be substituted-
for per tonne of biomass processed in the biorefinery. The second reason is that the Biofine
process requires a significant amount of additional biomass to support its process needs (as
shown in Table 15 for Miscanthus). This additional biomass incurs a carbon penalty
associated with its supply cycle, with the net effect being that the CO2 input for Biofine is
36.9% higher than for the DIBANET “Biorefining” scenario. This, coupled with the lower
carbon savings associated with the products, means that the carbon balance for the
Biorefining scenario is 469.2% greater than for Biofine.
Table 22: Carbon balances for the Biofine and DIBANET scenarios processing sugarcane
bagasse or Miscanthus in the base-case. Values are presented as tonnes of CO2 per tonne of
biomass processed in the biorefining facility. The DIBANET scenarios are compared to
Biofine with the values in square brackets.
Pretreatment Combined Biorefining Biofuels Biofine
Sugarcane Bagasse
CO2 Used 0.000 0.000 0.000 0.000 0.000
CO2 Saved 1.751 [+240.6%] 1.652 [+221.3%] 1.532 [+198.0%] 1.049 [+104.0%] 0.514
Balance 1.751 [+240.6%] 1.652 [+221.3%] 1.532 [+198.0%] 1.049 [+104.0%] 0.514
Miscanthus
CO2 Used 0.171 [-30.0%] 0.192 [-21.8%] 0.179 [-26.9%] 0.161 [-34.3%] 0.245
CO2 Saved 1.868 [+265.7%] 1.822 [+256.7%] 1.692 [+231.2%] 1.201 [+135.1%] 0.511
Balance 1.697 [+538.4%] 1.630 [+513.3%] 1.513 [+469.2%] 1.040 [+291.3%] 0.266
CO2 Ratio 10.897 [+422.7%] 9.505 [+355.9%] 9.448 [+353.2%] 7.458 [+257.8%] 2.085
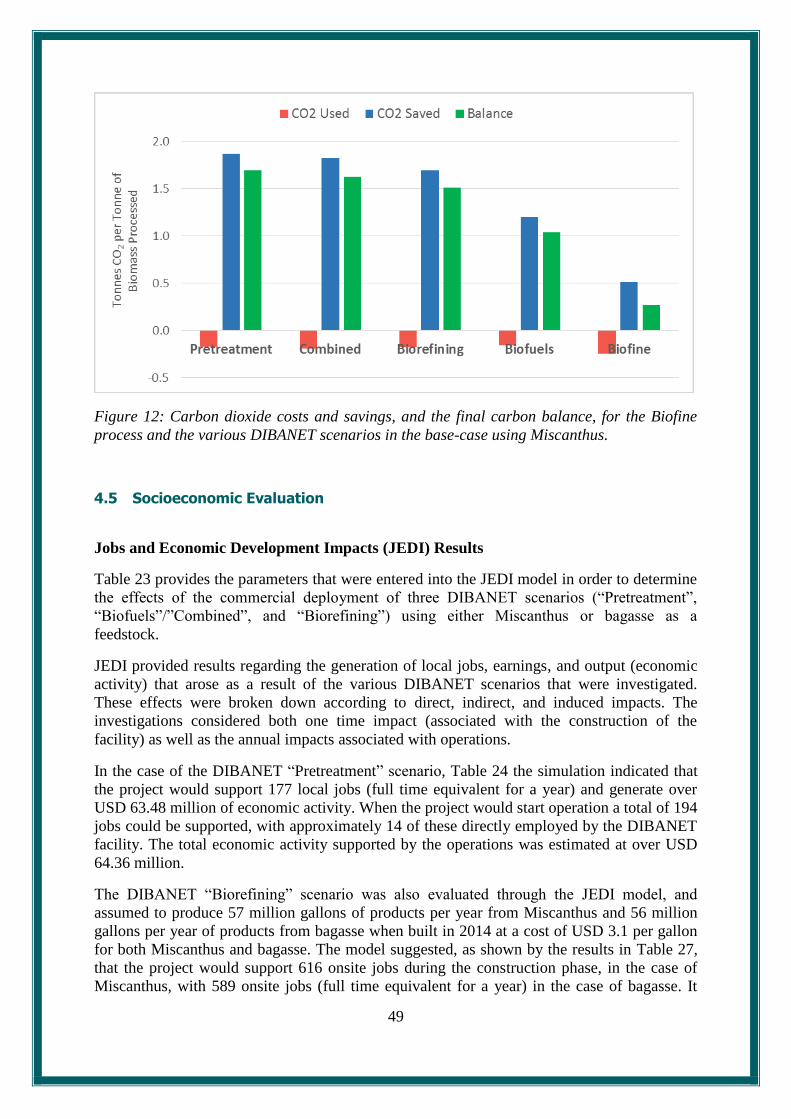
49
Figure 12: Carbon dioxide costs and savings, and the final carbon balance, for the Biofine
process and the various DIBANET scenarios in the base-case using Miscanthus.
4.5 Socioeconomic Evaluation
Jobs and Economic Development Impacts (JEDI) Results
Table 23 provides the parameters that were entered into the JEDI model in order to determine
the effects of the commercial deployment of three DIBANET scenarios (“Pretreatment”,
“Biofuels”/”Combined”, and “Biorefining”) using either Miscanthus or bagasse as a
feedstock.
JEDI provided results regarding the generation of local jobs, earnings, and output (economic
activity) that arose as a result of the various DIBANET scenarios that were investigated.
These effects were broken down according to direct, indirect, and induced impacts. The
investigations considered both one time impact (associated with the construction of the
facility) as well as the annual impacts associated with operations.
In the case of the DIBANET “Pretreatment” scenario, Table 24 the simulation indicated that
the project would support 177 local jobs (full time equivalent for a year) and generate over
USD 63.48 million of economic activity. When the project would start operation a total of 194
jobs could be supported, with approximately 14 of these directly employed by the DIBANET
facility. The total economic activity supported by the operations was estimated at over USD
64.36 million.
The DIBANET “Biorefining” scenario was also evaluated through the JEDI model, and
assumed to produce 57 million gallons of products per year from Miscanthus and 56 million
gallons per year of products from bagasse when built in 2014 at a cost of USD 3.1 per gallon
for both Miscanthus and bagasse. The model suggested, as shown by the results in Table 27,
that the project would support 616 onsite jobs during the construction phase, in the case of
Miscanthus, with 589 onsite jobs (full time equivalent for a year) in the case of bagasse. It

50
was estimated that over USD 223.93 million of economic activity would be generated in the
Miscanthus scenario with USD 263.22 million for bagasse. The operation of the plant could
support a total of 237 jobs, with approximately 53 of these directly employed by the
DIBANET facility. The total economic activity supported by the operation was estimated at
over USD 61.33 million and USD 21.39 million for Miscanthus and bagasse feedstocks,
respectively.
The DIBANET “Biofuels” and “Combined” scenarios were considered to be equivalent in the
case of the JEDI model. This model assumed that they produced 65 million gallons of product
per year from Miscanthus and 63 million gallons of product per year from bagasse. The
capital cost was USD 4.2 per gallon and USD 4.3 per gallon, respectively, for Miscanthus and
bagasse. The model results indicated that, in the construction period, the project would
support 769 onsite jobs (full time equivalent for a year) and it would generate over USD 277
million of economic activity for Miscanthus and USD 325 million of economic activity for
bagasse. The operation of the plant could support a total of 256 jobs, with approximately 60
of these directly employed by the DIBANET plant. The total economic activity supported by
the operation was estimated to be USD 64.50 million and USD 24.59 million for the
Miscanthus and bagasse feedstocks, respectively.
Table 23: Process parameters used for the various DIBANET scenarios, and the bagasse and
Miscanthus feedstocks, in the JEDI model.
Pretreatment Biofuels Biorefining
Miscanthus Bagasse Miscanthus Bagasse Miscanthus Bagasse
Project Location Iowa Florida Iowa Florida Iowa Florida
County Population 80,000 200,000 80,000 200,000 80,000 200,000
Year Construction Starts 2014 2014 2014 2014 2014 2014
Process (T = Thermochemical) T T T T T T
Project Size (Mil. Gal./Year) 13 16 65 63 57 56
Fuel Produced (Type) Ethanol Ethanol Ethanol Ethanol Ethanol Ethanol
Construction Period (Years) 2 2 2 2 2 2
Construction Cost ($/Gal. Fuel) $6.10 $5.20 $4.2 $4.30 $3.1 $3.10
Feedstock Type Energy Crop Residues
Energy Crop
Residues Energy Crop
Residues
Cost of Dry Feedstock ($/Unit) $60.00 $32.50 $60.00 $32.50 $60.00 $32.50
Produced Locally (Percent) 100% 100% 100% 100% 100% 100%
New Production (Percent) 90% 0% 90% 0% 90% 0%
Feedstock Supplier
Direct (e.g., Farmer) (Percent) 100% 100% 100% 100% 100% 100%
Wholesaler (Percent)
Fuel Yield (Gal./Unit Feedstock) 28.0 33.0 137.0000 133.0000 121.0000 118.0000
Fixed Operations/Maintenance Cost ($/Gal.)
$0.18 $0.18 $0.18 $0.18 $0.18 $0.18
Non-Fuel Variable Operations and Maintenance Cost ($/Gal.)
$0.03 $0.03 $0.03 $0.03 $0.03 $0.03

51
Table 24: Summary results for the local economic impacts, returned by the JEDI model, for the DIBANET “Pretreatment” scenario in the base-
case (a facility processing 475,000 tonnes of biomass per year) when both sugarcane bagasse and Miscanthus were used.
Bagasse Miscanthus
Jobs Earnings Output Jobs Earnings Output
During construction period $m (2013) $m (2013) $m (2013) $m (2013)
Project Development, Onsite Labour Impacts 198 22.46 28.50 177 18.80 24.68
Construction Labour 154 19.21 132 15.80
Construction Related Services 44 3.25 45 3.00
Equipment and Supply Chain Impacts 92 4.86 14.70 57 2.63 8.53
Induced Impacts 100 4.36 13.51 58 2.16 6.69
Total Impacts (Direct, Indirect, Induced) 391 31.68 56.72 292 23.59 39.89
During operating years (annual)
Onsite Labour Impacts 17 0.73 0.73 14 0.65 0.65
Local Revenue and Supply Chain Impacts 16 0.75 3.01 145 6.11 50.88
Agricultural Sector Only - 0.00 84 3.21
Other Industries 16 0.75 62 2.90
Induced Impacts 11 0.47 1.45 34 1.27 4.80
Total Impacts (Direct, Indirect, Induced) 43 1.95 5.19 194 8.03 56.33

52
Table 25: Summary results for the local economic impacts, returned by the JEDI model, for the DIBANET “Biorefining” scenario in the base-
case (a facility processing 475,000 tonnes of biomass per year) when both sugarcane bagasse and Miscanthus were used.
Bagasse Miscanthus
Jobs Earnings Output Jobs Earnings Output
During construction period $m (2013) $m (2013) $m (2013) $m (2013)
Project Development, Onsite Labour Impacts 589 71.85 84.45 616 72.85 85.95
Construction Labour 498 65.07 517 66.17
Construction Related Services 91 6.78 99 6.69
Equipment and Supply Chain Impacts 262 13.95 41.59 185 8.51 27.05
Induced Impacts 289 12.52 38.86 193 7.22 22.34
Total Impacts (Direct, Indirect, Induced) 1,139 98.33 164.89 994 88.58 135.35
During operating years (annual)
Onsite Labour Impacts 52 1.86 1.86 53 1.88 1.88
Local Revenue and Supply Chain Impacts 50 2.43 9.94 143 6.29 44.40
Agricultural Sector Only - 0.00 61 2.33
Other Industries 50 2.43 82 3.96
Induced Impacts 30 1.29 4.01 41 1.53 5.34
Total Impacts (Direct, Indirect, Induced) 132 5.58 15.81 237 9.70 51.63
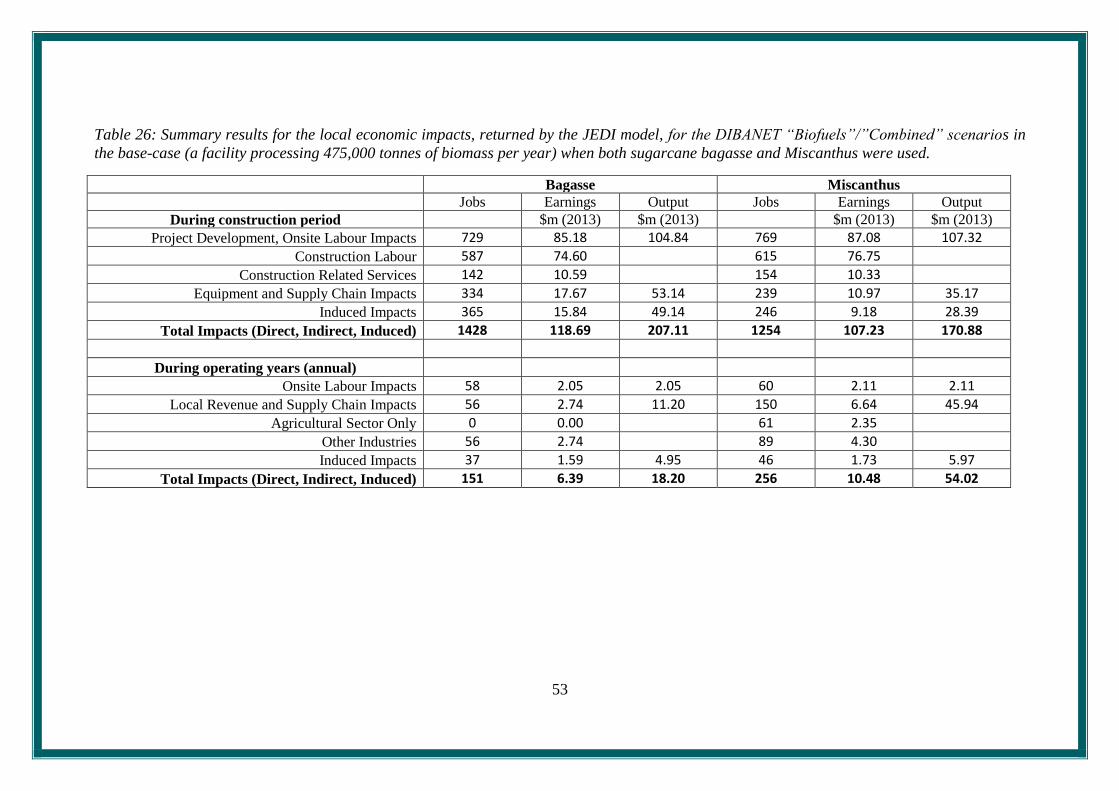
53
Table 26: Summary results for the local economic impacts, returned by the JEDI model, for the DIBANET “Biofuels”/”Combined” scenarios in
the base-case (a facility processing 475,000 tonnes of biomass per year) when both sugarcane bagasse and Miscanthus were used.
Bagasse Miscanthus
Jobs Earnings Output Jobs Earnings Output
During construction period $m (2013) $m (2013) $m (2013) $m (2013)
Project Development, Onsite Labour Impacts 729 85.18 104.84 769 87.08 107.32
Construction Labour 587 74.60 615 76.75
Construction Related Services 142 10.59 154 10.33
Equipment and Supply Chain Impacts 334 17.67 53.14 239 10.97 35.17
Induced Impacts 365 15.84 49.14 246 9.18 28.39
Total Impacts (Direct, Indirect, Induced) 1428 118.69 207.11 1254 107.23 170.88
During operating years (annual)
Onsite Labour Impacts 58 2.05 2.05 60 2.11 2.11
Local Revenue and Supply Chain Impacts 56 2.74 11.20 150 6.64 45.94
Agricultural Sector Only 0 0.00 61 2.35
Other Industries 56 2.74 89 4.30
Induced Impacts 37 1.59 4.95 46 1.73 5.97
Total Impacts (Direct, Indirect, Induced) 151 6.39 18.20 256 10.48 54.02

54
Internal Evaluation of Jobs with Bagasse and Miscanthus
UL researchers estimated the number of workers that would be needed to be directly
employed by one biorefinery for each of the different DIBANET scenarios at a number of
different scales of operation. To these data-points regression curves were fitted, using power
functions. These allowed the number of workers to be calculated based on any user-provided
scale of operation.
These derived relationships (between scale of operation and biorefinery workers) are
presented as curves in the top graph of Figure 13. These clearly show that there are
diminishing returns (in terms of direct jobs) associated with increasing scales of operation. In
this case sugarcane bagasse was used as the feedstock, meaning that there were no direct jobs
associated with the sourcing of the biomass. This is a reasonable assumption given that
bagasse already exists, at the point of use, as a by-product of the sugar/ethanol production
process of sugar mills. However, the use of Miscanthus as a feedstock would create jobs, as
discussed in Section 3.6. It was calculated that each 1,000 tonnes of biomass processed at the
biorefinery would create 0.391 jobs. This number was reached using the following
assumptions: (i) the employment effects associated with Miscanthus would be 9 hours per
hectare in production (27); (ii) the average worker would work for 1,920 hours per year (40
hours per week multiplied by 48 weeks per year); and (iii) an average hectare of agricultural
land in Ireland would produce 12 dry tonnes of Miscanthus per year.
The second graph in Figure 13 shows the direct calculated employment effects associated
with DIBANET biorefineries, of varying scales of operation, processing Miscanthus. It
separates the number of jobs created at the various DIBANET facility scenarios
(“Pretreatment”, “Biorefining”, “Combined”/”Biofuels”) from those created in order to supply
the Miscanthus. It is clear that, while the increases seen for the number of jobs at the
biorefinery diminish with larger scales of operation, this is not the case for the Miscanthus
jobs as these are linearly related to scale. The third graph in Figure 13 combines the jobs
associated with Miscanthus with those for the given DIBANET scenario and shows that the
influence of the Miscanthus jobs dominates the shape of the regression lines. This is
reinforced in the fourth graph in Figure 13 which plots the relative proportion that the
Miscanthus-jobs contribute to total direct jobs (DIBANET facility plus Miscanthus jobs).
That graph shows that, while the biorefinery jobs are the main contributor at low scales of
operation (for example levels of operation that could be expected for demonstration-scale
plants), once the size of the facility reaches approximately 100,000 tonnes of Miscanthus per
year the number of Miscanthus jobs is greater. This proportion rises to approximately 80% of
all employment by the base-case scale (500,000 tonnes per year) for the “Pretreatment”
scenario.
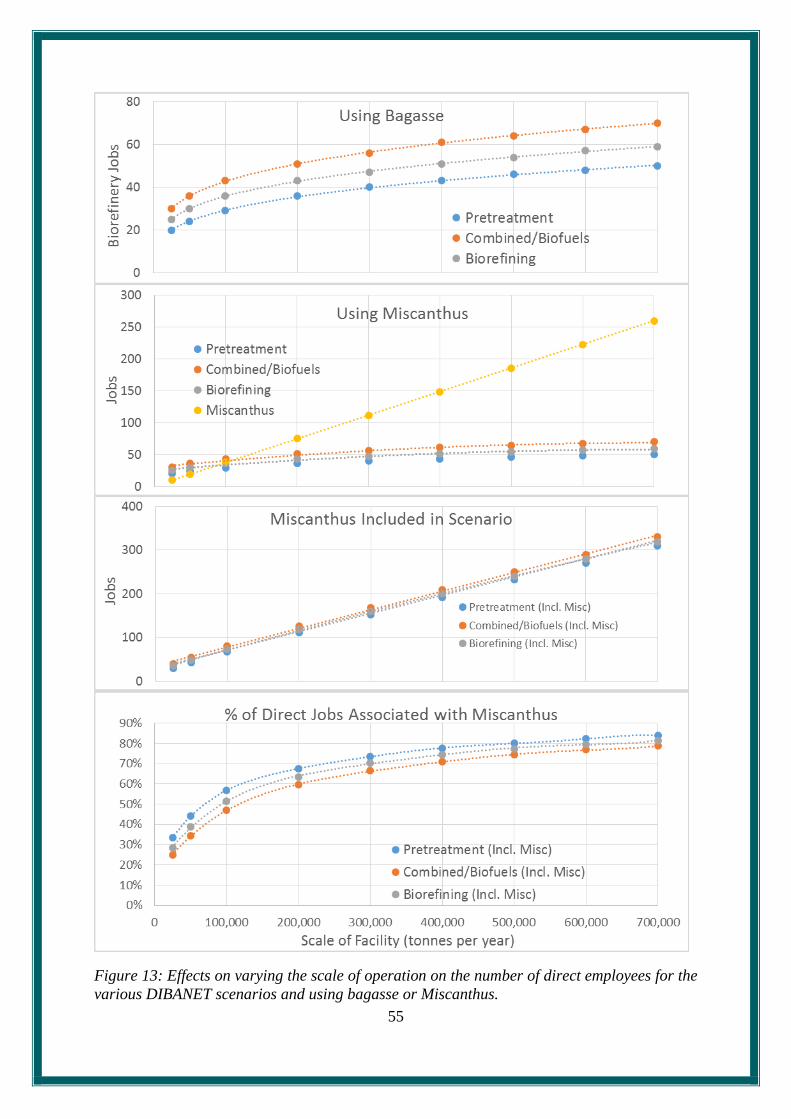
55
Figure 13: Effects on varying the scale of operation on the number of direct employees for the
various DIBANET scenarios and using bagasse or Miscanthus.
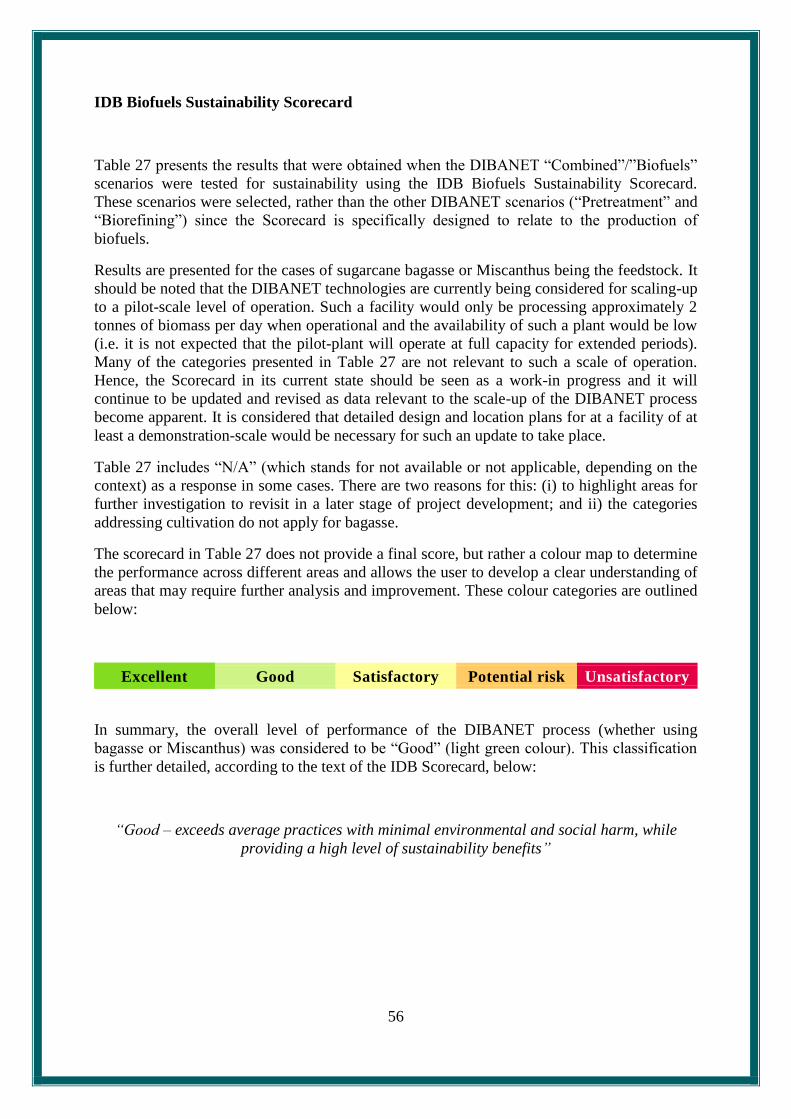
56
IDB Biofuels Sustainability Scorecard
Table 27 presents the results that were obtained when the DIBANET “Combined”/”Biofuels”
scenarios were tested for sustainability using the IDB Biofuels Sustainability Scorecard.
These scenarios were selected, rather than the other DIBANET scenarios (“Pretreatment” and
“Biorefining”) since the Scorecard is specifically designed to relate to the production of
biofuels.
Results are presented for the cases of sugarcane bagasse or Miscanthus being the feedstock. It
should be noted that the DIBANET technologies are currently being considered for scaling-up
to a pilot-scale level of operation. Such a facility would only be processing approximately 2
tonnes of biomass per day when operational and the availability of such a plant would be low
(i.e. it is not expected that the pilot-plant will operate at full capacity for extended periods).
Many of the categories presented in Table 27 are not relevant to such a scale of operation.
Hence, the Scorecard in its current state should be seen as a work-in progress and it will
continue to be updated and revised as data relevant to the scale-up of the DIBANET process
become apparent. It is considered that detailed design and location plans for at a facility of at
least a demonstration-scale would be necessary for such an update to take place.
Table 27 includes “N/A” (which stands for not available or not applicable, depending on the
context) as a response in some cases. There are two reasons for this: (i) to highlight areas for
further investigation to revisit in a later stage of project development; and ii) the categories
addressing cultivation do not apply for bagasse.
The scorecard in Table 27 does not provide a final score, but rather a colour map to determine
the performance across different areas and allows the user to develop a clear understanding of
areas that may require further analysis and improvement. These colour categories are outlined
below:
Excellent Good Satisfactory Potential risk Unsatisfactory
In summary, the overall level of performance of the DIBANET process (whether using
bagasse or Miscanthus) was considered to be “Good” (light green colour). This classification
is further detailed, according to the text of the IDB Scorecard, below:
“Good – exceeds average practices with minimal environmental and social harm, while
providing a high level of sustainability benefits”

57
Table 27: Results from the IDB Biofuels Sustainability Scorecard for the DIBANET process
using either sugarcane bagasse or Miscanthus.
Bagasse Miscanthus
ENVIRONMENTAL
Project Site Biodiversity No conservation value Insufficient Data
Invasive species N/A Species are non-native but
domesticated
Carbon emissions from
land use change
Cropland No land for cultivation (if
you replace annual crops you
increase carbon in soil)
Feedstock/Crop management Crop lifecycle (Residue) Permanent crop
Crop Rotation/Crop mix N/A No crop rotation or
intercropping
Harvesting Method N/A No burning
Water Management Rain fed Rain fed
Fertilizer Management N/A No fertilizer used
Pesticide use N/A No pesticide used
Production/Facility Management Energy source for facility Cogeneration from biomass
with excess to sell to grid
Cogeneration from biomass
with excess to sell to grid
Water requirements for
industrial production
No water required for
production cycle
No water required for
production cycle
Waste management Meet international standards Meet international standards
Waste diversion N/A N/A
Distribution Mid third ratio Mid third ratio
CROSS CUTTING Environmental and social
impact assessment
These assessment will be
made for Demo and
Commercial scale plants
These assessment will be
made for Demo and
Commercial scale plants
Yield calculator (not included) 4 (not included) 5
Energy Balance (not included) 6 (not included) 7
Greenhouse gas emissions
savings
>60% >60%
4 IDB website does not give the correct tools to calculate these for our novel processes.
5 IDB website does not give the correct tools to calculate these for our novel processes.
6 IDB website does not give the correct tools to calculate these for our novel processes.
7 IDB website does not give the correct tools to calculate these for our novel processes.
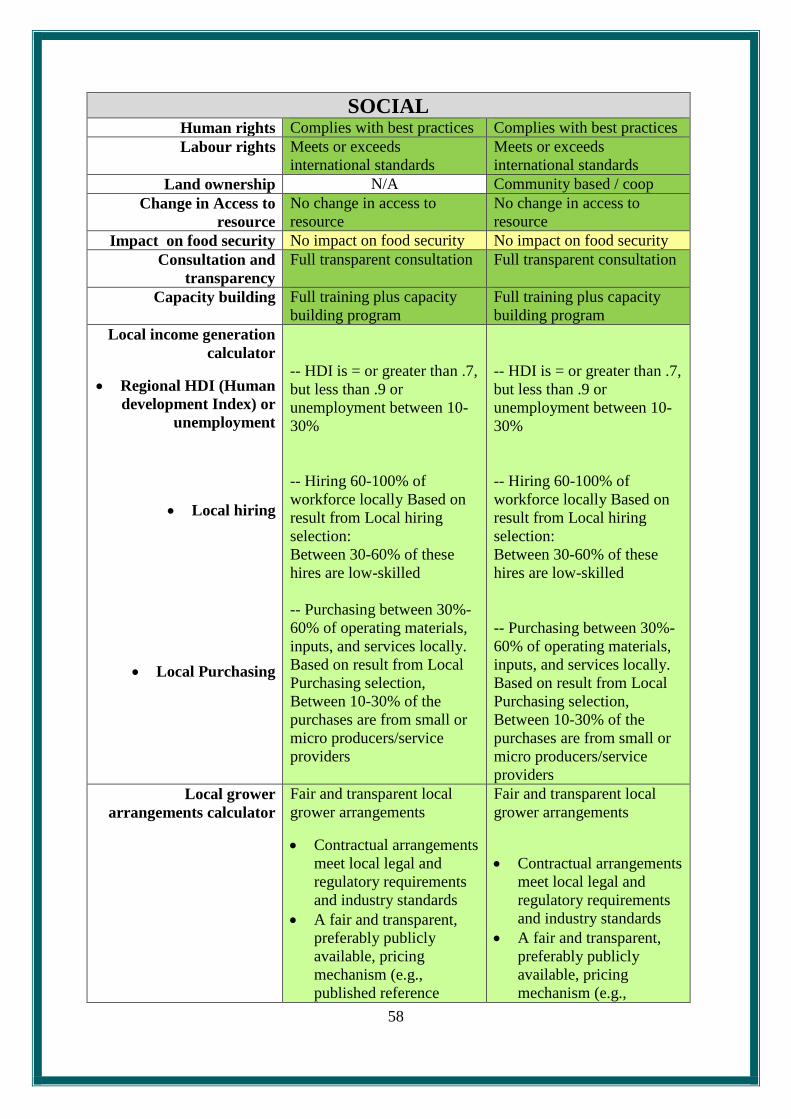
58
SOCIAL Human rights Complies with best practices Complies with best practices
Labour rights Meets or exceeds
international standards
Meets or exceeds
international standards
Land ownership N/A Community based / coop
Change in Access to
resource
No change in access to
resource
No change in access to
resource
Impact on food security No impact on food security No impact on food security
Consultation and
transparency
Full transparent consultation Full transparent consultation
Capacity building Full training plus capacity
building program
Full training plus capacity
building program
Local income generation
calculator
Regional HDI (Human
development Index) or
unemployment
Local hiring
Local Purchasing
-- HDI is = or greater than .7,
but less than .9 or
unemployment between 10-
30%
-- Hiring 60-100% of
workforce locally Based on
result from Local hiring
selection:
Between 30-60% of these
hires are low-skilled
-- Purchasing between 30%-
60% of operating materials,
inputs, and services locally.
Based on result from Local
Purchasing selection,
Between 10-30% of the
purchases are from small or
micro producers/service
providers
Local grower
arrangements calculator
Fair and transparent local
grower arrangements
Contractual arrangements
meet local legal and
regulatory requirements
and industry standards
A fair and transparent,
preferably publicly
available, pricing
mechanism (e.g.,
published reference
Fair and transparent local
grower arrangements
Contractual arrangements
meet local legal and
regulatory requirements
and industry standards
A fair and transparent,
preferably publicly
available, pricing
mechanism (e.g.,

59
price)
Fair and objective
product acceptance
criteria and penalties for
payment delays
published reference
price)
Fair and objective
product acceptance
criteria and penalties for
payment delays
Community development N/A
Community development
program with full
consultation
Impacts on indigenous
people
N/A N/A

60
4.6 Economics
4.6.1 Financial Evaluation of the Base Case
The base-case involved a facility whose capital cost was estimated based on a processing
capability of 500,000 tonnes of biomass per year, and which operated with an availability of
95%, meaning that 475,000 tonnes of biomass were actually processed through the
biorefinery each year. This base-case also assumed that a low pressure boiler was used to
supply the process need requirements for the DIBANET “Pretreatment” and “Biorefining”
scenarios, and that a high pressure (HP) boiler was used for the DIBANET “Combined” and
“Biofuels” scenarios, as well as for the Biofine process. For the DIBANET scenarios using a
HP boiler, the base case considered that any surplus solid fuel (AHRs and/or lignin,
depending on process needs and the specifics of the scenario) was sold rather that used to
provide electricity in a CHP system. The CHP option is considered separately in Section
4.6.3. For Biofine, the process needs could never be met using the AHRs alone, which means
that the examination of a CHP system was not warranted. The main results for the financial
evaluation are presented in Table 28 for Biofine and for the four different DIBANET
scenarios, for both sugarcane bagasse and Miscanthus. These values are also represented
graphically in Figure 14 (capital costs), Figure 15 (annual profits), Figure 16 (IRR), Figure 17
(ROI), and Figure 18 (NPV).
Table 28: Financial metrics for using (Sugarcane Bagasse) and [Miscanthus] in a number of
difference DIBANET scenarios and using the Biofine process.
Pretreat. Combined Biorefining Biofuels Biofine
Capex ($m) (82.0) [82.0] (271.0) [271.0] (176.8) [176.8] (271.0) [271.0] (291.1) [291.1]
Profit/Loss per yr ($m) (43.9) [20.8] (87.0) [70.1] (77.0) [59.9] (37.9) [28.4] (34.3) [9.7]
IRR (%) (41.72) [21.04] (26.52) [21.42] (34.99) [27.89] (9.98) [5.68] (7.38) [-7.18]
ROI (%) (204.38) [51.96] (88.27) [54.36] (150.42) [97.83] (-10.02) [-29.24] (-22.02) [-67.99]
NPV ($m) (167.6) [42.6] (239.2) [147.3] (266.0) [173.0] (-27.2) [-79.3] (-64.1) [-197.9]
Payback Period (yrs) (3) [7] (5) [7] (4) [5] No Payback No Payback
It is clear from Table 28 that the Biofine process does not represent a viable option
financially. A major reason for this is the capital cost associated with the facility. As
discussed in Section 4.1, the Biofine process has only been demonstrated at a solids loading
level of 5%, which means that that much larger reactors, along with the associated necessary
equipment, will be needed to process the same amount of biomass as in the DIBANET
process. However, due to the DIBANET pre-treatment process removing, very rapidly,
approximately 50% from the mass of the biomass in the form of soluble lignin and
hemicellulose, the DIBANET hydrolysis stage would only need to process approximately half
the biomass as for the Biofine hydrolysis. Further to this, as also discussed in Section 4.1, the
Biofine process also requires higher temperatures and pressures than the DIBANET
hydrolysis stages. The combination of acidic conditions and the high temperatures and

61
pressures seen in Biofine, will dictate that expensive alloys, such as zirconium, will be needed
for the reactors and associated equipment. In contrast, the milder conditions of DIBANET
will allow for much cheaper reactors to be purchased.
The need for large amounts of high pressure steam in the Biofine process also contributes
significantly to the capital cost since it requires the purchase a high pressure boiler, which
also has higher annual operating and maintenance costs. Further to this, due to the significant
energy requirements of the Biofine process, see Table 15, the boiler would need to be of a
much greater capacity than that required to supply the energy needs for DIBANET (244 MWth
compared with 62 MWth for the DIBANET “Biorefining” scenario). Figure 14 presents the
capital costs for the Biofine and DIBANET processes and separates the total capital cost
between the boiler and biorefinery costs. In DIBANET the boiler costs are significantly lower
than Biofine, even in the scenarios (“Biofuels”, “Combined”) where a high pressure boiler is
required and these also contribute a lower proportion to total capital costs.
Figure 14 also shows significant differences in capital costs between the “Pretreatment” and
“Biorefining” and “Biofuels”/”Combined” scenarios. The “Pretreatment” process is the
simplest of all the DIBANET scenarios and so has lower capital costs for the main biorefinery
and for the low pressure boiler (since process energy needs are relatively low). The reduction
in the capital cost may make the “Pretreatment” option more attractive to investors who may
have concerns over the risks associated in investing in larger projects. This scenario, whilst
providing less annual revenue than the other DIBANET options, does still provide attractive
values for the IRR, ROI, and NPV and has a short payback period of 3 years when bagasse is
used.
Figure 14: Capital costs for the various technologies, assuming a biomass throughput (for the
production of fuels and/or chemicals) of 475,000 dry tonnes per year. The total costs for the
facilities are presented as well as separate costs for the biorefinery and boiler sections.
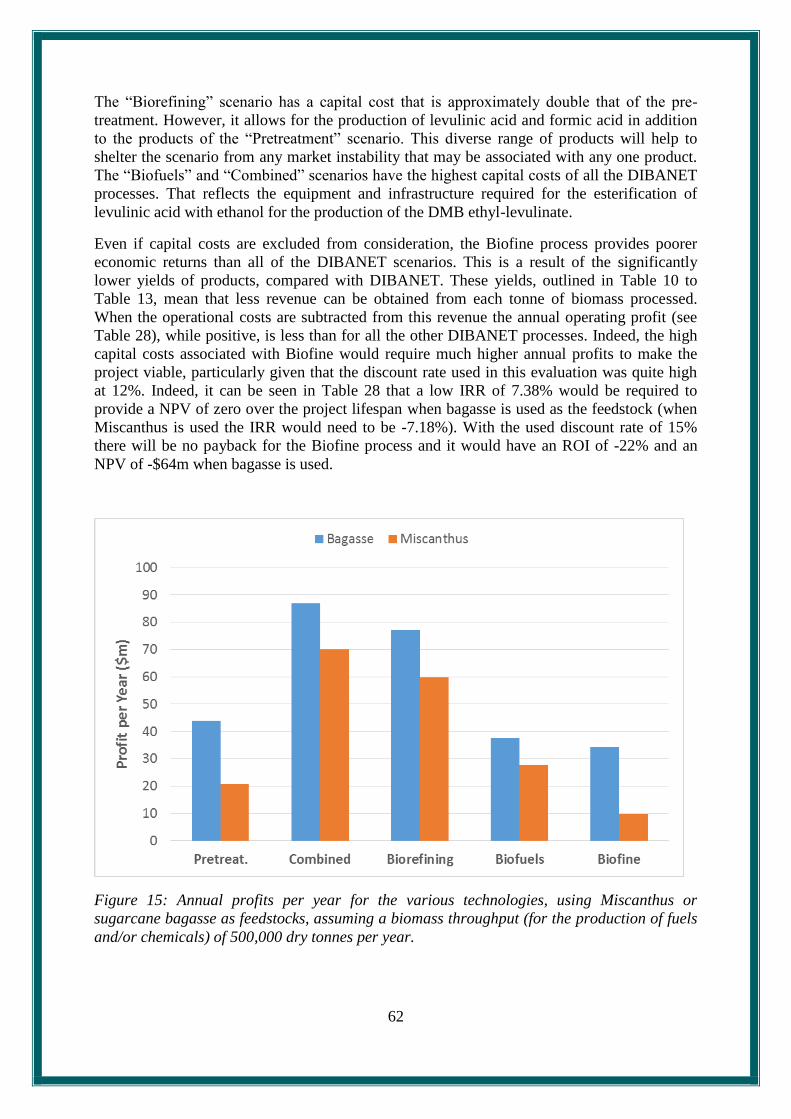
62
The “Biorefining” scenario has a capital cost that is approximately double that of the pre-
treatment. However, it allows for the production of levulinic acid and formic acid in addition
to the products of the “Pretreatment” scenario. This diverse range of products will help to
shelter the scenario from any market instability that may be associated with any one product.
The “Biofuels” and “Combined” scenarios have the highest capital costs of all the DIBANET
processes. That reflects the equipment and infrastructure required for the esterification of
levulinic acid with ethanol for the production of the DMB ethyl-levulinate.
Even if capital costs are excluded from consideration, the Biofine process provides poorer
economic returns than all of the DIBANET scenarios. This is a result of the significantly
lower yields of products, compared with DIBANET. These yields, outlined in Table 10 to
Table 13, mean that less revenue can be obtained from each tonne of biomass processed.
When the operational costs are subtracted from this revenue the annual operating profit (see
Table 28), while positive, is less than for all the other DIBANET processes. Indeed, the high
capital costs associated with Biofine would require much higher annual profits to make the
project viable, particularly given that the discount rate used in this evaluation was quite high
at 12%. Indeed, it can be seen in Table 28 that a low IRR of 7.38% would be required to
provide a NPV of zero over the project lifespan when bagasse is used as the feedstock (when
Miscanthus is used the IRR would need to be -7.18%). With the used discount rate of 15%
there will be no payback for the Biofine process and it would have an ROI of -22% and an
NPV of -$64m when bagasse is used.
Figure 15: Annual profits per year for the various technologies, using Miscanthus or
sugarcane bagasse as feedstocks, assuming a biomass throughput (for the production of fuels
and/or chemicals) of 500,000 dry tonnes per year.
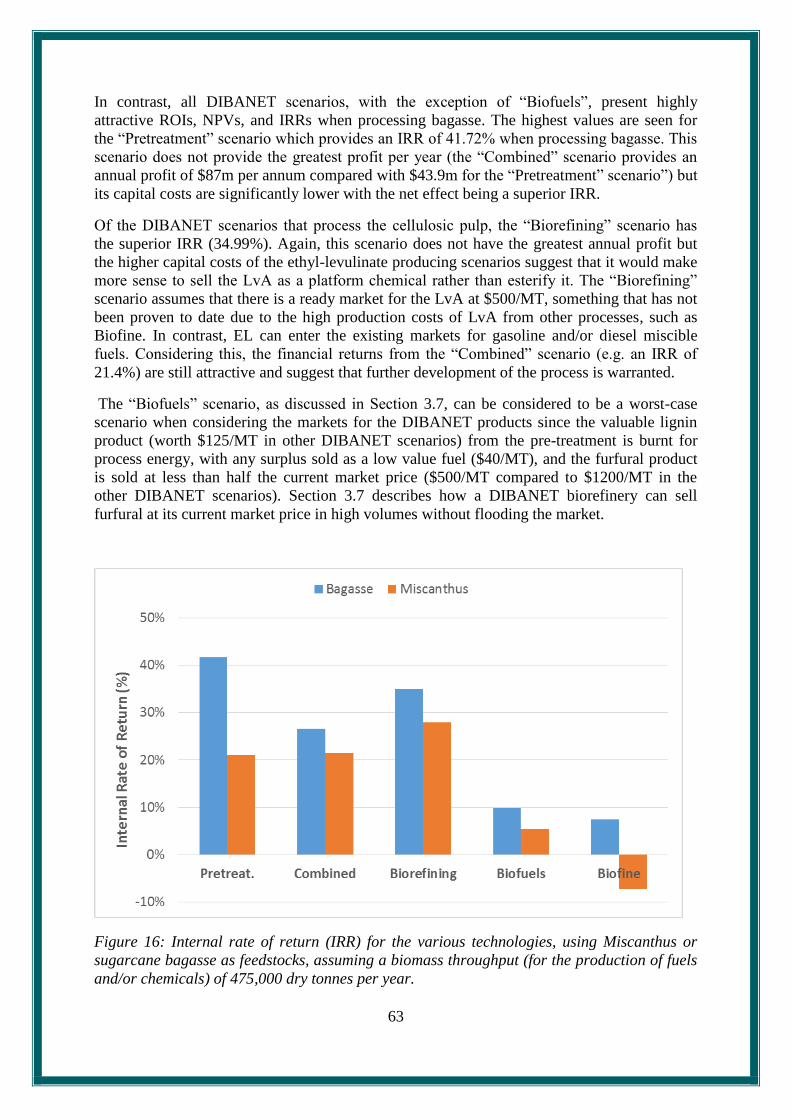
63
In contrast, all DIBANET scenarios, with the exception of “Biofuels”, present highly
attractive ROIs, NPVs, and IRRs when processing bagasse. The highest values are seen for
the “Pretreatment” scenario which provides an IRR of 41.72% when processing bagasse. This
scenario does not provide the greatest profit per year (the “Combined” scenario provides an
annual profit of $87m per annum compared with $43.9m for the “Pretreatment” scenario”) but
its capital costs are significantly lower with the net effect being a superior IRR.
Of the DIBANET scenarios that process the cellulosic pulp, the “Biorefining” scenario has
the superior IRR (34.99%). Again, this scenario does not have the greatest annual profit but
the higher capital costs of the ethyl-levulinate producing scenarios suggest that it would make
more sense to sell the LvA as a platform chemical rather than esterify it. The “Biorefining”
scenario assumes that there is a ready market for the LvA at $500/MT, something that has not
been proven to date due to the high production costs of LvA from other processes, such as
Biofine. In contrast, EL can enter the existing markets for gasoline and/or diesel miscible
fuels. Considering this, the financial returns from the “Combined” scenario (e.g. an IRR of
21.4%) are still attractive and suggest that further development of the process is warranted.
The “Biofuels” scenario, as discussed in Section 3.7, can be considered to be a worst-case
scenario when considering the markets for the DIBANET products since the valuable lignin
product (worth $125/MT in other DIBANET scenarios) from the pre-treatment is burnt for
process energy, with any surplus sold as a low value fuel ($40/MT), and the furfural product
is sold at less than half the current market price ($500/MT compared to $1200/MT in the
other DIBANET scenarios). Section 3.7 describes how a DIBANET biorefinery can sell
furfural at its current market price in high volumes without flooding the market.
Figure 16: Internal rate of return (IRR) for the various technologies, using Miscanthus or
sugarcane bagasse as feedstocks, assuming a biomass throughput (for the production of fuels
and/or chemicals) of 475,000 dry tonnes per year.

64
The one advantage of the “Biofuels” scenario, compared with the other DIBANET process
configurations, is that it allows all of the process energy needs to be met from the products of
the process (AHRs and lignin). This means that no additional biomass needs to be purchased
to fuel the boilers. An investigation was made into assigning a value of $1,200 per tonne for
the furfural in the “Biofuels” scenario but keeping the end-use for the lignin product the same
(i.e. the only difference between this scenario and the “Combined” scenario was in the use of
the lignin). It was found that the IRR improved substantially when using bagasse as a
feedstock (from 9.98% to 24.31%) but that the “Combined” and “Biorefining” scenarios still
had superior values for the ROI, NPV, and IRR. This shows that lignin has significantly more
value as a biomaterial than as a fuel and that it is financially superior to burn additional
biomass (even higher cost biomass such as Miscanthus), rather than the lignin, to supply the
energy needs of the process. Indeed, it was found that a bagasse price of $120 per tonne was
necessary for the “Biofuels” scenario (in the case where the furfural was sold for $1200/MT)
to provide superior returns compared with the “Combined” scenario.
Figure 17: Return on investment (ROI) for the various technologies, using Miscanthus or
sugarcane bagasse as feedstocks, assuming a biomass throughput (for the production of fuels
and/or chemicals) of 475,000 dry tonnes per year.
The financial returns when processing Miscanthus are significantly less than when processing
sugarcane bagasse for all DIBANET scenarios, Table 28. This is primarily the result of two
significant differences between bagasse and Miscanthus: the higher cost and the lower
pentose content of Miscanthus. The effect of this is particularly apparent in the “Pretreatment”
scenario, which sees its ROI reduced by approximately a factor of 4 when the feedstock shifts
from bagasse to Miscanthus (nevertheless the IRR of 21% for this option is still attractive).
Miscanthus has a higher hexose content than sugarcane bagasse meaning that the yields of
LvA and EL will be greater. Scenarios that provide a greater value weighting to these
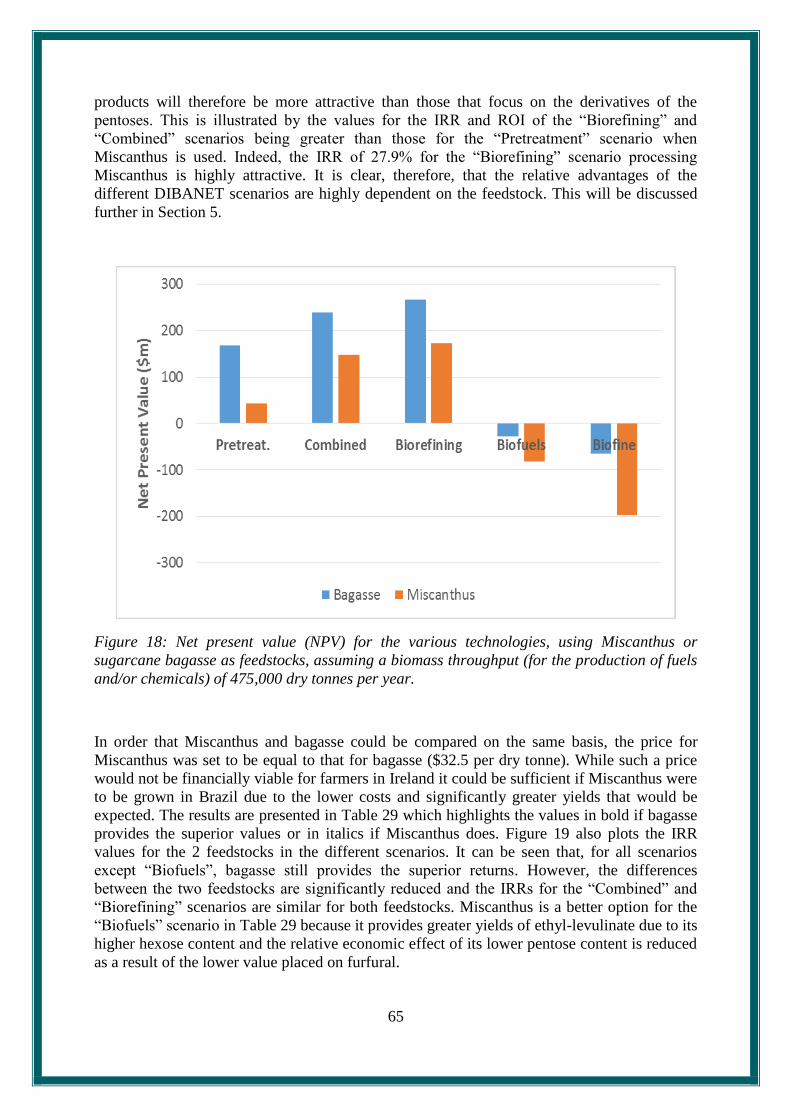
65
products will therefore be more attractive than those that focus on the derivatives of the
pentoses. This is illustrated by the values for the IRR and ROI of the “Biorefining” and
“Combined” scenarios being greater than those for the “Pretreatment” scenario when
Miscanthus is used. Indeed, the IRR of 27.9% for the “Biorefining” scenario processing
Miscanthus is highly attractive. It is clear, therefore, that the relative advantages of the
different DIBANET scenarios are highly dependent on the feedstock. This will be discussed
further in Section 5.
Figure 18: Net present value (NPV) for the various technologies, using Miscanthus or
sugarcane bagasse as feedstocks, assuming a biomass throughput (for the production of fuels
and/or chemicals) of 475,000 dry tonnes per year.
In order that Miscanthus and bagasse could be compared on the same basis, the price for
Miscanthus was set to be equal to that for bagasse ($32.5 per dry tonne). While such a price
would not be financially viable for farmers in Ireland it could be sufficient if Miscanthus were
to be grown in Brazil due to the lower costs and significantly greater yields that would be
expected. The results are presented in Table 29 which highlights the values in bold if bagasse
provides the superior values or in italics if Miscanthus does. Figure 19 also plots the IRR
values for the 2 feedstocks in the different scenarios. It can be seen that, for all scenarios
except “Biofuels”, bagasse still provides the superior returns. However, the differences
between the two feedstocks are significantly reduced and the IRRs for the “Combined” and
“Biorefining” scenarios are similar for both feedstocks. Miscanthus is a better option for the
“Biofuels” scenario in Table 29 because it provides greater yields of ethyl-levulinate due to its
higher hexose content and the relative economic effect of its lower pentose content is reduced
as a result of the lower value placed on furfural.

66
Table 29: Financial metrics for using (Sugarcane Bagasse) and [Miscanthus] in a number of
different DIBANET scenarios and using the Biofine process under the instance where a lower
price of $32.5/t is paid for the Miscanthus.
Pretreat. Combined Biorefining Biofuels Biofine
Capex ($m) (82.0) [82.0] (271.0) [271.0] (176.8) [176.8] (271.0) [271.0] (291.1) [291.1]
Profit/Loss per yr ($m) (43.86) [34.75] (87.01) [85.63] (77.02) [74.41] (37.94) [41.41] (34.32) [29.55]
IRR (%) (41.71%) [34.16%] (26.52%) [26.12%] (34.99%) [33.95%] (9.98%) [11.39%] (7.38%) [5.27%]
ROI (%) (204.36%) [144.04%] (88.28%) [85.51%] (150.43%) [142.44%] (-10.02%) [-3.07%] (-22.01%) [-30.91%]
NPV ($m) (167.6) [118.1] (239.3) [231.8] (266.0) [251.9] (-27.2) [-8.3] (-64.1) [-90.0]
Payback Period (yrs) (3) [4] (5) [5] (4) [4] No Payback No Payback
Figure 19: Internal rate of return (IRR) for the various technologies, using Miscanthus or
sugarcane bagasse as feedstocks, assuming a biomass biorefinery throughput of 475,000 dry
tonnes per year and that Miscanthus and bagasse are priced equally.
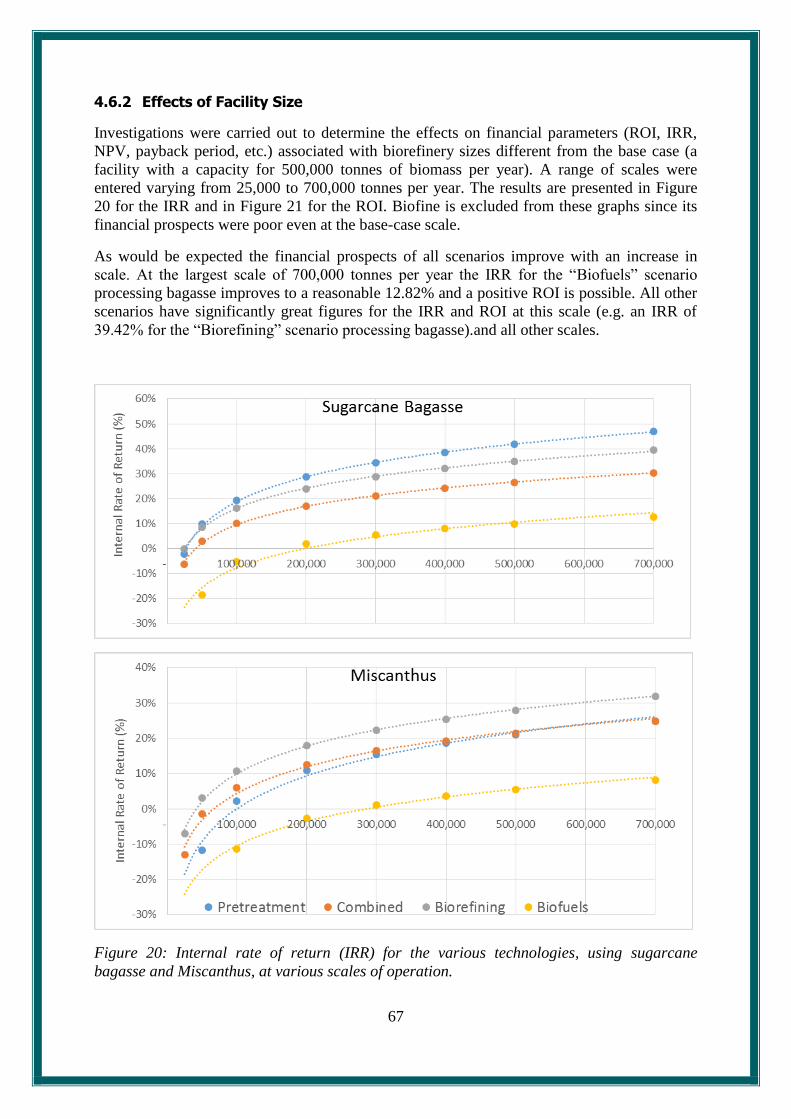
67
4.6.2 Effects of Facility Size
Investigations were carried out to determine the effects on financial parameters (ROI, IRR,
NPV, payback period, etc.) associated with biorefinery sizes different from the base case (a
facility with a capacity for 500,000 tonnes of biomass per year). A range of scales were
entered varying from 25,000 to 700,000 tonnes per year. The results are presented in Figure
20 for the IRR and in Figure 21 for the ROI. Biofine is excluded from these graphs since its
financial prospects were poor even at the base-case scale.
As would be expected the financial prospects of all scenarios improve with an increase in
scale. At the largest scale of 700,000 tonnes per year the IRR for the “Biofuels” scenario
processing bagasse improves to a reasonable 12.82% and a positive ROI is possible. All other
scenarios have significantly great figures for the IRR and ROI at this scale (e.g. an IRR of
39.42% for the “Biorefining” scenario processing bagasse).and all other scales.
Figure 20: Internal rate of return (IRR) for the various technologies, using sugarcane
bagasse and Miscanthus, at various scales of operation.
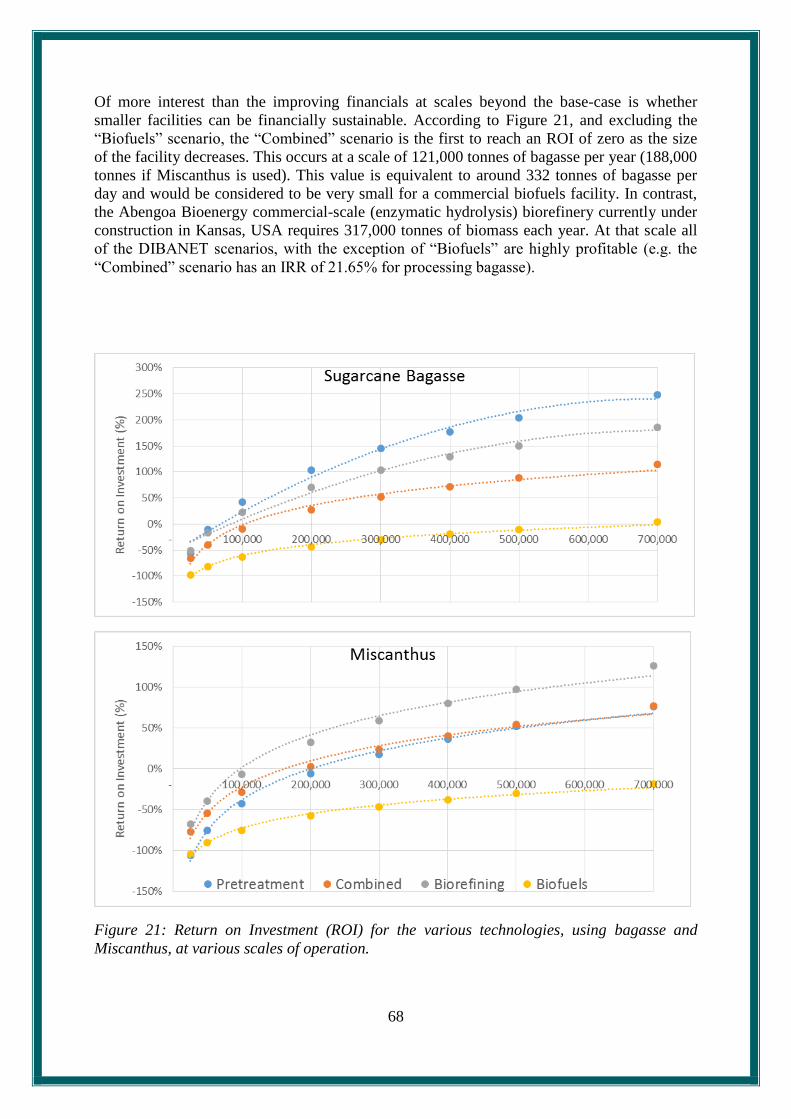
68
Of more interest than the improving financials at scales beyond the base-case is whether
smaller facilities can be financially sustainable. According to Figure 21, and excluding the
“Biofuels” scenario, the “Combined” scenario is the first to reach an ROI of zero as the size
of the facility decreases. This occurs at a scale of 121,000 tonnes of bagasse per year (188,000
tonnes if Miscanthus is used). This value is equivalent to around 332 tonnes of bagasse per
day and would be considered to be very small for a commercial biofuels facility. In contrast,
the Abengoa Bioenergy commercial-scale (enzymatic hydrolysis) biorefinery currently under
construction in Kansas, USA requires 317,000 tonnes of biomass each year. At that scale all
of the DIBANET scenarios, with the exception of “Biofuels” are highly profitable (e.g. the
“Combined” scenario has an IRR of 21.65% for processing bagasse).
Figure 21: Return on Investment (ROI) for the various technologies, using bagasse and
Miscanthus, at various scales of operation.

69
The “Biorefining” and “Pretreatment” scenarios continue to be profitable at scales at which
the “Combined” scenario no longer provides a positive ROI. Indeed, the “Biorefining”
scenario requires a facility size of less than 68,500 tonnes per year (188 tonnes per day) for
the ROI to be negative when processing bagasse whilst the “Pretreatment” scenario requires
less than 58,000 tonnes per year (158 tonnes per day) to reach this point. These results are
important since they open up the possibility for smaller-scale biorefineries that pose less risk
to investors than other such first-of-a-kind commercial scale facilities that tend to require
much larger economies of scale to be financially viable.
If Miscanthus is the feedstock to be utilised, then larger facilities will be needed to achieve the
same economic returns as sugarcane-bagasse processing biorefineries. This is partly a result
of the higher cost of this feedstock and also, in the case of technologies where furfural
provides a significant proportion of the total revenue (e.g. the “Pretreatment” and
“Biorefining” scenarios), due to the significantly lower pentose content of this feedstock.
Nevertheless, the utilisation of Miscanthus as a feedstock at modest economies of scale can be
highly profitable, particularly for technologies (e.g. the “Biorefining” scenario) that make the
most of the extra hexose content that this feedstock has when compared with bagasse. Table
30 summarises the minimum scales of operation required to provide a positive ROI for all
DIBANET scenarios processing Miscanthus or bagasse and also shows the relative extra
biomass requirement needed for a Miscanthus plant to provide this, compared with the
bagasse plant. For the DIBANET scenarios this extra biomass requirement is greatest (in
relative terms) for the “Pretreatment” scenario. Table 30 also shows that the Biofine process
requires a facility of a massive scale (over 1 million tonnes per annum, with an associated
capital cost of $497.3m) for the utilisation of bagasse to provide a positive ROI, whilst doing
so for Miscanthus would be impossible for Biofine at practicable levels of operation.
Table 30: The minimum facility size required to achieve a positive ROI value for the Biofine
process and the DBANET scenarios using either bagasse or Miscanthus as the feedstock. The
relative extra biomass requirement for Miscanthus, compared with bagasse, is also presented.
Pretreatment Combined Biorefining Biofuels Biofine
Bagasse 57,918 121,251 68,277 635,593 1,041,464
Miscanthus 221,491 188,432 112,959 1,094,478 33,521,486
% Extra Req. for Miscanthus 282.42% 55.41% 65.44% 72.20% 3,118.69%

70
4.6.3 Use of Process Residues
Slow pyrolysis, fast pyrolysis, and gasification have been shown to be uneconomical end-uses
for the acid hydrolysis residues. That leaves combustion as the most viable alternative.
However, there are a number of different process configurations that can be employed in
combustion. Three of these are included in the DIBANET spreadsheet so that the financial
competiveness of these can be evaluated. The options are:
Residues and lignin are burned in a low pressure (LP) boiler for the production of heat
and energy. Any electricity required by the process is bought from the grid. This
option is not suitable for the Biofine process, since it requires high pressure steam, but
it is suitable for the DIBANET scenarios that do not produce ethyl-levulinate
(“Pretreatment” and “Biorefining”).
Residues and lignin are burned in a high pressure boiler. This (or a CHP unit) is a
requirement for the “Combined” and “Biofuels” DIBANET scenarios, and for Biofine.
Residues (and possibly) lignin are burned in a combined heat and power (CHP) system
that comprises a high pressure boiler and a steam turbine for the production, and sale,
of electricity. In this option, process electrical needs are met internally and excess
electricity is sold to the grid. This option is suitable for the DIBANET “Biofuels”
option sin which a surplus of lignin is produced beyond that required for process heat.
It is not suitable for the Biofine process or other DIBANET scenarios since these
require additional biomass to supply their process needs.
Hence, the evaluation regarding the type of boiler system only needed to consider CHP versus
a HP boiler for the DIBANET “biofuels” scenario. Table 31 presents the economic indices
returned for these two options, in the base-case, using either Miscanthus or sugarcane bagasse
as a feedstock, whilst the ROI and IRR are plotted in Figure 22. It can be seen that the
financial returns are superior for the CHP option in the case of Miscanthus and the LP option
provides better returns when bagasse is used. There are two main reasons for this difference:
1. Differences in Klason lignin (KL) content between the feedstocks – The KL content of
Miscanthus is 21.2% greater (in relative terms) than that of bagasse. That means that,
in the Biofuels scenario, only 68.3% of the lignin is required for process heat
requirements when Miscanthus is used, compared with a lignin requirement of 80.4%
when bagasse is used. The surplus lignin can be used to generate electricity for sale.
For bagasse this surplus lignin amounts to 29 kg per tonne of biomass processed,
whereas for Miscanthus the surplus is significantly greater at 58 kg per tonne. The
capital and operating costs of a CHP system is greater than that of a high-pressure
boiler meaning that this extra cost will need to be covered by the extra profit that the
sale of electricity can enable. A boiler system that can use a larger proportion of its
output for electricity production (once process energy needs have been met) would
therefore be more advantageous in this regard, something that Miscanthus enables in
comparison to bagasse.
2. Differences in the prices paid for electricity in Ireland and Brazil – The selection of
feedstock in the DIBANET model automatically changes the location of the
biorefining facility (to Ireland for Miscanthus and to Brazil for bagasse). The market

71
conditions are more favourable in Ireland for the production of biomass-based
electricity than they are in Brazil since a price of 7.2 euro cents (9.4 US cents) can be
charged per kWhr (versus 3.6 US cents in Brazil). Also, the cost to industry for
purchasing electricity from the grid (as would be required in the HP boiler option) is
higher in Ireland (14 US cents per kWhr) than in Brazil (11 US cents per kWhr),
further increasing the electricity price differential between the Miscanthus and bagasse
options.
Table 31: Financial metrics for employing a combined heat and power (CHP) system or a
low pressure (LP) boiler system for the combustion of AHRs and lignin in the DIBANET
“Biofuels” scenario in cases where sugarcane bagasse or Miscanthus are the feedstocks
processed in the base-case (500,000 tonnes per year).
DIBANET “Biofuels” Scenario
Sugarcane Bagasse Miscanthus
HP CHP HP CHP
Capex ($m) 271.0 277.7 271.0 284.2
Profit/Loss per yr ($m) 37.69 39.11 27.88 32.68
IRR (%) 9.88% 10.07% 5.45% 7.01%
ROI (%) -10.52% -9.58% -30.18% -23.60%
NPV ($m) -28.51 -26.62 -81.80 -67.07
Figure 22: Values for the internal rate of return (IRR) and the return on investment (ROI) for
variations of the DIBANET “Biofuels” scenario in which sugarcane bagasse or Miscanthus
are combusted in low pressure boilers or in combined heat and power (CHP) systems.
72
4.7 Case Study: Facility Owned and Operated by Sugar Mill
Following the successful demonstration-scale application of the process the DIBANET IP
would be ready for commercial deployment. DIBANET Deliverable D.5.4 presents several
options for what could happen at this point. In one option the spin-out company that holds the
IP could become involved in the manufacture, operation, and ownership of commercial-scale
DIBANET biorefining facilities. In such a scenario it would be necessary to pay the
independent suppliers of the biomass feedstock, e.g. bagasse, an appropriate price for their
resource. An alternative option would be for the spin-out company to license the DIBANET
process so that other companies could operate commercial-scale facilities. In this scenario it is
feasible that a sugar mill operator could operate such a facility using bagasse as the feedstock.
In that instance it may not be necessary for the owner of the biorefinery to pay the feedstock
provider. This would mean that the cost of the bagasse could be $0 per tonne.
Furthermore, the sugar mill operator would not need to pay the current market price for
ethanol since this product would be manufactured in the mill and would be available for use
in the DIBANET “Combined” and “Biofuels” scenarios. The cost of this ethanol to the
DIBANET process would then be related to the production cost in the sugar mill and not to
market ethanol conditions. A review of the literature suggested that this production cost
would be 31.3 US cents per litre in Brazil {Dias, 2010 #1972}, equivalent to a cost of
$397/MT.
To evaluate this scenario, the two base-case prices were adjusted (bagasse from $32.5/MT to
$0/MT and ethanol from $863/MT to $397/MT) in the Excel spreadsheet, and the effects on
the commercial prospects of the DIBANET scenarios were examined. The results are
presented in Table 32 and are compared with the results when the base-case prices of bagasse
and ethanol are used (the figures in square brackets). Table 32 also presents the economic
returns (annual profit and NPV) for the sugar mill operator that could be associated with the
alternative option of not building the biorefinery and instead selling the bagasse at a price of
$32.5 per tonne. For this option a much lower discount rate (5% versus 12% for the
DIBANET scenarios and Biofine) is applied reflecting the much lower risk it presents. In
order for the biorefinery option to be financially superior to the “Sell Bagasse” option its NPV
would need to be greater.
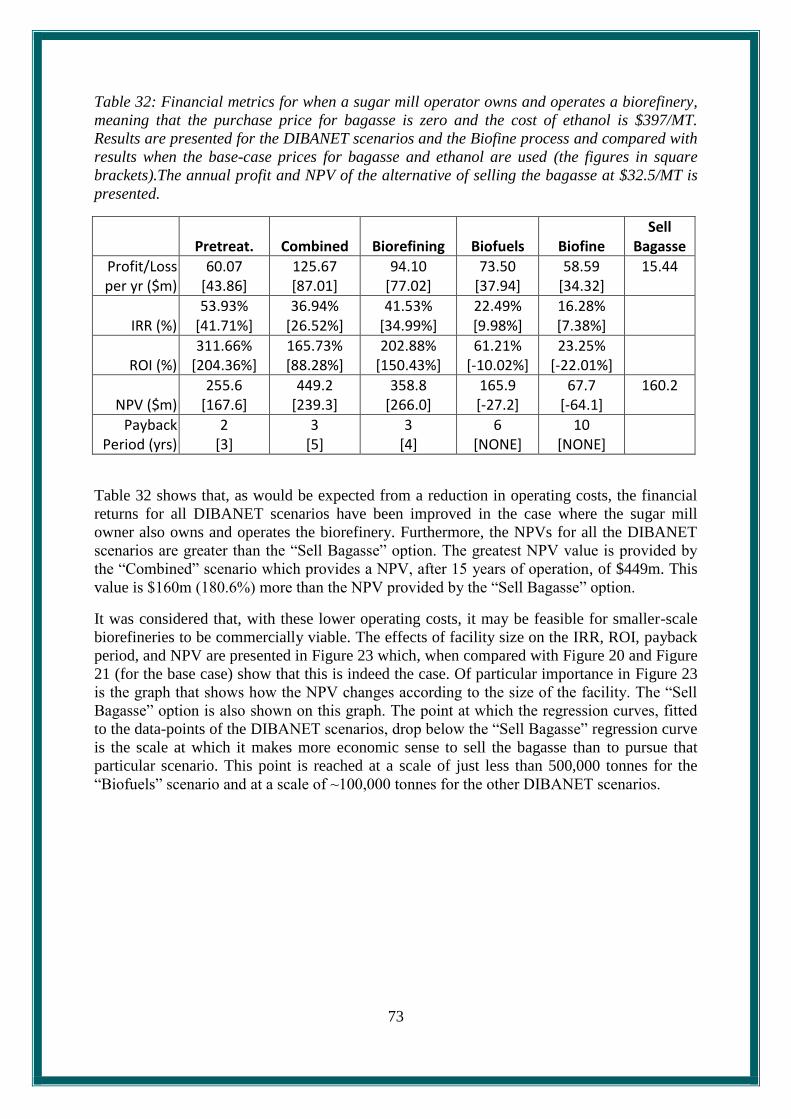
73
Table 32: Financial metrics for when a sugar mill operator owns and operates a biorefinery,
meaning that the purchase price for bagasse is zero and the cost of ethanol is $397/MT.
Results are presented for the DIBANET scenarios and the Biofine process and compared with
results when the base-case prices for bagasse and ethanol are used (the figures in square
brackets).The annual profit and NPV of the alternative of selling the bagasse at $32.5/MT is
presented.
Pretreat. Combined Biorefining Biofuels Biofine
Sell Bagasse
Profit/Loss per yr ($m)
60.07 [43.86]
125.67 [87.01]
94.10 [77.02]
73.50 [37.94]
58.59 [34.32]
15.44
IRR (%) 53.93%
[41.71%] 36.94%
[26.52%] 41.53%
[34.99%] 22.49% [9.98%]
16.28% [7.38%]
ROI (%) 311.66%
[204.36%] 165.73% [88.28%]
202.88% [150.43%]
61.21% [-10.02%]
23.25% [-22.01%]
NPV ($m) 255.6
[167.6] 449.2
[239.3] 358.8
[266.0] 165.9 [-27.2]
67.7 [-64.1]
160.2
Payback Period (yrs)
2 [3]
3 [5]
3 [4]
6 [NONE]
10 [NONE]
Table 32 shows that, as would be expected from a reduction in operating costs, the financial
returns for all DIBANET scenarios have been improved in the case where the sugar mill
owner also owns and operates the biorefinery. Furthermore, the NPVs for all the DIBANET
scenarios are greater than the “Sell Bagasse” option. The greatest NPV value is provided by
the “Combined” scenario which provides a NPV, after 15 years of operation, of $449m. This
value is $160m (180.6%) more than the NPV provided by the “Sell Bagasse” option.
It was considered that, with these lower operating costs, it may be feasible for smaller-scale
biorefineries to be commercially viable. The effects of facility size on the IRR, ROI, payback
period, and NPV are presented in Figure 23 which, when compared with Figure 20 and Figure
21 (for the base case) show that this is indeed the case. Of particular importance in Figure 23
is the graph that shows how the NPV changes according to the size of the facility. The “Sell
Bagasse” option is also shown on this graph. The point at which the regression curves, fitted
to the data-points of the DIBANET scenarios, drop below the “Sell Bagasse” regression curve
is the scale at which it makes more economic sense to sell the bagasse than to pursue that
particular scenario. This point is reached at a scale of just less than 500,000 tonnes for the
“Biofuels” scenario and at a scale of ~100,000 tonnes for the other DIBANET scenarios.

74
Figure 23: Internal Rate of Return (IRR), Return on Investment (ROI), and NPV for the
various technologies using bagasse at various scales of operation.
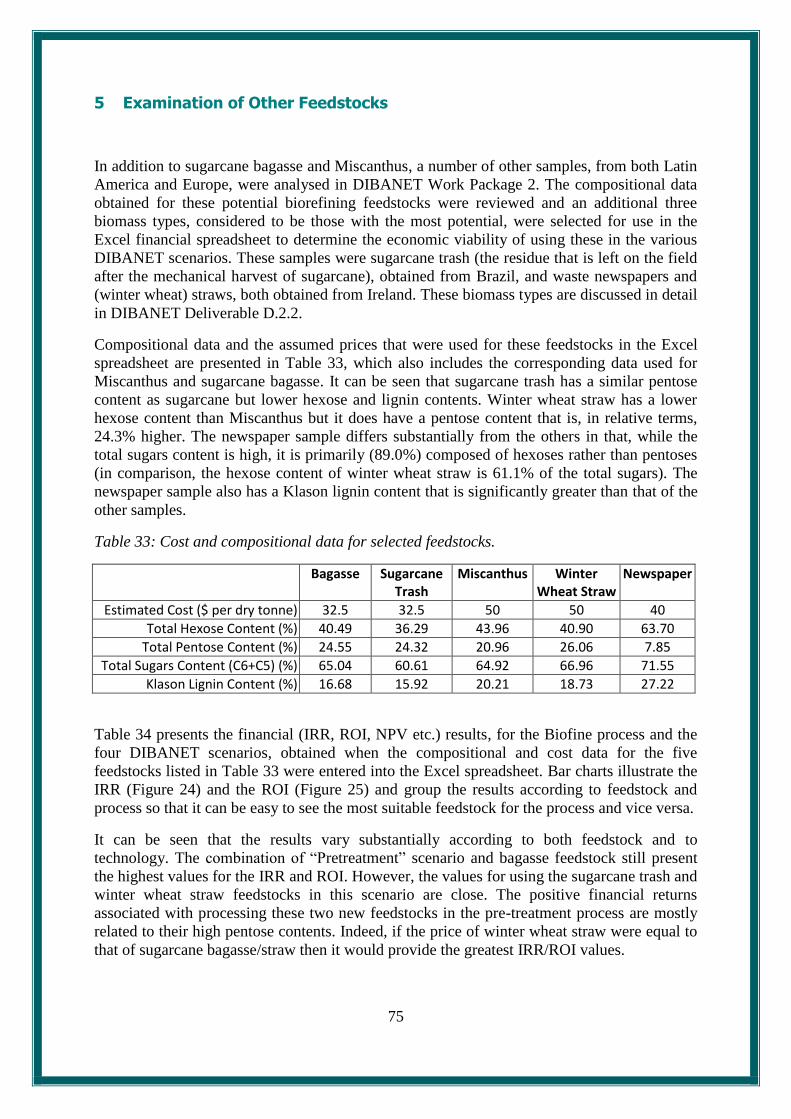
75
5 Examination of Other Feedstocks
In addition to sugarcane bagasse and Miscanthus, a number of other samples, from both Latin
America and Europe, were analysed in DIBANET Work Package 2. The compositional data
obtained for these potential biorefining feedstocks were reviewed and an additional three
biomass types, considered to be those with the most potential, were selected for use in the
Excel financial spreadsheet to determine the economic viability of using these in the various
DIBANET scenarios. These samples were sugarcane trash (the residue that is left on the field
after the mechanical harvest of sugarcane), obtained from Brazil, and waste newspapers and
(winter wheat) straws, both obtained from Ireland. These biomass types are discussed in detail
in DIBANET Deliverable D.2.2.
Compositional data and the assumed prices that were used for these feedstocks in the Excel
spreadsheet are presented in Table 33, which also includes the corresponding data used for
Miscanthus and sugarcane bagasse. It can be seen that sugarcane trash has a similar pentose
content as sugarcane but lower hexose and lignin contents. Winter wheat straw has a lower
hexose content than Miscanthus but it does have a pentose content that is, in relative terms,
24.3% higher. The newspaper sample differs substantially from the others in that, while the
total sugars content is high, it is primarily (89.0%) composed of hexoses rather than pentoses
(in comparison, the hexose content of winter wheat straw is 61.1% of the total sugars). The
newspaper sample also has a Klason lignin content that is significantly greater than that of the
other samples.
Table 33: Cost and compositional data for selected feedstocks.
Bagasse Sugarcane Trash
Miscanthus Winter Wheat Straw
Newspaper
Estimated Cost ($ per dry tonne) 32.5 32.5 50 50 40
Total Hexose Content (%) 40.49 36.29 43.96 40.90 63.70
Total Pentose Content (%) 24.55 24.32 20.96 26.06 7.85
Total Sugars Content (C6+C5) (%) 65.04 60.61 64.92 66.96 71.55
Klason Lignin Content (%) 16.68 15.92 20.21 18.73 27.22
Table 34 presents the financial (IRR, ROI, NPV etc.) results, for the Biofine process and the
four DIBANET scenarios, obtained when the compositional and cost data for the five
feedstocks listed in Table 33 were entered into the Excel spreadsheet. Bar charts illustrate the
IRR (Figure 24) and the ROI (Figure 25) and group the results according to feedstock and
process so that it can be easy to see the most suitable feedstock for the process and vice versa.
It can be seen that the results vary substantially according to both feedstock and to
technology. The combination of “Pretreatment” scenario and bagasse feedstock still present
the highest values for the IRR and ROI. However, the values for using the sugarcane trash and
winter wheat straw feedstocks in this scenario are close. The positive financial returns
associated with processing these two new feedstocks in the pre-treatment process are mostly
related to their high pentose contents. Indeed, if the price of winter wheat straw were equal to
that of sugarcane bagasse/straw then it would provide the greatest IRR/ROI values.

76
While the trash and straw are attractive feedstocks for the “Pretreatment” scenario, newspaper
is not - the financial model returned negative values for the IRR and ROI. Newspaper is
unsuitable for the pre-treatment (unless a significantly greater price is paid for the cellulosic
pulp) due to its low pentosan content. That means that furfural yields (on a per-tonne of
biomass processed basis) would be low. Newspaper performs much better as a feedstock in
scenarios where less weighting is placed on the furfural, and where greater revenues can be
achieved from processing the hexoses. For example, the Biofuels scenario provides attractive
values for the IRR/ROI (e.g. an IRR of 21.1%) when using newspaper. This is a result of the
enhanced hexose content of the feedstock. While there are still more profitable scenarios for
using the newspaper feedstock than in the “Biofuels” process, that scenario is much more
competitive when using this feedstock than it is when other feedstocks are used.
Table 34: Financial results from modelling the use of a number of different feedstocks in the
Biofine process and the various DIBANET scenarios.
Pretreatment Combined Biorefining Biofuels Biofine
Sugarcane Bagasse Profit/Loss per yr ($m) 43.86 87.01 77.02 37.94 34.32
IRR (%) 41.71% 26.52% 34.99% 9.98% 7.38%
ROI (%) 204.36% 88.28% 150.43% -10.02% -22.01%
NPV ($m) 167.60 239.27 266.03 -27.17 -64.08
Payback Period (yrs) 3 5 4 - -
Sugarcane Trash Profit/Loss per yr ($m) 42.65 76.07 67.70 27.57 28.24
IRR (%) 40.74% 23.28% 31.20% 5.30% 4.66%
ROI (%) 196.34% 66.36% 121.83% -30.80% -33.37%
NPV ($m) 161.02 179.86 215.44 -83.46 -97.12
Payback Period (yrs) 3 6 4 - -
Miscanthus Profit/Loss per yr ($m) 20.84 70.08 59.89 28.35 9.67
IRR (%) 21.04% 21.42% 27.89% 5.68% -7.18%
ROI (%) 51.96% 54.36% 97.83% -29.24% -67.99%
NPV ($m) 42.61 147.34 173.01 -79.25 -197.90
Payback Period (yrs) 7 7 5 - -
Winter Wheat Straw Profit/Loss per yr ($m) 38.88 83.71 74.28 32.86 24.65
IRR (%) 37.65% 25.56% 33.90% 7.79% 2.89%
ROI (%) 171.35% 81.66% 142.04% -20.20% -40.05%
NPV ($m) 140.52 221.33 251.19 -54.74 -116.58
Payback Period (yrs) 3 5 4 - -
Newspaper Profit/Loss per yr ($m) 5.46 93.15 74.54 69.12 23.51
IRR (%) -0.01% 28.27% 34.00% 21.12% 2.30%
ROI (%) -49.88% 100.58% 142.84% 52.45% -42.18%
NPV ($m) -40.91 272.61 252.59 142.14 -122.77
Payback Period - 5 4 7 -

77
Figure 24: The internal rate of return (IRR) associated with processing a number of
feedstocks in the Biofine process and the different DIBANET scenarios. The results are
grouped according to the feedstock (top chart) and according to the process (bottom chart).
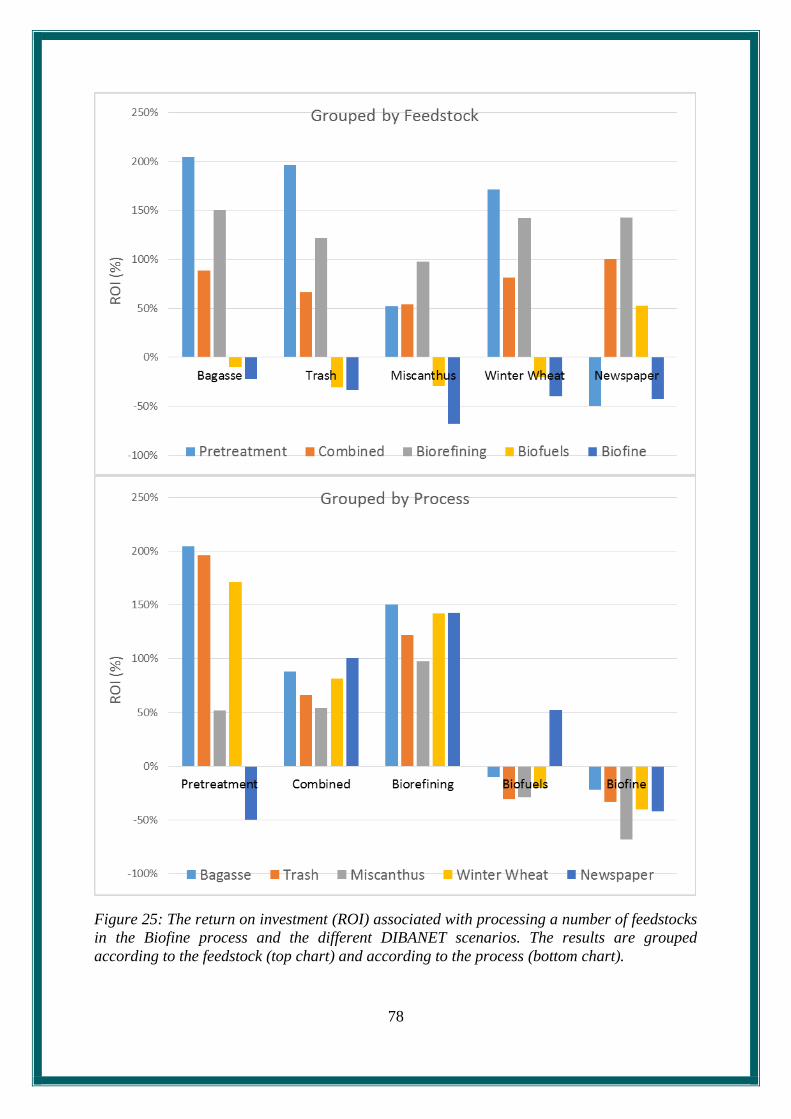
78
Figure 25: The return on investment (ROI) associated with processing a number of feedstocks
in the Biofine process and the different DIBANET scenarios. The results are grouped
according to the feedstock (top chart) and according to the process (bottom chart).

79
6 Comparisons with Other Technologies
A literature review was carried out to determine how the financial metrics of the DIBANET
scenarios compare with those predicted for other lignocellulosic biorefining technologies.
Some of the relevant papers that were found are discussed below.
Gonzalez et al. (6) evaluated the economics for the production of ethanol via the gasification
of lignocellulosic biomass and the subsequent catalytic upgrading of the syngas. Four
different feedstocks (softwoods, hardwoods, corn stover, and switchgrass), with purchase
prices ranging from $76.5 to $88.5 per dry tonne, were evaluated using similar financial
parameters as in the DIBANET model (a discount rate of 12%, a facility lifespan of 15 years,
a base-case facility size of 453,597 tonnes per annum) and Aspen Plus was used to model the
gasification process. The revenue for ethanol was set at $3.01 per US gallon (79.5c per litre)
with this revenue comprising the sales price ($2 per US gallon) and a subsidy ($1.01 per US
gallon). This is very similar to the DIBANET sales price of 79c per litre for ethyl levulinate.
Irrespective of the feedstock used the capital cost of the facility, excluding the cost of the
purchase of land, was estimated to be $290m. The values obtained for the NPV and IRR are
presented in Figure 26. It can be seen that the IRR values are lower than for most of the
DIBANET scenarios, excluding the “Biofuels” scenario, in the base case.
Figure 26: Results for the net present value (NPV) and internal rate of return (IRR) for the
production of lignocellulosic ethanol from a number of different feedstocks via a gasification
process. Taken from (6).
80
Dias et al. (7) compared the economics of producing second generation ethanol from
sugarcane bagasse and trash against the economics of using these for electricity production in
a CHP system. Enzymatic hydrolysis was the conversion process used in the biorefinery
systems with three different levels of technological development. The first was based on
current conditions and assumed low yields (60%) and low solids loadings (10 weight percent)
with only the glucose fraction fermented to ethanol (the pentoses being anaerobically digested
to produce a biogas that is used in the CHP system). The second level of technological
development saw yields improved (70%) and solid loadings levels increased (15%) as a result
of the use of an alkaline delignification step. The third level saw ethanol also being produced
from the pentoses (80% efficiency). The authors found that the use of 50% of trash in addition
to the bagasse allowed for an IRR of 16.9% for the CHP option with lower values for the
biorefining facilities employing Technology Levels 1 and 2 (IRRs of 12.2% and 14.5%,
respectively) although the most advanced biorefinery option did present a higher IRR (18.4%)
than CHP. However these values for the internal rate of return are lower than those for all
DIBANET scenarios, excluding the “Biofuels” scenario, when sugarcane bagasse is
processed, as seen in Table 28.
Murat Sen et al. (8) presented a techno economic evaluation for an integrated biofuel
production process involving: (1), The conversion of cellulose to levulinic acid and formic
acid (FA); (2), The conversion of this LvA + FA solution to gamma-valerolactone (GVL); (3),
The separation of GVL from the sulphuric acid solution using liquid-liquid extraction with
butyl acetate; (4), The catalytic decarboxylation of GVL to butene and CO2, followed by; (5),
The oligomerisation of butene to higher molecular weight alkanes (C8 to C20). However, the
minimum selling price calculated for this mix of alkenes ($4.31 per US gallon of gasoline
equivalent, or $1.14 per litre) was prohibitively high, and significantly less than the price used
for ethyl levulinate in the DIABNET scenarios (79c per litre). Also, these calculations were
derived from LvA production experiments that took place using cellulose and not
lignocellulosic biomass.
Piccolo and Bezzo (9) determined the commercial viability of two biorefining technologies.
One of these processes involved enzymatic hydrolysis of the biomass followed by the
fermentation of the liberated sugars to ethanol. The other process involved the gasification of
the biomass and the subsequent fermentation of the syngas to ethanol. Under the assumption
that 700,000 dry tonnes of biomass were processed each year, and using a discount rate of
10% and a facility lifespan of 10 years, an IRR of 11.0% was obtained for the enzymatic
hydrolysis route, and an IRR of 10.4% for the gasification route. In contrast, the DIBANET
“Pretreatment”, “Combined”, and “Biorefining” scenarios provide IRRs of 46.14%, 28.65%,
and 38.36%, respectively, when using the same discount rate, facility lifespan, and facility
size.
Zhang et al. (10) evaluated the economic feasibility for the production of bio-oil via the fast
pyrolysis of biomass and the subsequent upgrading of this bio-oil to chemicals and/or
biofuels. For a facility processing 700,000 tonnes of biomass per year the optimum IRR of
13.3% was obtained by employing a two-stage bio-oil upgrading process consisting of
hydrotreating followed by fluid catalytic cracking with the hydrogen being provided from
natural gas. Such a facility would cost $242m. The IRR value for this process is significantly
poorer than the values the DIBANET “Pretreatment”, “Combined”, and “Biorefining”
scenarios provide using a smaller facility size (see Table 28).
81
7 Conclusion
The DIBANET proposal was focused on developing sustainable and profitable means for
obtaining biofuels and platform chemicals from lignocellulosic biomass. It considered that
acid hydrolysis was an effective tool for this since it would allow for a wide variety of
different feedstocks to be processed. It would also allow for the process conditions to be
engineered so that levulinic acid could be produced in high yields from cellulose/hexoses
(with formic acid as a co-product) and furfural could be produced in high yields from
hemicellulose/pentoses. These main products are of a higher value than ethanol and could also
be used to synthesise biofuels. The Biofine process, which also targets these chemicals, was
considered to be the state of the art at that time. A project proposal was formulated that
attempted to fine-tweak the performance of a Biofine-like process for improved financial and
environmental returns. At the time one of the main strategies for achieving this was to use the
acid hydrolysis residues (the dominant output of the Biofine process) in fast pyrolysis
schemes for the production of bio-oils that could potentially be upgraded to biofuels. It was
considered that a model would need to be developed to optimise the link between the
hydrolysis and pyrolysis stages to allow for the integrated process to be financially attractive.
This final deliverable for DIBANET is being written after 45 months of intense and
productive research. It has turned out that the rewarding outputs of the project, and the
important areas that should be focused on, are significantly different from those expected
when writing the proposal. Firstly, UL researchers have developed robust kinetic models for
the acid degradation of biomass. These show the critical failings in the Biofine process that
have meant it has never been successfully commercially deployed despite being developed as
far back as 1988. Its process yields are too low and its energy demands are too high.
Principally this is down to the recalcitrant nature of lignocellulosic biomass and the
significantly different behaviours of the three main polymers (cellulose, hemicellulose, and
lignin) when exposed to acid hydrolysis conditions. The Biofine process attempts a “sledge-
hammer” approach to this problem by using high temperatures and pressures, with the
production of levulinic acid as a target. This does allow for some levulinic acid production,
but at low yields, whilst the lignin and hemicellulose fractions suffer in these conditions.
The DIBANET proposal considered that an improved pre-treatment method might be
important and suggested the use of ionic liquids. Theoretically these could be of use since
they allow for fractionation of the lignocellulosic polymers. However ionic liquids were
quickly rejected as the project got underway due to poor efficiencies and high costs. In
hindsight this was the most important decision in the project since the alternative (now-
patented) pre-treatment method that was subsequently developed has huge benefits. Indeed, it
is the main reason for the highly attractive financial returns, energy balances, and positive
environmental performance indicators that are presented in this Deliverable. In all cases these
are vastly superior to Biofine.
The pre-treatment allows the fractionation of cellulose from the lignin and hemicellulose. It
can then be processed independently at conditions that are optimal for high levulinic acid
yields whilst the same can be done for the hemicellulose, allowing for significantly increased
furfural yields. Furthermore, the lignin is separated but kept intact (unlike in the Biofine
process) and is of an organosolv-type quality and of high value.
82
By increasing the yields of high-value chemicals from hexoses and pentoses and by obtaining
lignin as a separate saleable product, DIBANET vastly reduces the amount of low-value acid
hydrolysis residues (AHRs) that are produced. The models show that one tonne of Miscanthus
will produce 151 kg of AHRs when put through the DIBANET process, compared with 517
kg when put through the Biofine process.
Fast pyrolysis experiments that used AHRs gave poor quality bio-oils at low yields, primarily
due to the low hydrogen contents of these materials. On advice from an independent reviewer
this option for the DIBANET process chain was dropped midway through the project.
Gasification and slow-pyrolysis (for biochar production) were investigated as alternative
thermochemical means for processing these AHRs. The results from gasification again
suffered from the low hydrogen content of the feedstock, meaning that very large quantities of
steam would be needed to produce a suitable syngas for upgrading. The biochar that was
produced was of a reasonable quality but its estimated value was relatively low.
In any case, the focus of the project had shifted substantially as a result of the significantly
lower AHR yields that were achieved. It was a condition of DIBANET that all process needs
would need to be met from either the residues of the process or from alternative renewable
energy sources. Under a Biofine-type level of production of AHRs it was expected that these
would be surplus to process heat requirements, so allowing for the production of bio-
oil/biochar/syngas from a significant proportion. In reality it was found that the process
energy needs of Biofine were so high that even AHRs equivalent to approximately 50% of the
mass of the original biomass would not be sufficient. Indeed, the model suggests that an
additional 572 kg of biomass would need to be combusted, per tonne of biomass used in the
Biofine process, to satisfy the energy requirements of that technology.
While the energy needs for DIBANET are significantly less than for Biofine, the AHR levels
are so low that extra biomass is also required. In such a situation it is important that as much
of the process energy requirements as possible are provided from the AHRs, so minimising
the need for extra biomass. The most efficient way of providing the low pressure steam and
modest temperatures required in the DIBANET pretreatment/hydrolysis processes is through
the direct combustion of AHRs/biomass. Gasification would not be able to provide as much
process energy, per tonne of feedstock, as direct combustion. The only scenario in which
gasification/pyrolysis could be favoured for the use of AHRs would be one whereupon the
products from these thermochemical processes are of greater value than the cost of the extra
biomass that would be needed as substitute-fuel for the hydrolysis process. This has not been
demonstrated. Indeed, there have been no indications that the performances of AHRs in these
processes would be superior to those of the virgin biomass, with much evidence to the
contrary. The separate gasification or pyrolysis of virgin biomass is not of relevance to this
modelling Deliverable or to the DIBANET project since the hydrolysis stage is the core
concept and all other areas need to relate to that for a truly integrated process to be developed.
Therefore, the targets for the modelling of the DIBANET process chain shifted substantially
from those considered at the proposal stage. Instead of concentrating on how to utilise the
AHRs the focus shifted to considering what would be the most profitable outputs of the
pretreatment and hydrolysis processes and how these products should be utilised. For
example: (i) should the lignin be sold on the market or used to make up the energy shortfall;
(ii) is it more profitable to sell levulinic acid as a platform chemical or to esterify it with
ethanol to produce, and then sell, ethyl-levulinate; and (iii) can the pretreatment process be
economical without the following cellulose-hydrolysis stage.
83
This Deliverable has summarised the extensive modelling that took place to answer these, and
other, questions. This was necessary at the fundamental process level (using Aspen Plus) as
well as on the financial level (using Microsoft-Excel financial accounting methods). The latter
would not have any kind of serious validity without the former.
The results of the modelling show that the DIBANET process can be very profitable with
highly attractive values for the IRR/ROI/NPV for most process scenarios. These values are far
in excess of those possible from the Biofine process, which does not represent a viable
technology for commercial investment.
The DIBANET process can be separated into three distinct stages; (1) pre-treatment; (2)
hydrolysis of cellulose for levulinic acid development; and (3) esterification of levulinic acid
for ethyl-levulinate production. It has been demonstrated that the pre-treatment process can be
a financially viable technology in its own right, particularly when feedstocks with high
pentose contents (e.g. bagasse) are used. Combining stages (1) and (2) increases capital costs
but also increases the annual profits and the NPV. Combining all three stages can also be
financially rewarding providing that the value of the furfural and lignin co-products are fully
exploited. The modelling has shown that the internal energy balance of the process is
improved by combusting part of the lignin to make up the energy short-fall that results from
the low amounts of AHRs that are produced. However, the modelling has also shown that it is
economically far superior to sell this lignin and to purchase additional biomass to fuel the
process instead (even with feedstocks, such as Miscanthus, that have higher costs).
The attractive financials of the DIBANET processes also mean that these can potentially be
operated profitably at lower scales of operation than would be possible for many other
lignocellulose-processing technologies. Indeed, there are possible scenarios in which a
demonstration-scale plant could pay back the investment cost and provide a healthy NPV in
addition to proving the process on an enhanced scale.
The DIBANET processes also perform well when considered according to other, non-
financial, parameters. For example, DIBANET process outputs can substitute for large
quantities of fossil-fuel derived transport fuels and chemicals, so helping to reduce
anthropogenic carbon dioxide emissions. The processes are also highly energy efficient,
providing attractive energy balances that are far superior to the Biofine process.
In conclusion, the focus of the DIBANET project has changed significantly during its course
but the end result has been the development of a core IP that has real potential for commercial
deployment. This IP can also occupy an important niche in the biorefining sector in that it
allows for the low-cost production of levulinic acid, something that has been long-anticipated
but not fulfilled to date.
84
8 References
1. Mani S, Sokhansanj S, Tagore S, Turhollow AF. Techno-economic analysis of using
corn stover to supply heat and power to a corn ethanol plant – Part 2: Cost of heat and power
generation systems. Biomass Bioenergy. 2010 3//;34(3):356-64.
2. Aden A, Ruth M, Ibsen K, Jechura J, Neeves K, Sheehan J, et al. Lignocellulosic
Biomass to Ethanol Process Design and Economics Utilizing Co-Current Dilute Acid
Prehydrolysis and Enzymatic Hydrolysis for Corn Stover - Technical Report NREL/TP-510-
32438. Golden, Colorado: National Renewable Energy Laboratory; 2002.
3. Lynd LR, Elander RT, Wyman CE. Likely features and costs of mature biomass
ethanol technology. Appl Biochem Biotechnol. 1996;57/58:741-61.
4. Felten D, Fröba N, Fries J, Emmerling C. Energy balances and greenhouse gas-
mitigation potentials of bioenergy cropping systems (Miscanthus, rapeseed, and maize) based
on farming conditions in Western Germany. Renewable Energy. 2013 7//;55(0):160-74.
5. Styles D, Jones MB. Energy crops in Ireland: Quantifying the potential life-cycle
greenhouse gas reductions of energy-crop electricity. Biomass Bioenergy. 2007.
6. Gonzalez R, Daystar J, Jett M, Treasure T, Jameel H, Venditti R, et al. Economics of
cellulosic ethanol production in a thermochemical pathway for softwood, hardwood, corn
stover and switchgrass. Fuel Process Technol. 2012;94(1):113-22.
7. Dias MOS, Cunha MP, Jesus CDF, Rocha GJM, Pradella JGC, Rossell CEV, et al.
Second generation ethanol in Brazil: Can it compete with electricity production? Bioresour
Technol. 2011 10//;102(19):8964-71.
8. Murat Sen S, Henao CA, Braden DJ, Dumesic JA, Maravelias CT. Catalytic
conversion of lignocellulosic biomass to fuels: Process development and technoeconomic
evaluation. Chem Eng Sci. 2012;67(1):57-67.
9. Piccolo C, Bezzo F. A techno-economic comparison between two technologies for
bioethanol production from lignocellulose. Biomass Bioenergy. 2009 3//;33(3):478-91.
10. Zhang Y, Brown TR, Hu G, Brown RC. Techno-economic analysis of two bio-oil
upgrading pathways. Chem Eng J. 2013 (0).