Embed Size (px)
Citation preview
Annexure- 2
REPORT ON HYDROGEOLOGICAL STUDY
GHUTKU COAL WASHERY, (2.5 MPTA)
Village Ghutku, Tehsil Takhatpur, Dist Bilaspur, Chhattisgarh
PROJECT PROPONENT
M/S. PARAS POWER & COAL BENEFICATION LIMITED Lakhmi Tower, Vayapar Vihar, Bilaspur - 495001
FOR
GROUND WATER CLEARANCE
FROM
CENTRAL GROUND WATER AUTHORITY
PREPARED BY
MINJAL D-3 Sharda Sah-Niwas, 85 Hill Road,
Ram Nagar, Nagpur 440033. E-id : [email protected]
Mo No. 09423104901
JULY 2016
Report on Hydrogeological Study of Ghutku Coal Washery M/s Paras Power & Coal Benification Ltd.
i Minjal, Nagpur
INDEX
Ch. No.
Content Page No.
1.0 INDRODUCTION 1- 8
1.1 Location And Communication 2
1.2 Present Environmental Scenario 5
2 GEOLOGY 9- 12
2.1 Regional Geology 9
2.2 Buffer zone 10
2.3 Core zone 11
2.4 Fence diagram 11
3 HYDROLOGY 13 - 15
3.1 General 13
3.2 Hydrological Impact Assessment: 13
4 HYDROGEOLOGY 16-23
4.1 Regional Hydrogeological Setting 16
4.2 Aquifer Parameters 16
4.3 Local Hydrogeological Settings 17
4.4 Hydrogeological Regime 17
4.5 Water Table and Movement of Groundwater : 20
4.6 Groundwater Potential 22
4.7 Water Level Trend 22
5 GROUND WATER RESOURCE 24-31
5.1 General 24
5.2 Groundwater Recharge 25
5.3 Groundwater draft 26
5.4 Groundwater balance 27
5.5 Stage of development 30
6 WATER QUALITY 32-34
7 POSSIBLE IMPACT OF PUMPING ON WATER REGIME 35-36
7.1 Impact on Land Surface 35
7.2 Impact on surface runoff 35
7.3 Impact on groundwater 35
7.4 Artificial Recharge 36
8 CONCLUSION 37-38
Report on Hydrogeological Study of Ghutku Coal Washery (2.5 MTPA) M/s Paras Power & Coal Benification Ltd.
ii Minjal, Nagpur
TABLE
Table
No.
Content Page
No.
1.1 The Monthwise Normal Rainfall Data 7
1.2 Distribution of Normal Rainfall 7
2.1 Strapigraphic Succession, Mand Bilaspur Coalfield. 9
3.1 Rainfall – Surface Flow Relations (annual) 13
3.2 Rainfall – Infiltration Relation (annual) 14
4.1 Aquifer parameter of Buffer zone 16
4.1A Aquifer parameter of Core zone 16
4.2 Hydrogeological units (aquifer disposition) 17
4.3 Water Level Data of 10 km Buffer Zone of Ghutku Coal Washery in (m) 18
4.4 Water level in core and buffer zone 19
4.5 Details the old Borewell constructed in plant area by ex owner 22
4.6 Water Level Monitoring Data (WL in m bgl)- CGWB Sikri H.S. 23
5.1 The norms used for resource evaluation as per CGWB 24
5.2 Recharge area 24
5.3 Groundwater Recharge-Monsoon-Non command area 25
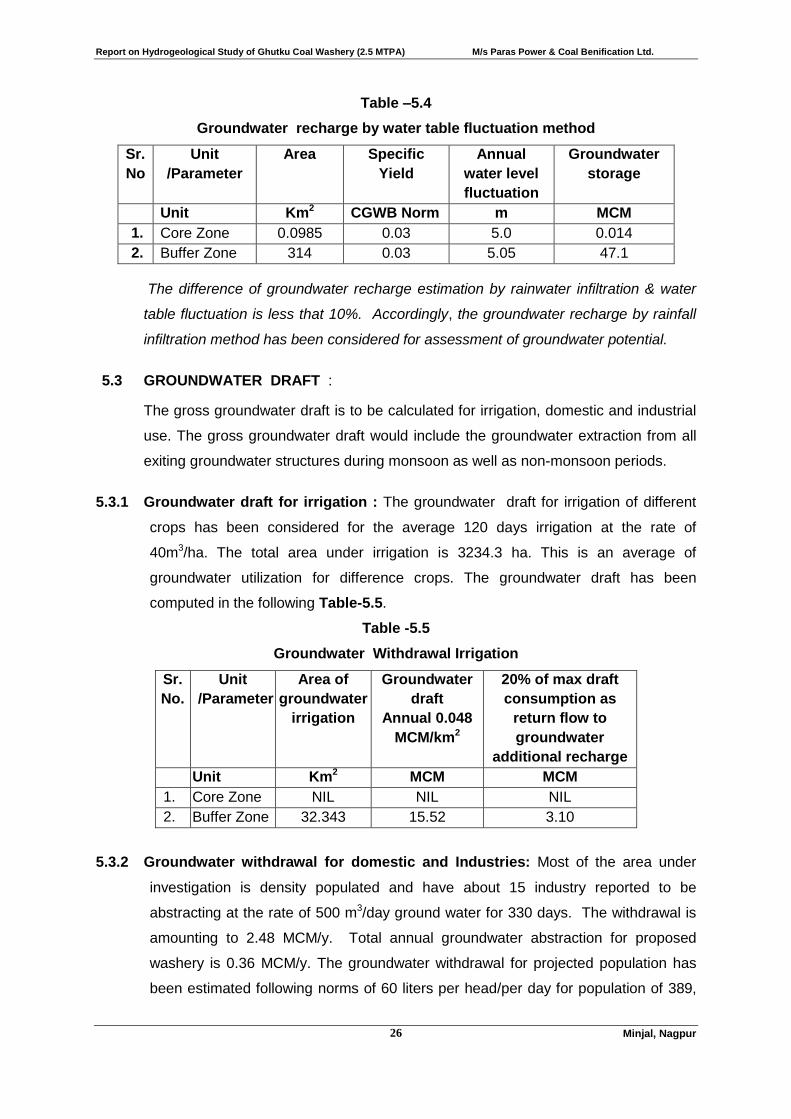
5.4 Groundwater recharge by water table fluctuation method 26
5.5 Groundwater Withdrawal Irrigation 26
5.6 Groundwater withdrawal for domestic and Industries 27
5.7 Total annual groundwater draft 27
5.8 Summary Report In Respect of Each Groundwater Assessment Unit 27
5.9 Groundwater Balance 29
5.10 Existing stage of groundwater development 30
6.1 Ground Water Quality Sampling Stations 32
6.1A Ground Water Quality Sampling Stations 33
7.1 Artificial Recharge proposal 36
Report on Hydrogeological Study of Ghutku Coal Washery (2.5 MTPA) M/s Paras Power & Coal Benification Ltd.
iii Minjal, Nagpur
FIGURE
Figure
No.
Content Page
No.
1.1 Location Map of Ghutku Coal Washery 1
1.2 Layout Plan for Ghutku Coal Washery (0.96 MTPA) 3
1.3 Location Map of Buffer zone 4
1.4 Topography of Buffer zone 5
1.5 Drainage Map of Buffer zone 6
1.6 Normal Rainfall of Bilaspur IMD Station 7
1.7 Distribution of Normal Rainfall 7
2.1 Geology of Buffer zone 10
2.2 Fence Diagram of Chhattisgarh Basin 12
3.1 Rainfall – Surface Flow Relations (annual) 13
3.2 Rainfall – Infiltration Relation (annual) 14
4.1 Depth to Water Level Map of Buffer zone 19
4.2 Water Table Map of Buffer zone 21
4.3 Long Term Water Level Hydrograph 23
5.1 Ground water Balance 30
5.2 Existing stage of groundwater development 30
Report on Hydrogeological Study of Ghutku Coal Washery (2.5 MTPA) M/s Paras Power & Coal Benification Ltd.
Minjal, Nagpur
1
REPORT ON HYDROGEOLOGICAL STUDY OF
GHUTKU COAL WASHERY
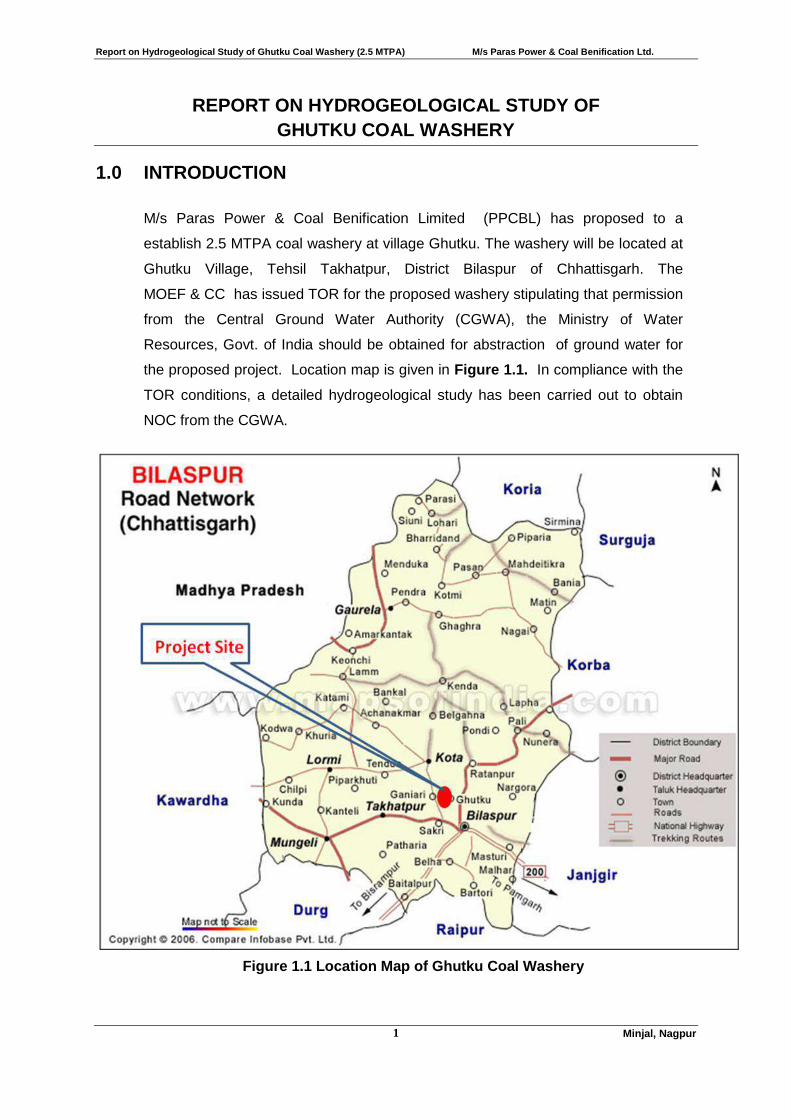
1.0 INTRODUCTION
M/s Paras Power & Coal Benification Limited (PPCBL) has proposed to a
establish 2.5 MTPA coal washery at village Ghutku. The washery will be located at
Ghutku Village, Tehsil Takhatpur, District Bilaspur of Chhattisgarh. The
MOEF & CC has issued TOR for the proposed washery stipulating that permission
from the Central Ground Water Authority (CGWA), the Ministry of Water
Resources, Govt. of India should be obtained for abstraction of ground water for
the proposed project. Location map is given in Figure 1.1. In compliance with the
TOR conditions, a detailed hydrogeological study has been carried out to obtain
NOC from the CGWA.
Figure 1.1 Location Map of Ghutku Coal Washery
Report on Hydrogeological Study of Ghutku Coal Washery (2.5 MTPA) M/s Paras Power & Coal Benification Ltd.
Minjal, Nagpur
2
Scope of Work
M/s PPCBL has retained the services of M/s Minjal, Nagpur to carry out a detailed
hydrogeological study for obtaining NOC from the Central Ground Water Authority
for abstraction and environmental clearance from MOEF (CG.). Assignment
covers the following :
1) The study will be carried out as per TOR granted by MOEF following the
guidelines and procedures acceptable to the concerned statutory authorities
and obtain approval from the Central Ground Water Authority, New Delhi and
MOEF.
2) CGWA application in the prescribed form will be prepared and submitted for
obtaining NOC.
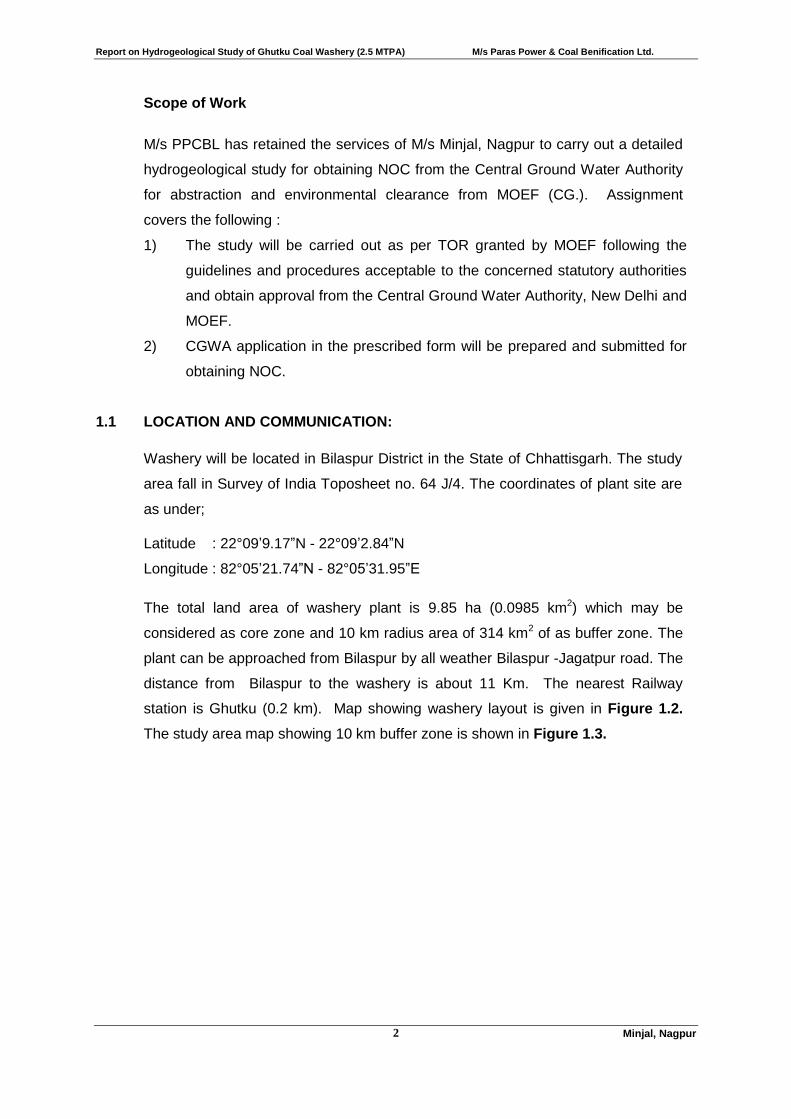
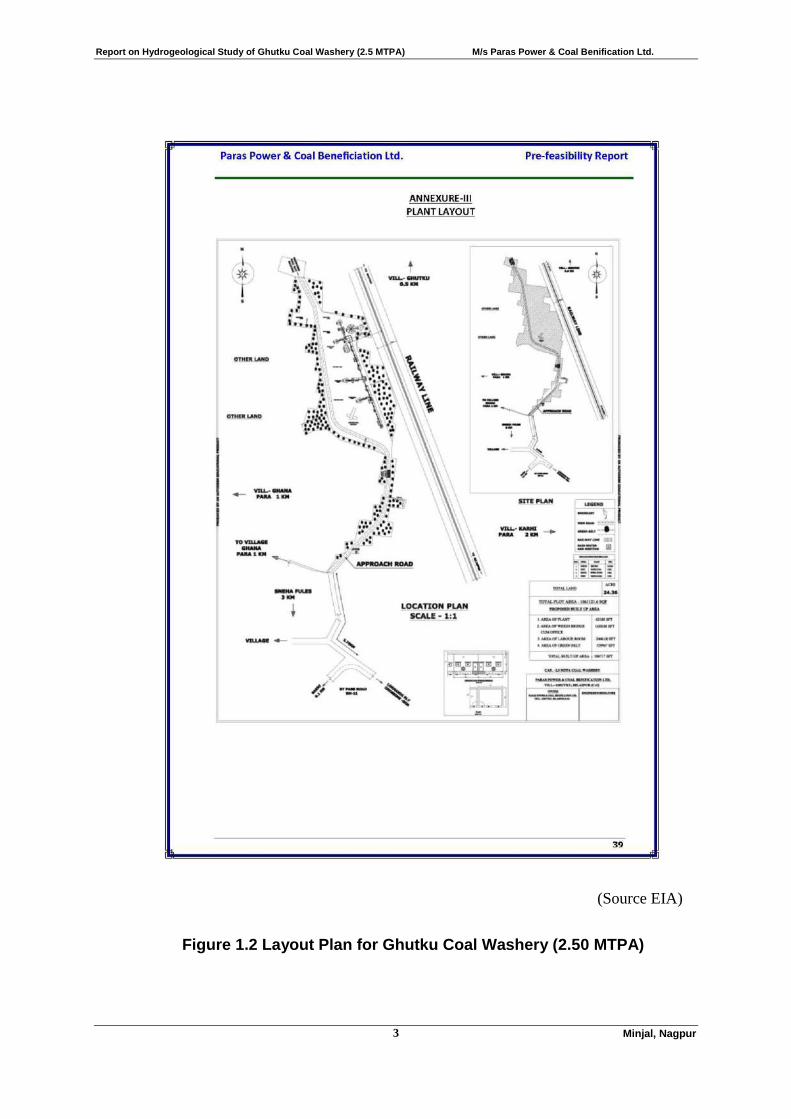
1.1 LOCATION AND COMMUNICATION:
Washery will be located in Bilaspur District in the State of Chhattisgarh. The study
area fall in Survey of India Toposheet no. 64 J/4. The coordinates of plant site are
as under;
Latitude : 22°09’9.17”N - 22°09’2.84”N
Longitude : 82°05’21.74”N - 82°05’31.95”E
The total land area of washery plant is 9.85 ha (0.0985 km2) which may be
considered as core zone and 10 km radius area of 314 km2 of as buffer zone. The
plant can be approached from Bilaspur by all weather Bilaspur -Jagatpur road. The
distance from Bilaspur to the washery is about 11 Km. The nearest Railway
station is Ghutku (0.2 km). Map showing washery layout is given in Figure 1.2.
The study area map showing 10 km buffer zone is shown in Figure 1.3.
Report on Hydrogeological Study of Ghutku Coal Washery (2.5 MTPA) M/s Paras Power & Coal Benification Ltd.
Minjal, Nagpur
3
(Source EIA)
Figure 1.2 Layout Plan for Ghutku Coal Washery (2.50 MTPA)
Report on Hydrogeological Study of Ghutku Coal Washery (2.5 MTPA) M/s Paras Power & Coal Benification Ltd.
Minjal, Nagpur
4
STREAMS
RIVER / NALA
POND
ROAD
HABITATION
GRID
INDEX
WASHERIES BOUNDARY
280
280
280
280
280
280
280
275
283
267
255
269
269
269
270
276
283 279
289
272
276
283
284
276
267
264
278
278
278
275
279
277
285
281
285
285
279
295
295290
287
285
290284
286
292
291
288Beltukri
Ghanghadih
Chorbhatti Kalan
BhataparaChakrakund Nawapara
Saktipara
Bhadam
NarotikapaNewara
Bhundri
Gokulpu
Bhauwakapa
Kalnutar
Nawapara
Lampara
Gauband
Khargahan
Lamer
Chanadongari
Fakirpara
Chorbhath KhurdPondi
Padipar
Bhilauni
BhilauniDevri
Devri
Khajri
Kathakoni
Bandhiyapara
Bharni
Devari
ParsadaJoki
Pendri
SambalpuriDabena
Binahyasar
Binduri
Kathakoni
Bahtarai Pand
Tiwaripara
Binduri
Saida
Mendra
Sakri
Hapha
UslapurMangla
Kududand
Ghurti
Dnldclhapara
Bairhapur
Sajunpara
Nuwapara
Chhuihapara
Nuwapara
Gondaya
LachhanpurPendorwa
Lophandi
NawagoanAmtara
Chumkua
Mahtarai
Nahribhata
Semartal
BarpaliKachhar
Ghutku
Nirta
SenduriJorupara
Ramtala
Ghana Karhipara
Turkadih
Turkadih
KoniLakhandi
Koni
Birkana
Sarkanda
Bandhwapara
Khamtarai
1
2
3
4
5
Ganiyari
6
7
9
8
10
11
12
13
14
15
16
17
18Gatori
19
Bharari
20
21
22
23
24
25
26
2728
29
30
31
32 33
34
35
N
22°5' 22°5'
22°10'
82°00' 82°5' 82°10'
82°00' 82°5' 82°10'
22°10'
GHUTKU 2.5MTPA COAL WASHERY
KEY MAP
PREPARED BY - MINJAL , NAGPUR
Arp
a N
adi
HYDROGRAPHIC - NET WORK STATION 31 00 1 2 3 4 5 6 7 8 Km.
Figure 1.3 Location Map of Buffer zone
Report on Hydrogeological Study of Ghutku Coal Washery (2.5 MTPA) M/s Paras Power & Coal Benification Ltd.
Minjal, Nagpur
5
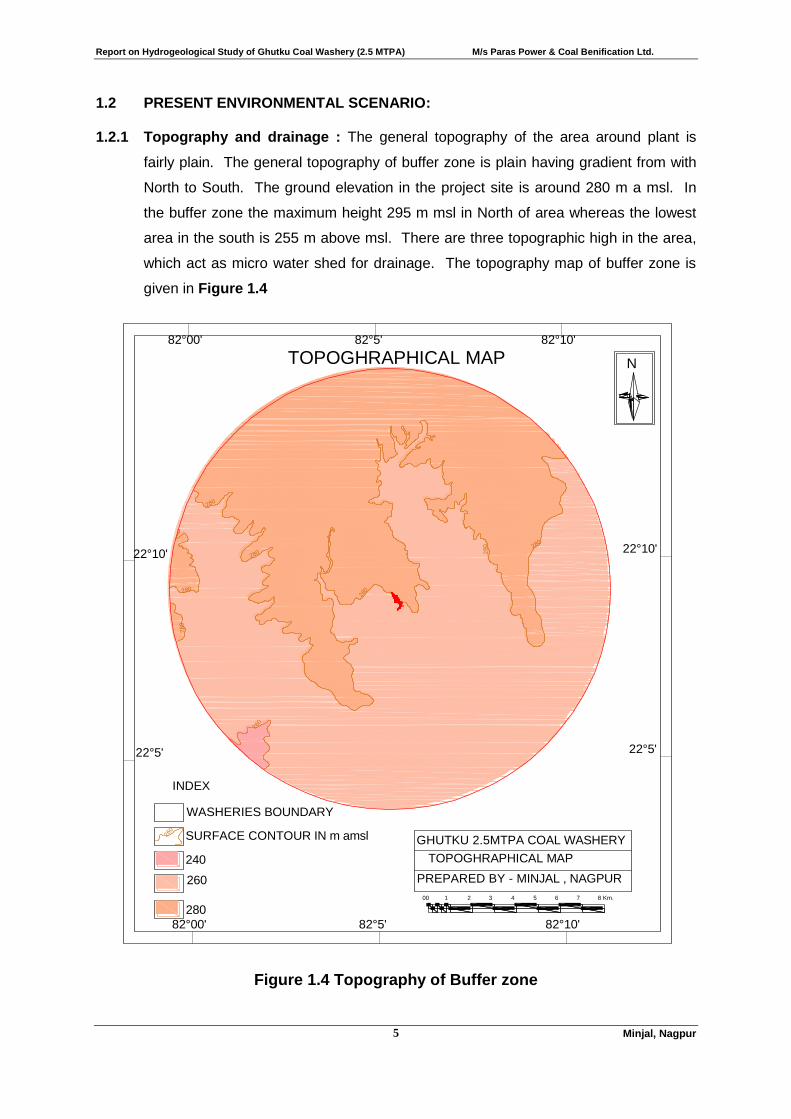
1.2 PRESENT ENVIRONMENTAL SCENARIO:
1.2.1 Topography and drainage : The general topography of the area around plant is
fairly plain. The general topography of buffer zone is plain having gradient from with
North to South. The ground elevation in the project site is around 280 m a msl. In
the buffer zone the maximum height 295 m msl in North of area whereas the lowest
area in the south is 255 m above msl. There are three topographic high in the area,
which act as micro water shed for drainage. The topography map of buffer zone is
given in Figure 1.4
280
280
280
280
280
280 280
N
22°5'
22°10'
22°5'
22°10'
82°00' 82°5' 82°10'
82°00' 82°5' 82°10'
260
260
240
280
INDEX
WASHERIES BOUNDARY
SURFACE CONTOUR IN m amsl260
GHUTKU 2.5MTPA COAL WASHERY
TOPOGHRAPHICAL MAP
PREPARED BY - MINJAL , NAGPUR
TOPOGHRAPHICAL MAP
00 1 2 3 4 5 6 7 8 Km.
Figure 1.4 Topography of Buffer zone
Report on Hydrogeological Study of Ghutku Coal Washery (2.5 MTPA) M/s Paras Power & Coal Benification Ltd.
Minjal, Nagpur
6
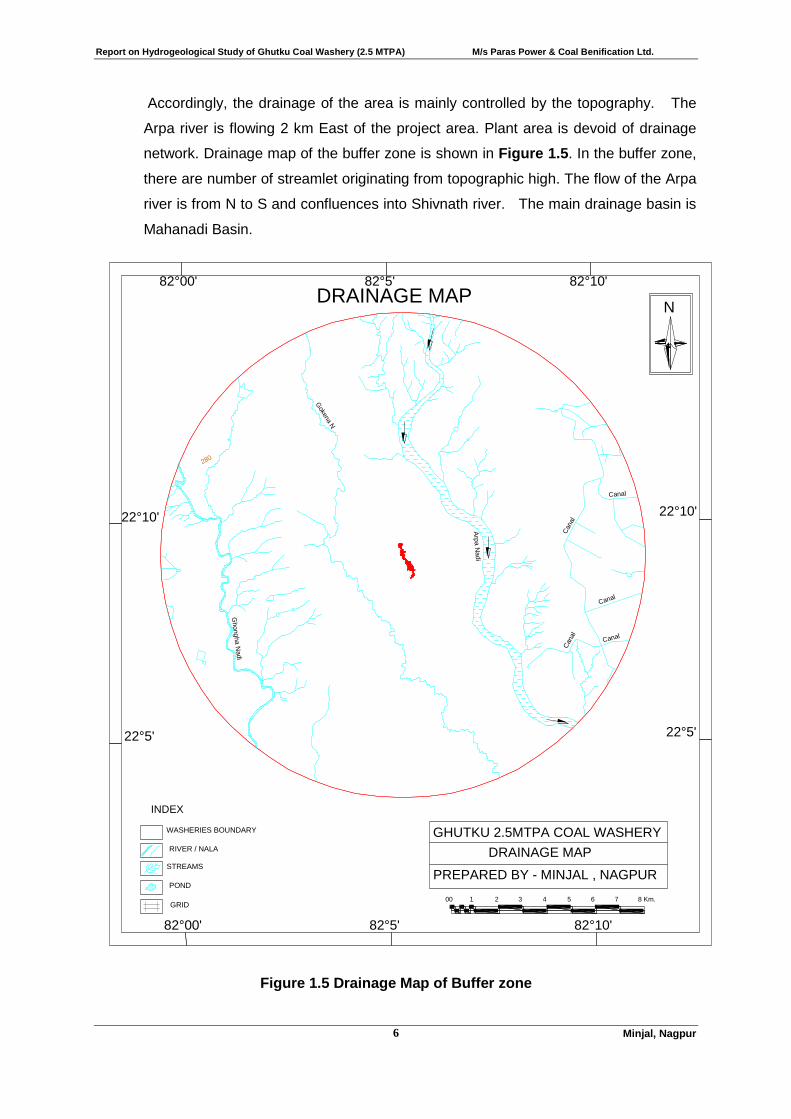
Accordingly, the drainage of the area is mainly controlled by the topography. The
Arpa river is flowing 2 km East of the project area. Plant area is devoid of drainage
network. Drainage map of the buffer zone is shown in Figure 1.5. In the buffer zone,
there are number of streamlet originating from topographic high. The flow of the Arpa
river is from N to S and confluences into Shivnath river. The main drainage basin is
Mahanadi Basin.
N
22°5' 22°5'
22°10'
82°00' 82°5' 82°10'
82°00' 82°5' 82°10'
22°10'
280
GHUTKU 2.5MTPA COAL WASHERY
DRAINAGE MAP
PREPARED BY - MINJAL , NAGPUR
DRAINAGE MAP
Goken
a N
Gho
ng
ha
Nadi
Canal
Canal
Canal
Canal
Canal
STREAMS
RIVER / NALA
INDEX
WASHERIES BOUNDARY
POND
GRID
Arp
a N
adi
00 1 2 3 4 5 6 7 8 Km.
Figure 1.5 Drainage Map of Buffer zone
Report on Hydrogeological Study of Ghutku Coal Washery (2.5 MTPA) M/s Paras Power & Coal Benification Ltd.
Minjal, Nagpur
7
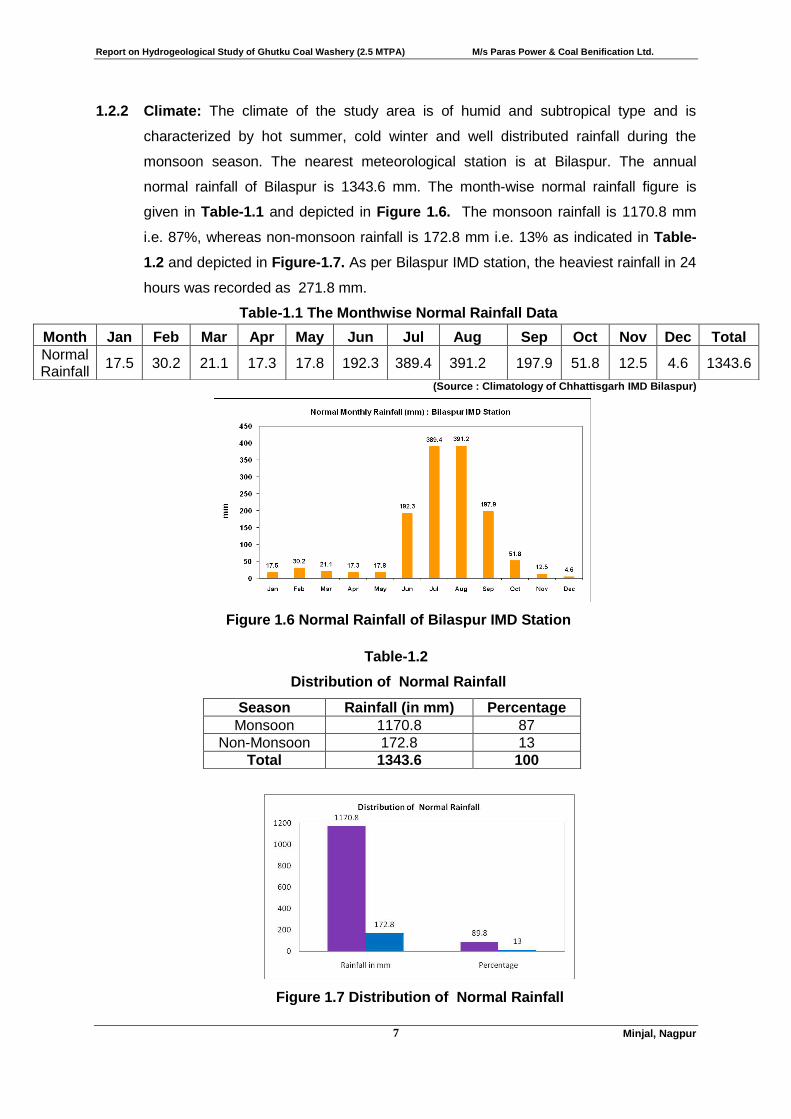
1.2.2 Climate: The climate of the study area is of humid and subtropical type and is
characterized by hot summer, cold winter and well distributed rainfall during the
monsoon season. The nearest meteorological station is at Bilaspur. The annual
normal rainfall of Bilaspur is 1343.6 mm. The month-wise normal rainfall figure is
given in Table-1.1 and depicted in Figure 1.6. The monsoon rainfall is 1170.8 mm
i.e. 87%, whereas non-monsoon rainfall is 172.8 mm i.e. 13% as indicated in Table-
1.2 and depicted in Figure-1.7. As per Bilaspur IMD station, the heaviest rainfall in 24
hours was recorded as 271.8 mm.
Table-1.1 The Monthwise Normal Rainfall Data
(Source : Climatology of Chhattisgarh IMD Bilaspur)
Figure 1.6 Normal Rainfall of Bilaspur IMD Station
Table-1.2
Distribution of Normal Rainfall
Season Rainfall (in mm) Percentage
Monsoon 1170.8 87
Non-Monsoon 172.8 13
Total 1343.6 100
Figure 1.7 Distribution of Normal Rainfall
Month Jan Feb Mar Apr May Jun Jul Aug Sep Oct Nov Dec Total
Normal Rainfall
17.5 30.2 21.1 17.3 17.8 192.3 389.4 391.2 197.9 51.8 12.5 4.6 1343.6
Report on Hydrogeological Study of Ghutku Coal Washery (2.5 MTPA) M/s Paras Power & Coal Benification Ltd.
Minjal, Nagpur
8
1.2.3 Socio-economics : Total population of the buffer zone for rural area is 122979
persons in 70 villages. Part of Bilaspur town come under buffer zone. 10 % of total
population of Bilaspur is 266362. Thus the total population in buffer zone comes to
389341. The total irrigation by groundwater is in3234.3 Ha. of land of buffer zone
whereas there is no irrigation in core zone area.
1.2.4 Plant Technology :
The washery will have 2.5 MTPA capacity based on wet separation process
comprising crushing, screening, washing and handling.
The heavy media cyclone is an extremely efficient coal cleaning technology. ROM
coal is subjected to two stage closed circuit crushing & screening to obtain (-) 50
mm size fraction.
Feed coal is processed in two heavy media cyclones in series. Magnetite and water
are used as the “media”. The media density primarily determines separating gravity.
A gravimetric separation takes place. Buoyancy affect of the media forces the
lighter coal solids to the center of the cyclone where they are transported upward.
The dense mineral matter spirals toward the apex and exits through orifice. Clean
coal is produced from the first cyclone. Middling and reject are produced from the
second cyclone.
Magnetite carried away by the coal particles is recovered by water spraying &
reused.
Entire process wastewater is recycled in the washing circuit as such no effluent
discharge is envisaged.
Report on Hydrogeological Study of Ghutku Coal Washery (2.5 MTPA) M/s Paras Power & Coal Benification Ltd.
Minjal, Nagpur
9
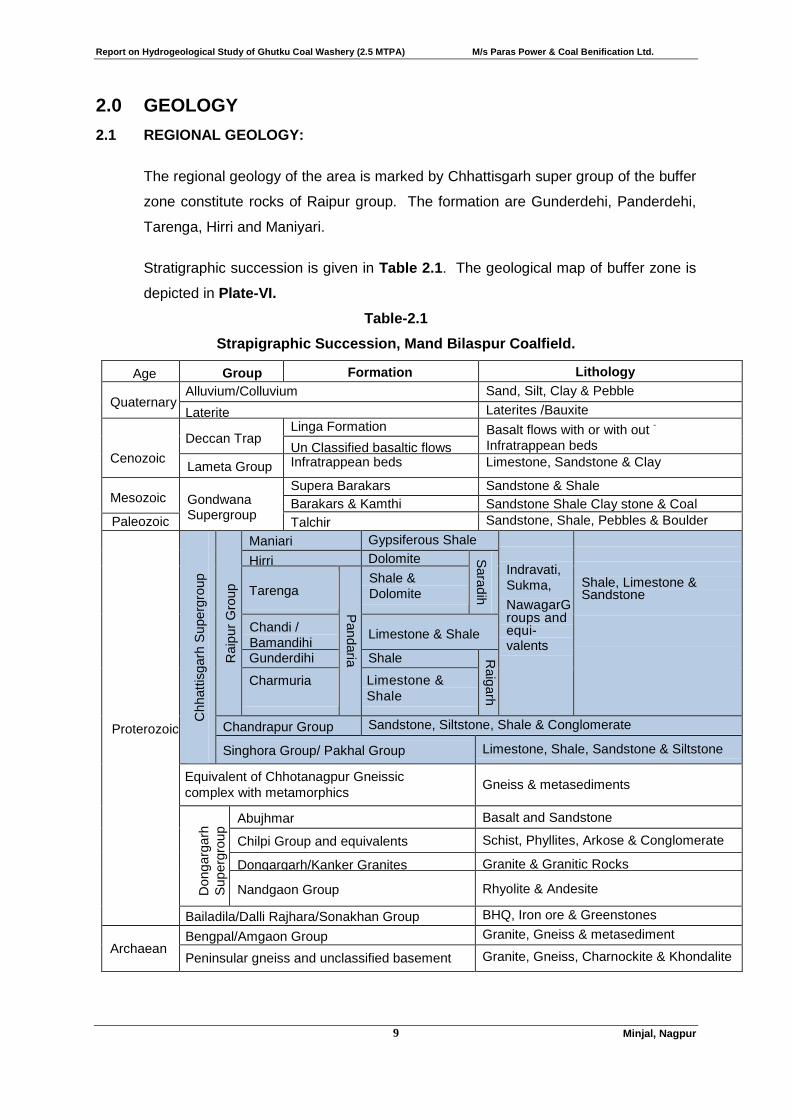
2.0 GEOLOGY
2.1 REGIONAL GEOLOGY:
The regional geology of the area is marked by Chhattisgarh super group of the buffer
zone constitute rocks of Raipur group. The formation are Gunderdehi, Panderdehi,
Tarenga, Hirri and Maniyari.
Stratigraphic succession is given in Table 2.1. The geological map of buffer zone is
depicted in Plate-VI.
Table-2.1
Strapigraphic Succession, Mand Bilaspur Coalfield.
Age Group Formation Lithology
Quaternary Alluvium/Colluvium Sand, Silt, Clay & Pebble
Laterite Laterites /Bauxite
Cenozoic
Deccan Trap Linga Formation Basalt flows with or with out
-
Infratrappean beds Un Classified basaltic flows
Lameta Group Infratrappean beds Limestone, Sandstone & Clay
Mesozoic Gondwana Supergroup
Supera Barakars Sandstone & Shale
Barakars & Kamthi Sandstone Shale Clay stone & Coal
Talchir Sandstone, Shale, Pebbles & Boulder Paleozoic
Proterozoic
Chhatt
isgarh
Superg
roup
Raip
ur
Gro
up
Maniari Gypsiferous Shale Indravati,
Sukma,
NawagarGroups and equi- valents
Shale, Limestone & Sandstone
Hirri Dolomite
S
ara
dih
adih
Tarenga
Pan
daria
Shale &
Dolomite
Chandi /
Bamandihi Limestone & Shale
Gunderdihi Shale Raig
arh
Charmuria Limestone &
Shale
Chandrapur Group Sandstone, Siltstone, Shale & Conglomerate
Singhora Group/ Pakhal Group Limestone, Shale, Sandstone & Siltstone
Equivalent of Chhotanagpur Gneissic
complex with metamorphics Gneiss & metasediments
Dong
arg
arh
Sup
erg
rou
p Abujhmar Basalt and Sandstone
Chilpi Group and equivalents Schist, Phyllites, Arkose & Conglomerate
Dongargarh/Kanker Granites Granite & Granitic Rocks
Nandgaon Group Rhyolite & Andesite
Bailadila/Dalli Rajhara/Sonakhan Group BHQ, Iron ore & Greenstones
Archaean Bengpal/Amgaon Group Granite, Gneiss & metasediment
Peninsular gneiss and unclassified basement Granite, Gneiss, Charnockite & Khondalite
Report on Hydrogeological Study of Ghutku Coal Washery (2.5 MTPA) M/s Paras Power & Coal Benification Ltd.
Minjal, Nagpur
10
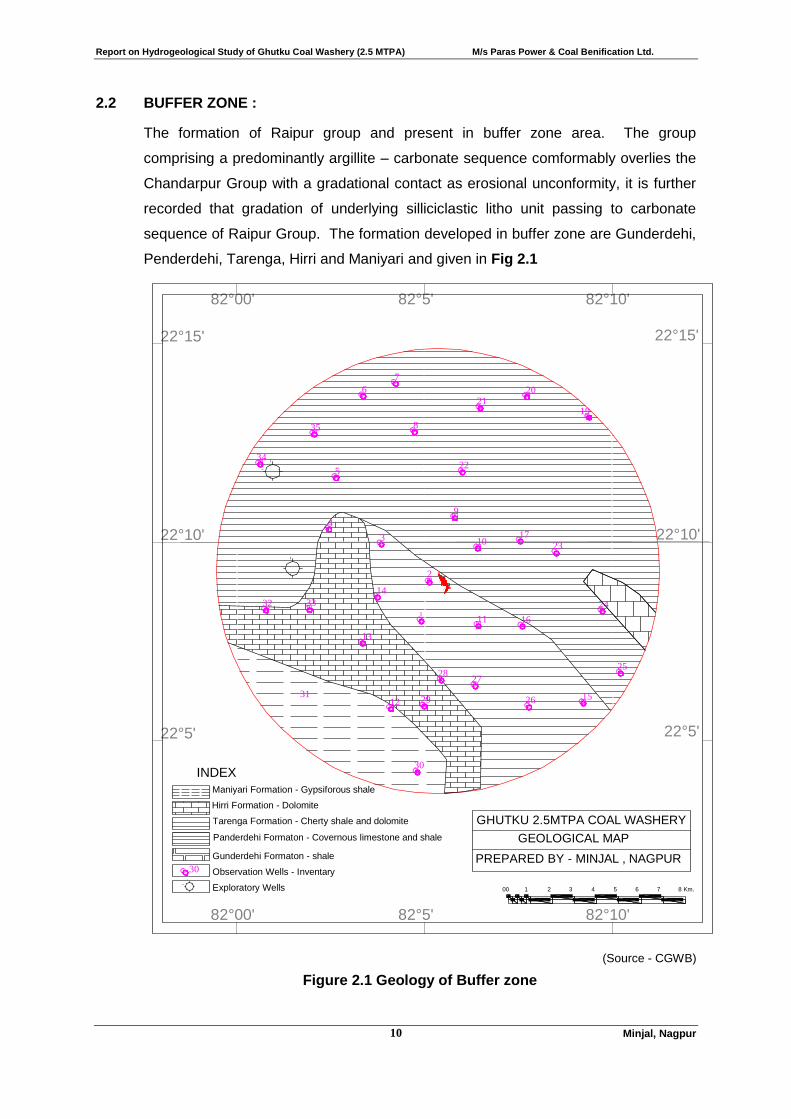
2.2 BUFFER ZONE :
The formation of Raipur group and present in buffer zone area. The group
comprising a predominantly argillite – carbonate sequence comformably overlies the
Chandarpur Group with a gradational contact as erosional unconformity, it is further
recorded that gradation of underlying silliciclastic litho unit passing to carbonate
sequence of Raipur Group. The formation developed in buffer zone are Gunderdehi,
Penderdehi, Tarenga, Hirri and Maniyari and given in Fig 2.1
Panderdehi Formaton - Covernous limestone and shale
Tarenga Formation - Cherty shale and dolomite
Hirri Formation - Dolomite
Maniyari Formation - Gypsiforous shale
Gunderdehi Formaton - shale
22°15'
22°10'
22°5' 22°5'
22°10'
22°15'
82°00' 82°5' 82°10'
82°00' 82°5' 82°10'
INDEX
1
2
3
4
5
6
7
9
8
10
11
12
13
14
15
16
17
19
2021
22
23
24
25
26
2728
29
30
31
32 33
34
35
Observation Wells - Inventary
Exploratory Wells
30
00 1 2 3 4 5 6 7 8 Km.
GHUTKU 2.5MTPA COAL WASHERY
GEOLOGICAL MAP
PREPARED BY - MINJAL , NAGPUR
(Source - CGWB)
Figure 2.1 Geology of Buffer zone
Report on Hydrogeological Study of Ghutku Coal Washery (2.5 MTPA) M/s Paras Power & Coal Benification Ltd.
Minjal, Nagpur
11
2.2.1 Gunderdehi Formation ; It is represented mainly by purple shale. The purple shale
is generally calcareous, highly friable in character and is associated with impersistent
limestone bands. Locally intra –formation conglomerate lense are present in the
upper part. Besides, lenses and pockets of stromatolitic limestone appearing
towards top, indicate a gradational contact with the overlying formation. It is reported
that at subsurface Gunderdehi purple shale grades to black shale also encountered
2.2.2 Penderdehi Formation : It is the most heterogeneous unit comprising dark gray,
fine-grained stromatolitic limestone and flaggy limestone associated with green
calcareous shale. Pockets and lenses of coarse crystalline dolomites are very
frequent. The flaggy limestone is composed of micritic calcite, clay and quartz. The
clay and fine clastics are alternately arranged, imparting a flaggy appearance to the
rock. The green shale is friable, splintery, calcareous and at places itself contains
columnar stromatolitic structure inclined to bedding plane.
2.2.3 Tarenga Formation : It consists of cherty shale, calcareous shale, brown-colored
bedded argillaceous dolomite and splintery violet shale. At places, intraformation flat
pebble conglomerate are present.
2.2.4 Hirri Formation : This is characterized by intraformation conglomerate, dolomite and
black shale contain gypsum as layers, parallel to bedding and as disseminated
grains/ crystals. Stromatolitic dolomite is exposed in Hirri and Kodwa mines. The
stromatolites are columnar having a wide inter columnar space. It represent the
closing phase of deposition in Chhattisgarh basin and consists of lower gypsiferous
gray siltstone and shale followed by reddish brown calcareous and non-calcareous
shale with limestone and dolomite. The major constitutes are quartz, clay and
carbonate. Cross –lamination and mud cracks are the common sedimentary
structures. Minor argillaceous limestone and oolitic limestone occur as lenses in
shale.
2.3 CORE ZONE :
The Geology of core zone is marked by Tarenga formation lithogically dominated by
cherty shale and dolomite rock.
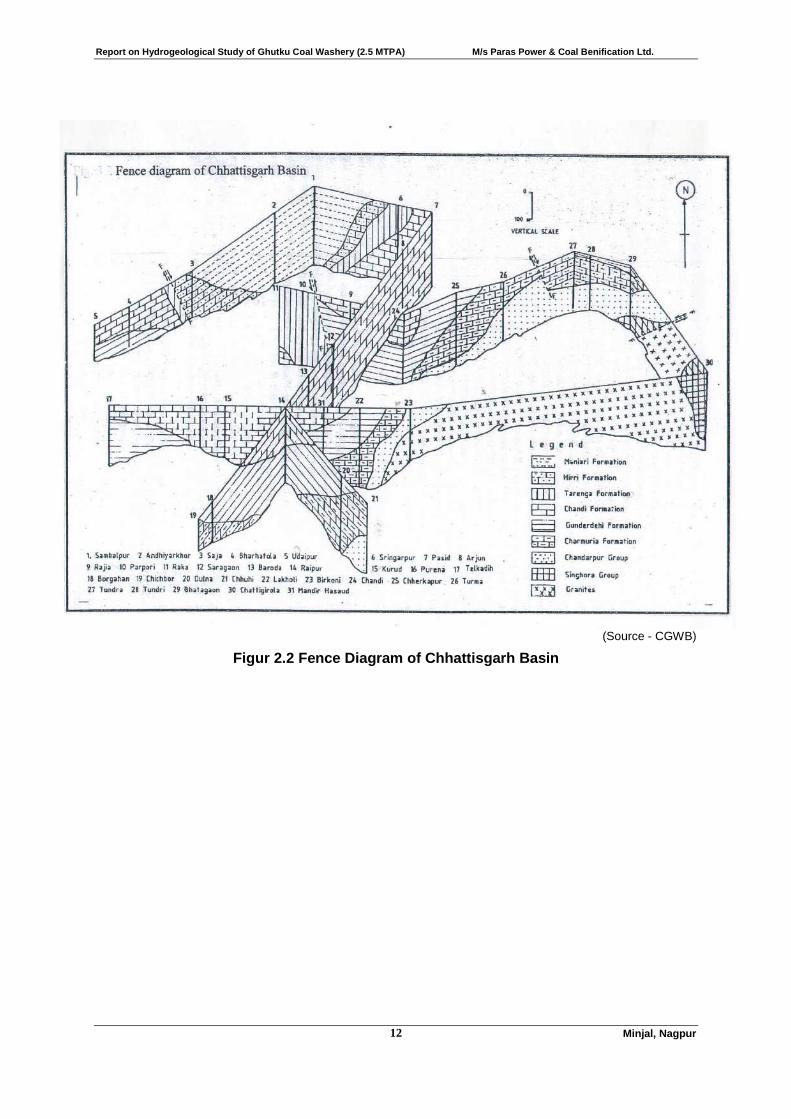
2.4 FENCE DIAGRAM ;
Central Ground Water Board have prepared fence diagram incorporating available
borehole of Chhattisgarh super group. The fence diagram exhibit the subsurface
feature of buffer zone is given in Figure. 2.2
Report on Hydrogeological Study of Ghutku Coal Washery (2.5 MTPA) M/s Paras Power & Coal Benification Ltd.
Minjal, Nagpur
12
(Source - CGWB)
Figur 2.2 Fence Diagram of Chhattisgarh Basin
Report on Hydrogeological Study of Ghutku Coal Washery (2.5 MTPA) M/s Paras Power & Coal Benification Ltd.
Minjal, Nagpur
13
3.0 HYDROLOGY 3.1 GENERAL ;
The hydrology of the area deals with the rainfall – runoff - infiltration relationship in
pre-pumping & post-pumping period for hydrological impact assessment due to
pumping from tube wells for washery
3.2 HYDROLOGICAL IMPACT ASSESSMENT:
Considering the analytical model applicable to the study area, a rainfall - surface
runoff - groundwater recharge relationship on unit area basis has been attempted to
analyze the hydrological impact in pre and post-pumping conditions.
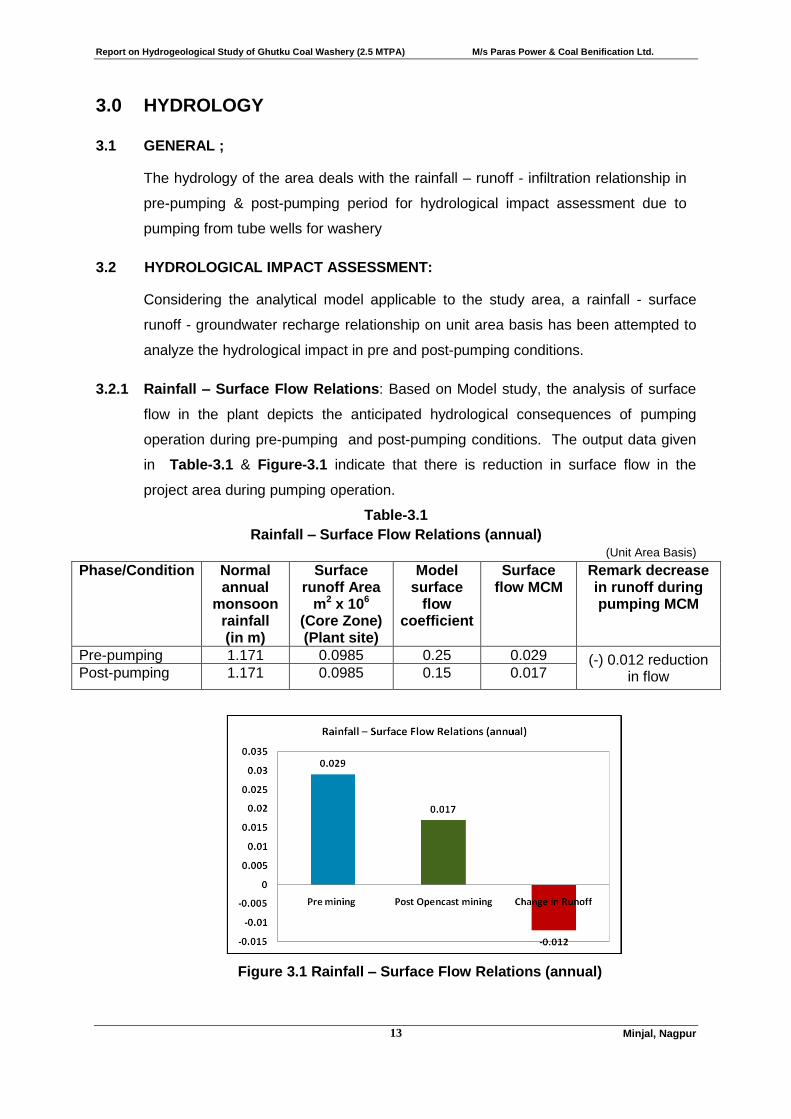
3.2.1 Rainfall – Surface Flow Relations: Based on Model study, the analysis of surface
flow in the plant depicts the anticipated hydrological consequences of pumping
operation during pre-pumping and post-pumping conditions. The output data given
in Table-3.1 & Figure-3.1 indicate that there is reduction in surface flow in the
project area during pumping operation.
Table-3.1
Rainfall – Surface Flow Relations (annual) (Unit Area Basis)
Phase/Condition Normal annual
monsoon rainfall (in m)
Surface runoff Area
m2 x 106 (Core Zone) (Plant site)
Model surface
flow coefficient
Surface flow MCM
Remark decrease in runoff during pumping MCM
Pre-pumping 1.171 0.0985 0.25 0.029 (-) 0.012 reduction in flow Post-pumping 1.171 0.0985 0.15 0.017
Figure 3.1 Rainfall – Surface Flow Relations (annual)
Report on Hydrogeological Study of Ghutku Coal Washery (2.5 MTPA) M/s Paras Power & Coal Benification Ltd.
Minjal, Nagpur
14
It can be stated that due to pumping, there will be reduction in flow into drainage to
the tune of 0.012 MCM. This may be due to pumping and increase in induced
infiltration in the area by industrial activity of washery. The pumping and induced
infiltration will contribute to drainage as groundwater runoff for the longer period of
utilization.
3.2.2 Rainfall – Infiltration Relation : Study has established a model to calculate induced
infiltration from normal rainfall over the land under different conditions. The same is
applied in the present project area and the output is placed in Table-3.2 and
depicted in Figure 3.2.
Table-3.2
Rainfall – Infiltration Relation (annual)
(Unit Area Basis)
Phase/
Condition
Normal
monsoon
annual
rainfall (in
m)
Area
m2 x 106
Model
infiltration
coefficient
Annual
induced
infiltration
due to
rainfall in
MCM
Remarks
Increase in
infiltration
/recharge
due to
pumping
MCM
Pre-
pumping
1.171 0.0985 0.12 0.014
0.001 Post-
pumping
1.171 0.0985 0.21 0.024
Figure 3.2 Rainfall – Infiltration Relation (annual)
Report on Hydrogeological Study of Ghutku Coal Washery (2.5 MTPA) M/s Paras Power & Coal Benification Ltd.
Minjal, Nagpur
15
The induced infiltration in post-pumping period will increase to the tune of 0.01 MCM
due to induced recharge by industrial activity of formation and lowering of water level.
(Figure 3.3).
3.2.3 Discussions :
The study reveals that during pumping there will be induced infiltration due to
withdrawal of water from system and creation of infiltration zone. The industrial
activity during operation of plant area accelerates induced infiltration which will limit
the radius of influence during post-pumping period. There will be reduction in surface
flow due to high infiltration zone created by plant operation. Thus, the impact due to
pumping will be temporary and will be restored at the end of monsoon period. The
surface flow in the first order streamlet near washery will be reduced due to rainwater
harvesting.
Report on Hydrogeological Study of Ghutku Coal Washery (2.5 MTPA) M/s Paras Power & Coal Benification Ltd.
Minjal, Nagpur
16
4 HYDROGEOLOGY
4.1 REGIONAL HYDROGEOLOGICAL SETTING:
Buffer zone constitutes mainly Chhattisgarh super group aquifer system, covered by a
layer of soil cover/detrital mantle. Aquifer mainly consists of Dolomite and Cherty
shale. The primary porosity and permeability of these formations are good. The
groundwater in these formations occurs under unconfined and semi-confined to
confined conditions.
The general direction of groundwater movement is from North to South, in the
regional area and with local formation of groundwater devide and hydraulic trough.
Groundwater flow is mostly following the topography of the area. The general
groundwater movement is towards the Apra river. The river being fed by the
groundwater runoff.
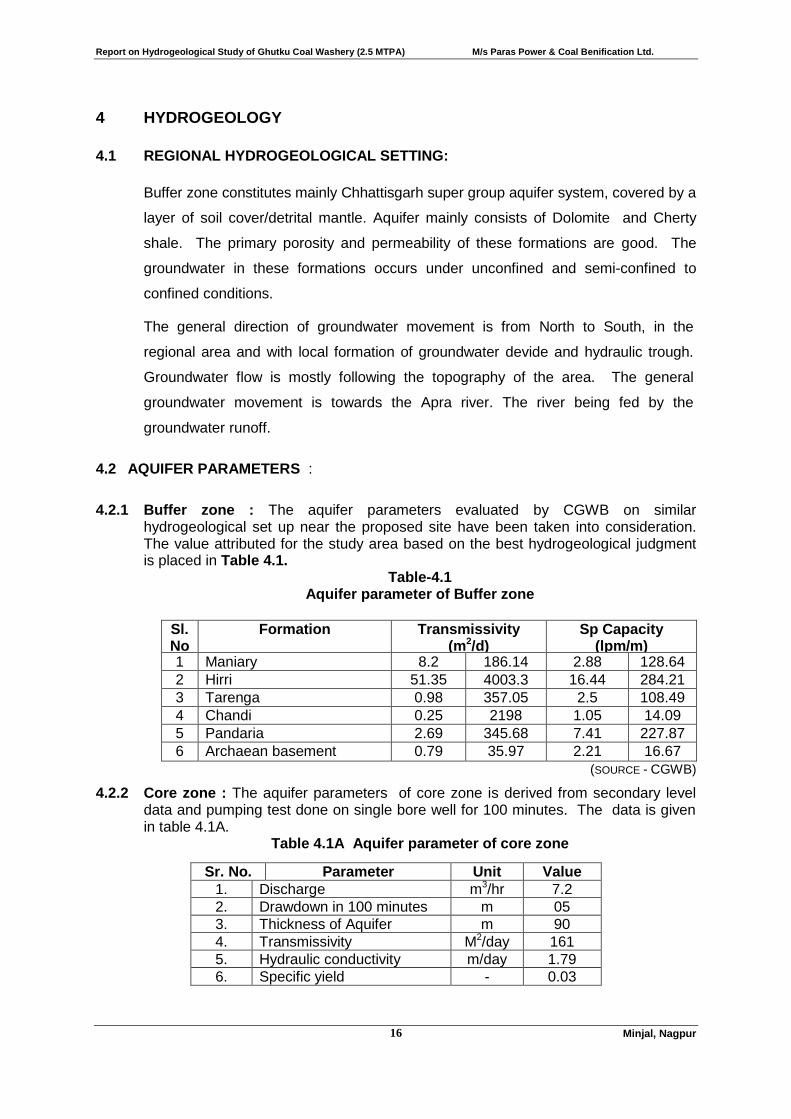
4.2 AQUIFER PARAMETERS :
4.2.1 Buffer zone : The aquifer parameters evaluated by CGWB on similar hydrogeological set up near the proposed site have been taken into consideration. The value attributed for the study area based on the best hydrogeological judgment is placed in Table 4.1.
Table-4.1 Aquifer parameter of Buffer zone
Sl. No.
Formation Transmissivity (m2/d)
Sp Capacity (lpm/m)
1 Maniary 8.2 186.14 2.88 128.64
2 Hirri 51.35 4003.3 16.44 284.21
3 Tarenga 0.98 357.05 2.5 108.49
4 Chandi 0.25 2198 1.05 14.09
5 Pandaria 2.69 345.68 7.41 227.87
6 Archaean basement crystaline
0.79 35.97 2.21 16.67
(SOURCE - CGWB)
4.2.2 Core zone : The aquifer parameters of core zone is derived from secondary level data and pumping test done on single bore well for 100 minutes. The data is given in table 4.1A.
Table 4.1A Aquifer parameter of core zone
Sr. No. Parameter Unit Value
1. Discharge m3/hr 7.2
2. Drawdown in 100 minutes m 05
3. Thickness of Aquifer m 90
4. Transmissivity M2/day 161
5. Hydraulic conductivity m/day 1.79
6. Specific yield - 0.03

Report on Hydrogeological Study of Ghutku Coal Washery (2.5 MTPA) M/s Paras Power & Coal Benification Ltd.
Minjal, Nagpur
17
4.3 LOCAL HYDROGEOLOGICAL SETTINGS :
4.3.1 Aquifer : The aquifer present in plant area constitute Cherty shale and dolomite
rock. Thus, due to sedimentation/stratifications multiple aquifer system prevails. The
top most formation, will be the major source of flow into tubewell during pumping.
The weathered formation with fractures behave as unconfined aquifer.
The unconfined aquifer is mainly affected by dugwell and hand pump. But in depth
semi-confined aquifer sustained tubewell. The aquifer system is having double
porosity, one being primary porosity and other being secondary porosity formed due
to joints and fractures. These double porosity system form a conduit system making
these formation most potential aquifer for movement and storage of groundwater.
The major hydrogeological units developed in area are furnished below in Table-4.2.
Table-4.2
Hydrogeological units (aquifer disposition)
Sr.
No.
Hydrogeologic
Units
Formation Depth range
(m)
1. Unconfined aquifer Soil loosely cemented, poorly
consolidated weathered.
5 – 30
2. Semi confined Compact Cherity Shale & Dolomite
with primary & secondary porosity in
fracture zone.
30 - 70
3. Confined Compact Dolomite with primary &
secondary porosity in between cherity
shale & Cavernous Dolomite of
fracture.
50 - 150
4.4 HYDROGEOLOGICAL REGIME:
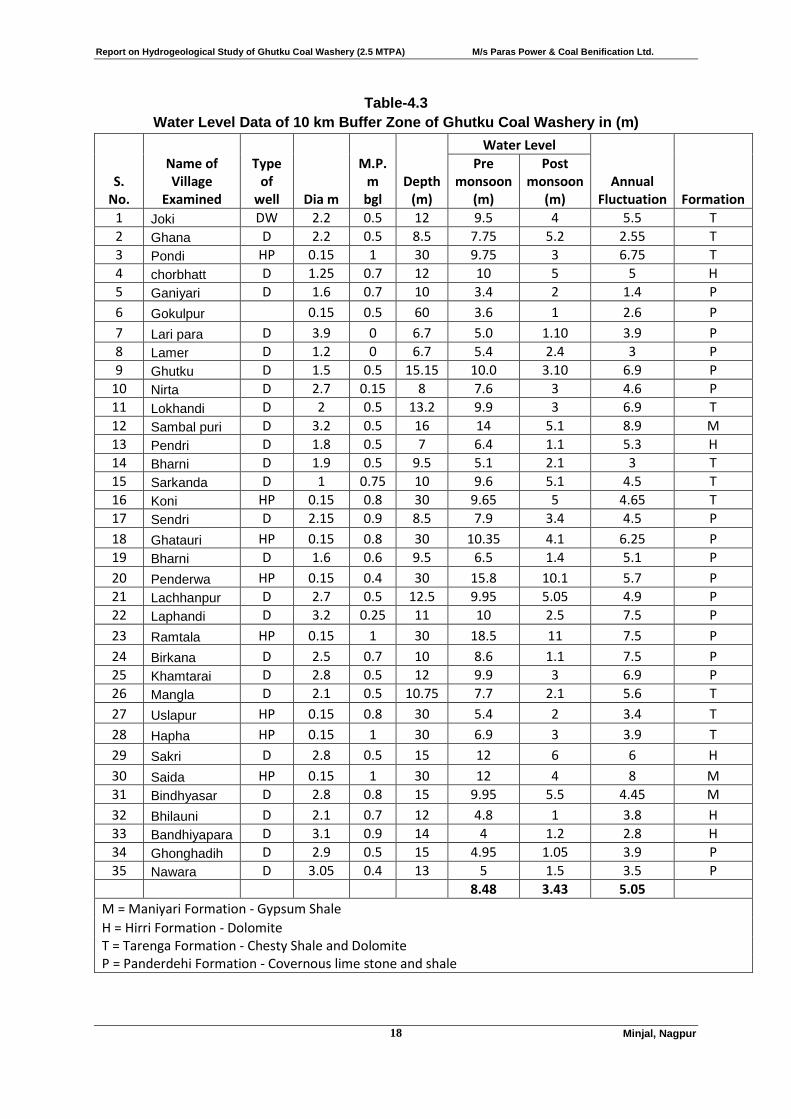
4.4.1 Groundwater Level : Well inventory of 38 numbers of dug wells in the buffer zone
has been prepared. The water level data is furnished in Table 4.3 . The abstract of
water level is given in Table 4.4. In the core zone, water level on an average in pre-
monsoon is 10.00 m bgl where as in post-monsoon it is 5.00 m bgl. The average
annual fluctuation is 5.00 m bgl. In the buffer zone, the depth of water level in pre-
monsoon varies between 3.4 m to 18.50 m bgl, average being 8.48 m bgl while
during post-monsoon it varies from 1.00 m to 11.00 m bgl, average being 3.43 m bgl.
The average water level fluctuation between two extreme seasons in the buffer zone
is 5.05 m. The pre-monsoon water level map has been prepared Figure 4.1.
Report on Hydrogeological Study of Ghutku Coal Washery (2.5 MTPA) M/s Paras Power & Coal Benification Ltd.
Minjal, Nagpur
18
Table-4.3
Water Level Data of 10 km Buffer Zone of Ghutku Coal Washery in (m)
S. No.
Name of Village
Examined
Type of
well Dia m
M.P. m bgl
Depth (m)
Water Level
Annual Fluctuation Formation
Pre monsoon
(m)
Post monsoon
(m)
1 Joki DW 2.2 0.5 12 9.5 4 5.5 T
2 Ghana D 2.2 0.5 8.5 7.75 5.2 2.55 T
3 Pondi HP 0.15 1 30 9.75 3 6.75 T
4 chorbhatt D 1.25 0.7 12 10 5 5 H
5 Ganiyari D 1.6 0.7 10 3.4 2 1.4 P
6 Gokulpur 0.15 0.5 60 3.6 1 2.6 P
7 Lari para D 3.9 0 6.7 5.0 1.10 3.9 P
8 Lamer D 1.2 0 6.7 5.4 2.4 3 P
9 Ghutku D 1.5 0.5 15.15 10.0 3.10 6.9 P
10 Nirta D 2.7 0.15 8 7.6 3 4.6 P
11 Lokhandi D 2 0.5 13.2 9.9 3 6.9 T
12 Sambal puri D 3.2 0.5 16 14 5.1 8.9 M
13 Pendri D 1.8 0.5 7 6.4 1.1 5.3 H
14 Bharni D 1.9 0.5 9.5 5.1 2.1 3 T
15 Sarkanda D 1 0.75 10 9.6 5.1 4.5 T
16 Koni HP 0.15 0.8 30 9.65 5 4.65 T
17 Sendri D 2.15 0.9 8.5 7.9 3.4 4.5 P
18 Ghatauri HP 0.15 0.8 30 10.35 4.1 6.25 P
19 Bharni D 1.6 0.6 9.5 6.5 1.4 5.1 P
20 Penderwa HP 0.15 0.4 30 15.8 10.1 5.7 P
21 Lachhanpur D 2.7 0.5 12.5 9.95 5.05 4.9 P
22 Laphandi D 3.2 0.25 11 10 2.5 7.5 P
23 Ramtala HP 0.15 1 30 18.5 11 7.5 P
24 Birkana D 2.5 0.7 10 8.6 1.1 7.5 P
25 Khamtarai D 2.8 0.5 12 9.9 3 6.9 P
26 Mangla D 2.1 0.5 10.75 7.7 2.1 5.6 T
27 Uslapur HP 0.15 0.8 30 5.4 2 3.4 T
28 Hapha HP 0.15 1 30 6.9 3 3.9 T
29 Sakri D 2.8 0.5 15 12 6 6 H
30 Saida HP 0.15 1 30 12 4 8 M
31 Bindhyasar D 2.8 0.8 15 9.95 5.5 4.45 M
32 Bhilauni D 2.1 0.7 12 4.8 1 3.8 H
33 Bandhiyapara D 3.1 0.9 14 4 1.2 2.8 H
34 Ghonghadih D 2.9 0.5 15 4.95 1.05 3.9 P
35 Nawara D 3.05 0.4 13 5 1.5 3.5 P
8.48 3.43 5.05
M = Maniyari Formation - Gypsum Shale
H = Hirri Formation - Dolomite T = Tarenga Formation - Chesty Shale and Dolomite P = Panderdehi Formation - Covernous lime stone and shale
Report on Hydrogeological Study of Ghutku Coal Washery (2.5 MTPA) M/s Paras Power & Coal Benification Ltd.
Minjal, Nagpur
19
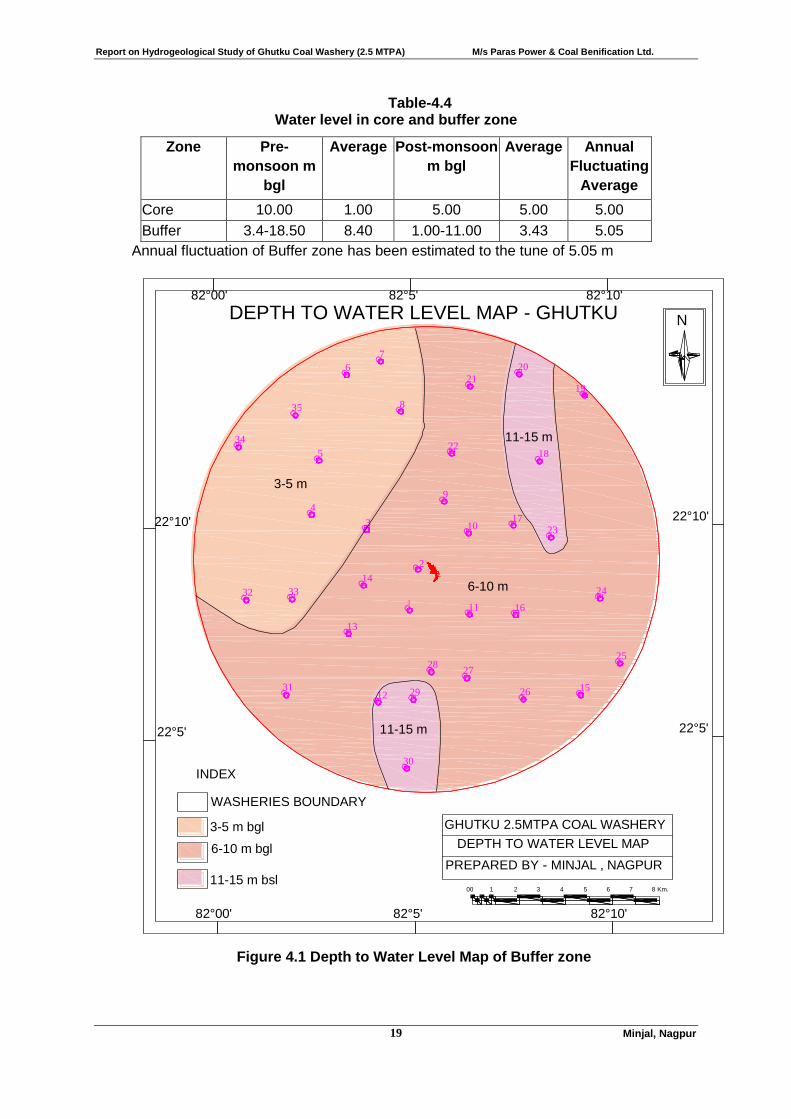
Table-4.4 Water level in core and buffer zone
Zone
Pre-
monsoon m
bgl
Average
Post-monsoon
m bgl
Average
Annual
Fluctuating
Average
Core 10.00 1.00 5.00 5.00 5.00
Buffer 3.4-18.50 8.40 1.00-11.00 3.43 5.05
Annual fluctuation of Buffer zone has been estimated to the tune of 5.05 m
N
22°5' 22°5'
22°10'
82°00' 82°5' 82°10'
82°00' 82°5' 82°10'
22°10'
1
2
3
4
5
6
7
9
8
10
11
12
13
14
15
16
17
18
19
20
21
22
23
24
25
26
2728
29
30
31
32 33
34
35
6-10 m bgl
3-5 m bgl
11-15 m bsl
INDEX
WASHERIES BOUNDARY
DEPTH TO WATER LEVEL MAP - GHUTKU
3-5 m
6-10 m
11-15 m
11-15 m
GHUTKU 2.5MTPA COAL WASHERY
DEPTH TO WATER LEVEL MAP
PREPARED BY - MINJAL , NAGPUR
00 1 2 3 4 5 6 7 8 Km.
Figure 4.1 Depth to Water Level Map of Buffer zone
Report on Hydrogeological Study of Ghutku Coal Washery (2.5 MTPA) M/s Paras Power & Coal Benification Ltd.
Minjal, Nagpur
20
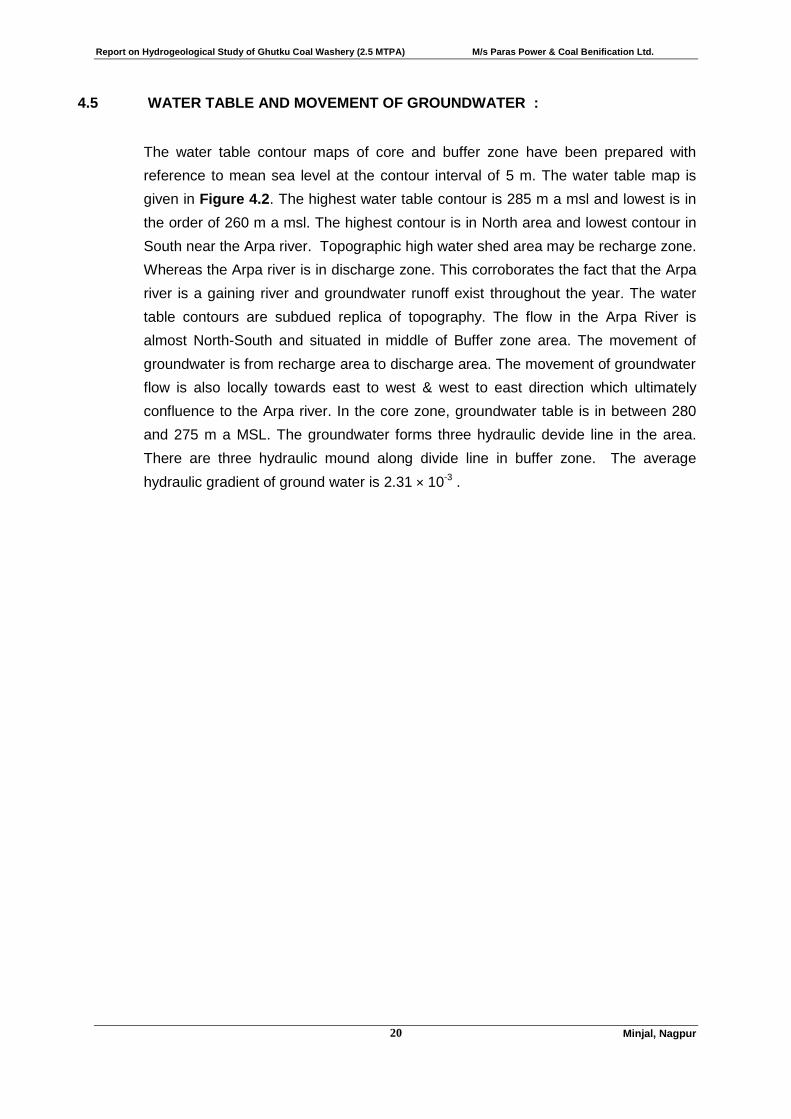
4.5 WATER TABLE AND MOVEMENT OF GROUNDWATER :
The water table contour maps of core and buffer zone have been prepared with
reference to mean sea level at the contour interval of 5 m. The water table map is
given in Figure 4.2. The highest water table contour is 285 m a msl and lowest is in
the order of 260 m a msl. The highest contour is in North area and lowest contour in
South near the Arpa river. Topographic high water shed area may be recharge zone.
Whereas the Arpa river is in discharge zone. This corroborates the fact that the Arpa
river is a gaining river and groundwater runoff exist throughout the year. The water
table contours are subdued replica of topography. The flow in the Arpa River is
almost North-South and situated in middle of Buffer zone area. The movement of
groundwater is from recharge area to discharge area. The movement of groundwater
flow is also locally towards east to west & west to east direction which ultimately
confluence to the Arpa river. In the core zone, groundwater table is in between 280
and 275 m a MSL. The groundwater forms three hydraulic devide line in the area.
There are three hydraulic mound along divide line in buffer zone. The average
hydraulic gradient of ground water is 2.31 × 10⁻³ .
Report on Hydrogeological Study of Ghutku Coal Washery (2.5 MTPA) M/s Paras Power & Coal Benification Ltd.
Minjal, Nagpur
21
N
22°5' 22°5'
22°10'
82°00' 82°5' 82°10'
82°00' 82°5' 82°10'
22°10'
GROUND WATER FLOW DIRECTION
WATER TABLE
G.W. NICRO WATER SHED
INDEX
WASHERIES BOUNDARY
WATER TABLE MAP
OBSERVATION WELL
270
1
2
3
4
5
6
7
9
8
10
11
12
13
14
15
16
17
18
19
20
21
22
23
24
25
26
2728
29
30
31
33
34
35
31
GHUTKU 2.5MTPA COAL WASHERY
WATER TABLE MAP
PREPARED BY - MINJAL , NAGPUR
260
260
260
260
265
265
270
275280
285
270
270
270
275
280
285
00 1 2 3 4 5 6 7 8 Km.
Figure 4.2 Water Table Map of Buffer zone
Report on Hydrogeological Study of Ghutku Coal Washery (2.5 MTPA) M/s Paras Power & Coal Benification Ltd.
Minjal, Nagpur
22
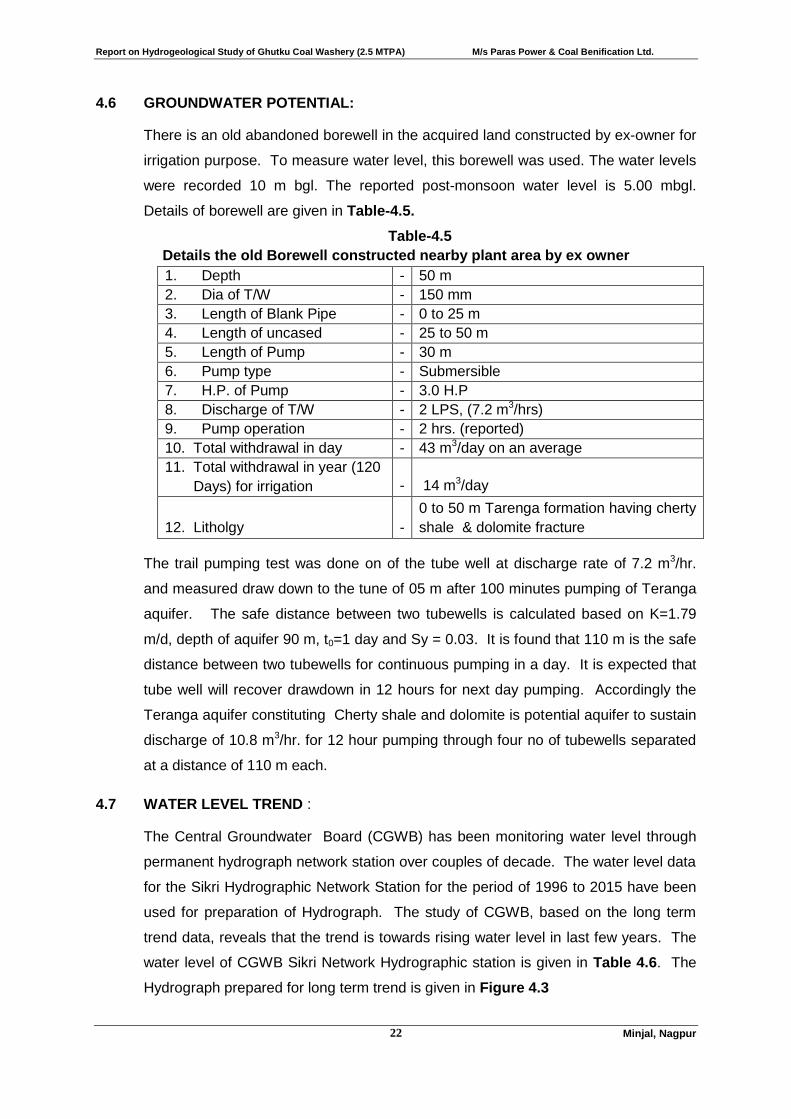
4.6 GROUNDWATER POTENTIAL:
There is an old abandoned borewell in the acquired land constructed by ex-owner for
irrigation purpose. To measure water level, this borewell was used. The water levels
were recorded 10 m bgl. The reported post-monsoon water level is 5.00 mbgl.
Details of borewell are given in Table-4.5.
Table-4.5
Details the old Borewell constructed nearby plant area by ex owner
1. Depth - 50 m
2. Dia of T/W - 150 mm
3. Length of Blank Pipe - 0 to 25 m
4. Length of uncased - 25 to 50 m
5. Length of Pump - 30 m
6. Pump type - Submersible
7. H.P. of Pump - 3.0 H.P
8. Discharge of T/W - 2 LPS, (7.2 m3/hrs)
9. Pump operation - 2 hrs. (reported)
10. Total withdrawal in day - 43 m3/day on an average
11. Total withdrawal in year (120
Days) for irrigation - 14 m3/day
12. Litholgy -
0 to 50 m Tarenga formation having cherty
shale & dolomite fracture
The trail pumping test was done on of the tube well at discharge rate of 7.2 m3/hr.
and measured draw down to the tune of 05 m after 100 minutes pumping of Teranga
aquifer. The safe distance between two tubewells is calculated based on K=1.79
m/d, depth of aquifer 90 m, t0=1 day and Sy = 0.03. It is found that 110 m is the safe
distance between two tubewells for continuous pumping in a day. It is expected that
tube well will recover drawdown in 12 hours for next day pumping. Accordingly the
Teranga aquifer constituting Cherty shale and dolomite is potential aquifer to sustain
discharge of 10.8 m3/hr. for 12 hour pumping through four no of tubewells separated
at a distance of 110 m each.
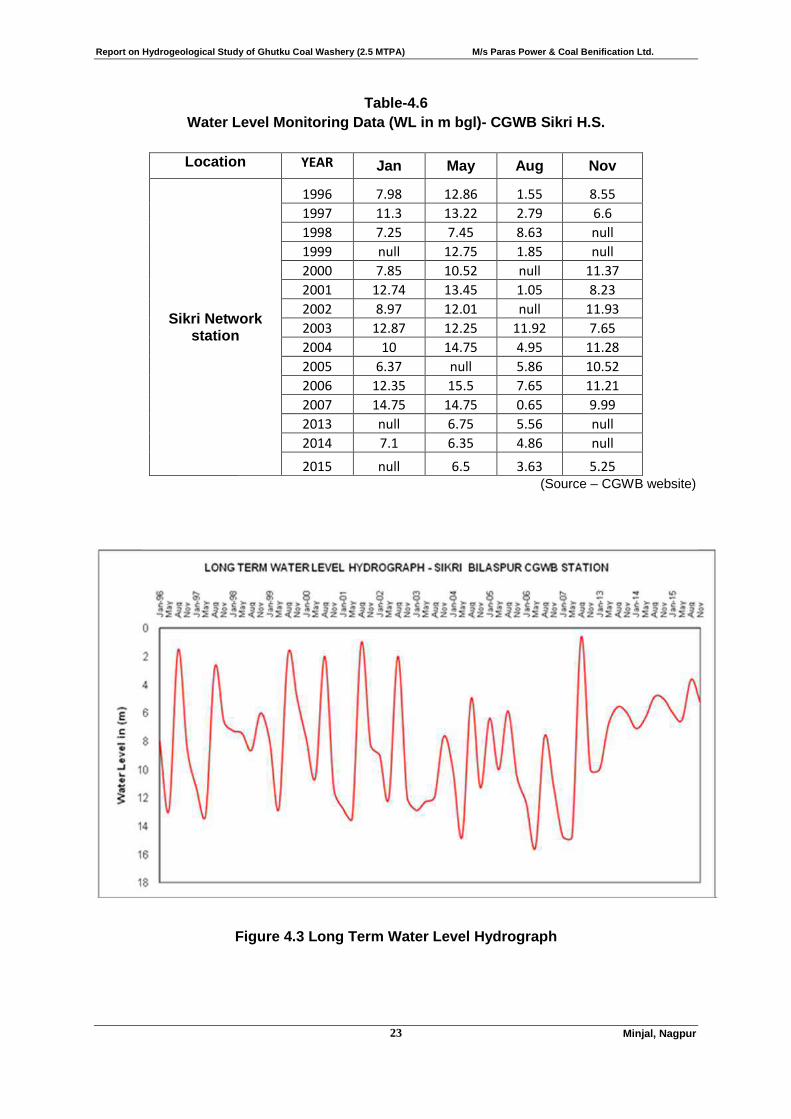
4.7 WATER LEVEL TREND :
The Central Groundwater Board (CGWB) has been monitoring water level through
permanent hydrograph network station over couples of decade. The water level data
for the Sikri Hydrographic Network Station for the period of 1996 to 2015 have been
used for preparation of Hydrograph. The study of CGWB, based on the long term
trend data, reveals that the trend is towards rising water level in last few years. The
water level of CGWB Sikri Network Hydrographic station is given in Table 4.6. The
Hydrograph prepared for long term trend is given in Figure 4.3
Report on Hydrogeological Study of Ghutku Coal Washery (2.5 MTPA) M/s Paras Power & Coal Benification Ltd.
Minjal, Nagpur
23
Table-4.6
Water Level Monitoring Data (WL in m bgl)- CGWB Sikri H.S.
Location YEAR Jan May Aug Nov
Sikri Network station
1996 7.98 12.86 1.55 8.55
1997 11.3 13.22 2.79 6.6
1998 7.25 7.45 8.63 null
1999 null 12.75 1.85 null
2000 7.85 10.52 null 11.37
2001 12.74 13.45 1.05 8.23
2002 8.97 12.01 null 11.93
2003 12.87 12.25 11.92 7.65
2004 10 14.75 4.95 11.28
2005 6.37 null 5.86 10.52
2006 12.35 15.5 7.65 11.21
2007 14.75 14.75 0.65 9.99
2013 null 6.75 5.56 null
2014 7.1 6.35 4.86 null
2015 null 6.5 3.63 5.25 (Source – CGWB website)
Figure 4.3 Long Term Water Level Hydrograph
Report on Hydrogeological Study of Ghutku Coal Washery (2.5 MTPA) M/s Paras Power & Coal Benification Ltd.
Minjal, Nagpur
24
5.0 GROUNDWATER RESOURCES IN CORE AND BUFFER ZONES:
5.1 GENERAL :
The groundwater resources of the core and buffer zones have been computed
following the methodology and norms described in GWRE 2011. CGWB has carried
out computation based on the Takhatpur Block as unit. The Takhatpur Block has
been declared as safe category as per CGWB report 2012-13. The site of the
proposed plant falls in the non-command area. The norms used for resource
evaluation as per CGWB are given in Table 5.1.
Table 5.1
The norms used for resource evaluation as per CGWB
Sr. No. Particular Unit Value
1. Annual Rainfall Normal 1343.6
2. Rainfall infiltration Coefficient 0.12
3. SP yield Coefficient 0.03
4. Natural Discharge Coefficient 0.5
5. Provision for 25 years Coefficient 1.28
6. Hydraulic conductivity of Dolomite & Cherity Shale fracture
m/d 1.79
7. Domestic m3/y/person 21.9
8. Irrigation MCM /km2 0.48
9. Industries MCM /Unit 0.165
10. Recharg by return flow Coefficient 0.20
As per norms in assessment unit, hilly areas having slope more than 20% are
deleted from the total area to get area suitable for recharge. Further, areas having of
groundwater quality beyond the permissible limit should be identified and handled
separately. The remaining area is to be delineated into command and non-command
areas. The Buffer zone have almost same litho unit and detrital mantle hence entire
buffer zone is considered single unit. The rechargeable areas considered for all as
single unit under the Cherty Shale & Dolomite and limestone, Chhattisgarh Super
Group is given below in Table-5.2.
Table 5.2 Recharge area
Sr. No.
Units of assessment
Area Km2 Area suitable for
recharge km2
Geographical area
Hilly Area
Poor Quantity
Command Non Command
1. Core zone (plant area)
0.0985 NIL NIL NIL 0.0985 0.0985
2. Buffer Zone 314 NIL NIL NIL 314 314
Report on Hydrogeological Study of Ghutku Coal Washery (2.5 MTPA) M/s Paras Power & Coal Benification Ltd.
Minjal, Nagpur
25
5.2 Groundwater Recharge:
GWRE norms suggest that groundwater recharge can be estimated by rainfall
infiltration method as well as water table fluctuation method. Both methods have
been attempted. Due to non-availability of long term annual water level fluctuation
data for numbers of observation wells, rainfall infiltration method has been
considered for groundwater recharge assessment.
5.2.1 Groundwater recharge by rainfall infiltration method: The groundwater
recharge by rainfall infiltration has been computed based on GWRE Norm. Data is
given in Table-5.3. The aquifer is Dolomite/ Limestone/ shale considered under
hard rock terrain. Non-monsoon rainfall is 12.86% little more than 10% of the
annual rainfall. Considering the rainfall intensity recharge during non monsoon may
not be possible. Therefore, recharge by monsoon rain has been considered. The
gross ground water recharge in buffer zone estimated to the tune of 47.22 MCM.
The net annual ground water available is 44.86 MCM.
Table 5.3
Groundwater Recharge-Monsoon-Non command area
Sr.
No.
Unit
/Parameters
Normal
rainfall
Monsoon
rainfall
Recharge
area
Rainfall
infiltration
coefficient
Recharge
by
Monsoon
rainfall
Recharge
by other
sources
Gross
recharge
MCM
Natural
dis-
charge
5%
Net
annual
GW
available
Unit mm mm km2 CGWB
Norm
MCM MCM MCM MCM MCM
1. Core Zone 1343.6 1170.8 0.0985 0.12 0.014 - 0.014 0.0006 0.0134
2. Buffer Zone 1343.6 1170.8 314 0.12 44.12 3.10 47.22 2.36 44.86
(MCM – Million Cubic Meter)
5.2.2 Groundwater recharge by water table fluctuation method: The recharge by water
table fluctuation method, referred as dynamic groundwater resource, has been
estimated based on annual water level fluctuations observed during investigation
and secondary data. The dynamic groundwater resources have been considered as
change in groundwater storage due to rainfall recharge during monsoon. The
specific yield of the Barakar Sandstone/shale has been considered as per GWRE
Norm as 0.04. The recharge estimate is given in Table-5.4.
Report on Hydrogeological Study of Ghutku Coal Washery (2.5 MTPA) M/s Paras Power & Coal Benification Ltd.
Minjal, Nagpur
26
Table –5.4
Groundwater recharge by water table fluctuation method
Sr.
No
Unit
/Parameter
Area Specific
Yield
Annual
water level
fluctuation
Groundwater
storage
Unit Km2 CGWB Norm m MCM
1. Core Zone 0.0985 0.03 5.0 0.014
2. Buffer Zone 314 0.03 5.05 47.1
The difference of groundwater recharge estimation by rainwater infiltration & water
table fluctuation is less that 10%. Accordingly, the groundwater recharge by rainfall
infiltration method has been considered for assessment of groundwater potential.
5.3 GROUNDWATER DRAFT :
The gross groundwater draft is to be calculated for irrigation, domestic and industrial
use. The gross groundwater draft would include the groundwater extraction from all
exiting groundwater structures during monsoon as well as non-monsoon periods.
5.3.1 Groundwater draft for irrigation : The groundwater draft for irrigation of different
crops has been considered for the average 120 days irrigation at the rate of
40m3/ha. The total area under irrigation is 3234.3 ha. This is an average of
groundwater utilization for difference crops. The groundwater draft has been
computed in the following Table-5.5.
Table -5.5
Groundwater Withdrawal Irrigation
Sr.
No.
Unit
/Parameter
Area of
groundwater
irrigation
Groundwater
draft
Annual 0.048
MCM/km2
20% of max draft
consumption as
return flow to
groundwater
additional recharge
Unit Km2 MCM MCM
1. Core Zone NIL NIL NIL
2. Buffer Zone 32.343 15.52 3.10
5.3.2 Groundwater withdrawal for domestic and Industries: Most of the area under
investigation is density populated and have about 15 industry reported to be
abstracting at the rate of 500 m3/day ground water for 330 days. The withdrawal is
amounting to 2.48 MCM/y. Total annual groundwater abstraction for proposed
washery is 0.36 MCM/y. The groundwater withdrawal for projected population has
been estimated following norms of 60 liters per head/per day for population of 389,
Report on Hydrogeological Study of Ghutku Coal Washery (2.5 MTPA) M/s Paras Power & Coal Benification Ltd.
Minjal, Nagpur
27
341 for 365 days. The estimated abstraction of groundwater domestic use is 8.52
MCM/y. The total withdrawal due to domestic & Industry is 11.00 MCM. The
additional allocation for 25 years is estimated to the tune of 14.08 MCM as per of
recent assessment norm used by CGWB given in Table-5.6.
Table- 5.6
Groundwater withdrawal for domestic and Industries
Sr.
No
Unit
/Parameter
Present draft Total 25 year
Allocation Industry Domestic
Unit MCM MCM MCM MCM
1. Core Zone Nil Nil Nil Nil
2. Buffer Zone 2.48 8.52 11.00 14.08
Total 2.48 8.52 11.00 14.08
5.3.3 Total annual groundwater draft : The annual groundwater draft in respect of
irrigation and domestic/ industries for assessment is given in Table-5.7.
Table 5.7
Total annual groundwater draft
Sr.
No
Unit /
Parameter
GW draft
by
Irrigation
GW draft by
domestic
/industries
Total GW
draft
Unit MCM MCM MCM
1. Core Zone NIL NIL NIL
2. Buffer Zone 15.52 11.00 26.52
Total 15.52 11.00 26.52
The total annual ground water draft by all measure is 26.52 MCM.
5.4 GROUNDWATER BALANCE :
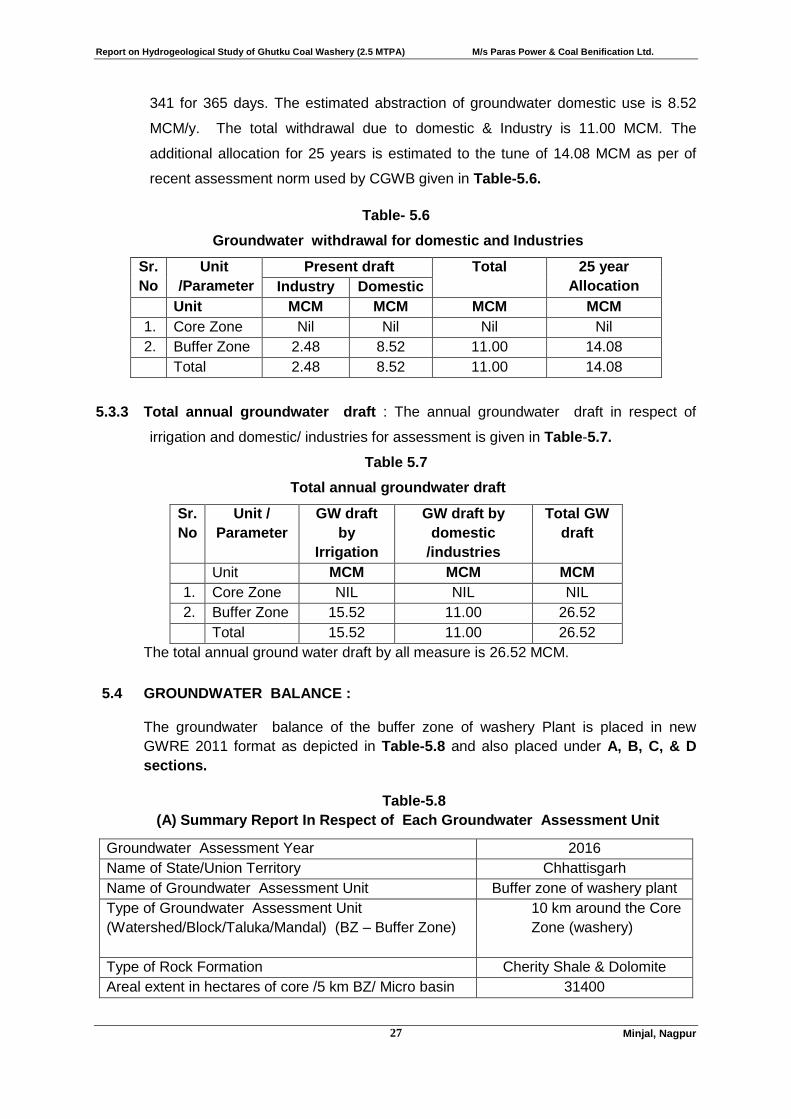
The groundwater balance of the buffer zone of washery Plant is placed in new
GWRE 2011 format as depicted in Table-5.8 and also placed under A, B, C, & D
sections.
Table-5.8
(A) Summary Report In Respect of Each Groundwater Assessment Unit
Groundwater Assessment Year 2016
Name of State/Union Territory Chhattisgarh
Name of Groundwater Assessment Unit Buffer zone of washery plant
Type of Groundwater Assessment Unit
(Watershed/Block/Taluka/Mandal) (BZ – Buffer Zone)
10 km around the Core
Zone (washery)
Type of Rock Formation Cherity Shale & Dolomite
Areal extent in hectares of core /5 km BZ/ Micro basin 31400
Report on Hydrogeological Study of Ghutku Coal Washery (2.5 MTPA) M/s Paras Power & Coal Benification Ltd.
Minjal, Nagpur
28
a Groundwater Assessment Unit Buffer
b Command Area in Ha Nil
c Non-command Area Ha 31400
d Poor Groundwater Quality Area Nil
(B) Zone suitable for groundwater recharge and also of good groundwater quality
Sl.
No
Description of Item Non-Command area
(MCM)
Groundwater
Assessment Units
10km buffer zone
1 Recharge from rainfall during monsoon season 44.12
2 Recharge from other sources during monsoon season NIL
3 Recharge from rainfall during non-monsoon season NIL
4 Recharge from other sources during non-monsoon season 3.10
5 Total annual groundwater recharge (1+2+3+4) 47.22
6 Natural discharge during non-monsoon season (5%) 2.36
7 Net annual groundwater availability (5-6) 44.86
8 Existing gross groundwater draft for irrigation 15.52
9 Existing gross groundwater draft for domestic and
industrial water supply
11.00
10 Existing gross groundwater draft for all uses (8 + 9) 26.52
11 Allocation for domestic and industrial water supply upto
next 25 years
14.08
12 Net groundwater availability for future
irrigation development (7-10-11)
4.26
13 Method adopted for computing rainfall recharge during
monsoon season (Water table fluctuation method, WTF
47.10
14 If response to Sl. No. 13 is water table fluctuation method,
how was specific yield value adopted (Norms/Pumping test
/ Dry season water balance method)
CGWB norm
15 Existing stage of groundwater development as a
percentage ([10/7] x100)
59 %
16 Is there a significant decline of pre-monsoon water table
levels (Yes/No)
No
17 Is there a significant decline of post-monsoon water table
levels (Yes/No)
No
18 Categorization for future groundwater Development (safe /
semi- critical / critical / over-exploited)
Safe
Report on Hydrogeological Study of Ghutku Coal Washery (2.5 MTPA) M/s Paras Power & Coal Benification Ltd.
Minjal, Nagpur
29
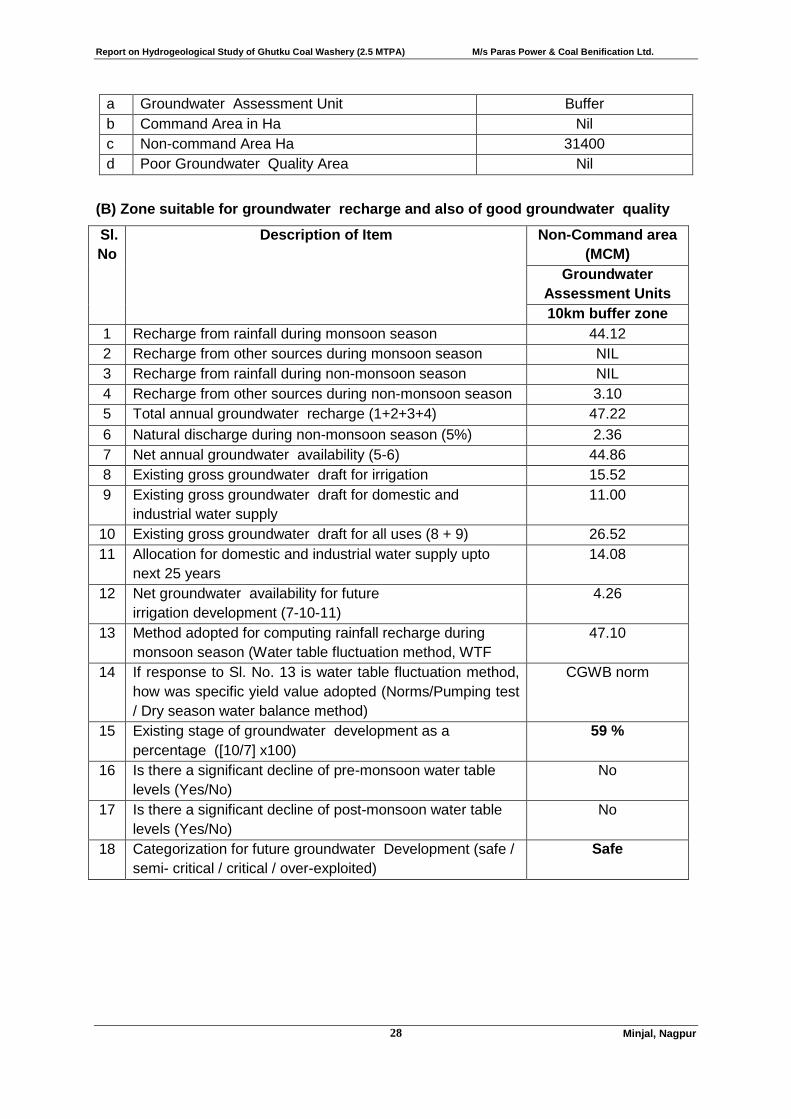
(C) Zone suitable for groundwater recharge but of poor groundwater : NA – Not Applicable
Sl.
No
Description of Item Non-Command area
(MCM)
Buffer zone
1 Recharge from rainfall and other sources, if any,
during monsoon period
Nil
2 Recharge from rainfall and other sources, if any,
during non- monsoon period
Nil
3 Total annual groundwater recharge (1+2) Nil
4 Natural discharge during non-monsoon period Nil
5 Net annual groundwater availability (3-4) Nil
6 Existing gross groundwater draft, if any Nil
7 Net groundwater availability for future use (5-6) Nil
(D) Additional annual potential recharge in hectare metres in the groundwater assessment unit : NA – Not Applicable
1. Waterlogged and shallow water table area NIL
2. Flood prone area NIL
3. Total NIL
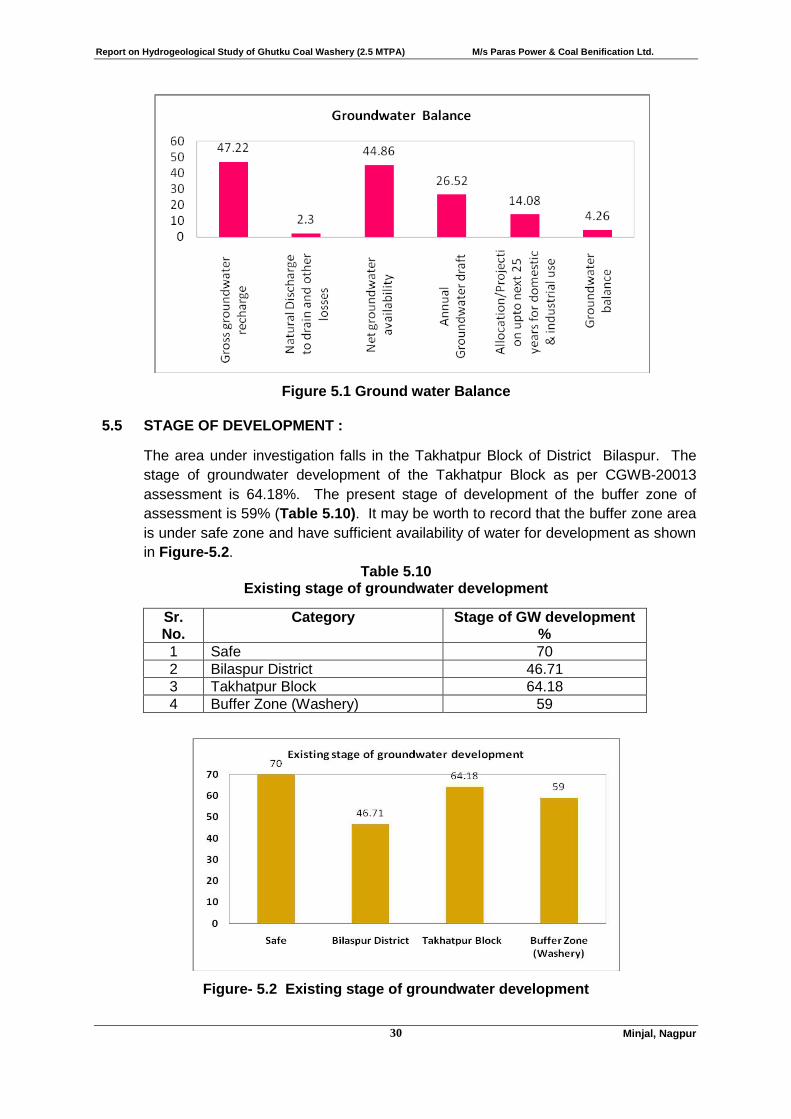
Extract of groundwater resource estimation as groundwater balance is depicted in
Table 5.9 and Figure 5.1.
Table 5.9
Groundwater Balance
Sr.
No.
Particulars Cubic Meter (MCM)
10km buffer
i Gross groundwater recharge 47.22
ii Natural Discharge to drain and other losses – 5
%.of (i)
2.30
iii Net groundwater availability ( i–ii) 44.86
iv Annual Groundwater draft 26.52
v Allocation/Projection upto next 25 years for
domestic & industrial use
14.08
vi Groundwater balance { iii- (iv + v)} 4.26
vii Proposed ground water with drawal 0.36
viii Ground water left for future use 3.90
Report on Hydrogeological Study of Ghutku Coal Washery (2.5 MTPA) M/s Paras Power & Coal Benification Ltd.
Minjal, Nagpur
30
Figure 5.1 Ground water Balance
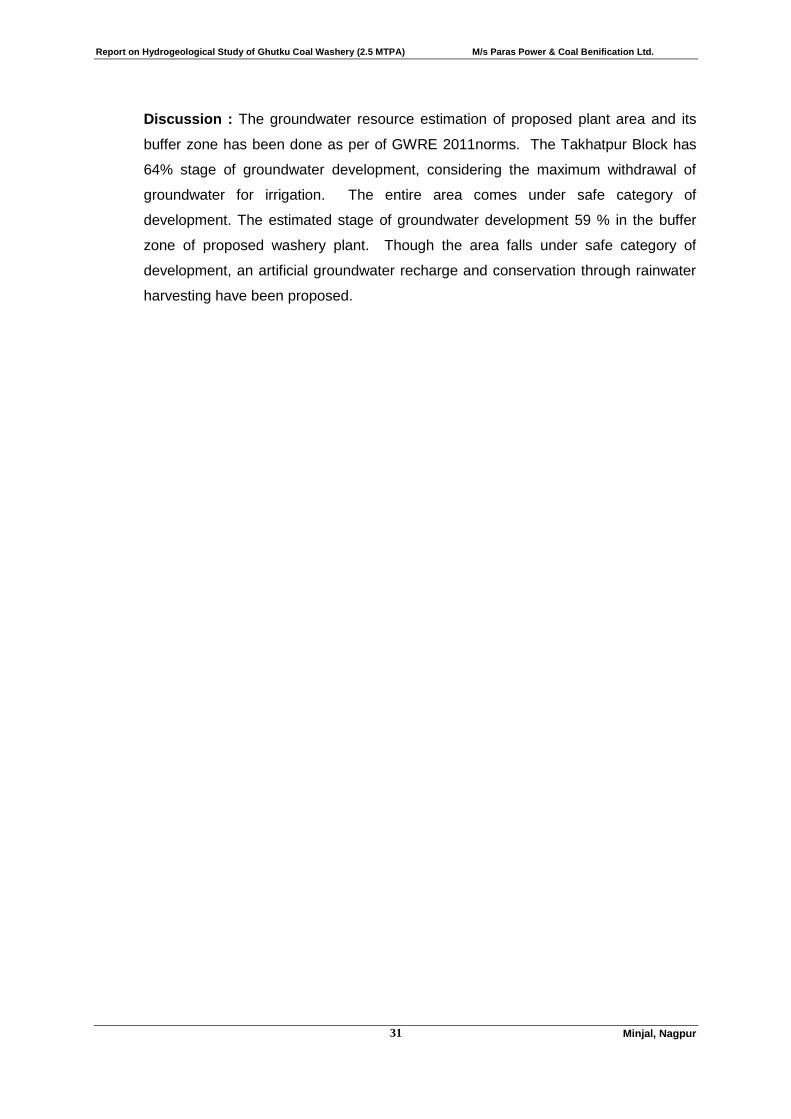
5.5 STAGE OF DEVELOPMENT :
The area under investigation falls in the Takhatpur Block of District Bilaspur. The
stage of groundwater development of the Takhatpur Block as per CGWB-20013
assessment is 64.18%. The present stage of development of the buffer zone of
assessment is 59% (Table 5.10). It may be worth to record that the buffer zone area
is under safe zone and have sufficient availability of water for development as shown
in Figure-5.2.
Table 5.10 Existing stage of groundwater development
Sr. No.
Category Stage of GW development %
1 Safe 70
2 Bilaspur District 46.71
3 Takhatpur Block 64.18
4 Buffer Zone (Washery) 59
Figure- 5.2 Existing stage of groundwater development
Report on Hydrogeological Study of Ghutku Coal Washery (2.5 MTPA) M/s Paras Power & Coal Benification Ltd.
Minjal, Nagpur
31
Discussion : The groundwater resource estimation of proposed plant area and its
buffer zone has been done as per of GWRE 2011norms. The Takhatpur Block has
64% stage of groundwater development, considering the maximum withdrawal of
groundwater for irrigation. The entire area comes under safe category of
development. The estimated stage of groundwater development 59 % in the buffer
zone of proposed washery plant. Though the area falls under safe category of
development, an artificial groundwater recharge and conservation through rainwater
harvesting have been proposed.
Report on Hydrogeological Study of Ghutku Coal Washery (2.5 MTPA) M/s Paras Power & Coal Benification Ltd.
Minjal, Nagpur
32
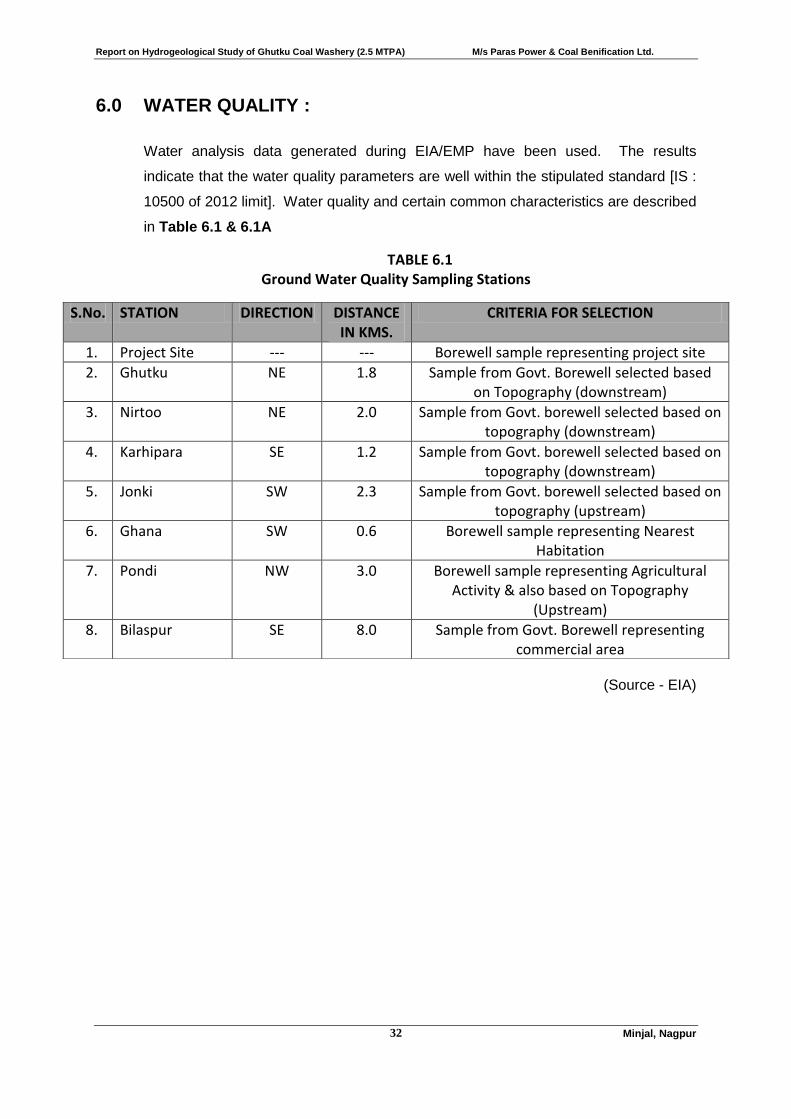
6.0 WATER QUALITY :
Water analysis data generated during EIA/EMP have been used. The results
indicate that the water quality parameters are well within the stipulated standard [IS :
10500 of 2012 limit]. Water quality and certain common characteristics are described
in Table 6.1 & 6.1A
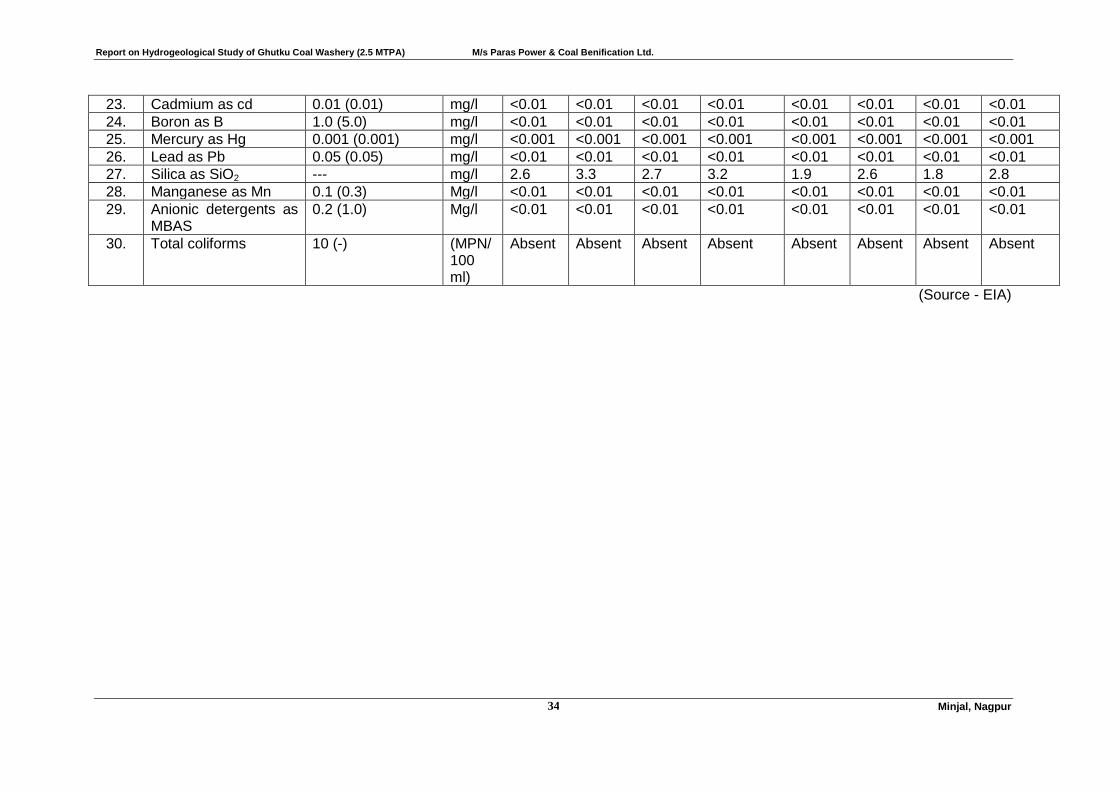
TABLE 6.1 Ground Water Quality Sampling Stations
(Source - EIA)
S.No. STATION DIRECTION DISTANCE IN KMS.
CRITERIA FOR SELECTION
1. Project Site --- --- Borewell sample representing project site
2. Ghutku NE 1.8 Sample from Govt. Borewell selected based on Topography (downstream)
3. Nirtoo NE 2.0 Sample from Govt. borewell selected based on topography (downstream)
4. Karhipara SE 1.2 Sample from Govt. borewell selected based on topography (downstream)
5. Jonki SW 2.3 Sample from Govt. borewell selected based on topography (upstream)
6. Ghana SW 0.6 Borewell sample representing Nearest Habitation
7. Pondi NW 3.0 Borewell sample representing Agricultural Activity & also based on Topography
(Upstream)
8. Bilaspur SE 8.0 Sample from Govt. Borewell representing commercial area
Report on Hydrogeological Study of Ghutku Coal Washery (2.5 MTPA) M/s Paras Power & Coal Benification Ltd.
Minjal, Nagpur
33
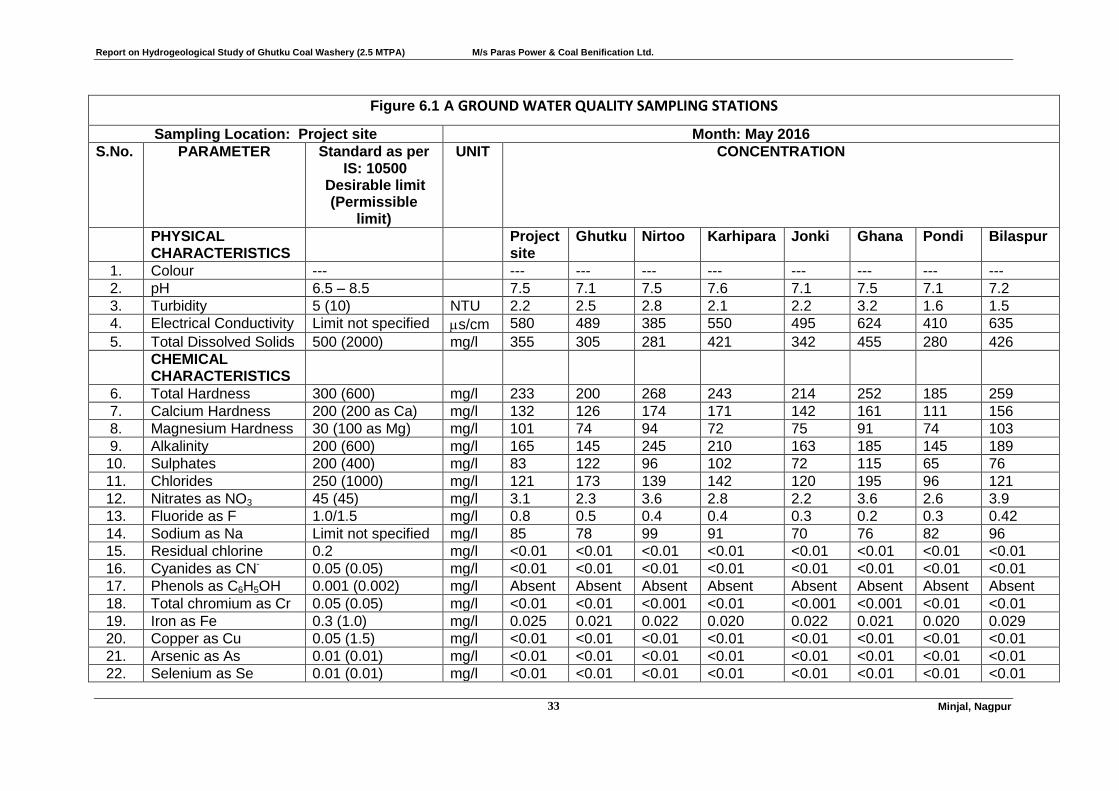
Figure 6.1 A GROUND WATER QUALITY SAMPLING STATIONS
Sampling Location: Project site Month: May 2016
S.No. PARAMETER Standard as per IS: 10500
Desirable limit (Permissible
limit)
UNIT CONCENTRATION
PHYSICAL CHARACTERISTICS
Project site
Ghutku Nirtoo Karhipara Jonki Ghana Pondi Bilaspur
1. Colour --- --- --- --- --- --- --- --- ---
2. pH 6.5 – 8.5 7.5 7.1 7.5 7.6 7.1 7.5 7.1 7.2
3. Turbidity 5 (10) NTU 2.2 2.5 2.8 2.1 2.2 3.2 1.6 1.5
4. Electrical Conductivity Limit not specified s/cm 580 489 385 550 495 624 410 635
5. Total Dissolved Solids 500 (2000) mg/l 355 305 281 421 342 455 280 426
CHEMICAL CHARACTERISTICS
6. Total Hardness 300 (600) mg/l 233 200 268 243 214 252 185 259
7. Calcium Hardness 200 (200 as Ca) mg/l 132 126 174 171 142 161 111 156
8. Magnesium Hardness 30 (100 as Mg) mg/l 101 74 94 72 75 91 74 103
9. Alkalinity 200 (600) mg/l 165 145 245 210 163 185 145 189
10. Sulphates 200 (400) mg/l 83 122 96 102 72 115 65 76
11. Chlorides 250 (1000) mg/l 121 173 139 142 120 195 96 121
12. Nitrates as NO3 45 (45) mg/l 3.1 2.3 3.6 2.8 2.2 3.6 2.6 3.9
13. Fluoride as F 1.0/1.5 mg/l 0.8 0.5 0.4 0.4 0.3 0.2 0.3 0.42
14. Sodium as Na Limit not specified mg/l 85 78 99 91 70 76 82 96
15. Residual chlorine 0.2 mg/l <0.01 <0.01 <0.01 <0.01 <0.01 <0.01 <0.01 <0.01
16. Cyanides as CN- 0.05 (0.05) mg/l <0.01 <0.01 <0.01 <0.01 <0.01 <0.01 <0.01 <0.01
17. Phenols as C6H5OH 0.001 (0.002) mg/l Absent Absent Absent Absent Absent Absent Absent Absent
18. Total chromium as Cr 0.05 (0.05) mg/l <0.01 <0.01 <0.001 <0.01 <0.001 <0.001 <0.01 <0.01
19. Iron as Fe 0.3 (1.0) mg/l 0.025 0.021 0.022 0.020 0.022 0.021 0.020 0.029
20. Copper as Cu 0.05 (1.5) mg/l <0.01 <0.01 <0.01 <0.01 <0.01 <0.01 <0.01 <0.01
21. Arsenic as As 0.01 (0.01) mg/l <0.01 <0.01 <0.01 <0.01 <0.01 <0.01 <0.01 <0.01
22. Selenium as Se 0.01 (0.01) mg/l <0.01 <0.01 <0.01 <0.01 <0.01 <0.01 <0.01 <0.01
Report on Hydrogeological Study of Ghutku Coal Washery (2.5 MTPA) M/s Paras Power & Coal Benification Ltd.
Minjal, Nagpur
34
23. Cadmium as cd 0.01 (0.01) mg/l <0.01 <0.01 <0.01 <0.01 <0.01 <0.01 <0.01 <0.01
24. Boron as B 1.0 (5.0) mg/l <0.01 <0.01 <0.01 <0.01 <0.01 <0.01 <0.01 <0.01
25. Mercury as Hg 0.001 (0.001) mg/l <0.001 <0.001 <0.001 <0.001 <0.001 <0.001 <0.001 <0.001
26. Lead as Pb 0.05 (0.05) mg/l <0.01 <0.01 <0.01 <0.01 <0.01 <0.01 <0.01 <0.01
27. Silica as SiO2 --- mg/l 2.6 3.3 2.7 3.2 1.9 2.6 1.8 2.8
28. Manganese as Mn 0.1 (0.3) Mg/l <0.01 <0.01 <0.01 <0.01 <0.01 <0.01 <0.01 <0.01
29. Anionic detergents as MBAS
0.2 (1.0) Mg/l <0.01 <0.01 <0.01 <0.01 <0.01 <0.01 <0.01 <0.01
30. Total coliforms 10 (-) (MPN/100 ml)
Absent Absent Absent Absent Absent Absent Absent Absent
(Source - EIA)
Report on Hydrogeological Study of Ghutku Coal Washery M/s Paras Power & Coal Benification Ltd.
Minjal, Nagpur
35
7.0 POSSIBLE IMPACT OF PUMPING ON WATER REGIME:
The area affected by pumping plant is a function of tubewell depth and hydraulic
conductivity of the rock. The plant operational activity may create temporary dis-
equilibrium in environmental scenario locally and impacts may be on three accounts :
Impact on land surface
Impact on surface runoff
Impact on groundwater
7.1 IMPACT ON LAND SURFACE :
Within the core zone area, cracks and loosening of soil will be resulted due to
associated plant operation activities such as vibration. Due to this physical/textural
changes will occur in soil/formation. The pumping induced processes will increase
the rate of infiltration and recharge. The studies carried out for Indian condition have
established that rainfall-infiltration rates have been increased in the core zone area
due to vibration and lowering of water table thereby increasing the scope of
groundwater recharge
7.2 IMPACT ON SURFACE RUNOFF:
It is established that high infiltration zone will serve as good media for high
groundwater recharge and reduces the surface run-off considerably in the core zone.
Study carried out by modeling suggest that in pre-pumping condition the surface flow
will be 0.029 MCM of annual rainfall whereas in post- pumping condition the flow will
be 0.017 MCM. As such surface flow contribution to the natural drains from the plant
area would be reduced thereby some minor change is expected in hydrological
regime of the Local nala system. Thus there may be some marginal change in
quantity of surface runoff due to pumping.
7.3 IMPACT ON GROUNDWATER:
The area affected by washery plant is a function of impact on land surface. It is
observed that due to high infiltration impact will occur on unconfined aquifer. Study
has been done for rainfall infiltration in pre- pumping and post- pumping conditions.
The output data of modeling exercise reveals that 0.014 MCM of annual rainfall will
infiltrate during pre-pumping condition and 0.024 of annual rainfall will recharge to
system by infiltration during Post- pumping conditions. Thus, there will be net
increase in induced groundwater recharge due to pumping to the tune of 0.01 MCM
Report on Hydrogeological Study of Ghutku Coal Washery M/s Paras Power & Coal Benification Ltd.
Minjal, Nagpur
36
in Plant area. It will result in increased groundwater recharge to water system. After
the cessation of pumping, the groundwater levels will recoup and attain normalcy.
Thus, the impact on groundwater system is a temporary phenomenon.
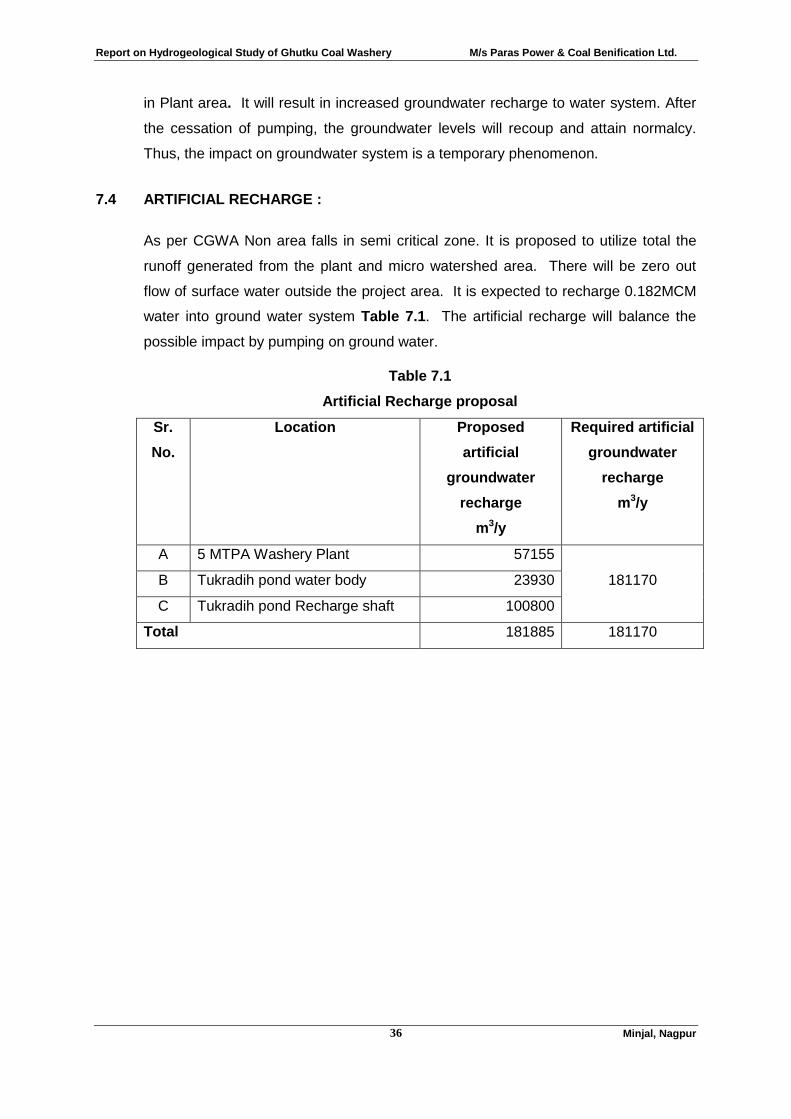
7.4 ARTIFICIAL RECHARGE :
As per CGWA Non area falls in semi critical zone. It is proposed to utilize total the
runoff generated from the plant and micro watershed area. There will be zero out
flow of surface water outside the project area. It is expected to recharge 0.182MCM
water into ground water system Table 7.1. The artificial recharge will balance the
possible impact by pumping on ground water.
Table 7.1
Artificial Recharge proposal
Sr.
No.
Location Proposed
artificial
groundwater
recharge
m3/y
Required artificial
groundwater
recharge
m3/y
A 5 MTPA Washery Plant 57155
181170 B Tukradih pond water body 23930
C Tukradih pond Recharge shaft 100800
Total 181885 181170
Report on Hydrogeological Study of Ghutku Coal Washery M/s Paras Power & Coal Benification Ltd.
Minjal, Nagpur
37
8.0 CONCLUSION
M/s Paras Power & Coal Beneficiation Limited (PPCBL) has proposed to install 2.5
MTPA Coal Washery at Ghutku village, Bilaspur District,Chhattisgarh. The washery
is based on wet process. The water requirement of 1098 m3/dwill be met from ground
water. The Chhattisgarh MOEF & CC has granted TOR for the proposed project on
06.06.2016. One of the conditions stipulated in the TOR pertains to obtaining NOC
from the Central Ground Water Authority for the ground water abstraction. A details
hydro-geological study has been carried out for the project. The main observations
and findings of the study are as follows:
1. The annual normal rainfall in the area is 1343 mm, which constitute 87 %
monsoon rainfall (1170.8 mm).
2. The three major Cherty shale & dolomite aquifer system developed in the area
are given below:
a. Unconfined aquifer having depth range of 5 to 30 m.
b. Semi-confined aquifer having depth range of 30 to 70 m.
c. Confined aquifer in the depth range of 70 to 150 m.
3. The average water level in the core zone in pre-monsoon and post-monsoon is
10.00 mbgl and 5.00 mbgl respectively. The annual fluctuation is 5 m.
4. The range of water level in the buffer zone in pre-monsoon and in post-
monsoon is 3.4–18.6 mbgl and 1.00-11.00 mbgl respectively. The annual
fluctuation is 5.01 m.
5. CGWB Hydrographic Network station at Sikri shows normal trend and indicative
of cyclic ground water recharge.
6. The groundwater flow direction is from east to westand from west to east toward
the Arpa river. The general groundwater flow is from north to south following the
path of the Arpa river. There is confluence of hydraulic gradient towards the
river in the buffer zone.
7. During pumping, there will be induced infiltration due to withdrawal of water from
the system and creation of infiltration zone. The reduction in surface flow will be
0.012 MCM. The induced infiltration in post-pumping will increase groundwater
recharge to the tune of 0.01 MCM.
8. The water table in the buffer zone is in the range of 285 m a msl to 260 m a msl.
The average hydraulic gradient of ground water flow is 2.31× 10⁻³. In the core
zone water table is in between 280 and 275m a msl.
9. The project area constitutes Cherty shale & dolomite potential aquifer to sustain
Report on Hydrogeological Study of Ghutku Coal Washery M/s Paras Power & Coal Benification Ltd.
Minjal, Nagpur
38
eight tubewells at a discharge rate of 10.8 m3/hr for 13 hr pumping in a day to
yield 1123 m3/d to abstract 1098 m3/day groundwater for the washery use. The
safe distance between two tubewells will be 110 m.
10. The groundwater resource estimation for 10 km buffer zone on annual basis has
been done following the GWRE 2011 guidelines.
- Gross recharge due to rainfall - 47.22 MCM. - Natural discharge - 2.30 MCM. - Net groundwater available - 44.86 MCM - - Annual ground water draft - 26.52 MCM - Allocation for next 25 years - 14.00 MCM. - Groundwater balance. - 4.26MCM.
- The stage ofgroundwater development - 59 % - Category of groundwater development - Safe
11. The additional withdrawal of 1098 m3/day for the proposed washery will cause
draft of 0.36 MCM. Even after considering the additional draft, groundwater
balance will be left 3.90 MCM for future use. Thus the area will remain under
the safe category on groundwater resources consideration. However, the
Takhatpur block comes under semi critical zone as per CGWA estimation.
12. The water quality of tube wells located within the project area and buffer zone
are well within the permissible limits. The washery will operate under the zero
discharge concept. There will be a sedimentation tank for reuse of waste water.
There will not be any ground water pollution due to proposed washery activity.
13. Possibility of rain water harvesting was explored. It was found that due to good
infiltration rate there will be acceptance of rainwater harvesting in the project
area with good recharge. It is planned to recharge 0.182 MCM m3/y through
Plant area and additional recharge through Turkadih pondat an estimated cost of
60 lakh including construction of two piezometers to monitor water level in and
around the project area.
14. As the area falls under the semi critical category as per CGWA and the total
requirement of groundwater is 1098 m3/day (0.36MCM), the Central Ground
Water Authority is requested to grant permission to abstract ground water with
0.182 MCM /y Rain Water Harvesting scheme to be implemented.
****