Embed Size (px)
Citation preview
ERCOT Public
ERCOT
Report on Existing and Potential Electric System Constraints and Needs
December 2017
Report on Existing and Potential Electric System Constraints and Needs ERCOT Public
© 2017 ERCOT
All rights reserved. i
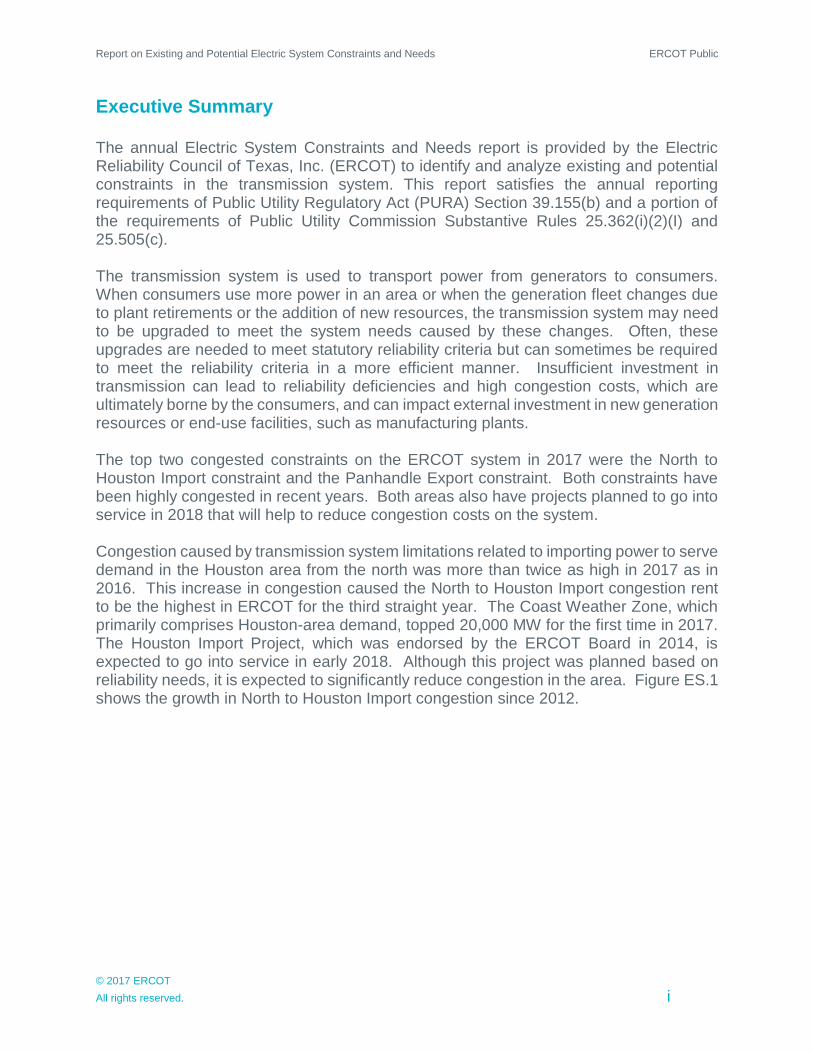
Executive Summary The annual Electric System Constraints and Needs report is provided by the Electric Reliability Council of Texas, Inc. (ERCOT) to identify and analyze existing and potential constraints in the transmission system. This report satisfies the annual reporting requirements of Public Utility Regulatory Act (PURA) Section 39.155(b) and a portion of the requirements of Public Utility Commission Substantive Rules 25.362(i)(2)(I) and 25.505(c). The transmission system is used to transport power from generators to consumers. When consumers use more power in an area or when the generation fleet changes due to plant retirements or the addition of new resources, the transmission system may need to be upgraded to meet the system needs caused by these changes. Often, these upgrades are needed to meet statutory reliability criteria but can sometimes be required to meet the reliability criteria in a more efficient manner. Insufficient investment in transmission can lead to reliability deficiencies and high congestion costs, which are ultimately borne by the consumers, and can impact external investment in new generation resources or end-use facilities, such as manufacturing plants. The top two congested constraints on the ERCOT system in 2017 were the North to Houston Import constraint and the Panhandle Export constraint. Both constraints have been highly congested in recent years. Both areas also have projects planned to go into service in 2018 that will help to reduce congestion costs on the system. Congestion caused by transmission system limitations related to importing power to serve demand in the Houston area from the north was more than twice as high in 2017 as in 2016. This increase in congestion caused the North to Houston Import congestion rent to be the highest in ERCOT for the third straight year. The Coast Weather Zone, which primarily comprises Houston-area demand, topped 20,000 MW for the first time in 2017. The Houston Import Project, which was endorsed by the ERCOT Board in 2014, is expected to go into service in early 2018. Although this project was planned based on reliability needs, it is expected to significantly reduce congestion in the area. Figure ES.1 shows the growth in North to Houston Import congestion since 2012.
Report on Existing and Potential Electric System Constraints and Needs ERCOT Public
© 2017 ERCOT
All rights reserved. ii
Figure ES.1: North to Houston Congestion Rent by Year
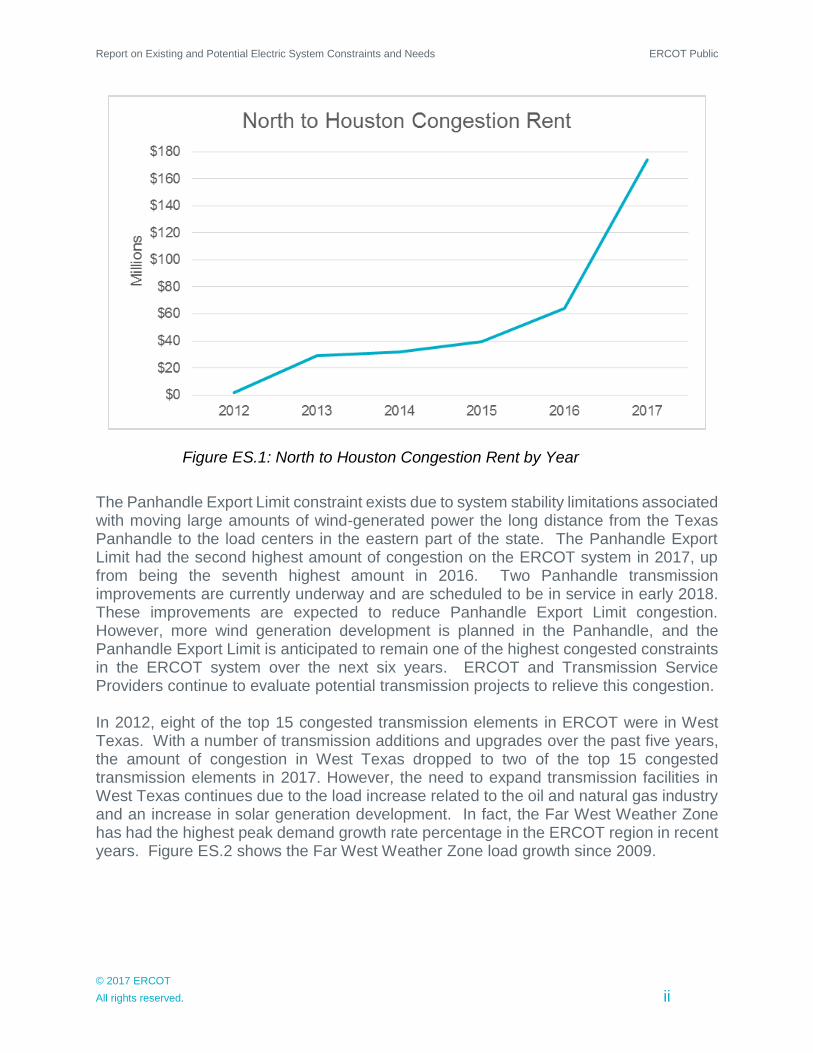
The Panhandle Export Limit constraint exists due to system stability limitations associated with moving large amounts of wind-generated power the long distance from the Texas Panhandle to the load centers in the eastern part of the state. The Panhandle Export Limit had the second highest amount of congestion on the ERCOT system in 2017, up from being the seventh highest amount in 2016. Two Panhandle transmission improvements are currently underway and are scheduled to be in service in early 2018. These improvements are expected to reduce Panhandle Export Limit congestion. However, more wind generation development is planned in the Panhandle, and the Panhandle Export Limit is anticipated to remain one of the highest congested constraints in the ERCOT system over the next six years. ERCOT and Transmission Service Providers continue to evaluate potential transmission projects to relieve this congestion. In 2012, eight of the top 15 congested transmission elements in ERCOT were in West Texas. With a number of transmission additions and upgrades over the past five years, the amount of congestion in West Texas dropped to two of the top 15 congested transmission elements in 2017. However, the need to expand transmission facilities in West Texas continues due to the load increase related to the oil and natural gas industry and an increase in solar generation development. In fact, the Far West Weather Zone has had the highest peak demand growth rate percentage in the ERCOT region in recent years. Figure ES.2 shows the Far West Weather Zone load growth since 2009.
Report on Existing and Potential Electric System Constraints and Needs ERCOT Public
© 2017 ERCOT
All rights reserved. iii
Figure ES.2: Far West Weather Zone Peak Demand by Year
Over the past two years, ERCOT and the Regional Planning Group (RPG) have reviewed and endorsed nearly $600 million of major transmission projects to serve West Texas oil and natural gas-related needs. One of these projects was the Far West Transmission Project, which the ERCOT Board endorsed in June 2017. The project, with an estimated cost of $336 million, will add more than 150 miles of new 345 kV transmission lines in areas with high growth in oil and natural gas related demand. Another area that has experienced significant load growth recently has been the Freeport area. Due to planned industrial facility additions, including the Freeport Liquefied Natural Gas facility, the Freeport area is expected to see its peak demand increase from less than 800 MW in 2014 to nearly 2,300 MW by 2022. Since 2012, CenterPoint Energy has proposed various transmission upgrade projects in the area to accommodate this growth. In 2017, the RPG reviewed the Freeport Master Plan project, which was designed to meet reliability needs in the area. The ERCOT Board endorsed the need for the project, which includes a new 345 kV line into the Freeport area, in December 2017. ERCOT performs a biennial Long-Term System Assessment (LTSA) to provide a roadmap for future transmission system expansion and identify long-term trends that should be taken into consideration in near-term planning. The 2016 LTSA identified a future trend of renewable (primarily solar) generation additions to the ERCOT grid corresponding with coal and natural gas generation retirements. In 2017, ERCOT
Report on Existing and Potential Electric System Constraints and Needs ERCOT Public
© 2017 ERCOT
All rights reserved. iv
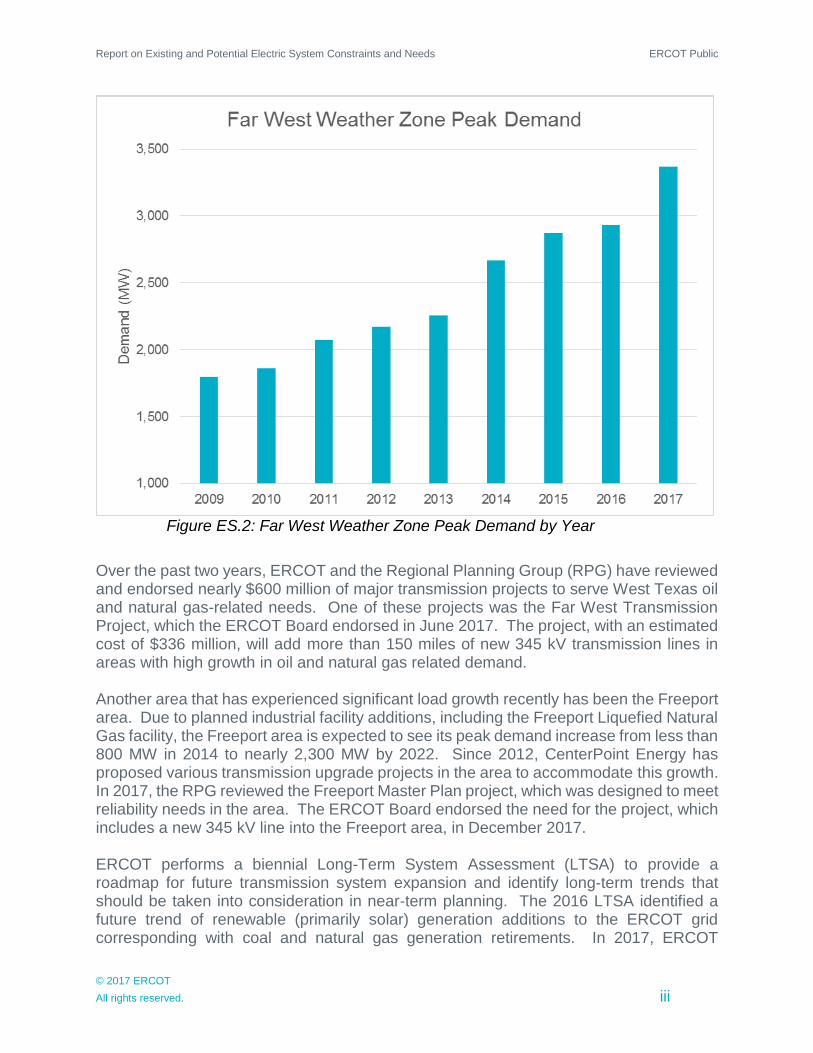
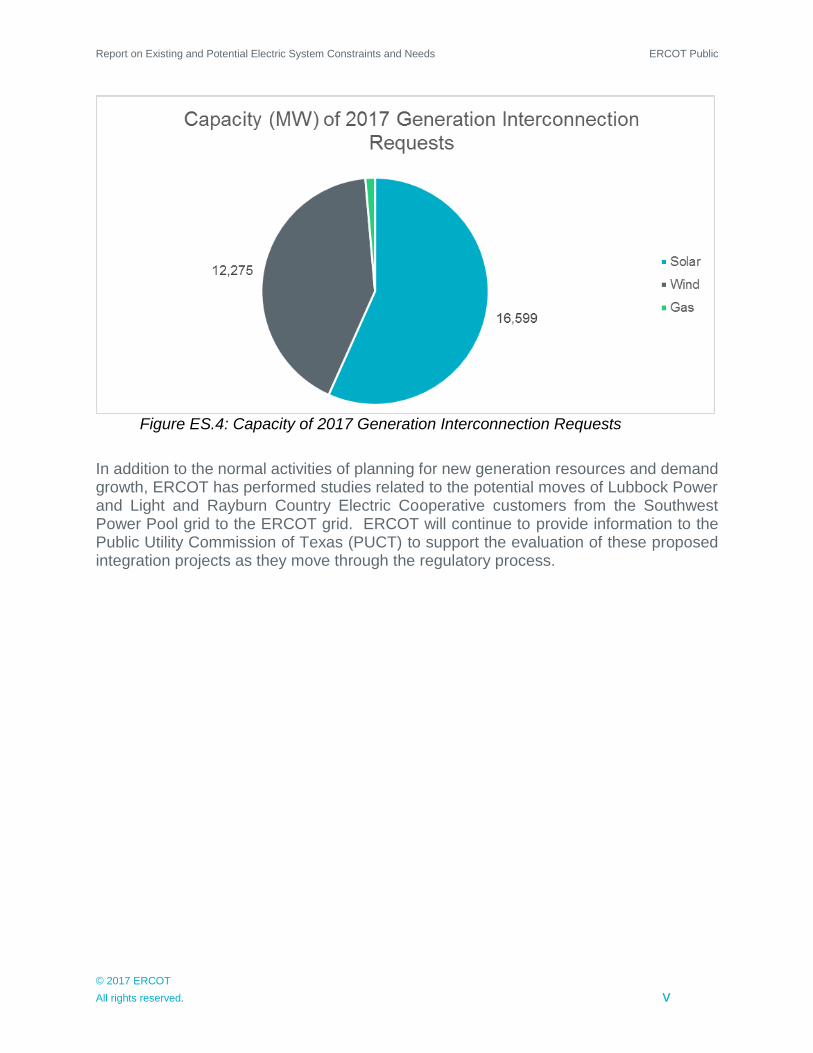
observed several markers that corroborated this trend. First, ERCOT received notification of retirement from the owners of almost 4,800 MW of coal and natural gas generation capacity. While none of the generators requesting to retire was needed to maintain local transmission system reliability, the removal of these generation resources could cause or exacerbate congestion on the ERCOT system. Second, in 2017 ERCOT received the highest number of requests in a year to study new generator interconnections. The majority of these requests were for new solar generation plants. Currently, there are more than 24,000 MWs of solar generation capacity under study, and approximately 16,000 MWs of that capacity requested study in 2017. Figure ES.3 shows the number of generator interconnection requests received per year, and Figure ES.4 shows the capacity breakdown for the requests received in 2017 (through November). The 2016 LTSA also concluded that this change in the generation mix would drive the need for additional transmission system investment to move the power across the system.
Figure ES.3: Number of Generation Interconnection Requests by Year
Report on Existing and Potential Electric System Constraints and Needs ERCOT Public
© 2017 ERCOT
All rights reserved. v
Figure ES.4: Capacity of 2017 Generation Interconnection Requests
In addition to the normal activities of planning for new generation resources and demand growth, ERCOT has performed studies related to the potential moves of Lubbock Power and Light and Rayburn Country Electric Cooperative customers from the Southwest Power Pool grid to the ERCOT grid. ERCOT will continue to provide information to the Public Utility Commission of Texas (PUCT) to support the evaluation of these proposed integration projects as they move through the regulatory process.
Report on Existing and Potential Electric System Constraints and Needs ERCOT Public
© 2017 ERCOT
All rights reserved. vi
Table of Contents Chapter 1. Introduction ............................................................................................................. 1
Chapter 2. ERCOT Transmission Planning .............................................................................. 2
Chapter 3. Recent Constraints ................................................................................................. 5
Houston Import ...................................................................................................................... 7
Panhandle Export ................................................................................................................ 11
Generic Transmission Constraints ...................................................................................... 13
Outage Related Congestion ................................................................................................ 14
Chapter 4. Planned Improvements ......................................................................................... 16
Far West Texas .................................................................................................................... 17
Freeport Area ....................................................................................................................... 20
Additional Reliability-Driven Planned Projects .................................................................... 22
Chapter 5. Projected Constraints ............................................................................................ 24
Generation Trends ............................................................................................................... 24
Projected Constraints Due to Generation Retirements ....................................................... 29
2020 and 2023 Projected Constraints ................................................................................. 29
Chapter 6. Load Integration .................................................................................................... 32
Lubbock Integration ............................................................................................................. 32
Rayburn County Electric Cooperative Integration ............................................................... 33
Chapter 7. Southern Cross ..................................................................................................... 34
Chapter 8. Contacts and Links ............................................................................................... 35
Contacts and Information ..................................................................................................... 35
Internet Links........................................................................................................................ 35
Chapter 9. Disclaimer ............................................................................................................. 36
Report on Existing and Potential Electric System Constraints and Needs ERCOT Public
© 2017 ERCOT
All rights reserved. 1
Chapter 1. Introduction
The Electric Reliability Council of Texas (ERCOT), as the independent organization (IO) under the Public Utility Regulatory Act (PURA), is charged with nondiscriminatory coordination of market transactions, systemwide transmission planning and network reliability, and ensuring the reliability and adequacy of the regional electric network in accordance with ERCOT and North American Electric Reliability Corporation (NERC) Reliability Standards. The IO ensures access to the transmission system for all buyers and sellers of electricity on nondiscriminatory terms. In addition, ERCOT, as the NERC-registered Planning Coordinator/ Planning Authority, is responsible for assessing the long-term reliability needs for the ERCOT region. ERCOT supervises and exercises comprehensive independent authority over the planning of transmission projects for the ERCOT system as outlined in PURA and Public Utility Commission of Texas (PUCT) Substantive Rules. The PUCT Substantive Rules further indicate that the IO shall evaluate and make a recommendation to the PUCT as to the need for any transmission facility over which the IO has comprehensive transmission planning authority. ERCOT examines the need for proposed transmission projects based on ERCOT planning criteria and NERC Reliability Standards. Once a project need has been identified ERCOT evaluates project alternatives based on cost-effectiveness, long-term system needs and other factors. Transmission planning (i.e., planning of facilities 60 kV and above) is a complex undertaking that requires significant work by, and coordination between, ERCOT, the Transmission Service Providers (TSP), stakeholders, and other market participants. ERCOT works directly with the TSPs, stakeholders, and market participants through the Regional Planning Group (RPG). Each of these entities has responsibilities to ensure that appropriate transmission planning and construction occurs. The ERCOT Nodal Protocols and Planning Guide describe the practices and procedures through which ERCOT meets its requirements related to system planning under PURA, PUCT Substantive Rules, and NERC Reliability Standards.
Report on Existing and Potential Electric System Constraints and Needs ERCOT Public
© 2017 ERCOT
All rights reserved. 2
Chapter 2. ERCOT Transmission Planning
Every year ERCOT performs a planning assessment of the transmission system. This assessment is primarily based on three sets of studies.
1. The Regional Transmission Plan (RTP) addresses region-wide reliability and
economic transmission needs and includes the recommendation of specific
planned improvements to meet those needs for the upcoming six years. The public
version of the 2017 RTP report is posted on the ERCOT website at:
http://www.ercot.com/news/presentations/.
2. The Long-Term System Assessment (LTSA) uses scenario-analysis techniques to
assess the potential needs of the ERCOT system up to 15 years into the future.
The role of the LTSA is to provide a roadmap for future transmission system
expansion and identify long-term trends that should be taken into consideration in
near-term planning. The biennial LTSA study is conducted in even-numbered
years. The 2016 Long-Term System Assessment report is posted on the ERCOT
website at: http://www.ercot.com/news/presentations/.
3. Stability studies are performed to assess the angular stability, voltage stability, and
frequency response of the ERCOT system. Due to the security-related sensitive
nature of the information contained in these study reports, they are not published
on the ERCOT website.
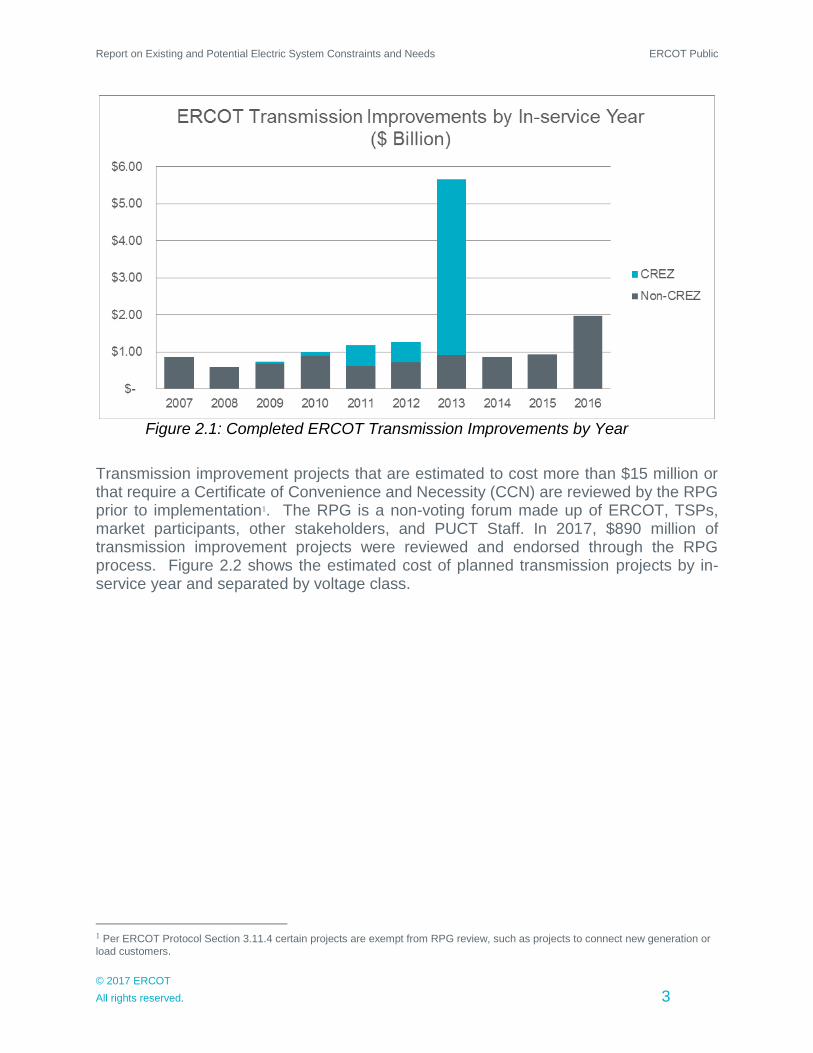
These Transmission Planning studies are conducted using models that represent expected future transmission topology, demand, and generation. The models are tested against reliability and economic planning criteria per NERC Reliability Standards and the ERCOT Protocols and Planning Guide. When system simulations indicate a deficiency in meeting the criteria, a corrective action plan is developed; this corrective action plan typically includes a planned transmission improvement project. TSPs also perform studies to assess the reliability of their portions of the ERCOT system. Transmission system improvements are built by TSPs and are paid for by consumers. During the twelve-month period from October 2016 through September 2017, TSPs completed $1.09 billion worth of transmission improvement projects. Figure 2.1 shows the cost of transmission improvements completed in ERCOT, by calendar year, from 2007 through 2016. The cost is separated by Competitive Renewable Energy Zone (CREZ)-related projects and non-CREZ-related projects. The non-CREZ-related transmission improvement costs in 2016 were notably higher than previous years due, in part, to the completion of two large projects located in the Lower Rio Grande Valley that accounted for approximately $649 million of the total.
Report on Existing and Potential Electric System Constraints and Needs ERCOT Public
© 2017 ERCOT
All rights reserved. 3
Figure 2.1: Completed ERCOT Transmission Improvements by Year
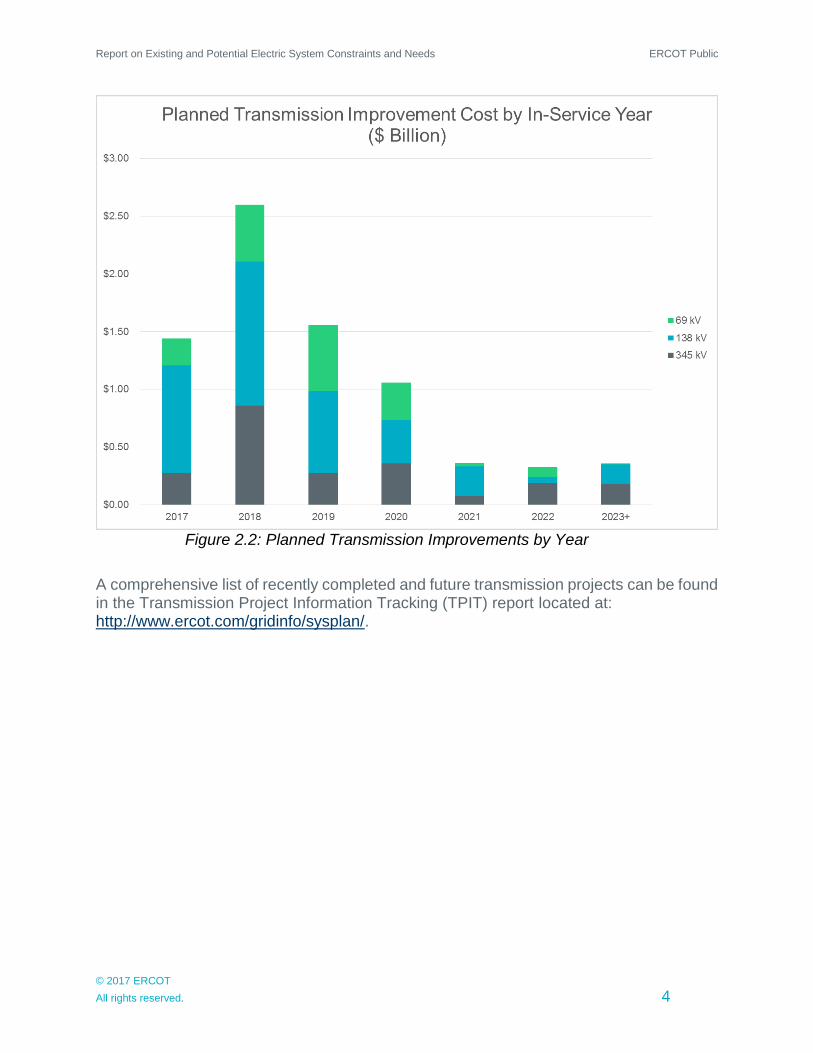
Transmission improvement projects that are estimated to cost more than $15 million or that require a Certificate of Convenience and Necessity (CCN) are reviewed by the RPG prior to implementation1. The RPG is a non-voting forum made up of ERCOT, TSPs, market participants, other stakeholders, and PUCT Staff. In 2017, $890 million of transmission improvement projects were reviewed and endorsed through the RPG process. Figure 2.2 shows the estimated cost of planned transmission projects by in-service year and separated by voltage class.
1 Per ERCOT Protocol Section 3.11.4 certain projects are exempt from RPG review, such as projects to connect new generation or
load customers.
Report on Existing and Potential Electric System Constraints and Needs ERCOT Public
© 2017 ERCOT
All rights reserved. 4
Figure 2.2: Planned Transmission Improvements by Year
A comprehensive list of recently completed and future transmission projects can be found in the Transmission Project Information Tracking (TPIT) report located at: http://www.ercot.com/gridinfo/sysplan/.
Report on Existing and Potential Electric System Constraints and Needs ERCOT Public
© 2017 ERCOT
All rights reserved. 5
Chapter 3. Recent Constraints
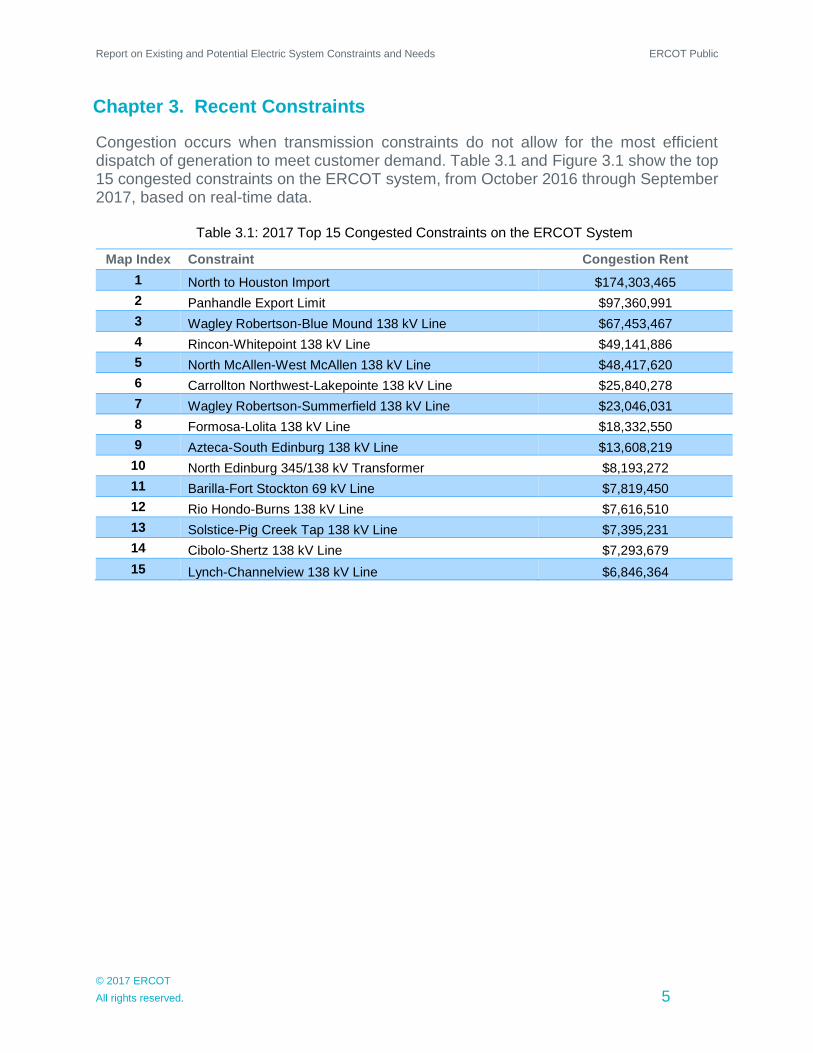
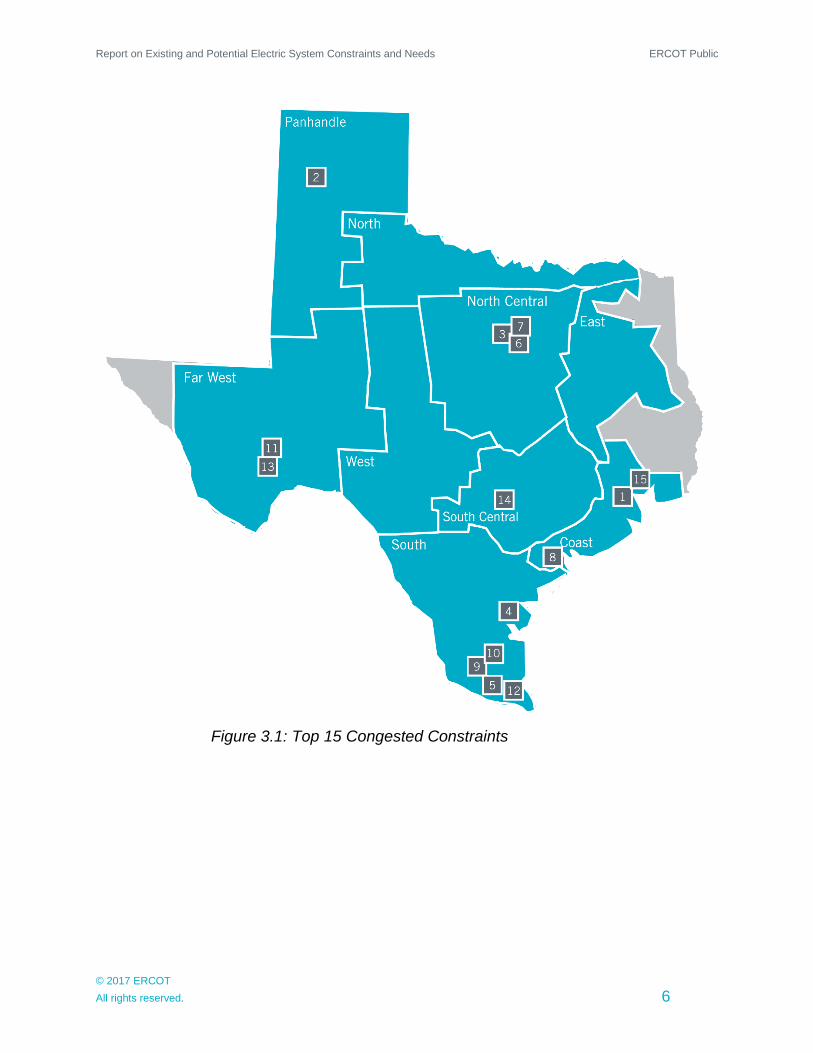
Congestion occurs when transmission constraints do not allow for the most efficient dispatch of generation to meet customer demand. Table 3.1 and Figure 3.1 show the top 15 congested constraints on the ERCOT system, from October 2016 through September 2017, based on real-time data.
Table 3.1: 2017 Top 15 Congested Constraints on the ERCOT System
Map Index Constraint Congestion Rent
1 North to Houston Import $174,303,465
2 Panhandle Export Limit $97,360,991
3 Wagley Robertson-Blue Mound 138 kV Line $67,453,467
4 Rincon-Whitepoint 138 kV Line $49,141,886
5 North McAllen-West McAllen 138 kV Line $48,417,620
6 Carrollton Northwest-Lakepointe 138 kV Line $25,840,278
7 Wagley Robertson-Summerfield 138 kV Line $23,046,031
8 Formosa-Lolita 138 kV Line $18,332,550
9 Azteca-South Edinburg 138 kV Line $13,608,219
10 North Edinburg 345/138 kV Transformer $8,193,272
11 Barilla-Fort Stockton 69 kV Line $7,819,450
12 Rio Hondo-Burns 138 kV Line $7,616,510
13 Solstice-Pig Creek Tap 138 kV Line $7,395,231
14 Cibolo-Shertz 138 kV Line $7,293,679
15 Lynch-Channelview 138 kV Line $6,846,364
Report on Existing and Potential Electric System Constraints and Needs ERCOT Public
© 2017 ERCOT
All rights reserved. 6
Figure 3.1: Top 15 Congested Constraints
Report on Existing and Potential Electric System Constraints and Needs ERCOT Public
© 2017 ERCOT
All rights reserved. 7
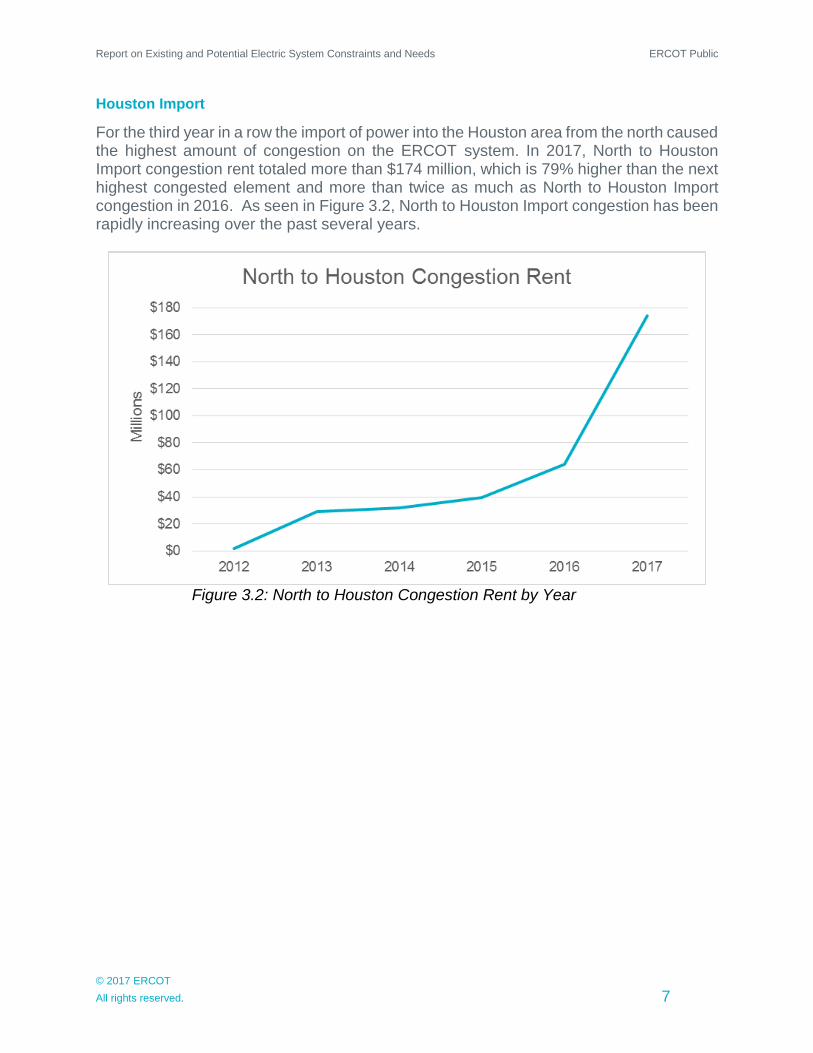
Houston Import
For the third year in a row the import of power into the Houston area from the north caused the highest amount of congestion on the ERCOT system. In 2017, North to Houston Import congestion rent totaled more than $174 million, which is 79% higher than the next highest congested element and more than twice as much as North to Houston Import congestion in 2016. As seen in Figure 3.2, North to Houston Import congestion has been rapidly increasing over the past several years.
Figure 3.2: North to Houston Congestion Rent by Year
Report on Existing and Potential Electric System Constraints and Needs ERCOT Public
© 2017 ERCOT
All rights reserved. 8
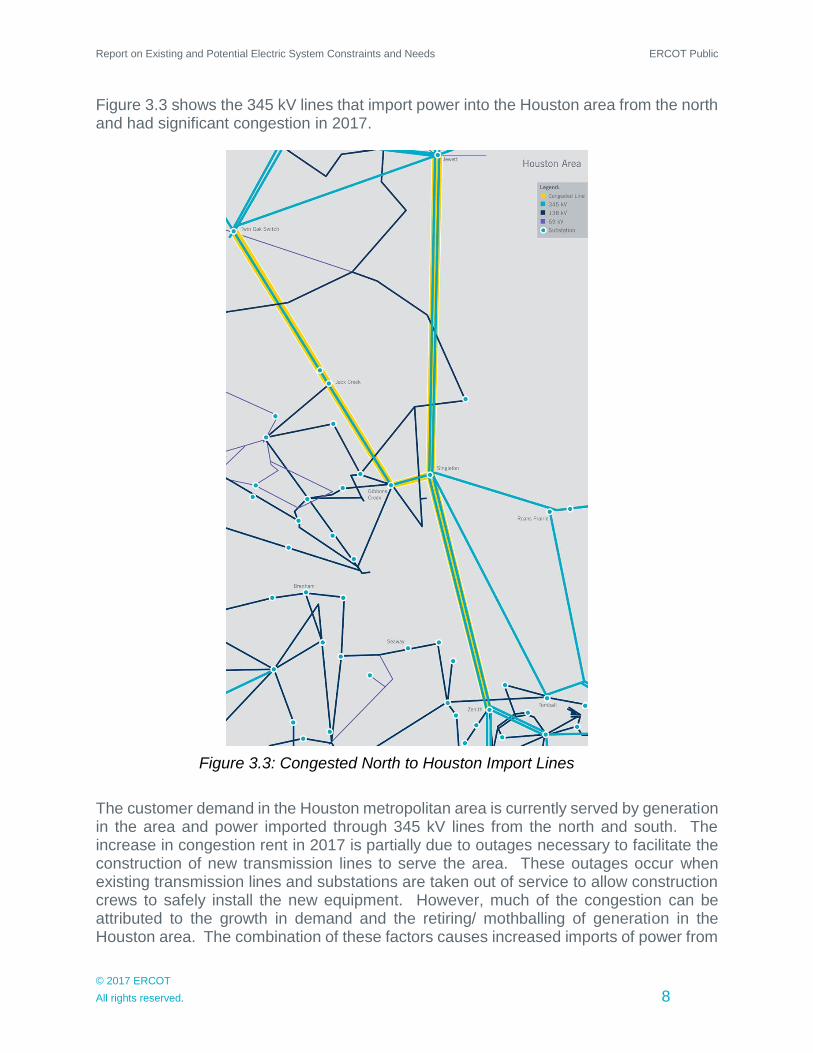
Figure 3.3 shows the 345 kV lines that import power into the Houston area from the north and had significant congestion in 2017.
Figure 3.3: Congested North to Houston Import Lines
The customer demand in the Houston metropolitan area is currently served by generation in the area and power imported through 345 kV lines from the north and south. The increase in congestion rent in 2017 is partially due to outages necessary to facilitate the construction of new transmission lines to serve the area. These outages occur when existing transmission lines and substations are taken out of service to allow construction crews to safely install the new equipment. However, much of the congestion can be attributed to the growth in demand and the retiring/ mothballing of generation in the Houston area. The combination of these factors causes increased imports of power from
Report on Existing and Potential Electric System Constraints and Needs ERCOT Public
© 2017 ERCOT
All rights reserved. 9
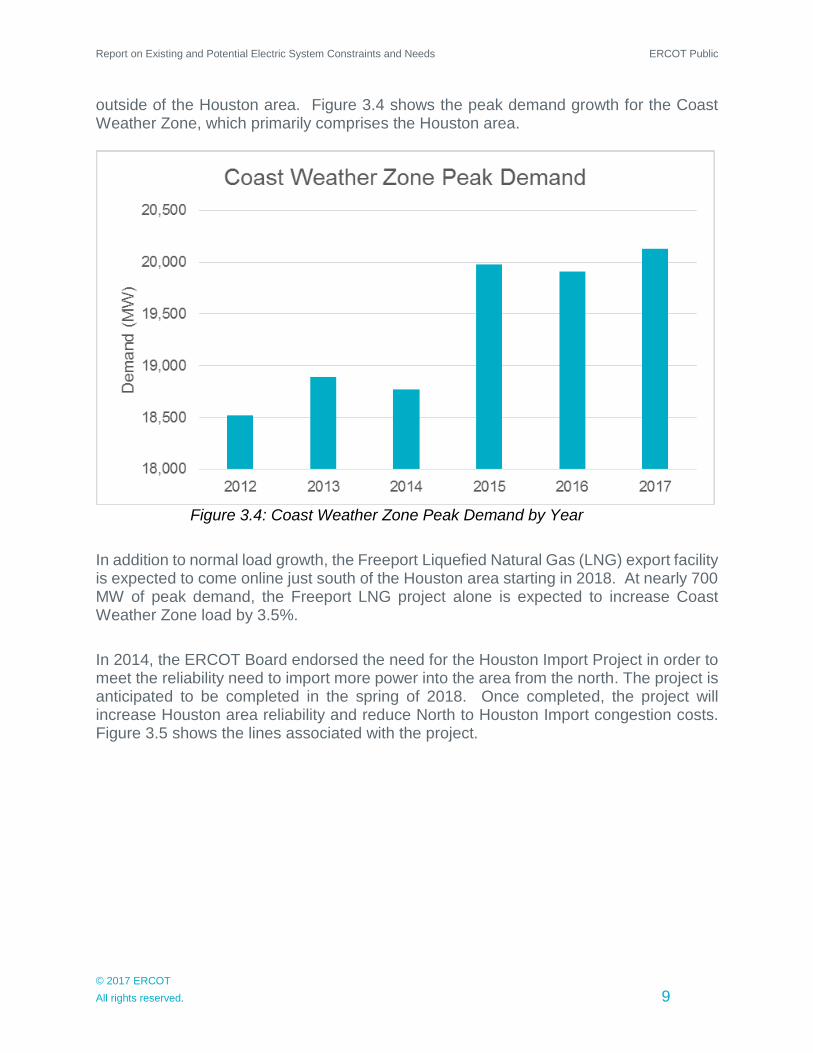
outside of the Houston area. Figure 3.4 shows the peak demand growth for the Coast Weather Zone, which primarily comprises the Houston area.
Figure 3.4: Coast Weather Zone Peak Demand by Year
In addition to normal load growth, the Freeport Liquefied Natural Gas (LNG) export facility is expected to come online just south of the Houston area starting in 2018. At nearly 700 MW of peak demand, the Freeport LNG project alone is expected to increase Coast Weather Zone load by 3.5%.
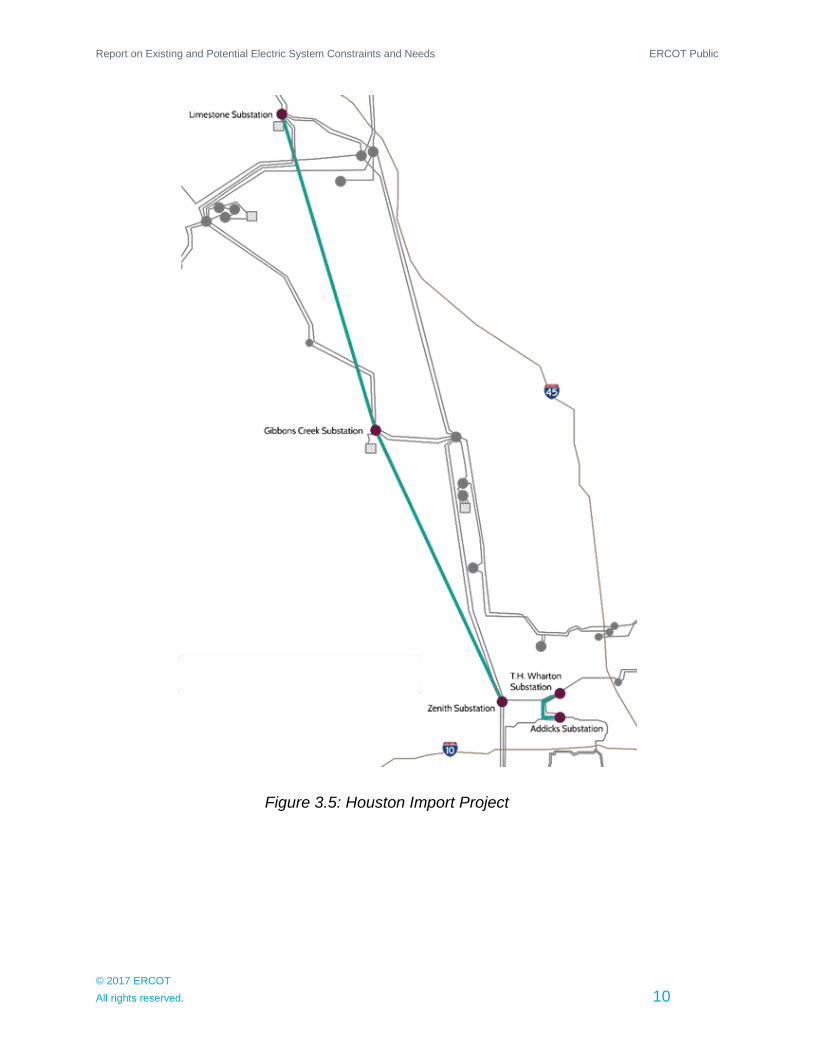
In 2014, the ERCOT Board endorsed the need for the Houston Import Project in order to meet the reliability need to import more power into the area from the north. The project is anticipated to be completed in the spring of 2018. Once completed, the project will increase Houston area reliability and reduce North to Houston Import congestion costs. Figure 3.5 shows the lines associated with the project.
Report on Existing and Potential Electric System Constraints and Needs ERCOT Public
© 2017 ERCOT
All rights reserved. 10
Figure 3.5: Houston Import Project
Report on Existing and Potential Electric System Constraints and Needs ERCOT Public
© 2017 ERCOT
All rights reserved. 11
Panhandle Export
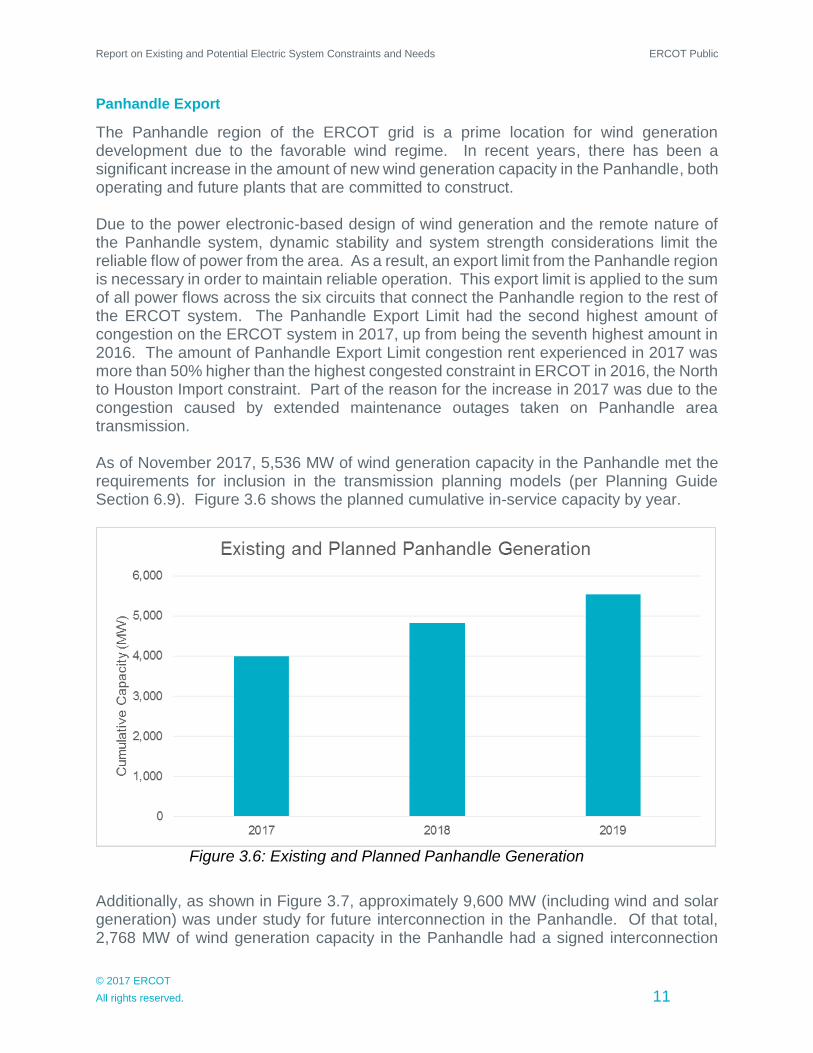
The Panhandle region of the ERCOT grid is a prime location for wind generation development due to the favorable wind regime. In recent years, there has been a significant increase in the amount of new wind generation capacity in the Panhandle, both operating and future plants that are committed to construct. Due to the power electronic-based design of wind generation and the remote nature of the Panhandle system, dynamic stability and system strength considerations limit the reliable flow of power from the area. As a result, an export limit from the Panhandle region is necessary in order to maintain reliable operation. This export limit is applied to the sum of all power flows across the six circuits that connect the Panhandle region to the rest of the ERCOT system. The Panhandle Export Limit had the second highest amount of congestion on the ERCOT system in 2017, up from being the seventh highest amount in 2016. The amount of Panhandle Export Limit congestion rent experienced in 2017 was more than 50% higher than the highest congested constraint in ERCOT in 2016, the North to Houston Import constraint. Part of the reason for the increase in 2017 was due to the congestion caused by extended maintenance outages taken on Panhandle area transmission. As of November 2017, 5,536 MW of wind generation capacity in the Panhandle met the requirements for inclusion in the transmission planning models (per Planning Guide Section 6.9). Figure 3.6 shows the planned cumulative in-service capacity by year.
Figure 3.6: Existing and Planned Panhandle Generation
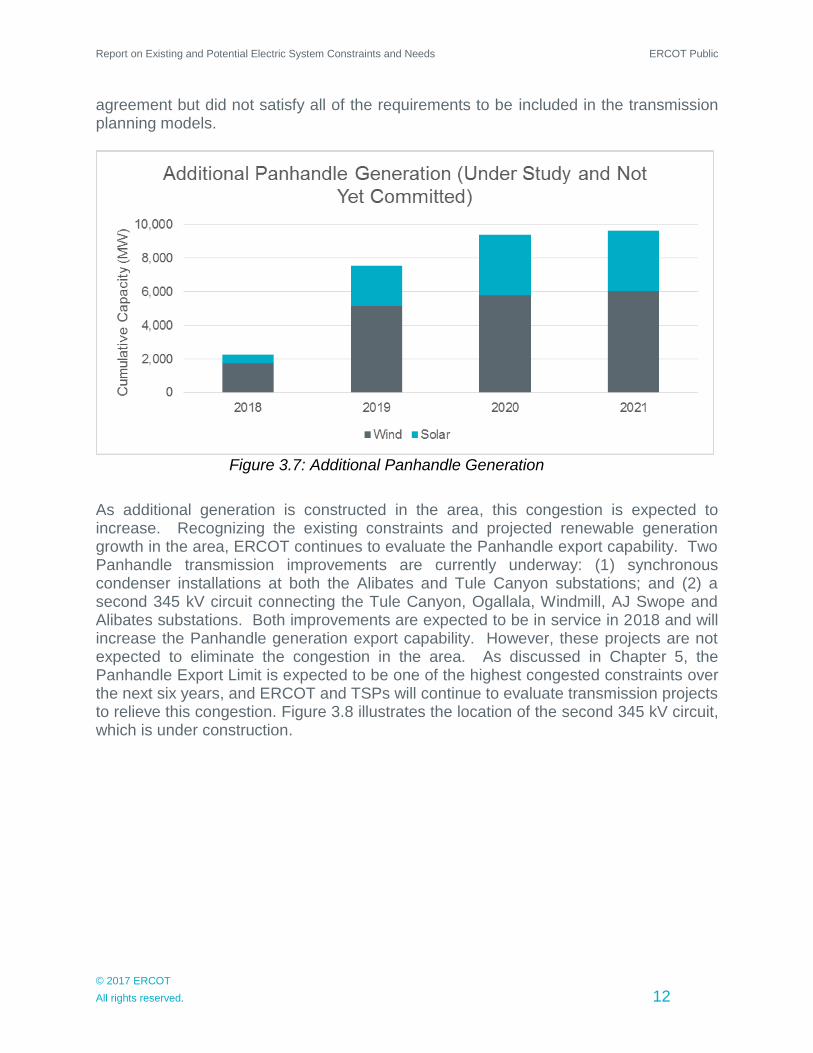
Additionally, as shown in Figure 3.7, approximately 9,600 MW (including wind and solar generation) was under study for future interconnection in the Panhandle. Of that total, 2,768 MW of wind generation capacity in the Panhandle had a signed interconnection
Report on Existing and Potential Electric System Constraints and Needs ERCOT Public
© 2017 ERCOT
All rights reserved. 12
agreement but did not satisfy all of the requirements to be included in the transmission planning models.
Figure 3.7: Additional Panhandle Generation
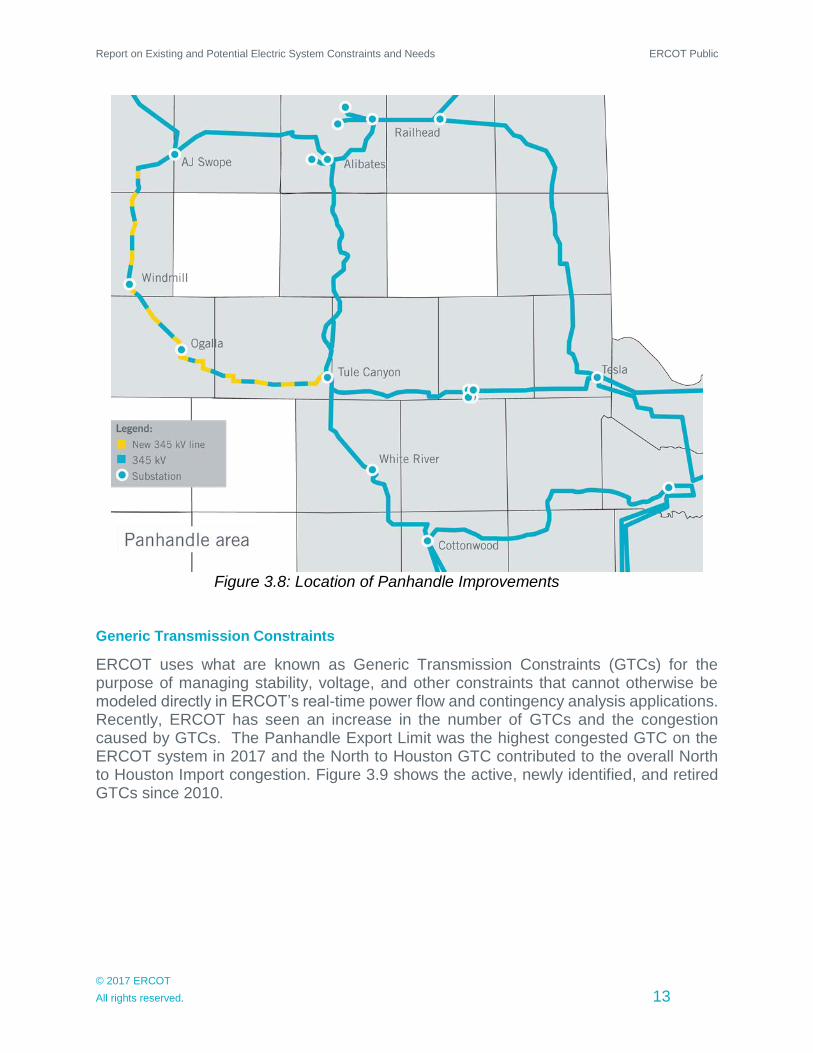
As additional generation is constructed in the area, this congestion is expected to increase. Recognizing the existing constraints and projected renewable generation growth in the area, ERCOT continues to evaluate the Panhandle export capability. Two Panhandle transmission improvements are currently underway: (1) synchronous condenser installations at both the Alibates and Tule Canyon substations; and (2) a second 345 kV circuit connecting the Tule Canyon, Ogallala, Windmill, AJ Swope and Alibates substations. Both improvements are expected to be in service in 2018 and will increase the Panhandle generation export capability. However, these projects are not expected to eliminate the congestion in the area. As discussed in Chapter 5, the Panhandle Export Limit is expected to be one of the highest congested constraints over the next six years, and ERCOT and TSPs will continue to evaluate transmission projects to relieve this congestion. Figure 3.8 illustrates the location of the second 345 kV circuit, which is under construction.
Report on Existing and Potential Electric System Constraints and Needs ERCOT Public
© 2017 ERCOT
All rights reserved. 13
Figure 3.8: Location of Panhandle Improvements
Generic Transmission Constraints
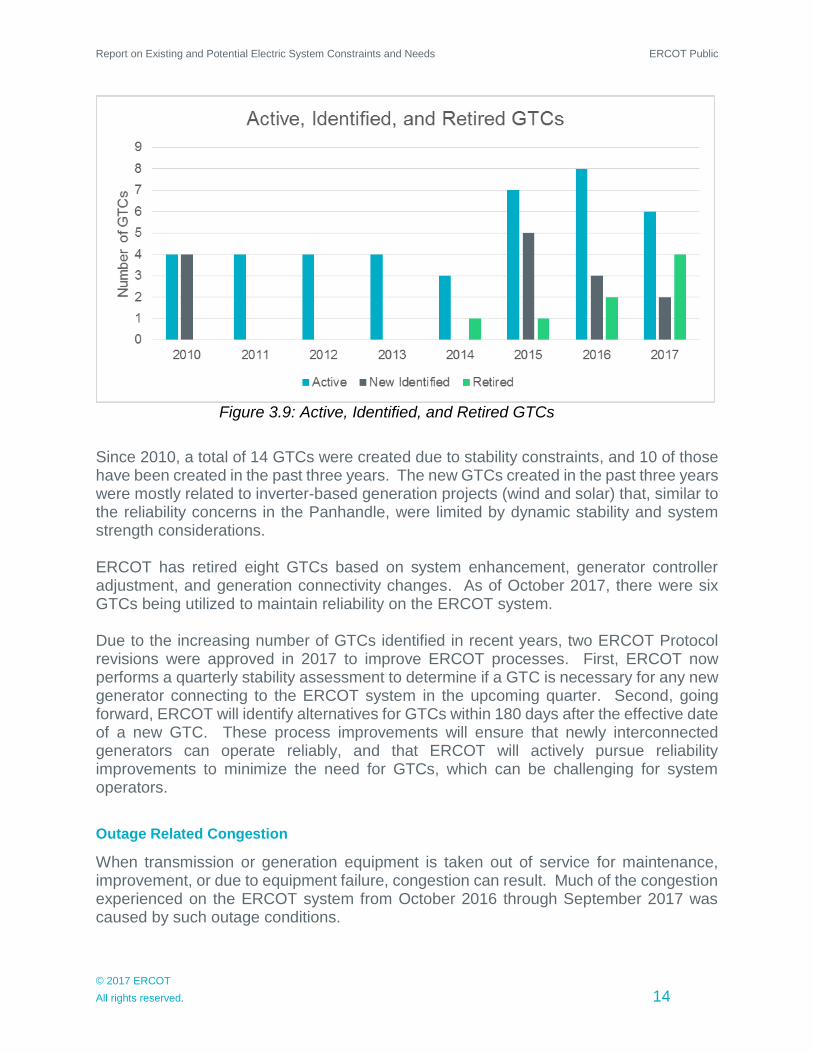
ERCOT uses what are known as Generic Transmission Constraints (GTCs) for the purpose of managing stability, voltage, and other constraints that cannot otherwise be modeled directly in ERCOT’s real-time power flow and contingency analysis applications. Recently, ERCOT has seen an increase in the number of GTCs and the congestion caused by GTCs. The Panhandle Export Limit was the highest congested GTC on the ERCOT system in 2017 and the North to Houston GTC contributed to the overall North to Houston Import congestion. Figure 3.9 shows the active, newly identified, and retired GTCs since 2010.
Report on Existing and Potential Electric System Constraints and Needs ERCOT Public
© 2017 ERCOT
All rights reserved. 14
Figure 3.9: Active, Identified, and Retired GTCs
Since 2010, a total of 14 GTCs were created due to stability constraints, and 10 of those have been created in the past three years. The new GTCs created in the past three years were mostly related to inverter-based generation projects (wind and solar) that, similar to the reliability concerns in the Panhandle, were limited by dynamic stability and system strength considerations. ERCOT has retired eight GTCs based on system enhancement, generator controller adjustment, and generation connectivity changes. As of October 2017, there were six GTCs being utilized to maintain reliability on the ERCOT system. Due to the increasing number of GTCs identified in recent years, two ERCOT Protocol revisions were approved in 2017 to improve ERCOT processes. First, ERCOT now performs a quarterly stability assessment to determine if a GTC is necessary for any new generator connecting to the ERCOT system in the upcoming quarter. Second, going forward, ERCOT will identify alternatives for GTCs within 180 days after the effective date of a new GTC. These process improvements will ensure that newly interconnected generators can operate reliably, and that ERCOT will actively pursue reliability improvements to minimize the need for GTCs, which can be challenging for system operators.
Outage Related Congestion
When transmission or generation equipment is taken out of service for maintenance, improvement, or due to equipment failure, congestion can result. Much of the congestion experienced on the ERCOT system from October 2016 through September 2017 was caused by such outage conditions.
Report on Existing and Potential Electric System Constraints and Needs ERCOT Public
© 2017 ERCOT
All rights reserved. 15
In addition to outages contributing to the top two constraints, North to Houston Import and Panhandle Export Limit, the seventh highest amount of congestion on the ERCOT system was primarily driven by outages in the Tarrant County area. Specifically, the upgrade of the Eagle Mountain-Wagley Robertson-Saginaw 138 kV line resulted in outages that contributed to the congestion experienced on the Wagley Robertson-Summerfield 138 kV line. This upgrade was completed in the summer of 2017. The nearby Wagley Robertson-Blue Mound 138 kV line congestion was not caused by outages but rather by high wind and high load conditions. ERCOT recommended upgrading this line in the 2017 RTP. In addition to this upgrade, the 2017 RTP also identified the need for a reconfiguration of the 138 kV lines from Hicks Switch to Alliance to Roanoke. Both of these projects will help mitigate congestion in this area; however, the Hicks Switch area upgrades are not anticipated to be completed prior to 2022. The other area that experienced a significant amount of outage related congestion was the Lower Rio Grande Valley. Congestion experienced on the North McAllen-West McAllen 138 kV line, Azteca-South Edinburg 138 kV line, and North Edinburg 345/138 kV transformer, can be linked to outages on generation at North Edinburg and McAllen area transmission system improvements. The Hidalgo-Starr Transmission Project, which was endorsed by the ERCOT Board in June 2016 and is planned to go in service by 2020, is expected to help relieve congestion in the area when there are outages.
Report on Existing and Potential Electric System Constraints and Needs ERCOT Public
© 2017 ERCOT
All rights reserved. 16
Chapter 4. Planned Improvements
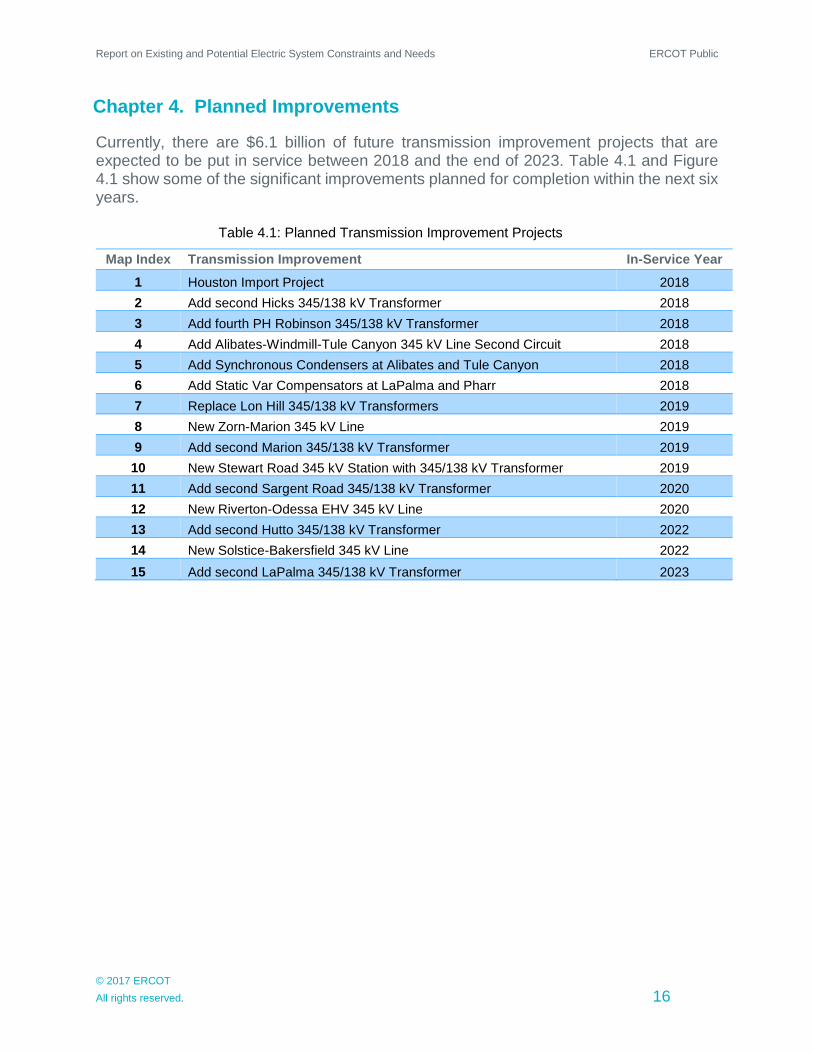
Currently, there are $6.1 billion of future transmission improvement projects that are expected to be put in service between 2018 and the end of 2023. Table 4.1 and Figure 4.1 show some of the significant improvements planned for completion within the next six years.
Table 4.1: Planned Transmission Improvement Projects
Map Index Transmission Improvement In-Service Year
1 Houston Import Project 2018
2 Add second Hicks 345/138 kV Transformer 2018
3 Add fourth PH Robinson 345/138 kV Transformer 2018
4 Add Alibates-Windmill-Tule Canyon 345 kV Line Second Circuit 2018
5 Add Synchronous Condensers at Alibates and Tule Canyon 2018
6 Add Static Var Compensators at LaPalma and Pharr 2018
7 Replace Lon Hill 345/138 kV Transformers 2019
8 New Zorn-Marion 345 kV Line 2019
9 Add second Marion 345/138 kV Transformer 2019
10 New Stewart Road 345 kV Station with 345/138 kV Transformer 2019
11 Add second Sargent Road 345/138 kV Transformer 2020
12 New Riverton-Odessa EHV 345 kV Line 2020
13 Add second Hutto 345/138 kV Transformer 2022
14 New Solstice-Bakersfield 345 kV Line 2022
15 Add second LaPalma 345/138 kV Transformer 2023
Report on Existing and Potential Electric System Constraints and Needs ERCOT Public
© 2017 ERCOT
All rights reserved. 17
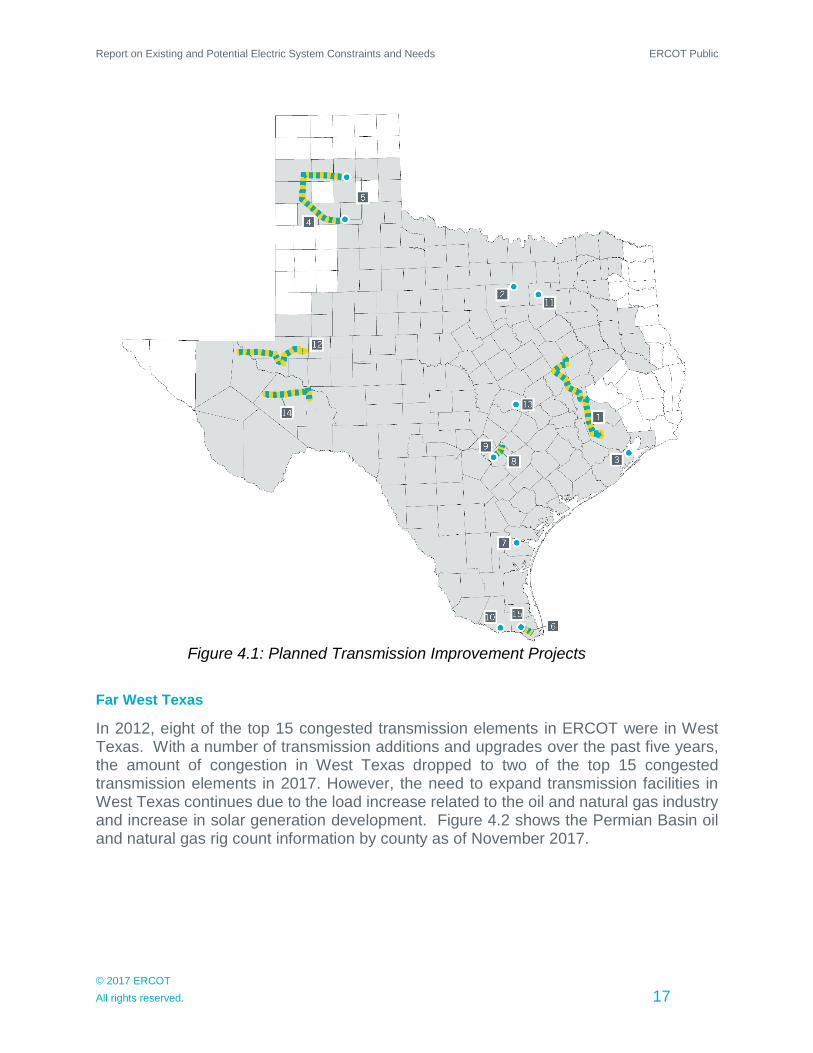
Figure 4.1: Planned Transmission Improvement Projects
Far West Texas
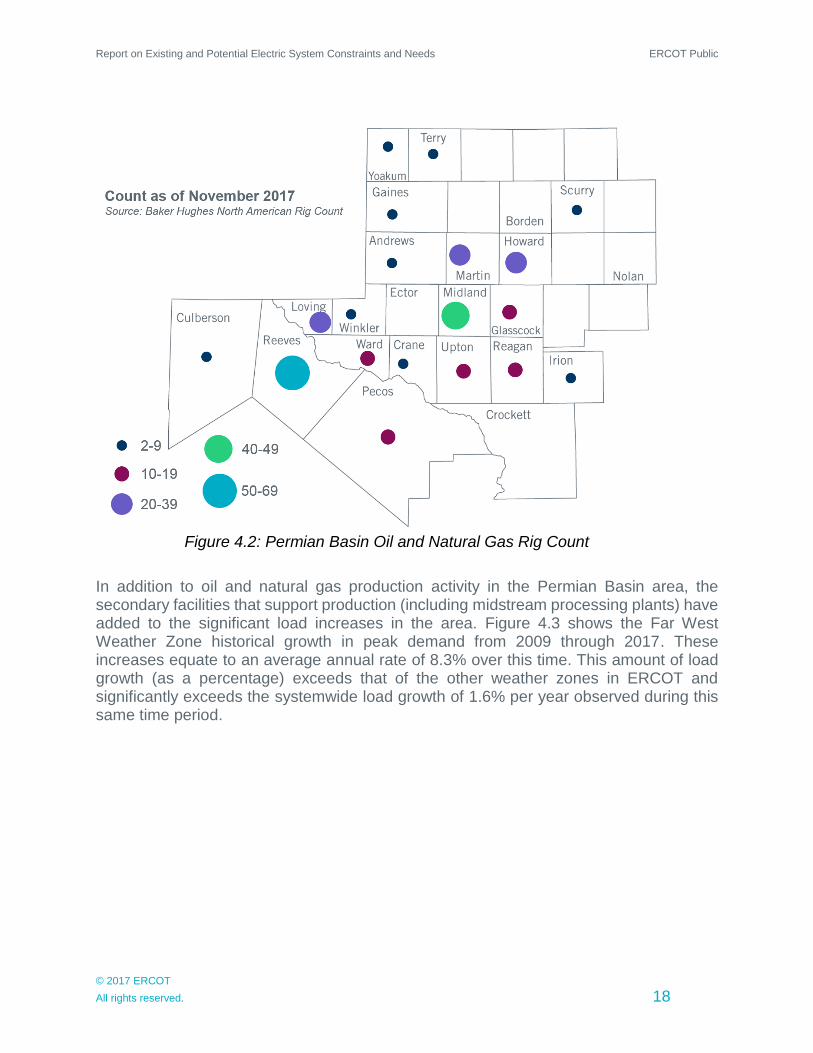
In 2012, eight of the top 15 congested transmission elements in ERCOT were in West Texas. With a number of transmission additions and upgrades over the past five years, the amount of congestion in West Texas dropped to two of the top 15 congested transmission elements in 2017. However, the need to expand transmission facilities in West Texas continues due to the load increase related to the oil and natural gas industry and increase in solar generation development. Figure 4.2 shows the Permian Basin oil and natural gas rig count information by county as of November 2017.
Report on Existing and Potential Electric System Constraints and Needs ERCOT Public
© 2017 ERCOT
All rights reserved. 18
Figure 4.2: Permian Basin Oil and Natural Gas Rig Count
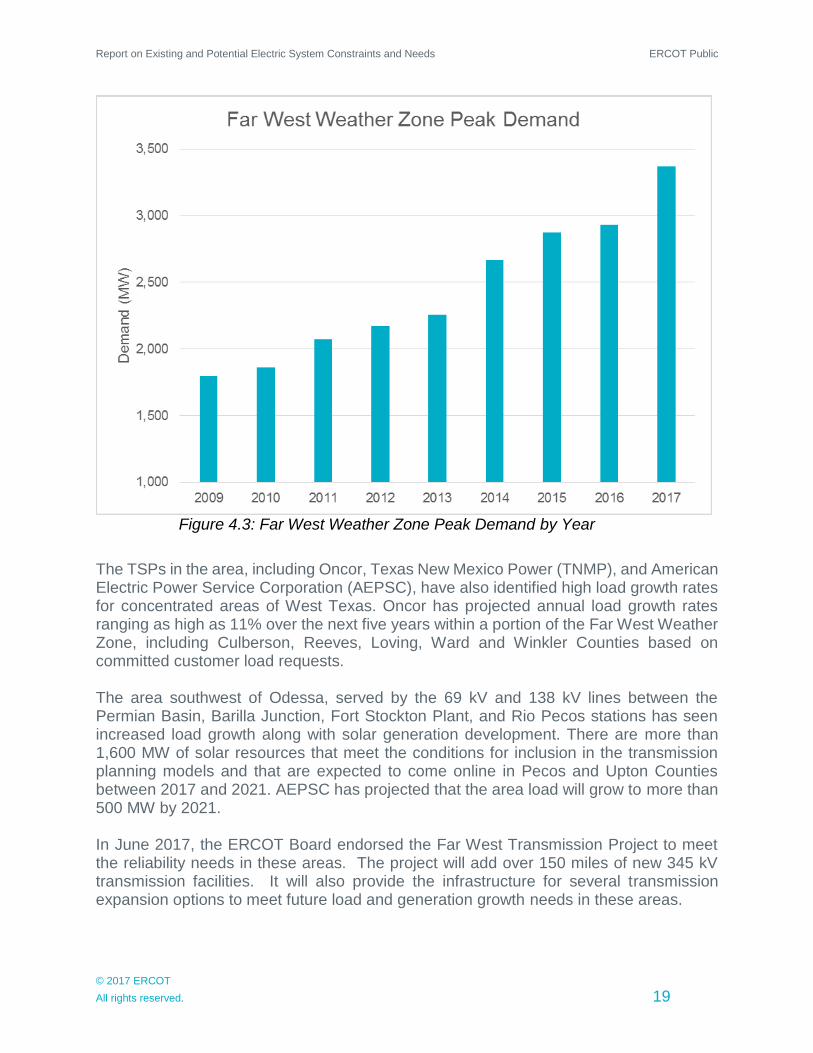
In addition to oil and natural gas production activity in the Permian Basin area, the secondary facilities that support production (including midstream processing plants) have added to the significant load increases in the area. Figure 4.3 shows the Far West Weather Zone historical growth in peak demand from 2009 through 2017. These increases equate to an average annual rate of 8.3% over this time. This amount of load growth (as a percentage) exceeds that of the other weather zones in ERCOT and significantly exceeds the systemwide load growth of 1.6% per year observed during this same time period.
Report on Existing and Potential Electric System Constraints and Needs ERCOT Public
© 2017 ERCOT
All rights reserved. 19
Figure 4.3: Far West Weather Zone Peak Demand by Year
The TSPs in the area, including Oncor, Texas New Mexico Power (TNMP), and American Electric Power Service Corporation (AEPSC), have also identified high load growth rates for concentrated areas of West Texas. Oncor has projected annual load growth rates ranging as high as 11% over the next five years within a portion of the Far West Weather Zone, including Culberson, Reeves, Loving, Ward and Winkler Counties based on committed customer load requests. The area southwest of Odessa, served by the 69 kV and 138 kV lines between the Permian Basin, Barilla Junction, Fort Stockton Plant, and Rio Pecos stations has seen increased load growth along with solar generation development. There are more than 1,600 MW of solar resources that meet the conditions for inclusion in the transmission planning models and that are expected to come online in Pecos and Upton Counties between 2017 and 2021. AEPSC has projected that the area load will grow to more than 500 MW by 2021. In June 2017, the ERCOT Board endorsed the Far West Transmission Project to meet the reliability needs in these areas. The project will add over 150 miles of new 345 kV transmission facilities. It will also provide the infrastructure for several transmission expansion options to meet future load and generation growth needs in these areas.
Report on Existing and Potential Electric System Constraints and Needs ERCOT Public
© 2017 ERCOT
All rights reserved. 20
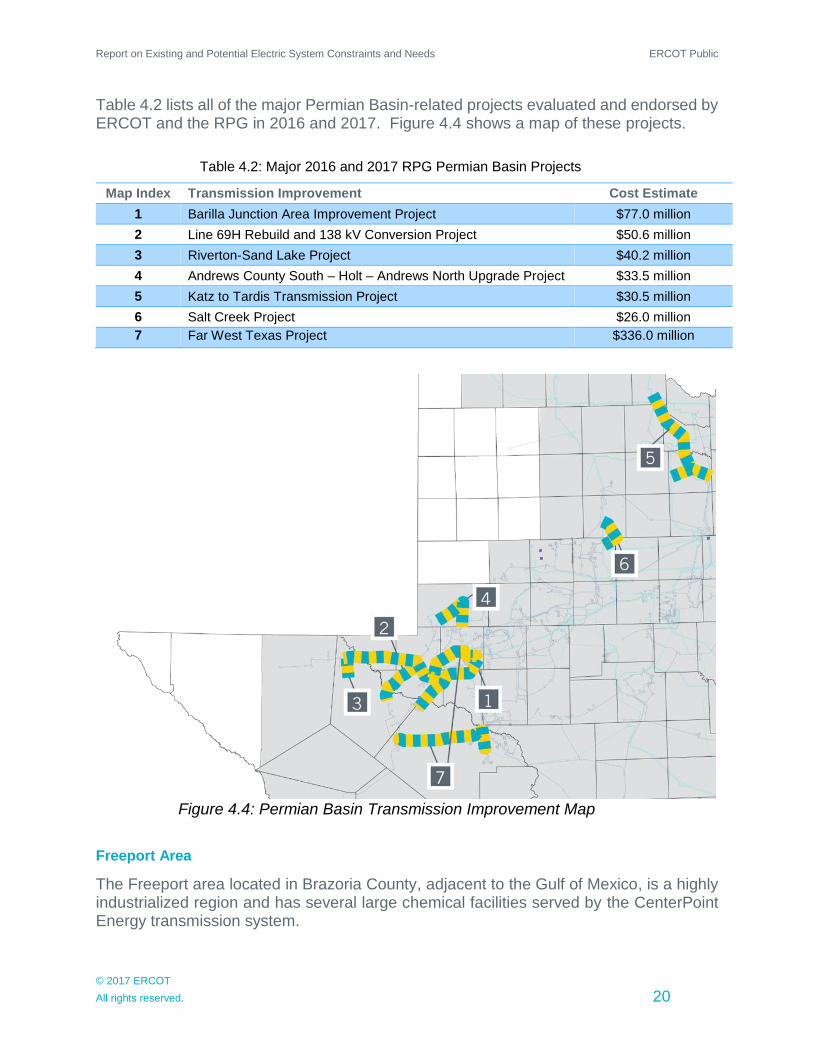
Table 4.2 lists all of the major Permian Basin-related projects evaluated and endorsed by ERCOT and the RPG in 2016 and 2017. Figure 4.4 shows a map of these projects.
Table 4.2: Major 2016 and 2017 RPG Permian Basin Projects
Map Index Transmission Improvement Cost Estimate
1 Barilla Junction Area Improvement Project $77.0 million
2 Line 69H Rebuild and 138 kV Conversion Project $50.6 million
3 Riverton-Sand Lake Project $40.2 million
4 Andrews County South – Holt – Andrews North Upgrade Project $33.5 million
5 Katz to Tardis Transmission Project $30.5 million
6 Salt Creek Project $26.0 million
7 Far West Texas Project $336.0 million
Figure 4.4: Permian Basin Transmission Improvement Map
Freeport Area
The Freeport area located in Brazoria County, adjacent to the Gulf of Mexico, is a highly industrialized region and has several large chemical facilities served by the CenterPoint Energy transmission system.
Report on Existing and Potential Electric System Constraints and Needs ERCOT Public
© 2017 ERCOT
All rights reserved. 21
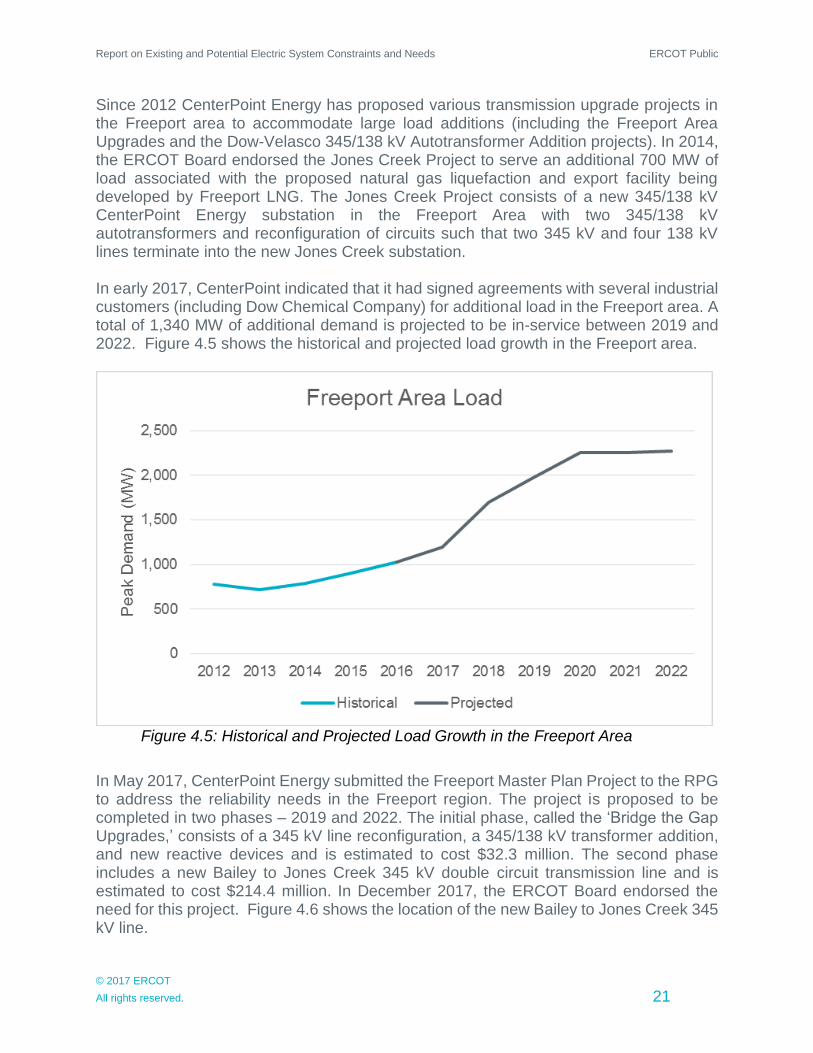
Since 2012 CenterPoint Energy has proposed various transmission upgrade projects in the Freeport area to accommodate large load additions (including the Freeport Area Upgrades and the Dow-Velasco 345/138 kV Autotransformer Addition projects). In 2014, the ERCOT Board endorsed the Jones Creek Project to serve an additional 700 MW of load associated with the proposed natural gas liquefaction and export facility being developed by Freeport LNG. The Jones Creek Project consists of a new 345/138 kV CenterPoint Energy substation in the Freeport Area with two 345/138 kV autotransformers and reconfiguration of circuits such that two 345 kV and four 138 kV lines terminate into the new Jones Creek substation. In early 2017, CenterPoint indicated that it had signed agreements with several industrial customers (including Dow Chemical Company) for additional load in the Freeport area. A total of 1,340 MW of additional demand is projected to be in-service between 2019 and 2022. Figure 4.5 shows the historical and projected load growth in the Freeport area.
Figure 4.5: Historical and Projected Load Growth in the Freeport Area
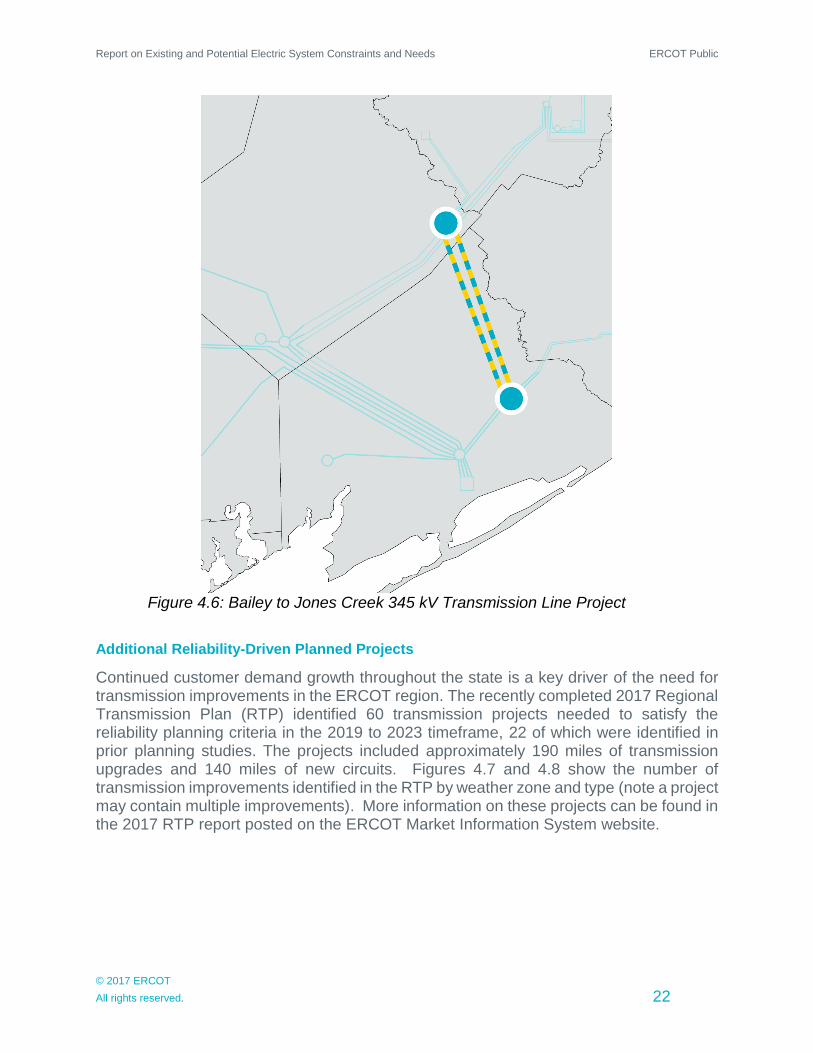
In May 2017, CenterPoint Energy submitted the Freeport Master Plan Project to the RPG to address the reliability needs in the Freeport region. The project is proposed to be completed in two phases – 2019 and 2022. The initial phase, called the ‘Bridge the Gap Upgrades,’ consists of a 345 kV line reconfiguration, a 345/138 kV transformer addition, and new reactive devices and is estimated to cost $32.3 million. The second phase includes a new Bailey to Jones Creek 345 kV double circuit transmission line and is estimated to cost $214.4 million. In December 2017, the ERCOT Board endorsed the need for this project. Figure 4.6 shows the location of the new Bailey to Jones Creek 345 kV line.
Report on Existing and Potential Electric System Constraints and Needs ERCOT Public
© 2017 ERCOT
All rights reserved. 22
Figure 4.6: Bailey to Jones Creek 345 kV Transmission Line Project
Additional Reliability-Driven Planned Projects
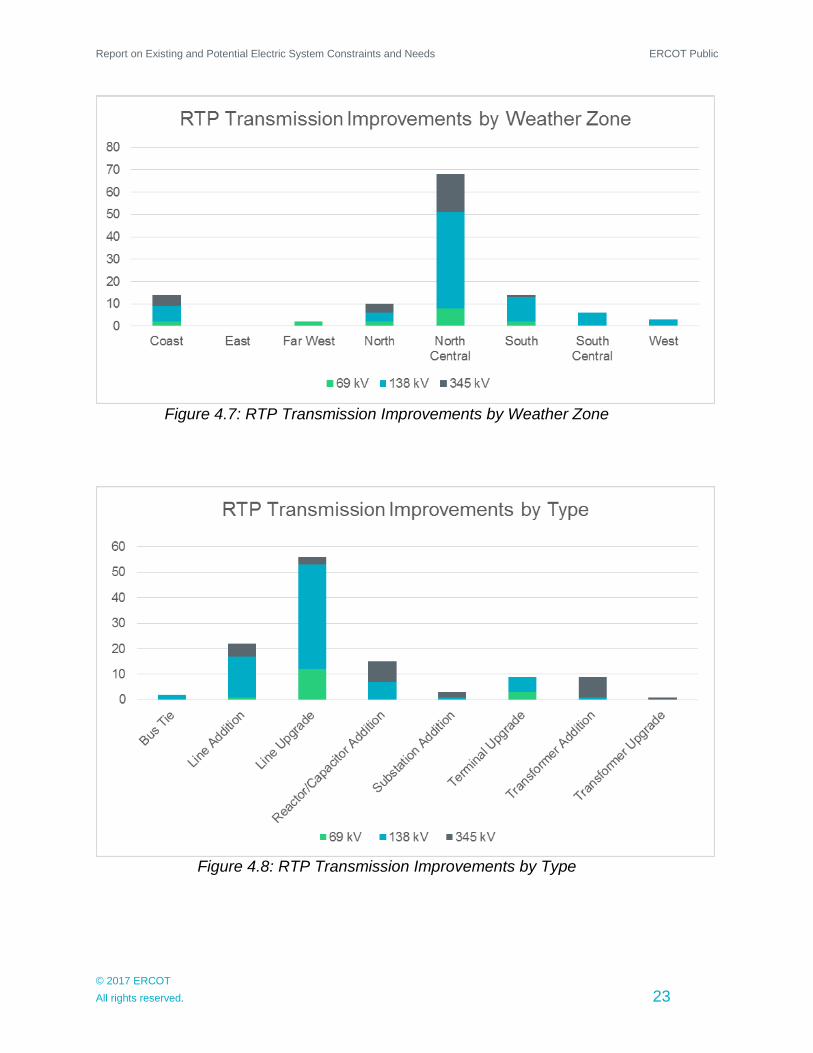
Continued customer demand growth throughout the state is a key driver of the need for transmission improvements in the ERCOT region. The recently completed 2017 Regional Transmission Plan (RTP) identified 60 transmission projects needed to satisfy the reliability planning criteria in the 2019 to 2023 timeframe, 22 of which were identified in prior planning studies. The projects included approximately 190 miles of transmission upgrades and 140 miles of new circuits. Figures 4.7 and 4.8 show the number of transmission improvements identified in the RTP by weather zone and type (note a project may contain multiple improvements). More information on these projects can be found in the 2017 RTP report posted on the ERCOT Market Information System website.
Report on Existing and Potential Electric System Constraints and Needs ERCOT Public
© 2017 ERCOT
All rights reserved. 23
Figure 4.7: RTP Transmission Improvements by Weather Zone
Figure 4.8: RTP Transmission Improvements by Type
Report on Existing and Potential Electric System Constraints and Needs ERCOT Public
© 2017 ERCOT
All rights reserved. 24
Chapter 5. Projected Constraints
Generation Trends
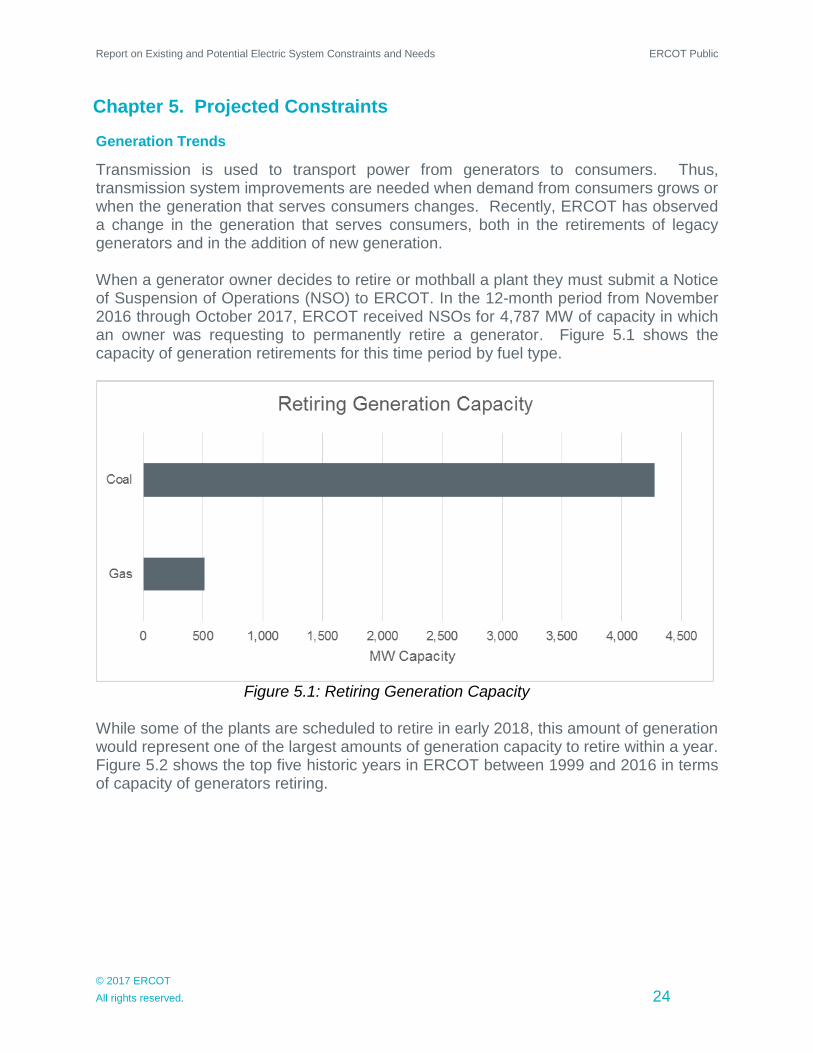
Transmission is used to transport power from generators to consumers. Thus, transmission system improvements are needed when demand from consumers grows or when the generation that serves consumers changes. Recently, ERCOT has observed a change in the generation that serves consumers, both in the retirements of legacy generators and in the addition of new generation. When a generator owner decides to retire or mothball a plant they must submit a Notice of Suspension of Operations (NSO) to ERCOT. In the 12-month period from November 2016 through October 2017, ERCOT received NSOs for 4,787 MW of capacity in which an owner was requesting to permanently retire a generator. Figure 5.1 shows the capacity of generation retirements for this time period by fuel type.
Figure 5.1: Retiring Generation Capacity
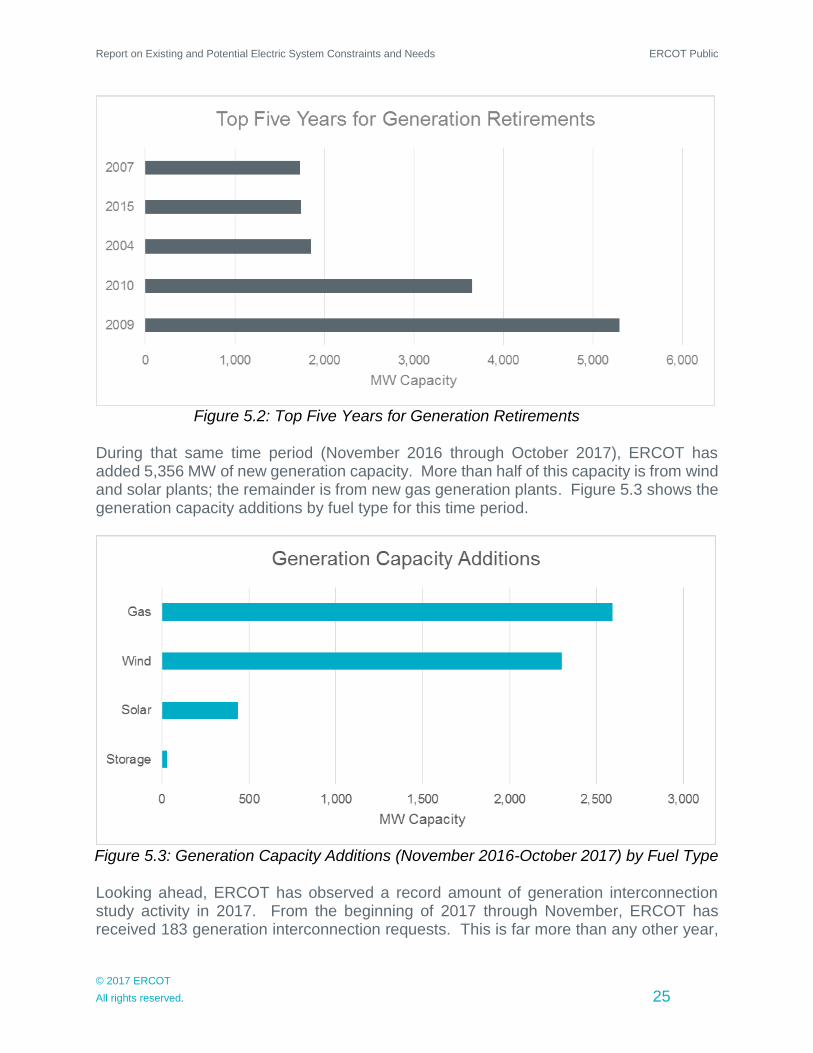
While some of the plants are scheduled to retire in early 2018, this amount of generation would represent one of the largest amounts of generation capacity to retire within a year. Figure 5.2 shows the top five historic years in ERCOT between 1999 and 2016 in terms of capacity of generators retiring.
Report on Existing and Potential Electric System Constraints and Needs ERCOT Public
© 2017 ERCOT
All rights reserved. 25
Figure 5.2: Top Five Years for Generation Retirements
During that same time period (November 2016 through October 2017), ERCOT has added 5,356 MW of new generation capacity. More than half of this capacity is from wind and solar plants; the remainder is from new gas generation plants. Figure 5.3 shows the generation capacity additions by fuel type for this time period.
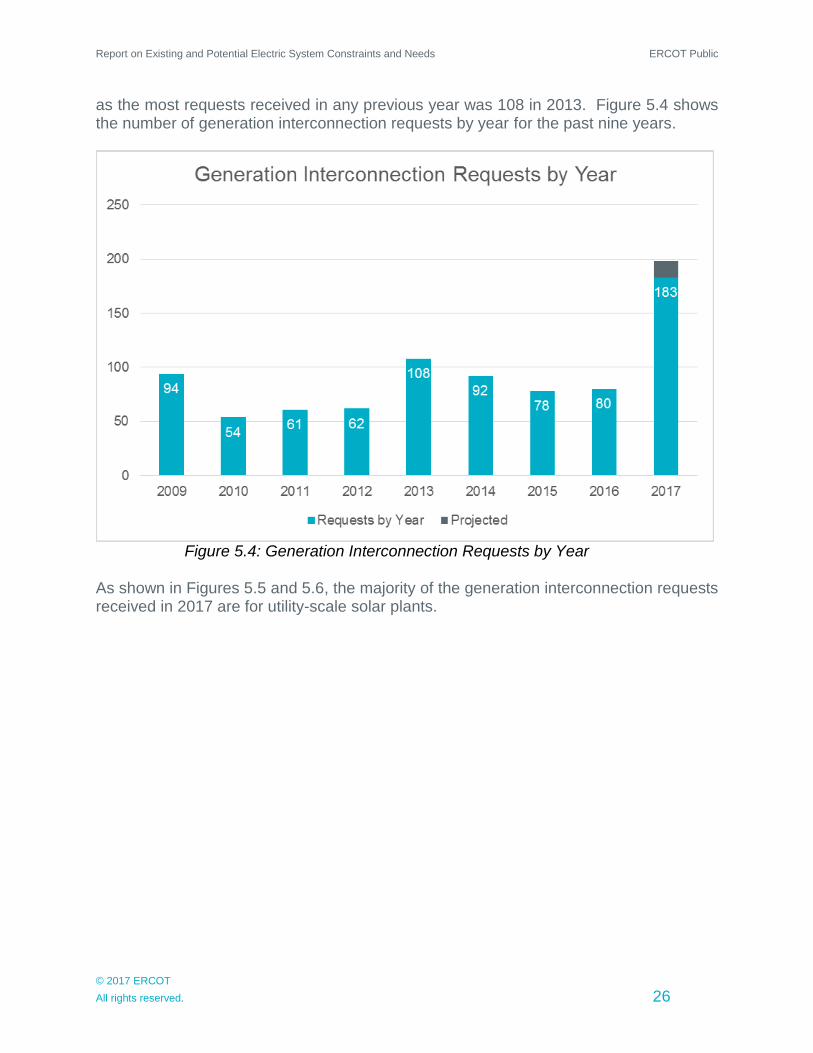
Figure 5.3: Generation Capacity Additions (November 2016-October 2017) by Fuel Type Looking ahead, ERCOT has observed a record amount of generation interconnection study activity in 2017. From the beginning of 2017 through November, ERCOT has received 183 generation interconnection requests. This is far more than any other year,
Report on Existing and Potential Electric System Constraints and Needs ERCOT Public
© 2017 ERCOT
All rights reserved. 26
as the most requests received in any previous year was 108 in 2013. Figure 5.4 shows the number of generation interconnection requests by year for the past nine years.
Figure 5.4: Generation Interconnection Requests by Year
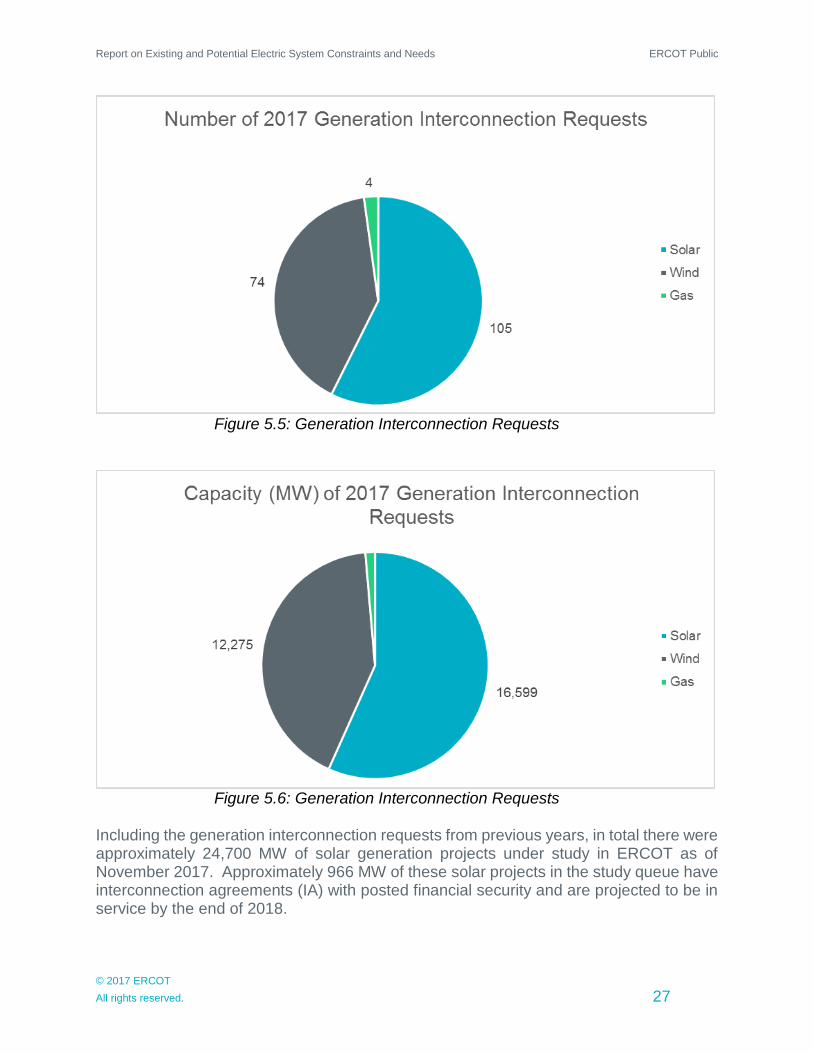
As shown in Figures 5.5 and 5.6, the majority of the generation interconnection requests received in 2017 are for utility-scale solar plants.
Report on Existing and Potential Electric System Constraints and Needs ERCOT Public
© 2017 ERCOT
All rights reserved. 27
Figure 5.5: Generation Interconnection Requests
Figure 5.6: Generation Interconnection Requests
Including the generation interconnection requests from previous years, in total there were approximately 24,700 MW of solar generation projects under study in ERCOT as of November 2017. Approximately 966 MW of these solar projects in the study queue have interconnection agreements (IA) with posted financial security and are projected to be in service by the end of 2018.
Report on Existing and Potential Electric System Constraints and Needs ERCOT Public
© 2017 ERCOT
All rights reserved. 28
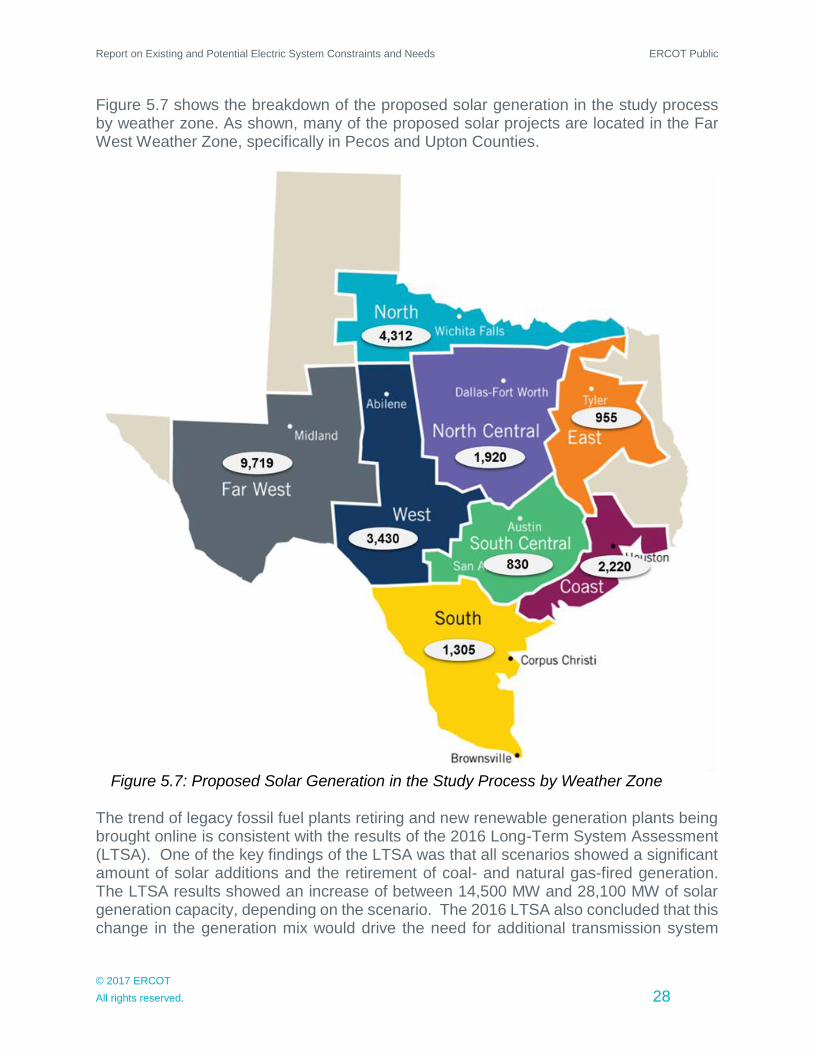
Figure 5.7 shows the breakdown of the proposed solar generation in the study process by weather zone. As shown, many of the proposed solar projects are located in the Far West Weather Zone, specifically in Pecos and Upton Counties.
Figure 5.7: Proposed Solar Generation in the Study Process by Weather Zone
The trend of legacy fossil fuel plants retiring and new renewable generation plants being brought online is consistent with the results of the 2016 Long-Term System Assessment (LTSA). One of the key findings of the LTSA was that all scenarios showed a significant amount of solar additions and the retirement of coal- and natural gas-fired generation. The LTSA results showed an increase of between 14,500 MW and 28,100 MW of solar generation capacity, depending on the scenario. The 2016 LTSA also concluded that this change in the generation mix would drive the need for additional transmission system
Report on Existing and Potential Electric System Constraints and Needs ERCOT Public
© 2017 ERCOT
All rights reserved. 29
improvements to move the power from sunnier West Texas to the load centers in the eastern part of the state.
Projected Constraints Due to Generation Retirements
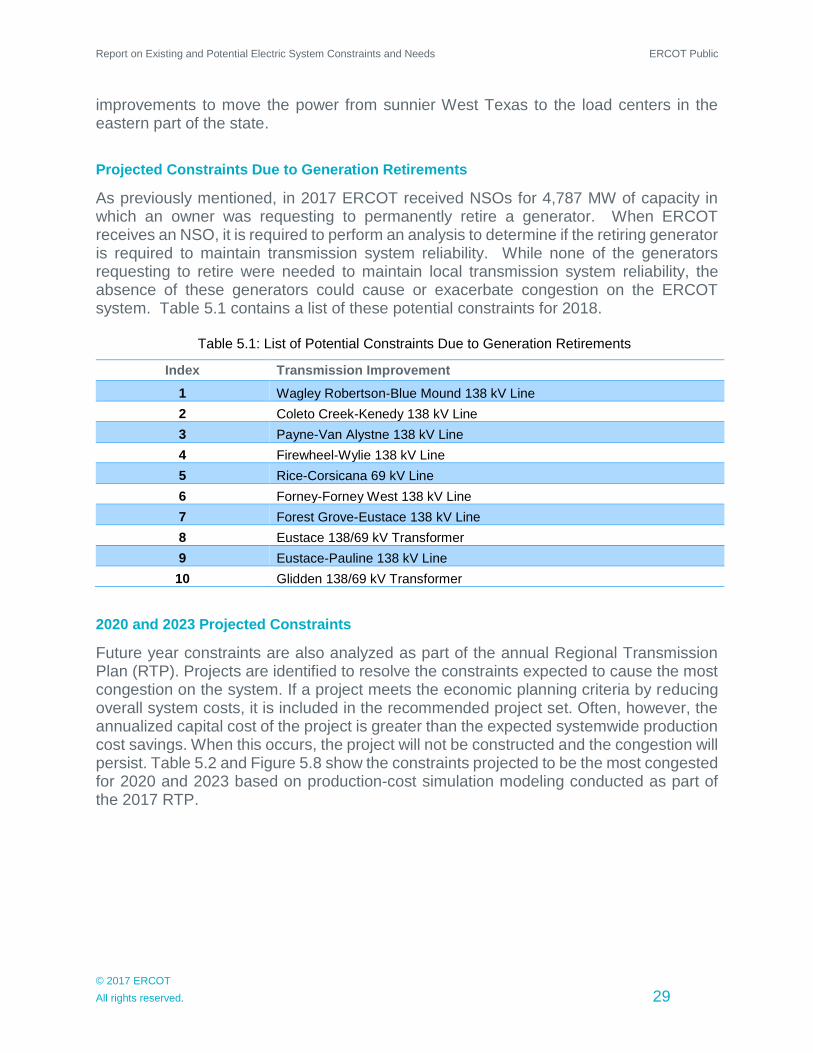
As previously mentioned, in 2017 ERCOT received NSOs for 4,787 MW of capacity in which an owner was requesting to permanently retire a generator. When ERCOT receives an NSO, it is required to perform an analysis to determine if the retiring generator is required to maintain transmission system reliability. While none of the generators requesting to retire were needed to maintain local transmission system reliability, the absence of these generators could cause or exacerbate congestion on the ERCOT system. Table 5.1 contains a list of these potential constraints for 2018.
Table 5.1: List of Potential Constraints Due to Generation Retirements
Index Transmission Improvement
1 Wagley Robertson-Blue Mound 138 kV Line
2 Coleto Creek-Kenedy 138 kV Line
3 Payne-Van Alystne 138 kV Line
4 Firewheel-Wylie 138 kV Line
5 Rice-Corsicana 69 kV Line
6 Forney-Forney West 138 kV Line
7 Forest Grove-Eustace 138 kV Line
8 Eustace 138/69 kV Transformer
9 Eustace-Pauline 138 kV Line
10 Glidden 138/69 kV Transformer
2020 and 2023 Projected Constraints
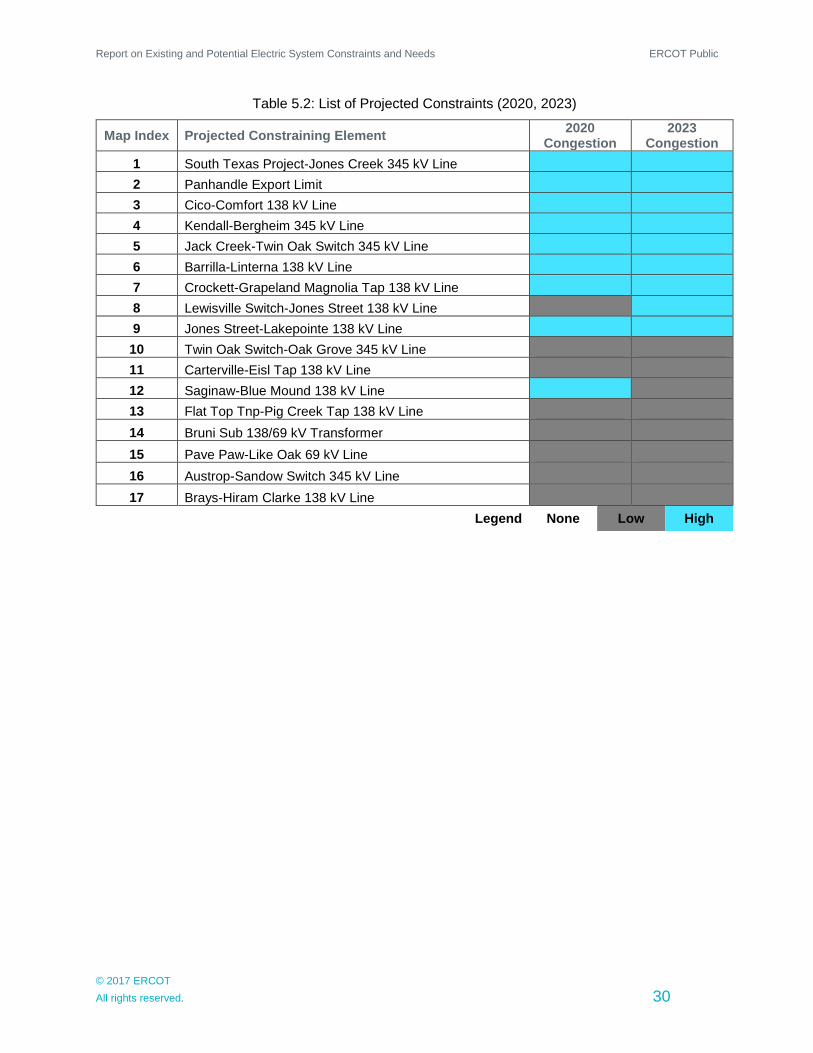
Future year constraints are also analyzed as part of the annual Regional Transmission Plan (RTP). Projects are identified to resolve the constraints expected to cause the most congestion on the system. If a project meets the economic planning criteria by reducing overall system costs, it is included in the recommended project set. Often, however, the annualized capital cost of the project is greater than the expected systemwide production cost savings. When this occurs, the project will not be constructed and the congestion will persist. Table 5.2 and Figure 5.8 show the constraints projected to be the most congested for 2020 and 2023 based on production-cost simulation modeling conducted as part of the 2017 RTP.
Report on Existing and Potential Electric System Constraints and Needs ERCOT Public
© 2017 ERCOT
All rights reserved. 30
Table 5.2: List of Projected Constraints (2020, 2023)
Map Index Projected Constraining Element 2020
Congestion 2023
Congestion
1 South Texas Project-Jones Creek 345 kV Line
2 Panhandle Export Limit
3 Cico-Comfort 138 kV Line
4 Kendall-Bergheim 345 kV Line
5 Jack Creek-Twin Oak Switch 345 kV Line
6 Barrilla-Linterna 138 kV Line
7 Crockett-Grapeland Magnolia Tap 138 kV Line
8 Lewisville Switch-Jones Street 138 kV Line
9 Jones Street-Lakepointe 138 kV Line
10 Twin Oak Switch-Oak Grove 345 kV Line
11 Carterville-Eisl Tap 138 kV Line
12 Saginaw-Blue Mound 138 kV Line
13 Flat Top Tnp-Pig Creek Tap 138 kV Line
14 Bruni Sub 138/69 kV Transformer
15 Pave Paw-Like Oak 69 kV Line
16 Austrop-Sandow Switch 345 kV Line
17 Brays-Hiram Clarke 138 kV Line
Legend None Low High

Report on Existing and Potential Electric System Constraints and Needs ERCOT Public
© 2017 ERCOT
All rights reserved. 31
Figure 5.8: Projected 2020 and 2023 Constraints
Report on Existing and Potential Electric System Constraints and Needs ERCOT Public
© 2017 ERCOT
All rights reserved. 32
Chapter 6. Load Integration
Recently, utilities either not currently connected to, or not fully connected to, the ERCOT grid have proposed switching all or parts of their systems into ERCOT. Following is a brief description of the Lubbock Power and Light and Rayburn Country Electric Cooperative proposals.
Lubbock Integration
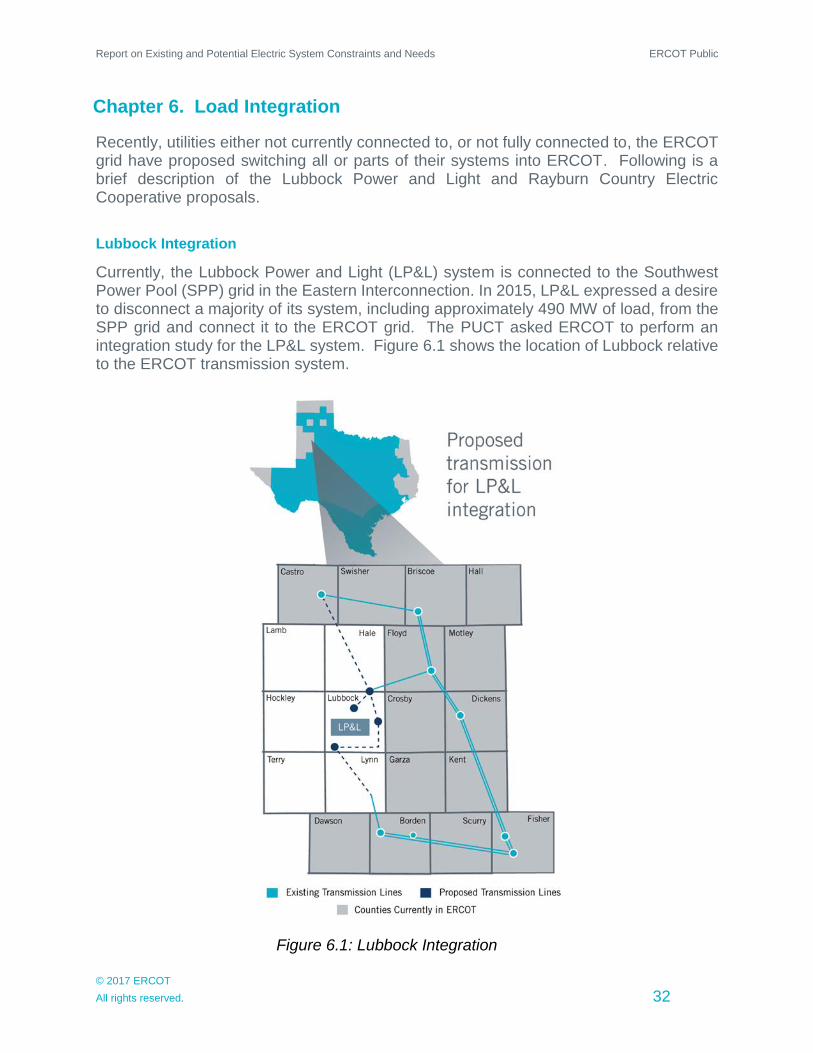
Currently, the Lubbock Power and Light (LP&L) system is connected to the Southwest Power Pool (SPP) grid in the Eastern Interconnection. In 2015, LP&L expressed a desire to disconnect a majority of its system, including approximately 490 MW of load, from the SPP grid and connect it to the ERCOT grid. The PUCT asked ERCOT to perform an integration study for the LP&L system. Figure 6.1 shows the location of Lubbock relative to the ERCOT transmission system.
Figure 6.1: Lubbock Integration
Report on Existing and Potential Electric System Constraints and Needs ERCOT Public
© 2017 ERCOT
All rights reserved. 33
ERCOT’s Lubbock Integration study focused on identifying the most cost-effective transmission facilities necessary to integrate the LP&L system into the ERCOT grid while meeting the applicable reliability standards. The study, which was completed in June 2016, included a recommendation for the transmission facilities ERCOT preferred should LP&L integrate into the ERCOT grid. The recommended transmission facilities were estimated to cost $364 million. Following ERCOT’s filing of the Lubbock Integration study, the PUCT asked ERCOT and SPP to perform a full impact analysis of the potential LP&L system move to ERCOT. ERCOT and SPP jointly created a study scope for the analysis and then separately performed the requisite studies. Both ERCOT and SPP filed their impact studies with the PUCT in June 2017; these studies are available online in PUCT docket 47576. The PUCT is expected to determine if the LP&L system move to ERCOT is in the public interest in 2018.
Rayburn County Electric Cooperative Integration
Rayburn Country Electric Cooperative (RCEC) has a total peak load of about 1,000 MW. Most of this load is within the ERCOT system; however, approximately 190 MW is served from 138 kV transmission facilities within the Eastern Interconnection on the SPP grid. The 190 MW load served from the Eastern Interconnection is located in Kaufman, Van Zandt, Henderson and Anderson Counties. RCEC seeks to transfer this 190 MW load and most of the associated 138 kV transmission facilities from the Eastern Interconnection into ERCOT by December 2019 with the aim of having the entire RCEC load being served by ERCOT transmission facilities at the conclusion of this proposed transfer. RCEC and Lone Star Transmission performed a joint study and identified a preferred transmission interconnection option, with an estimated cost of $38 million, to integrate these facilities into the ERCOT grid. The PUCT asked ERCOT to perform an integration study for the RCEC load. ERCOT concluded its study, agreeing with the RCEC and Lone Star Transmission preferred option. ERCOT filed the study report with the PUCT in June 2017 (available in PUCT docket 47342). The PUCT also asked ERCOT and SPP to perform a full impact analysis of the potential move. This impact analysis is expected to be completed in early 2018.
Report on Existing and Potential Electric System Constraints and Needs ERCOT Public
© 2017 ERCOT
All rights reserved. 34
Chapter 7. Southern Cross
ERCOT currently has five asynchronous ties to other grids. There are two connections to the Eastern Interconnection with a total capacity of 820 MW. The other three ties are to the Mexican system and have a total capacity of 430 MW. These ties allow for ERCOT and the connecting grids to exchange power in emergencies and for entities to trade power between the grids on a commercial basis. Southern Cross Transmission has proposed building a 2,000 MW merchant tie between ERCOT and the Eastern Interconnection. The tie would connect into the existing ERCOT system in Rusk County and in the Eastern Interconnect would terminate in eastern Mississippi. Power would flow between terminals via an approximately 400-mile High Voltage Direct Current (HVDC) line. The developer expects to begin commercial operation in the third quarter of 2022. The PUCT has granted conditional approval for the facilities necessary to connect the Southern Cross project to ERCOT. However, due to the unique commercial nature and size of the tie, the PUCT has asked ERCOT to complete 14 directives to accommodate the project. The outcome of some of the directives may include changing ERCOT Bylaws, Protocols, or guides. ERCOT began working with stakeholders on these directives in 2017.
Report on Existing and Potential Electric System Constraints and Needs ERCOT Public
© 2017 ERCOT
All rights reserved. 35
Chapter 8. Contacts and Links
Contacts and Information
For general communications and queries, the public can submit a request for information at: http://www.ercot.com/about/contact/inforequest Media Robbie Searcy 512-225-7213 Regulatory and Government Relations Shelly Botkin 512-225-7177
Internet Links
ERCOT Home Page: http://www.ercot.com Market Information System: https://mis.ercot.com/pps/tibco/mis Users must obtain a digital certificate for access to this area. Folders in this area include data, procedures, reports and maps for both operations and planning purposes. Helpful information that can be found on this site includes the following:
Generation Project Interconnection Information
Regional Planning Group Information
Steady-State Base Cases
System Protection Data
Report on Existing and Potential Electric System Constraints and Needs ERCOT Public
© 2017 ERCOT
All rights reserved. 36
Chapter 9. Disclaimer
This report was prepared by the Electric Reliability Council of Texas (ERCOT) staff. It is intended to be a report of the status of the transmission system in the ERCOT region and ERCOT’s recommendations to address transmission constraints. Transmission system planning is a continuous process. Conclusions reached in this report can change with the addition (or elimination) of plans for new generation, transmission facilities, equipment, or loads. Information on congestion costs presented herein is based on the most recent settlement calculations at the time of the development of this report. Future settlements as well as ERCOT Board of Directors and Public Utility Commission of Texas directives may change the figures presented herein. ALL INFORMATION CONTAINED HEREIN IS PROVIDED “AS IS” WITHOUT ANY WARRANTIES OF ANY KIND. ERCOT, ITS ELECTED AND APPOINTED OFFICIALS, EMPLOYEES AND ASSIGNS MAKE NO REPRESENTATIONS WITH RESPECT TO SAID INFORMATION AND DISCLAIM ALL EXPRESS AND IMPLIED WARRANTIES AND CONDITIONS OF ANY KIND, INCLUDING WITHOUT LIMITATION, REPRESENTATIONS, WARRANTIES OR CONDITIONS REGARDING ACCURACY, TIMELINESS, COMPLETENESS, MERCHANTABILITY, OR FITNESS FOR ANY PARTICULAR PURPOSE. The specific suitability for any use of the report and its accuracy should be confirmed by the person or entity choosing to make such use. Use of any of the information in this report is solely at the user’s risk. ERCOT ASSUMES NO RESPONSIBILITY TO YOU OR ANY THIRD PARTY FOR THE CONSEQUENCES OF ANY INTERRUPTION, INACCURACY, ERROR OR OMISSION, RESULTING FROM THE USE OF INFORMATION CONTAINED IN THIS DOCUMENT. ERCOT SHALL NOT BE LIABLE TO YOU OR ANY THIRD PARTY FOR, AND BY USING THE INFORMATION CONTAINED IN THE DOCUMENT YOU AGREE TO INDEMNIFY ERCOT, ITS DIRECTORS, OFFICERS, EMPLOYEES, AND REPRESENTATIVES FOR ANY CLAIM, DAMAGES, OR LOSSES RESULTING FROM, DAMAGE OF ANY KIND ARISING DIRECTLY OR INDIRECTLY OUT OF OR RELATING TO YOUR USE OF THE INFORMATION CONTAINED IN THIS DOCUMENT (INCLUDING ANY BREACH OF THIS AGREEMENT), INCLUDING, BUT NOT LIMITED TO, ANY LOST PROFITS, LOST OPPORTUNITIES, SPECIAL INCIDENTAL, DIRECT, INDIRECT OR CONSEQUENTIAL DAMAGES, EVEN IF ERCOT IS ADVISED OF THE POSSIBILITY OF SUCH DAMAGE OR OF A CLAIM, OR POTENTIAL CLAIM, BY ANOTHER PARTY, INCLUDING CLAIM FOR PUNITIVE DAMAGES.