Embed Size (px)
Citation preview
October 1, 2004
Austin 7620 Metro Center Drive Austin, Texas 78744-1613 Telephone: (512) 225-7000 Fax: (512) 225-7020
Taylor2705 West Lake Drive
Taylor, Texas 76574-2136Telephone: (512) 248-3000
Fax: (512) 248-6560
REPORT ON EXISTING AND POTENTIAL ELECTRIC SYSTEM CONSTRAINTS AND NEEDS
WITHIN THE ERCOT REGION
-2-
ELECTRIC SYSTEM CONSTRAINTS AND NEEDS WITHIN THE ERCOT REGION 10/01/04
- 3 -
TABLE OF CONTENTS Page
DISCLAIMER........................................................................................................................................................... 4 EXECUTIVE SUMMARY........................................................................................................................................ 5 INTRODUCTION..................................................................................................................................................... 8
Maintaining Reliability........................................................................................................................................ 9 PURPOSE................................................................................................................................................................ 10 SECTION 1 – TRANSMISSION AND CONGESTION ........................................................................................ 11 MAJOR TRANSMISSION ADDITIONS COMPLETED OR UNDERWAY ...................................................... 11 SUMMARY OF TRANSMISSION INVESTMENTS............................................................................................ 15 TRANSMISSION PLANNING AND ERCOT PLANNING REGIONS............................................................... 17
Transmission Benefits to Society....................................................................................................................... 17 ERCOT Endorsement........................................................................................................................................ 18 South Region Discussion................................................................................................................................... 20 North Region Discussion................................................................................................................................... 26 West Region Discussion.................................................................................................................................... 31 Regulatory Authorization .................................................................................................................................. 34 Transmission Line Routing ............................................................................................................................... 34 Conservation, Efficiency, and Distributed Generation Programs ........................................................................ 34 Projected Congestion Discussion....................................................................................................................... 35
CONSTRAINTS AND CONGESTION ZONES.................................................................................................... 37 Distribution Constraints .................................................................................................................................... 37 Transmission Constraints .................................................................................................................................. 37 Commercially Significant Constraints ............................................................................................................... 37 Zonal Replacement Reserve Service.................................................................................................................. 40 Local Constraints .............................................................................................................................................. 40 Reliability Must-Run Service ............................................................................................................................ 45 Frequency of Congestion................................................................................................................................... 46 Congestion Cost Summary ................................................................................................................................ 49
SECTION 2 – OVERVIEW OF ERCOT ............................................................................................................... 50 POPULATON.......................................................................................................................................................... 50 LOADS .................................................................................................................................................................... 51
Historical Loads ................................................................................................................................................ 51 Location of Demand (Load) .............................................................................................................................. 54
ENERGY ................................................................................................................................................................. 56 GENERATION ....................................................................................................................................................... 57
Location of Generation Capacity ....................................................................................................................... 57 Import/Export ................................................................................................................................................... 58 New Generation Capacity.................................................................................................................................. 59 Age of Generating Capacity .............................................................................................................................. 61
APPENDIX A – TRANSMISSION PROJECT INFORMATION TRACKING (TPIT) ...................................... 63
ELECTRIC SYSTEM CONSTRAINTS AND NEEDS WITHIN THE ERCOT REGION 10/01/04
- 4 -
DISCLAIMER
This report was prepared by the Electric Reliability Council of Texas (ERCOT) System Planning Transmission Services staff. It is intended to be a report of the status of the transmission system in the ERCOT Region and ERCOT’s recommendations to address transmission constraints. Transmission system planning is a continuous process. Conclusions reached in this report can change with the addition (or elimination) of plans for new generation, transmission facilities, equipment, or loads.
Information on congestion management presented herein is based on the most recent settlement calculations at the time of the development of this report. True-up settlement statements had been issued through October 2003. Final settlements had been issued through June 2004. Future settlements and Board and Public Utility Commission of Texas directives may change the figures presented herein.
ALL INFORMATION CONTAINED HEREIN IS PROVIDED “AS IS” WITHOUT ANY WARRANTIES OF ANY KIND. ERCOT, ITS ELECTED AND APPOINTED OFFICIALS, EMPLOYEES AND ASSIGNS MAKE NO REPRESENTATIONS WITH RESPECT TO SAID INFORMATION AND DISCLAIM ALL EXPRESS AND IMPLIED WARRANTIES AND CONDITIONS OF ANY KIND, INCLUDING WITHOUT LIMITATION, REPRESENTATIONS, WARRANTIES OR CONDITIONS REGARDING ACCURACY, TIMELINESS, COMPLETENESS, MERCHANTABILITY, OR FITNESS FOR ANY PARTICULAR PURPOSE. The specific suitability for any use of the report and its accuracy should be confirmed by the person or entity choosing to make such use. Use of any of the information in this report is solely at the user’s risk.
ERCOT ASSUMES NO RESPONSIBILITY TO YOU OR ANY THIRD PARTY FOR THE CONSEQUENCES OF ANY INTERRUPTION, INACCURACY, ERROR OR OMISSION, RESULTING FROM THE USE OF INFORMATION CONTAINED IN THIS DOCUMENT. ERCOT SHALL NOT BE LIABLE TO YOU OR ANY THIRD PARTY FOR, AND BY USING THE INFORMATION CONTAINED IN THE DOCUMENT YOU AGREE TO INDEMNIFY ERCOT, ITS DIRECTORS, OFFICERS, EMPLOYEES, AND RESPRESENTATIVES FOR ANY CLAIM, DAMAGES, OR LOSSES RESULTING FROM, DAMAGE OF ANY KIND ARISING DIRECTLY OR INDIRECTLY OUT OF OR RELATING TO YOUR USE OF THE INFORMATION CONTAINED IN THIS DOCUMENT (INCLUDING ANY BREACH OF THIS AGREEMENT), INCLUDING, BUT NOT LIMITED TO, ANY LOST PROFITS, LOST OPPORTUNITIES, SPECIAL INCIDENTAL, DIRECT, INDIRECT OR CONSEQUENTIAL DAMAGES, EVEN IF ERCOT IS ADVISED OF THE POSSIBILITY OF SUCH DAMAGE OR OF A CLAIM, OR POTENTIAL CLAIM, BY ANOTHER PARTY, INCLUDING CLAIM FOR PUNITIVE DAMAGES.
ELECTRIC SYSTEM CONSTRAINTS AND NEEDS WITHIN THE ERCOT REGION 10/01/04
- 5 -
EXECUTIVE SUMMARY
High-voltage transmission lines serve as an integral link between power generating plants and consumers of electrical energy. Working together, these transmission lines form a transportation highway for electrical power and are often referred to collectively as the transmission grid. The synergism achieved by all components that make up the transmission grid enables the delivery of power to the consumer with minimum disruptions. Major transmission-related components include conductors, support (tower) structures, rights of way, transformers, relays, breakers, switches, reactive devices and remedial action equipment. Some components are essential to the physical act of transmitting power (e.g. conductors); others ensure that the delivered power is of acceptable quality (e.g. reactive devices), while others are required to protect equipment or affect operations and maintenance (e.g. control systems, SCADA, relays, and breakers). This system must be planned, designed, constructed, and maintained to operate reliably within thermal, voltage, and stability limits while achieving its major purposes. The transmission system must be flexible enough, every second of every day, to accommodate the growing demand for reliable and affordable electricity.
The Electric Reliability Council of Texas (ERCOT), Transmission and Distribution Service Providers (TDSPs), generators, and loads are meeting the challenge to keep the ERCOT system reliable and adequate. Over 26,000 MW of new generation capacity including over 900 MW of wind power has been added to the grid. This represents an increase of over 46% of installed generation capacity since 1995. Reserve margins are projected to remain above the 12.5% minimum requirement through 2009, and transmission construction is proceeding well to meet customer load requirements. About 700 circuit miles of 345-kV lines and hundreds of circuit miles of 138-kV lines along with significant autotransformer additions have been installed since 1996. Additional new generation is being developed within the region. Measures have already been taken that will reduce the chances of wide-scale events like the Northeast blackout of 2003.
A summary of all the transmission projects currently in progress within ERCOT indicates that significant 138-kV construction will be completed over the next three years. Multiple 345-kV/138-kV autotransformers will be installed through 2007 in order to increase the transfer capability from the 345-kV system to the 138-kV load-serving system. 345-kV additions are also continuing to be made at about the same rate as in previous years.
The consumer’s electric bill contains rate elements covering the three main components of electrical infrastructure costs – generation, transmission and distribution. Generation costs come from the capital costs of power plant equipment, operation and maintenance expenses and, most significantly, the cost of the fuel used by the plants to produce electricity. Transmission and distribution costs come from the capital costs for transmission and distribution equipment, plus operation and maintenance expenses.
Almost $2 billion in transmission additions have been made over the past six years with a total transmission plant investment in ERCOT of almost $6.8 billion. In other words, over 27% of the total transmission plant investment in ERCOT has been added to rate base over the past six years. While these investments require significant capital, transmission costs currently make up less than 10% percent of a retail consumer’s electric bill.
Based on the current assessment of existing needs, and in support of ongoing generation and demand growth, ERCOT is tracking a series of projects over several years with an estimated cost of approximately $2.8 billion. The average level of future transmission estimates in ERCOT is consistent with the past six years. Several large 138-kV, 345-kV, and other transmission projects are expected to be completed in 2006.
Through its planning authority role, all significant projects are independently studied by ERCOT in an open and non-discriminatory manner. ERCOT leads three regional planning groups (RPGs): North, South, and West. ERCOT staff facilitates the consideration and review of proposed projects to address transmission constraints and other system needs. ERCOT has recently adopted computer simulation tools and developed processes to project congestion costs based on wholesale market fundamentals. These new tools and processes are being applied to determining the cost effectiveness of major transmission additions in the RPG process. Where there is a need, ERCOT recommends and the TDSPs build transmission infrastructure that has been fully analyzed vis-à-vis the open RPG process. We emphasize fairness and
ELECTRIC SYSTEM CONSTRAINTS AND NEEDS WITHIN THE ERCOT REGION 10/01/04
- 6 -
openness with stakeholders that may be impacted by these facilities – balancing their concerns with the need to keep the lights on for millions of people. Participation in these regional planning groups is required of all TDSPs and is open to all market participants/stakeholders, consumers, and Public Utility Commission of Texas (PUCT) staff.
Retail competition is strong in Texas. In the ERCOT Region where customer choice is in effect1, consumers representing about 37% of the peak load have exercised their right to switch to different retail service providers. Over the past 10 years, wholesale competition has been encouraged in electricity markets to lower costs to consumers by spurring needed investments in generation and increasing the efficiency of operations. Today, the transmission system acts as an interstate highway system for wholesale electricity commerce and is the backbone for wholesale and retail competition.
Daily transmission constraints increase electricity costs to consumers and can reduce system reliability and increase the risk of equipment damage if not properly managed. Two types of constraints are defined in the ERCOT market: (a) Commercially significant constraints (CSCs) limit the flow of energy from one of the major zones in the ERCOT Region into another, and (b) local constraints (LCs) limit the flow of energy in areas within a zone in ERCOT.
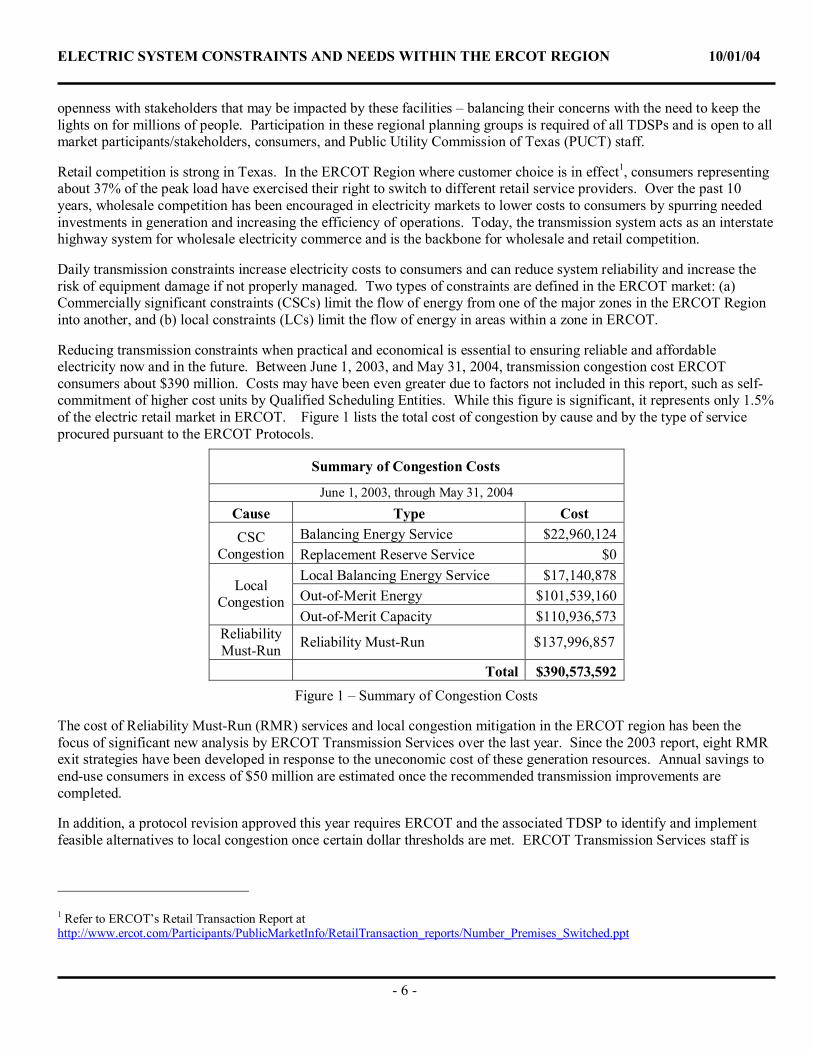
Reducing transmission constraints when practical and economical is essential to ensuring reliable and affordable electricity now and in the future. Between June 1, 2003, and May 31, 2004, transmission congestion cost ERCOT consumers about $390 million. Costs may have been even greater due to factors not included in this report, such as self-commitment of higher cost units by Qualified Scheduling Entities. While this figure is significant, it represents only 1.5% of the electric retail market in ERCOT. Figure 1 lists the total cost of congestion by cause and by the type of service procured pursuant to the ERCOT Protocols.
Summary of Congestion Costs
June 1, 2003, through May 31, 2004 Cause Type Cost
Balancing Energy Service $22,960,124 CSC Congestion Replacement Reserve Service $0
Local Balancing Energy Service $17,140,878 Out-of-Merit Energy $101,539,160
Local Congestion
Out-of-Merit Capacity $110,936,573 Reliability Must-Run Reliability Must-Run $137,996,857
Total $390,573,592 Figure 1 – Summary of Congestion Costs
The cost of Reliability Must-Run (RMR) services and local congestion mitigation in the ERCOT region has been the focus of significant new analysis by ERCOT Transmission Services over the last year. Since the 2003 report, eight RMR exit strategies have been developed in response to the uneconomic cost of these generation resources. Annual savings to end-use consumers in excess of $50 million are estimated once the recommended transmission improvements are completed.
In addition, a protocol revision approved this year requires ERCOT and the associated TDSP to identify and implement feasible alternatives to local congestion once certain dollar thresholds are met. ERCOT Transmission Services staff is
1 Refer to ERCOT’s Retail Transaction Report at http://www.ercot.com/Participants/PublicMarketInfo/RetailTransaction_reports/Number_Premises_Switched.ppt
ELECTRIC SYSTEM CONSTRAINTS AND NEEDS WITHIN THE ERCOT REGION 10/01/04
- 7 -
actively identifying areas of chronic transmission congestion and, with the assistance of the regional planning groups, developing plans to alleviate these transmission bottlenecks.
Electricity use is continuing to grow. This reflects the transformation of the economy to a high-technology information base that relies on electricity. Electricity, though, is not a commodity that can be easily stored, and the transmission infrastructure is at the heart of economic well-being. An open, aggressive, and coordinated transmission planning process that incorporates transmission upgrades to relieve constraints, reliability must-run requirements, and the interconnection of new supply (including environmentally friendly units) will be of paramount importance to the future of Texas.
ELECTRIC SYSTEM CONSTRAINTS AND NEEDS WITHIN THE ERCOT REGION 10/01/04
- 8 -
INTRODUCTION
There is a common element running through homes, offices, manufacturing plants, farms, hospitals, schools and public services. It is electricity. Electricity enables us to live our lives comfortably and conduct our business efficiently.
As our quality of life improves, the need for electricity grows. So does the need for a safe, reliable, and growing electric generation and transmission system to supply our growing need for electricity. Transmission provides the highway for power between those who create it (generators) and local distribution companies that distribute it for use in homes and businesses (load).
Under the Public Utility Regulatory Act (PURA), the Electric Reliability Council of Texas (ERCOT) is charged with network reliability, system-wide transmission planning, nondiscriminatory coordination of market transactions, and ensuring the reliability and adequacy of the regional electric network. In addition, ERCOT ensures access to the transmission and distribution systems for all buyers and sellers of electricity on nondiscriminatory terms. ERCOT along with the Transmission and Distribution Service Providers (TDSPs) has a duty and responsibility to operate, maintain, plan, and expand the transmission system to meet the needs of all users dependent upon it.
ERCOT’s priorities are to: • Serve the needs of customers and communities reliably and efficiently, • Conduct work openly, fairly, and honestly, and • Solicit a diversity of opinions and ideas to achieve better results.
Customers depend on ERCOT and the TDSPs to deliver power where and when it is needed. Communities count on ERCOT to have the infrastructure in place to meet the electric needs of their residents and businesses and to support economic growth initiatives. ERCOT system operators expertly monitor and manage the electric system around the clock, while ERCOT’s transmission planners continually evaluate future electric needs and make recommendations for improving the reliability and adequacy of the system for customers and communities. Because of years of careful planning and operation of the grid, ERCOT enjoys one of the most reliable systems in North America.
Transmission planning in the current environment is a complex undertaking that requires significant work by, and coordination among, ERCOT and the TDSPs, as well as with other market participants. ERCOT works directly with the TDSPs, with stakeholders/market participants, and through the regional planning groups (RPGs). Each of these entities has responsibilities to ensure the appropriate planning and construction occurs.
The ERCOT power system consists of those generation, transmission, and distribution facilities that are controlled by individual entities, such as municipal utilities, electric cooperatives, TDSPs, and generation resources. Together these entities function as an integrated and coordinated power supply network. On July 31, 2001, the ERCOT Region began operations as a single control area under the direction of ERCOT.
The transmission system is the principal means for achieving a reliable electric supply. It ties together the major electric system facilities, generation resources, and customer demand centers. This system must be planned, designed, constructed and maintained to operate reliably within thermal, voltage, and stability limits while achieving its major purposes. Its purposes are to:
Deliver Electric Power to Areas of Customer Demand — The transmission system provides for the integration of electric generation resources and electric system facilities to ensure the reliable delivery of electric power to meet continuously changing customer demands under a wide variety of system operating conditions.
Allow Economic and Competitive Exchange of Electric Power Among Systems — The transmission system allows for the economic and competitive exchange of electric power among all systems and industry participants. Such transfers help to reduce the cost of electric supply to customers and provide a liquid market.
Provide Flexibility for Changing System Conditions — Transmission capacity must be available on the interconnected transmission systems to provide the flexibility needed to handle a shift in facility loadings caused by
ELECTRIC SYSTEM CONSTRAINTS AND NEEDS WITHIN THE ERCOT REGION 10/01/04
- 9 -
the maintenance of generation and transmission equipment, the forced outages of such equipment, and a wide range of other system variable conditions, such as construction delays, higher than expected customer demands, and generating unit fuel shortages.
Electric power transfers have a significant effect on the reliability of the interconnected transmission systems and must be evaluated in the context of the other functions performed by these interconnected systems. In some areas, portions of the transmission system are operated at their reliability limits as the uses of the transmission system increase with new generation and demand. New transmission facilities are identified whenever reliability is compromised or when it is economic to expand the transmission system. Efforts by all industry participants to minimize costs will continue to require maximum utilization, within safety and reliability limits, of the existing transmission systems.
The competitive electricity environment is fostering an increasing demand for transmission services. With this focus on transmission and its ability to support competitive electric power transfers as opposed to traditional integrated utility operation, all users of the interconnected transmission system should understand the electrical limitations of the transmission system and the capability of the system to support a wider variety of energy transfers. The challenge is to plan, operate, and maintain the transmission system in order to provide the requested electric power transfers while sustaining overall system reliability.
Recent announcements of construction of new generation capacity and retirement of older, less efficient units demonstrate the ERCOT market is working effectively. However, competition also changes the landscape:
• New participants enter the market, exit the market, or consolidate their operations, thus changing the players and their contractual supply arrangements.
• Changes in the generation patterns, including the introduction of large, remote wind development, place new challenges on the existing transmission grid.
• Retirement of older plants near metropolitan areas due to economics or environmental restrictions requires a careful assessment of the reliability needs and the transmission alternatives to must-run contracts.
Electric systems must also be planned to withstand probable forced and maintenance outages at projected customer demand and anticipated electricity transfer levels. Extreme but less probable contingencies measure the robustness of the electric systems, and they are evaluated for risks and consequences. The ability of the interconnected transmission systems to withstand probable and extreme contingencies is evaluated by simulated testing of the systems.
Maintaining Reliability
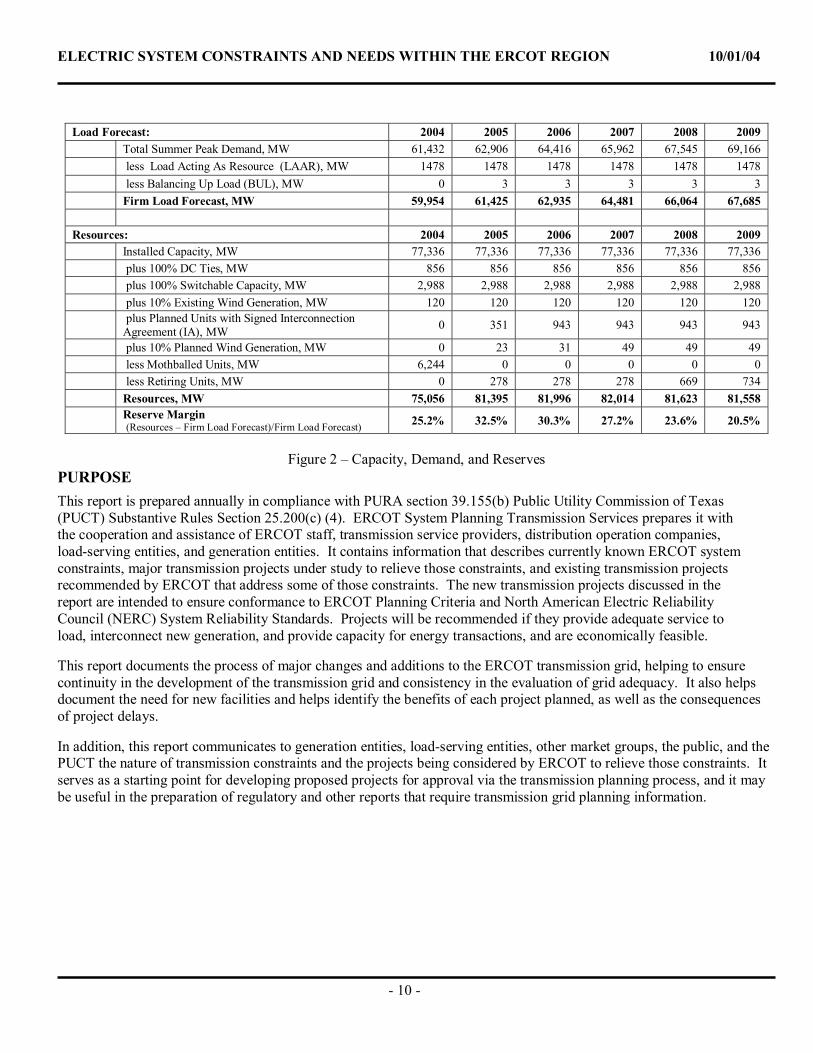
ERCOT, TDSPs, generators, and loads are meeting the challenge to keep the ERCOT system reliable and adequate. Over 26,000 MW of new generation capacity including wind power has been added to the grid since 1995. This represents over 46% increase. Reserve margins are projected to remain above the 12.5% minimum requirement through 2009, and transmission construction is proceeding well to meet customer load requirements. About 700 circuit miles of 345-kV lines and hundreds of circuit miles of 138-kV lines along with significant autotransformer additions have been installed since 1996. Additional new generation is being developed within the region. Measures have already been taken that will reduce the chances of wide-scale events like the Northeast blackout of 2003. Figure 2 presents the projected demand (load) and capacity (generation) through 2009.
ELECTRIC SYSTEM CONSTRAINTS AND NEEDS WITHIN THE ERCOT REGION 10/01/04
- 10 -
Load Forecast: 2004 2005 2006 2007 2008 2009 Total Summer Peak Demand, MW 61,432 62,906 64,416 65,962 67,545 69,166
less Load Acting As Resource (LAAR), MW 1478 1478 1478 1478 1478 1478 less Balancing Up Load (BUL), MW 0 3 3 3 3 3 Firm Load Forecast, MW 59,954 61,425 62,935 64,481 66,064 67,685
Resources: 2004 2005 2006 2007 2008 2009 Installed Capacity, MW 77,336 77,336 77,336 77,336 77,336 77,336 plus 100% DC Ties, MW 856 856 856 856 856 856 plus 100% Switchable Capacity, MW 2,988 2,988 2,988 2,988 2,988 2,988 plus 10% Existing Wind Generation, MW 120 120 120 120 120 120
plus Planned Units with Signed Interconnection Agreement (IA), MW 0 351 943 943 943 943
plus 10% Planned Wind Generation, MW 0 23 31 49 49 49 less Mothballed Units, MW 6,244 0 0 0 0 0 less Retiring Units, MW 0 278 278 278 669 734 Resources, MW 75,056 81,395 81,996 82,014 81,623 81,558
Reserve Margin (Resources – Firm Load Forecast)/Firm Load Forecast) 25.2% 32.5% 30.3% 27.2% 23.6% 20.5%
Figure 2 – Capacity, Demand, and Reserves
PURPOSE This report is prepared annually in compliance with PURA section 39.155(b) Public Utility Commission of Texas (PUCT) Substantive Rules Section 25.200(c) (4). ERCOT System Planning Transmission Services prepares it with the cooperation and assistance of ERCOT staff, transmission service providers, distribution operation companies, load-serving entities, and generation entities. It contains information that describes currently known ERCOT system constraints, major transmission projects under study to relieve those constraints, and existing transmission projects recommended by ERCOT that address some of those constraints. The new transmission projects discussed in the report are intended to ensure conformance to ERCOT Planning Criteria and North American Electric Reliability Council (NERC) System Reliability Standards. Projects will be recommended if they provide adequate service to load, interconnect new generation, and provide capacity for energy transactions, and are economically feasible.
This report documents the process of major changes and additions to the ERCOT transmission grid, helping to ensure continuity in the development of the transmission grid and consistency in the evaluation of grid adequacy. It also helps document the need for new facilities and helps identify the benefits of each project planned, as well as the consequences of project delays.
In addition, this report communicates to generation entities, load-serving entities, other market groups, the public, and the PUCT the nature of transmission constraints and the projects being considered by ERCOT to relieve those constraints. It serves as a starting point for developing proposed projects for approval via the transmission planning process, and it may be useful in the preparation of regulatory and other reports that require transmission grid planning information.
ELECTRIC SYSTEM CONSTRAINTS AND NEEDS WITHIN THE ERCOT REGION 10/01/04
- 11 -
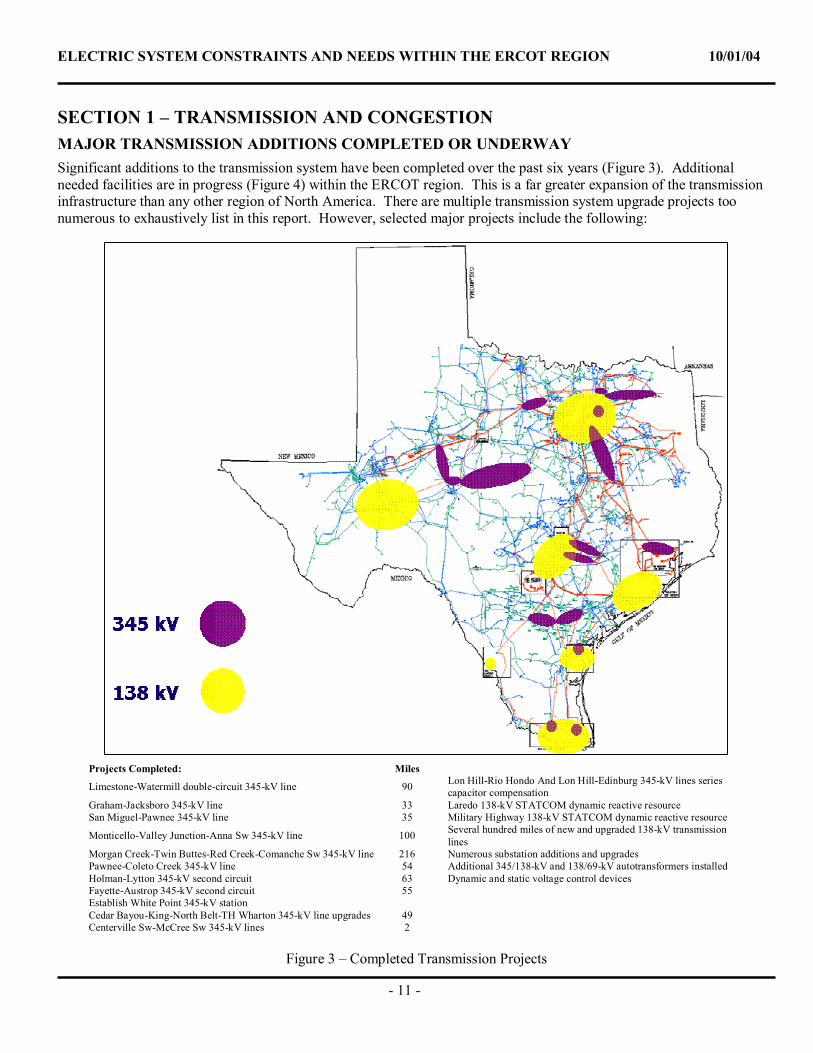
SECTION 1 – TRANSMISSION AND CONGESTION MAJOR TRANSMISSION ADDITIONS COMPLETED OR UNDERWAY Significant additions to the transmission system have been completed over the past six years (Figure 3). Additional needed facilities are in progress (Figure 4) within the ERCOT region. This is a far greater expansion of the transmission infrastructure than any other region of North America. There are multiple transmission system upgrade projects too numerous to exhaustively list in this report. However, selected major projects include the following:
Projects Completed: Miles
Limestone-Watermill double-circuit 345-kV line 90 Lon Hill-Rio Hondo And Lon Hill-Edinburg 345-kV lines series capacitor compensation
Graham-Jacksboro 345-kV line 33 Laredo 138-kV STATCOM dynamic reactive resource San Miguel-Pawnee 345-kV line 35 Military Highway 138-kV STATCOM dynamic reactive resource
Monticello-Valley Junction-Anna Sw 345-kV line 100 Several hundred miles of new and upgraded 138-kV transmission lines
Morgan Creek-Twin Buttes-Red Creek-Comanche Sw 345-kV line 216 Numerous substation additions and upgrades Pawnee-Coleto Creek 345-kV line 54 Additional 345/138-kV and 138/69-kV autotransformers installed Holman-Lytton 345-kV second circuit 63 Dynamic and static voltage control devices Fayette-Austrop 345-kV second circuit 55 Establish White Point 345-kV station Cedar Bayou-King-North Belt-TH Wharton 345-kV line upgrades 49 Centerville Sw-McCree Sw 345-kV lines 2
Figure 3 – Completed Transmission Projects
ELECTRIC SYSTEM CONSTRAINTS AND NEEDS WITHIN THE ERCOT REGION 10/01/04
- 12 -
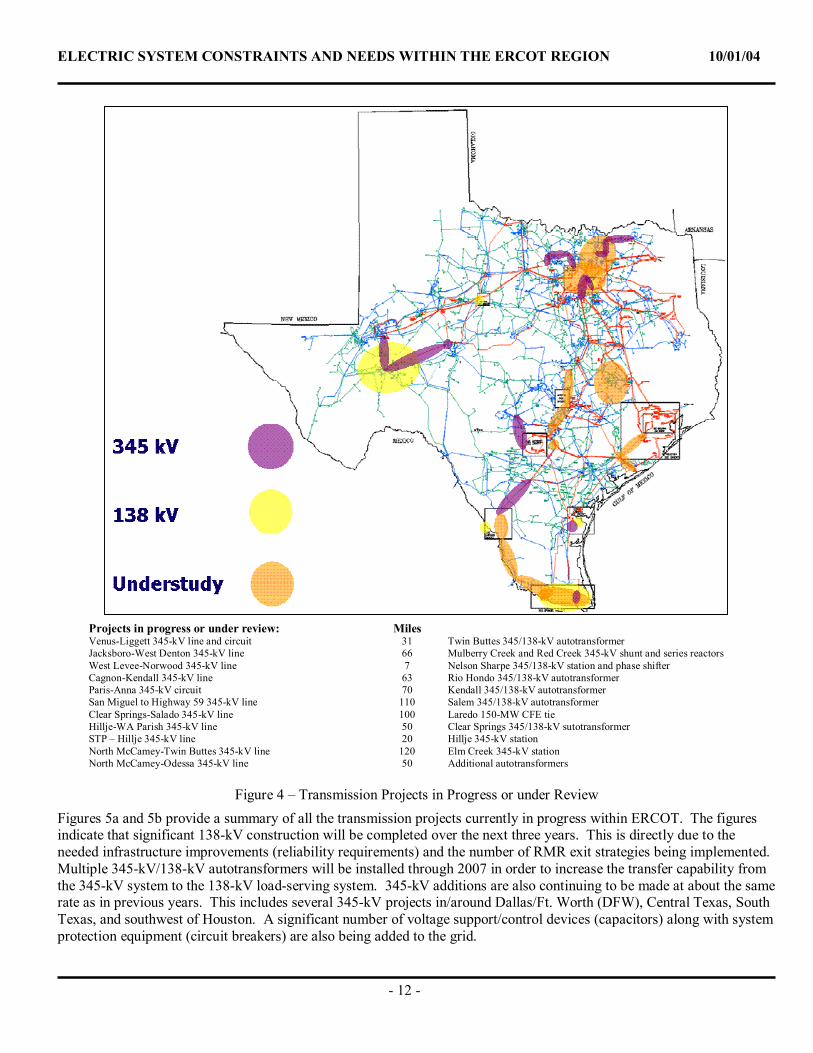
Projects in progress or under review: Miles Venus-Liggett 345-kV line and circuit 31 Twin Buttes 345/138-kV autotransformer Jacksboro-West Denton 345-kV line 66 Mulberry Creek and Red Creek 345-kV shunt and series reactors West Levee-Norwood 345-kV line 7 Nelson Sharpe 345/138-kV station and phase shifter Cagnon-Kendall 345-kV line 63 Rio Hondo 345/138-kV autotransformer Paris-Anna 345-kV circuit 70 Kendall 345/138-kV autotransformer San Miguel to Highway 59 345-kV line 110 Salem 345/138-kV autotransformer Clear Springs-Salado 345-kV line 100 Laredo 150-MW CFE tie Hillje-WA Parish 345-kV line 50 Clear Springs 345/138-kV sutotransformer STP – Hillje 345-kV line 20 Hillje 345-kV station North McCamey-Twin Buttes 345-kV line 120 Elm Creek 345-kV station North McCamey-Odessa 345-kV line 50 Additional autotransformers
Figure 4 – Transmission Projects in Progress or under Review
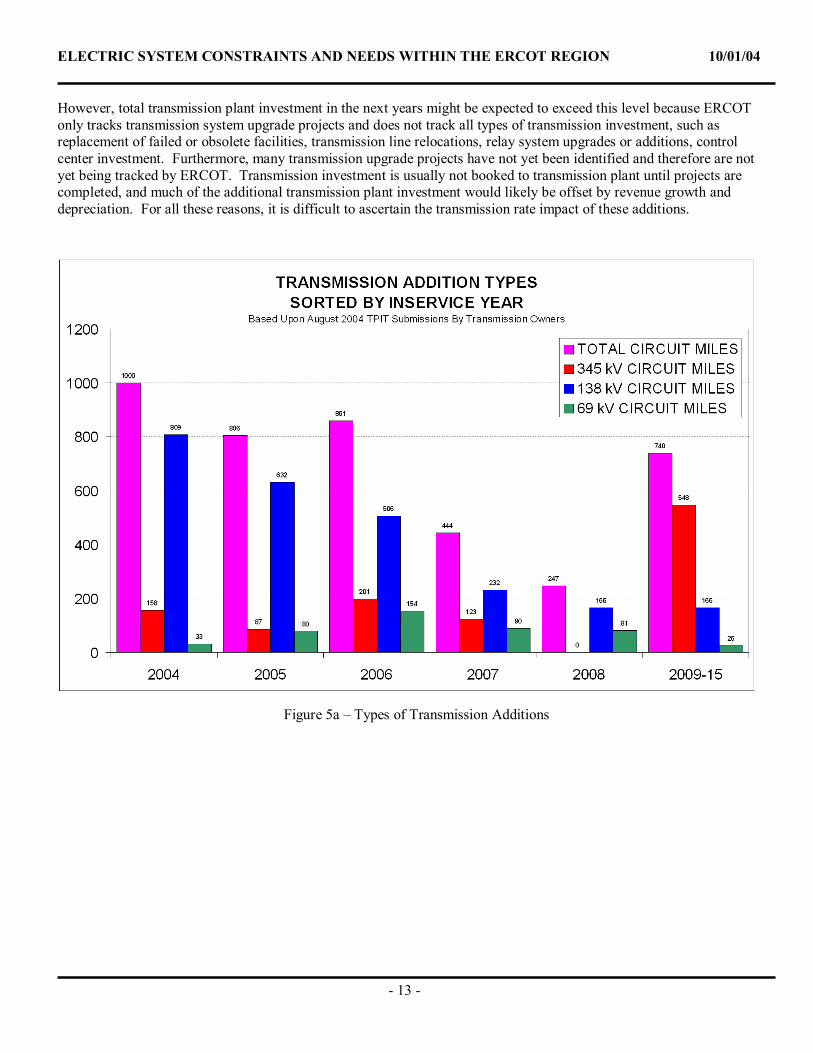
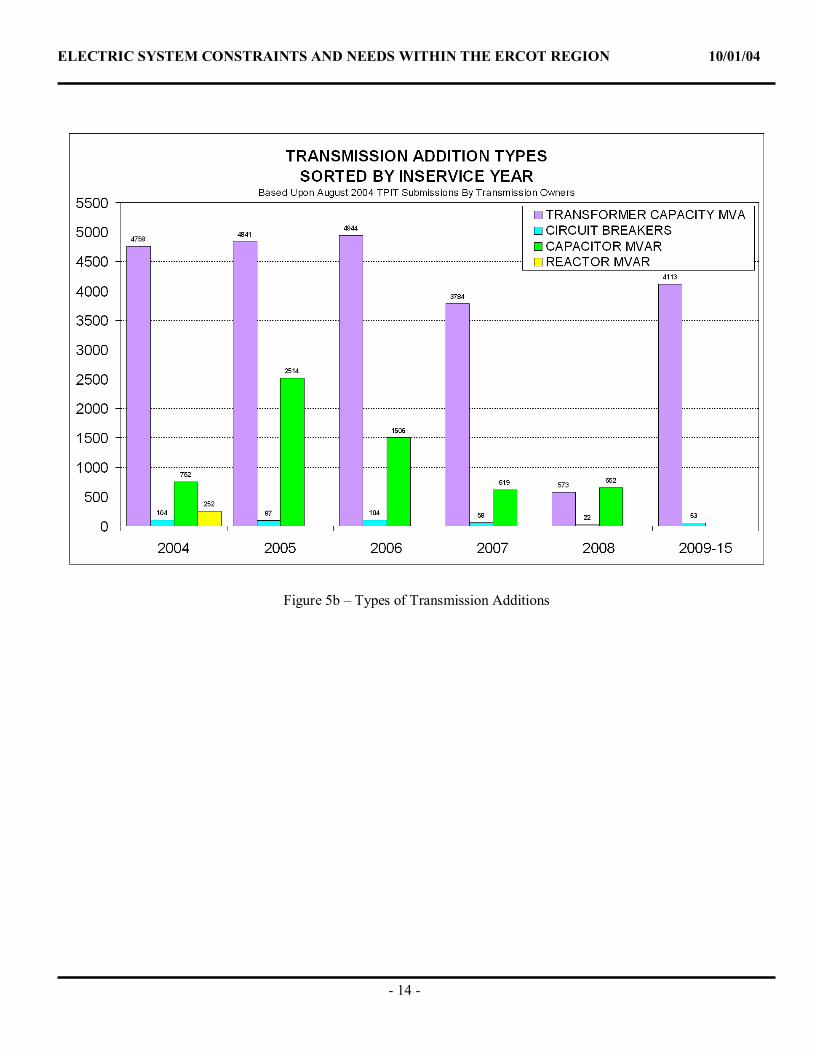
Figures 5a and 5b provide a summary of all the transmission projects currently in progress within ERCOT. The figures indicate that significant 138-kV construction will be completed over the next three years. This is directly due to the needed infrastructure improvements (reliability requirements) and the number of RMR exit strategies being implemented. Multiple 345-kV/138-kV autotransformers will be installed through 2007 in order to increase the transfer capability from the 345-kV system to the 138-kV load-serving system. 345-kV additions are also continuing to be made at about the same rate as in previous years. This includes several 345-kV projects in/around Dallas/Ft. Worth (DFW), Central Texas, South Texas, and southwest of Houston. A significant number of voltage support/control devices (capacitors) along with system protection equipment (circuit breakers) are also being added to the grid.
ELECTRIC SYSTEM CONSTRAINTS AND NEEDS WITHIN THE ERCOT REGION 10/01/04
- 13 -
However, total transmission plant investment in the next years might be expected to exceed this level because ERCOT only tracks transmission system upgrade projects and does not track all types of transmission investment, such as replacement of failed or obsolete facilities, transmission line relocations, relay system upgrades or additions, control center investment. Furthermore, many transmission upgrade projects have not yet been identified and therefore are not yet being tracked by ERCOT. Transmission investment is usually not booked to transmission plant until projects are completed, and much of the additional transmission plant investment would likely be offset by revenue growth and depreciation. For all these reasons, it is difficult to ascertain the transmission rate impact of these additions.
Figure 5a – Types of Transmission Additions
ELECTRIC SYSTEM CONSTRAINTS AND NEEDS WITHIN THE ERCOT REGION 10/01/04
- 14 -
Figure 5b – Types of Transmission Additions
ELECTRIC SYSTEM CONSTRAINTS AND NEEDS WITHIN THE ERCOT REGION 10/01/04
- 15 -
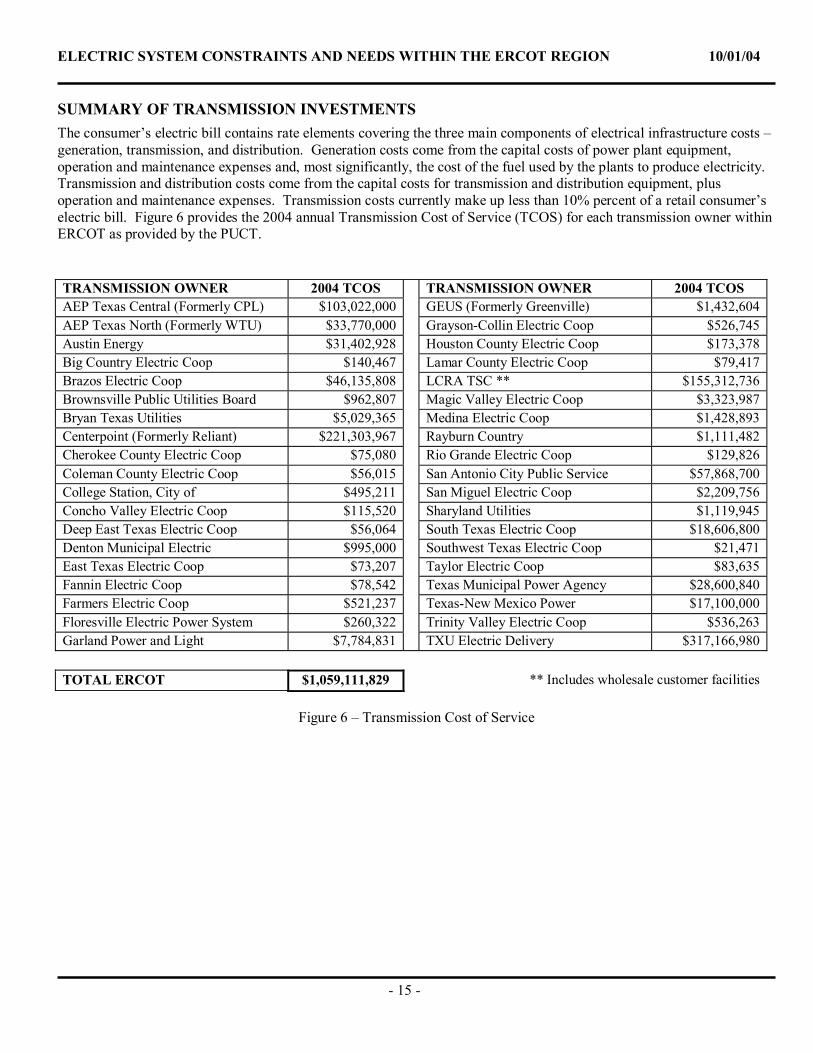
SUMMARY OF TRANSMISSION INVESTMENTS The consumer’s electric bill contains rate elements covering the three main components of electrical infrastructure costs – generation, transmission, and distribution. Generation costs come from the capital costs of power plant equipment, operation and maintenance expenses and, most significantly, the cost of the fuel used by the plants to produce electricity. Transmission and distribution costs come from the capital costs for transmission and distribution equipment, plus operation and maintenance expenses. Transmission costs currently make up less than 10% percent of a retail consumer’s electric bill. Figure 6 provides the 2004 annual Transmission Cost of Service (TCOS) for each transmission owner within ERCOT as provided by the PUCT.
TRANSMISSION OWNER 2004 TCOS TRANSMISSION OWNER 2004 TCOS AEP Texas Central (Formerly CPL) $103,022,000 GEUS (Formerly Greenville) $1,432,604 AEP Texas North (Formerly WTU) $33,770,000 Grayson-Collin Electric Coop $526,745 Austin Energy $31,402,928 Houston County Electric Coop $173,378 Big Country Electric Coop $140,467 Lamar County Electric Coop $79,417 Brazos Electric Coop $46,135,808 LCRA TSC ** $155,312,736 Brownsville Public Utilities Board $962,807 Magic Valley Electric Coop $3,323,987 Bryan Texas Utilities $5,029,365 Medina Electric Coop $1,428,893 Centerpoint (Formerly Reliant) $221,303,967 Rayburn Country $1,111,482 Cherokee County Electric Coop $75,080 Rio Grande Electric Coop $129,826 Coleman County Electric Coop $56,015 San Antonio City Public Service $57,868,700 College Station, City of $495,211 San Miguel Electric Coop $2,209,756 Concho Valley Electric Coop $115,520 Sharyland Utilities $1,119,945 Deep East Texas Electric Coop $56,064 South Texas Electric Coop $18,606,800 Denton Municipal Electric $995,000 Southwest Texas Electric Coop $21,471 East Texas Electric Coop $73,207 Taylor Electric Coop $83,635 Fannin Electric Coop $78,542 Texas Municipal Power Agency $28,600,840 Farmers Electric Coop $521,237 Texas-New Mexico Power $17,100,000 Floresville Electric Power System $260,322 Trinity Valley Electric Coop $536,263 Garland Power and Light $7,784,831 TXU Electric Delivery $317,166,980
TOTAL ERCOT $1,059,111,829 ** Includes wholesale customer facilities
Figure 6 – Transmission Cost of Service
ELECTRIC SYSTEM CONSTRAINTS AND NEEDS WITHIN THE ERCOT REGION 10/01/04
- 16 -
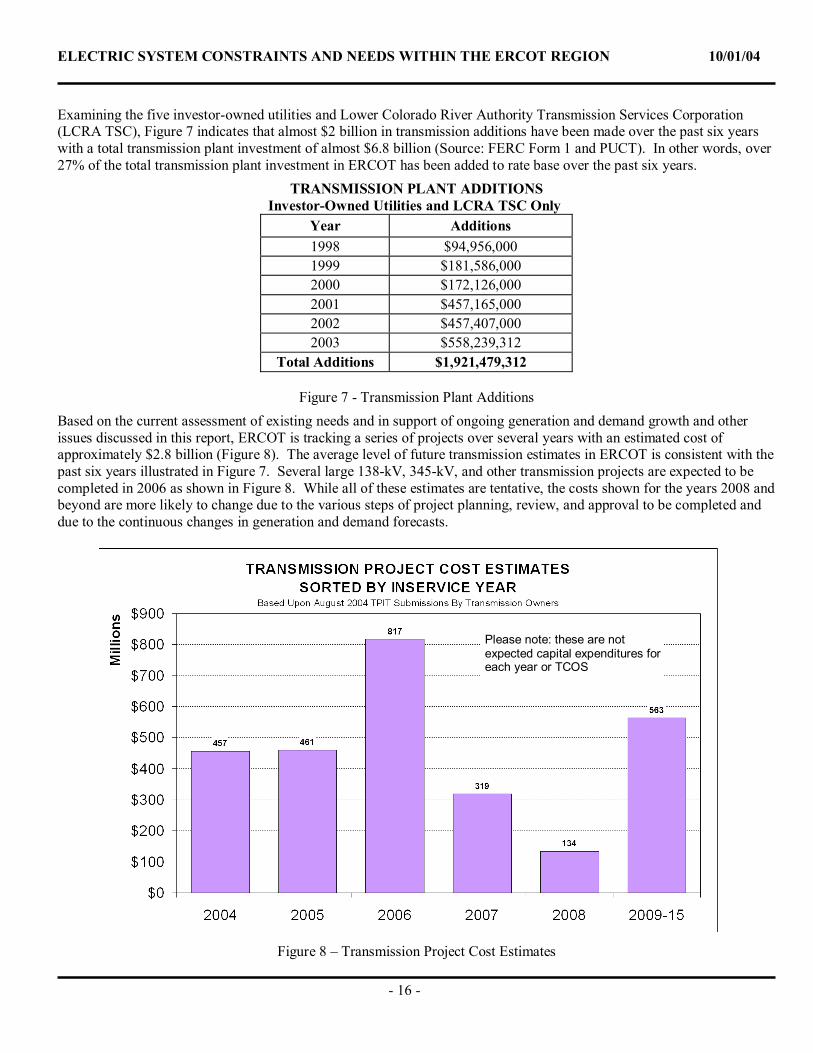
Examining the five investor-owned utilities and Lower Colorado River Authority Transmission Services Corporation (LCRA TSC), Figure 7 indicates that almost $2 billion in transmission additions have been made over the past six years with a total transmission plant investment of almost $6.8 billion (Source: FERC Form 1 and PUCT). In other words, over 27% of the total transmission plant investment in ERCOT has been added to rate base over the past six years.
TRANSMISSION PLANT ADDITIONS Investor-Owned Utilities and LCRA TSC Only
Year Additions 1998 $94,956,000 1999 $181,586,000 2000 $172,126,000 2001 $457,165,000 2002 $457,407,000 2003 $558,239,312
Total Additions $1,921,479,312
Figure 7 - Transmission Plant Additions Based on the current assessment of existing needs and in support of ongoing generation and demand growth and other issues discussed in this report, ERCOT is tracking a series of projects over several years with an estimated cost of approximately $2.8 billion (Figure 8). The average level of future transmission estimates in ERCOT is consistent with the past six years illustrated in Figure 7. Several large 138-kV, 345-kV, and other transmission projects are expected to be completed in 2006 as shown in Figure 8. While all of these estimates are tentative, the costs shown for the years 2008 and beyond are more likely to change due to the various steps of project planning, review, and approval to be completed and due to the continuous changes in generation and demand forecasts.
Figure 8 – Transmission Project Cost Estimates
Please note: these are not expected capital expenditures foreach year or TCOS
ELECTRIC SYSTEM CONSTRAINTS AND NEEDS WITHIN THE ERCOT REGION 10/01/04
- 17 -
TRANSMISSION PLANNING AND ERCOT PLANNING REGIONS Through its planning authority role, all significant projects are independently studied by ERCOT in an open and non-discriminatory manner. ERCOT leads three regional planning groups (RPGs): North, South, and West. ERCOT staff facilitates the consideration and review of proposed projects to address transmission constraints and other system needs. Where there is a need, ERCOT along with the TDSPs builds transmission infrastructure that has been fully analyzed vis-à-vis the open RPG process. We emphasize fairness and openness with stakeholders that may be impacted by these facilities – balancing their concerns with the need to keep the lights on for millions of people. Participation in these regional planning groups is required of all TDSPs and is open to all market participants/stakeholders, consumers, and PUCT staff. For a detailed discussion of the responsibilities of the planning regions, refer to the Power System Planning Charter and Processes. This document and significant other planning information is posted on the Internet in the Operations and System Planning Data area at the following address: http://www.ercot.com/tmaps/Login.cfm
Throughout the RPG effort, we are committed to be inclusive – to share proposals openly and invite a broad spectrum of interested individuals in their review. This report illustrates ERCOT’s commitment. In it, we share proposals for strengthening the transmission system to meet anticipated energy delivery needs. ERCOT recognizes these proposals potentially affect many communities, and appropriately, ERCOT and TDSPs welcome input so that the ultimate solutions are mutually beneficial and cost effective.
The development of this report reflects the feedback received in past years. As a result, we have organized findings and project proposals so readers can easily find information related to specific areas – as well as information about ERCOT and how the planning process works.
The public planning process evaluates and analyzes system performance, identifies needs and problems, develops possible solutions, informs stakeholders of findings, seeks input, discusses options, tailors projects to mitigate identified impacts, and supports regulatory certification and TDSP construction of needed projects.
Accordingly, this report presents transmission system issues as ERCOT continues to improve the transmission system infrastructure. We want to work with people to plan and implement transmission improvements in a reasonable way so ERCOT and the TDSPs can continue to provide the reliable energy delivery service that benefits everyone.
The transmission planning process has a series of detailed technical analyses as its core. ERCOT along with the TDSPs assesses the needs of its existing and potential system users on an individual and collective basis, according to accepted industry system performance criteria and practices, in order to determine the best transmission projects responsive to those needs. We look at individual issues or customer requests on a case-by-case basis, seek input from all market participants/stakeholders, discuss options, develop possible solutions, and then incorporate those into overall system analyses
ERCOT’s transmission assessment process complies with regional and national standards and guidelines for reliable operation of the transmission system, development of transmission system models for future years and seasons, and exchange of information related to these issues.
Participation and coordination extends importantly to the public as well. In addition to working closely with TDSPs and others in the industry, ERCOT shares and receives information at various public and stakeholder meetings throughout the year, and regularly communicates with governmental agencies and community organizations. ERCOT believes the more information that is available for mutual planning efforts, the better the ultimate plans. Information from interactions with customers and stakeholders is given full consideration. This report reflects input received from these audiences.
Transmission Benefits to Society
As part of the electric infrastructure, transmission supports two key benefits to society – reliability and economy of electric supply. These two benefits are tightly intertwined. Fundamentally, transmission connects power producers to power consumers. Without transmission, every consumer would have to generate their own electricity on site and exactly match their production to their usage at all times. This is not economically or logistically feasible or socially desirable,
ELECTRIC SYSTEM CONSTRAINTS AND NEEDS WITHIN THE ERCOT REGION 10/01/04
- 18 -
and in fact is the reason transmission system evolved in the first place. Transmission allows for the development of efficient generating plants and for the movement of power to many consumers.
Transmission is a network of wires with many power plants and distribution substations interconnected at various locations. This network provides multiple paths to get power from producers to consumers. Having multiple paths to move power lessens the chance that consumers will be negatively affected by outages of various network elements. Transmission provides the ability for an area to access more distant sources of electricity when local sources are unavailable or are more expensive to run. Transmission provides the means to balance constantly varying electricity production and usage over broad areas, allowing uninterrupted electricity supply on demand for consumers. Because of transmission’s network configuration and ability to provide access to more distant sources of power, not as many local sources are required to provide the same level of electrical service reliability to consumers.
Transmission also provides the ability to transport emerging “green” sources of power, like wind energy from large wind farms developing in remote areas, to the consumers. Transmission infrastructure in a community also provides the opportunity for area economic development and growth; without local transmission it is difficult to provide the necessary electrical services to support growth in a timely or economic fashion.
ERCOT Endorsement
Initial inclusion and analysis of proposed transmission projects in this report do not constitute endorsement to begin construction, nor do they indicate a final decision on proposed need or project requirements. The ERCOT Board of Directors will endorse proposed major projects in accordance with the following process:
ERCOT staff recommends needed major transmission facility additions based on identified constraints and evaluates proposals from transmission service providers and the requirements for integrating new generating facilities into the ERCOT system. ERCOT conducts an open process of review and comment on proposed major facility additions through
committees and subcommittees. ERCOT staff submits final recommended transmission facility additions to the ERCOT Board of
Directors for review and concurrence. ERCOT staff determines the designated providers of the additions. ERCOT notifies the PUCT of all Board-endorsed transmission facility additions and their designated
providers. Projects proposed by individual transmission service providers or other stakeholders may also be submitted directly to ERCOT for review.
ELECTRIC SYSTEM CONSTRAINTS AND NEEDS WITHIN THE ERCOT REGION 10/01/04
- 19 -
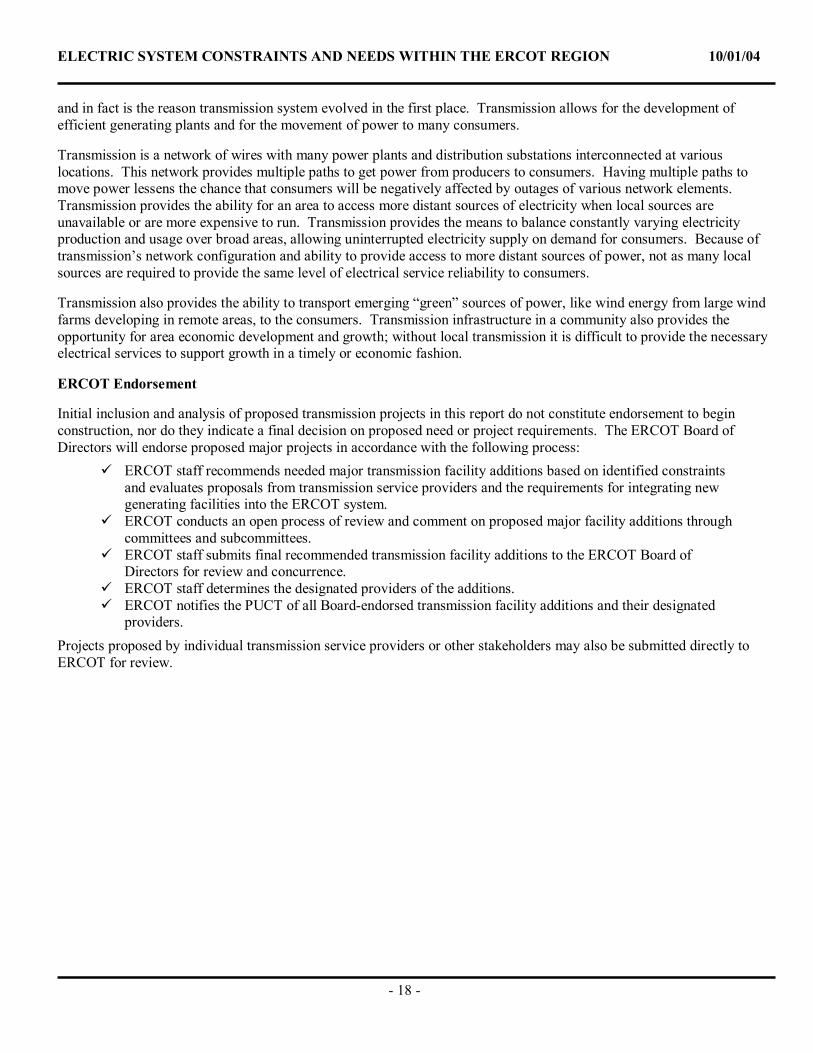
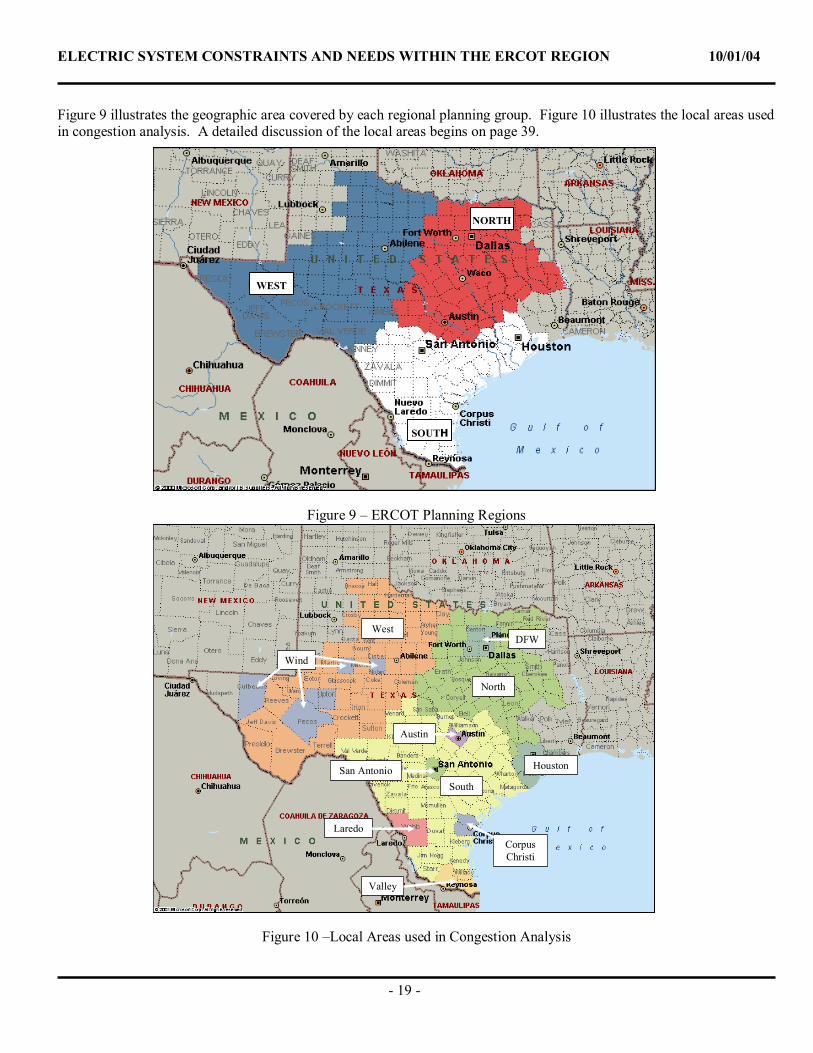
Figure 9 illustrates the geographic area covered by each regional planning group. Figure 10 illustrates the local areas used in congestion analysis. A detailed discussion of the local areas begins on page 39.
Figure 9 – ERCOT Planning Regions
Figure 10 –Local Areas used in Congestion Analysis
SOUTH
NORTH
WEST
West
North
South
Houston
Corpus Christi
Valley
Laredo
San Antonio
Austin
Wind
DFWWest
North
South
Houston
Corpus Christi
Valley
Laredo
San Antonio
Austin
Wind
DFW
ELECTRIC SYSTEM CONSTRAINTS AND NEEDS WITHIN THE ERCOT REGION 10/01/04
- 20 -
South Region Discussion
The ERCOT South Region consists of 55 counties and has 35,539 MW of generation. It had 25,448 MW of coincident peak load in 2003. These numbers represent approximately 43% of the total ERCOT generation capacity and 45% of total ERCOT coincident peak load. Geographically, the region encompasses the San Antonio and Houston metropolitan areas as well as the Rio Grande Valley and smaller centers of load in Laredo, Del Rio, Corpus Christi, and Victoria.
Non-coincident load growth between 1999 and 2003 for the South Region was approximately 2.5% per year compared to the average growth rate of 2.1% for all of ERCOT. The largest increases in load occurred in counties near the San Antonio and Houston metropolitan areas. Based upon percentage, counties located in the Rio Grande Valley and Corpus Christi also ranked near the top in growth. About 1,600 MW of new generation were put into service in the South Region in 2003.
Local Constraints and Congestion
Several services are used in ERCOT for the resolution of local congestion. These are Local Balancing Energy (LBE), Out-of-Merit Energy (OOME), Out-Of-Merit Capacity (OOMC), and Reliability Must-Run (RMR). A detailed discussion of these services can be found starting on page 41. All LBE has been paid as OOME since August 2003 due to a protocol change that determined the LBE was not working as designed and would be discontinued in the ERCOT market.
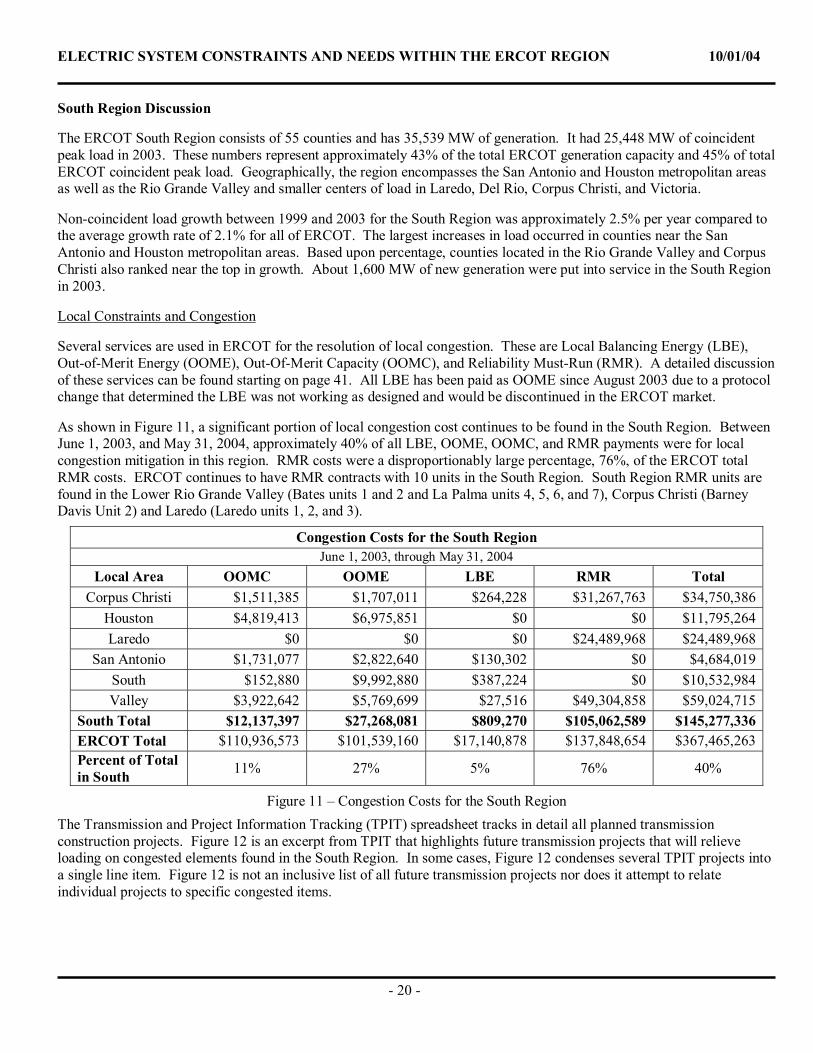
As shown in Figure 11, a significant portion of local congestion cost continues to be found in the South Region. Between June 1, 2003, and May 31, 2004, approximately 40% of all LBE, OOME, OOMC, and RMR payments were for local congestion mitigation in this region. RMR costs were a disproportionably large percentage, 76%, of the ERCOT total RMR costs. ERCOT continues to have RMR contracts with 10 units in the South Region. South Region RMR units are found in the Lower Rio Grande Valley (Bates units 1 and 2 and La Palma units 4, 5, 6, and 7), Corpus Christi (Barney Davis Unit 2) and Laredo (Laredo units 1, 2, and 3).
Congestion Costs for the South Region June 1, 2003, through May 31, 2004
Local Area OOMC OOME LBE RMR Total Corpus Christi $1,511,385 $1,707,011 $264,228 $31,267,763 $34,750,386
Houston $4,819,413 $6,975,851 $0 $0 $11,795,264Laredo $0 $0 $0 $24,489,968 $24,489,968
San Antonio $1,731,077 $2,822,640 $130,302 $0 $4,684,019South $152,880 $9,992,880 $387,224 $0 $10,532,984Valley $3,922,642 $5,769,699 $27,516 $49,304,858 $59,024,715
South Total $12,137,397 $27,268,081 $809,270 $105,062,589 $145,277,336ERCOT Total $110,936,573 $101,539,160 $17,140,878 $137,848,654 $367,465,263Percent of Total in South 11% 27% 5% 76% 40%
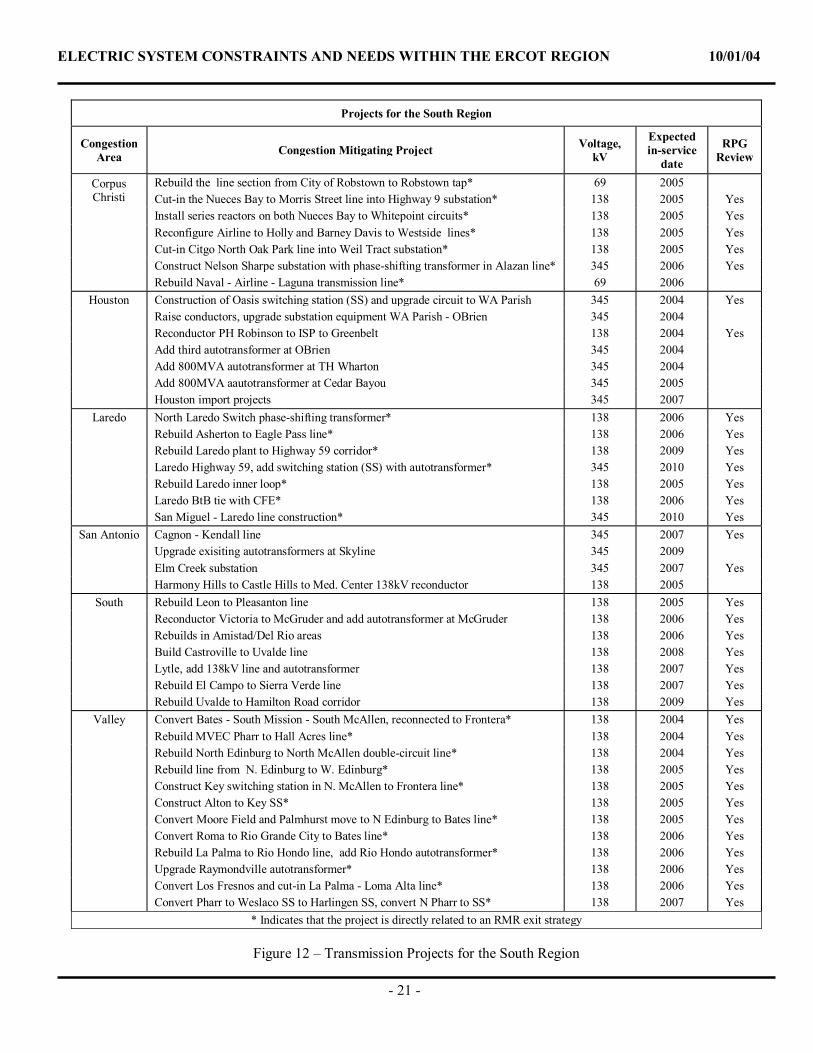
Figure 11 – Congestion Costs for the South Region The Transmission and Project Information Tracking (TPIT) spreadsheet tracks in detail all planned transmission construction projects. Figure 12 is an excerpt from TPIT that highlights future transmission projects that will relieve loading on congested elements found in the South Region. In some cases, Figure 12 condenses several TPIT projects into a single line item. Figure 12 is not an inclusive list of all future transmission projects nor does it attempt to relate individual projects to specific congested items.
ELECTRIC SYSTEM CONSTRAINTS AND NEEDS WITHIN THE ERCOT REGION 10/01/04
- 21 -
Projects for the South Region
Congestion Area Congestion Mitigating Project Voltage,
kV
Expected in-service
date
RPG Review
Rebuild the line section from City of Robstown to Robstown tap* 69 2005 Corpus Christi Cut-in the Nueces Bay to Morris Street line into Highway 9 substation* 138 2005 Yes
Install series reactors on both Nueces Bay to Whitepoint circuits* 138 2005 Yes Reconfigure Airline to Holly and Barney Davis to Westside lines* 138 2005 Yes Cut-in Citgo North Oak Park line into Weil Tract substation* 138 2005 Yes Construct Nelson Sharpe substation with phase-shifting transformer in Alazan line* 345 2006 Yes Rebuild Naval - Airline - Laguna transmission line* 69 2006
Houston Construction of Oasis switching station (SS) and upgrade circuit to WA Parish 345 2004 Yes Raise conductors, upgrade substation equipment WA Parish - OBrien 345 2004 Reconductor PH Robinson to ISP to Greenbelt 138 2004 Yes Add third autotransformer at OBrien 345 2004 Add 800MVA autotransformer at TH Wharton 345 2004 Add 800MVA aautotransformer at Cedar Bayou 345 2005 Houston import projects 345 2007
Laredo North Laredo Switch phase-shifting transformer* 138 2006 Yes Rebuild Asherton to Eagle Pass line* 138 2006 Yes Rebuild Laredo plant to Highway 59 corridor* 138 2009 Yes Laredo Highway 59, add switching station (SS) with autotransformer* 345 2010 Yes Rebuild Laredo inner loop* 138 2005 Yes Laredo BtB tie with CFE* 138 2006 Yes San Miguel - Laredo line construction* 345 2010 Yes
San Antonio Cagnon - Kendall line 345 2007 Yes Upgrade exisiting autotransformers at Skyline 345 2009 Elm Creek substation 345 2007 Yes Harmony Hills to Castle Hills to Med. Center 138kV reconductor 138 2005
South Rebuild Leon to Pleasanton line 138 2005 Yes Reconductor Victoria to McGruder and add autotransformer at McGruder 138 2006 Yes
Rebuilds in Amistad/Del Rio areas 138 2006 Yes Build Castroville to Uvalde line 138 2008 Yes Lytle, add 138kV line and autotransformer 138 2007 Yes Rebuild El Campo to Sierra Verde line 138 2007 Yes Rebuild Uvalde to Hamilton Road corridor 138 2009 Yes
Valley Convert Bates - South Mission - South McAllen, reconnected to Frontera* 138 2004 Yes Rebuild MVEC Pharr to Hall Acres line* 138 2004 Yes
Rebuild North Edinburg to North McAllen double-circuit line* 138 2004 Yes Rebuild line from N. Edinburg to W. Edinburg* 138 2005 Yes Construct Key switching station in N. McAllen to Frontera line* 138 2005 Yes
Construct Alton to Key SS* 138 2005 Yes Convert Moore Field and Palmhurst move to N Edinburg to Bates line* 138 2005 Yes Convert Roma to Rio Grande City to Bates line* 138 2006 Yes Rebuild La Palma to Rio Hondo line, add Rio Hondo autotransformer* 138 2006 Yes Upgrade Raymondville autotransformer* 138 2006 Yes Convert Los Fresnos and cut-in La Palma - Loma Alta line* 138 2006 Yes
Convert Pharr to Weslaco SS to Harlingen SS, convert N Pharr to SS* 138 2007 Yes * Indicates that the project is directly related to an RMR exit strategy
Figure 12 – Transmission Projects for the South Region
ELECTRIC SYSTEM CONSTRAINTS AND NEEDS WITHIN THE ERCOT REGION 10/01/04
- 22 -
The following summaries highlight some of transmission related concerns found within the South Region.
Corpus Christi
ERCOT currently contracts with the Barney Davis unit 2 for RMR services in order to protect against thermal overloads caused by power flow from the north to the south within Corpus Christi. In December of 2003, the ERCOT Board endorsed a plan that provides for several 138-kV and 345-kV transmission system projects to be completed by AEP. AEP’s most recent report indicates the 138-kV additions will be completed by year-end 2005 and a new 345/138-kV substation serving the Corpus Christi area to be competed by summer peak of 2007. The intermediate 138-kV projects eliminate the need for an RMR contract with the Barney Davis unit. The new 345/138-kV station will be located approximately 10 miles south of the existing 345-kV Lon Hill substation on the Rio Hondo line and will alleviate long-term 138-kV constraints.
Houston Houston is one of ERCOT’s two largest load centers. It has also been a prime area for independent power producers (IPP) and cogeneration development in recent years. The Deer Park Energy Center (DPEC) generating plant was interconnected in 2002, and the generating units were brought online in stages through 2004. The South Houston Green Power (SHGP) generating plant was interconnected in 2003 and is now in commercial operation. No interconnections of new generating units are expected in 2005. The large influx of new generation in the Houston area from 1999 to 2004, combined with load growth, Texas Genco mothballing, and other changes within ERCOT, significantly changed transmission system conditions in Houston. However, the timely interconnection of new generating plants and upgrades relating to these plants have resulted in minimal internal congestion costs and no RMR units in the Houston zone. Because both the DPEC and SHGP interconnection substations connect through transmission lines to the existing P. H. Robinson substation (PHR), various transmission upgrades were built in the general vicinity of PHR in 2003 and 2004, including a new autotransformer at PHR and a new 345-kV Oasis substation. Also, 345/138-kV autotransformer loading in the area has been high. In addition to the new PHR 345/138-kV autotransformer, 345/138-kV autotransformers were added or upgraded at Obrien and T. H. Wharton substations in 2004 along with various other transmission system improvements. Even so, autotransformers and circuits at several locations have been highly loaded on several occasions and have occasionally caused OOM generation dispatch. Planning studies indicate the need for additional transmission upgrades over the next several years. A new 345/138-kV autotransformer is planned at Cedar Bayou substation in 2005, along with numerous upgrades in various areas of Houston, particularly the northwest. Generally, high 345/138-kV autotransformer loading is due to a combination of (1) load growth on the 138-kV system, (2) increased imports and 345-kV generator connections, and (3) decreased use of older generation typically connected at 69 kV and 138 kV. These same changes have also caused voltage stability concerns in the Houston area. Even with the influx of new generation over the past five years, Houston has become a major import area within ERCOT. While Houston load was historically served by generating units located in and around the city, Houston’s load is now increasingly served by generation located in other parts of ERCOT. As Houston’s load has continued to grow, this generation shift has resulted in increasing import constraints. In 2002, South to Houston flows became a commercially significant constraint in ERCOT. This was followed by North to Houston flows also becoming a commercially significant constraint. Various low-cost, short-lead-time upgrades have been completed to help mitigate these constraints, including upgrades of the South Texas Project - W. A. Parish (STP–WAP) and Gibbons Creek – Obrien 345-kV circuits, autotransformer upgrades at Dow and other locations, the new Oasis substation, and various capacitor banks, and other upgrades. An undervoltage load-shedding scheme has also been installed for the Houston area. It will serve as a safety net in the event of contingencies exceeding the normal planning and operating criteria. While these upgrades have helped reduce congestion and improve reliability, imports into Houston are still constrained due to thermal and voltage stability limitations. Relatively low-cost, short-lead-time upgrades have largely been exhausted, and import limitations continue to pose significant economic and reliability concerns. CenterPoint Energy has submitted a proposal with various upgrades to address these import limitations for ERCOT regional review. The major
ELECTRIC SYSTEM CONSTRAINTS AND NEEDS WITHIN THE ERCOT REGION 10/01/04
- 23 -
components of the proposed projects include a new 345-kV Hillje substation looped into the existing STP-Holman 345-kV circuit, a new 345-kV double circuit from the new Hillje substation to WAP, a new 345-kV circuit from the new Hillje substation to STP, upgrade of the Tomball-Jewett 345-kV circuit, and an upgrade of the T. H. Wharton-Jewett 345-kV circuit. Upgrades of several underlying facilities in various parts of ERCOT will also be necessary, along with the new static and dynamic reactive resources in the Houston area. Rio Grande Valley
The lower Rio Grande Valley, located in the south Texas counties of Cameron, Willacy, and Hidalgo, borders Mexico and, because of increased trade and commercial activity, has experienced electric load growth of about 5%. This rate exceeds the average growth for the rest of ERCOT. Major population centers include McAllen, Harlingen, and Brownsville. Local transmission constraints in the Valley continue to result in congestion costs and the need to operate RMR generation at La Palma and Bates plants. Transmission upgrades of the underlying 138-kV system that are underway on both the east and west sides of the Valley will relieve local contingency overloads and eliminate the need for RMR generation by the summer peak of 2006.
Current plans to retire RMR generation will be adequate in the short term; however, long-term requirements are still under consideration. Constraints due to aggressive load growth will impact not only the local need to transport power within the Valley, but also the need to import bulk power to the Valley. Because of the availability of generation in the San Antonio area, the ERCOT Board endorsed extension of the 345-kV system south from the San Antonio area (San Miguel plant) to Laredo. This extension can serve as the first part of a 345-kV line that could ultimately terminate on the west side of the Valley providing a third 345-kV path into the Valley. In order to transport power delivered by this third 345-kV line, a 345-kV loop from North Edinburg to Frontera and then to La Palma will be necessary. This loop would effectively tie the South McAllen and the Brownsville areas together and provide a 345-kV line paralleling the U.S. and Mexico border and providing long-term transmission capacity to serve continued load growth. The 345-kV extension would also open opportunities for transactions with Mexico that could reduce energy costs in both countries.
Laredo
Laredo, located entirely within Webb County, continues to grow at a 5% rate. ERCOT has entered into an RMR contract with the Laredo plant owner in order to protect against voltage collapse and thermal overloads. In March of 2004, the ERCOT Board endorsed a plan that provides for a back-to-back (BtB) tie with the Mexican transmission system at Nuevo Laredo. This tie would allow the area to meet ERCOT Planning Criteria until a new 345-kV line can be constructed between the San Miguel and Laredo plants. The BtB tie is to be in service by summer peak of 2007 when the Laredo plant is not sufficient to meet the reliability criteria. The 345-kV line is to be in service by summer peak of 2010 when the combined benefit of the Laredo plant and the BtB tie is not sufficient to meet the criteria. In addition to these transmission upgrades, many underlying improvements are necessary including phase shifting transformers at the North Laredo and Del Rio Hamilton Road substations. Once the 345-kV line is complete, the Laredo plant can be released from RMR status.
Uvalde and Del Rio Areas
Due to the availability of generation in the San Antonio area and the shortage of generation along the border with Mexico, the prevailing flow of power to Laredo and the Valley passes across the Uvalde and Del Rio areas south of San Antonio. While the new 345-kV line from San Miguel plant to Laredo will eventually cause this flow to bypass these areas, its loss will still adversely impact this area. Several 138-kV line upgrades are underway including Leon to Pleasanton, Pearsall to Dilley, Uvalde to Del Rio Hamilton Road, and Eagle Pass to Asherton. A new 138-kV line is proposed from Kendall to Castroville to Lytle, and another later project will extend this line from Castroville to Uvalde.
San Antonio
City Public Service (CPS) is a municipally owned electric and gas utility company that primarily serves the San Antonio / Bexar County area. CPS serves approximately 600,000 electric customers within its 1,566-square-mile area. The peak
ELECTRIC SYSTEM CONSTRAINTS AND NEEDS WITHIN THE ERCOT REGION 10/01/04
- 24 -
system load reached 4,117 MW in August 2003. The highest load growth is occurring in the northern part of the city. Load growth in this area has been from 9% to 20% compared to 3% system average growth. The area surrounding the future Toyota plant in the southern part of the city will also grow at a rapid rate with predictions of about 20% annual increase for the next few years. CPS will construct a new substation to serve this load for Toyota. Current load forecasts for this substation indicate approximately 49 MVA of load by May 2006. This load could possibly double within several years if Toyota decides to expand plant operations.
In general, most CPS load is served by local CPS-owned generation plants and nuclear power imported from the South Texas Project. In July 2004, approximately 190 MW of new CPS-owned generation was placed into service at the existing Leon Creek plant. This generation consists of four modern combustion turbine peaking units. This new generation replaces the recently retired Mission Road plant, rated at 100 MW. CPS has elected not to opt-in to retail market competition. However, CPS does import and export bulk power from the ERCOT system.
The CPS-owned portion of the existing 138-kV tie line from the Leon Creek plant to Pleasanton was rebuilt and placed into service in June 2003. This transmission line has been and continues to be a limiting element for exporting power from the CPS system. The remainder of the line (15 miles) has not been completed and retains the old rating of 101 MVA. The CPS portion of the line is rated at 215 MVA. The additional 190 MW of generation at Leon Creek mentioned above further increases the loading problems on this line.
The CPS and LCRA systems are experiencing load growth especially in northwest Bexar County and in the Kendall County area, respectively. This growth has created thermal and voltage problems in the Kendall area. Several new projects will resolve these problems by 2007. The most significant project is the addition of a new 345-kV transmission tie line between the CPS Cagnon substation and the Kendall substation. CPS and LCRA are working to determine the best route for this major transmission line. Other related projects include the addition of a second 345/138-kV autotransformer at the Kendall substation and the addition of a 138-kV, 31.2-MVAR capacitor bank at the Boerne substation.
The ERCOT market has been experiencing significant transmission congestion in the area northeast of San Antonio, especially along the corridor between CPS’s Skyline substation and LCRA’s Marion substation. A proposed 345-kV switching station (Elm Creek) located at the intersection of the 345-kV transmission lines from Skyline to STP, Hill County substation to STP, and both lines from Marion to San Miguel is currently being reviewed by the South Regional Planning Group. A second 345-kV project that will have a positive effect on the area northeast of San Antonio is a new 100-mile 345-kV transmission line between Hays and Bell Counties. This project (Clear Springs-Salado 345-kV line) is also under review by both the South and North Regional Planning Groups.
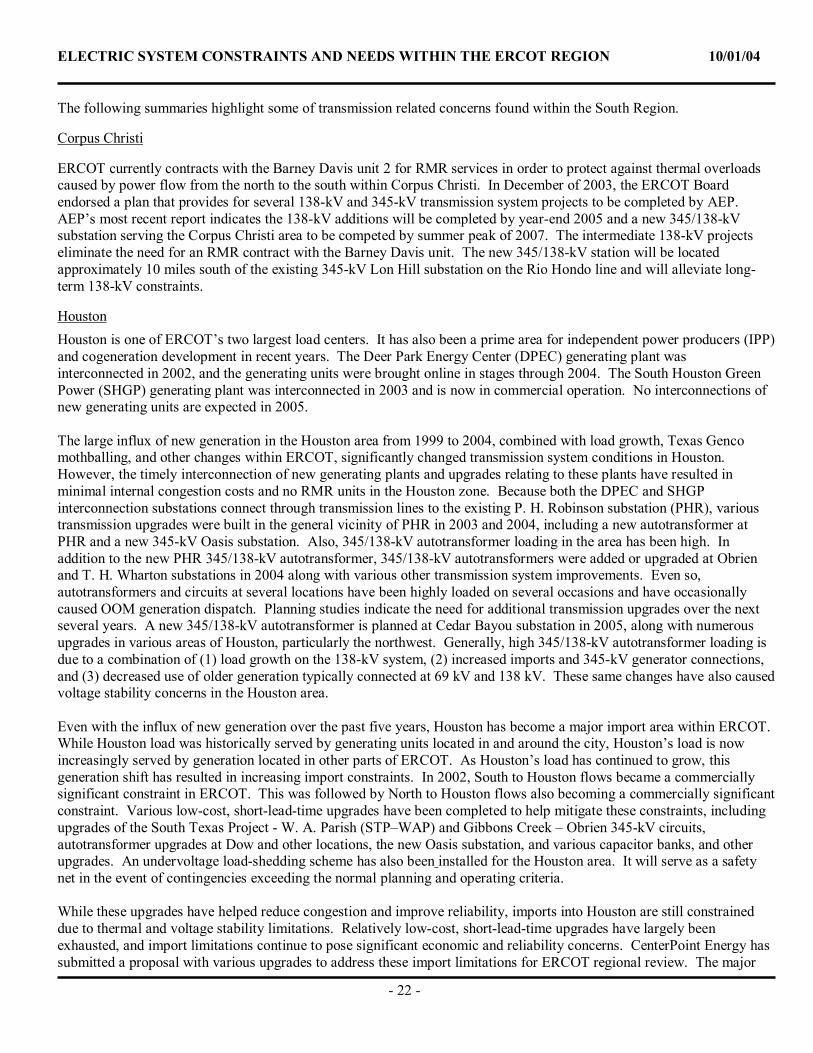
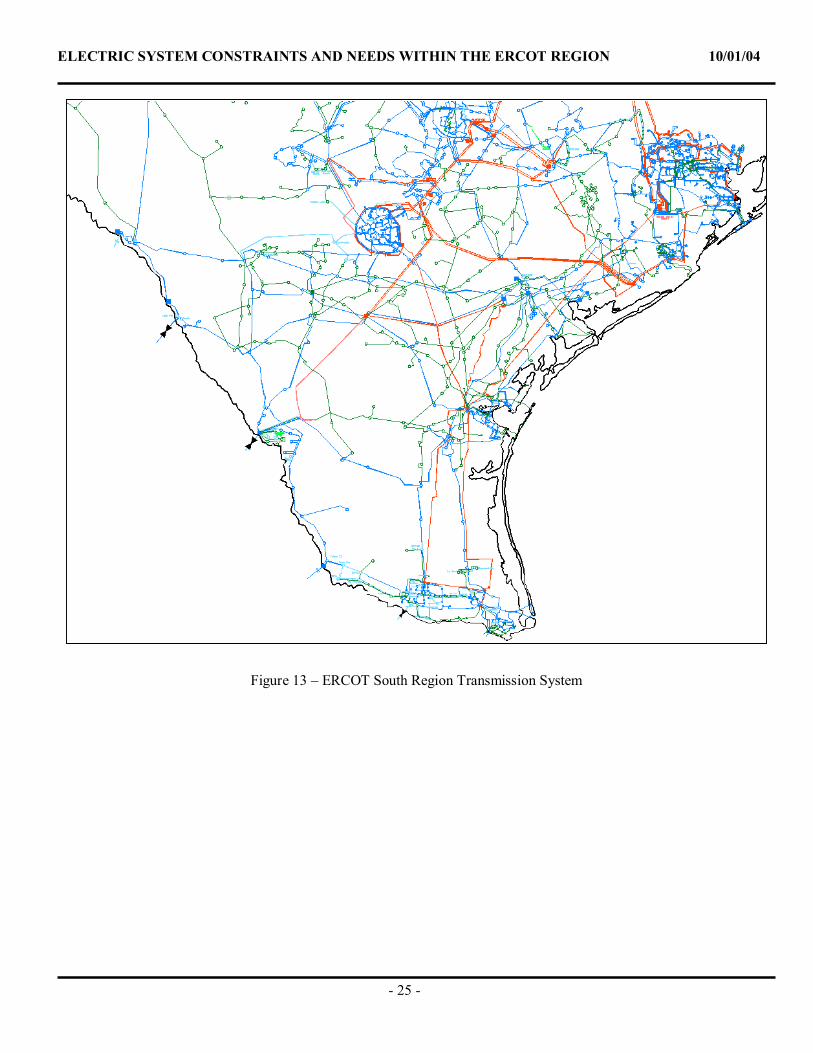
Figure 13 shows the South Region transmission system.
ELECTRIC SYSTEM CONSTRAINTS AND NEEDS WITHIN THE ERCOT REGION 10/01/04
- 25 -
Figure 13 – ERCOT South Region Transmission System
ELECTRIC SYSTEM CONSTRAINTS AND NEEDS WITHIN THE ERCOT REGION 10/01/04
- 26 -
North Region Discussion
The ERCOT North Region consists of 78 counties and has 39,539 MW of generation. It had 27,841 MW of coincident peak load in 2003. These numbers represent approximately 48% of the total ERCOT generation capacity and 49% of total ERCOT coincident peak load. Geographically, the region encompasses the metropolitan areas of Dallas, Fort Worth, and Austin. Non-coincident load growth for 1999 to 2003 in the North Region was approximately 2.5% per year compared to the average load growth of 2.1% for all of ERCOT. The largest increases in load occurred in counties in the Dallas-Fort Worth (DFW) metropolitan area.
There have been 665 MW of new generation put into service in the North Region since August 2003. There are 592 MW of new generation expected to go in service in 2006. This is the only announced future generation in the region.
Local Constraints and Congestion
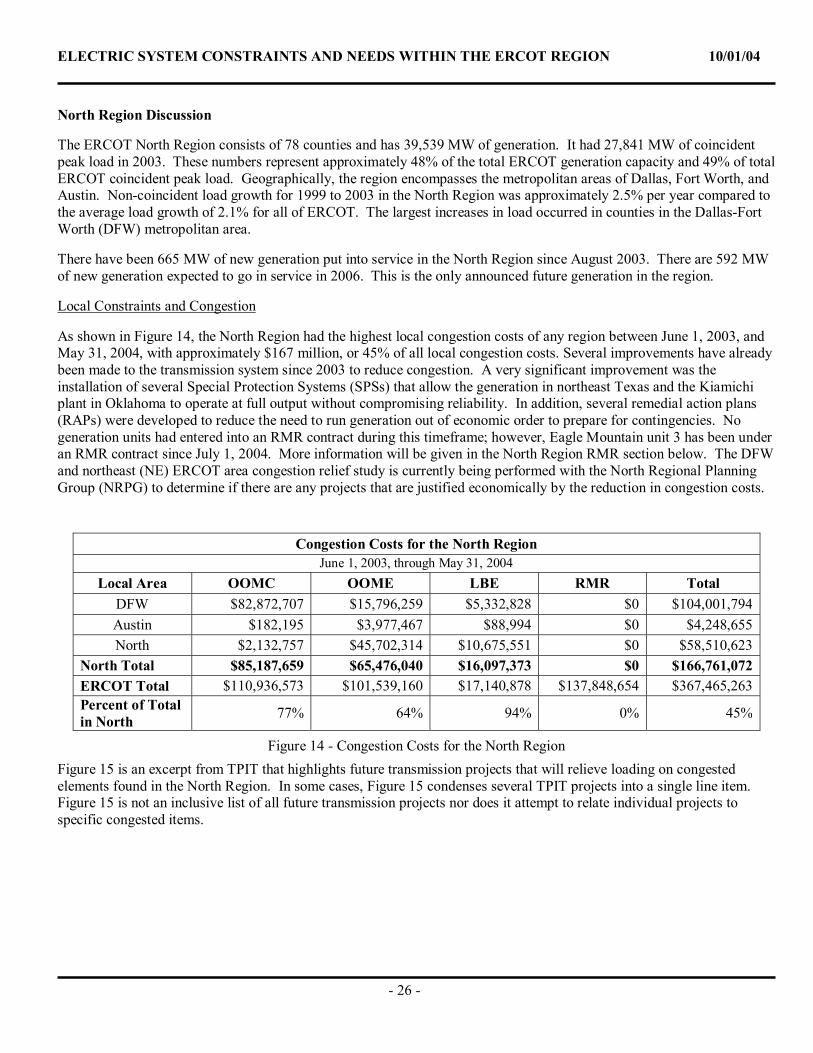
As shown in Figure 14, the North Region had the highest local congestion costs of any region between June 1, 2003, and May 31, 2004, with approximately $167 million, or 45% of all local congestion costs. Several improvements have already been made to the transmission system since 2003 to reduce congestion. A very significant improvement was the installation of several Special Protection Systems (SPSs) that allow the generation in northeast Texas and the Kiamichi plant in Oklahoma to operate at full output without compromising reliability. In addition, several remedial action plans (RAPs) were developed to reduce the need to run generation out of economic order to prepare for contingencies. No generation units had entered into an RMR contract during this timeframe; however, Eagle Mountain unit 3 has been under an RMR contract since July 1, 2004. More information will be given in the North Region RMR section below. The DFW and northeast (NE) ERCOT area congestion relief study is currently being performed with the North Regional Planning Group (NRPG) to determine if there are any projects that are justified economically by the reduction in congestion costs.
Congestion Costs for the North Region June 1, 2003, through May 31, 2004
Local Area OOMC OOME LBE RMR Total DFW $82,872,707 $15,796,259 $5,332,828 $0 $104,001,794 Austin $182,195 $3,977,467 $88,994 $0 $4,248,655 North $2,132,757 $45,702,314 $10,675,551 $0 $58,510,623
North Total $85,187,659 $65,476,040 $16,097,373 $0 $166,761,072 ERCOT Total $110,936,573 $101,539,160 $17,140,878 $137,848,654 $367,465,263 Percent of Total in North 77% 64% 94% 0% 45%
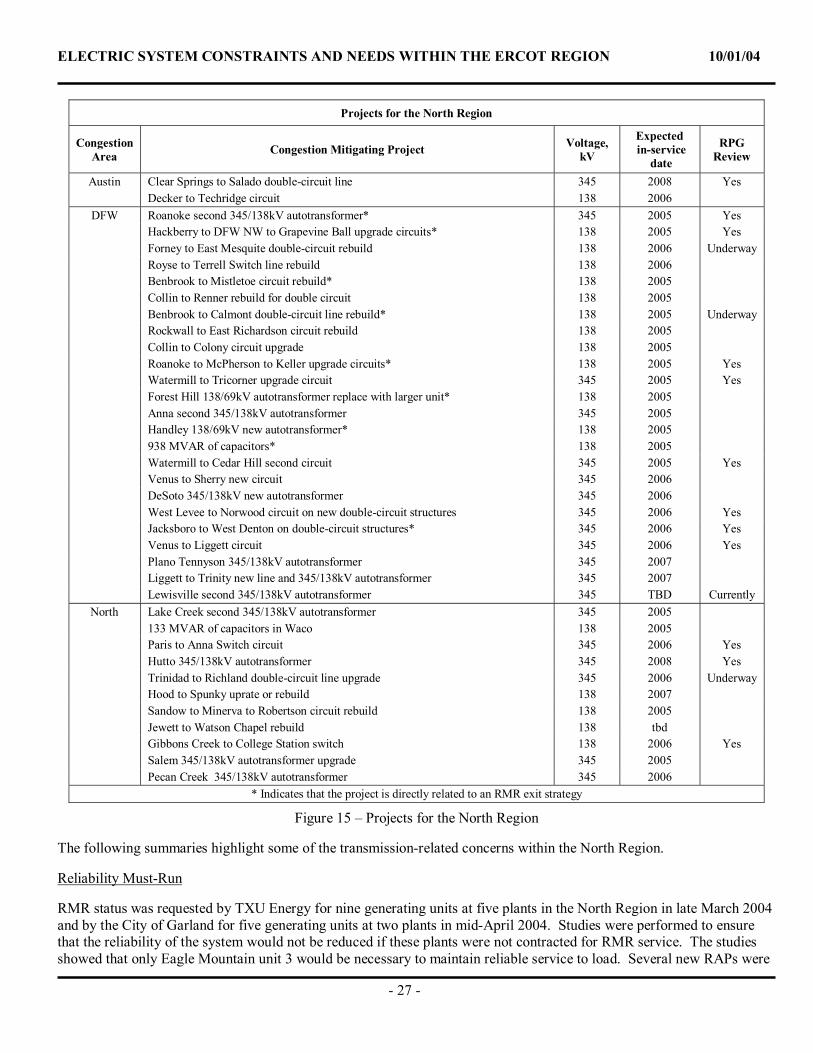
Figure 14 - Congestion Costs for the North Region Figure 15 is an excerpt from TPIT that highlights future transmission projects that will relieve loading on congested elements found in the North Region. In some cases, Figure 15 condenses several TPIT projects into a single line item. Figure 15 is not an inclusive list of all future transmission projects nor does it attempt to relate individual projects to specific congested items.
ELECTRIC SYSTEM CONSTRAINTS AND NEEDS WITHIN THE ERCOT REGION 10/01/04
- 27 -
Projects for the North Region
Congestion Area Congestion Mitigating Project Voltage,
kV
Expected in-service
date
RPG Review
Austin Clear Springs to Salado double-circuit line 345 2008 Yes Decker to Techridge circuit 138 2006
DFW Roanoke second 345/138kV autotransformer* 345 2005 Yes Hackberry to DFW NW to Grapevine Ball upgrade circuits* 138 2005 Yes Forney to East Mesquite double-circuit rebuild 138 2006 Underway Royse to Terrell Switch line rebuild 138 2006 Benbrook to Mistletoe circuit rebuild* 138 2005 Collin to Renner rebuild for double circuit 138 2005 Benbrook to Calmont double-circuit line rebuild* 138 2005 Underway Rockwall to East Richardson circuit rebuild 138 2005 Collin to Colony circuit upgrade 138 2005 Roanoke to McPherson to Keller upgrade circuits* 138 2005 Yes Watermill to Tricorner upgrade circuit 345 2005 Yes Forest Hill 138/69kV autotransformer replace with larger unit* 138 2005 Anna second 345/138kV autotransformer 345 2005 Handley 138/69kV new autotransformer* 138 2005 938 MVAR of capacitors* 138 2005 Watermill to Cedar Hill second circuit 345 2005 Yes Venus to Sherry new circuit 345 2006 DeSoto 345/138kV new autotransformer 345 2006 West Levee to Norwood circuit on new double-circuit structures 345 2006 Yes Jacksboro to West Denton on double-circuit structures* 345 2006 Yes Venus to Liggett circuit 345 2006 Yes Plano Tennyson 345/138kV autotransformer 345 2007 Liggett to Trinity new line and 345/138kV autotransformer 345 2007 Lewisville second 345/138kV autotransformer 345 TBD Currently
North Lake Creek second 345/138kV autotransformer 345 2005 133 MVAR of capacitors in Waco 138 2005 Paris to Anna Switch circuit 345 2006 Yes
Hutto 345/138kV autotransformer 345 2008 Yes Trinidad to Richland double-circuit line upgrade 345 2006 Underway
Hood to Spunky uprate or rebuild 138 2007 Sandow to Minerva to Robertson circuit rebuild 138 2005 Jewett to Watson Chapel rebuild 138 tbd Gibbons Creek to College Station switch 138 2006 Yes Salem 345/138kV autotransformer upgrade 345 2005 Pecan Creek 345/138kV autotransformer 345 2006
* Indicates that the project is directly related to an RMR exit strategy
Figure 15 – Projects for the North Region
The following summaries highlight some of the transmission-related concerns within the North Region.
Reliability Must-Run
RMR status was requested by TXU Energy for nine generating units at five plants in the North Region in late March 2004 and by the City of Garland for five generating units at two plants in mid-April 2004. Studies were performed to ensure that the reliability of the system would not be reduced if these plants were not contracted for RMR service. The studies showed that only Eagle Mountain unit 3 would be necessary to maintain reliable service to load. Several new RAPs were
ELECTRIC SYSTEM CONSTRAINTS AND NEEDS WITHIN THE ERCOT REGION 10/01/04
- 28 -
developed by TXU Electric Delivery to augment scheduled improvements to the transmission system to prevent damage to transmission facilities while maintaining reliability. Without these RAPs and system improvements more units would have been necessary to serve load reliably, and subsequently more units would have been contracted for RMR service.
Thirteen of the fourteen generating plants that requested RMR status are located within the four counties: Tarrant, Dallas, Collin, and Denton that are the center of the DFW area. The total generation capacity in the four counties was 5,486 MW, without these units there are 4,524 MW, a reduction of 1,322 MW or 22.6 % of the available generation within these four counties.
Major Constraints
Reliably moving power into, out of, and through the North Region and delivering power to the large load centers such as the DFW area are the greatest challenges in the region. A number of transmission line upgrade projects were completed in 2004 to relieve line constraints.
Around 400 MVAR of transmission capacitors were installed in 2004 to support the voltage in the region. Large installations of additional capacitors in later years are being studied.
345/138-kV autotransformers are necessary to get power to the load, which is primarily served from the 138-kV transmission network. Four autotransformers were installed in the DFW area by peak 2004, two are scheduled by peak 2005, and one is already scheduled for the 2006 peak while four are being studied for installation between 2006 and 2008. Studies are continually being performed to determine the location and number of 345/138-kV autotransformers that are necessary to reliably serve the load in DFW. Many 345/138-kV autotransformers are scheduled for installation in other North Region load centers between 2005 and 2008. A major concern in determining how many autotransformers to install and where to locate them is the lack of knowledge about the operation/dispatch of existing generation and the installation of future generation in the North Region.
Major Projects Scheduled Before 2006 Summer Peak
A project to convert several 69-kV facilities to 138-kV, construct a new switching station, and construct two miles of new 138-kV circuit in the Bryan – College Station area has been approved by the North Regional Planning Group (NRPG). This project is planned to improve facilities owned by Brazos Electric Cooperative (BEC), the City of College Station (COCS), and Texas Municipal Power Agency (TMPA). This project is considered a short-term improvement for the reliability needs of the Bryan – College Station area.
During the last year the NRPG and the ERCOT Board approved two major projects. West Denton to Jacksboro 345-kV and West Levee to Norwood 345-kV circuits are scheduled to be constructed by TXU Electric Delivery. The West Denton to Jacksboro circuit is important to support the rapid load growth that is occurring in the northern part of the DFW area. The West Levee to Norwood circuit provides a second electrical path to three large autotransformers that serve Dallas County. A much higher level of reliability is achieved when these autotransformers are connected to more than one 345-kV source. The Venus to Liggett 345-kV circuit and the Paris Switch to Anna 345-kV circuit, which were previously approved by the ERCOT Board, provide additional electrical paths into the DFW area. These projects will also help reduce congestion costs in the DFW area.
Numerous projects have been approved by the NRPG and were justified by the planning criteria. However, four projects in the DFW area that had been identified and justified using the reliability criteria have been accelerated to be completed by the summer peak 2005 based upon an economic study that was approved by the NRPG. These four projects (second 345 /138-kV Roanoke auto, reconductor Hackberry – DFW NW – Grapevine Ball 138-kV line, uprate Watermill – Tricorner 345-kV line by 20%, reconductor Roanoke – McPherson – Keller 138-kV line) were initially scheduled to be completed in 2006 and 2007.
ELECTRIC SYSTEM CONSTRAINTS AND NEEDS WITHIN THE ERCOT REGION 10/01/04
- 29 -
Major Projects Scheduled After 2006
There are several projects that are being evaluated for construction after the 2006 summer peak. The largest project is the Clear Springs to Salado double-circuit 345-kV line, which spans between the north and south planning regions. This study has been ongoing for several months, and the report is expected to be presented to all stakeholders late in 2004.
A study of the Bryan-College Station area has recently been started, and several options for a long-term reliability solution are currently being developed for study.
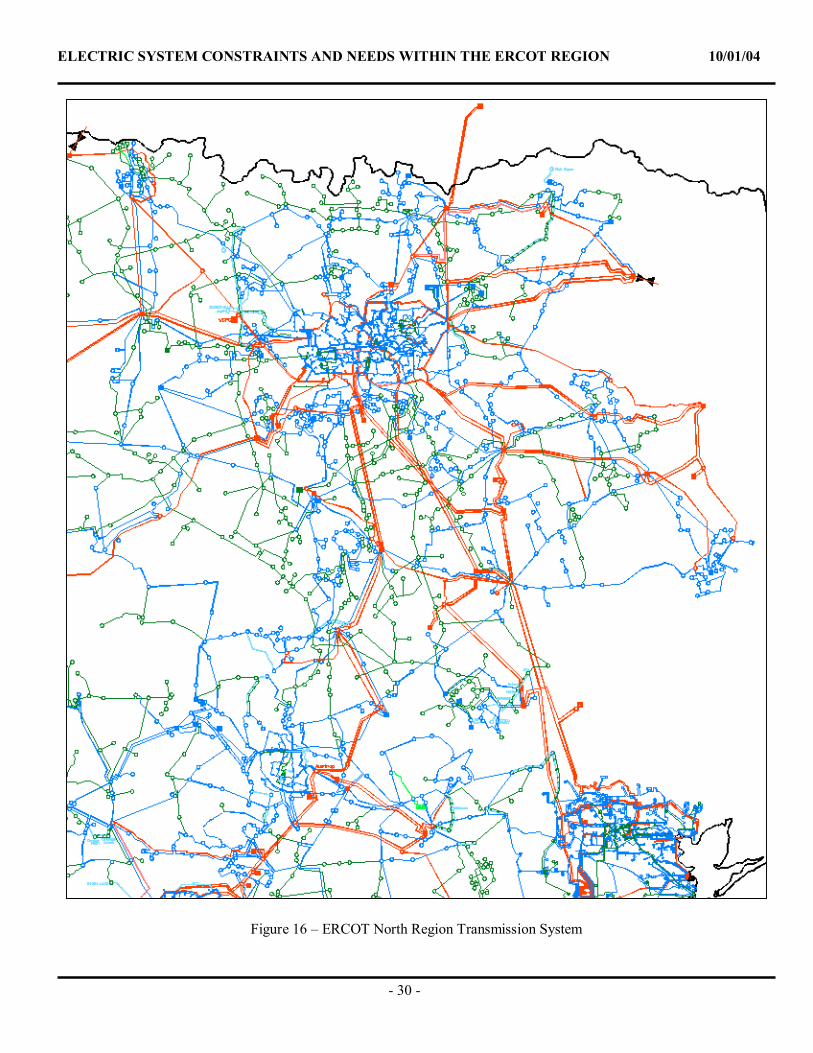
Figure 16 shows the North Region transmission system.
ELECTRIC SYSTEM CONSTRAINTS AND NEEDS WITHIN THE ERCOT REGION 10/01/04
- 30 -
Figure 16 – ERCOT North Region Transmission System
ELECTRIC SYSTEM CONSTRAINTS AND NEEDS WITHIN THE ERCOT REGION 10/01/04
- 31 -
West Region Discussion
The ERCOT West Region consists of 68 counties and has 7,589 MW of generation. It had 3,875 MW of coincident peak load in 2003. These numbers represent approximately 9% of the total ERCOT generation capacity and 7% of total ERCOT coincident peak load. The West Region showed no load growth between 1999 and 2003, compared to the average load growth of 2.1% for all of ERCOT. The West Region includes Wichita Falls and all of the ERCOT system west of Fort Worth, Waco, and Austin, and northwest of San Antonio and Del Rio. This area is characterized generally by low to no load growth. There are some areas where oil field development is resulting in significant load increases, but these occurrences are infrequent. Most of the transmission construction activity is currently being driven by the development of wind generation and changes in dispatch of existing area gas generation.
There have been 198 MW of new generation put into service in the West Region since August 2003. Depending on the status of the federal Production Tax Credit, there could be from 0 to 1,729 MW of new generation put into service by the end of 2005.
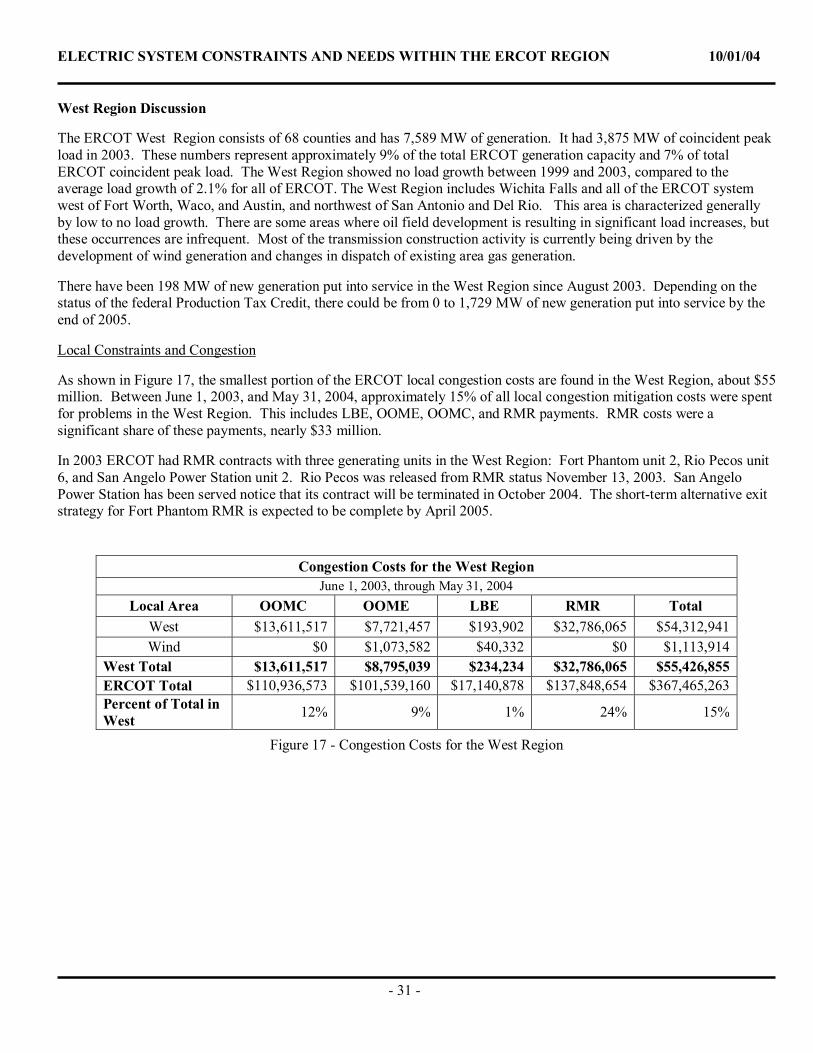
Local Constraints and Congestion
As shown in Figure 17, the smallest portion of the ERCOT local congestion costs are found in the West Region, about $55 million. Between June 1, 2003, and May 31, 2004, approximately 15% of all local congestion mitigation costs were spent for problems in the West Region. This includes LBE, OOME, OOMC, and RMR payments. RMR costs were a significant share of these payments, nearly $33 million.
In 2003 ERCOT had RMR contracts with three generating units in the West Region: Fort Phantom unit 2, Rio Pecos unit 6, and San Angelo Power Station unit 2. Rio Pecos was released from RMR status November 13, 2003. San Angelo Power Station has been served notice that its contract will be terminated in October 2004. The short-term alternative exit strategy for Fort Phantom RMR is expected to be complete by April 2005.
Congestion Costs for the West Region June 1, 2003, through May 31, 2004
Local Area OOMC OOME LBE RMR Total West $13,611,517 $7,721,457 $193,902 $32,786,065 $54,312,941 Wind $0 $1,073,582 $40,332 $0 $1,113,914
West Total $13,611,517 $8,795,039 $234,234 $32,786,065 $55,426,855 ERCOT Total $110,936,573 $101,539,160 $17,140,878 $137,848,654 $367,465,263 Percent of Total in West 12% 9% 1% 24% 15%
Figure 17 - Congestion Costs for the West Region
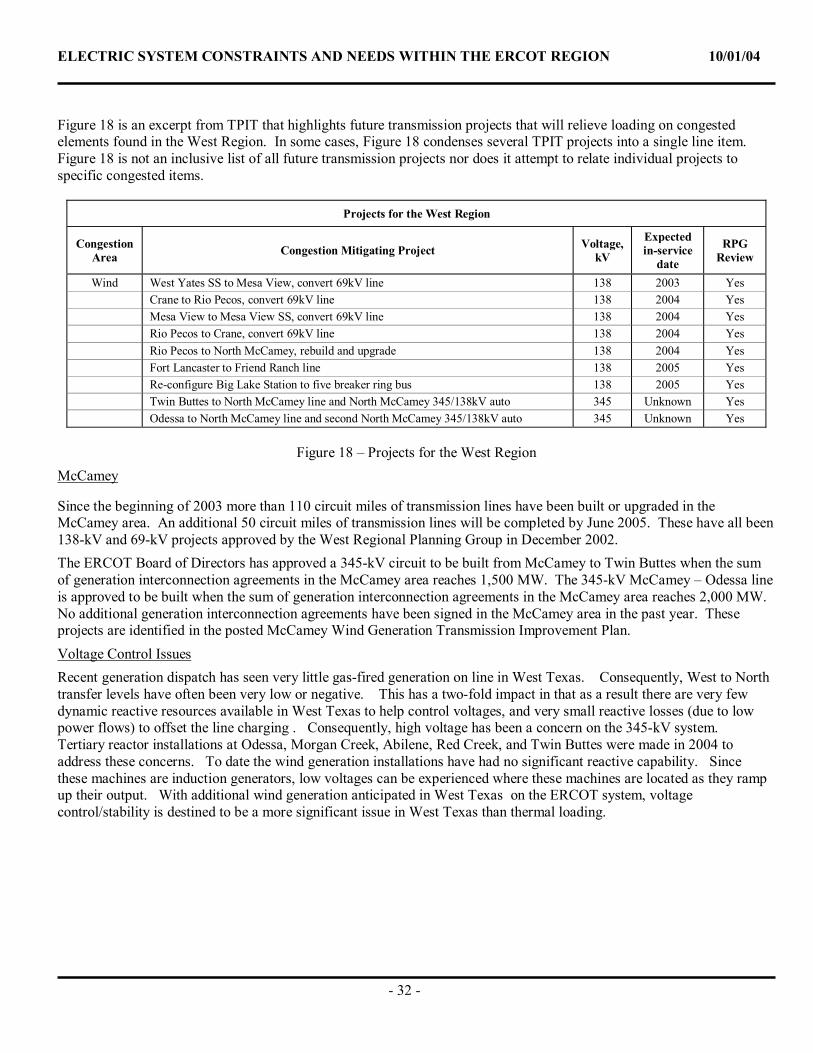
ELECTRIC SYSTEM CONSTRAINTS AND NEEDS WITHIN THE ERCOT REGION 10/01/04
- 32 -
Figure 18 is an excerpt from TPIT that highlights future transmission projects that will relieve loading on congested elements found in the West Region. In some cases, Figure 18 condenses several TPIT projects into a single line item. Figure 18 is not an inclusive list of all future transmission projects nor does it attempt to relate individual projects to specific congested items.
Projects for the West Region
Congestion Area Congestion Mitigating Project Voltage,
kV
Expected in-service
date
RPG Review
Wind West Yates SS to Mesa View, convert 69kV line 138 2003 Yes Crane to Rio Pecos, convert 69kV line 138 2004 Yes Mesa View to Mesa View SS, convert 69kV line 138 2004 Yes Rio Pecos to Crane, convert 69kV line 138 2004 Yes Rio Pecos to North McCamey, rebuild and upgrade 138 2004 Yes Fort Lancaster to Friend Ranch line 138 2005 Yes Re-configure Big Lake Station to five breaker ring bus 138 2005 Yes
Twin Buttes to North McCamey line and North McCamey 345/138kV auto 345 Unknown Yes Odessa to North McCamey line and second North McCamey 345/138kV auto 345 Unknown Yes
Figure 18 – Projects for the West Region
McCamey
Since the beginning of 2003 more than 110 circuit miles of transmission lines have been built or upgraded in the McCamey area. An additional 50 circuit miles of transmission lines will be completed by June 2005. These have all been 138-kV and 69-kV projects approved by the West Regional Planning Group in December 2002. The ERCOT Board of Directors has approved a 345-kV circuit to be built from McCamey to Twin Buttes when the sum of generation interconnection agreements in the McCamey area reaches 1,500 MW. The 345-kV McCamey – Odessa line is approved to be built when the sum of generation interconnection agreements in the McCamey area reaches 2,000 MW. No additional generation interconnection agreements have been signed in the McCamey area in the past year. These projects are identified in the posted McCamey Wind Generation Transmission Improvement Plan. Voltage Control Issues Recent generation dispatch has seen very little gas-fired generation on line in West Texas. Consequently, West to North transfer levels have often been very low or negative. This has a two-fold impact in that as a result there are very few dynamic reactive resources available in West Texas to help control voltages, and very small reactive losses (due to low power flows) to offset the line charging . Consequently, high voltage has been a concern on the 345-kV system. Tertiary reactor installations at Odessa, Morgan Creek, Abilene, Red Creek, and Twin Buttes were made in 2004 to address these concerns. To date the wind generation installations have had no significant reactive capability. Since these machines are induction generators, low voltages can be experienced where these machines are located as they ramp up their output. With additional wind generation anticipated in West Texas on the ERCOT system, voltage control/stability is destined to be a more significant issue in West Texas than thermal loading.
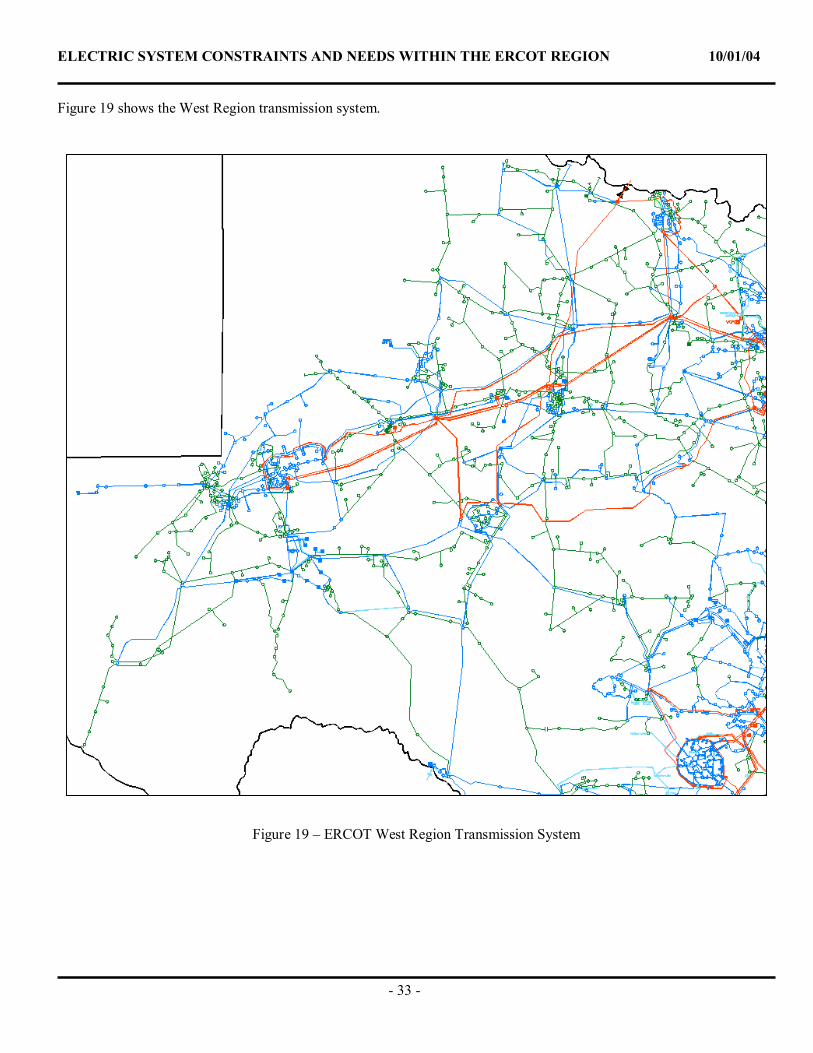
ELECTRIC SYSTEM CONSTRAINTS AND NEEDS WITHIN THE ERCOT REGION 10/01/04
- 33 -
Figure 19 shows the West Region transmission system.
Figure 19 – ERCOT West Region Transmission System
ELECTRIC SYSTEM CONSTRAINTS AND NEEDS WITHIN THE ERCOT REGION 10/01/04
- 34 -
Regulatory Authorization
Most new transmission line construction and some line reconstruction require the approval of the PUCT. It is the responsibility of the transmission service provider building the facility to apply for and obtain the Certificate of Convenience and Necessity (CCN) and all other required regulatory approvals. The present PUCT rules allow the PUCT up to 12 months for consideration of a contested CCN, with some provisions for expedited approval of uncontested applications and critical projects. The need to perform a routing study and for the transmission service provider to hold public meetings typically adds 12 months or more to the time required to certify and build a new transmission line. In most new transmission projects, the acquisition of right of way and construction can take up to 12 months after a CCN is granted by the PUCT. As a result, firm commitments should be made at least three years ahead of required in-service dates for most transmission line projects, and some projects may require commitments four to eight years in advance of system needs.
Transmission Line Routing
ERCOT's primary responsibility and concern is the reliability of the supply of electricity in an area that covers about 75% of the state. In carrying out that responsibility, ERCOT performs hundreds of short-range and long-range technical studies to determine where potential problem areas may be and decide which solutions to the technical issues are appropriate. When the studies indicate that new electric transmission facilities are required, ERCOT initiates a review of the technical merits of such facilities before the projects are formally recommended by ERCOT.
In the case of new transmission lines, ERCOT performs no specific routing evaluation or proposal at this stage other than generally trying to favor existing rights of way and avoiding known congested or environmentally sensitive areas. Indeed, it is impossible for ERCOT to do detailed routing evaluations given the number of potential projects to consider and the thousands of potentially affected properties.
Specific routing evaluations and proposals are the responsibility of the particular transmission service provider that develops and constructs each project. ERCOT encourages them to address landowner concerns and reach a mutually acceptable resolution. If that cannot be done, the specific routing issues can be raised and addressed at the PUCT in CCN proceedings related to the particular project.
Routes shown in the drawings in this document are for illustration only. Actual routes are the responsibility of the transmission service providers and the PUCT certification process.
Conservation, Efficiency, and Distributed Generation Programs
Additional conservation, energy efficiency, and distributed generation programs may help mitigate transmission constraints and the need for additional transmission. However, in a deregulated retail market, it will be much more difficult to quantify such factors. These factors will be included in future studies to the extent to which tangible data can be quantified and locations identified. Candidate areas for development of such projects that could mitigate the need for additional transmission include Dallas/Ft. Worth, Houston, Austin, San Antonio, Laredo, McAllen, Harlingen, and Brownsville, although the value of such projects will vary depending on the exact location and size of the projects within these general areas.
ELECTRIC SYSTEM CONSTRAINTS AND NEEDS WITHIN THE ERCOT REGION 10/01/04
- 35 -
Projected Congestion Discussion
Modeling
ERCOT has recently adopted computer simulation tools and developed processes to project congestion costs based on wholesale market fundamentals. These tools simulate the security-constrained unit commitment and economic dispatch of all generators in ERCOT to meet the projected ERCOT demand in each hour of the forecasted period. The relative dispatch merit of the generating units is determined by each unit’s fundamental variable cost drivers (heat rate, start-up cost, fuel price, etc.) and its operational constraints (minimum up and down times, ramp rates, etc.).
The ERCOT transmission network is fully represented utilizing the approved power flow models, and the system load in each hour is distributed across the appropriate transmission buses. The computer simulation results in a dispatch for each hour that is secure for potential contingencies of individual line segments, as well as the double circuits that are considered under the ERCOT criteria to be single elements. However, contingencies on elements with a nominal voltage of 69 kV and below, and overloads on those elements, are ignored. All currently approved SPSs and RAPs are modeled; RAPs may be added or modified for 2005. Due to model limitations, the ratings of transmission lines with dynamic ratings are modeled as changing monthly, based on the peak temperature for the month.
The study is intended to identify likely transmission security violations that will require ERCOT operations to issue generation redispatch instructions resulting in congestion uplifts to market participants. Several limitations in the data and market assumptions exist. The analysis does not take into consideration the following:
• Transmission construction and maintenance outages • Simulation of bidding behavior other than cost-based bids, • Any special fuel, fuel delivery, or power purchase agreements.
However, the results provide a valid starting point to develop more detailed analyses by the regional planning groups. It is also worth noting that congestion on several of these elements is well known and projects are under review to correct them, while congestion may be experienced on other elements not identified in the analysis due to actual conditions outside the assumptions of this analysis.
ELECTRIC SYSTEM CONSTRAINTS AND NEEDS WITHIN THE ERCOT REGION 10/01/04
- 36 -
Results
Using this approach, the ERCOT system was simulated for the year 2005, using the topology of the transmission network (including new planned facilities) that is included in the ERCOT Steady-State Working Group peak case. The congestion cost for a line segment is defined as the shadow price of the constraint multiplied by the line rating, summed across all hours of the year. The lines with the highest annual congestion costs were identified. Figure 20 shows the transmission circuits which are projected to have congestion costs greater than $500,000 for the year, based on this simulation.
Congested Line Planning Region Solution (Planned or Under Study)
STP-Parish 345-kV line South CSC/CRE; STP-Hillje-WA Parish 345-kV project Austrop 345/138-kV auto North Clear Springs-Salado 345-kV line Allen #2 345/138-kV auto North Plano Tennyson 345/138-kV auto Taylor-Taylor West 138-kV North Clear Springs-Salado 345-kV line Collin 345/138-kV auto North Second 345/138-kV auto Austin-Tuttle South Under study La Palma-Rio Hondo 138-kV line South Upgrade line and LaPalma-Rio Hondo 345-kV line
Marion-Skyline 345-kV lines South to North Elm Creek 345-kV switch station; Clear Springs-Salado 345-kV line
Laredo import limit South San Miguel – Laredo 345-kV line Everman-Decordova 345-kV line North Upgrade line Big Brown-Jewett 345-kV line North Under study Fayette 345/138-kV auto North Under study Gibbons Creek-Obrien 345-kV line North to South CSC/CRE; STP-Hillje-WA Parish 345-kV project Ballpark-Deely 138-kV line South Under study Zorn-Clear Springs 345-kV line South to North Clear Springs-Salado and Cagnon-Kendall 345-kV linesTerrell NT-Terrell N 138-kV line North Upgrade line
Tomball-Jewett 345-kV line North to South CSC/CRE; upgrade & STP-Hillje-WA Parish 345-kV project
Techridge-Howard Ln 138-kV line North Clear Springs-Salado 345-kV line Greenville 138/69-kV autos North Under study; upgrade autos Sandow-Salty 138-kV line North Clear Springs-Salado 345-kV line Decordova-Decordova SB North Second Concord 345/138-kV autotransformer Nueces Bay-White Point 138-kV line South Under study;RMR exit strategy projects Asherton-N Laredo 138-kV line South RMR exit strategy project
Zorn 345/138-kV autos North Zorn 345-kV bus switching; Clear Springs-Salado 345-kV line
Figure 20 - Projected Congestion
Transmission upgrades are currently planned or under consideration to alleviate congestion on several of these congested elements are shown in the figure. The remaining congested elements will be the focus of further study over the next year in order to determine whether economic projects should be planned to reduce the congestion on those elements.
ELECTRIC SYSTEM CONSTRAINTS AND NEEDS WITHIN THE ERCOT REGION 10/01/04
- 37 -
CONSTRAINTS AND CONGESTION ZONES A sound and reliable electricity infrastructure is a fundamental underpinning of a region’s economy and the daily life of its citizens. Consider how many electricity-powered devices are in homes or workplaces now or how many new homes, office buildings, and other developments exist now compared to 25 years ago.
A reliable supply of electricity is so basic to life today that we only tend to think about it when it is not there. The excellent past performance of the nation’s electrical system and its operators have created the sense that we can continue to progress indefinitely with what we have now. However, the existing transmission system was not built to accommodate the vastly expanded amounts and types of energy flows that have developed in recent years.
Distribution Constraints
ERCOT can identify the transmission constraints but is dependent on the distribution service providers for information on distribution constraints. Distribution constraints do not affect the ability of specific generation to serve load but may affect the reliability of service. The configuration of a distribution system (i.e., predominantly a radial system) is such that there are no constraints that are comparable to those on a transmission system. Distribution entities usually monitor and perform a comprehensive analysis of their distribution system during peak load periods. During this analysis of the distribution system, the following areas are analyzed: substation transformer and breaker loading, conductor and line device loading, load balance, steady-state voltage level, short-circuit protection and coordination, service reliability, and system configuration. This analysis is the basis for distribution system improvements that are performed to ensure the continued safe and reliable provision of electric service to customers.
Because of the low cost impact of congestion in distribution systems, no distribution constraints that merit consideration have been identified.
Transmission Constraints
A transmission constraint is a physical limitation in the transmission system that prevents the reliable delivery of electricity. It also prevents the full potential of economic and competitive exchange of electric power among all market participants.
Transmission constraints complicate ERCOT system security management, lead to economic inefficiencies, and can create captive markets. They reduce liquidity of the market and can create must-run generation, resulting in increased utilization of inefficient units and reduced utilization of more efficient units.
New transmission capacity provided by system improvements maintains reliable service to load, allows new generation to be fully integrated into the grid, provides for additional competition, and promotes lower energy prices. A robust transmission network is required to support a liquid competitive electricity market. Despite their operating importance, the direct cost of transmission facilities is a small fraction of the total cost of electricity, typically much less than 10% of a customer’s bill.
Commercially Significant Constraints
A commercially significant constraint (CSC) is a constraint in the transmission grid that limits the free flow of energy within the ERCOT market to a commercially significant degree. This report does not address the establishment of CSCs as described in ERCOT Protocols Section 7. CSCs are established annually in a stakeholder process for supporting congestion management operations and allocating zonal congestion management costs.
ERCOT has implemented a zonal balancing energy market design for the resolution of transmission congestion across CSCs based on power-flow calculations. In this market design, the ERCOT transmission grid, including generation resources and load, is divided into a predetermined number of congestion zones. Figures 21 and 22 show the approximate congestion zones for 2003 and 2004, respectively.
ELECTRIC SYSTEM CONSTRAINTS AND NEEDS WITHIN THE ERCOT REGION 10/01/04
- 38 -
2003 CM Zones
Houston
North
South
West
Figure 21 – Congestion Zones for 2003
Figure 22 – Congestion Zones for 2004
2004 CM Zones Houston
North
Northeast
South
West
ELECTRIC SYSTEM CONSTRAINTS AND NEEDS WITHIN THE ERCOT REGION 10/01/04
- 39 -
There were four zones for 2003 and three CSCs: West-North, South-North, and South-Houston. For 2004, a fifth zone, the Northeast zone, was developed from the North Zone. There are five CSCs for 2004: West-North, South-North, South-Houston, North-Houston, and Northeast-North. CSCs are shown as white arrows in Figures 21 and 22. Zonal congestion is resolved on every 15-minute interval by a linear programming algorithm solving simultaneously for power balance and the CSCs between zones.
Congestion Management Costs For CSCs
The two ERCOT market services utilized for the resolution of CSC congestion are Balancing Energy Service and Zonal Replacement Reserve Service. The costs presented herein include the amounts settled for these two services consistent with the ERCOT Protocols and were based on data as of mid-August 2004. Final congestion costs reflected in true-up settlement statements and other re-settlements may vary based on subsequent metering information received at ERCOT.
Balancing Energy Service for Congestion Management
Balancing Energy Service (BES) makes up the difference between total electricity requirements and the sum of the energy schedules on a zonal basis. ERCOT deploys up BES on the load side of the CSC at a marginal incremental price and down BES on the generation side of the CSC at a marginal decremental price based on submitted BES bids. Interzonal congestion management charges are directly assigned to scheduled power flows that impact congested CSCs. Figures 23 and 24 show the balancing energy costs by constraint for 2003 and 2004, respectively.
Figure 23– Balancing Energy Costs 2003
In 2003, the South-North constraint accounted for 54% of the balancing energy costs for congestion management, the South-Houston constraint accounted for 46% of the costs, and the West-North constraint accounted for less than 1%.
Figure 24– Balancing Energy Costs for 2004
Balancing Energy Costs for 2003
June 1, 2003, through December 31, 2003
Constraint Cost South-North $4,959,668 West-North $14,453
South-Houston $4,288,174 Total $9,262,295
Balancing Energy Costs for 2004
January 1, 2004, through May 31, 2004
Constraint Cost South-North $2,223,684 West-North $0
South-Houston $1,948,814 North-Houston $2,609,835 Northeast-North $6,915,497
Total $13,697,829
ELECTRIC SYSTEM CONSTRAINTS AND NEEDS WITHIN THE ERCOT REGION 10/01/04
- 40 -
In 2004, the Northeast-North constraint accounted for 51% of the costs and the North-Houston constraint for 19%. The total balancing energy costs for congestion management between June 1, 2003, and May 31, 2004, were $22,960,124.
The average cost of each CSC constraint is shown in Figures 25 and 26. The average is calculated by dividing the cost for each constraint by the total number of 15-minute intervals or the number of days.
Average Balancing Energy Costs for 2003
June 1, 2003, through December 31, 2003
Constraint Per-Interval Costs Per-Day Costs South-North $241 $23,176 West-North $1 $68
South-Houston $209 $20,038 Total $451 $43,282
Figure 25 – Average Balancing Energy Costs 2003
Average Balancing Energy Costs for 2004
January 1, 2004, through May 31, 2004
Constraint Per-Interval Costs Per-Day Costs South-North $152 $14,629 West-North $0 $0
South-Houston $134 $12,821 North-Houston $179 $17,170
Northeast-North $474 $45,497 Total $939 $90,117
Figure 26 – Average Balancing Energy Costs for 2004
Zonal Replacement Reserve Service
Replacement Reserve Service (RPRS) is procured from generation units planned to be off line and loads acting as resources that are available for interruption during the requirement period. When deployed, units providing RPRS are capable of providing additional balancing energy service to ERCOT. Replacement Reserve Service was not required between June 1, 2003, and May 31, 2004.
Local Constraints
A local constraint (LC) is a bottleneck that limits the flow of energy in areas generally within one congestion zone. ERCOT has identified eleven general areas with local constraints. These areas are Austin, Corpus Christi, Dallas/Fort Worth (DFW), Houston, Laredo, North, Rio Grande Valley, San Antonio, South, West, and Wind. The most significant of these areas (based on costs) are Dallas/Fort Worth, North, West (McCamey, San Angelo, Morgan East), Houston and South. These five areas account for 90% of the total local balancing and out-of-merit costs.
ELECTRIC SYSTEM CONSTRAINTS AND NEEDS WITHIN THE ERCOT REGION 10/01/04
- 41 -
Congestion Management Costs For LCs
Three ERCOT market services are utilized for the resolution of local congestion: Local Balancing Energy Service, Out-of-Merit Energy, and Out-of-Merit Capacity. While these services may be procured for other reliability needs, the costs included in this report are those incurred in the resolution of local congestion in the ERCOT LCs.
Local Balancing Energy (LBE) Service
Local Balancing Energy Service is used to manage local congestion when the market solution test is met in accordance to Section 7 of the ERCOT Protocols. Figure 27 shows the local balancing costs by local area for June and July 2003. Since August 2003 all Local Balancing Energy has been paid as OOME due to a protocol change that determined the LBE was not working as designed and would be discontinued in the ERCOT market. The North area accounts for most of the costs, with 62%, and DFW is second with 31%.
Local Balancing Energy Costs
June 1, 2003, through July 31, 2003
Area Up Down Total
Austin $53,888 $35,106 $88,994
Corpus Christi $123,312 $140,916 $264,228
DFW $5,242,414 $90,414 $5,332,828
Houston $0 $0 $0
Laredo $0 $0 $0
North $2,563,076 $8,112,475 $10,675,551
San Antonio $76,852 $53,451 $130,302
South $65,571 $321,653 $387,224
Valley $8,117 $19,400 $27,516
West $108,615 $85,287 $193,902
Wind $11,392 $28,940 $40,332
Total $8,253,236 $8,887,641 $17,140,878
Figure 27 – Local Balancing Energy Costs (Totals may not match because of rounding.)
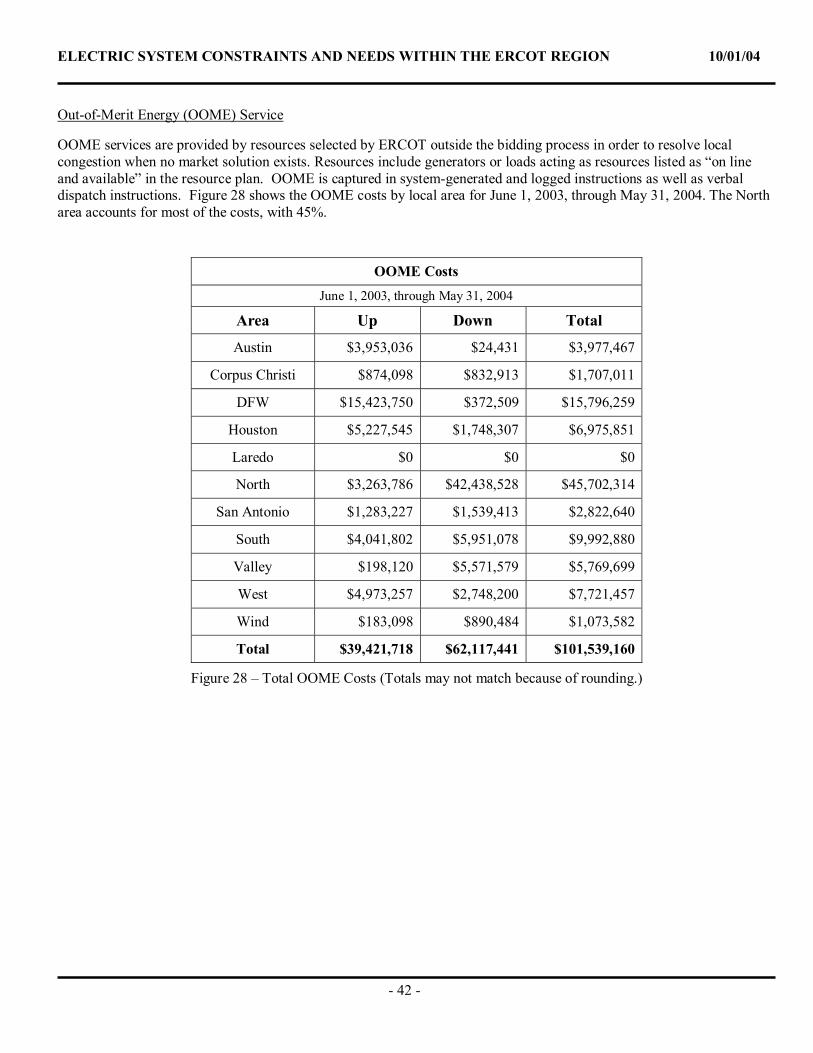
ELECTRIC SYSTEM CONSTRAINTS AND NEEDS WITHIN THE ERCOT REGION 10/01/04
- 42 -
Out-of-Merit Energy (OOME) Service
OOME services are provided by resources selected by ERCOT outside the bidding process in order to resolve local congestion when no market solution exists. Resources include generators or loads acting as resources listed as “on line and available” in the resource plan. OOME is captured in system-generated and logged instructions as well as verbal dispatch instructions. Figure 28 shows the OOME costs by local area for June 1, 2003, through May 31, 2004. The North area accounts for most of the costs, with 45%.
OOME Costs June 1, 2003, through May 31, 2004
Area Up Down Total
Austin $3,953,036 $24,431 $3,977,467
Corpus Christi $874,098 $832,913 $1,707,011
DFW $15,423,750 $372,509 $15,796,259
Houston $5,227,545 $1,748,307 $6,975,851
Laredo $0 $0 $0
North $3,263,786 $42,438,528 $45,702,314
San Antonio $1,283,227 $1,539,413 $2,822,640
South $4,041,802 $5,951,078 $9,992,880
Valley $198,120 $5,571,579 $5,769,699
West $4,973,257 $2,748,200 $7,721,457
Wind $183,098 $890,484 $1,073,582
Total $39,421,718 $62,117,441 $101,539,160
Figure 28 – Total OOME Costs (Totals may not match because of rounding.)
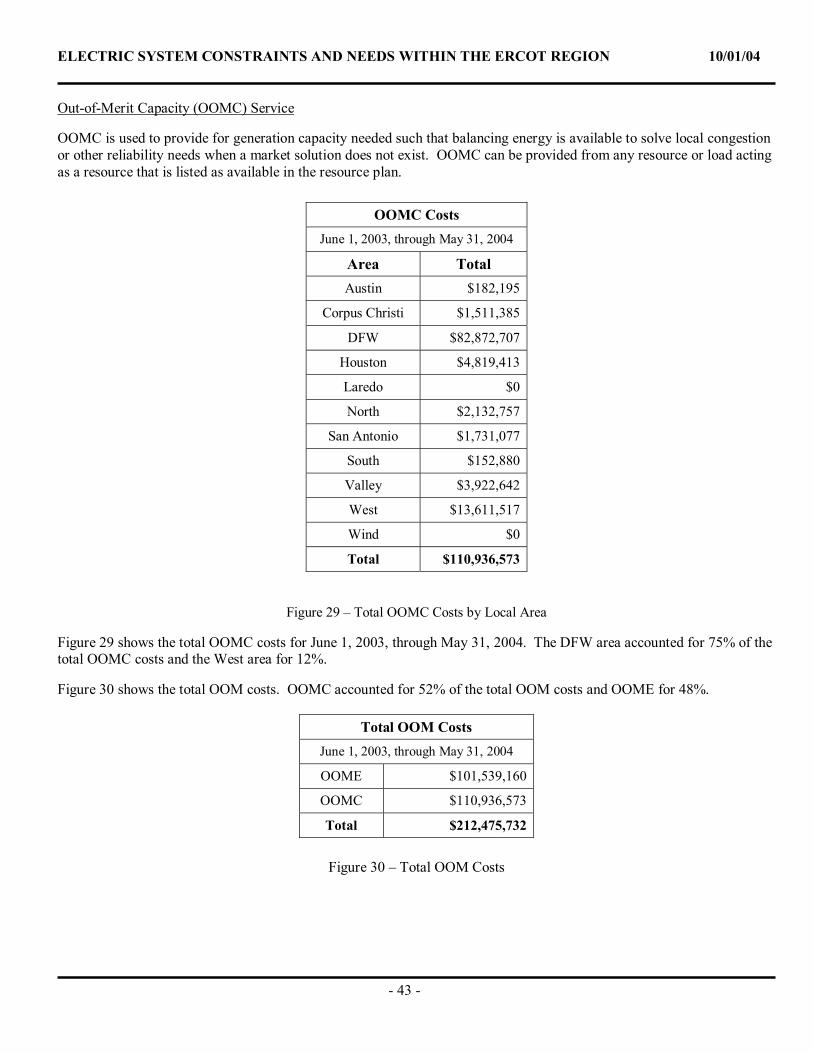
ELECTRIC SYSTEM CONSTRAINTS AND NEEDS WITHIN THE ERCOT REGION 10/01/04
- 43 -
Out-of-Merit Capacity (OOMC) Service
OOMC is used to provide for generation capacity needed such that balancing energy is available to solve local congestion or other reliability needs when a market solution does not exist. OOMC can be provided from any resource or load acting as a resource that is listed as available in the resource plan.
Figure 29 – Total OOMC Costs by Local Area
Figure 29 shows the total OOMC costs for June 1, 2003, through May 31, 2004. The DFW area accounted for 75% of the total OOMC costs and the West area for 12%.
Figure 30 shows the total OOM costs. OOMC accounted for 52% of the total OOM costs and OOME for 48%.
Figure 30 – Total OOM Costs
OOMC Costs June 1, 2003, through May 31, 2004
Area Total Austin $182,195
Corpus Christi $1,511,385
DFW $82,872,707
Houston $4,819,413
Laredo $0
North $2,132,757
San Antonio $1,731,077
South $152,880
Valley $3,922,642
West $13,611,517
Wind $0
Total $110,936,573
Total OOM Costs June 1, 2003, through May 31, 2004
OOME $101,539,160
OOMC $110,936,573
Total $212,475,732
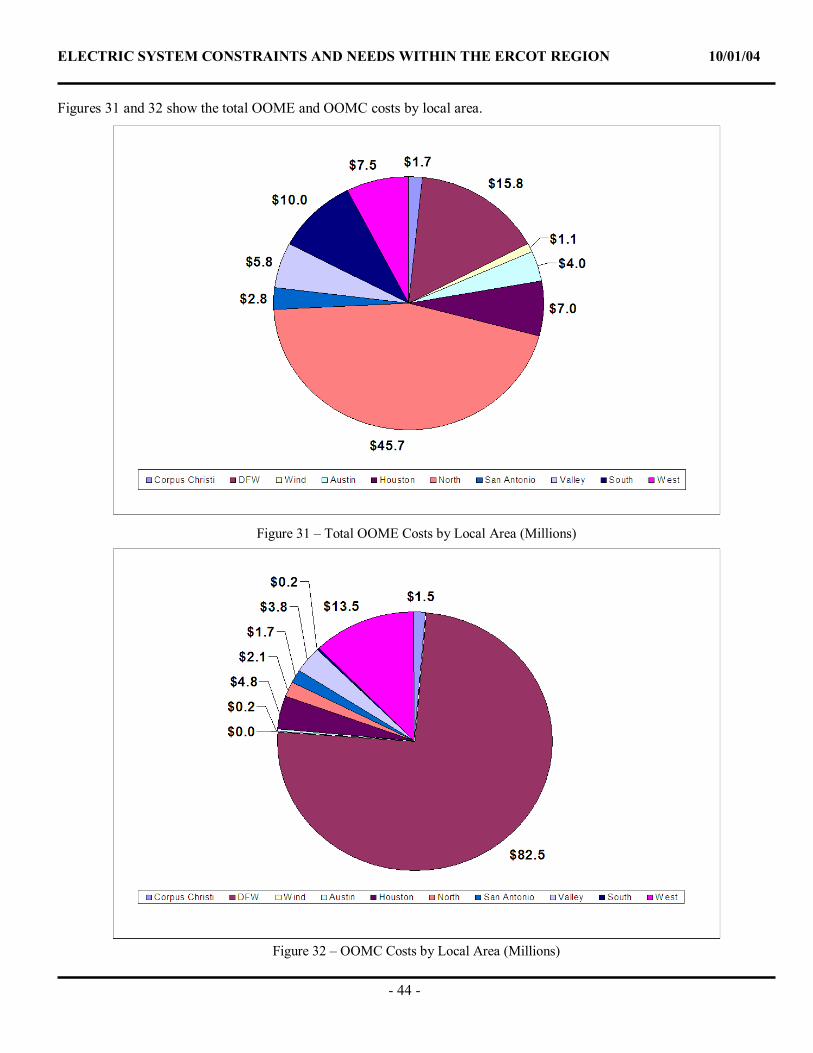
ELECTRIC SYSTEM CONSTRAINTS AND NEEDS WITHIN THE ERCOT REGION 10/01/04
- 44 -
Figures 31 and 32 show the total OOME and OOMC costs by local area.
Figure 31 – Total OOME Costs by Local Area (Millions)
Figure 32 – OOMC Costs by Local Area (Millions)
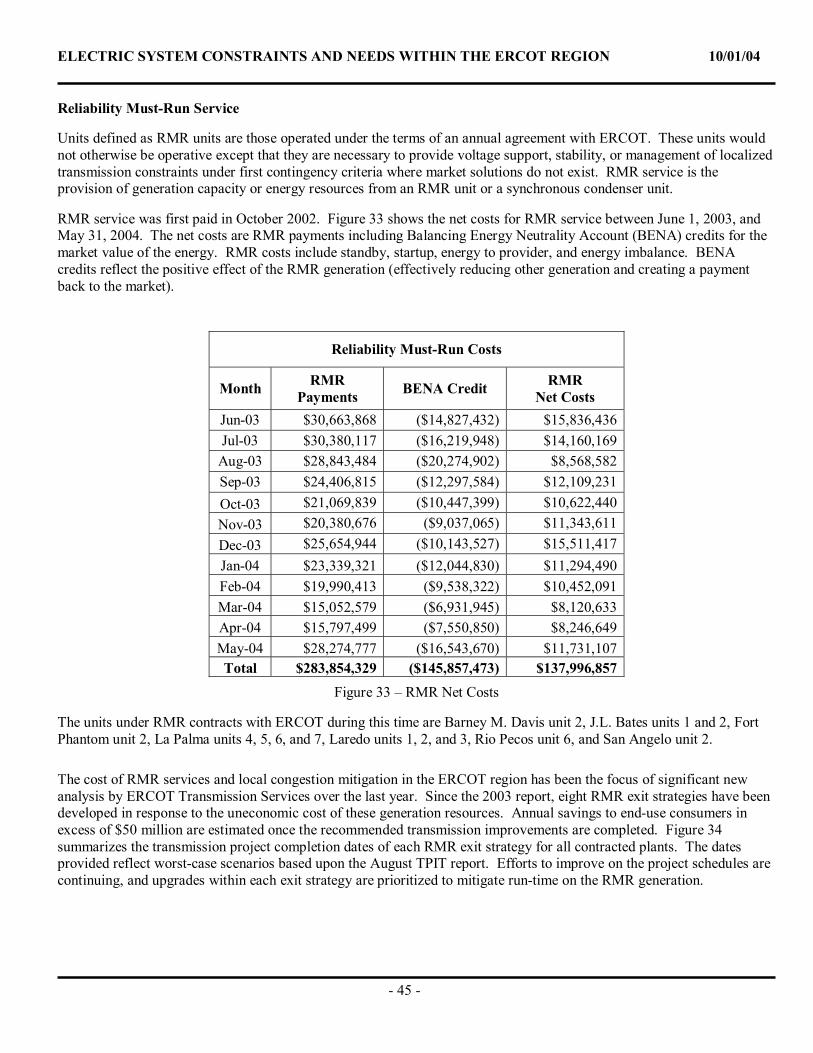
ELECTRIC SYSTEM CONSTRAINTS AND NEEDS WITHIN THE ERCOT REGION 10/01/04
- 45 -
Reliability Must-Run Service
Units defined as RMR units are those operated under the terms of an annual agreement with ERCOT. These units would not otherwise be operative except that they are necessary to provide voltage support, stability, or management of localized transmission constraints under first contingency criteria where market solutions do not exist. RMR service is the provision of generation capacity or energy resources from an RMR unit or a synchronous condenser unit.
RMR service was first paid in October 2002. Figure 33 shows the net costs for RMR service between June 1, 2003, and May 31, 2004. The net costs are RMR payments including Balancing Energy Neutrality Account (BENA) credits for the market value of the energy. RMR costs include standby, startup, energy to provider, and energy imbalance. BENA credits reflect the positive effect of the RMR generation (effectively reducing other generation and creating a payment back to the market).
Reliability Must-Run Costs
Month RMR Payments BENA Credit RMR
Net Costs Jun-03 $30,663,868 ($14,827,432) $15,836,436 Jul-03 $30,380,117 ($16,219,948) $14,160,169
Aug-03 $28,843,484 ($20,274,902) $8,568,582 Sep-03 $24,406,815 ($12,297,584) $12,109,231 Oct-03 $21,069,839 ($10,447,399) $10,622,440 Nov-03 $20,380,676 ($9,037,065) $11,343,611 Dec-03 $25,654,944 ($10,143,527) $15,511,417 Jan-04 $23,339,321 ($12,044,830) $11,294,490 Feb-04 $19,990,413 ($9,538,322) $10,452,091 Mar-04 $15,052,579 ($6,931,945) $8,120,633 Apr-04 $15,797,499 ($7,550,850) $8,246,649 May-04 $28,274,777 ($16,543,670) $11,731,107 Total $283,854,329 ($145,857,473) $137,996,857
Figure 33 – RMR Net Costs
The units under RMR contracts with ERCOT during this time are Barney M. Davis unit 2, J.L. Bates units 1 and 2, Fort Phantom unit 2, La Palma units 4, 5, 6, and 7, Laredo units 1, 2, and 3, Rio Pecos unit 6, and San Angelo unit 2. The cost of RMR services and local congestion mitigation in the ERCOT region has been the focus of significant new analysis by ERCOT Transmission Services over the last year. Since the 2003 report, eight RMR exit strategies have been developed in response to the uneconomic cost of these generation resources. Annual savings to end-use consumers in excess of $50 million are estimated once the recommended transmission improvements are completed. Figure 34 summarizes the transmission project completion dates of each RMR exit strategy for all contracted plants. The dates provided reflect worst-case scenarios based upon the August TPIT report. Efforts to improve on the project schedules are continuing, and upgrades within each exit strategy are prioritized to mitigate run-time on the RMR generation.
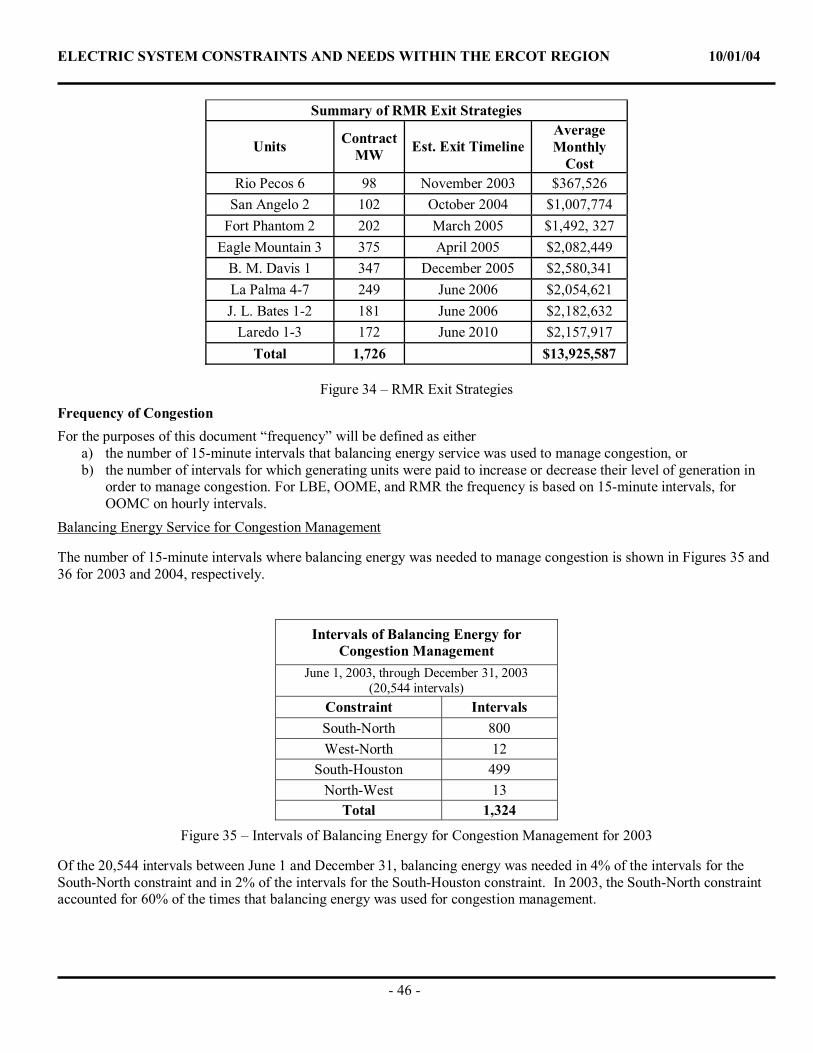
ELECTRIC SYSTEM CONSTRAINTS AND NEEDS WITHIN THE ERCOT REGION 10/01/04
- 46 -
Summary of RMR Exit Strategies
Units Contract MW Est. Exit Timeline
Average Monthly
Cost Rio Pecos 6 98 November 2003 $367,526
San Angelo 2 102 October 2004 $1,007,774 Fort Phantom 2 202 March 2005 $1,492, 327
Eagle Mountain 3 375 April 2005 $2,082,449 B. M. Davis 1 347 December 2005 $2,580,341 La Palma 4-7 249 June 2006 $2,054,621 J. L. Bates 1-2 181 June 2006 $2,182,632
Laredo 1-3 172 June 2010 $2,157,917 Total 1,726 $13,925,587
Figure 34 – RMR Exit Strategies
Frequency of Congestion For the purposes of this document “frequency” will be defined as either
a) the number of 15-minute intervals that balancing energy service was used to manage congestion, or b) the number of intervals for which generating units were paid to increase or decrease their level of generation in
order to manage congestion. For LBE, OOME, and RMR the frequency is based on 15-minute intervals, for OOMC on hourly intervals.
Balancing Energy Service for Congestion Management
The number of 15-minute intervals where balancing energy was needed to manage congestion is shown in Figures 35 and 36 for 2003 and 2004, respectively.
Intervals of Balancing Energy for Congestion Management
June 1, 2003, through December 31, 2003 (20,544 intervals)
Constraint Intervals South-North 800 West-North 12
South-Houston 499 North-West 13
Total 1,324
Figure 35 – Intervals of Balancing Energy for Congestion Management for 2003
Of the 20,544 intervals between June 1 and December 31, balancing energy was needed in 4% of the intervals for the South-North constraint and in 2% of the intervals for the South-Houston constraint. In 2003, the South-North constraint accounted for 60% of the times that balancing energy was used for congestion management.
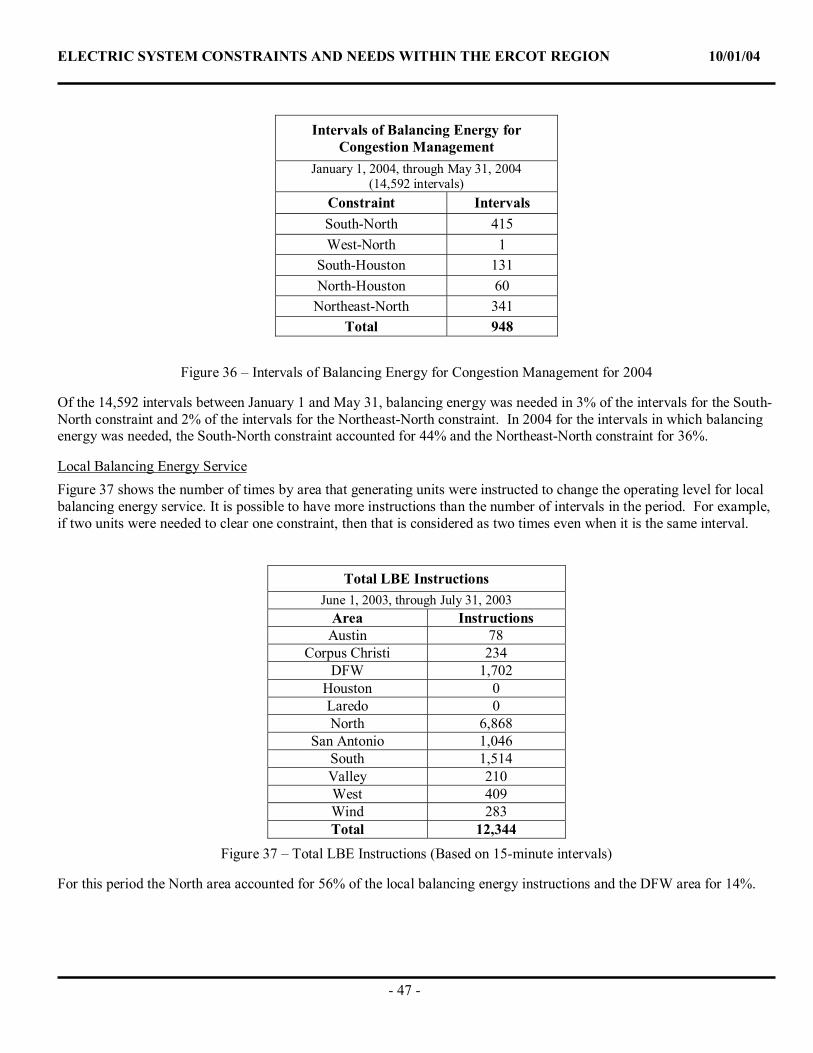
ELECTRIC SYSTEM CONSTRAINTS AND NEEDS WITHIN THE ERCOT REGION 10/01/04
- 47 -
Figure 36 – Intervals of Balancing Energy for Congestion Management for 2004
Of the 14,592 intervals between January 1 and May 31, balancing energy was needed in 3% of the intervals for the South-North constraint and 2% of the intervals for the Northeast-North constraint. In 2004 for the intervals in which balancing energy was needed, the South-North constraint accounted for 44% and the Northeast-North constraint for 36%.
Local Balancing Energy Service Figure 37 shows the number of times by area that generating units were instructed to change the operating level for local balancing energy service. It is possible to have more instructions than the number of intervals in the period. For example, if two units were needed to clear one constraint, then that is considered as two times even when it is the same interval.
Total LBE Instructions June 1, 2003, through July 31, 2003
Area Instructions Austin 78
Corpus Christi 234 DFW 1,702
Houston 0 Laredo 0 North 6,868
San Antonio 1,046 South 1,514 Valley 210 West 409 Wind 283 Total 12,344
Figure 37 – Total LBE Instructions (Based on 15-minute intervals)
For this period the North area accounted for 56% of the local balancing energy instructions and the DFW area for 14%.
Intervals of Balancing Energy for Congestion Management
January 1, 2004, through May 31, 2004 (14,592 intervals)
Constraint Intervals South-North 415 West-North 1
South-Houston 131 North-Houston 60
Northeast-North 341 Total 948
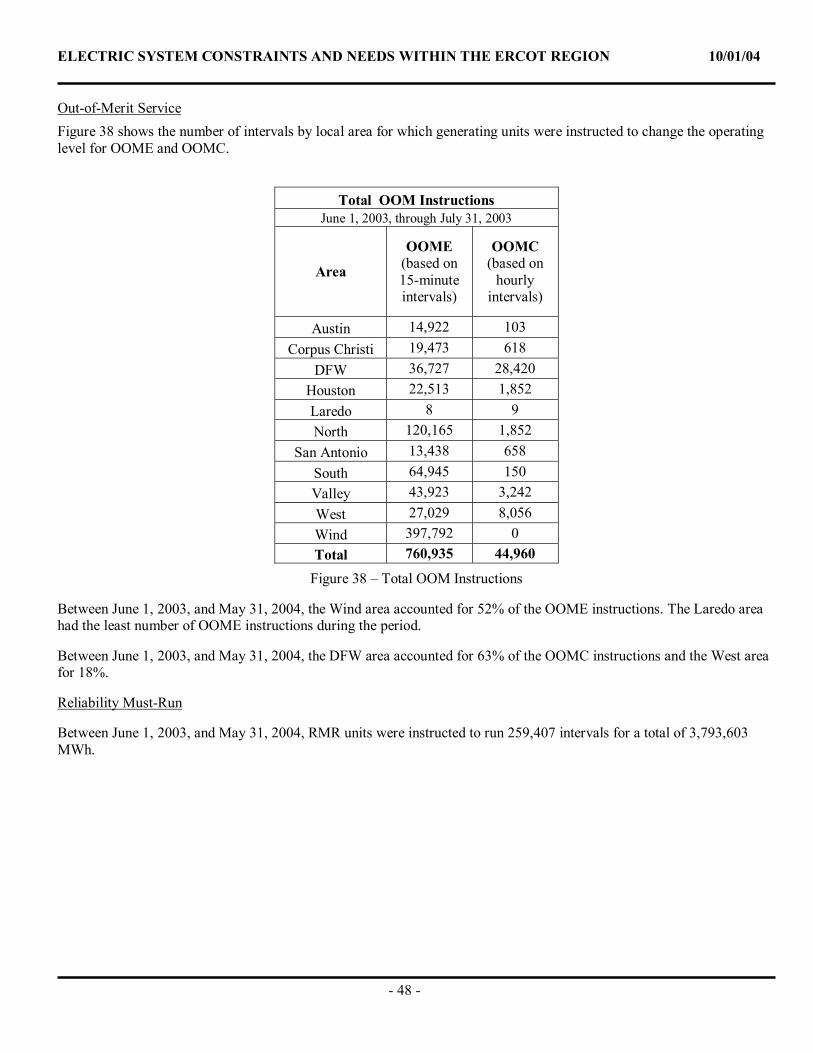
ELECTRIC SYSTEM CONSTRAINTS AND NEEDS WITHIN THE ERCOT REGION 10/01/04
- 48 -
Out-of-Merit Service Figure 38 shows the number of intervals by local area for which generating units were instructed to change the operating level for OOME and OOMC.
Total OOM Instructions June 1, 2003, through July 31, 2003
Area
OOME (based on 15-minute intervals)
OOMC (based on
hourly intervals)
Austin 14,922 103 Corpus Christi 19,473 618
DFW 36,727 28,420 Houston 22,513 1,852 Laredo 8 9 North 120,165 1,852
San Antonio 13,438 658 South 64,945 150 Valley 43,923 3,242 West 27,029 8,056 Wind 397,792 0 Total 760,935 44,960
Figure 38 – Total OOM Instructions
Between June 1, 2003, and May 31, 2004, the Wind area accounted for 52% of the OOME instructions. The Laredo area had the least number of OOME instructions during the period.
Between June 1, 2003, and May 31, 2004, the DFW area accounted for 63% of the OOMC instructions and the West area for 18%.
Reliability Must-Run
Between June 1, 2003, and May 31, 2004, RMR units were instructed to run 259,407 intervals for a total of 3,793,603 MWh.
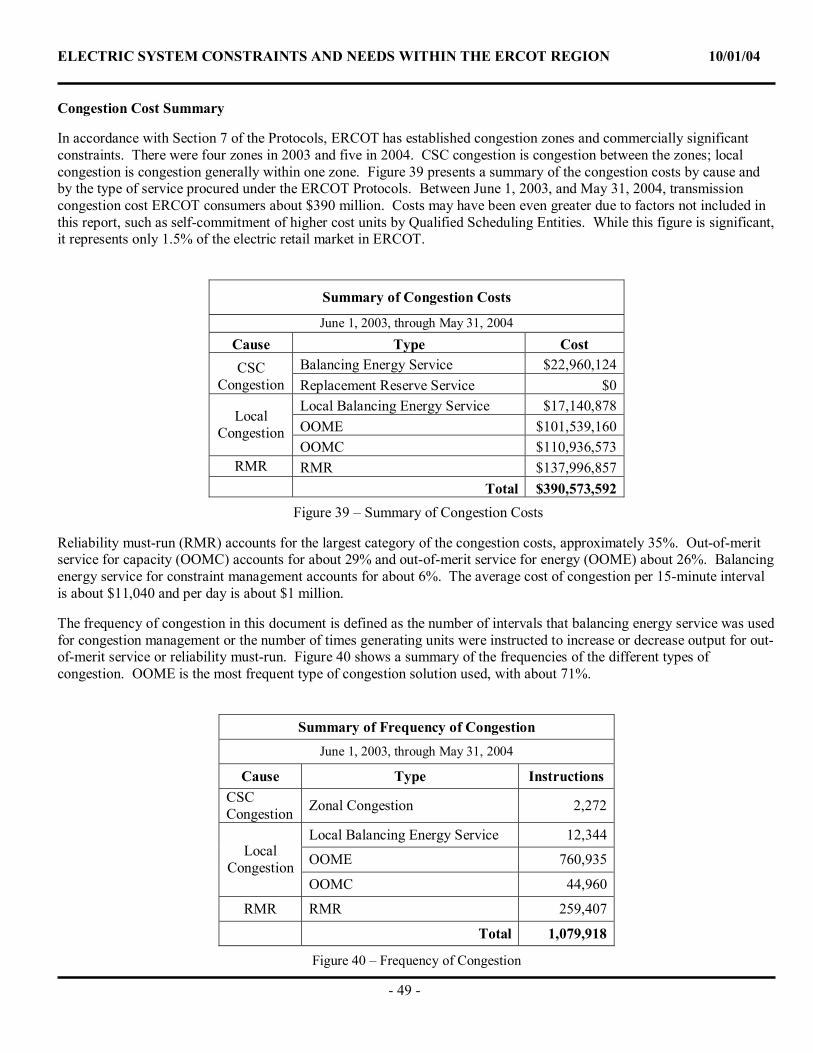
ELECTRIC SYSTEM CONSTRAINTS AND NEEDS WITHIN THE ERCOT REGION 10/01/04
- 49 -
Congestion Cost Summary
In accordance with Section 7 of the Protocols, ERCOT has established congestion zones and commercially significant constraints. There were four zones in 2003 and five in 2004. CSC congestion is congestion between the zones; local congestion is congestion generally within one zone. Figure 39 presents a summary of the congestion costs by cause and by the type of service procured under the ERCOT Protocols. Between June 1, 2003, and May 31, 2004, transmission congestion cost ERCOT consumers about $390 million. Costs may have been even greater due to factors not included in this report, such as self-commitment of higher cost units by Qualified Scheduling Entities. While this figure is significant, it represents only 1.5% of the electric retail market in ERCOT.
Summary of Congestion Costs
June 1, 2003, through May 31, 2004
Cause Type Cost Balancing Energy Service $22,960,124 CSC
Congestion Replacement Reserve Service $0 Local Balancing Energy Service $17,140,878 OOME $101,539,160
Local Congestion
OOMC $110,936,573 RMR RMR $137,996,857
Total $390,573,592 Figure 39 – Summary of Congestion Costs
Reliability must-run (RMR) accounts for the largest category of the congestion costs, approximately 35%. Out-of-merit service for capacity (OOMC) accounts for about 29% and out-of-merit service for energy (OOME) about 26%. Balancing energy service for constraint management accounts for about 6%. The average cost of congestion per 15-minute interval is about $11,040 and per day is about $1 million.
The frequency of congestion in this document is defined as the number of intervals that balancing energy service was used for congestion management or the number of times generating units were instructed to increase or decrease output for out-of-merit service or reliability must-run. Figure 40 shows a summary of the frequencies of the different types of congestion. OOME is the most frequent type of congestion solution used, with about 71%.
Summary of Frequency of Congestion June 1, 2003, through May 31, 2004
Cause Type Instructions CSC Congestion Zonal Congestion 2,272
Local Balancing Energy Service 12,344
OOME 760,935 Local Congestion
OOMC 44,960
RMR RMR 259,407
Total 1,079,918
Figure 40 – Frequency of Congestion
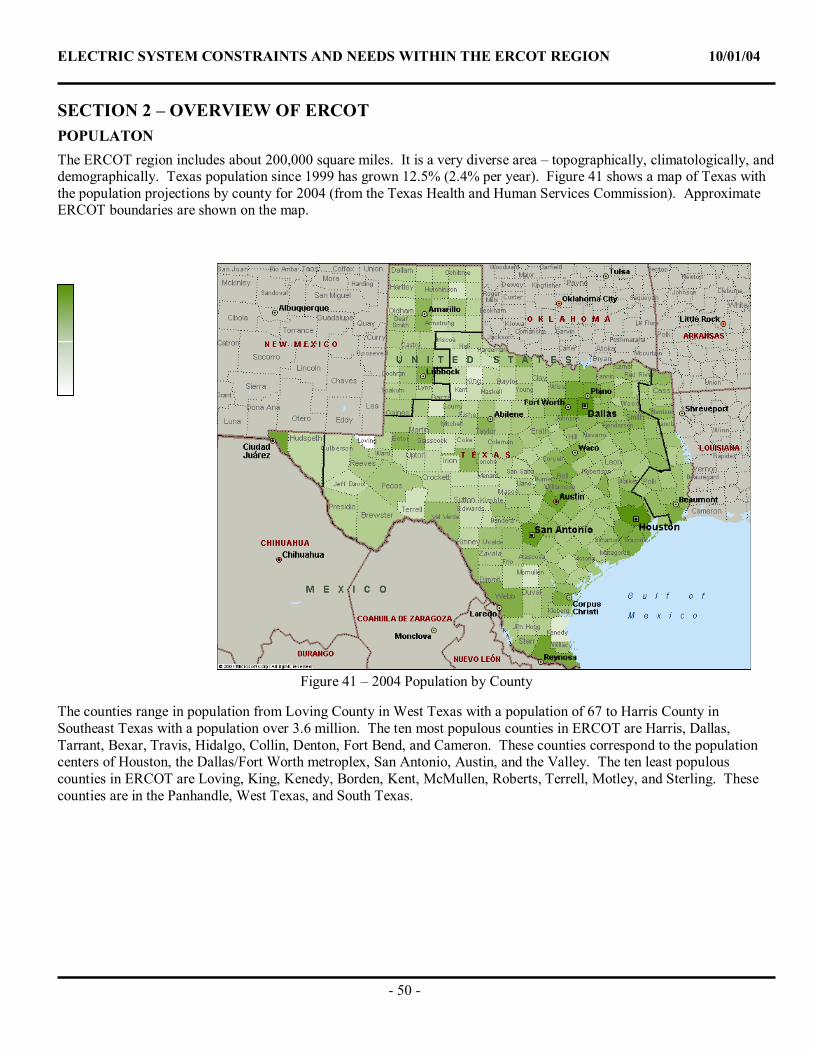
ELECTRIC SYSTEM CONSTRAINTS AND NEEDS WITHIN THE ERCOT REGION 10/01/04
- 50 -
Population by County
4,000,000
15,492
60
SECTION 2 – OVERVIEW OF ERCOT POPULATON The ERCOT region includes about 200,000 square miles. It is a very diverse area – topographically, climatologically, and demographically. Texas population since 1999 has grown 12.5% (2.4% per year). Figure 41 shows a map of Texas with the population projections by county for 2004 (from the Texas Health and Human Services Commission). Approximate ERCOT boundaries are shown on the map.
Figure 41 – 2004 Population by County
The counties range in population from Loving County in West Texas with a population of 67 to Harris County in Southeast Texas with a population over 3.6 million. The ten most populous counties in ERCOT are Harris, Dallas, Tarrant, Bexar, Travis, Hidalgo, Collin, Denton, Fort Bend, and Cameron. These counties correspond to the population centers of Houston, the Dallas/Fort Worth metroplex, San Antonio, Austin, and the Valley. The ten least populous counties in ERCOT are Loving, King, Kenedy, Borden, Kent, McMullen, Roberts, Terrell, Motley, and Sterling. These counties are in the Panhandle, West Texas, and South Texas.
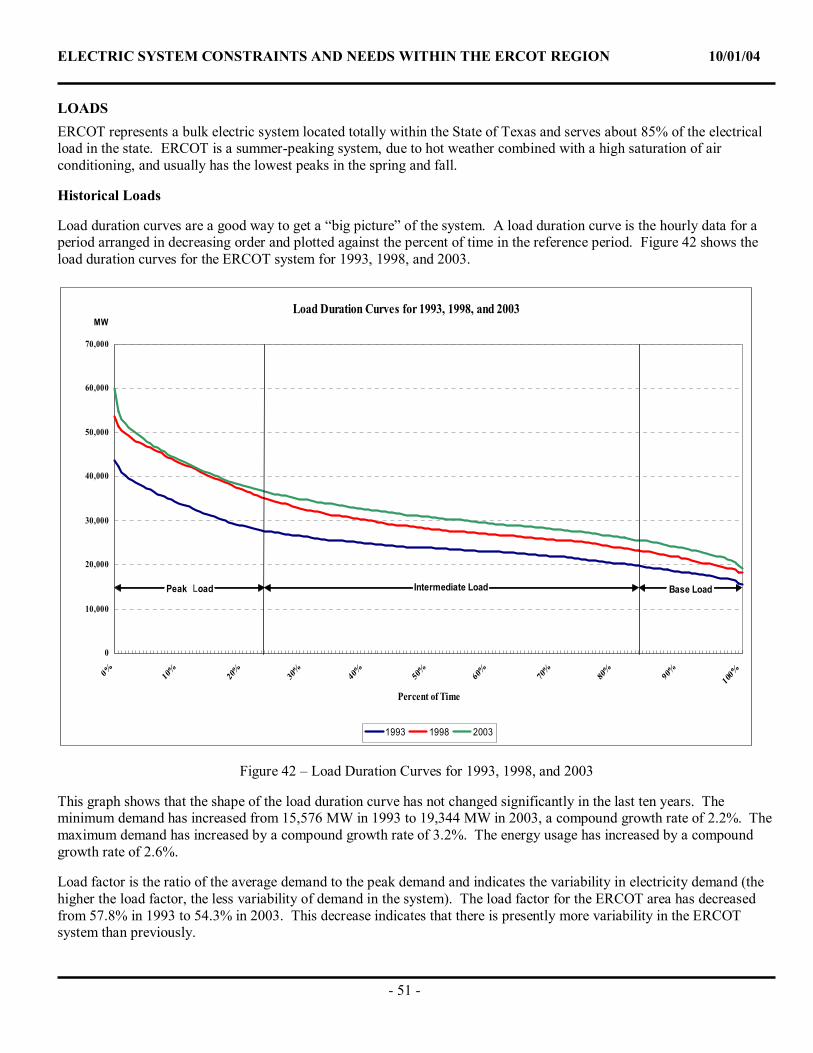
ELECTRIC SYSTEM CONSTRAINTS AND NEEDS WITHIN THE ERCOT REGION 10/01/04
- 51 -
LOADS ERCOT represents a bulk electric system located totally within the State of Texas and serves about 85% of the electrical load in the state. ERCOT is a summer-peaking system, due to hot weather combined with a high saturation of air conditioning, and usually has the lowest peaks in the spring and fall.
Historical Loads
Load duration curves are a good way to get a “big picture” of the system. A load duration curve is the hourly data for a period arranged in decreasing order and plotted against the percent of time in the reference period. Figure 42 shows the load duration curves for the ERCOT system for 1993, 1998, and 2003.
Figure 42 – Load Duration Curves for 1993, 1998, and 2003
This graph shows that the shape of the load duration curve has not changed significantly in the last ten years. The minimum demand has increased from 15,576 MW in 1993 to 19,344 MW in 2003, a compound growth rate of 2.2%. The maximum demand has increased by a compound growth rate of 3.2%. The energy usage has increased by a compound growth rate of 2.6%.
Load factor is the ratio of the average demand to the peak demand and indicates the variability in electricity demand (the higher the load factor, the less variability of demand in the system). The load factor for the ERCOT area has decreased from 57.8% in 1993 to 54.3% in 2003. This decrease indicates that there is presently more variability in the ERCOT system than previously.
Load Duration Curves for 1993, 1998, and 2003
0
10,000
20,000
30,000
40,000
50,000
60,000
70,000
0% 10%
20%
30%
40%
50%
60%
70%
80%
90%
100%
Percent of Time
MW
1993 1998 2003
Peak Load Intermediate Load Base Load
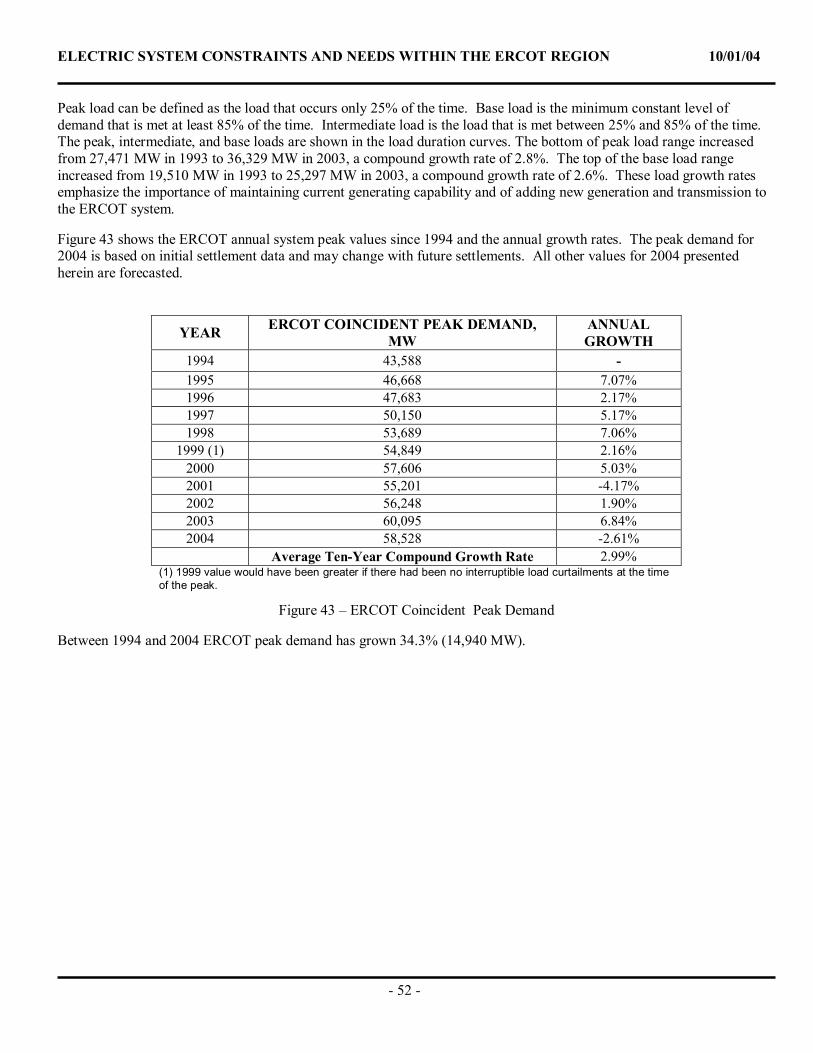
ELECTRIC SYSTEM CONSTRAINTS AND NEEDS WITHIN THE ERCOT REGION 10/01/04
- 52 -
Peak load can be defined as the load that occurs only 25% of the time. Base load is the minimum constant level of demand that is met at least 85% of the time. Intermediate load is the load that is met between 25% and 85% of the time. The peak, intermediate, and base loads are shown in the load duration curves. The bottom of peak load range increased from 27,471 MW in 1993 to 36,329 MW in 2003, a compound growth rate of 2.8%. The top of the base load range increased from 19,510 MW in 1993 to 25,297 MW in 2003, a compound growth rate of 2.6%. These load growth rates emphasize the importance of maintaining current generating capability and of adding new generation and transmission to the ERCOT system.
Figure 43 shows the ERCOT annual system peak values since 1994 and the annual growth rates. The peak demand for 2004 is based on initial settlement data and may change with future settlements. All other values for 2004 presented herein are forecasted.
Figure 43 – ERCOT Coincident Peak Demand
Between 1994 and 2004 ERCOT peak demand has grown 34.3% (14,940 MW).
YEAR ERCOT COINCIDENT PEAK DEMAND, MW
ANNUAL GROWTH
1994 43,588 - 1995 46,668 7.07% 1996 47,683 2.17% 1997 50,150 5.17% 1998 53,689 7.06%
1999 (1) 54,849 2.16% 2000 57,606 5.03% 2001 55,201 -4.17% 2002 56,248 1.90% 2003 60,095 6.84% 2004 58,528 -2.61%
Average Ten-Year Compound Growth Rate 2.99% (1) 1999 value would have been greater if there had been no interruptible load curtailments at the time of the peak.
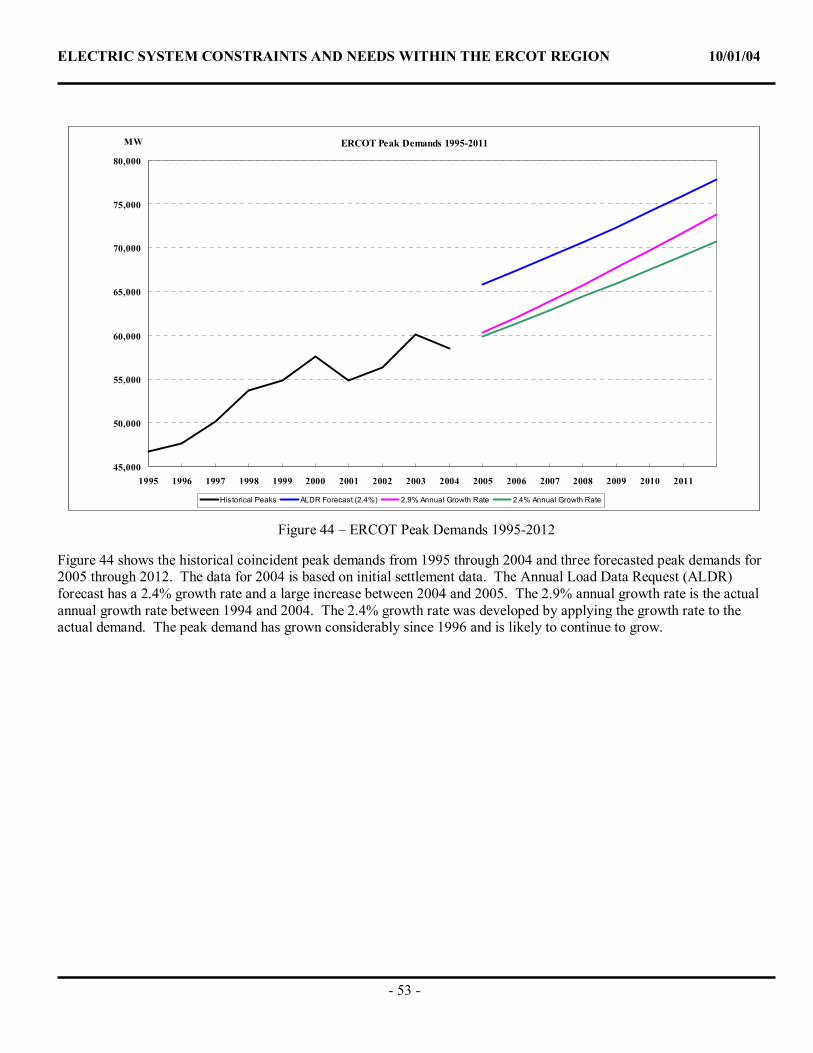
ELECTRIC SYSTEM CONSTRAINTS AND NEEDS WITHIN THE ERCOT REGION 10/01/04
- 53 -
Figure 44 – ERCOT Peak Demands 1995-2012
Figure 44 shows the historical coincident peak demands from 1995 through 2004 and three forecasted peak demands for 2005 through 2012. The data for 2004 is based on initial settlement data. The Annual Load Data Request (ALDR) forecast has a 2.4% growth rate and a large increase between 2004 and 2005. The 2.9% annual growth rate is the actual annual growth rate between 1994 and 2004. The 2.4% growth rate was developed by applying the growth rate to the actual demand. The peak demand has grown considerably since 1996 and is likely to continue to grow.
ERCOT Peak Demands 1995-2011
45,000
50,000
55,000
60,000
65,000
70,000
75,000
80,000
1995 1996 1997 1998 1999 2000 2001 2002 2003 2004 2005 2006 2007 2008 2009 2010 2011
MW
Historical Peaks ALDR Forecast (2.4%) 2.9% Annual Growth Rate 2.4% Annual Growth Rate
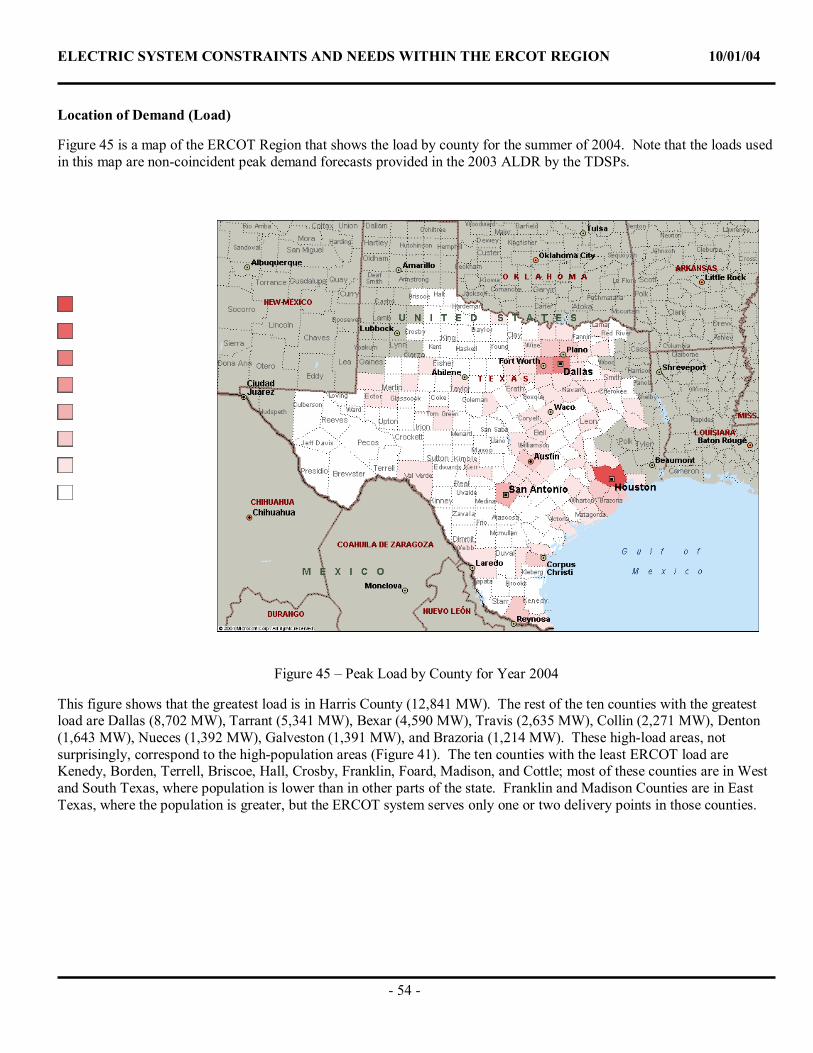
ELECTRIC SYSTEM CONSTRAINTS AND NEEDS WITHIN THE ERCOT REGION 10/01/04
- 54 -
Load by County, MW
11,000 to 14,000
9,000 to 10,999
7,000 to 8,999
5,000 to 6,999
3,000 to 4,999
1,000 to 2,999
100 to 999
0 to 99
Location of Demand (Load)
Figure 45 is a map of the ERCOT Region that shows the load by county for the summer of 2004. Note that the loads used in this map are non-coincident peak demand forecasts provided in the 2003 ALDR by the TDSPs.
Figure 31 – Peak Demand by County for Year 2004
Figure 45 – Peak Load by County for Year 2004
This figure shows that the greatest load is in Harris County (12,841 MW). The rest of the ten counties with the greatest load are Dallas (8,702 MW), Tarrant (5,341 MW), Bexar (4,590 MW), Travis (2,635 MW), Collin (2,271 MW), Denton (1,643 MW), Nueces (1,392 MW), Galveston (1,391 MW), and Brazoria (1,214 MW). These high-load areas, not surprisingly, correspond to the high-population areas (Figure 41). The ten counties with the least ERCOT load are Kenedy, Borden, Terrell, Briscoe, Hall, Crosby, Franklin, Foard, Madison, and Cottle; most of these counties are in West and South Texas, where population is lower than in other parts of the state. Franklin and Madison Counties are in East Texas, where the population is greater, but the ERCOT system serves only one or two delivery points in those counties.
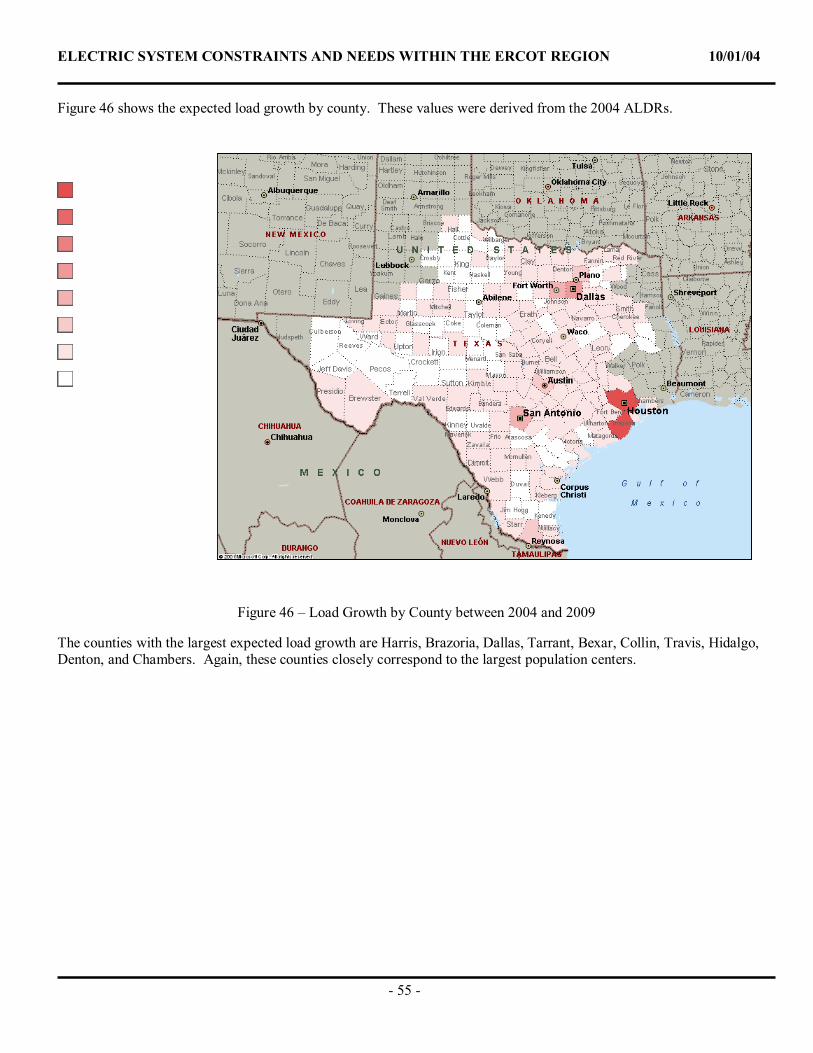
ELECTRIC SYSTEM CONSTRAINTS AND NEEDS WITHIN THE ERCOT REGION 10/01/04
- 55 -
Growth by County, MW
1,300 to 3,500
1,100 to 1,299
900 to 1,099
700 to 899
500 to 699
300 to 499
1 to 299
-50 to 0
Figure 46 shows the expected load growth by county. These values were derived from the 2004 ALDRs.
Figure 46 – Load Growth by County between 2004 and 2009
The counties with the largest expected load growth are Harris, Brazoria, Dallas, Tarrant, Bexar, Collin, Travis, Hidalgo, Denton, and Chambers. Again, these counties closely correspond to the largest population centers.
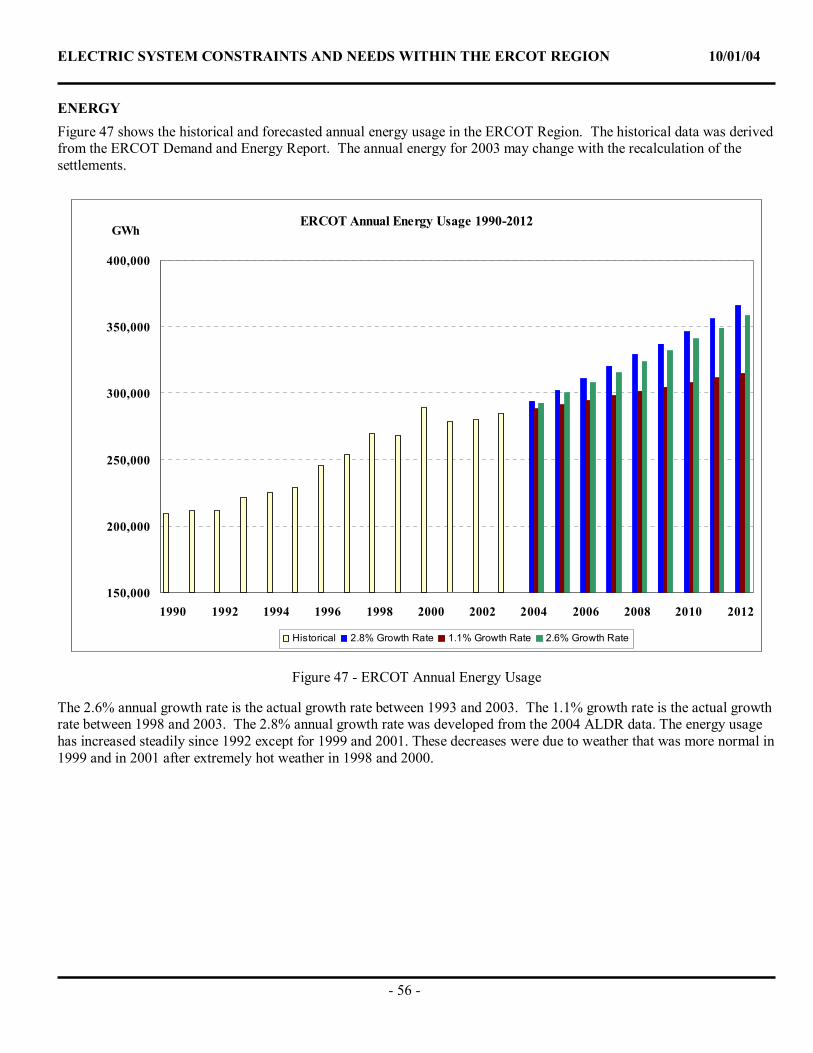
ELECTRIC SYSTEM CONSTRAINTS AND NEEDS WITHIN THE ERCOT REGION 10/01/04
- 56 -
ENERGY Figure 47 shows the historical and forecasted annual energy usage in the ERCOT Region. The historical data was derived from the ERCOT Demand and Energy Report. The annual energy for 2003 may change with the recalculation of the settlements.
Figure 47 - ERCOT Annual Energy Usage
The 2.6% annual growth rate is the actual growth rate between 1993 and 2003. The 1.1% growth rate is the actual growth rate between 1998 and 2003. The 2.8% annual growth rate was developed from the 2004 ALDR data. The energy usage has increased steadily since 1992 except for 1999 and 2001. These decreases were due to weather that was more normal in 1999 and in 2001 after extremely hot weather in 1998 and 2000.
ERCOT Annual Energy Usage 1990-2012
150,000
200,000
250,000
300,000
350,000
400,000
1990 1992 1994 1996 1998 2000 2002 2004 2006 2008 2010 2012
GWh
Historical 2.8% Growth Rate 1.1% Growth Rate 2.6% Growth Rate
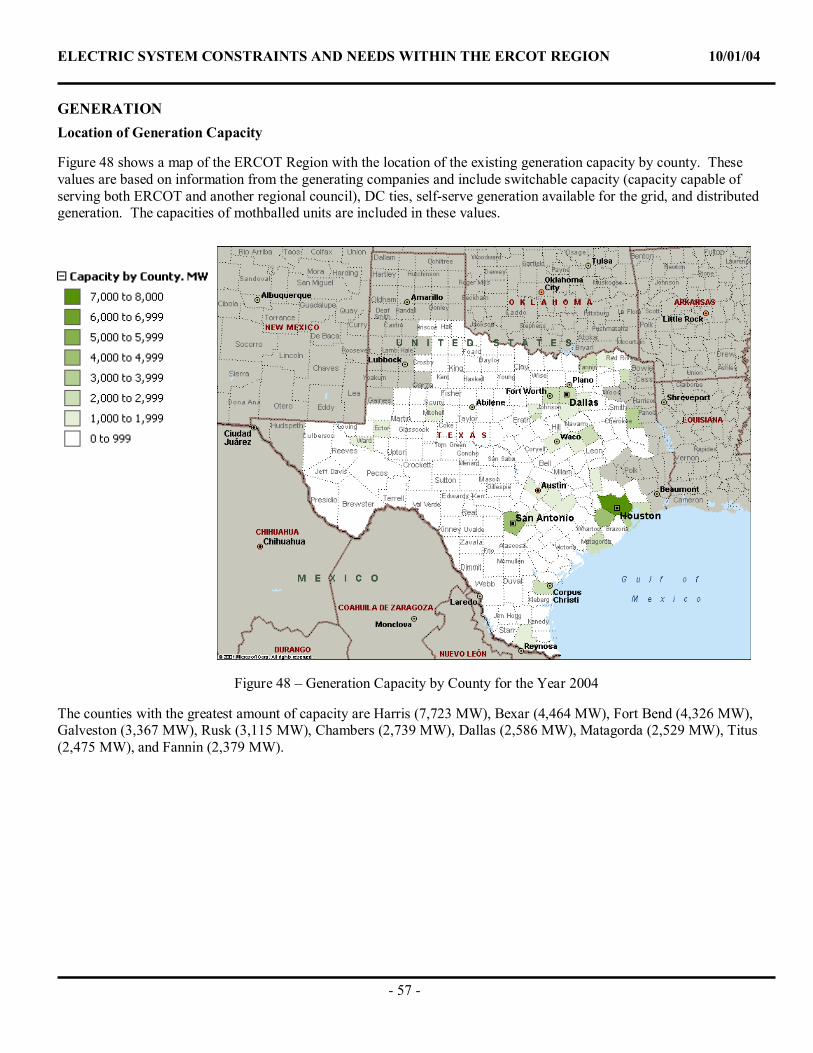
ELECTRIC SYSTEM CONSTRAINTS AND NEEDS WITHIN THE ERCOT REGION 10/01/04
- 57 -
GENERATION Location of Generation Capacity
Figure 48 shows a map of the ERCOT Region with the location of the existing generation capacity by county. These values are based on information from the generating companies and include switchable capacity (capacity capable of serving both ERCOT and another regional council), DC ties, self-serve generation available for the grid, and distributed generation. The capacities of mothballed units are included in these values.
Figure 48 – Generation Capacity by County for the Year 2004
The counties with the greatest amount of capacity are Harris (7,723 MW), Bexar (4,464 MW), Fort Bend (4,326 MW), Galveston (3,367 MW), Rusk (3,115 MW), Chambers (2,739 MW), Dallas (2,586 MW), Matagorda (2,529 MW), Titus (2,475 MW), and Fannin (2,379 MW).
ELECTRIC SYSTEM CONSTRAINTS AND NEEDS WITHIN THE ERCOT REGION 10/01/04
- 58 -
Import/Export
Figure 49 consolidates peak load by county (Figure 45) and generation by county (Figure 48) to show generation import/export by county in the ERCOT system for the year 2004. If a county has more generation than peak load (blue on the map), then it will “export” generation to other counties. If a county has more peak load than generation (red on the map), then it must “import” generation. Because this is a calculation, it is presented for example only. The true values will depend on actual load levels and actual generation dispatch.
Figure 49 – Generation Import/Export by County for the Year 2004
For the year 2004 for non-coincident peak load, the counties that import the most generation are Dallas, Harris, Tarrant, Collin, Denton, Williamson, Bell, Travis, Brazoria, and Smith. These counties are the most dependent on transmission to meet customers’ energy needs. The counties that are able to export the most generation are Fort Bend, Rusk, Chambers, Titus, Matagorda, Fannin, Somervell, Freestone, Hood, and Fayette.
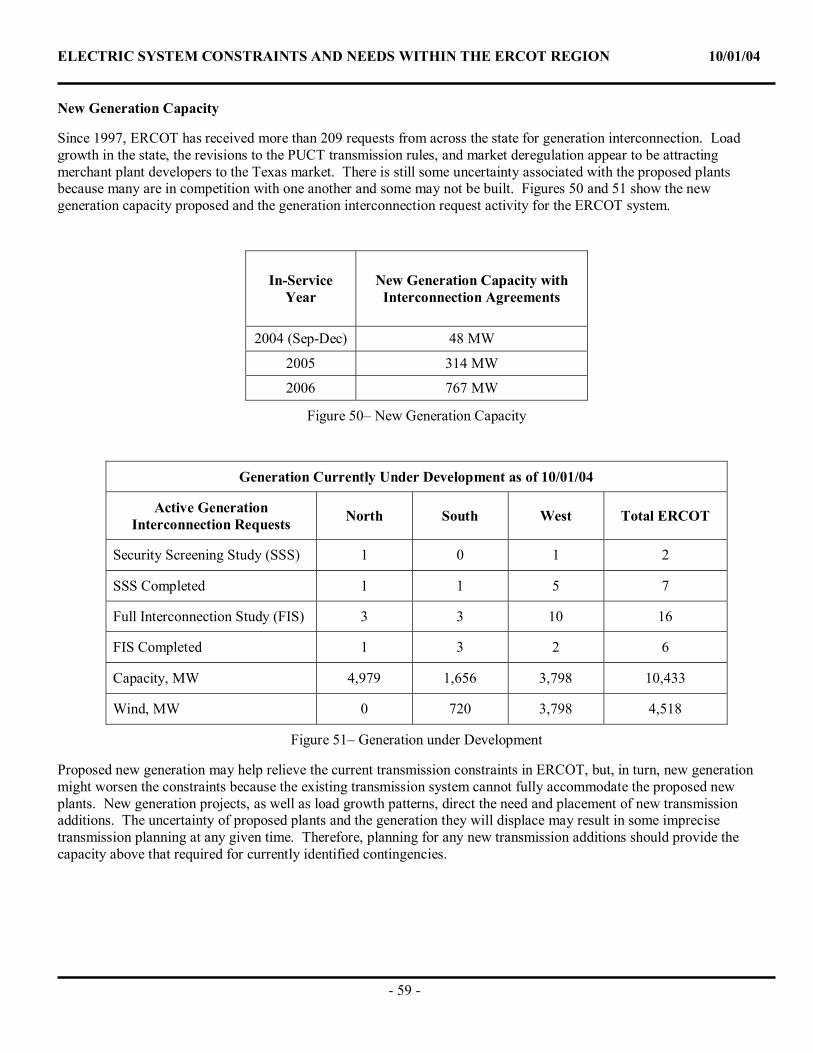
ELECTRIC SYSTEM CONSTRAINTS AND NEEDS WITHIN THE ERCOT REGION 10/01/04
- 59 -
New Generation Capacity
Since 1997, ERCOT has received more than 209 requests from across the state for generation interconnection. Load growth in the state, the revisions to the PUCT transmission rules, and market deregulation appear to be attracting merchant plant developers to the Texas market. There is still some uncertainty associated with the proposed plants because many are in competition with one another and some may not be built. Figures 50 and 51 show the new generation capacity proposed and the generation interconnection request activity for the ERCOT system.
In-Service Year
New Generation Capacity with Interconnection Agreements
2004 (Sep-Dec) 48 MW
2005 314 MW
2006 767 MW
Figure 50– New Generation Capacity
Generation Currently Under Development as of 10/01/04
Active Generation Interconnection Requests North South West Total ERCOT
Security Screening Study (SSS) 1 0 1 2
SSS Completed 1 1 5 7
Full Interconnection Study (FIS) 3 3 10 16
FIS Completed 1 3 2 6
Capacity, MW 4,979 1,656 3,798 10,433
Wind, MW 0 720 3,798 4,518
Figure 51– Generation under Development
Proposed new generation may help relieve the current transmission constraints in ERCOT, but, in turn, new generation might worsen the constraints because the existing transmission system cannot fully accommodate the proposed new plants. New generation projects, as well as load growth patterns, direct the need and placement of new transmission additions. The uncertainty of proposed plants and the generation they will displace may result in some imprecise transmission planning at any given time. Therefore, planning for any new transmission additions should provide the capacity above that required for currently identified contingencies.
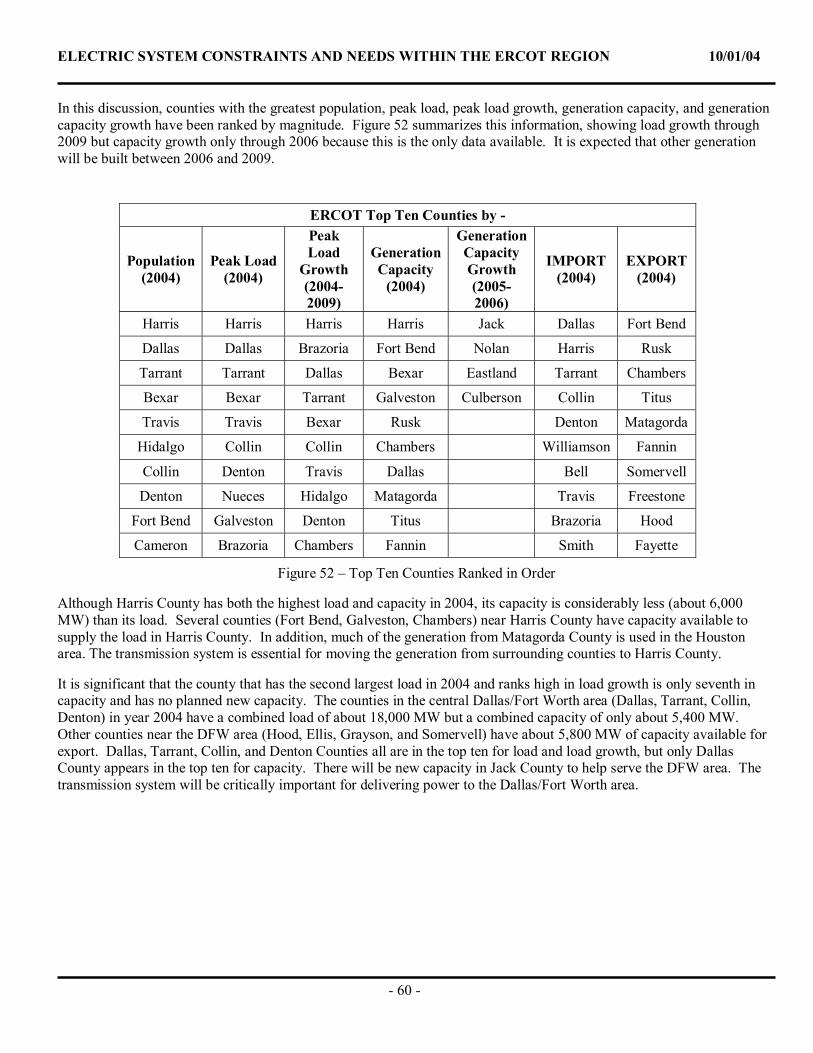
ELECTRIC SYSTEM CONSTRAINTS AND NEEDS WITHIN THE ERCOT REGION 10/01/04
- 60 -
In this discussion, counties with the greatest population, peak load, peak load growth, generation capacity, and generation capacity growth have been ranked by magnitude. Figure 52 summarizes this information, showing load growth through 2009 but capacity growth only through 2006 because this is the only data available. It is expected that other generation will be built between 2006 and 2009.
ERCOT Top Ten Counties by -
Population (2004)
Peak Load (2004)
Peak Load
Growth (2004-2009)
Generation Capacity
(2004)
Generation Capacity Growth (2005-2006)
IMPORT (2004)
EXPORT (2004)
Harris Harris Harris Harris Jack Dallas Fort Bend
Dallas Dallas Brazoria Fort Bend Nolan Harris Rusk
Tarrant Tarrant Dallas Bexar Eastland Tarrant Chambers
Bexar Bexar Tarrant Galveston Culberson Collin Titus
Travis Travis Bexar Rusk Denton Matagorda
Hidalgo Collin Collin Chambers Williamson Fannin
Collin Denton Travis Dallas Bell Somervell
Denton Nueces Hidalgo Matagorda Travis Freestone
Fort Bend Galveston Denton Titus Brazoria Hood
Cameron Brazoria Chambers Fannin Smith Fayette
Figure 52 – Top Ten Counties Ranked in Order
Although Harris County has both the highest load and capacity in 2004, its capacity is considerably less (about 6,000 MW) than its load. Several counties (Fort Bend, Galveston, Chambers) near Harris County have capacity available to supply the load in Harris County. In addition, much of the generation from Matagorda County is used in the Houston area. The transmission system is essential for moving the generation from surrounding counties to Harris County.
It is significant that the county that has the second largest load in 2004 and ranks high in load growth is only seventh in capacity and has no planned new capacity. The counties in the central Dallas/Fort Worth area (Dallas, Tarrant, Collin, Denton) in year 2004 have a combined load of about 18,000 MW but a combined capacity of only about 5,400 MW. Other counties near the DFW area (Hood, Ellis, Grayson, and Somervell) have about 5,800 MW of capacity available for export. Dallas, Tarrant, Collin, and Denton Counties all are in the top ten for load and load growth, but only Dallas County appears in the top ten for capacity. There will be new capacity in Jack County to help serve the DFW area. The transmission system will be critically important for delivering power to the Dallas/Fort Worth area.
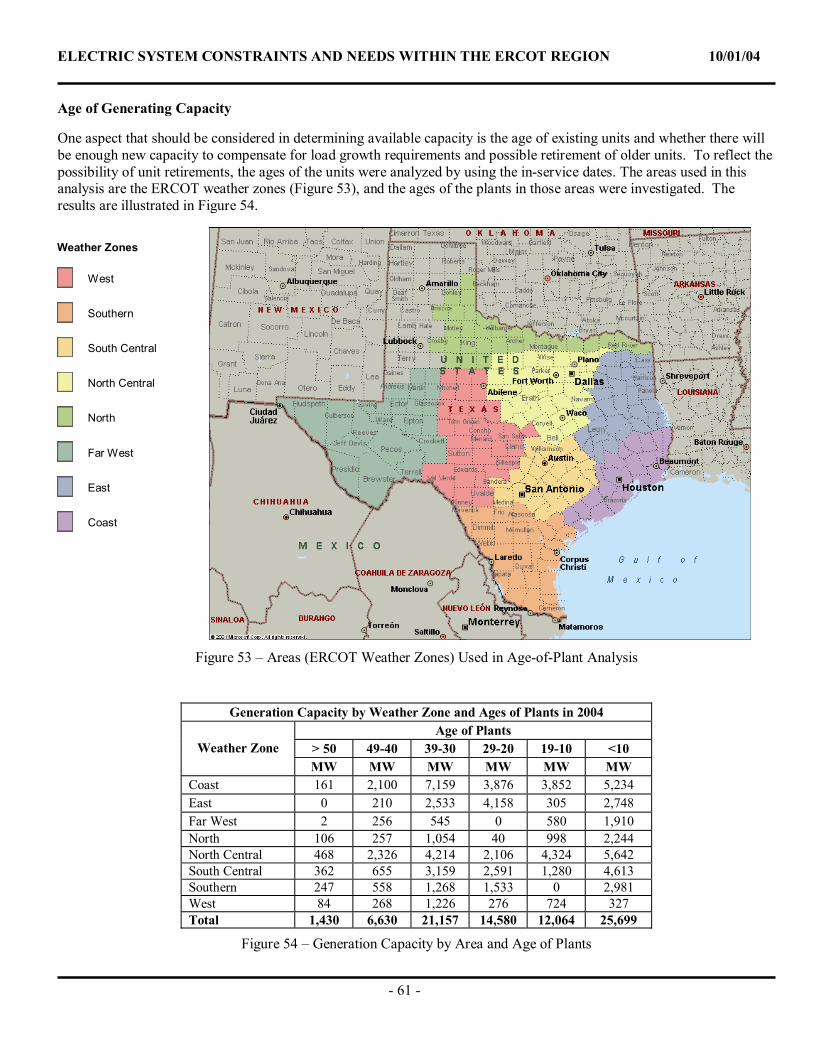
ELECTRIC SYSTEM CONSTRAINTS AND NEEDS WITHIN THE ERCOT REGION 10/01/04
- 61 -
Age of Generating Capacity
One aspect that should be considered in determining available capacity is the age of existing units and whether there will be enough new capacity to compensate for load growth requirements and possible retirement of older units. To reflect the possibility of unit retirements, the ages of the units were analyzed by using the in-service dates. The areas used in this analysis are the ERCOT weather zones (Figure 53), and the ages of the plants in those areas were investigated. The results are illustrated in Figure 54.
Figure 53 – Areas (ERCOT Weather Zones) Used in Age-of-Plant Analysis
Generation Capacity by Weather Zone and Ages of Plants in 2004 Age of Plants
> 50 49-40 39-30 29-20 19-10 <10 Weather Zone MW MW MW MW MW MW
Coast 161 2,100 7,159 3,876 3,852 5,234 East 0 210 2,533 4,158 305 2,748 Far West 2 256 545 0 580 1,910 North 106 257 1,054 40 998 2,244 North Central 468 2,326 4,214 2,106 4,324 5,642 South Central 362 655 3,159 2,591 1,280 4,613 Southern 247 558 1,268 1,533 0 2,981 West 84 268 1,226 276 724 327 Total 1,430 6,630 21,157 14,580 12,064 25,699
Figure 54 – Generation Capacity by Area and Age of Plants
Weather Zones
West
Southern
South Central
North Central
North
Far West
East
Coast
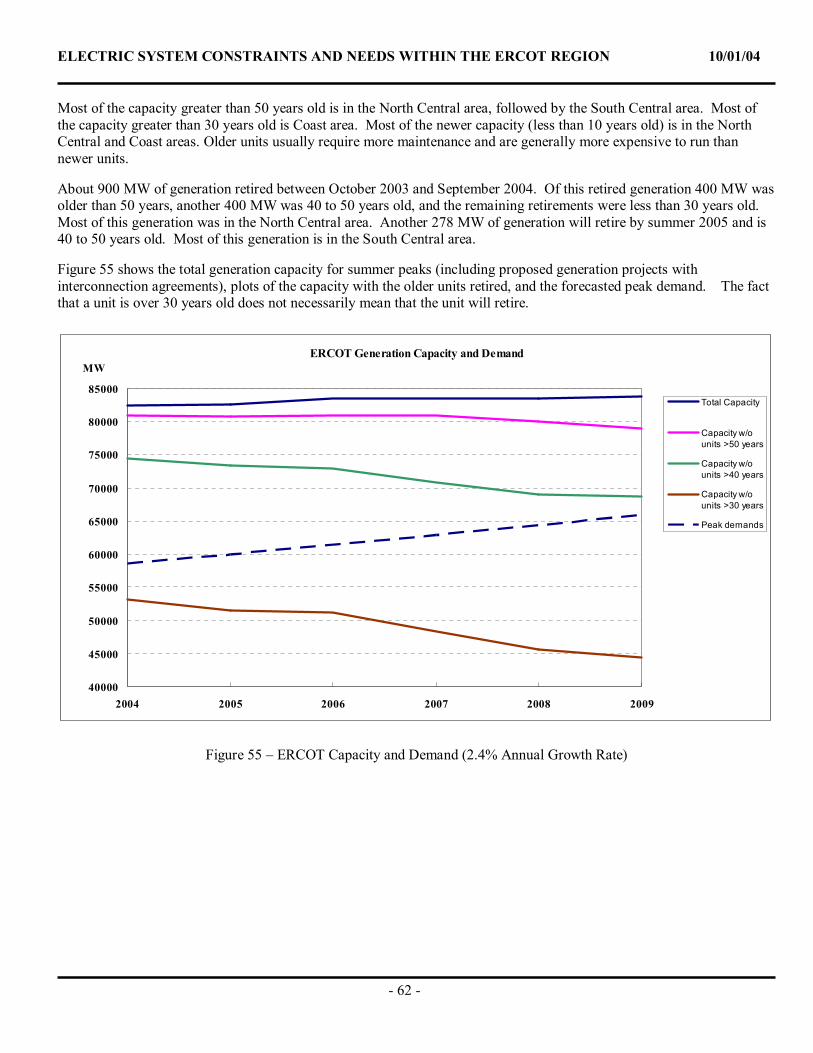
ELECTRIC SYSTEM CONSTRAINTS AND NEEDS WITHIN THE ERCOT REGION 10/01/04
- 62 -
Most of the capacity greater than 50 years old is in the North Central area, followed by the South Central area. Most of the capacity greater than 30 years old is Coast area. Most of the newer capacity (less than 10 years old) is in the North Central and Coast areas. Older units usually require more maintenance and are generally more expensive to run than newer units.
About 900 MW of generation retired between October 2003 and September 2004. Of this retired generation 400 MW was older than 50 years, another 400 MW was 40 to 50 years old, and the remaining retirements were less than 30 years old. Most of this generation was in the North Central area. Another 278 MW of generation will retire by summer 2005 and is 40 to 50 years old. Most of this generation is in the South Central area.
Figure 55 shows the total generation capacity for summer peaks (including proposed generation projects with interconnection agreements), plots of the capacity with the older units retired, and the forecasted peak demand. The fact that a unit is over 30 years old does not necessarily mean that the unit will retire.
Figure 55 – ERCOT Capacity and Demand (2.4% Annual Growth Rate)
ERCOT Generation Capacity and Demand
40000
45000
50000
55000
60000
65000
70000
75000
80000
85000
2004 2005 2006 2007 2008 2009
MW
Total Capacity
Capacity w/ounits >50 years
Capacity w/ounits >40 years
Capacity w/ounits >30 years
Peak demands
ELECTRIC SYSTEM CONSTRAINTS AND NEEDS WITHIN THE ERCOT REGION 10/01/04
- 63 -
APPENDIX A – TRANSMISSION PROJECT INFORMATION TRACKING (TPIT)
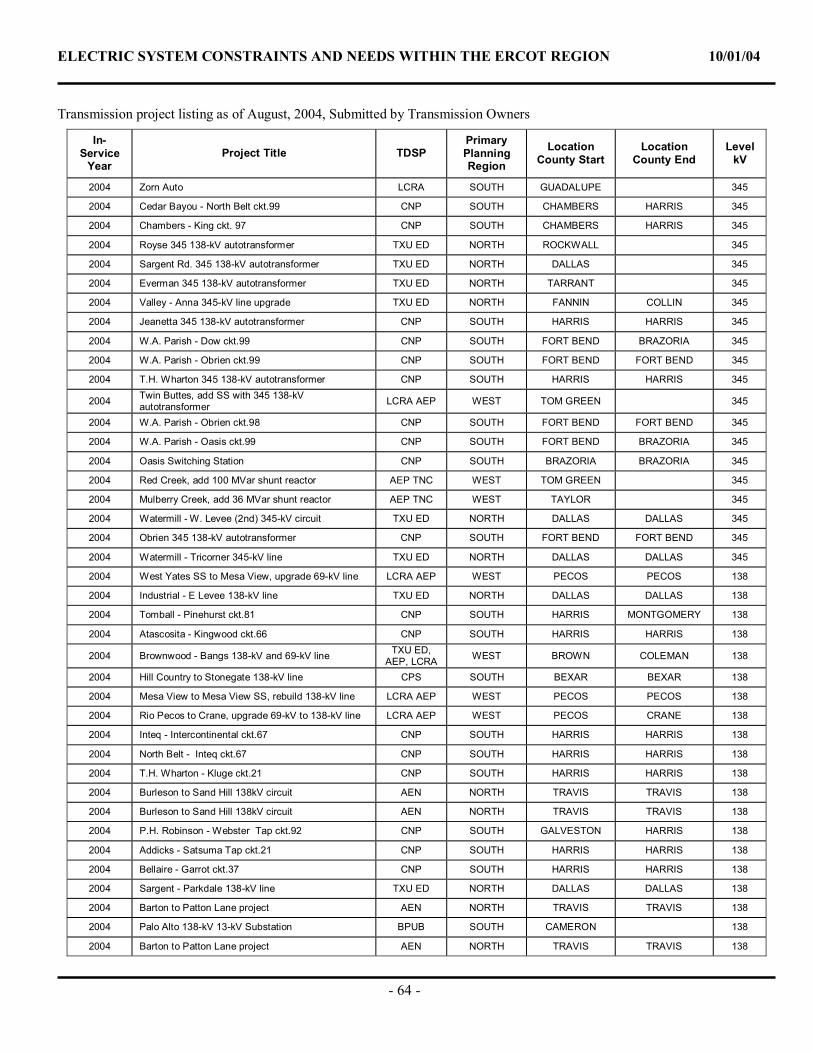
ELECTRIC SYSTEM CONSTRAINTS AND NEEDS WITHIN THE ERCOT REGION 10/01/04
- 64 -
Transmission project listing as of August, 2004, Submitted by Transmission Owners
In-Service
Year Project Title TDSP
Primary Planning Region
Location County Start
Location County End
Level kV
2004 Zorn Auto LCRA SOUTH GUADALUPE 345
2004 Cedar Bayou - North Belt ckt.99 CNP SOUTH CHAMBERS HARRIS 345
2004 Chambers - King ckt. 97 CNP SOUTH CHAMBERS HARRIS 345
2004 Royse 345 138-kV autotransformer TXU ED NORTH ROCKWALL 345
2004 Sargent Rd. 345 138-kV autotransformer TXU ED NORTH DALLAS 345
2004 Everman 345 138-kV autotransformer TXU ED NORTH TARRANT 345
2004 Valley - Anna 345-kV line upgrade TXU ED NORTH FANNIN COLLIN 345
2004 Jeanetta 345 138-kV autotransformer CNP SOUTH HARRIS HARRIS 345
2004 W.A. Parish - Dow ckt.99 CNP SOUTH FORT BEND BRAZORIA 345
2004 W.A. Parish - Obrien ckt.99 CNP SOUTH FORT BEND FORT BEND 345
2004 T.H. Wharton 345 138-kV autotransformer CNP SOUTH HARRIS HARRIS 345
2004 Twin Buttes, add SS with 345 138-kV autotransformer LCRA AEP WEST TOM GREEN 345
2004 W.A. Parish - Obrien ckt.98 CNP SOUTH FORT BEND FORT BEND 345
2004 W.A. Parish - Oasis ckt.99 CNP SOUTH FORT BEND BRAZORIA 345
2004 Oasis Switching Station CNP SOUTH BRAZORIA BRAZORIA 345
2004 Red Creek, add 100 MVar shunt reactor AEP TNC WEST TOM GREEN 345
2004 Mulberry Creek, add 36 MVar shunt reactor AEP TNC WEST TAYLOR 345
2004 Watermill - W. Levee (2nd) 345-kV circuit TXU ED NORTH DALLAS DALLAS 345
2004 Obrien 345 138-kV autotransformer CNP SOUTH FORT BEND FORT BEND 345
2004 Watermill - Tricorner 345-kV line TXU ED NORTH DALLAS DALLAS 345
2004 West Yates SS to Mesa View, upgrade 69-kV line LCRA AEP WEST PECOS PECOS 138
2004 Industrial - E Levee 138-kV line TXU ED NORTH DALLAS DALLAS 138
2004 Tomball - Pinehurst ckt.81 CNP SOUTH HARRIS MONTGOMERY 138
2004 Atascosita - Kingwood ckt.66 CNP SOUTH HARRIS HARRIS 138
2004 Brownwood - Bangs 138-kV and 69-kV line TXU ED, AEP, LCRA WEST BROWN COLEMAN 138
2004 Hill Country to Stonegate 138-kV line CPS SOUTH BEXAR BEXAR 138
2004 Mesa View to Mesa View SS, rebuild 138-kV line LCRA AEP WEST PECOS PECOS 138
2004 Rio Pecos to Crane, upgrade 69-kV to 138-kV line LCRA AEP WEST PECOS CRANE 138
2004 Inteq - Intercontinental ckt.67 CNP SOUTH HARRIS HARRIS 138
2004 North Belt - Inteq ckt.67 CNP SOUTH HARRIS HARRIS 138
2004 T.H. Wharton - Kluge ckt.21 CNP SOUTH HARRIS HARRIS 138
2004 Burleson to Sand Hill 138kV circuit AEN NORTH TRAVIS TRAVIS 138
2004 Burleson to Sand Hill 138kV circuit AEN NORTH TRAVIS TRAVIS 138
2004 P.H. Robinson - Webster Tap ckt.92 CNP SOUTH GALVESTON HARRIS 138
2004 Addicks - Satsuma Tap ckt.21 CNP SOUTH HARRIS HARRIS 138
2004 Bellaire - Garrot ckt.37 CNP SOUTH HARRIS HARRIS 138
2004 Sargent - Parkdale 138-kV line TXU ED NORTH DALLAS DALLAS 138
2004 Barton to Patton Lane project AEN NORTH TRAVIS TRAVIS 138
2004 Palo Alto 138-kV 13-kV Substation BPUB SOUTH CAMERON 138
2004 Barton to Patton Lane project AEN NORTH TRAVIS TRAVIS 138
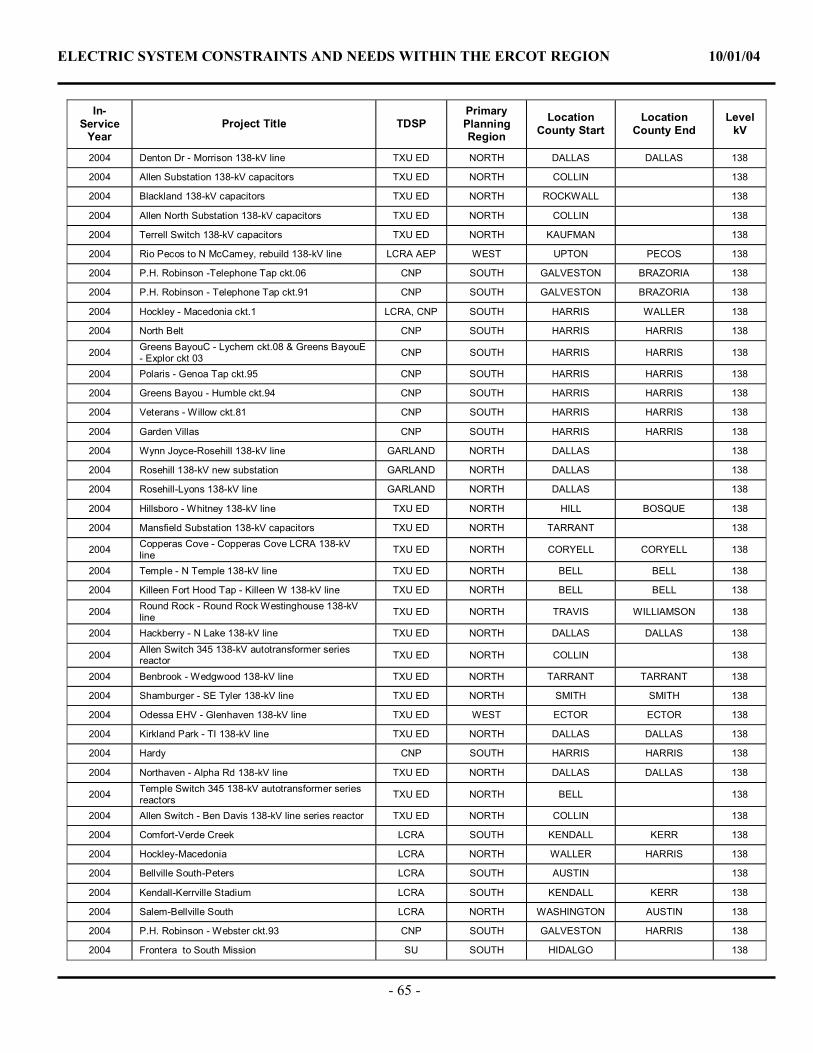
ELECTRIC SYSTEM CONSTRAINTS AND NEEDS WITHIN THE ERCOT REGION 10/01/04
- 65 -
In-Service
Year Project Title TDSP
Primary Planning Region
Location County Start
Location County End
Level kV
2004 Denton Dr - Morrison 138-kV line TXU ED NORTH DALLAS DALLAS 138
2004 Allen Substation 138-kV capacitors TXU ED NORTH COLLIN 138
2004 Blackland 138-kV capacitors TXU ED NORTH ROCKWALL 138
2004 Allen North Substation 138-kV capacitors TXU ED NORTH COLLIN 138
2004 Terrell Switch 138-kV capacitors TXU ED NORTH KAUFMAN 138
2004 Rio Pecos to N McCamey, rebuild 138-kV line LCRA AEP WEST UPTON PECOS 138
2004 P.H. Robinson -Telephone Tap ckt.06 CNP SOUTH GALVESTON BRAZORIA 138
2004 P.H. Robinson - Telephone Tap ckt.91 CNP SOUTH GALVESTON BRAZORIA 138
2004 Hockley - Macedonia ckt.1 LCRA, CNP SOUTH HARRIS WALLER 138
2004 North Belt CNP SOUTH HARRIS HARRIS 138
2004 Greens BayouC - Lychem ckt.08 & Greens BayouE - Explor ckt 03 CNP SOUTH HARRIS HARRIS 138
2004 Polaris - Genoa Tap ckt.95 CNP SOUTH HARRIS HARRIS 138
2004 Greens Bayou - Humble ckt.94 CNP SOUTH HARRIS HARRIS 138
2004 Veterans - Willow ckt.81 CNP SOUTH HARRIS HARRIS 138
2004 Garden Villas CNP SOUTH HARRIS HARRIS 138
2004 Wynn Joyce-Rosehill 138-kV line GARLAND NORTH DALLAS 138
2004 Rosehill 138-kV new substation GARLAND NORTH DALLAS 138
2004 Rosehill-Lyons 138-kV line GARLAND NORTH DALLAS 138
2004 Hillsboro - Whitney 138-kV line TXU ED NORTH HILL BOSQUE 138
2004 Mansfield Substation 138-kV capacitors TXU ED NORTH TARRANT 138
2004 Copperas Cove - Copperas Cove LCRA 138-kV line TXU ED NORTH CORYELL CORYELL 138
2004 Temple - N Temple 138-kV line TXU ED NORTH BELL BELL 138
2004 Killeen Fort Hood Tap - Killeen W 138-kV line TXU ED NORTH BELL BELL 138
2004 Round Rock - Round Rock Westinghouse 138-kV line TXU ED NORTH TRAVIS WILLIAMSON 138
2004 Hackberry - N Lake 138-kV line TXU ED NORTH DALLAS DALLAS 138
2004 Allen Switch 345 138-kV autotransformer series reactor TXU ED NORTH COLLIN 138
2004 Benbrook - Wedgwood 138-kV line TXU ED NORTH TARRANT TARRANT 138
2004 Shamburger - SE Tyler 138-kV line TXU ED NORTH SMITH SMITH 138
2004 Odessa EHV - Glenhaven 138-kV line TXU ED WEST ECTOR ECTOR 138
2004 Kirkland Park - TI 138-kV line TXU ED NORTH DALLAS DALLAS 138
2004 Hardy CNP SOUTH HARRIS HARRIS 138
2004 Northaven - Alpha Rd 138-kV line TXU ED NORTH DALLAS DALLAS 138
2004 Temple Switch 345 138-kV autotransformer series reactors TXU ED NORTH BELL 138
2004 Allen Switch - Ben Davis 138-kV line series reactor TXU ED NORTH COLLIN 138
2004 Comfort-Verde Creek LCRA SOUTH KENDALL KERR 138
2004 Hockley-Macedonia LCRA NORTH WALLER HARRIS 138
2004 Bellville South-Peters LCRA SOUTH AUSTIN 138
2004 Kendall-Kerrville Stadium LCRA SOUTH KENDALL KERR 138
2004 Salem-Bellville South LCRA NORTH WASHINGTON AUSTIN 138
2004 P.H. Robinson - Webster ckt.93 CNP SOUTH GALVESTON HARRIS 138
2004 Frontera to South Mission SU SOUTH HIDALGO 138
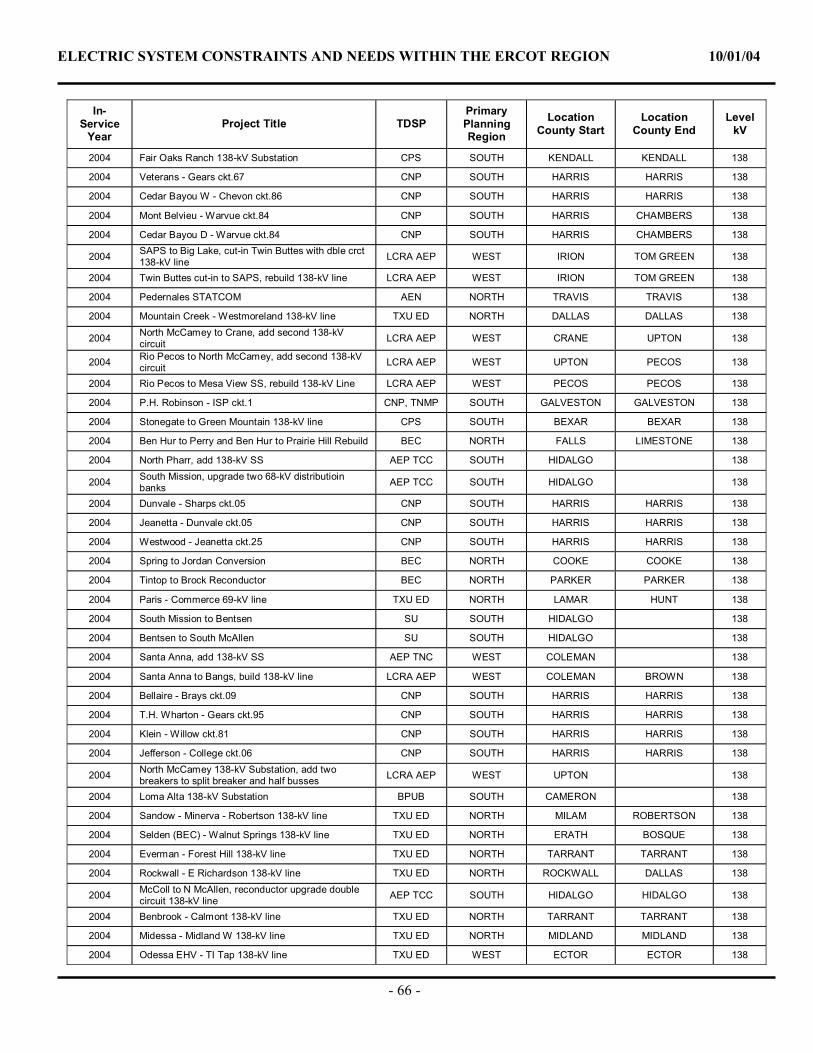
ELECTRIC SYSTEM CONSTRAINTS AND NEEDS WITHIN THE ERCOT REGION 10/01/04
- 66 -
In-Service
Year Project Title TDSP
Primary Planning Region
Location County Start
Location County End
Level kV
2004 Fair Oaks Ranch 138-kV Substation CPS SOUTH KENDALL KENDALL 138
2004 Veterans - Gears ckt.67 CNP SOUTH HARRIS HARRIS 138
2004 Cedar Bayou W - Chevon ckt.86 CNP SOUTH HARRIS HARRIS 138
2004 Mont Belvieu - Warvue ckt.84 CNP SOUTH HARRIS CHAMBERS 138
2004 Cedar Bayou D - Warvue ckt.84 CNP SOUTH HARRIS CHAMBERS 138
2004 SAPS to Big Lake, cut-in Twin Buttes with dble crct 138-kV line LCRA AEP WEST IRION TOM GREEN 138
2004 Twin Buttes cut-in to SAPS, rebuild 138-kV line LCRA AEP WEST IRION TOM GREEN 138
2004 Pedernales STATCOM AEN NORTH TRAVIS TRAVIS 138
2004 Mountain Creek - Westmoreland 138-kV line TXU ED NORTH DALLAS DALLAS 138
2004 North McCamey to Crane, add second 138-kV circuit LCRA AEP WEST CRANE UPTON 138
2004 Rio Pecos to North McCamey, add second 138-kV circuit LCRA AEP WEST UPTON PECOS 138
2004 Rio Pecos to Mesa View SS, rebuild 138-kV Line LCRA AEP WEST PECOS PECOS 138
2004 P.H. Robinson - ISP ckt.1 CNP, TNMP SOUTH GALVESTON GALVESTON 138
2004 Stonegate to Green Mountain 138-kV line CPS SOUTH BEXAR BEXAR 138
2004 Ben Hur to Perry and Ben Hur to Prairie Hill Rebuild BEC NORTH FALLS LIMESTONE 138
2004 North Pharr, add 138-kV SS AEP TCC SOUTH HIDALGO 138
2004 South Mission, upgrade two 68-kV distributioin banks AEP TCC SOUTH HIDALGO 138
2004 Dunvale - Sharps ckt.05 CNP SOUTH HARRIS HARRIS 138
2004 Jeanetta - Dunvale ckt.05 CNP SOUTH HARRIS HARRIS 138
2004 Westwood - Jeanetta ckt.25 CNP SOUTH HARRIS HARRIS 138
2004 Spring to Jordan Conversion BEC NORTH COOKE COOKE 138
2004 Tintop to Brock Reconductor BEC NORTH PARKER PARKER 138
2004 Paris - Commerce 69-kV line TXU ED NORTH LAMAR HUNT 138
2004 South Mission to Bentsen SU SOUTH HIDALGO 138
2004 Bentsen to South McAllen SU SOUTH HIDALGO 138
2004 Santa Anna, add 138-kV SS AEP TNC WEST COLEMAN 138
2004 Santa Anna to Bangs, build 138-kV line LCRA AEP WEST COLEMAN BROWN 138
2004 Bellaire - Brays ckt.09 CNP SOUTH HARRIS HARRIS 138
2004 T.H. Wharton - Gears ckt.95 CNP SOUTH HARRIS HARRIS 138
2004 Klein - Willow ckt.81 CNP SOUTH HARRIS HARRIS 138
2004 Jefferson - College ckt.06 CNP SOUTH HARRIS HARRIS 138
2004 North McCamey 138-kV Substation, add two breakers to split breaker and half busses LCRA AEP WEST UPTON 138
2004 Loma Alta 138-kV Substation BPUB SOUTH CAMERON 138
2004 Sandow - Minerva - Robertson 138-kV line TXU ED NORTH MILAM ROBERTSON 138
2004 Selden (BEC) - Walnut Springs 138-kV line TXU ED NORTH ERATH BOSQUE 138
2004 Everman - Forest Hill 138-kV line TXU ED NORTH TARRANT TARRANT 138
2004 Rockwall - E Richardson 138-kV line TXU ED NORTH ROCKWALL DALLAS 138
2004 McColl to N McAllen, reconductor upgrade double circuit 138-kV line AEP TCC SOUTH HIDALGO HIDALGO 138
2004 Benbrook - Calmont 138-kV line TXU ED NORTH TARRANT TARRANT 138
2004 Midessa - Midland W 138-kV line TXU ED NORTH MIDLAND MIDLAND 138
2004 Odessa EHV - TI Tap 138-kV line TXU ED WEST ECTOR ECTOR 138
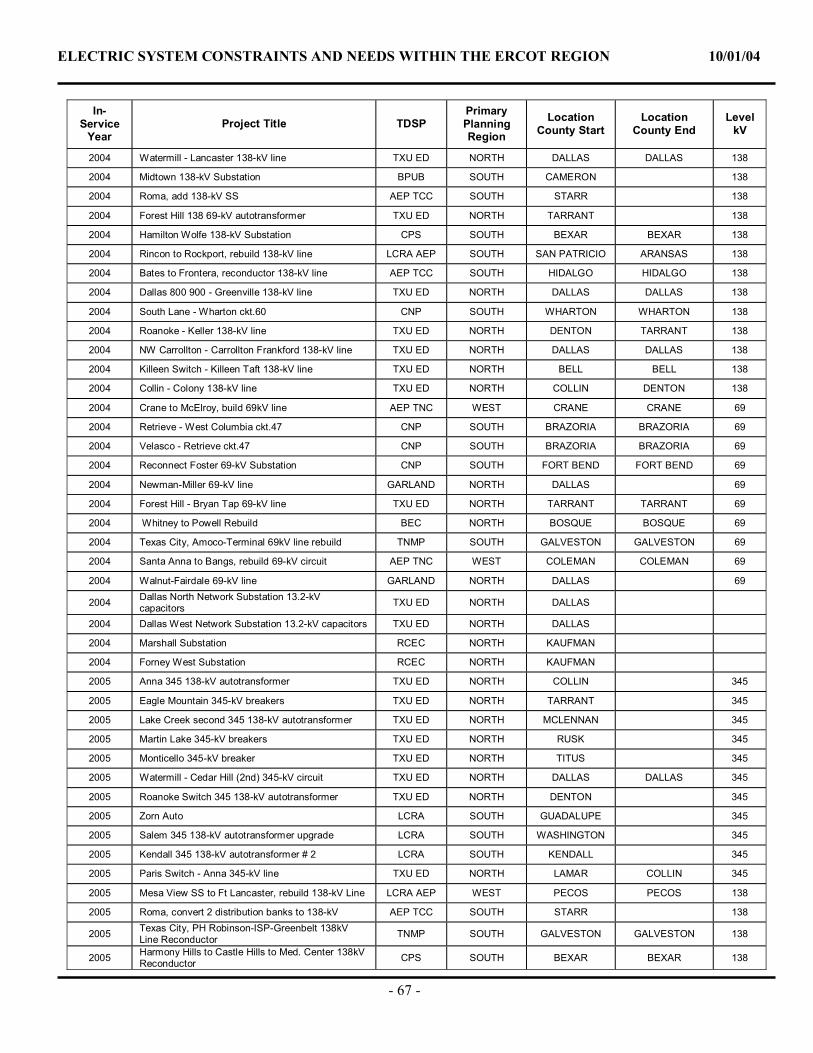
ELECTRIC SYSTEM CONSTRAINTS AND NEEDS WITHIN THE ERCOT REGION 10/01/04
- 67 -
In-Service
Year Project Title TDSP
Primary Planning Region
Location County Start
Location County End
Level kV
2004 Watermill - Lancaster 138-kV line TXU ED NORTH DALLAS DALLAS 138
2004 Midtown 138-kV Substation BPUB SOUTH CAMERON 138
2004 Roma, add 138-kV SS AEP TCC SOUTH STARR 138
2004 Forest Hill 138 69-kV autotransformer TXU ED NORTH TARRANT 138
2004 Hamilton Wolfe 138-kV Substation CPS SOUTH BEXAR BEXAR 138
2004 Rincon to Rockport, rebuild 138-kV line LCRA AEP SOUTH SAN PATRICIO ARANSAS 138
2004 Bates to Frontera, reconductor 138-kV line AEP TCC SOUTH HIDALGO HIDALGO 138
2004 Dallas 800 900 - Greenville 138-kV line TXU ED NORTH DALLAS DALLAS 138
2004 South Lane - Wharton ckt.60 CNP SOUTH WHARTON WHARTON 138
2004 Roanoke - Keller 138-kV line TXU ED NORTH DENTON TARRANT 138
2004 NW Carrollton - Carrollton Frankford 138-kV line TXU ED NORTH DALLAS DALLAS 138
2004 Killeen Switch - Killeen Taft 138-kV line TXU ED NORTH BELL BELL 138
2004 Collin - Colony 138-kV line TXU ED NORTH COLLIN DENTON 138
2004 Crane to McElroy, build 69kV line AEP TNC WEST CRANE CRANE 69
2004 Retrieve - West Columbia ckt.47 CNP SOUTH BRAZORIA BRAZORIA 69
2004 Velasco - Retrieve ckt.47 CNP SOUTH BRAZORIA BRAZORIA 69
2004 Reconnect Foster 69-kV Substation CNP SOUTH FORT BEND FORT BEND 69
2004 Newman-Miller 69-kV line GARLAND NORTH DALLAS 69
2004 Forest Hill - Bryan Tap 69-kV line TXU ED NORTH TARRANT TARRANT 69
2004 Whitney to Powell Rebuild BEC NORTH BOSQUE BOSQUE 69
2004 Texas City, Amoco-Terminal 69kV line rebuild TNMP SOUTH GALVESTON GALVESTON 69
2004 Santa Anna to Bangs, rebuild 69-kV circuit AEP TNC WEST COLEMAN COLEMAN 69
2004 Walnut-Fairdale 69-kV line GARLAND NORTH DALLAS 69
2004 Dallas North Network Substation 13.2-kV capacitors TXU ED NORTH DALLAS
2004 Dallas West Network Substation 13.2-kV capacitors TXU ED NORTH DALLAS
2004 Marshall Substation RCEC NORTH KAUFMAN
2004 Forney West Substation RCEC NORTH KAUFMAN
2005 Anna 345 138-kV autotransformer TXU ED NORTH COLLIN 345
2005 Eagle Mountain 345-kV breakers TXU ED NORTH TARRANT 345
2005 Lake Creek second 345 138-kV autotransformer TXU ED NORTH MCLENNAN 345
2005 Martin Lake 345-kV breakers TXU ED NORTH RUSK 345
2005 Monticello 345-kV breaker TXU ED NORTH TITUS 345
2005 Watermill - Cedar Hill (2nd) 345-kV circuit TXU ED NORTH DALLAS DALLAS 345
2005 Roanoke Switch 345 138-kV autotransformer TXU ED NORTH DENTON 345
2005 Zorn Auto LCRA SOUTH GUADALUPE 345
2005 Salem 345 138-kV autotransformer upgrade LCRA SOUTH WASHINGTON 345
2005 Kendall 345 138-kV autotransformer # 2 LCRA SOUTH KENDALL 345
2005 Paris Switch - Anna 345-kV line TXU ED NORTH LAMAR COLLIN 345
2005 Mesa View SS to Ft Lancaster, rebuild 138-kV Line LCRA AEP WEST PECOS PECOS 138
2005 Roma, convert 2 distribution banks to 138-kV AEP TCC SOUTH STARR 138
2005 Texas City, PH Robinson-ISP-Greenbelt 138kV Line Reconductor TNMP SOUTH GALVESTON GALVESTON 138
2005 Harmony Hills to Castle Hills to Med. Center 138kV Reconductor CPS SOUTH BEXAR BEXAR 138
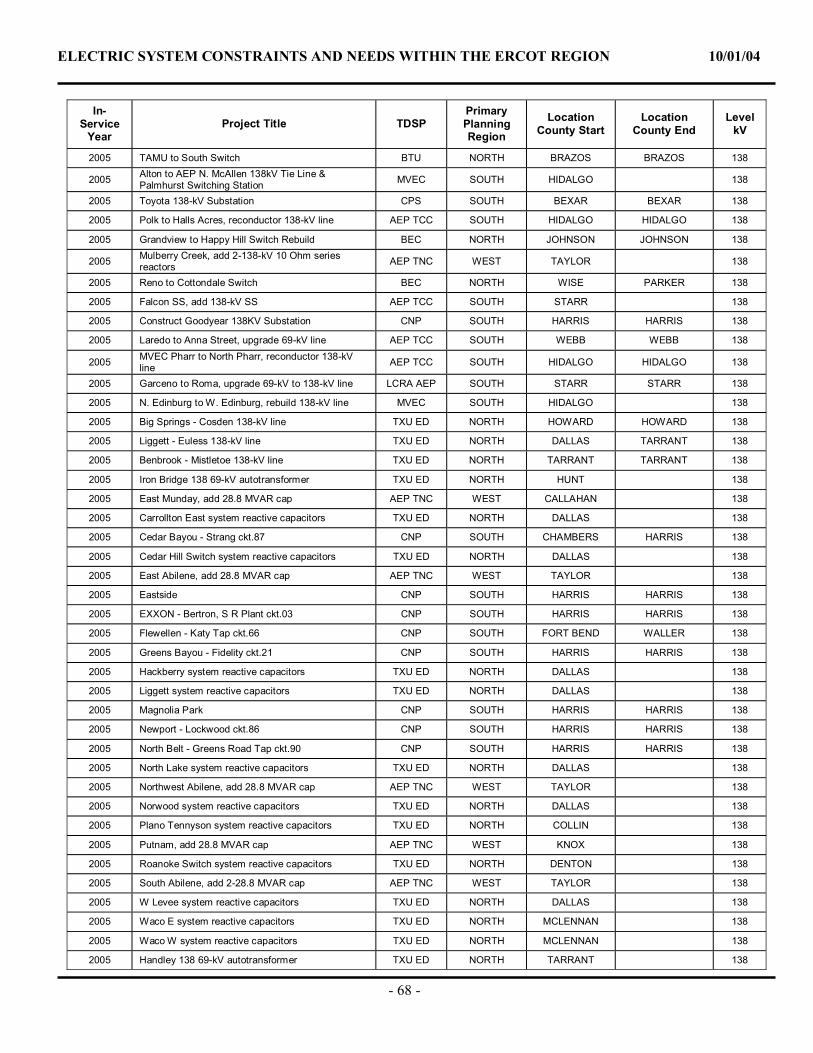
ELECTRIC SYSTEM CONSTRAINTS AND NEEDS WITHIN THE ERCOT REGION 10/01/04
- 68 -
In-Service
Year Project Title TDSP
Primary Planning Region
Location County Start
Location County End
Level kV
2005 TAMU to South Switch BTU NORTH BRAZOS BRAZOS 138
2005 Alton to AEP N. McAllen 138kV Tie Line & Palmhurst Switching Station MVEC SOUTH HIDALGO 138
2005 Toyota 138-kV Substation CPS SOUTH BEXAR BEXAR 138
2005 Polk to Halls Acres, reconductor 138-kV line AEP TCC SOUTH HIDALGO HIDALGO 138
2005 Grandview to Happy Hill Switch Rebuild BEC NORTH JOHNSON JOHNSON 138
2005 Mulberry Creek, add 2-138-kV 10 Ohm series reactors AEP TNC WEST TAYLOR 138
2005 Reno to Cottondale Switch BEC NORTH WISE PARKER 138
2005 Falcon SS, add 138-kV SS AEP TCC SOUTH STARR 138
2005 Construct Goodyear 138KV Substation CNP SOUTH HARRIS HARRIS 138
2005 Laredo to Anna Street, upgrade 69-kV line AEP TCC SOUTH WEBB WEBB 138
2005 MVEC Pharr to North Pharr, reconductor 138-kV line AEP TCC SOUTH HIDALGO HIDALGO 138
2005 Garceno to Roma, upgrade 69-kV to 138-kV line LCRA AEP SOUTH STARR STARR 138
2005 N. Edinburg to W. Edinburg, rebuild 138-kV line MVEC SOUTH HIDALGO 138
2005 Big Springs - Cosden 138-kV line TXU ED NORTH HOWARD HOWARD 138
2005 Liggett - Euless 138-kV line TXU ED NORTH DALLAS TARRANT 138
2005 Benbrook - Mistletoe 138-kV line TXU ED NORTH TARRANT TARRANT 138
2005 Iron Bridge 138 69-kV autotransformer TXU ED NORTH HUNT 138
2005 East Munday, add 28.8 MVAR cap AEP TNC WEST CALLAHAN 138
2005 Carrollton East system reactive capacitors TXU ED NORTH DALLAS 138
2005 Cedar Bayou - Strang ckt.87 CNP SOUTH CHAMBERS HARRIS 138
2005 Cedar Hill Switch system reactive capacitors TXU ED NORTH DALLAS 138
2005 East Abilene, add 28.8 MVAR cap AEP TNC WEST TAYLOR 138
2005 Eastside CNP SOUTH HARRIS HARRIS 138
2005 EXXON - Bertron, S R Plant ckt.03 CNP SOUTH HARRIS HARRIS 138
2005 Flewellen - Katy Tap ckt.66 CNP SOUTH FORT BEND WALLER 138
2005 Greens Bayou - Fidelity ckt.21 CNP SOUTH HARRIS HARRIS 138
2005 Hackberry system reactive capacitors TXU ED NORTH DALLAS 138
2005 Liggett system reactive capacitors TXU ED NORTH DALLAS 138
2005 Magnolia Park CNP SOUTH HARRIS HARRIS 138
2005 Newport - Lockwood ckt.86 CNP SOUTH HARRIS HARRIS 138
2005 North Belt - Greens Road Tap ckt.90 CNP SOUTH HARRIS HARRIS 138
2005 North Lake system reactive capacitors TXU ED NORTH DALLAS 138
2005 Northwest Abilene, add 28.8 MVAR cap AEP TNC WEST TAYLOR 138
2005 Norwood system reactive capacitors TXU ED NORTH DALLAS 138
2005 Plano Tennyson system reactive capacitors TXU ED NORTH COLLIN 138
2005 Putnam, add 28.8 MVAR cap AEP TNC WEST KNOX 138
2005 Roanoke Switch system reactive capacitors TXU ED NORTH DENTON 138
2005 South Abilene, add 2-28.8 MVAR cap AEP TNC WEST TAYLOR 138
2005 W Levee system reactive capacitors TXU ED NORTH DALLAS 138
2005 Waco E system reactive capacitors TXU ED NORTH MCLENNAN 138
2005 Waco W system reactive capacitors TXU ED NORTH MCLENNAN 138
2005 Handley 138 69-kV autotransformer TXU ED NORTH TARRANT 138
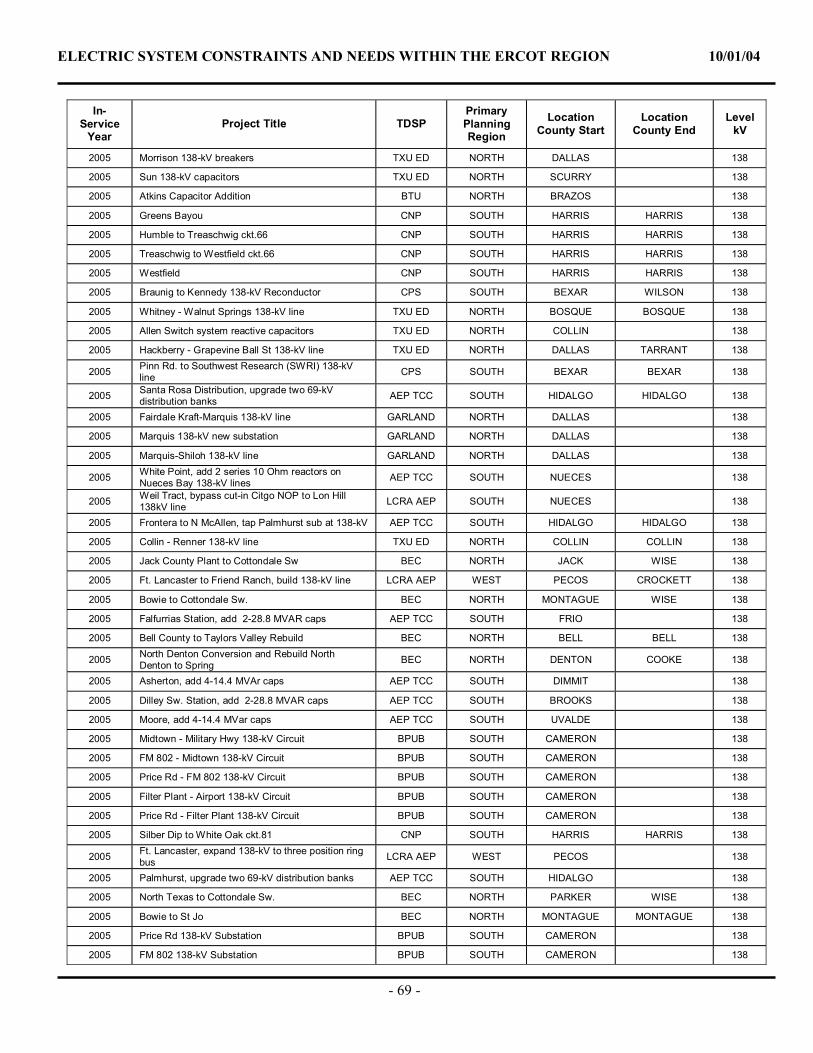
ELECTRIC SYSTEM CONSTRAINTS AND NEEDS WITHIN THE ERCOT REGION 10/01/04
- 69 -
In-Service
Year Project Title TDSP
Primary Planning Region
Location County Start
Location County End
Level kV
2005 Morrison 138-kV breakers TXU ED NORTH DALLAS 138
2005 Sun 138-kV capacitors TXU ED NORTH SCURRY 138
2005 Atkins Capacitor Addition BTU NORTH BRAZOS 138
2005 Greens Bayou CNP SOUTH HARRIS HARRIS 138
2005 Humble to Treaschwig ckt.66 CNP SOUTH HARRIS HARRIS 138
2005 Treaschwig to Westfield ckt.66 CNP SOUTH HARRIS HARRIS 138
2005 Westfield CNP SOUTH HARRIS HARRIS 138
2005 Braunig to Kennedy 138-kV Reconductor CPS SOUTH BEXAR WILSON 138
2005 Whitney - Walnut Springs 138-kV line TXU ED NORTH BOSQUE BOSQUE 138
2005 Allen Switch system reactive capacitors TXU ED NORTH COLLIN 138
2005 Hackberry - Grapevine Ball St 138-kV line TXU ED NORTH DALLAS TARRANT 138
2005 Pinn Rd. to Southwest Research (SWRI) 138-kV line CPS SOUTH BEXAR BEXAR 138
2005 Santa Rosa Distribution, upgrade two 69-kV distribution banks AEP TCC SOUTH HIDALGO HIDALGO 138
2005 Fairdale Kraft-Marquis 138-kV line GARLAND NORTH DALLAS 138
2005 Marquis 138-kV new substation GARLAND NORTH DALLAS 138
2005 Marquis-Shiloh 138-kV line GARLAND NORTH DALLAS 138
2005 White Point, add 2 series 10 Ohm reactors on Nueces Bay 138-kV lines AEP TCC SOUTH NUECES 138
2005 Weil Tract, bypass cut-in Citgo NOP to Lon Hill 138kV line LCRA AEP SOUTH NUECES 138
2005 Frontera to N McAllen, tap Palmhurst sub at 138-kV AEP TCC SOUTH HIDALGO HIDALGO 138
2005 Collin - Renner 138-kV line TXU ED NORTH COLLIN COLLIN 138
2005 Jack County Plant to Cottondale Sw BEC NORTH JACK WISE 138
2005 Ft. Lancaster to Friend Ranch, build 138-kV line LCRA AEP WEST PECOS CROCKETT 138
2005 Bowie to Cottondale Sw. BEC NORTH MONTAGUE WISE 138
2005 Falfurrias Station, add 2-28.8 MVAR caps AEP TCC SOUTH FRIO 138
2005 Bell County to Taylors Valley Rebuild BEC NORTH BELL BELL 138
2005 North Denton Conversion and Rebuild North Denton to Spring BEC NORTH DENTON COOKE 138
2005 Asherton, add 4-14.4 MVAr caps AEP TCC SOUTH DIMMIT 138
2005 Dilley Sw. Station, add 2-28.8 MVAR caps AEP TCC SOUTH BROOKS 138
2005 Moore, add 4-14.4 MVar caps AEP TCC SOUTH UVALDE 138
2005 Midtown - Military Hwy 138-kV Circuit BPUB SOUTH CAMERON 138
2005 FM 802 - Midtown 138-kV Circuit BPUB SOUTH CAMERON 138
2005 Price Rd - FM 802 138-kV Circuit BPUB SOUTH CAMERON 138
2005 Filter Plant - Airport 138-kV Circuit BPUB SOUTH CAMERON 138
2005 Price Rd - Filter Plant 138-kV Circuit BPUB SOUTH CAMERON 138
2005 Silber Dip to White Oak ckt.81 CNP SOUTH HARRIS HARRIS 138
2005 Ft. Lancaster, expand 138-kV to three position ring bus LCRA AEP WEST PECOS 138
2005 Palmhurst, upgrade two 69-kV distribution banks AEP TCC SOUTH HIDALGO 138
2005 North Texas to Cottondale Sw. BEC NORTH PARKER WISE 138
2005 Bowie to St Jo BEC NORTH MONTAGUE MONTAGUE 138
2005 Price Rd 138-kV Substation BPUB SOUTH CAMERON 138
2005 FM 802 138-kV Substation BPUB SOUTH CAMERON 138
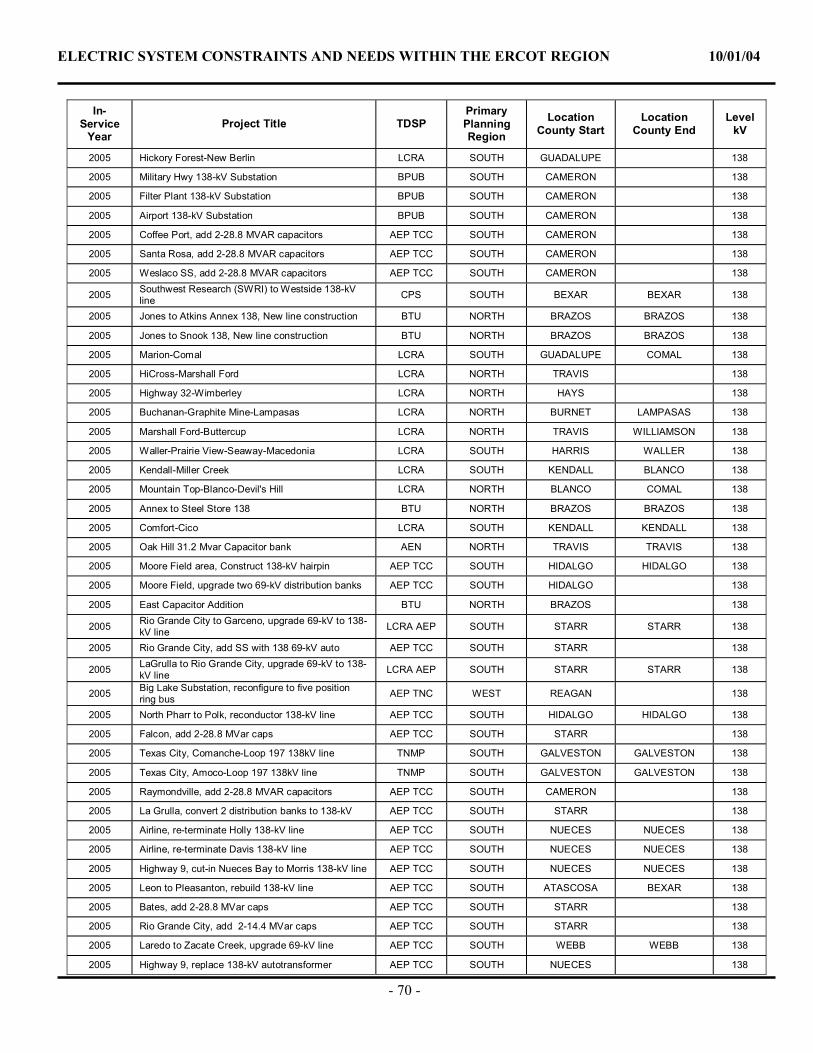
ELECTRIC SYSTEM CONSTRAINTS AND NEEDS WITHIN THE ERCOT REGION 10/01/04
- 70 -
In-Service
Year Project Title TDSP
Primary Planning Region
Location County Start
Location County End
Level kV
2005 Hickory Forest-New Berlin LCRA SOUTH GUADALUPE 138
2005 Military Hwy 138-kV Substation BPUB SOUTH CAMERON 138
2005 Filter Plant 138-kV Substation BPUB SOUTH CAMERON 138
2005 Airport 138-kV Substation BPUB SOUTH CAMERON 138
2005 Coffee Port, add 2-28.8 MVAR capacitors AEP TCC SOUTH CAMERON 138
2005 Santa Rosa, add 2-28.8 MVAR capacitors AEP TCC SOUTH CAMERON 138
2005 Weslaco SS, add 2-28.8 MVAR capacitors AEP TCC SOUTH CAMERON 138
2005 Southwest Research (SWRI) to Westside 138-kV line CPS SOUTH BEXAR BEXAR 138
2005 Jones to Atkins Annex 138, New line construction BTU NORTH BRAZOS BRAZOS 138
2005 Jones to Snook 138, New line construction BTU NORTH BRAZOS BRAZOS 138
2005 Marion-Comal LCRA SOUTH GUADALUPE COMAL 138
2005 HiCross-Marshall Ford LCRA NORTH TRAVIS 138
2005 Highway 32-Wimberley LCRA NORTH HAYS 138
2005 Buchanan-Graphite Mine-Lampasas LCRA NORTH BURNET LAMPASAS 138
2005 Marshall Ford-Buttercup LCRA NORTH TRAVIS WILLIAMSON 138
2005 Waller-Prairie View-Seaway-Macedonia LCRA SOUTH HARRIS WALLER 138
2005 Kendall-Miller Creek LCRA SOUTH KENDALL BLANCO 138
2005 Mountain Top-Blanco-Devil's Hill LCRA NORTH BLANCO COMAL 138
2005 Annex to Steel Store 138 BTU NORTH BRAZOS BRAZOS 138
2005 Comfort-Cico LCRA SOUTH KENDALL KENDALL 138
2005 Oak Hill 31.2 Mvar Capacitor bank AEN NORTH TRAVIS TRAVIS 138
2005 Moore Field area, Construct 138-kV hairpin AEP TCC SOUTH HIDALGO HIDALGO 138
2005 Moore Field, upgrade two 69-kV distribution banks AEP TCC SOUTH HIDALGO 138
2005 East Capacitor Addition BTU NORTH BRAZOS 138
2005 Rio Grande City to Garceno, upgrade 69-kV to 138-kV line LCRA AEP SOUTH STARR STARR 138
2005 Rio Grande City, add SS with 138 69-kV auto AEP TCC SOUTH STARR 138
2005 LaGrulla to Rio Grande City, upgrade 69-kV to 138-kV line LCRA AEP SOUTH STARR STARR 138
2005 Big Lake Substation, reconfigure to five position ring bus AEP TNC WEST REAGAN 138
2005 North Pharr to Polk, reconductor 138-kV line AEP TCC SOUTH HIDALGO HIDALGO 138
2005 Falcon, add 2-28.8 MVar caps AEP TCC SOUTH STARR 138
2005 Texas City, Comanche-Loop 197 138kV line TNMP SOUTH GALVESTON GALVESTON 138
2005 Texas City, Amoco-Loop 197 138kV line TNMP SOUTH GALVESTON GALVESTON 138
2005 Raymondville, add 2-28.8 MVAR capacitors AEP TCC SOUTH CAMERON 138
2005 La Grulla, convert 2 distribution banks to 138-kV AEP TCC SOUTH STARR 138
2005 Airline, re-terminate Holly 138-kV line AEP TCC SOUTH NUECES NUECES 138
2005 Airline, re-terminate Davis 138-kV line AEP TCC SOUTH NUECES NUECES 138
2005 Highway 9, cut-in Nueces Bay to Morris 138-kV line AEP TCC SOUTH NUECES NUECES 138
2005 Leon to Pleasanton, rebuild 138-kV line AEP TCC SOUTH ATASCOSA BEXAR 138
2005 Bates, add 2-28.8 MVar caps AEP TCC SOUTH STARR 138
2005 Rio Grande City, add 2-14.4 MVar caps AEP TCC SOUTH STARR 138
2005 Laredo to Zacate Creek, upgrade 69-kV line AEP TCC SOUTH WEBB WEBB 138
2005 Highway 9, replace 138-kV autotransformer AEP TCC SOUTH NUECES 138
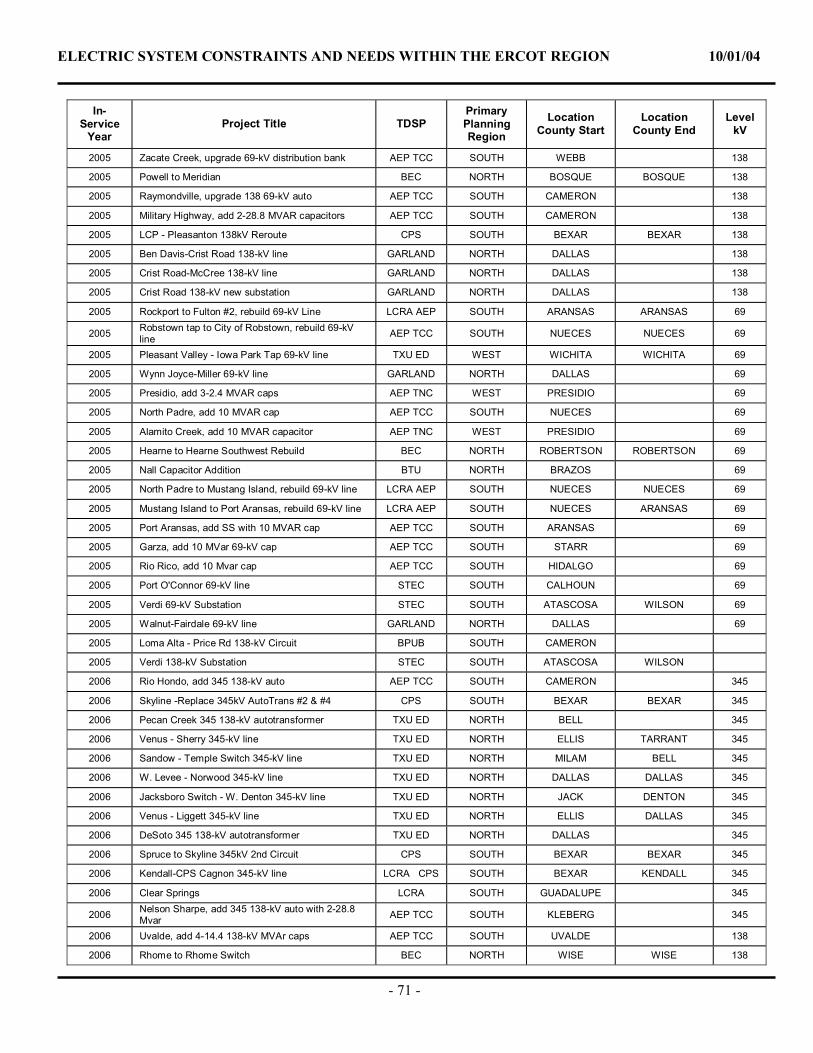
ELECTRIC SYSTEM CONSTRAINTS AND NEEDS WITHIN THE ERCOT REGION 10/01/04
- 71 -
In-Service
Year Project Title TDSP
Primary Planning Region
Location County Start
Location County End
Level kV
2005 Zacate Creek, upgrade 69-kV distribution bank AEP TCC SOUTH WEBB 138
2005 Powell to Meridian BEC NORTH BOSQUE BOSQUE 138
2005 Raymondville, upgrade 138 69-kV auto AEP TCC SOUTH CAMERON 138
2005 Military Highway, add 2-28.8 MVAR capacitors AEP TCC SOUTH CAMERON 138
2005 LCP - Pleasanton 138kV Reroute CPS SOUTH BEXAR BEXAR 138
2005 Ben Davis-Crist Road 138-kV line GARLAND NORTH DALLAS 138
2005 Crist Road-McCree 138-kV line GARLAND NORTH DALLAS 138
2005 Crist Road 138-kV new substation GARLAND NORTH DALLAS 138
2005 Rockport to Fulton #2, rebuild 69-kV Line LCRA AEP SOUTH ARANSAS ARANSAS 69
2005 Robstown tap to City of Robstown, rebuild 69-kV line AEP TCC SOUTH NUECES NUECES 69
2005 Pleasant Valley - Iowa Park Tap 69-kV line TXU ED WEST WICHITA WICHITA 69
2005 Wynn Joyce-Miller 69-kV line GARLAND NORTH DALLAS 69
2005 Presidio, add 3-2.4 MVAR caps AEP TNC WEST PRESIDIO 69
2005 North Padre, add 10 MVAR cap AEP TCC SOUTH NUECES 69
2005 Alamito Creek, add 10 MVAR capacitor AEP TNC WEST PRESIDIO 69
2005 Hearne to Hearne Southwest Rebuild BEC NORTH ROBERTSON ROBERTSON 69
2005 Nall Capacitor Addition BTU NORTH BRAZOS 69
2005 North Padre to Mustang Island, rebuild 69-kV line LCRA AEP SOUTH NUECES NUECES 69
2005 Mustang Island to Port Aransas, rebuild 69-kV line LCRA AEP SOUTH NUECES ARANSAS 69
2005 Port Aransas, add SS with 10 MVAR cap AEP TCC SOUTH ARANSAS 69
2005 Garza, add 10 MVar 69-kV cap AEP TCC SOUTH STARR 69
2005 Rio Rico, add 10 Mvar cap AEP TCC SOUTH HIDALGO 69
2005 Port O'Connor 69-kV line STEC SOUTH CALHOUN 69
2005 Verdi 69-kV Substation STEC SOUTH ATASCOSA WILSON 69
2005 Walnut-Fairdale 69-kV line GARLAND NORTH DALLAS 69
2005 Loma Alta - Price Rd 138-kV Circuit BPUB SOUTH CAMERON
2005 Verdi 138-kV Substation STEC SOUTH ATASCOSA WILSON
2006 Rio Hondo, add 345 138-kV auto AEP TCC SOUTH CAMERON 345
2006 Skyline -Replace 345kV AutoTrans #2 & #4 CPS SOUTH BEXAR BEXAR 345
2006 Pecan Creek 345 138-kV autotransformer TXU ED NORTH BELL 345
2006 Venus - Sherry 345-kV line TXU ED NORTH ELLIS TARRANT 345
2006 Sandow - Temple Switch 345-kV line TXU ED NORTH MILAM BELL 345
2006 W. Levee - Norwood 345-kV line TXU ED NORTH DALLAS DALLAS 345
2006 Jacksboro Switch - W. Denton 345-kV line TXU ED NORTH JACK DENTON 345
2006 Venus - Liggett 345-kV line TXU ED NORTH ELLIS DALLAS 345
2006 DeSoto 345 138-kV autotransformer TXU ED NORTH DALLAS 345
2006 Spruce to Skyline 345kV 2nd Circuit CPS SOUTH BEXAR BEXAR 345
2006 Kendall-CPS Cagnon 345-kV line LCRA CPS SOUTH BEXAR KENDALL 345
2006 Clear Springs LCRA SOUTH GUADALUPE 345
2006 Nelson Sharpe, add 345 138-kV auto with 2-28.8 Mvar AEP TCC SOUTH KLEBERG 345
2006 Uvalde, add 4-14.4 138-kV MVAr caps AEP TCC SOUTH UVALDE 138
2006 Rhome to Rhome Switch BEC NORTH WISE WISE 138
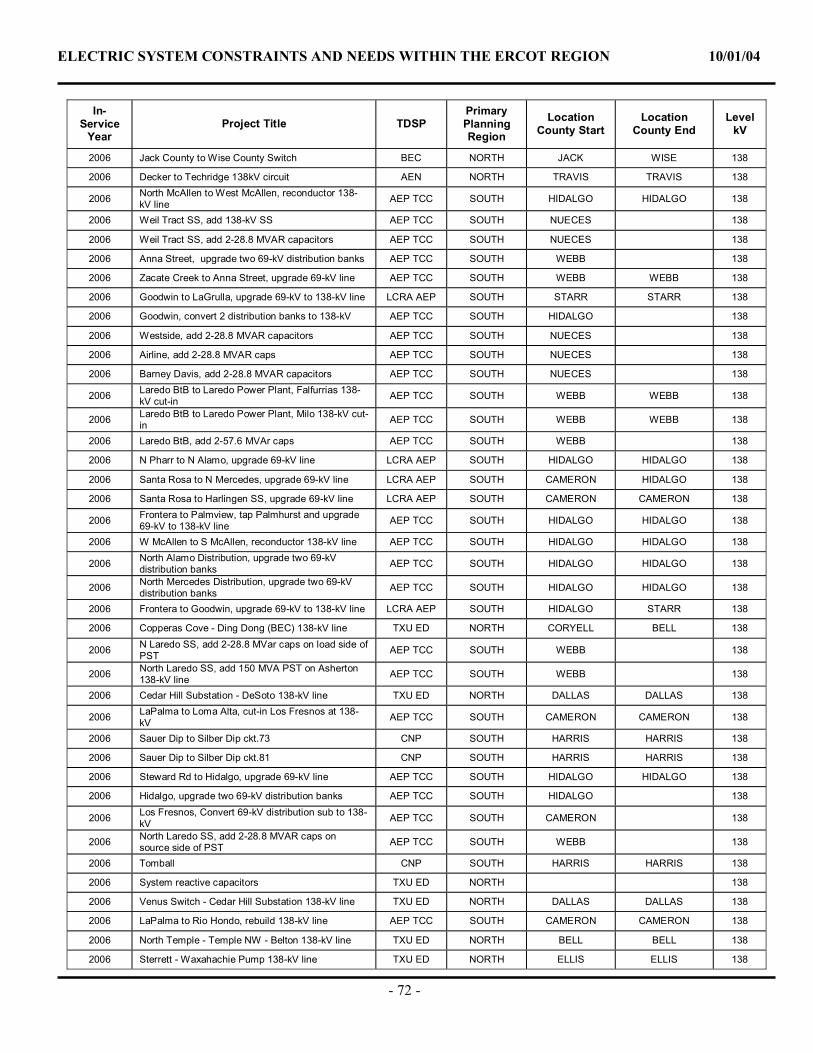
ELECTRIC SYSTEM CONSTRAINTS AND NEEDS WITHIN THE ERCOT REGION 10/01/04
- 72 -
In-Service
Year Project Title TDSP
Primary Planning Region
Location County Start
Location County End
Level kV
2006 Jack County to Wise County Switch BEC NORTH JACK WISE 138
2006 Decker to Techridge 138kV circuit AEN NORTH TRAVIS TRAVIS 138
2006 North McAllen to West McAllen, reconductor 138-kV line AEP TCC SOUTH HIDALGO HIDALGO 138
2006 Weil Tract SS, add 138-kV SS AEP TCC SOUTH NUECES 138
2006 Weil Tract SS, add 2-28.8 MVAR capacitors AEP TCC SOUTH NUECES 138
2006 Anna Street, upgrade two 69-kV distribution banks AEP TCC SOUTH WEBB 138
2006 Zacate Creek to Anna Street, upgrade 69-kV line AEP TCC SOUTH WEBB WEBB 138
2006 Goodwin to LaGrulla, upgrade 69-kV to 138-kV line LCRA AEP SOUTH STARR STARR 138
2006 Goodwin, convert 2 distribution banks to 138-kV AEP TCC SOUTH HIDALGO 138
2006 Westside, add 2-28.8 MVAR capacitors AEP TCC SOUTH NUECES 138
2006 Airline, add 2-28.8 MVAR caps AEP TCC SOUTH NUECES 138
2006 Barney Davis, add 2-28.8 MVAR capacitors AEP TCC SOUTH NUECES 138
2006 Laredo BtB to Laredo Power Plant, Falfurrias 138-kV cut-in AEP TCC SOUTH WEBB WEBB 138
2006 Laredo BtB to Laredo Power Plant, Milo 138-kV cut-in AEP TCC SOUTH WEBB WEBB 138
2006 Laredo BtB, add 2-57.6 MVAr caps AEP TCC SOUTH WEBB 138
2006 N Pharr to N Alamo, upgrade 69-kV line LCRA AEP SOUTH HIDALGO HIDALGO 138
2006 Santa Rosa to N Mercedes, upgrade 69-kV line LCRA AEP SOUTH CAMERON HIDALGO 138
2006 Santa Rosa to Harlingen SS, upgrade 69-kV line LCRA AEP SOUTH CAMERON CAMERON 138
2006 Frontera to Palmview, tap Palmhurst and upgrade 69-kV to 138-kV line AEP TCC SOUTH HIDALGO HIDALGO 138
2006 W McAllen to S McAllen, reconductor 138-kV line AEP TCC SOUTH HIDALGO HIDALGO 138
2006 North Alamo Distribution, upgrade two 69-kV distribution banks AEP TCC SOUTH HIDALGO HIDALGO 138
2006 North Mercedes Distribution, upgrade two 69-kV distribution banks AEP TCC SOUTH HIDALGO HIDALGO 138
2006 Frontera to Goodwin, upgrade 69-kV to 138-kV line LCRA AEP SOUTH HIDALGO STARR 138
2006 Copperas Cove - Ding Dong (BEC) 138-kV line TXU ED NORTH CORYELL BELL 138
2006 N Laredo SS, add 2-28.8 MVar caps on load side of PST AEP TCC SOUTH WEBB 138
2006 North Laredo SS, add 150 MVA PST on Asherton 138-kV line AEP TCC SOUTH WEBB 138
2006 Cedar Hill Substation - DeSoto 138-kV line TXU ED NORTH DALLAS DALLAS 138
2006 LaPalma to Loma Alta, cut-in Los Fresnos at 138-kV AEP TCC SOUTH CAMERON CAMERON 138
2006 Sauer Dip to Silber Dip ckt.73 CNP SOUTH HARRIS HARRIS 138
2006 Sauer Dip to Silber Dip ckt.81 CNP SOUTH HARRIS HARRIS 138
2006 Steward Rd to Hidalgo, upgrade 69-kV line AEP TCC SOUTH HIDALGO HIDALGO 138
2006 Hidalgo, upgrade two 69-kV distribution banks AEP TCC SOUTH HIDALGO 138
2006 Los Fresnos, Convert 69-kV distribution sub to 138-kV AEP TCC SOUTH CAMERON 138
2006 North Laredo SS, add 2-28.8 MVAR caps on source side of PST AEP TCC SOUTH WEBB 138
2006 Tomball CNP SOUTH HARRIS HARRIS 138
2006 System reactive capacitors TXU ED NORTH 138
2006 Venus Switch - Cedar Hill Substation 138-kV line TXU ED NORTH DALLAS DALLAS 138
2006 LaPalma to Rio Hondo, rebuild 138-kV line AEP TCC SOUTH CAMERON CAMERON 138
2006 North Temple - Temple NW - Belton 138-kV line TXU ED NORTH BELL BELL 138
2006 Sterrett - Waxahachie Pump 138-kV line TXU ED NORTH ELLIS ELLIS 138
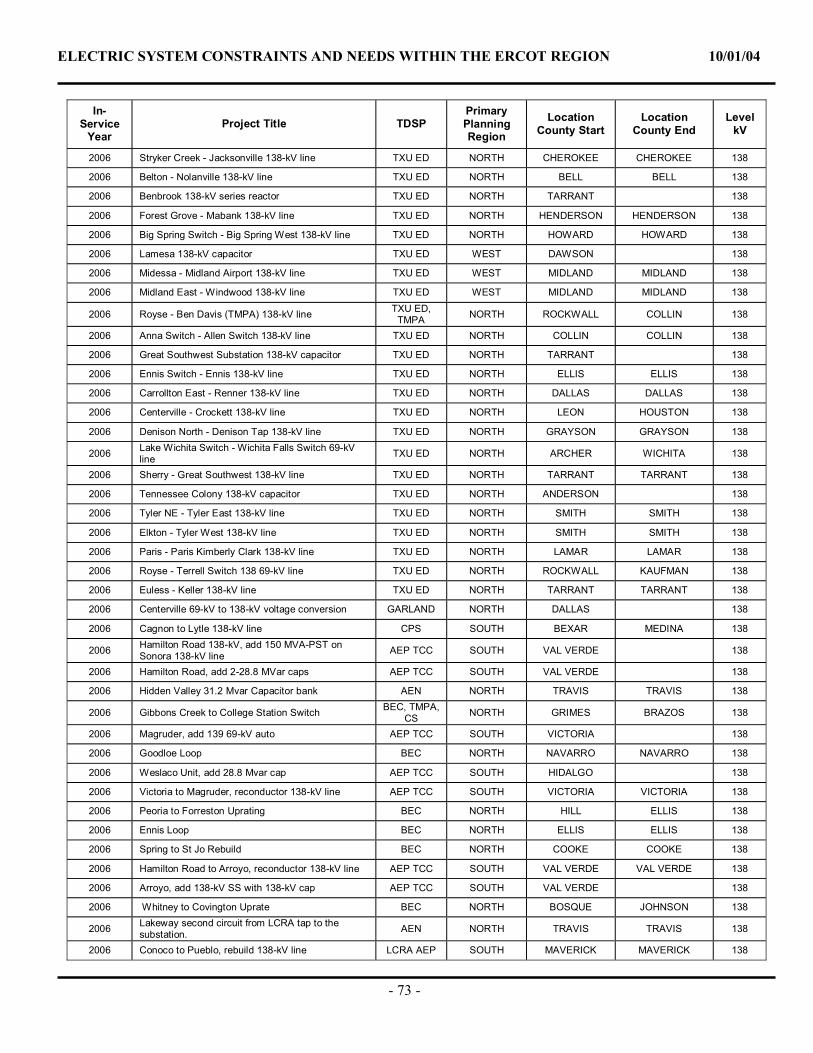
ELECTRIC SYSTEM CONSTRAINTS AND NEEDS WITHIN THE ERCOT REGION 10/01/04
- 73 -
In-Service
Year Project Title TDSP
Primary Planning Region
Location County Start
Location County End
Level kV
2006 Stryker Creek - Jacksonville 138-kV line TXU ED NORTH CHEROKEE CHEROKEE 138
2006 Belton - Nolanville 138-kV line TXU ED NORTH BELL BELL 138
2006 Benbrook 138-kV series reactor TXU ED NORTH TARRANT 138
2006 Forest Grove - Mabank 138-kV line TXU ED NORTH HENDERSON HENDERSON 138
2006 Big Spring Switch - Big Spring West 138-kV line TXU ED NORTH HOWARD HOWARD 138
2006 Lamesa 138-kV capacitor TXU ED WEST DAWSON 138
2006 Midessa - Midland Airport 138-kV line TXU ED WEST MIDLAND MIDLAND 138
2006 Midland East - Windwood 138-kV line TXU ED WEST MIDLAND MIDLAND 138
2006 Royse - Ben Davis (TMPA) 138-kV line TXU ED, TMPA NORTH ROCKWALL COLLIN 138
2006 Anna Switch - Allen Switch 138-kV line TXU ED NORTH COLLIN COLLIN 138
2006 Great Southwest Substation 138-kV capacitor TXU ED NORTH TARRANT 138
2006 Ennis Switch - Ennis 138-kV line TXU ED NORTH ELLIS ELLIS 138
2006 Carrollton East - Renner 138-kV line TXU ED NORTH DALLAS DALLAS 138
2006 Centerville - Crockett 138-kV line TXU ED NORTH LEON HOUSTON 138
2006 Denison North - Denison Tap 138-kV line TXU ED NORTH GRAYSON GRAYSON 138
2006 Lake Wichita Switch - Wichita Falls Switch 69-kV line TXU ED NORTH ARCHER WICHITA 138
2006 Sherry - Great Southwest 138-kV line TXU ED NORTH TARRANT TARRANT 138
2006 Tennessee Colony 138-kV capacitor TXU ED NORTH ANDERSON 138
2006 Tyler NE - Tyler East 138-kV line TXU ED NORTH SMITH SMITH 138
2006 Elkton - Tyler West 138-kV line TXU ED NORTH SMITH SMITH 138
2006 Paris - Paris Kimberly Clark 138-kV line TXU ED NORTH LAMAR LAMAR 138
2006 Royse - Terrell Switch 138 69-kV line TXU ED NORTH ROCKWALL KAUFMAN 138
2006 Euless - Keller 138-kV line TXU ED NORTH TARRANT TARRANT 138
2006 Centerville 69-kV to 138-kV voltage conversion GARLAND NORTH DALLAS 138
2006 Cagnon to Lytle 138-kV line CPS SOUTH BEXAR MEDINA 138
2006 Hamilton Road 138-kV, add 150 MVA-PST on Sonora 138-kV line AEP TCC SOUTH VAL VERDE 138
2006 Hamilton Road, add 2-28.8 MVar caps AEP TCC SOUTH VAL VERDE 138
2006 Hidden Valley 31.2 Mvar Capacitor bank AEN NORTH TRAVIS TRAVIS 138
2006 Gibbons Creek to College Station Switch BEC, TMPA, CS NORTH GRIMES BRAZOS 138
2006 Magruder, add 139 69-kV auto AEP TCC SOUTH VICTORIA 138
2006 Goodloe Loop BEC NORTH NAVARRO NAVARRO 138
2006 Weslaco Unit, add 28.8 Mvar cap AEP TCC SOUTH HIDALGO 138
2006 Victoria to Magruder, reconductor 138-kV line AEP TCC SOUTH VICTORIA VICTORIA 138
2006 Peoria to Forreston Uprating BEC NORTH HILL ELLIS 138
2006 Ennis Loop BEC NORTH ELLIS ELLIS 138
2006 Spring to St Jo Rebuild BEC NORTH COOKE COOKE 138
2006 Hamilton Road to Arroyo, reconductor 138-kV line AEP TCC SOUTH VAL VERDE VAL VERDE 138
2006 Arroyo, add 138-kV SS with 138-kV cap AEP TCC SOUTH VAL VERDE 138
2006 Whitney to Covington Uprate BEC NORTH BOSQUE JOHNSON 138
2006 Lakeway second circuit from LCRA tap to the substation. AEN NORTH TRAVIS TRAVIS 138
2006 Conoco to Pueblo, rebuild 138-kV line LCRA AEP SOUTH MAVERICK MAVERICK 138
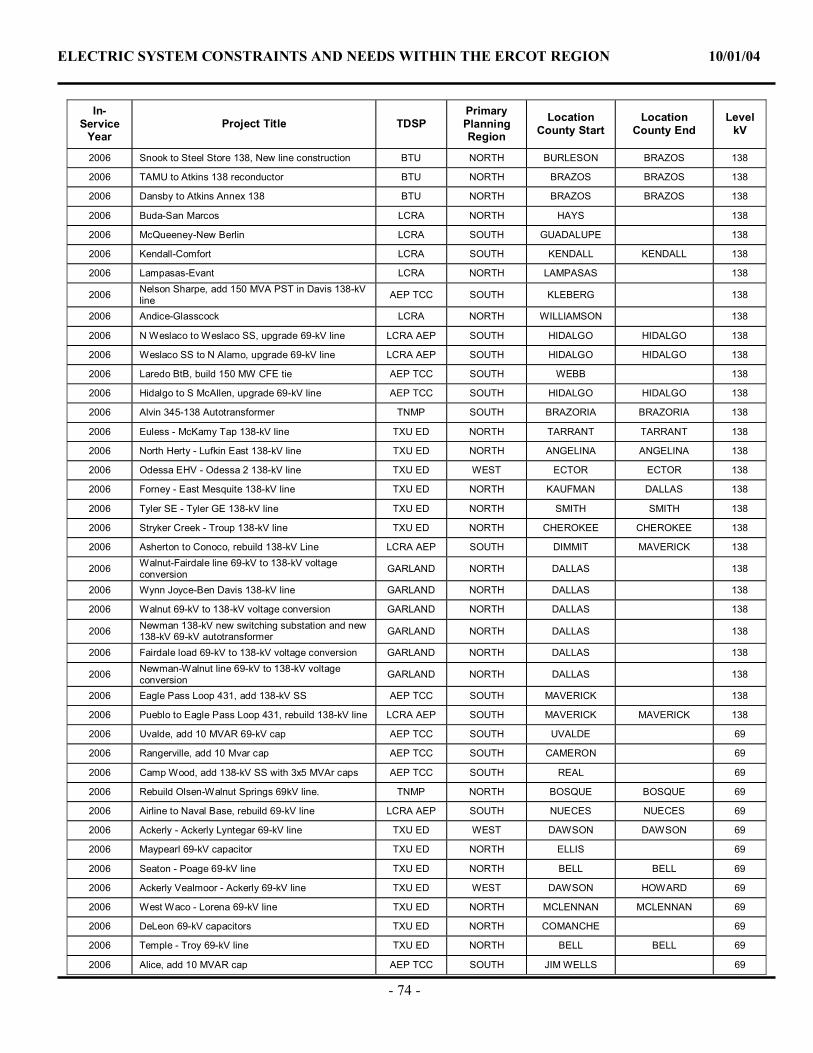
ELECTRIC SYSTEM CONSTRAINTS AND NEEDS WITHIN THE ERCOT REGION 10/01/04
- 74 -
In-Service
Year Project Title TDSP
Primary Planning Region
Location County Start
Location County End
Level kV
2006 Snook to Steel Store 138, New line construction BTU NORTH BURLESON BRAZOS 138
2006 TAMU to Atkins 138 reconductor BTU NORTH BRAZOS BRAZOS 138
2006 Dansby to Atkins Annex 138 BTU NORTH BRAZOS BRAZOS 138
2006 Buda-San Marcos LCRA NORTH HAYS 138
2006 McQueeney-New Berlin LCRA SOUTH GUADALUPE 138
2006 Kendall-Comfort LCRA SOUTH KENDALL KENDALL 138
2006 Lampasas-Evant LCRA NORTH LAMPASAS 138
2006 Nelson Sharpe, add 150 MVA PST in Davis 138-kV line AEP TCC SOUTH KLEBERG 138
2006 Andice-Glasscock LCRA NORTH WILLIAMSON 138
2006 N Weslaco to Weslaco SS, upgrade 69-kV line LCRA AEP SOUTH HIDALGO HIDALGO 138
2006 Weslaco SS to N Alamo, upgrade 69-kV line LCRA AEP SOUTH HIDALGO HIDALGO 138
2006 Laredo BtB, build 150 MW CFE tie AEP TCC SOUTH WEBB 138
2006 Hidalgo to S McAllen, upgrade 69-kV line AEP TCC SOUTH HIDALGO HIDALGO 138
2006 Alvin 345-138 Autotransformer TNMP SOUTH BRAZORIA BRAZORIA 138
2006 Euless - McKamy Tap 138-kV line TXU ED NORTH TARRANT TARRANT 138
2006 North Herty - Lufkin East 138-kV line TXU ED NORTH ANGELINA ANGELINA 138
2006 Odessa EHV - Odessa 2 138-kV line TXU ED WEST ECTOR ECTOR 138
2006 Forney - East Mesquite 138-kV line TXU ED NORTH KAUFMAN DALLAS 138
2006 Tyler SE - Tyler GE 138-kV line TXU ED NORTH SMITH SMITH 138
2006 Stryker Creek - Troup 138-kV line TXU ED NORTH CHEROKEE CHEROKEE 138
2006 Asherton to Conoco, rebuild 138-kV Line LCRA AEP SOUTH DIMMIT MAVERICK 138
2006 Walnut-Fairdale line 69-kV to 138-kV voltage conversion GARLAND NORTH DALLAS 138
2006 Wynn Joyce-Ben Davis 138-kV line GARLAND NORTH DALLAS 138
2006 Walnut 69-kV to 138-kV voltage conversion GARLAND NORTH DALLAS 138
2006 Newman 138-kV new switching substation and new 138-kV 69-kV autotransformer GARLAND NORTH DALLAS 138
2006 Fairdale load 69-kV to 138-kV voltage conversion GARLAND NORTH DALLAS 138
2006 Newman-Walnut line 69-kV to 138-kV voltage conversion GARLAND NORTH DALLAS 138
2006 Eagle Pass Loop 431, add 138-kV SS AEP TCC SOUTH MAVERICK 138
2006 Pueblo to Eagle Pass Loop 431, rebuild 138-kV line LCRA AEP SOUTH MAVERICK MAVERICK 138
2006 Uvalde, add 10 MVAR 69-kV cap AEP TCC SOUTH UVALDE 69
2006 Rangerville, add 10 Mvar cap AEP TCC SOUTH CAMERON 69
2006 Camp Wood, add 138-kV SS with 3x5 MVAr caps AEP TCC SOUTH REAL 69
2006 Rebuild Olsen-Walnut Springs 69kV line. TNMP NORTH BOSQUE BOSQUE 69
2006 Airline to Naval Base, rebuild 69-kV line LCRA AEP SOUTH NUECES NUECES 69
2006 Ackerly - Ackerly Lyntegar 69-kV line TXU ED WEST DAWSON DAWSON 69
2006 Maypearl 69-kV capacitor TXU ED NORTH ELLIS 69
2006 Seaton - Poage 69-kV line TXU ED NORTH BELL BELL 69
2006 Ackerly Vealmoor - Ackerly 69-kV line TXU ED WEST DAWSON HOWARD 69
2006 West Waco - Lorena 69-kV line TXU ED NORTH MCLENNAN MCLENNAN 69
2006 DeLeon 69-kV capacitors TXU ED NORTH COMANCHE 69
2006 Temple - Troy 69-kV line TXU ED NORTH BELL BELL 69
2006 Alice, add 10 MVAR cap AEP TCC SOUTH JIM WELLS 69
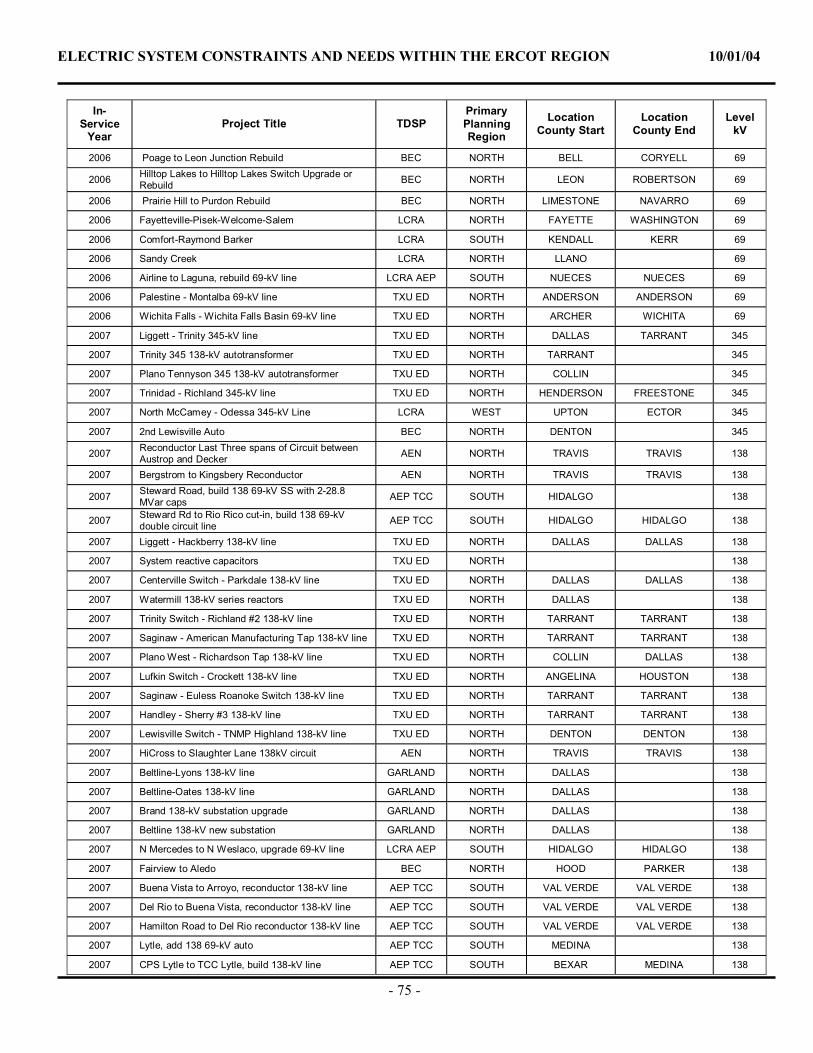
ELECTRIC SYSTEM CONSTRAINTS AND NEEDS WITHIN THE ERCOT REGION 10/01/04
- 75 -
In-Service
Year Project Title TDSP
Primary Planning Region
Location County Start
Location County End
Level kV
2006 Poage to Leon Junction Rebuild BEC NORTH BELL CORYELL 69
2006 Hilltop Lakes to Hilltop Lakes Switch Upgrade or Rebuild BEC NORTH LEON ROBERTSON 69
2006 Prairie Hill to Purdon Rebuild BEC NORTH LIMESTONE NAVARRO 69
2006 Fayetteville-Pisek-Welcome-Salem LCRA NORTH FAYETTE WASHINGTON 69
2006 Comfort-Raymond Barker LCRA SOUTH KENDALL KERR 69
2006 Sandy Creek LCRA NORTH LLANO 69
2006 Airline to Laguna, rebuild 69-kV line LCRA AEP SOUTH NUECES NUECES 69
2006 Palestine - Montalba 69-kV line TXU ED NORTH ANDERSON ANDERSON 69
2006 Wichita Falls - Wichita Falls Basin 69-kV line TXU ED NORTH ARCHER WICHITA 69
2007 Liggett - Trinity 345-kV line TXU ED NORTH DALLAS TARRANT 345
2007 Trinity 345 138-kV autotransformer TXU ED NORTH TARRANT 345
2007 Plano Tennyson 345 138-kV autotransformer TXU ED NORTH COLLIN 345
2007 Trinidad - Richland 345-kV line TXU ED NORTH HENDERSON FREESTONE 345
2007 North McCamey - Odessa 345-kV Line LCRA WEST UPTON ECTOR 345
2007 2nd Lewisville Auto BEC NORTH DENTON 345
2007 Reconductor Last Three spans of Circuit between Austrop and Decker AEN NORTH TRAVIS TRAVIS 138
2007 Bergstrom to Kingsbery Reconductor AEN NORTH TRAVIS TRAVIS 138
2007 Steward Road, build 138 69-kV SS with 2-28.8 MVar caps AEP TCC SOUTH HIDALGO 138
2007 Steward Rd to Rio Rico cut-in, build 138 69-kV double circuit line AEP TCC SOUTH HIDALGO HIDALGO 138
2007 Liggett - Hackberry 138-kV line TXU ED NORTH DALLAS DALLAS 138
2007 System reactive capacitors TXU ED NORTH 138
2007 Centerville Switch - Parkdale 138-kV line TXU ED NORTH DALLAS DALLAS 138
2007 Watermill 138-kV series reactors TXU ED NORTH DALLAS 138
2007 Trinity Switch - Richland #2 138-kV line TXU ED NORTH TARRANT TARRANT 138
2007 Saginaw - American Manufacturing Tap 138-kV line TXU ED NORTH TARRANT TARRANT 138
2007 Plano West - Richardson Tap 138-kV line TXU ED NORTH COLLIN DALLAS 138
2007 Lufkin Switch - Crockett 138-kV line TXU ED NORTH ANGELINA HOUSTON 138
2007 Saginaw - Euless Roanoke Switch 138-kV line TXU ED NORTH TARRANT TARRANT 138
2007 Handley - Sherry #3 138-kV line TXU ED NORTH TARRANT TARRANT 138
2007 Lewisville Switch - TNMP Highland 138-kV line TXU ED NORTH DENTON DENTON 138
2007 HiCross to Slaughter Lane 138kV circuit AEN NORTH TRAVIS TRAVIS 138
2007 Beltline-Lyons 138-kV line GARLAND NORTH DALLAS 138
2007 Beltline-Oates 138-kV line GARLAND NORTH DALLAS 138
2007 Brand 138-kV substation upgrade GARLAND NORTH DALLAS 138
2007 Beltline 138-kV new substation GARLAND NORTH DALLAS 138
2007 N Mercedes to N Weslaco, upgrade 69-kV line LCRA AEP SOUTH HIDALGO HIDALGO 138
2007 Fairview to Aledo BEC NORTH HOOD PARKER 138
2007 Buena Vista to Arroyo, reconductor 138-kV line AEP TCC SOUTH VAL VERDE VAL VERDE 138
2007 Del Rio to Buena Vista, reconductor 138-kV line AEP TCC SOUTH VAL VERDE VAL VERDE 138
2007 Hamilton Road to Del Rio reconductor 138-kV line AEP TCC SOUTH VAL VERDE VAL VERDE 138
2007 Lytle, add 138 69-kV auto AEP TCC SOUTH MEDINA 138
2007 CPS Lytle to TCC Lytle, build 138-kV line AEP TCC SOUTH BEXAR MEDINA 138
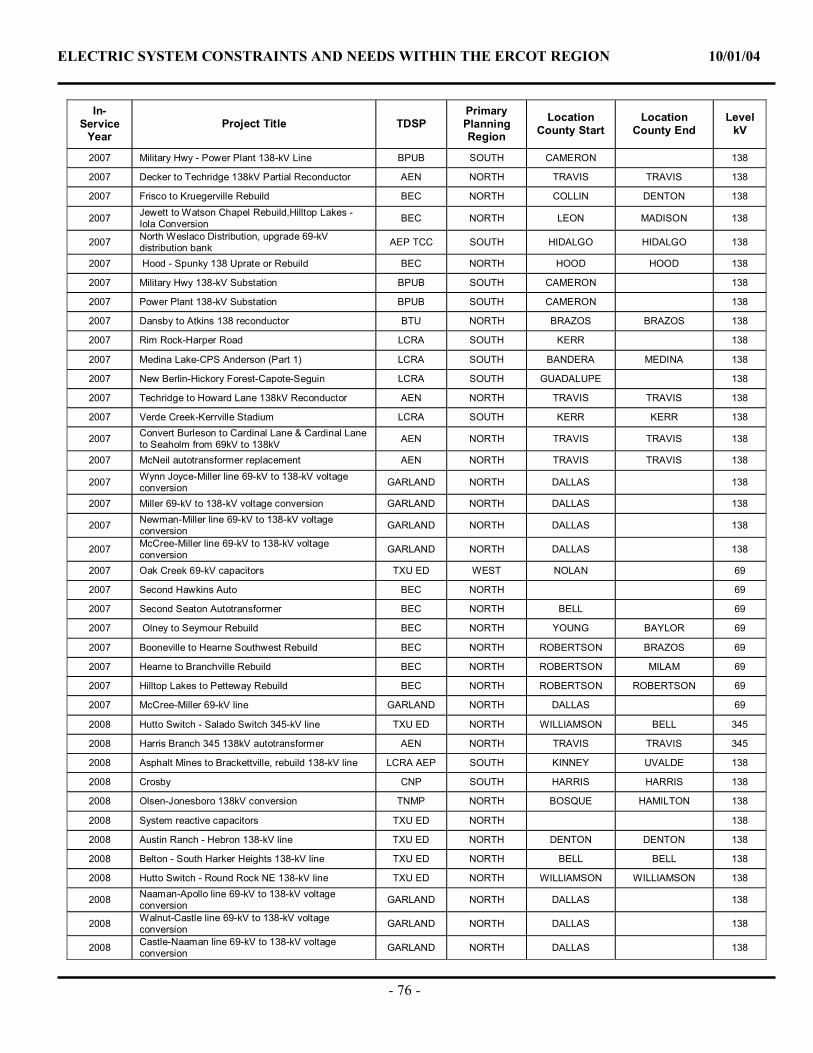
ELECTRIC SYSTEM CONSTRAINTS AND NEEDS WITHIN THE ERCOT REGION 10/01/04
- 76 -
In-Service
Year Project Title TDSP
Primary Planning Region
Location County Start
Location County End
Level kV
2007 Military Hwy - Power Plant 138-kV Line BPUB SOUTH CAMERON 138
2007 Decker to Techridge 138kV Partial Reconductor AEN NORTH TRAVIS TRAVIS 138
2007 Frisco to Kruegerville Rebuild BEC NORTH COLLIN DENTON 138
2007 Jewett to Watson Chapel Rebuild,Hilltop Lakes - Iola Conversion BEC NORTH LEON MADISON 138
2007 North Weslaco Distribution, upgrade 69-kV distribution bank AEP TCC SOUTH HIDALGO HIDALGO 138
2007 Hood - Spunky 138 Uprate or Rebuild BEC NORTH HOOD HOOD 138
2007 Military Hwy 138-kV Substation BPUB SOUTH CAMERON 138
2007 Power Plant 138-kV Substation BPUB SOUTH CAMERON 138
2007 Dansby to Atkins 138 reconductor BTU NORTH BRAZOS BRAZOS 138
2007 Rim Rock-Harper Road LCRA SOUTH KERR 138
2007 Medina Lake-CPS Anderson (Part 1) LCRA SOUTH BANDERA MEDINA 138
2007 New Berlin-Hickory Forest-Capote-Seguin LCRA SOUTH GUADALUPE 138
2007 Techridge to Howard Lane 138kV Reconductor AEN NORTH TRAVIS TRAVIS 138
2007 Verde Creek-Kerrville Stadium LCRA SOUTH KERR KERR 138
2007 Convert Burleson to Cardinal Lane & Cardinal Lane to Seaholm from 69kV to 138kV AEN NORTH TRAVIS TRAVIS 138
2007 McNeil autotransformer replacement AEN NORTH TRAVIS TRAVIS 138
2007 Wynn Joyce-Miller line 69-kV to 138-kV voltage conversion GARLAND NORTH DALLAS 138
2007 Miller 69-kV to 138-kV voltage conversion GARLAND NORTH DALLAS 138
2007 Newman-Miller line 69-kV to 138-kV voltage conversion GARLAND NORTH DALLAS 138
2007 McCree-Miller line 69-kV to 138-kV voltage conversion GARLAND NORTH DALLAS 138
2007 Oak Creek 69-kV capacitors TXU ED WEST NOLAN 69
2007 Second Hawkins Auto BEC NORTH 69
2007 Second Seaton Autotransformer BEC NORTH BELL 69
2007 Olney to Seymour Rebuild BEC NORTH YOUNG BAYLOR 69
2007 Booneville to Hearne Southwest Rebuild BEC NORTH ROBERTSON BRAZOS 69
2007 Hearne to Branchville Rebuild BEC NORTH ROBERTSON MILAM 69
2007 Hilltop Lakes to Petteway Rebuild BEC NORTH ROBERTSON ROBERTSON 69
2007 McCree-Miller 69-kV line GARLAND NORTH DALLAS 69
2008 Hutto Switch - Salado Switch 345-kV line TXU ED NORTH WILLIAMSON BELL 345
2008 Harris Branch 345 138kV autotransformer AEN NORTH TRAVIS TRAVIS 345
2008 Asphalt Mines to Brackettville, rebuild 138-kV line LCRA AEP SOUTH KINNEY UVALDE 138
2008 Crosby CNP SOUTH HARRIS HARRIS 138
2008 Olsen-Jonesboro 138kV conversion TNMP NORTH BOSQUE HAMILTON 138
2008 System reactive capacitors TXU ED NORTH 138
2008 Austin Ranch - Hebron 138-kV line TXU ED NORTH DENTON DENTON 138
2008 Belton - South Harker Heights 138-kV line TXU ED NORTH BELL BELL 138
2008 Hutto Switch - Round Rock NE 138-kV line TXU ED NORTH WILLIAMSON WILLIAMSON 138
2008 Naaman-Apollo line 69-kV to 138-kV voltage conversion GARLAND NORTH DALLAS 138
2008 Walnut-Castle line 69-kV to 138-kV voltage conversion GARLAND NORTH DALLAS 138
2008 Castle-Naaman line 69-kV to 138-kV voltage conversion GARLAND NORTH DALLAS 138
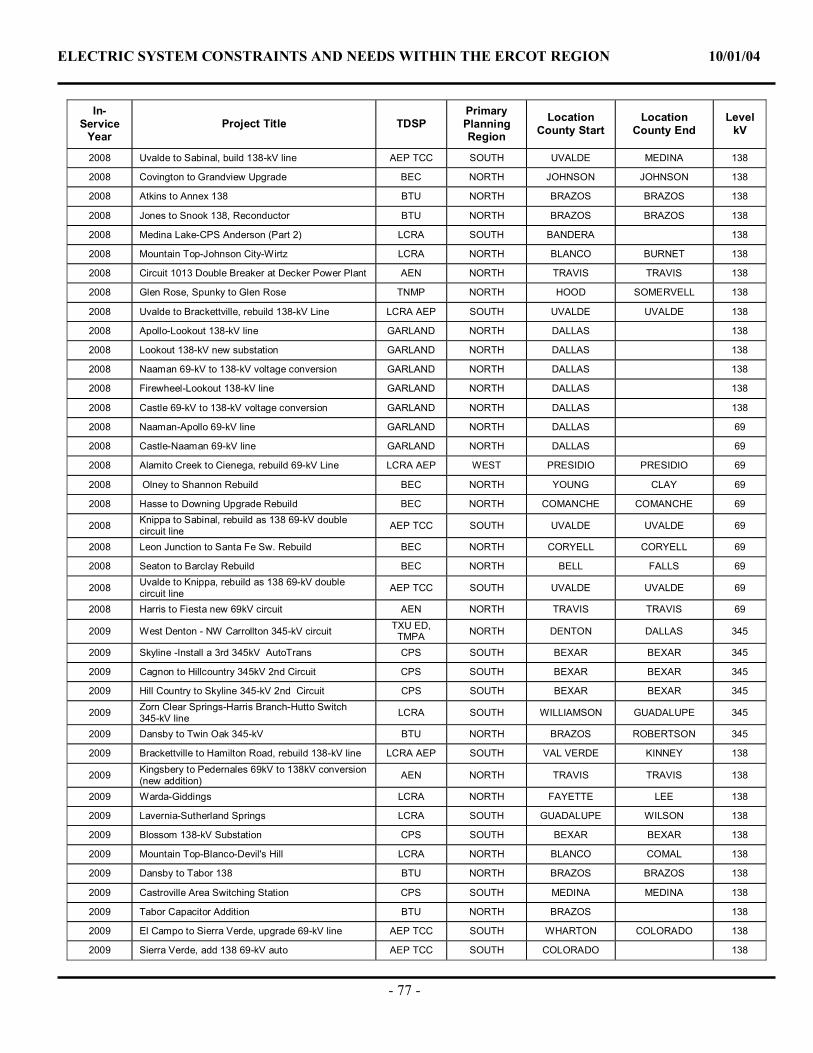
ELECTRIC SYSTEM CONSTRAINTS AND NEEDS WITHIN THE ERCOT REGION 10/01/04
- 77 -
In-Service
Year Project Title TDSP
Primary Planning Region
Location County Start
Location County End
Level kV
2008 Uvalde to Sabinal, build 138-kV line AEP TCC SOUTH UVALDE MEDINA 138
2008 Covington to Grandview Upgrade BEC NORTH JOHNSON JOHNSON 138
2008 Atkins to Annex 138 BTU NORTH BRAZOS BRAZOS 138
2008 Jones to Snook 138, Reconductor BTU NORTH BRAZOS BRAZOS 138
2008 Medina Lake-CPS Anderson (Part 2) LCRA SOUTH BANDERA 138
2008 Mountain Top-Johnson City-Wirtz LCRA NORTH BLANCO BURNET 138
2008 Circuit 1013 Double Breaker at Decker Power Plant AEN NORTH TRAVIS TRAVIS 138
2008 Glen Rose, Spunky to Glen Rose TNMP NORTH HOOD SOMERVELL 138
2008 Uvalde to Brackettville, rebuild 138-kV Line LCRA AEP SOUTH UVALDE UVALDE 138
2008 Apollo-Lookout 138-kV line GARLAND NORTH DALLAS 138
2008 Lookout 138-kV new substation GARLAND NORTH DALLAS 138
2008 Naaman 69-kV to 138-kV voltage conversion GARLAND NORTH DALLAS 138
2008 Firewheel-Lookout 138-kV line GARLAND NORTH DALLAS 138
2008 Castle 69-kV to 138-kV voltage conversion GARLAND NORTH DALLAS 138
2008 Naaman-Apollo 69-kV line GARLAND NORTH DALLAS 69
2008 Castle-Naaman 69-kV line GARLAND NORTH DALLAS 69
2008 Alamito Creek to Cienega, rebuild 69-kV Line LCRA AEP WEST PRESIDIO PRESIDIO 69
2008 Olney to Shannon Rebuild BEC NORTH YOUNG CLAY 69
2008 Hasse to Downing Upgrade Rebuild BEC NORTH COMANCHE COMANCHE 69
2008 Knippa to Sabinal, rebuild as 138 69-kV double circuit line AEP TCC SOUTH UVALDE UVALDE 69
2008 Leon Junction to Santa Fe Sw. Rebuild BEC NORTH CORYELL CORYELL 69
2008 Seaton to Barclay Rebuild BEC NORTH BELL FALLS 69
2008 Uvalde to Knippa, rebuild as 138 69-kV double circuit line AEP TCC SOUTH UVALDE UVALDE 69
2008 Harris to Fiesta new 69kV circuit AEN NORTH TRAVIS TRAVIS 69
2009 West Denton - NW Carrollton 345-kV circuit TXU ED, TMPA NORTH DENTON DALLAS 345
2009 Skyline -Install a 3rd 345kV AutoTrans CPS SOUTH BEXAR BEXAR 345
2009 Cagnon to Hillcountry 345kV 2nd Circuit CPS SOUTH BEXAR BEXAR 345
2009 Hill Country to Skyline 345-kV 2nd Circuit CPS SOUTH BEXAR BEXAR 345
2009 Zorn Clear Springs-Harris Branch-Hutto Switch 345-kV line LCRA SOUTH WILLIAMSON GUADALUPE 345
2009 Dansby to Twin Oak 345-kV BTU NORTH BRAZOS ROBERTSON 345
2009 Brackettville to Hamilton Road, rebuild 138-kV line LCRA AEP SOUTH VAL VERDE KINNEY 138
2009 Kingsbery to Pedernales 69kV to 138kV conversion (new addition) AEN NORTH TRAVIS TRAVIS 138
2009 Warda-Giddings LCRA NORTH FAYETTE LEE 138
2009 Lavernia-Sutherland Springs LCRA SOUTH GUADALUPE WILSON 138
2009 Blossom 138-kV Substation CPS SOUTH BEXAR BEXAR 138
2009 Mountain Top-Blanco-Devil's Hill LCRA NORTH BLANCO COMAL 138
2009 Dansby to Tabor 138 BTU NORTH BRAZOS BRAZOS 138
2009 Castroville Area Switching Station CPS SOUTH MEDINA MEDINA 138
2009 Tabor Capacitor Addition BTU NORTH BRAZOS 138
2009 El Campo to Sierra Verde, upgrade 69-kV line AEP TCC SOUTH WHARTON COLORADO 138
2009 Sierra Verde, add 138 69-kV auto AEP TCC SOUTH COLORADO 138
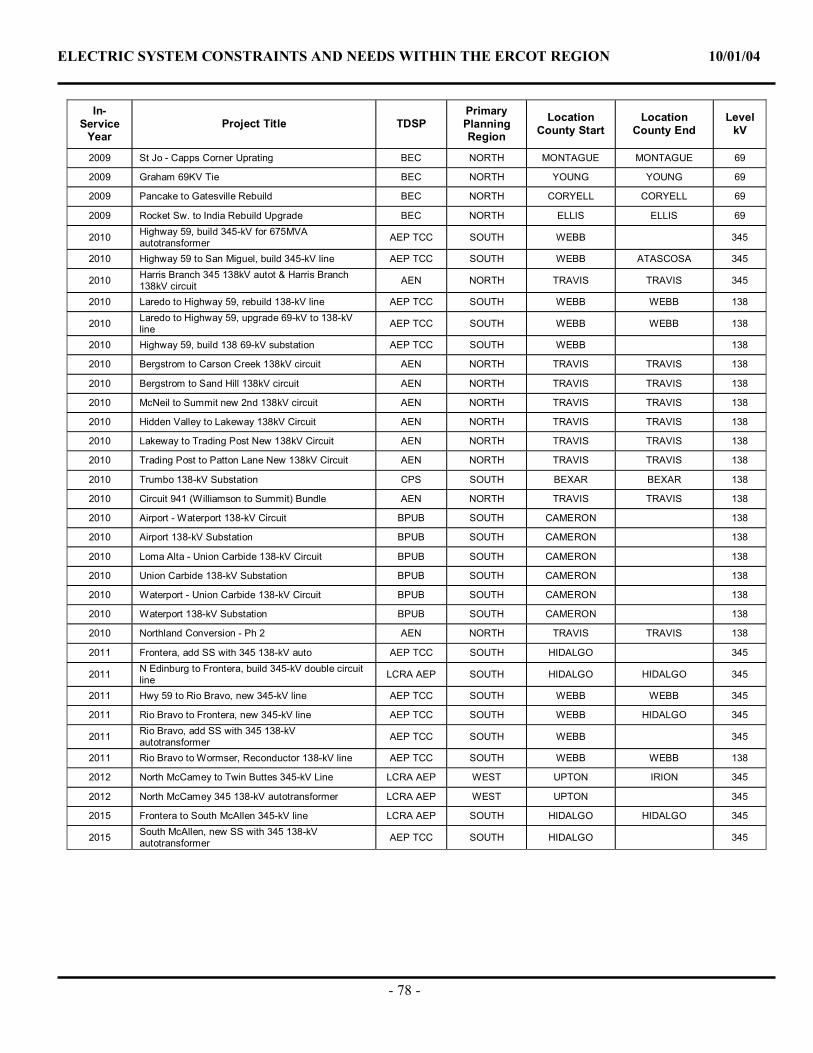
ELECTRIC SYSTEM CONSTRAINTS AND NEEDS WITHIN THE ERCOT REGION 10/01/04
- 78 -
In-Service
Year Project Title TDSP
Primary Planning Region
Location County Start
Location County End
Level kV
2009 St Jo - Capps Corner Uprating BEC NORTH MONTAGUE MONTAGUE 69
2009 Graham 69KV Tie BEC NORTH YOUNG YOUNG 69
2009 Pancake to Gatesville Rebuild BEC NORTH CORYELL CORYELL 69
2009 Rocket Sw. to India Rebuild Upgrade BEC NORTH ELLIS ELLIS 69
2010 Highway 59, build 345-kV for 675MVA autotransformer AEP TCC SOUTH WEBB 345
2010 Highway 59 to San Miguel, build 345-kV line AEP TCC SOUTH WEBB ATASCOSA 345
2010 Harris Branch 345 138kV autot & Harris Branch 138kV circuit AEN NORTH TRAVIS TRAVIS 345
2010 Laredo to Highway 59, rebuild 138-kV line AEP TCC SOUTH WEBB WEBB 138
2010 Laredo to Highway 59, upgrade 69-kV to 138-kV line AEP TCC SOUTH WEBB WEBB 138
2010 Highway 59, build 138 69-kV substation AEP TCC SOUTH WEBB 138
2010 Bergstrom to Carson Creek 138kV circuit AEN NORTH TRAVIS TRAVIS 138
2010 Bergstrom to Sand Hill 138kV circuit AEN NORTH TRAVIS TRAVIS 138
2010 McNeil to Summit new 2nd 138kV circuit AEN NORTH TRAVIS TRAVIS 138
2010 Hidden Valley to Lakeway 138kV Circuit AEN NORTH TRAVIS TRAVIS 138
2010 Lakeway to Trading Post New 138kV Circuit AEN NORTH TRAVIS TRAVIS 138
2010 Trading Post to Patton Lane New 138kV Circuit AEN NORTH TRAVIS TRAVIS 138
2010 Trumbo 138-kV Substation CPS SOUTH BEXAR BEXAR 138
2010 Circuit 941 (Williamson to Summit) Bundle AEN NORTH TRAVIS TRAVIS 138
2010 Airport - Waterport 138-kV Circuit BPUB SOUTH CAMERON 138
2010 Airport 138-kV Substation BPUB SOUTH CAMERON 138
2010 Loma Alta - Union Carbide 138-kV Circuit BPUB SOUTH CAMERON 138
2010 Union Carbide 138-kV Substation BPUB SOUTH CAMERON 138
2010 Waterport - Union Carbide 138-kV Circuit BPUB SOUTH CAMERON 138
2010 Waterport 138-kV Substation BPUB SOUTH CAMERON 138
2010 Northland Conversion - Ph 2 AEN NORTH TRAVIS TRAVIS 138
2011 Frontera, add SS with 345 138-kV auto AEP TCC SOUTH HIDALGO 345
2011 N Edinburg to Frontera, build 345-kV double circuit line LCRA AEP SOUTH HIDALGO HIDALGO 345
2011 Hwy 59 to Rio Bravo, new 345-kV line AEP TCC SOUTH WEBB WEBB 345
2011 Rio Bravo to Frontera, new 345-kV line AEP TCC SOUTH WEBB HIDALGO 345
2011 Rio Bravo, add SS with 345 138-kV autotransformer AEP TCC SOUTH WEBB 345
2011 Rio Bravo to Wormser, Reconductor 138-kV line AEP TCC SOUTH WEBB WEBB 138
2012 North McCamey to Twin Buttes 345-kV Line LCRA AEP WEST UPTON IRION 345
2012 North McCamey 345 138-kV autotransformer LCRA AEP WEST UPTON 345
2015 Frontera to South McAllen 345-kV line LCRA AEP SOUTH HIDALGO HIDALGO 345
2015 South McAllen, new SS with 345 138-kV autotransformer AEP TCC SOUTH HIDALGO 345