Embed Size (px)
Citation preview
Report onArrests forArrests forArrests forArrests forArrests forDriving Under the InfluenceDriving Under the InfluenceDriving Under the InfluenceDriving Under the InfluenceDriving Under the Influencein California, 1997
State of CaliforniaOffice of the Attorney GeneralBureau of Criminal Information and AnalysisCCCCCRIMINAL JUSTICE STATISTICS CENTERRIMINAL JUSTICE STATISTICS CENTERRIMINAL JUSTICE STATISTICS CENTERRIMINAL JUSTICE STATISTICS CENTERRIMINAL JUSTICE STATISTICS CENTERREPORT SERIESREPORT SERIESREPORT SERIESREPORT SERIESREPORT SERIES
Volume 1, Number 1 ■ April 1999
Report on ArrestsforDriving Under the Influencein California, 1997
Bill Lockyer, Attorney GeneralCalifornia Department of JusticeDivision of Criminal Justice Information ServicesBureau of Criminal Information and AnalysisCriminal Justice Statistics Center
ATTORNEY GENERAL ON THE INTERNET ➤ http://caag.state.ca.us
Report on Arrestsfor
Driving Under the Influence(DUI)
inCalifornia, 1997
CALIFORNIA DEPARTMENT OF JUSTICEBill Lockyer, Attorney General
DIVISION OF CRIMINAL JUSTICE INFORMATION SERVICESNick Dedier, Director
BUREAU OF CRIMINAL INFORMATION AND ANALYSISDoug Smith, ChiefMike Acosta, Assistant Chief
CRIMINAL JUSTICE STATISTICS CENTERSteve Galeria, Manager
STATISTICAL DATA CENTERRoy V. Lewis, Ph.D., Manager
PREPARED BYMarie K. Herbert, Research Analyst
ACKNOWLEDGEMENTS:
John Dumbauld, Manager, Statistical Analysis Center
The role of the Criminal Justice Statistics Center is:
§ To collect, analyze, and report statistical data, which provide valid measures of crimeand the criminal justice process;
§ To examine these data on an ongoing basis to better describe crime and the criminaljustice system;
§ To promote the responsible presentation and use of crime statistics.
Criminal Justice Statistics Center4949 BroadwayP.O. Box 903427Sacramento, CA 94203-4270
3
CONTENTS
Highlights ……………...………………………………………………………………. 4Introduction ……………………………………………………………………………. 6DUI Arrests by Gender …….. …………………………………………………………. 8DUI Arrests by Race …..………………………………………………………………. 10DUI Arrests by Age ……….…………………………………………………………… 12Appendix …………………..…………………………………………………………… 15
TABLES
DRIVING UNDER THE INFLUENCE ARRESTS
1 Number of Arrests and Rate per 100,000 Population by Year,1988-1997 …………………………………………………………………….. 7
2 Number and Percent of Arrests by Gender, 1988-1997 ……….….. …………. 83 Number of Arrests and Rate per 100,000 Population by Gender,
1988 & 1997 ………………………………………………………………….. 94 Number and Percent of Arrests by Race/Ethnic Group, 1988-1997 ……….… 105 Number of Arrests and Rate per 100,000 Population by Race/Ethnic
Group, 1988 & 1997 …………………………………………………………. 116 Number and Percent o f Arrests by Age Group, 1988-1997 ……………….… 127 Number of Arrests and Rate per 100,000 Population by Age Group,
1988 & 1997 …………………………………………………………….….… 138 By Age Group, 1988-1997 ………………………………………….………... 14
FIGURES
DRIVING UNDER THE INFLUENCE ARRESTS
1 Number of Arrests by Year, 1988-1997 ……………………………………… 72 By Gender, 1988-1997 ………………………………………………….…….. 93 Percent of Total Arrests by Race/Ethnic Group, 1988 & 1997 ……….…….... 114 Percent of Total Arrests by Age Group, 1988 & 1997 ………………….……. 13
APPENDICES
DRIVING UNDER THE INFLUENCE ARRESTS
A Number of Arrests and Percent Change by Gender, Race and Age Group,1988 & 1997 ………………………………………………………………….. 16
B Arrest Rate per 100,000 and Percent Change by Gender, Race and Age G roup,1988 & 1997 ………………………………………………………………….. 17
C By County, 1988-1997 ………………………………………………………... 18D By Cities with Population over 100,000, 1988-1997 …………………………. 19E By California Highway Patrol, County Jurisdictions, 1988-1997 ……………. 20F California Highway Patrol by County and Month, 1997 ……………………... 21G By County and Age Group, 1997 …………………………………………….. 22
4
HIGHLIGHTS
♦ Arrests for Driving Under the Influence (DUI) inCalifornia declined 40.9 percent from 327,186 in 1988to 193,250 in 1997. (Tables 1,8 & 10)
♦ The rate, per 100,000 total population, of DUI arrestsdeclined 49.7 percent from 1166.0 in 1988 to 586.4 in1997. (Tables 1,3,5 &7)
♦ From 1996 to 1997, DUI arrests declined 5.2 percentfrom 203,794 to 193,250. (Table 1)
♦ The number of DUI arrests peaked in 1990 at366,834. (Table 1)
5
♦ More men were arrested than women for DUI eachyear (86.8 percent in 1997); however, the percentageof women arrested increased by 2.6 percentage pointsfrom 10.6 in 1988 to 13.2 in 1997. (Table 2)
♦ From 1988 to 1997, there was a shift in thepercentage of total arrests for each race/ethnic group.The percentage of whites arrested for DUI decreased14 percent (from 55.7 in 1988 to 41.8 in 1997), whilethe percentage of Hispanics, blacks and othersincreased 14 percent (from 44.3 in 1988 to 58.3 in1997). (Table 5 and Figure 3)
♦ From 1988 to 1997, the percentage of 29 year oldsand younger arrested for DUI decreased 9.2 percent(from 50.8 in 1988 to 41.6 in 1997), while thepercentage of 30 year olds and older increased 9.2percent (from 49.2 in 1988 to 58.4 in 1997). (Table 7and Figure 4)
6
Report on Arrests for Driving Under the Influencein California, 1997
Introduction
This report contains information about persons arrested for the crimes of Driving Under theInfluence of alcohol or drugs. The purpose of this report is to provide accurate and completecriminal statistical information on Driving Under the Influence (DUI) to the public andgovernment entities for the development and evaluation of criminal justice programs andlegislation. The report organizes and displays 1997 arrest data and multi-year arrest data forDUI. Statewide totals of DUI arrests are displayed by gender, race, and age. Data by county,city, and California Highway Patrol are also available in the appendix.
Data concerning the number and nature of crimes committed and arrests in the state of Californiaare collected through the Uniform Crime Reporting (UCR) Program. Local city policedepartments, county sheriff offices, the California Highway Patrol, and other law enforcementagencies report on a monthly basis.
ARRESTS FOR DRIVING UNDER THE INFLUENCE
Arrests for the following California Vehicle Code Sections are the basis for this report:§ Driving Under Influence of Alcohol or Drugs - 23152 (a), 23152 (b), 23152 (c), 23152 (d),§ Driving Under Influence of Alcohol or Drugs Causing Injury - 23153 (a), 23153 (b), 23153
(d),§ Fourth or Subsequent [DUI] Offense Within Seven Years - 23175 (a),§ Ignition Interlock Device Prohibitions - 23247 (a), 23247 (b), 23247 (c), 23247 (d).
Arrests for the following Harbors and Navigation Code Sections are the basis for this report:§ Use of watercraft while under the influence of alcohol or drugs - 655 (b), 655 (c), 655 (e),
655 (f).
Arrests for driving under the influence of alcohol and/or drugs were combined to ensurecomplete data collection.
The arrest totals shown should not be interpreted as the number of individuals arrested forDriving Under the Influence (DUI) offenses because it is possible that some individuals mayhave been arrested for DUI on more than one occasion.
Total population1
DUI arrests reported
Percent change from
previous year
Rate per 100,000 total population2
Percent change in rate from
previous year
Rate per 100,000 at risk3
Percent change in rate from
previous year
### 28,060,746 327,186 - 1,166.0 - 1,489.2 -
### a 28,771,207 336,059 2.7 1,168.0 0.2 1,492.0 0.2
### 29,557,836 366,834 9.2 1,241.1 6.3 1,582.6 6.1
### a 30,646,000 312,571 -14.8 1,019.9 -17.8 1,325.3 -16.3
### 31,300,000 260,150 -16.8 831.2 -18.5 1,085.1 -18.1
### 31,742,000 233,673 -10.2 736.2 -11.4 960.3 -11.5
### 32,140,000 208,844 -10.6 649.8 -11.7 845.4 -12.0
### b 32,063,000 200,754 -3.9 626.1 -3.6 799.1 -5.5
### 32,383,000 203,794 1.5 629.3 0.5 797.5 -0.2
### 32,957,000 193,250 -5.2 586.4 -6.8 750.2 -5.91 Population estimates were provided by the Demographic Research Unit, California Department of Finance.2 Rates are based on annual total population estimates provided by the Demographic Research Unit, California Department of Finance.3 Rates are based on the population at risk (persons ages 10-69) for each year.a 1989 and 1991 data do not include arrests for San Bernardino PD.b 1995 data does not include arrests for Oakland PD or March-December arrests for Bakersfield PD.
Number of Arrests by Year
Number of Arrests and Rate per 100,000 Population by Year
Year
Figure 1
Table 1
DRIVING UNDER THE INFLUENCE ARRESTS, 1988-1997
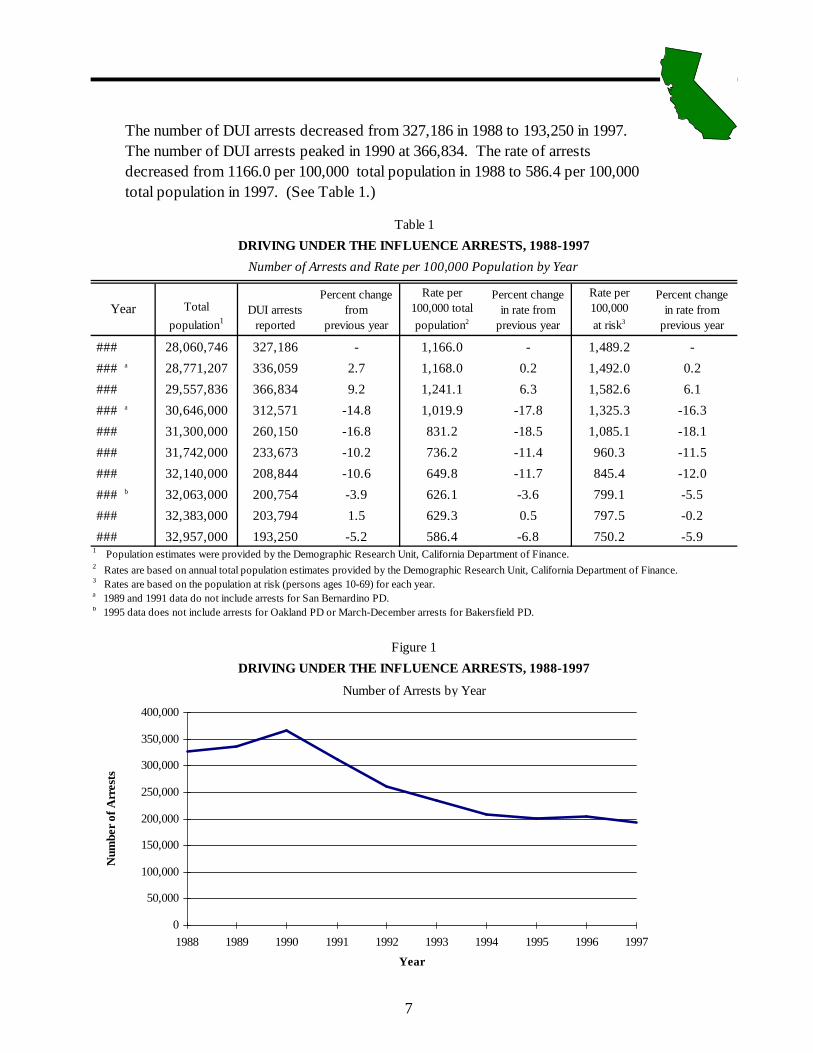
The number of DUI arrests decreased from 327,186 in 1988 to 193,250 in 1997. The number of DUI arrests peaked in 1990 at 366,834. The rate of arrests decreased from 1166.0 per 100,000 total population in 1988 to 586.4 per 100,000 total population in 1997. (See Table 1.)
DRIVING UNDER THE INFLUENCE ARRESTS, 1988-1997
0
50,000
100,000
150,000
200,000
250,000
300,000
350,000
400,000
1988 1989 1990 1991 1992 1993 1994 1995 1996 1997
Year
Num
ber o
f Arr
ests
7
DUI Arrests by Gender
Number and Percent of Arrests by Gender
Number Percent Number Percent
1988 292,378 89.4 34,808 10.6 327,1861989 a 300,748 89.5 35,311 10.5 336,0591990 327,264 89.2 39,570 10.8 366,8341991 a 276,585 88.5 35,986 11.5 312,5711992 230,672 88.7 29,478 11.3 260,1501993 206,636 88.4 27,037 11.6 233,6731994 184,656 88.4 24,188 11.6 208,8441995 b 176,355 87.8 24,399 12.2 200,7541996 178,464 87.6 25,330 12.4 203,7941997 167,648 86.8 25,602 13.2 193,250a 1989 and 1991 data do not include arrests for San Bernardino PD.b 1995 data does not include arrests for Oakland PD or March-December arrests for Bakersfield PD.
Male Female
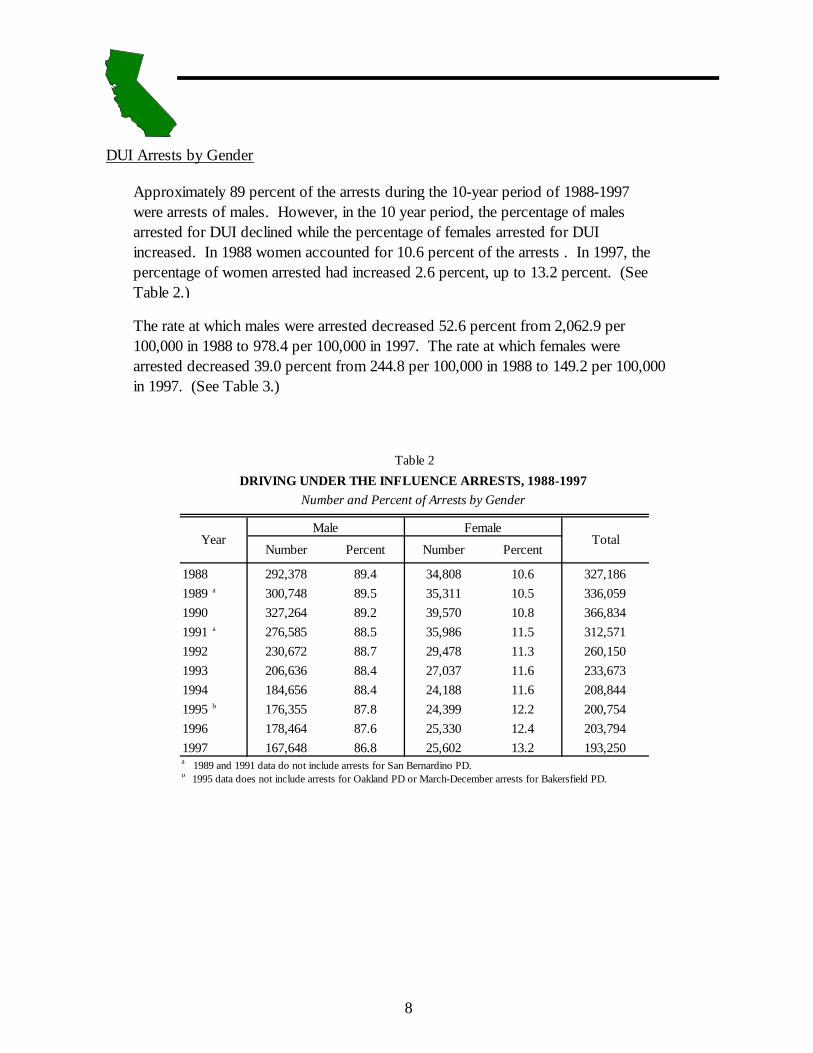
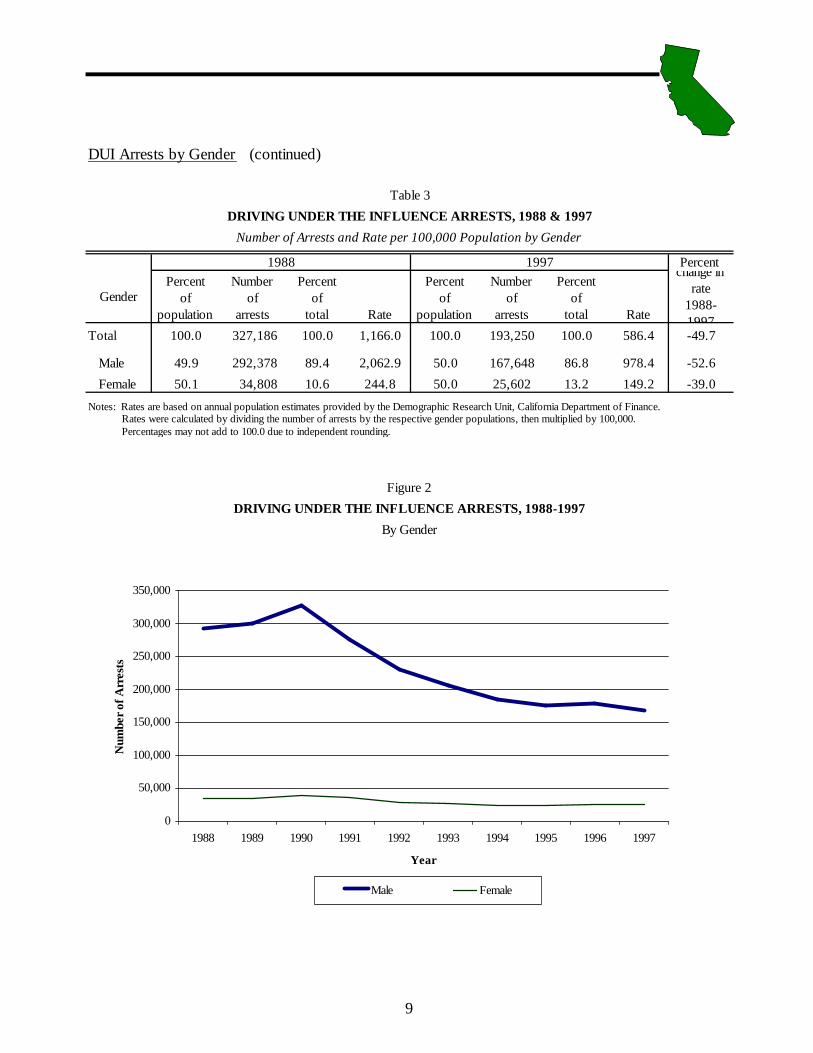
Approximately 89 percent of the arrests during the 10-year period of 1988-1997 were arrests of males. However, in the 10 year period, the percentage of males arrested for DUI declined while the percentage of females arrested for DUI increased. In 1988 women accounted for 10.6 percent of the arrests . In 1997, the percentage of women arrested had increased 2.6 percent, up to 13.2 percent. (See Table 2.)
The rate at which males were arrested decreased 52.6 percent from 2,062.9 per 100,000 in 1988 to 978.4 per 100,000 in 1997. The rate at which females were arrested decreased 39.0 percent from 244.8 per 100,000 in 1988 to 149.2 per 100,000 in 1997. (See Table 3.)
Year Total
Table 2DRIVING UNDER THE INFLUENCE ARRESTS, 1988-1997
8
DUI Arrests by Gender (continued)
Percent
GenderPercent
of population
Number of
arrests
Percent of
total Rate
Percent of
population
Number of
arrests
Percent of
total Rate
change in rate
1988-1997
Total 100.0 327,186 100.0 1,166.0 100.0 193,250 100.0 586.4 -49.7
Male 49.9 292,378 89.4 2,062.9 50.0 167,648 86.8 978.4 -52.6
Female 50.1 34,808 10.6 244.8 50.0 25,602 13.2 149.2 -39.0
Notes: Rates are based on annual population estimates provided by the Demographic Research Unit, California Department of Finance. Rates were calculated by dividing the number of arrests by the respective gender populations, then multiplied by 100,000. Percentages may not add to 100.0 due to independent rounding.
Table 3
1988 1997
By Gender
DRIVING UNDER THE INFLUENCE ARRESTS, 1988 & 1997
Number of Arrests and Rate per 100,000 Population by Gender
Figure 2
DRIVING UNDER THE INFLUENCE ARRESTS, 1988-1997
0
50,000
100,000
150,000
200,000
250,000
300,000
350,000
1988 1989 1990 1991 1992 1993 1994 1995 1996 1997
Year
Num
ber o
f Arr
ests
Male Female
9
DUI Arrests by Race
Number Percent Number Percent Number Percent Number Percent Total
182,225 55.7 115,448 35.3 17,744 5.4 11,769 3.6 327,186 174,388 51.9 131,721 39.2 17,516 5.2 12,434 3.7 336,059 186,793 50.9 140,273 38.2 20,993 5.7 18,775 5.1 366,834 155,373 49.7 126,355 40.4 18,156 5.8 12,687 4.1 312,571 112,891 43.4 117,516 45.2 16,778 6.4 12,965 5.0 260,150 98,045 42.0 108,739 46.5 15,519 6.6 11,370 4.9 233,673 86,839 41.6 96,857 46.4 14,377 6.9 10,771 5.2 208,844 85,924 42.8 91,208 45.4 12,824 6.4 10,798 5.4 200,754 86,629 42.5 92,225 45.3 13,382 6.6 11,558 5.7 203,794 80,696 41.8 85,186 44.1 12,915 6.7 14,453 7.5 193,250
a 1989 and 1991 data do not include arrests for San Bernardino PD.b 1995 data does not include arrests for Oakland PD or March-December arrests for Bakersfield PD.
19961997
1992199319941995 b
19881989 a
19901991 a
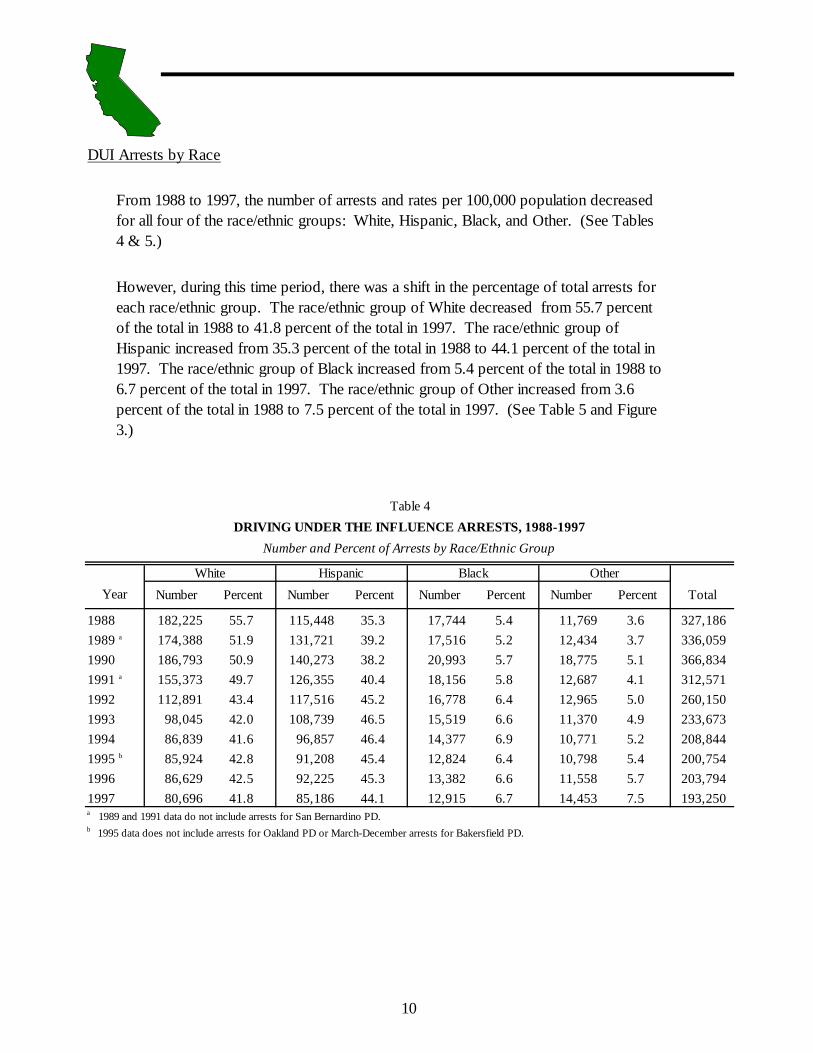
From 1988 to 1997, the number of arrests and rates per 100,000 population decreased for all four of the race/ethnic groups: White, Hispanic, Black, and Other. (See Tables 4 & 5.)
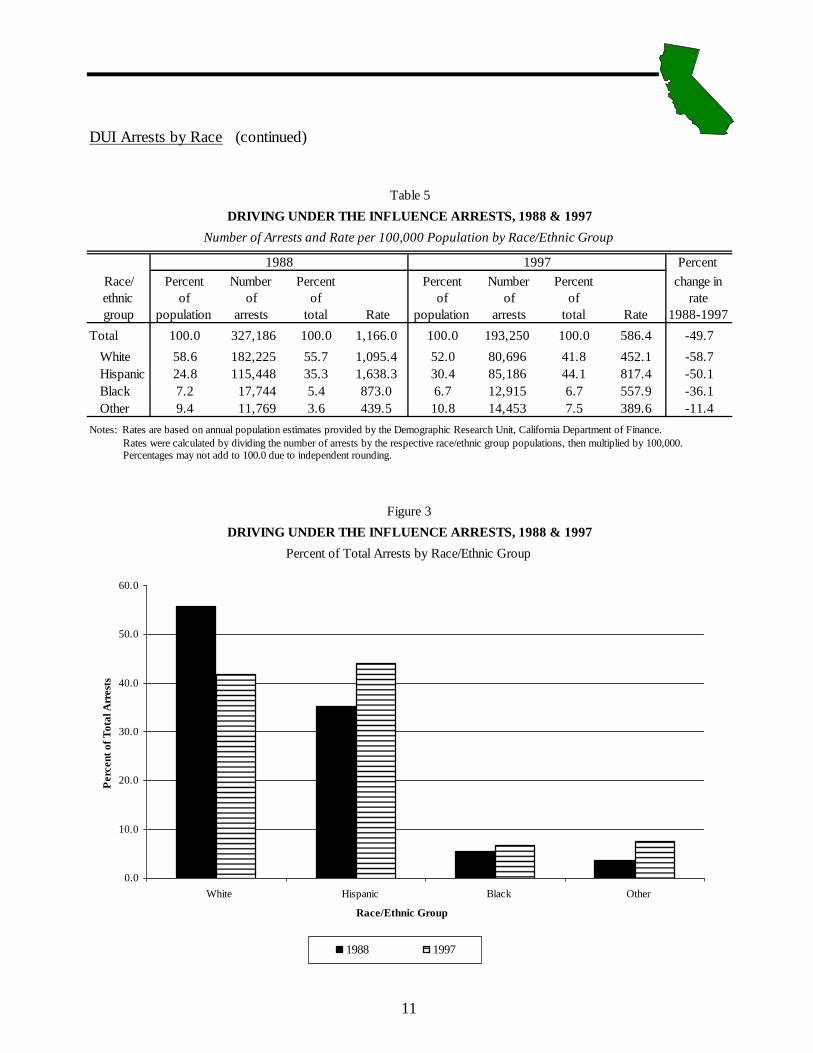
However, during this time period, there was a shift in the percentage of total arrests for each race/ethnic group. The race/ethnic group of White decreased from 55.7 percent of the total in 1988 to 41.8 percent of the total in 1997. The race/ethnic group of Hispanic increased from 35.3 percent of the total in 1988 to 44.1 percent of the total in 1997. The race/ethnic group of Black increased from 5.4 percent of the total in 1988 to 6.7 percent of the total in 1997. The race/ethnic group of Other increased from 3.6 percent of the total in 1988 to 7.5 percent of the total in 1997. (See Table 5 and Figure 3.)
Table 4
Year
DRIVING UNDER THE INFLUENCE ARRESTS, 1988-1997
Number and Percent of Arrests by Race/Ethnic Group
Hispanic Black OtherWhite
10
DUI Arrests by Race (continued)
Percent Race/ ethnic group
Percent of
population
Number of
arrests
Percent of
total Rate
Percent of
population
Number of
arrests
Percent of
total Rate
change in rate
1988-1997
Total 100.0 327,186 100.0 1,166.0 100.0 193,250 100.0 586.4 -49.7
White 58.6 182,225 55.7 1,095.4 52.0 80,696 41.8 452.1 -58.7 Hispanic 24.8 115,448 35.3 1,638.3 30.4 85,186 44.1 817.4 -50.1 Black 7.2 17,744 5.4 873.0 6.7 12,915 6.7 557.9 -36.1 Other 9.4 11,769 3.6 439.5 10.8 14,453 7.5 389.6 -11.4Notes: Rates are based on annual population estimates provided by the Demographic Research Unit, California Department of Finance. Rates were calculated by dividing the number of arrests by the respective race/ethnic group populations, then multiplied by 100,000. Percentages may not add to 100.0 due to independent rounding.
Table 5
DRIVING UNDER THE INFLUENCE ARRESTS, 1988 & 1997
DRIVING UNDER THE INFLUENCE ARRESTS, 1988 & 1997
Percent of Total Arrests by Race/Ethnic Group
Number of Arrests and Rate per 100,000 Population by Race/Ethnic Group
1988 1997
Figure 3
0.0
10.0
20.0
30.0
40.0
50.0
60.0
White Hispanic Black Other
Race/Ethnic Group
Per
cent
of T
otal
Arr
ests
1988 1997
11
DUI Arrests by Age
Table 6
Number and Percent of Arrests by Age Group
Number Percent Number Percent1988 323,980 99.0 3,206 1.0 327,1861989 a 333,269 99.2 2,790 0.8 336,0591990 363,958 99.2 2,876 0.8 366,8341991 a 310,208 99.2 2,363 0.8 312,5711992 258,311 99.3 1,839 0.7 260,1501993 231,978 99.3 1,695 0.7 233,6731994 207,064 99.1 1,780 0.9 208,8441995 b 199,095 99.2 1,659 0.8 200,7541996 201,972 99.1 1,822 0.9 203,7941997 191,535 99.1 1,715 0.9 193,250a 1989 and 1991 data do not include arrests for San Bernardino PD.b 1995 data does not include arrests for Oakland PD or March-December arrests for Bakersfield PD.
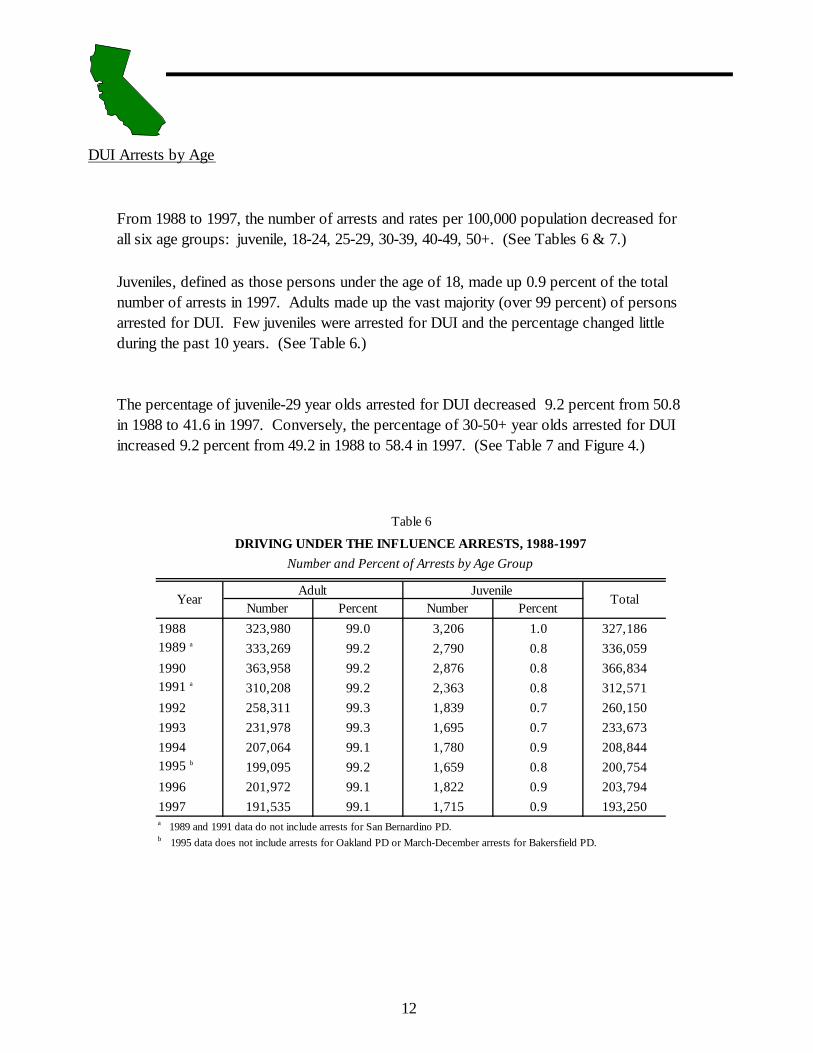
From 1988 to 1997, the number of arrests and rates per 100,000 population decreased for all six age groups: juvenile, 18-24, 25-29, 30-39, 40-49, 50+. (See Tables 6 & 7.)
Adult Juvenile
DRIVING UNDER THE INFLUENCE ARRESTS, 1988-1997
Juveniles, defined as those persons under the age of 18, made up 0.9 percent of the total number of arrests in 1997. Adults made up the vast majority (over 99 percent) of persons arrested for DUI. Few juveniles were arrested for DUI and the percentage changed little during the past 10 years. (See Table 6.)
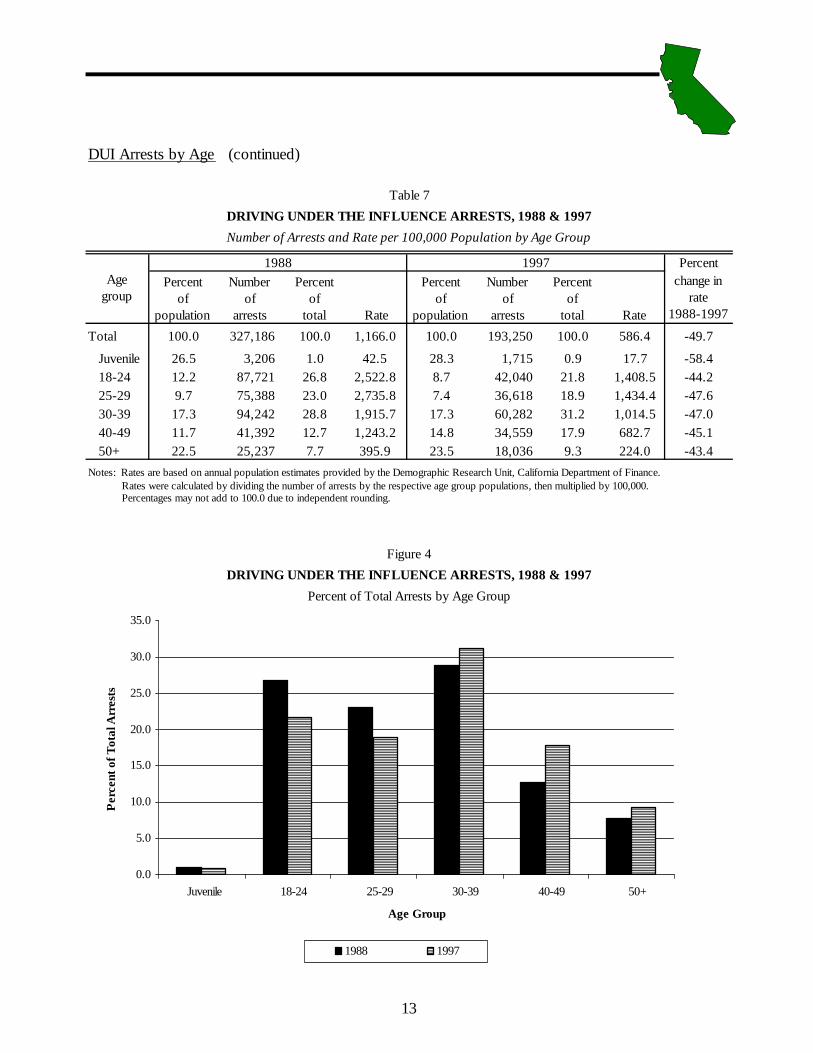
The percentage of juvenile-29 year olds arrested for DUI decreased 9.2 percent from 50.8 in 1988 to 41.6 in 1997. Conversely, the percentage of 30-50+ year olds arrested for DUI increased 9.2 percent from 49.2 in 1988 to 58.4 in 1997. (See Table 7 and Figure 4.)
Year Total
12
DUI Arrests by Age (continued)
PercentPercent
of population
Number of
arrests
Percent of
total Rate
Percent of
population
Number of
arrests
Percent of
total Rate
change in rate
1988-1997
Total 100.0 327,186 100.0 1,166.0 100.0 193,250 100.0 586.4 -49.7
Juvenile 26.5 3,206 1.0 42.5 28.3 1,715 0.9 17.7 -58.4 18-24 12.2 87,721 26.8 2,522.8 8.7 42,040 21.8 1,408.5 -44.2 25-29 9.7 75,388 23.0 2,735.8 7.4 36,618 18.9 1,434.4 -47.6 30-39 17.3 94,242 28.8 1,915.7 17.3 60,282 31.2 1,014.5 -47.0 40-49 11.7 41,392 12.7 1,243.2 14.8 34,559 17.9 682.7 -45.1 50+ 22.5 25,237 7.7 395.9 23.5 18,036 9.3 224.0 -43.4Notes: Rates are based on annual population estimates provided by the Demographic Research Unit, California Department of Finance. Rates were calculated by dividing the number of arrests by the respective age group populations, then multiplied by 100,000. Percentages may not add to 100.0 due to independent rounding.
Percent of Total Arrests by Age Group
1988 1997
DRIVING UNDER THE INFLUENCE ARRESTS, 1988 & 1997
Age group
Table 7
DRIVING UNDER THE INFLUENCE ARRESTS, 1988 & 1997
Number of Arrests and Rate per 100,000 Population by Age Group
Figure 4
0.0
5.0
10.0
15.0
20.0
25.0
30.0
35.0
Juvenile 18-24 25-29 30-39 40-49 50+
Age Group
Per
cent
of T
otal
Arr
ests
1988 1997
13
DUI Arrests by Age (continued)
1988 1989 a 1990 1991 a 1992 1993 1994 1995 b 1996 1997change 1988-1997
Total … … … .... 327,186 336,059 366,834 312,571 260,150 233,673 208,844 200,754 203,794 193,250 -40.9
Juvenile Total 3,206 2,790 2,876 2,363 1,839 1,695 1,780 1,659 1,822 1,715 -46.5
Under 10 … .... 1 1 2 2 0 0 1 1 1 3 200.0 10-12 … … … 7 8 12 6 1 3 2 2 5 3 -57.1 13-14 … … … 39 46 36 55 41 32 39 27 33 26 -33.3 15 … … … ..… . 153 129 122 119 89 98 102 89 86 89 -41.8 16 … … ..… … . 779 674 751 601 467 432 472 457 507 433 -44.4 17 … … … ..… . 2,227 1,932 1,953 1,580 1,241 1,130 1,164 1,083 1,190 1,161 -47.9
Adult Total 323,980 333,269 363,958 310,208 258,311 231,978 207,064 199,095 201,972 191,535 -40.9
18 … … ..… … . 6,424 6,020 6,107 4,877 3,776 3,228 2,982 3,087 3,361 3,106 -51.7 19 … ..… … … . 8,822 9,120 9,906 7,601 5,825 4,912 4,618 4,235 4,603 4,136 -53.1 20 … … ..… … .10,612 11,175 12,449 10,230 7,978 6,696 5,878 5,356 5,480 5,118 -51.8 21 … … … ..… .14,532 15,196 17,227 14,874 11,921 9,575 8,475 7,579 7,761 6,968 -52.1 22 … … ..… … .15,161 15,503 17,418 15,208 12,484 10,656 8,961 8,032 8,052 7,502 -50.5 23 … … … ..… .15,802 15,866 17,322 14,915 12,525 11,174 9,560 8,385 8,272 7,551 -52.2 24 … ..… .… … .16,368 16,559 17,375 14,387 12,225 10,462 9,454 8,608 8,377 7,659 -53.2 25-29 … … … 75,388 78,127 85,920 71,172 56,891 49,472 42,445 39,974 39,387 36,618 -51.4 30-34 … … … 56,168 58,994 66,057 56,804 46,846 42,309 37,213 35,847 34,981 31,994 -43.0 35-39 … … … 38,074 39,757 44,203 38,691 33,648 31,664 28,723 28,429 29,391 28,288 -25.7 40-44 … … … 25,345 25,911 28,482 25,364 21,989 20,814 19,638 19,970 20,804 21,040 -17.0 45-49 … … … 16,047 16,483 17,102 14,940 13,614 13,072 12,406 12,782 13,785 13,519 -15.8 50-54 … … … 10,276 10,287 10,416 8,851 7,950 7,717 7,297 7,330 7,855 8,228 -19.9 55-59 … … … 6,859 6,550 6,189 5,431 4,716 4,554 4,186 4,280 4,551 4,434 -35.4 60-64 … … … 4,325 4,090 4,053 3,525 3,030 2,776 2,533 2,497 2,560 2,576 -40.4 65 + … … .… … .3,777 3,631 3,732 3,338 2,893 2,897 2,695 2,704 2,752 2,798 -25.9a 1989 and 1991 data do not include arrests for San Bernardino PD.b 1995 data does not include arrests for Oakland PD or March-December arrests for Bakersfield PD.
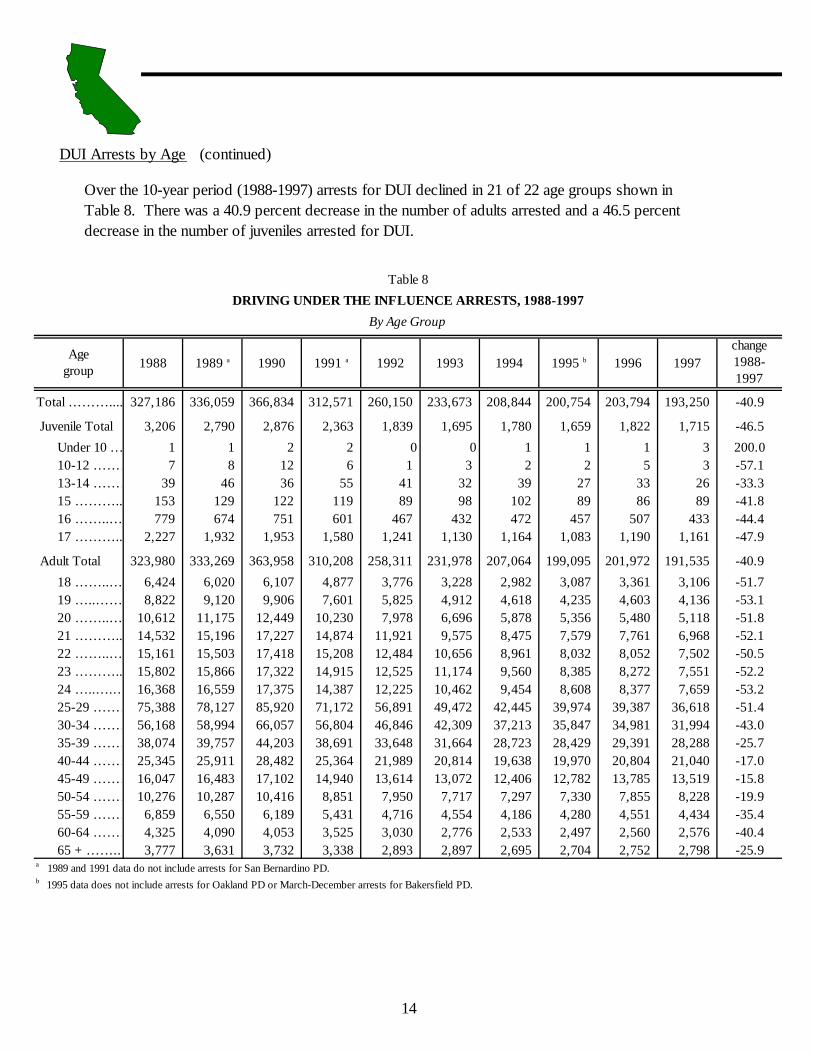
Over the 10-year period (1988-1997) arrests for DUI declined in 21 of 22 age groups shown in Table 8. There was a 40.9 percent decrease in the number of adults arrested and a 46.5 percent decrease in the number of juveniles arrested for DUI.
Age group
Table 8
DRIVING UNDER THE INFLUENCE ARRESTS, 1988-1997
By Age Group
14
APPENDIX
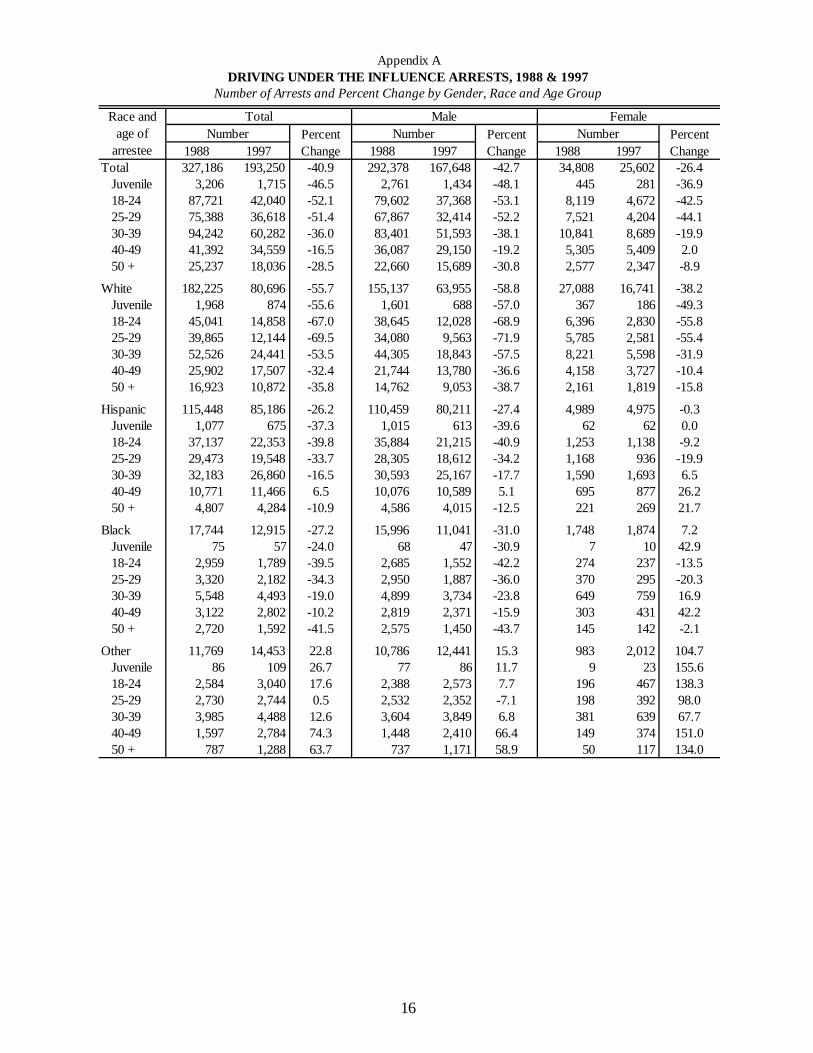
1988 1997 1988 1997 1988 1997Total 327,186 193,250 -40.9 292,378 167,648 -42.7 34,808 25,602 -26.4 Juvenile 3,206 1,715 -46.5 2,761 1,434 -48.1 445 281 -36.9 18-24 87,721 42,040 -52.1 79,602 37,368 -53.1 8,119 4,672 -42.5 25-29 75,388 36,618 -51.4 67,867 32,414 -52.2 7,521 4,204 -44.1 30-39 94,242 60,282 -36.0 83,401 51,593 -38.1 10,841 8,689 -19.9 40-49 41,392 34,559 -16.5 36,087 29,150 -19.2 5,305 5,409 2.0 50 + 25,237 18,036 -28.5 22,660 15,689 -30.8 2,577 2,347 -8.9
White 182,225 80,696 -55.7 155,137 63,955 -58.8 27,088 16,741 -38.2 Juvenile 1,968 874 -55.6 1,601 688 -57.0 367 186 -49.3 18-24 45,041 14,858 -67.0 38,645 12,028 -68.9 6,396 2,830 -55.8 25-29 39,865 12,144 -69.5 34,080 9,563 -71.9 5,785 2,581 -55.4 30-39 52,526 24,441 -53.5 44,305 18,843 -57.5 8,221 5,598 -31.9 40-49 25,902 17,507 -32.4 21,744 13,780 -36.6 4,158 3,727 -10.4 50 + 16,923 10,872 -35.8 14,762 9,053 -38.7 2,161 1,819 -15.8
Hispanic 115,448 85,186 -26.2 110,459 80,211 -27.4 4,989 4,975 -0.3 Juvenile 1,077 675 -37.3 1,015 613 -39.6 62 62 0.0 18-24 37,137 22,353 -39.8 35,884 21,215 -40.9 1,253 1,138 -9.2 25-29 29,473 19,548 -33.7 28,305 18,612 -34.2 1,168 936 -19.9 30-39 32,183 26,860 -16.5 30,593 25,167 -17.7 1,590 1,693 6.5 40-49 10,771 11,466 6.5 10,076 10,589 5.1 695 877 26.2 50 + 4,807 4,284 -10.9 4,586 4,015 -12.5 221 269 21.7
Black 17,744 12,915 -27.2 15,996 11,041 -31.0 1,748 1,874 7.2 Juvenile 75 57 -24.0 68 47 -30.9 7 10 42.9 18-24 2,959 1,789 -39.5 2,685 1,552 -42.2 274 237 -13.5 25-29 3,320 2,182 -34.3 2,950 1,887 -36.0 370 295 -20.3 30-39 5,548 4,493 -19.0 4,899 3,734 -23.8 649 759 16.9 40-49 3,122 2,802 -10.2 2,819 2,371 -15.9 303 431 42.2 50 + 2,720 1,592 -41.5 2,575 1,450 -43.7 145 142 -2.1
Other 11,769 14,453 22.8 10,786 12,441 15.3 983 2,012 104.7 Juvenile 86 109 26.7 77 86 11.7 9 23 155.6 18-24 2,584 3,040 17.6 2,388 2,573 7.7 196 467 138.3 25-29 2,730 2,744 0.5 2,532 2,352 -7.1 198 392 98.0 30-39 3,985 4,488 12.6 3,604 3,849 6.8 381 639 67.7 40-49 1,597 2,784 74.3 1,448 2,410 66.4 149 374 151.0 50 + 787 1,288 63.7 737 1,171 58.9 50 117 134.0
Number Number NumberTotal Male
Appendix ADRIVING UNDER THE INFLUENCE ARRESTS, 1988 & 1997
Number of Arrests and Percent Change by Gender, Race and Age Group
Percent Change
Percent Change
Percent Change
Race and age of
arrestee
Female
16
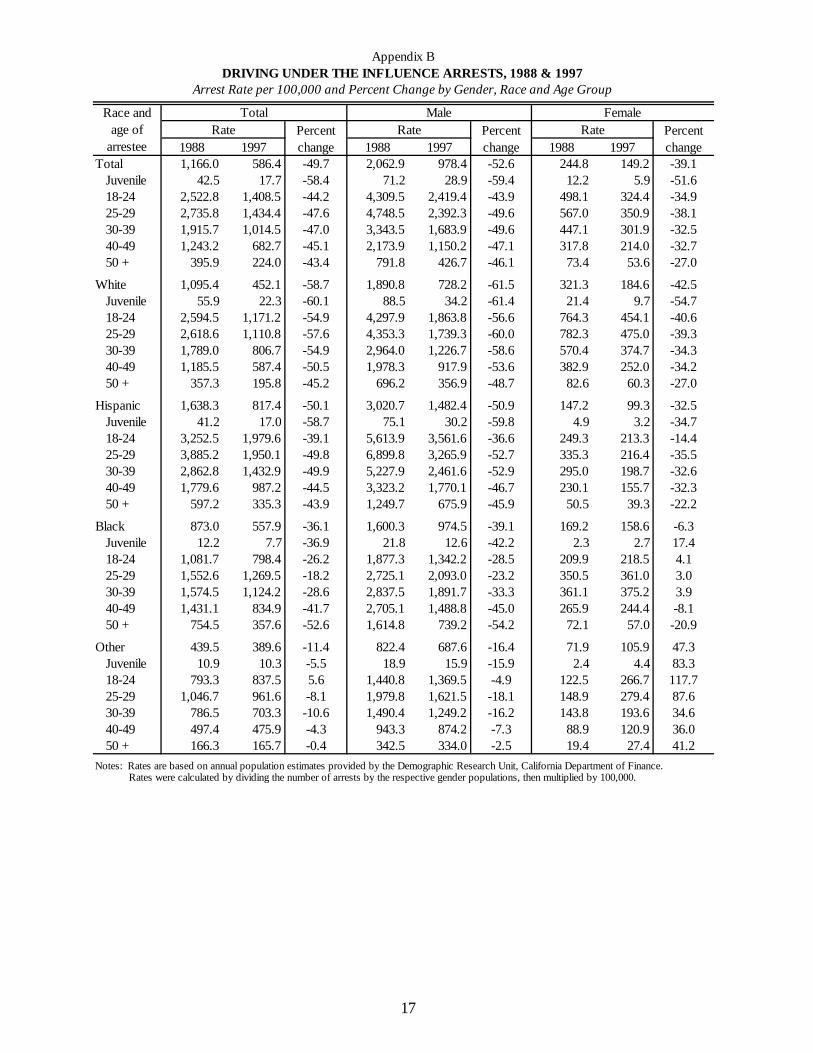
1988 1997 1988 1997 1988 1997Total 1,166.0 586.4 -49.7 2,062.9 978.4 -52.6 244.8 149.2 -39.1 Juvenile 42.5 17.7 -58.4 71.2 28.9 -59.4 12.2 5.9 -51.6 18-24 2,522.8 1,408.5 -44.2 4,309.5 2,419.4 -43.9 498.1 324.4 -34.9 25-29 2,735.8 1,434.4 -47.6 4,748.5 2,392.3 -49.6 567.0 350.9 -38.1 30-39 1,915.7 1,014.5 -47.0 3,343.5 1,683.9 -49.6 447.1 301.9 -32.5 40-49 1,243.2 682.7 -45.1 2,173.9 1,150.2 -47.1 317.8 214.0 -32.7 50 + 395.9 224.0 -43.4 791.8 426.7 -46.1 73.4 53.6 -27.0
White 1,095.4 452.1 -58.7 1,890.8 728.2 -61.5 321.3 184.6 -42.5 Juvenile 55.9 22.3 -60.1 88.5 34.2 -61.4 21.4 9.7 -54.7 18-24 2,594.5 1,171.2 -54.9 4,297.9 1,863.8 -56.6 764.3 454.1 -40.6 25-29 2,618.6 1,110.8 -57.6 4,353.3 1,739.3 -60.0 782.3 475.0 -39.3 30-39 1,789.0 806.7 -54.9 2,964.0 1,226.7 -58.6 570.4 374.7 -34.3 40-49 1,185.5 587.4 -50.5 1,978.3 917.9 -53.6 382.9 252.0 -34.2 50 + 357.3 195.8 -45.2 696.2 356.9 -48.7 82.6 60.3 -27.0
Hispanic 1,638.3 817.4 -50.1 3,020.7 1,482.4 -50.9 147.2 99.3 -32.5 Juvenile 41.2 17.0 -58.7 75.1 30.2 -59.8 4.9 3.2 -34.7 18-24 3,252.5 1,979.6 -39.1 5,613.9 3,561.6 -36.6 249.3 213.3 -14.4 25-29 3,885.2 1,950.1 -49.8 6,899.8 3,265.9 -52.7 335.3 216.4 -35.5 30-39 2,862.8 1,432.9 -49.9 5,227.9 2,461.6 -52.9 295.0 198.7 -32.6 40-49 1,779.6 987.2 -44.5 3,323.2 1,770.1 -46.7 230.1 155.7 -32.3 50 + 597.2 335.3 -43.9 1,249.7 675.9 -45.9 50.5 39.3 -22.2
Black 873.0 557.9 -36.1 1,600.3 974.5 -39.1 169.2 158.6 -6.3 Juvenile 12.2 7.7 -36.9 21.8 12.6 -42.2 2.3 2.7 17.4 18-24 1,081.7 798.4 -26.2 1,877.3 1,342.2 -28.5 209.9 218.5 4.1 25-29 1,552.6 1,269.5 -18.2 2,725.1 2,093.0 -23.2 350.5 361.0 3.0 30-39 1,574.5 1,124.2 -28.6 2,837.5 1,891.7 -33.3 361.1 375.2 3.9 40-49 1,431.1 834.9 -41.7 2,705.1 1,488.8 -45.0 265.9 244.4 -8.1 50 + 754.5 357.6 -52.6 1,614.8 739.2 -54.2 72.1 57.0 -20.9
Other 439.5 389.6 -11.4 822.4 687.6 -16.4 71.9 105.9 47.3 Juvenile 10.9 10.3 -5.5 18.9 15.9 -15.9 2.4 4.4 83.3 18-24 793.3 837.5 5.6 1,440.8 1,369.5 -4.9 122.5 266.7 117.7 25-29 1,046.7 961.6 -8.1 1,979.8 1,621.5 -18.1 148.9 279.4 87.6 30-39 786.5 703.3 -10.6 1,490.4 1,249.2 -16.2 143.8 193.6 34.6 40-49 497.4 475.9 -4.3 943.3 874.2 -7.3 88.9 120.9 36.0 50 + 166.3 165.7 -0.4 342.5 334.0 -2.5 19.4 27.4 41.2Notes: Rates are based on annual population estimates provided by the Demographic Research Unit, California Department of Finance. Rates were calculated by dividing the number of arrests by the respective gender populations, then multiplied by 100,000.
Appendix BDRIVING UNDER THE INFLUENCE ARRESTS, 1988 & 1997
Arrest Rate per 100,000 and Percent Change by Gender, Race and Age Group
Race and age of
arresteePercent change
Percent change
TotalRate Rate Rate
MalePercent change
Female
17
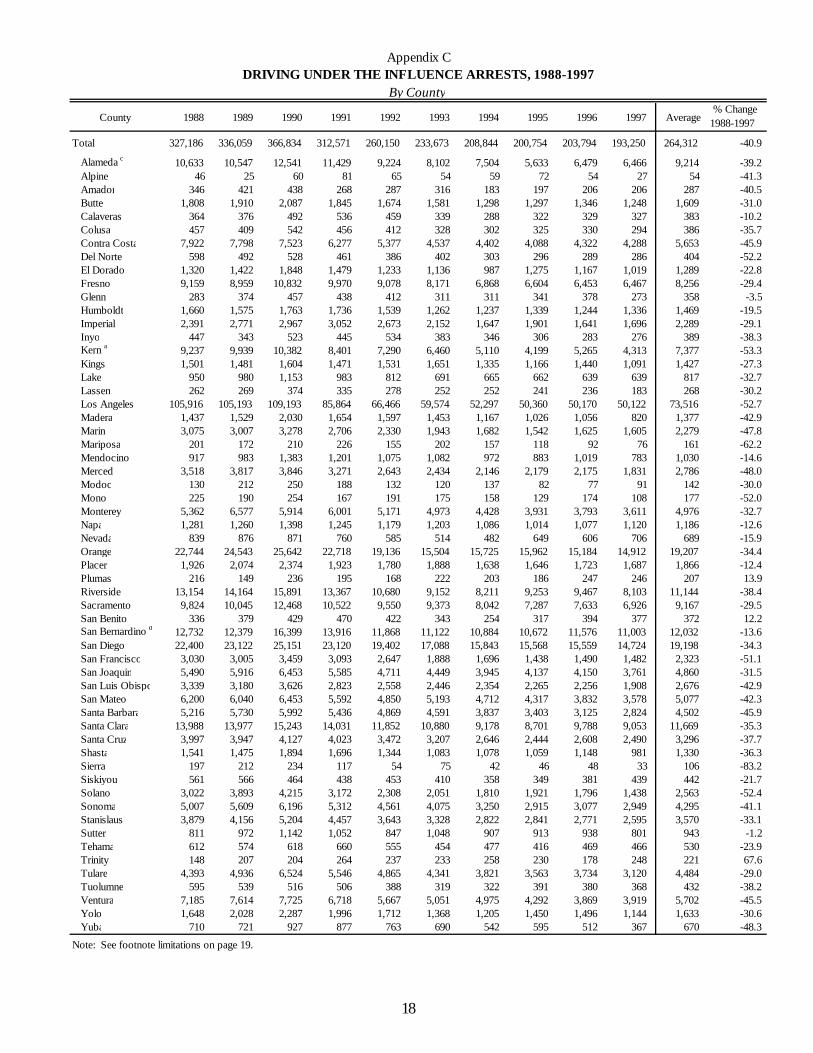
County 1988 1989 1990 1991 1992 1993 1994 1995 1996 1997 Average% Change
1988-1997
Total 327,186 336,059 366,834 312,571 260,150 233,673 208,844 200,754 203,794 193,250 264,312 -40.9
Alameda c 10,633 10,547 12,541 11,429 9,224 8,102 7,504 5,633 6,479 6,466 9,214 -39.2 Alpine 46 25 60 81 65 54 59 72 54 27 54 -41.3 Amador 346 421 438 268 287 316 183 197 206 206 287 -40.5 Butte 1,808 1,910 2,087 1,845 1,674 1,581 1,298 1,297 1,346 1,248 1,609 -31.0 Calaveras 364 376 492 536 459 339 288 322 329 327 383 -10.2 Colusa 457 409 542 456 412 328 302 325 330 294 386 -35.7 Contra Costa 7,922 7,798 7,523 6,277 5,377 4,537 4,402 4,088 4,322 4,288 5,653 -45.9 Del Norte 598 492 528 461 386 402 303 296 289 286 404 -52.2 El Dorado 1,320 1,422 1,848 1,479 1,233 1,136 987 1,275 1,167 1,019 1,289 -22.8 Fresno 9,159 8,959 10,832 9,970 9,078 8,171 6,868 6,604 6,453 6,467 8,256 -29.4 Glenn 283 374 457 438 412 311 311 341 378 273 358 -3.5 Humboldt 1,660 1,575 1,763 1,736 1,539 1,262 1,237 1,339 1,244 1,336 1,469 -19.5 Imperial 2,391 2,771 2,967 3,052 2,673 2,152 1,647 1,901 1,641 1,696 2,289 -29.1 Inyo 447 343 523 445 534 383 346 306 283 276 389 -38.3 Kern a 9,237 9,939 10,382 8,401 7,290 6,460 5,110 4,199 5,265 4,313 7,377 -53.3 Kings 1,501 1,481 1,604 1,471 1,531 1,651 1,335 1,166 1,440 1,091 1,427 -27.3 Lake 950 980 1,153 983 812 691 665 662 639 639 817 -32.7 Lassen 262 269 374 335 278 252 252 241 236 183 268 -30.2 Los Angeles 105,916 105,193 109,193 85,864 66,466 59,574 52,297 50,360 50,170 50,122 73,516 -52.7 Madera 1,437 1,529 2,030 1,654 1,597 1,453 1,167 1,026 1,056 820 1,377 -42.9 Marin 3,075 3,007 3,278 2,706 2,330 1,943 1,682 1,542 1,625 1,605 2,279 -47.8 Mariposa 201 172 210 226 155 202 157 118 92 76 161 -62.2 Mendocino 917 983 1,383 1,201 1,075 1,082 972 883 1,019 783 1,030 -14.6 Merced 3,518 3,817 3,846 3,271 2,643 2,434 2,146 2,179 2,175 1,831 2,786 -48.0 Modoc 130 212 250 188 132 120 137 82 77 91 142 -30.0 Mono 225 190 254 167 191 175 158 129 174 108 177 -52.0 Monterey 5,362 6,577 5,914 6,001 5,171 4,973 4,428 3,931 3,793 3,611 4,976 -32.7 Napa 1,281 1,260 1,398 1,245 1,179 1,203 1,086 1,014 1,077 1,120 1,186 -12.6 Nevada 839 876 871 760 585 514 482 649 606 706 689 -15.9 Orange 22,744 24,543 25,642 22,718 19,136 15,504 15,725 15,962 15,184 14,912 19,207 -34.4 Placer 1,926 2,074 2,374 1,923 1,780 1,888 1,638 1,646 1,723 1,687 1,866 -12.4 Plumas 216 149 236 195 168 222 203 186 247 246 207 13.9 Riverside 13,154 14,164 15,891 13,367 10,680 9,152 8,211 9,253 9,467 8,103 11,144 -38.4 Sacramento 9,824 10,045 12,468 10,522 9,550 9,373 8,042 7,287 7,633 6,926 9,167 -29.5 San Benito 336 379 429 470 422 343 254 317 394 377 372 12.2 San Bernardino d 12,732 12,379 16,399 13,916 11,868 11,122 10,884 10,672 11,576 11,003 12,032 -13.6 San Diego 22,400 23,122 25,151 23,120 19,402 17,088 15,843 15,568 15,559 14,724 19,198 -34.3 San Francisco 3,030 3,005 3,459 3,093 2,647 1,888 1,696 1,438 1,490 1,482 2,323 -51.1 San Joaquin 5,490 5,916 6,453 5,585 4,711 4,449 3,945 4,137 4,150 3,761 4,860 -31.5 San Luis Obispo 3,339 3,180 3,626 2,823 2,558 2,446 2,354 2,265 2,256 1,908 2,676 -42.9 San Mateo 6,200 6,040 6,453 5,592 4,850 5,193 4,712 4,317 3,832 3,578 5,077 -42.3 Santa Barbara 5,216 5,730 5,992 5,436 4,869 4,591 3,837 3,403 3,125 2,824 4,502 -45.9 Santa Clara 13,988 13,977 15,243 14,031 11,852 10,880 9,178 8,701 9,788 9,053 11,669 -35.3 Santa Cruz 3,997 3,947 4,127 4,023 3,472 3,207 2,646 2,444 2,608 2,490 3,296 -37.7 Shasta 1,541 1,475 1,894 1,696 1,344 1,083 1,078 1,059 1,148 981 1,330 -36.3 Sierra 197 212 234 117 54 75 42 46 48 33 106 -83.2 Siskiyou 561 566 464 438 453 410 358 349 381 439 442 -21.7 Solano 3,022 3,893 4,215 3,172 2,308 2,051 1,810 1,921 1,796 1,438 2,563 -52.4 Sonoma 5,007 5,609 6,196 5,312 4,561 4,075 3,250 2,915 3,077 2,949 4,295 -41.1 Stanislaus 3,879 4,156 5,204 4,457 3,643 3,328 2,822 2,841 2,771 2,595 3,570 -33.1 Sutter 811 972 1,142 1,052 847 1,048 907 913 938 801 943 -1.2 Tehama 612 574 618 660 555 454 477 416 469 466 530 -23.9 Trinity 148 207 204 264 237 233 258 230 178 248 221 67.6 Tulare 4,393 4,936 6,524 5,546 4,865 4,341 3,821 3,563 3,734 3,120 4,484 -29.0 Tuolumne 595 539 516 506 388 319 322 391 380 368 432 -38.2 Ventura 7,185 7,614 7,725 6,718 5,667 5,051 4,975 4,292 3,869 3,919 5,702 -45.5 Yolo 1,648 2,028 2,287 1,996 1,712 1,368 1,205 1,450 1,496 1,144 1,633 -30.6 Yuba 710 721 927 877 763 690 542 595 512 367 670 -48.3
Note: See footnote limitations on page 19.
Appendix CDRIVING UNDER THE INFLUENCE ARRESTS, 1988-1997
By County
18
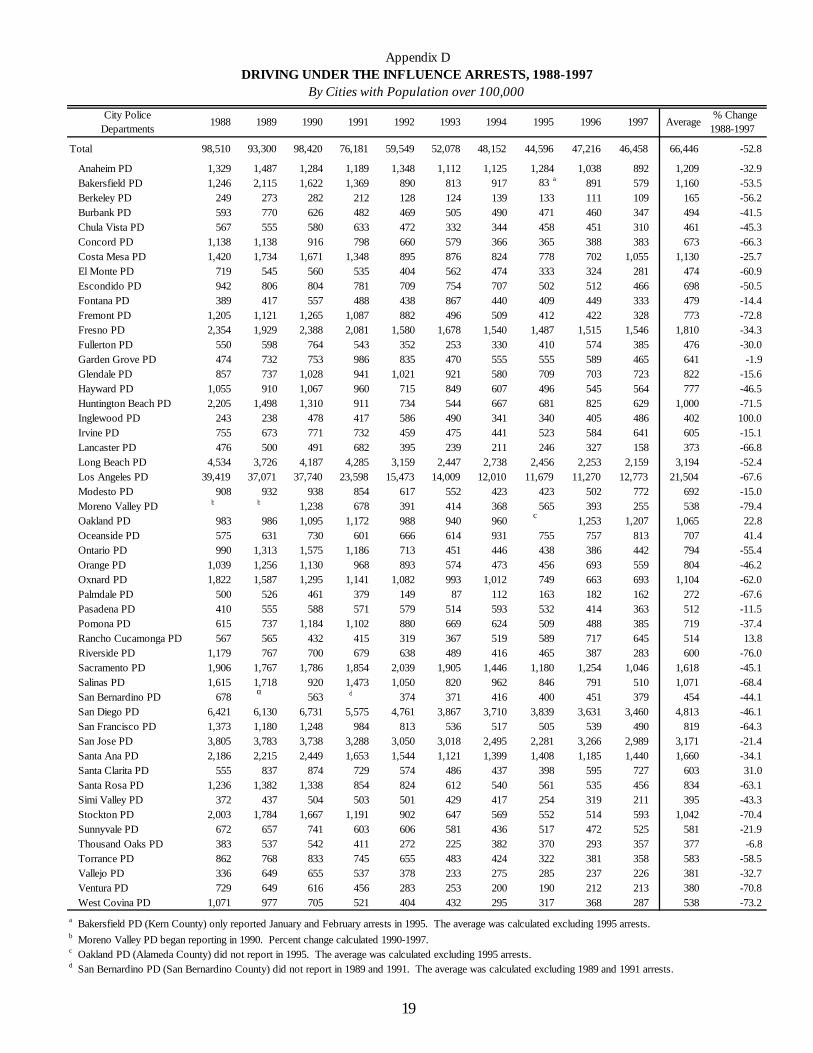
City Police Departments
1988 1989 1990 1991 1992 1993 1994 1995 1996 1997 Average% Change
1988-1997
Total 98,510 93,300 98,420 76,181 59,549 52,078 48,152 44,596 47,216 46,458 66,446 -52.8
Anaheim PD 1,329 1,487 1,284 1,189 1,348 1,112 1,125 1,284 1,038 892 1,209 -32.9 Bakersfield PD 1,246 2,115 1,622 1,369 890 813 917 83 a 891 579 1,160 -53.5 Berkeley PD 249 273 282 212 128 124 139 133 111 109 165 -56.2 Burbank PD 593 770 626 482 469 505 490 471 460 347 494 -41.5 Chula Vista PD 567 555 580 633 472 332 344 458 451 310 461 -45.3 Concord PD 1,138 1,138 916 798 660 579 366 365 388 383 673 -66.3 Costa Mesa PD 1,420 1,734 1,671 1,348 895 876 824 778 702 1,055 1,130 -25.7 El Monte PD 719 545 560 535 404 562 474 333 324 281 474 -60.9 Escondido PD 942 806 804 781 709 754 707 502 512 466 698 -50.5 Fontana PD 389 417 557 488 438 867 440 409 449 333 479 -14.4 Fremont PD 1,205 1,121 1,265 1,087 882 496 509 412 422 328 773 -72.8 Fresno PD 2,354 1,929 2,388 2,081 1,580 1,678 1,540 1,487 1,515 1,546 1,810 -34.3 Fullerton PD 550 598 764 543 352 253 330 410 574 385 476 -30.0 Garden Grove PD 474 732 753 986 835 470 555 555 589 465 641 -1.9 Glendale PD 857 737 1,028 941 1,021 921 580 709 703 723 822 -15.6 Hayward PD 1,055 910 1,067 960 715 849 607 496 545 564 777 -46.5 Huntington Beach PD 2,205 1,498 1,310 911 734 544 667 681 825 629 1,000 -71.5 Inglewood PD 243 238 478 417 586 490 341 340 405 486 402 100.0 Irvine PD 755 673 771 732 459 475 441 523 584 641 605 -15.1 Lancaster PD 476 500 491 682 395 239 211 246 327 158 373 -66.8 Long Beach PD 4,534 3,726 4,187 4,285 3,159 2,447 2,738 2,456 2,253 2,159 3,194 -52.4 Los Angeles PD 39,419 37,071 37,740 23,598 15,473 14,009 12,010 11,679 11,270 12,773 21,504 -67.6 Modesto PD 908 932 938 854 617 552 423 423 502 772 692 -15.0 Moreno Valley PD b b 1,238 678 391 414 368 565 393 255 538 -79.4 Oakland PD 983 986 1,095 1,172 988 940 960 c 1,253 1,207 1,065 22.8 Oceanside PD 575 631 730 601 666 614 931 755 757 813 707 41.4 Ontario PD 990 1,313 1,575 1,186 713 451 446 438 386 442 794 -55.4 Orange PD 1,039 1,256 1,130 968 893 574 473 456 693 559 804 -46.2 Oxnard PD 1,822 1,587 1,295 1,141 1,082 993 1,012 749 663 693 1,104 -62.0 Palmdale PD 500 526 461 379 149 87 112 163 182 162 272 -67.6 Pasadena PD 410 555 588 571 579 514 593 532 414 363 512 -11.5 Pomona PD 615 737 1,184 1,102 880 669 624 509 488 385 719 -37.4 Rancho Cucamonga PD 567 565 432 415 319 367 519 589 717 645 514 13.8 Riverside PD 1,179 767 700 679 638 489 416 465 387 283 600 -76.0 Sacramento PD 1,906 1,767 1,786 1,854 2,039 1,905 1,446 1,180 1,254 1,046 1,618 -45.1 Salinas PD 1,615 1,718 920 1,473 1,050 820 962 846 791 510 1,071 -68.4 San Bernardino PD 678 d 563 d 374 371 416 400 451 379 454 -44.1 San Diego PD 6,421 6,130 6,731 5,575 4,761 3,867 3,710 3,839 3,631 3,460 4,813 -46.1 San Francisco PD 1,373 1,180 1,248 984 813 536 517 505 539 490 819 -64.3 San Jose PD 3,805 3,783 3,738 3,288 3,050 3,018 2,495 2,281 3,266 2,989 3,171 -21.4 Santa Ana PD 2,186 2,215 2,449 1,653 1,544 1,121 1,399 1,408 1,185 1,440 1,660 -34.1 Santa Clarita PD 555 837 874 729 574 486 437 398 595 727 603 31.0 Santa Rosa PD 1,236 1,382 1,338 854 824 612 540 561 535 456 834 -63.1 Simi Valley PD 372 437 504 503 501 429 417 254 319 211 395 -43.3 Stockton PD 2,003 1,784 1,667 1,191 902 647 569 552 514 593 1,042 -70.4 Sunnyvale PD 672 657 741 603 606 581 436 517 472 525 581 -21.9 Thousand Oaks PD 383 537 542 411 272 225 382 370 293 357 377 -6.8 Torrance PD 862 768 833 745 655 483 424 322 381 358 583 -58.5 Vallejo PD 336 649 655 537 378 233 275 285 237 226 381 -32.7 Ventura PD 729 649 616 456 283 253 200 190 212 213 380 -70.8 West Covina PD 1,071 977 705 521 404 432 295 317 368 287 538 -73.2a Bakersfield PD (Kern County) only reported January and February arrests in 1995. The average was calculated excluding 1995 arrests.b Moreno Valley PD began reporting in 1990. Percent change calculated 1990-1997.c Oakland PD (Alameda County) did not report in 1995. The average was calculated excluding 1995 arrests.d San Bernardino PD (San Bernardino County) did not report in 1989 and 1991. The average was calculated excluding 1989 and 1991 arrests.
Appendix DDRIVING UNDER THE INFLUENCE ARRESTS, 1988-1997
By Cities with Population over 100,000
19
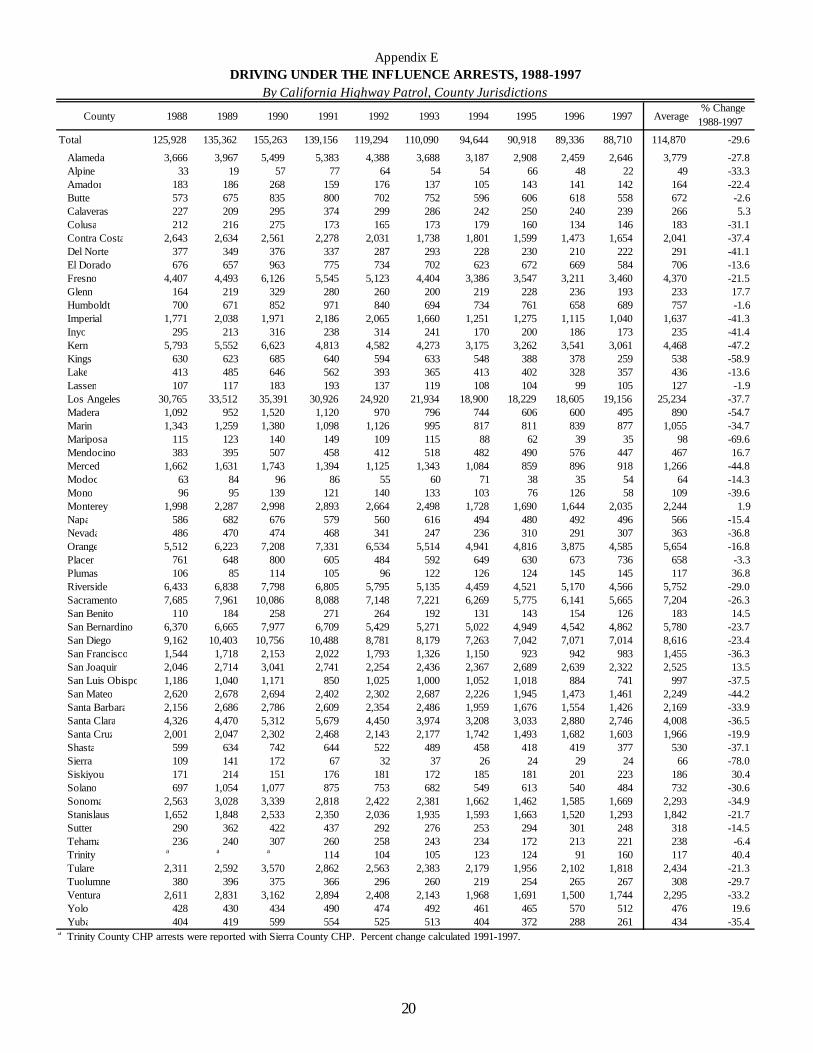
County 1988 1989 1990 1991 1992 1993 1994 1995 1996 1997 Average% Change
1988-1997
Total 125,928 135,362 155,263 139,156 119,294 110,090 94,644 90,918 89,336 88,710 114,870 -29.6
Alameda 3,666 3,967 5,499 5,383 4,388 3,688 3,187 2,908 2,459 2,646 3,779 -27.8 Alpine 33 19 57 77 64 54 54 66 48 22 49 -33.3 Amador 183 186 268 159 176 137 105 143 141 142 164 -22.4 Butte 573 675 835 800 702 752 596 606 618 558 672 -2.6 Calaveras 227 209 295 374 299 286 242 250 240 239 266 5.3 Colusa 212 216 275 173 165 173 179 160 134 146 183 -31.1 Contra Costa 2,643 2,634 2,561 2,278 2,031 1,738 1,801 1,599 1,473 1,654 2,041 -37.4 Del Norte 377 349 376 337 287 293 228 230 210 222 291 -41.1 El Dorado 676 657 963 775 734 702 623 672 669 584 706 -13.6 Fresno 4,407 4,493 6,126 5,545 5,123 4,404 3,386 3,547 3,211 3,460 4,370 -21.5 Glenn 164 219 329 280 260 200 219 228 236 193 233 17.7 Humboldt 700 671 852 971 840 694 734 761 658 689 757 -1.6 Imperial 1,771 2,038 1,971 2,186 2,065 1,660 1,251 1,275 1,115 1,040 1,637 -41.3 Inyo 295 213 316 238 314 241 170 200 186 173 235 -41.4 Kern 5,793 5,552 6,623 4,813 4,582 4,273 3,175 3,262 3,541 3,061 4,468 -47.2 Kings 630 623 685 640 594 633 548 388 378 259 538 -58.9 Lake 413 485 646 562 393 365 413 402 328 357 436 -13.6 Lassen 107 117 183 193 137 119 108 104 99 105 127 -1.9 Los Angeles 30,765 33,512 35,391 30,926 24,920 21,934 18,900 18,229 18,605 19,156 25,234 -37.7 Madera 1,092 952 1,520 1,120 970 796 744 606 600 495 890 -54.7 Marin 1,343 1,259 1,380 1,098 1,126 995 817 811 839 877 1,055 -34.7 Mariposa 115 123 140 149 109 115 88 62 39 35 98 -69.6 Mendocino 383 395 507 458 412 518 482 490 576 447 467 16.7 Merced 1,662 1,631 1,743 1,394 1,125 1,343 1,084 859 896 918 1,266 -44.8 Modoc 63 84 96 86 55 60 71 38 35 54 64 -14.3 Mono 96 95 139 121 140 133 103 76 126 58 109 -39.6 Monterey 1,998 2,287 2,998 2,893 2,664 2,498 1,728 1,690 1,644 2,035 2,244 1.9 Napa 586 682 676 579 560 616 494 480 492 496 566 -15.4 Nevada 486 470 474 468 341 247 236 310 291 307 363 -36.8 Orange 5,512 6,223 7,208 7,331 6,534 5,514 4,941 4,816 3,875 4,585 5,654 -16.8 Placer 761 648 800 605 484 592 649 630 673 736 658 -3.3 Plumas 106 85 114 105 96 122 126 124 145 145 117 36.8 Riverside 6,433 6,838 7,798 6,805 5,795 5,135 4,459 4,521 5,170 4,566 5,752 -29.0 Sacramento 7,685 7,961 10,086 8,088 7,148 7,221 6,269 5,775 6,141 5,665 7,204 -26.3 San Benito 110 184 258 271 264 192 131 143 154 126 183 14.5 San Bernardino 6,370 6,665 7,977 6,709 5,429 5,271 5,022 4,949 4,542 4,862 5,780 -23.7 San Diego 9,162 10,403 10,756 10,488 8,781 8,179 7,263 7,042 7,071 7,014 8,616 -23.4 San Francisco 1,544 1,718 2,153 2,022 1,793 1,326 1,150 923 942 983 1,455 -36.3 San Joaquin 2,046 2,714 3,041 2,741 2,254 2,436 2,367 2,689 2,639 2,322 2,525 13.5 San Luis Obispo 1,186 1,040 1,171 850 1,025 1,000 1,052 1,018 884 741 997 -37.5 San Mateo 2,620 2,678 2,694 2,402 2,302 2,687 2,226 1,945 1,473 1,461 2,249 -44.2 Santa Barbara 2,156 2,686 2,786 2,609 2,354 2,486 1,959 1,676 1,554 1,426 2,169 -33.9 Santa Clara 4,326 4,470 5,312 5,679 4,450 3,974 3,208 3,033 2,880 2,746 4,008 -36.5 Santa Cruz 2,001 2,047 2,302 2,468 2,143 2,177 1,742 1,493 1,682 1,603 1,966 -19.9 Shasta 599 634 742 644 522 489 458 418 419 377 530 -37.1 Sierra 109 141 172 67 32 37 26 24 29 24 66 -78.0 Siskiyou 171 214 151 176 181 172 185 181 201 223 186 30.4 Solano 697 1,054 1,077 875 753 682 549 613 540 484 732 -30.6 Sonoma 2,563 3,028 3,339 2,818 2,422 2,381 1,662 1,462 1,585 1,669 2,293 -34.9 Stanislaus 1,652 1,848 2,533 2,350 2,036 1,935 1,593 1,663 1,520 1,293 1,842 -21.7 Sutter 290 362 422 437 292 276 253 294 301 248 318 -14.5 Tehama 236 240 307 260 258 243 234 172 213 221 238 -6.4 Trinity a a a 114 104 105 123 124 91 160 117 40.4 Tulare 2,311 2,592 3,570 2,862 2,563 2,383 2,179 1,956 2,102 1,818 2,434 -21.3 Tuolumne 380 396 375 366 296 260 219 254 265 267 308 -29.7 Ventura 2,611 2,831 3,162 2,894 2,408 2,143 1,968 1,691 1,500 1,744 2,295 -33.2 Yolo 428 430 434 490 474 492 461 465 570 512 476 19.6 Yuba 404 419 599 554 525 513 404 372 288 261 434 -35.4a Trinity County CHP arrests were reported with Sierra County CHP. Percent change calculated 1991-1997.
Appendix EDRIVING UNDER THE INFLUENCE ARRESTS, 1988-1997
By California Highway Patrol, County Jurisdictions
20
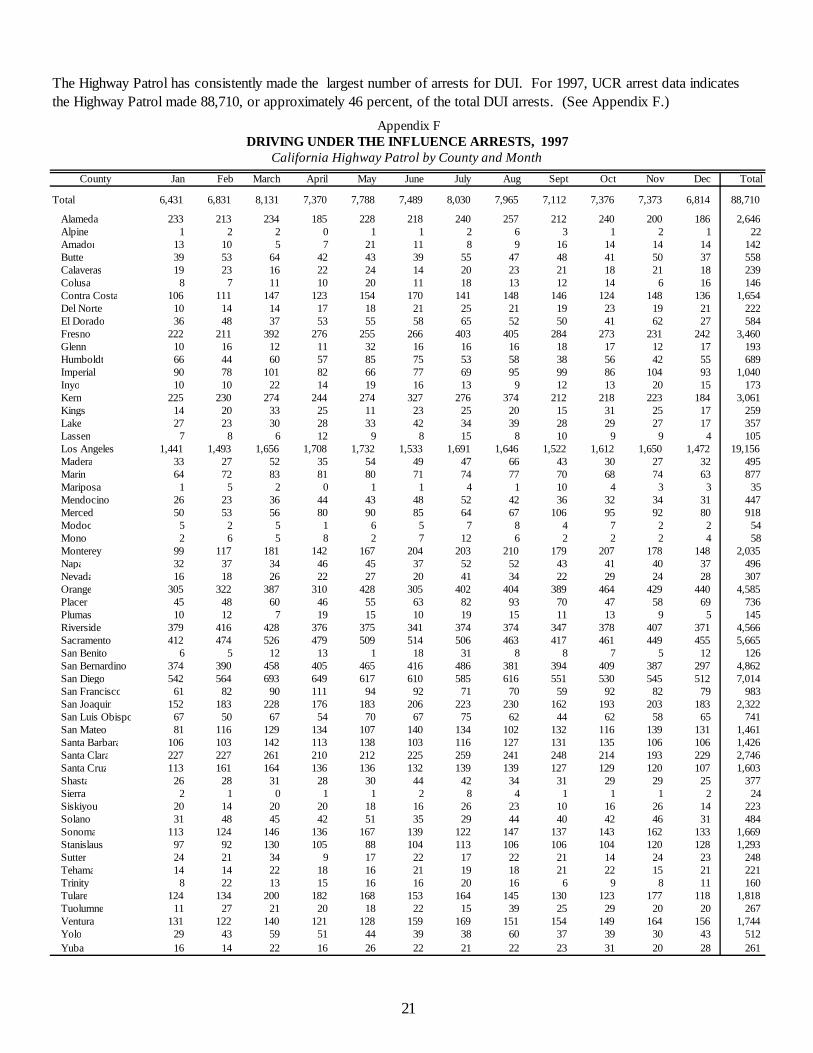
California Highway Patrol by County and MonthCounty Jan Feb March April May June July Aug Sept Oct Nov Dec Total
Total 6,431 6,831 8,131 7,370 7,788 7,489 8,030 7,965 7,112 7,376 7,373 6,814 88,710
Alameda 233 213 234 185 228 218 240 257 212 240 200 186 2,646 Alpine 1 2 2 0 1 1 2 6 3 1 2 1 22 Amador 13 10 5 7 21 11 8 9 16 14 14 14 142 Butte 39 53 64 42 43 39 55 47 48 41 50 37 558 Calaveras 19 23 16 22 24 14 20 23 21 18 21 18 239 Colusa 8 7 11 10 20 11 18 13 12 14 6 16 146 Contra Costa 106 111 147 123 154 170 141 148 146 124 148 136 1,654 Del Norte 10 14 14 17 18 21 25 21 19 23 19 21 222 El Dorado 36 48 37 53 55 58 65 52 50 41 62 27 584 Fresno 222 211 392 276 255 266 403 405 284 273 231 242 3,460 Glenn 10 16 12 11 32 16 16 16 18 17 12 17 193 Humboldt 66 44 60 57 85 75 53 58 38 56 42 55 689 Imperial 90 78 101 82 66 77 69 95 99 86 104 93 1,040 Inyo 10 10 22 14 19 16 13 9 12 13 20 15 173 Kern 225 230 274 244 274 327 276 374 212 218 223 184 3,061 Kings 14 20 33 25 11 23 25 20 15 31 25 17 259 Lake 27 23 30 28 33 42 34 39 28 29 27 17 357 Lassen 7 8 6 12 9 8 15 8 10 9 9 4 105 Los Angeles 1,441 1,493 1,656 1,708 1,732 1,533 1,691 1,646 1,522 1,612 1,650 1,472 19,156 Madera 33 27 52 35 54 49 47 66 43 30 27 32 495 Marin 64 72 83 81 80 71 74 77 70 68 74 63 877 Mariposa 1 5 2 0 1 1 4 1 10 4 3 3 35 Mendocino 26 23 36 44 43 48 52 42 36 32 34 31 447 Merced 50 53 56 80 90 85 64 67 106 95 92 80 918 Modoc 5 2 5 1 6 5 7 8 4 7 2 2 54 Mono 2 6 5 8 2 7 12 6 2 2 2 4 58 Monterey 99 117 181 142 167 204 203 210 179 207 178 148 2,035 Napa 32 37 34 46 45 37 52 52 43 41 40 37 496 Nevada 16 18 26 22 27 20 41 34 22 29 24 28 307 Orange 305 322 387 310 428 305 402 404 389 464 429 440 4,585 Placer 45 48 60 46 55 63 82 93 70 47 58 69 736 Plumas 10 12 7 19 15 10 19 15 11 13 9 5 145 Riverside 379 416 428 376 375 341 374 374 347 378 407 371 4,566 Sacramento 412 474 526 479 509 514 506 463 417 461 449 455 5,665 San Benito 6 5 12 13 1 18 31 8 8 7 5 12 126 San Bernardino 374 390 458 405 465 416 486 381 394 409 387 297 4,862 San Diego 542 564 693 649 617 610 585 616 551 530 545 512 7,014 San Francisco 61 82 90 111 94 92 71 70 59 92 82 79 983 San Joaquin 152 183 228 176 183 206 223 230 162 193 203 183 2,322 San Luis Obispo 67 50 67 54 70 67 75 62 44 62 58 65 741 San Mateo 81 116 129 134 107 140 134 102 132 116 139 131 1,461 Santa Barbara 106 103 142 113 138 103 116 127 131 135 106 106 1,426 Santa Clara 227 227 261 210 212 225 259 241 248 214 193 229 2,746 Santa Cruz 113 161 164 136 136 132 139 139 127 129 120 107 1,603 Shasta 26 28 31 28 30 44 42 34 31 29 29 25 377 Sierra 2 1 0 1 1 2 8 4 1 1 1 2 24 Siskiyou 20 14 20 20 18 16 26 23 10 16 26 14 223 Solano 31 48 45 42 51 35 29 44 40 42 46 31 484 Sonoma 113 124 146 136 167 139 122 147 137 143 162 133 1,669 Stanislaus 97 92 130 105 88 104 113 106 106 104 120 128 1,293 Sutter 24 21 34 9 17 22 17 22 21 14 24 23 248 Tehama 14 14 22 18 16 21 19 18 21 22 15 21 221 Trinity 8 22 13 15 16 16 20 16 6 9 8 11 160 Tulare 124 134 200 182 168 153 164 145 130 123 177 118 1,818 Tuolumne 11 27 21 20 18 22 15 39 25 29 20 20 267 Ventura 131 122 140 121 128 159 169 151 154 149 164 156 1,744 Yolo 29 43 59 51 44 39 38 60 37 39 30 43 512 Yuba 16 14 22 16 26 22 21 22 23 31 20 28 261
DRIVING UNDER THE INFLUENCE ARRESTS, 1997
The Highway Patrol has consistently made the largest number of arrests for DUI. For 1997, UCR arrest data indicates the Highway Patrol made 88,710, or approximately 46 percent, of the total DUI arrests. (See Appendix F.)
Appendix F
21
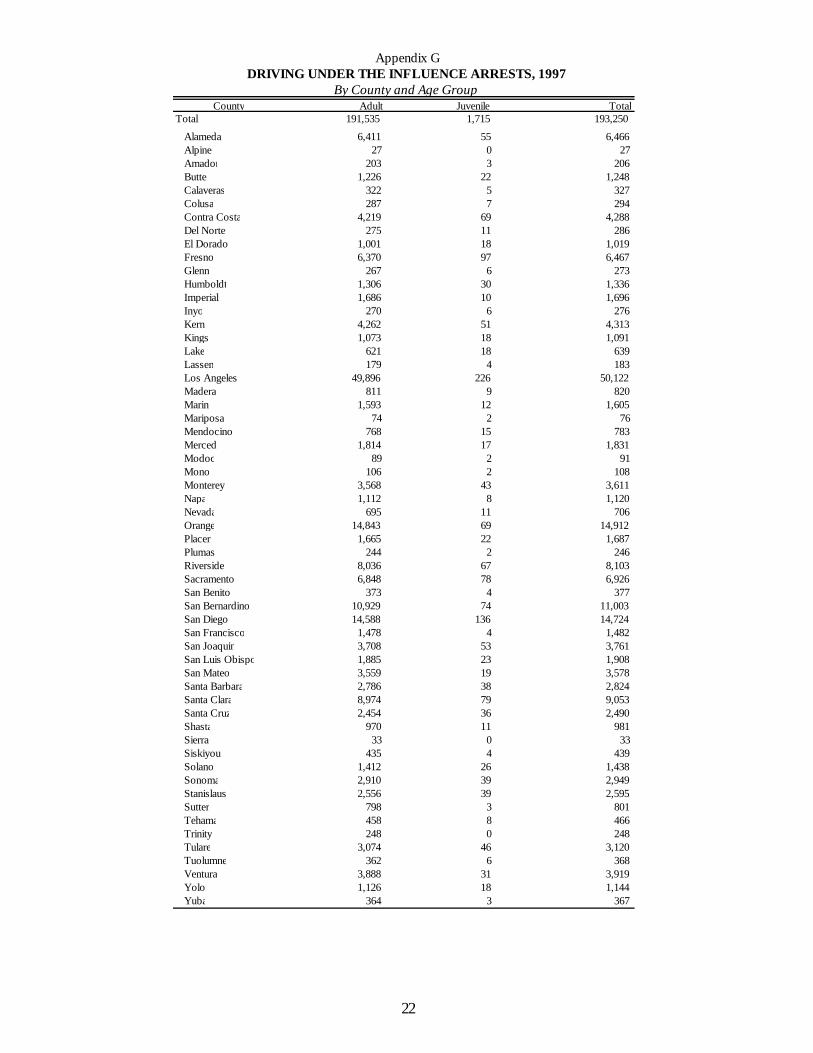
County Adult Juvenile TotalTotal 191,535 1,715 193,250
Alameda 6,411 55 6,466 Alpine 27 0 27 Amador 203 3 206 Butte 1,226 22 1,248 Calaveras 322 5 327 Colusa 287 7 294 Contra Costa 4,219 69 4,288 Del Norte 275 11 286 El Dorado 1,001 18 1,019 Fresno 6,370 97 6,467 Glenn 267 6 273 Humboldt 1,306 30 1,336 Imperial 1,686 10 1,696 Inyo 270 6 276 Kern 4,262 51 4,313 Kings 1,073 18 1,091 Lake 621 18 639 Lassen 179 4 183 Los Angeles 49,896 226 50,122 Madera 811 9 820 Marin 1,593 12 1,605 Mariposa 74 2 76 Mendocino 768 15 783 Merced 1,814 17 1,831 Modoc 89 2 91 Mono 106 2 108 Monterey 3,568 43 3,611 Napa 1,112 8 1,120 Nevada 695 11 706 Orange 14,843 69 14,912 Placer 1,665 22 1,687 Plumas 244 2 246 Riverside 8,036 67 8,103 Sacramento 6,848 78 6,926 San Benito 373 4 377 San Bernardino 10,929 74 11,003 San Diego 14,588 136 14,724 San Francisco 1,478 4 1,482 San Joaquin 3,708 53 3,761 San Luis Obispo 1,885 23 1,908 San Mateo 3,559 19 3,578 Santa Barbara 2,786 38 2,824 Santa Clara 8,974 79 9,053 Santa Cruz 2,454 36 2,490 Shasta 970 11 981 Sierra 33 0 33 Siskiyou 435 4 439 Solano 1,412 26 1,438 Sonoma 2,910 39 2,949 Stanislaus 2,556 39 2,595 Sutter 798 3 801 Tehama 458 8 466 Trinity 248 0 248 Tulare 3,074 46 3,120 Tuolumne 362 6 368 Ventura 3,888 31 3,919 Yolo 1,126 18 1,144 Yuba 364 3 367
Appendix GDRIVING UNDER THE INFLUENCE ARRESTS, 1997
By County and Age Group
22
4/99
CJSC* PUBLICATIONS ON THE INTERNEThttp://caag.state.ca.us/cjsc/pubsol.htm
CJSC Outlook: Crime in Urban and Rural California(1987 and 1996)
Crime and Delinquency in California (1996 to current)Crime and Delinquency in California (Advance
Release) (1996 to current)Crime as Reported by Selected California Agencies,
January through September (1995 to current)
Hate Crime in California (1995 to current)Homicide in California (1995 to current)Preliminary Report, Crime 1998 (January through June)Preliminary Report, Crime 1998 (January through
December)Report on Arrests for Driving Under the Influence in
California, 1997
AnnualsCrime and Delinquency in CaliforniaCrime and Delinquency in California -
Advance ReleaseCriminal Justice Profile - A Supplement to
C&D (statewide and individual counties)Hate Crime in CaliforniaHomicide in CaliforniaPreliminary Report, Crime (January-June
and January-December)
BCS Focus and ForumsThe California Experience in American
Juvenile Justice: Some HistoricalPerspectives (December 1988)
Controlling Plea Bargaining in California(September 1985)
Coordinating Justice in California: “Thereought to be a law about it” (December1988)
Crime Control and the Criminal Career(December 1992)
The Development of California DrunkDriving Legislation (December 1988)
Employment and Crime (February 1989)The Impact of California’s “Prior Felony
Conviction” Law (September 1987)The Origins and Development of Penalties
for Drunk Drivers in California (August1988)
A Policy Role for Focus Groups:Community Corrections (September1991)
The Prevalence and Incidence of ArrestsAmong Adult Males in California (August1988)
The Social Structure of Street DrugDealing (December 1988)
CJSC* PUBLICATIONS IN PRINT
BCS OutlooksAdult Felony Arrest Dispositions in
California (1982-1984 and 1986-1989)Crime in California and the United States,
1982 (December 1983)Crime in Urban and Rural California
(December 1997)Crime in Urban and Rural California
(November 1984)Felony Drug Arrests in California, 1985
(December 1986)Juvenile Justice in California, 1983 (June
1984)Motor Vehicle Theft in California
(December 1987)Motor Vehicle Theft Recovery Data, 1983
1989 (October 1990)Women in Crime: The Sentencing of
Female Defendants (April 1988)
BCS ReportsAdult Felony Arrest Dispositions in
California (April 1992)Crime in California and the U.S., 1980
1991 (January 1993)Crime in California and the U.S., 1988
data (January 1990)Effectiveness of Statutory Requirements
for the Registration of Sex Offenders - AReport to the California State Legislature
Executive Summary of the Final Report -Blue Ribbon Commission on InmatePopulation Management (January 1990)
Parolees Returned to Prison and theCalifornia Prison Population (January1988)
Target Hardening: A Literature Review(October 1989)
Monograph SeriesConspicuous Depredation: Automobile
Theft in Los Angeles, 1904 to 1987(March 1990)
Controlling Felony Plea Bargaining inCalifornia: The Impact of the Victim’sBill of Rights (1986)
Development of a White Collar Crime Index(December 1992)
Incapacitation Strategies and the CareerCriminal (December 1992)
Measuring White Collar Crime inDepository Institutions (December 1993)
Prosecutors’ Reponse to Parental ChildStealing: A Statewide Study (April 1995)
Race & Delinquency in Los AngelesJuvenile Court, 1950 (December 1990)
Survey Report: “The Expansion of theCriminal Justice and Penal System inCalifornia - Is greater coordinationrequired?” (December 1988)
MiscellaneousGang Organization and Migration/Drugs,
Gangs & Law EnforcementProceedings of the Attorney General’s
Crime Conference 85 (September 1985)Proceedings of Symposium 87: White
Collar/Institutional Crime - Its Measure-ment and Analysis
If you need a publication, assistance in obtaining statistical information, or a customized statisticalreport, contact the CJSC's Special Requests Unit at the California Department of Justice, CriminalJustice Statistics Center, Special Requests Unit, P. O. Box 903427, Sacramento, CA 94203-4270,Telephone: (916) 227-3509, FAX: (916) 227-0427, E-mail: [email protected]
*Prior to 1991, the Criminal Justice Statistics Center (CJSC) was known as the Bureau of Criminal Statistics (BCS).