Embed Size (px)
Citation preview

Interim Report
by
Global Environmental Subcommittee
Environmental Committee
Industrial Structure Council
Perspectives and Actions
to Construct a Future Sustainable Framework
on Climate Change
July 2003

Table of Contents
INTRODUCTION .. . . . . . . . . . . . . . . . . . . . . . . . . . . . . . . . . . . . . . . . . . . . . . . . . . . . . . . . . . . 1( 1 ) Background o f Di scuss ions a t t he Subcommi t t ee . . . . . 1( 2 ) Discuss ions a t the Subcommi t t ee . . . . . . . . . . . . . . . . . . . . . . . . . . . 2
Chapter 1 . Character i s t i c s o f the Globa l Warming Issue . 31 . Globa l Pub l i c Goods . . . . . . . . . . . . . . . . . . . . . . . . . . . . . . . . . . . . . . . . . . . . . . . 32 . Long- t e rm Chal lenge Requi r ing a Techn o l o gica l
Breakthrough. . . . . . . . . . . . . . . . . . . . . . . . . . . . . . . . . . . . . . . . . . . . . . . . . . . . . . . . . . 33 . Chal lenge Requ i r ing an Ef fo r t to Ach ieve Cos t
Ef fec t iveness . . . . . . . . . . . . . . . . . . . . . . . . . . . . . . . . . . . . . . . . . . . . . . . . . . . . . . . . . 44 . Clar i fy ing the Mechan i sm o f C l ima te Change . . . . . . . . . . . 5
C h a p t e r 2 . Progress o f Internat ional Negot ia t ions Concern ing the Uni ted Nat ions Framework Convent ion on Cl imate Change and the Kyoto Protocol . . . . . . . . . . . . . . . . . . 8
1 . Accumula t ing Sc ien t i f i c Knowledge whi le Negot ia t ing on the Conven t ion and the Pro toco l . . . . . . . . . . . . . . . . . . . . . . . . . . 8
2 . F r o m the F ramework Conven t ion to the Lega l ly B ind ing P ro toco l . . . . . . . . . . . . . . . . . . . . . . . . . . . . . . . . . . . . . . . . . . . . . . . . . . . . 93 . Numer ica l Targe ts Agreed wi thout Ca lcu la t ion
Fo rmula . . . . . . . . . . . . . . . . . . . . . . . . . . . . . . . . . . . . . . . . . . . . . . . . . . . . . . . . . . . . . . . 1 04 . Deve lop ing Coun t r i e s ’ Pa r t i c ipa t ion . . . . . . . . . . . . . . . . . . . . . . 1 45 . Uni ted S ta t e s ’ Announcement o f Withdrawal and the Marrake c h Accords . . . . . . . . . . . . . . . . . . . . . . . . . . . . . . . . . . . 1 56 . Discuss ions on the Framework beyond 2 0 1 2 . . . . . . . . . . . 1 7
C h a p t e r 3 . Character i s t i cs o f the Kyoto Protoco l . . . . . . . . . . 2 01 . Kyoto P ro toco l Current ly Deal ing wi th . . . . . . . . . . . . . . . . . . . . . . Approx imate ly One-Thi rd o f t he Wor ld ' s Greenhouse Gas Emiss ions . . . . . . . . . . . . . . . . . . . . . . . . . . . . . . . . . . . . . . . . . . . . . . . . . . . . . . 2 02 . Commi tmen t to Reduce To ta l Amount o f Emiss ions
by Coun t r i e s . . . . . . . . . . . . . . . . . . . . . . . . . . . . . . . . . . . . . . . . . . . . . . . . . . . . . . . . 2 33 . Fac to rs Concern ing Numer ica l Targe t s . . . . . . . . . . . . . . . . . . . 2 4
( 1 ) Dif fe rences in the Re la t ive Di f f i cu l ty o f Accompl i sh ing Reduc t ion Targe t s . . . . . . . . . . . . . . . . . . . . . . . . . 2 4( 2 ) Base Year . . . . . . . . . . . . . . . . . . . . . . . . . . . . . . . . . . . . . . . . . . . . . . . . . . . . . . . . . . . . 2 6

( 3 ) EU's Jo in t Fu l f i l lment . . . . . . . . . . . . . . . . . . . . . . . . . . . . . . . . . . . . . . . . . . 2 8( 4 ) Pena l t i e s fo r Non-compl iance . . . . . . . . . . . . . . . . . . . . . . . . . . . . . . . 2 9
Chapter 4 . GHG Emiss ions and the W o r l d Energy Demand and Supply S t r u c t u r e . . . . . . . . . . . . . . . . . . . . . . . . . . . . . . . . . . . . 3 3
1 . Trend o f GHG Emiss ion in Deve loped Co u n t r i e s . . . . . 3 3( 1 ) Large Gap in the Rooms o f Emiss ion Reduc t ion among Coun t r i e s . . . . . . . . . . . . . . . . . . . . . . . . . . . . . . . . . . . . . . . . . . . . . . . . . 3 3( 2 ) Emiss ion Reduc t ions by Fac to r s Othe r Than C l ima te Measu res . . . . . . . . . . . . . . . . . . . . . . . . . . . . . . . . . . . . . . . . . . . . . . . . 3 6( 3 ) Issue Common to Coun t r i e s : Inc reased Energy Consumpt ion in Transpor ta t ion a n d Res iden t ia l Sec to r s . . . . . . . . . . . . . . . . . . . . . . . . . . . . . . . . . . . . . . . . . . . . . . . . . . . . . . . . . . . . . . . 3 8
2 . Energy-der ived CO 2 Emiss ions in Developing Coun t r i e s . . . . . . . . . . . . . . . . . . . . . . . . . . . . . . . . . . . . . . . . . . . . . . . . . . . . . . . . . . . . . 3 9
( 1 ) Inc rease in Al l Sec to r s . . . . . . . . . . . . . . . . . . . . . . . . . . . . . . . . . . . . . . . . . 3 9(2 ) Po ten t i a l fo r S ign i f i can t Emiss ion Inc rease . . . . . . . . . . . . 4 0(3 ) No S imp le Dis t inc t ion be tween Developed and
Deve lop ing Coun t r i e s . . . . . . . . . . . . . . . . . . . . . . . . . . . . . . . . . . . . . . . . . . . 4 3
Chapter 5 .Perspect ives and Act ions to Construct a Future Sus ta inab le Framework . . . . . . . . . . . . . . . . . . . . . . . . . . . . . . . . . . . . . . . . . . . . . . . 5 0
1 . Four Fac to rs Concern ing the Globa l Warming P r o b l e m . . . . . . . . . . . . . . . . . . . . . . . . . . . . . . . . . . . . . . . . . . . . . . . . . . . . . . . . . . . . . . . 5 0
( 1 ) Need fo r a Technolog ica l Break throughs . . . . . . . . . . . . . . . . 5 0( 2 ) Divers i f i ed Agenda in Each Nat ion , Reg ion and s e c t o r . . . . . . . . . . . . . . . . . . . . . . . . . . . . . . . . . . . . . . . . . . . . . . . . . . . . . . . . . . . . . . . . . 5 0( 3 ) Tremendous Globa l Cos t . . . . . . . . . . . . . . . . . . . . . . . . . . . . . . . . . . . . . . . 5 0( 4 ) Sc ien t i f i c Uncer ta in t i e s Remain . . . . . . . . . . . . . . . . . . . . . . . . . . . . 5 1
2 . Four Bas ic Concep t s fo r a Sus ta inab le F ramework. . . 5 2 ( 1 ) Focus on Technolog ica l So lu t ions . . . . . . . . . . . . . . . . . . . . . . . . . 5 2 (2 ) S imul taneous Ach ievement o f Ef fec t iveness , E f f i c i enc ies and Equ i ty . . . . . . . . . . . . . . . . . . . . . . . . . . . . . . . . . . . . . . . . 5 2 ( i ) Need to cover the mos t o f g loba l emiss ions . . . . . . . . . 5 2 ( i i ) Pu r su i t o f cos t - e f f ec t iveness . . . . . . . . . . . . . . . . . . . . . . . . . . . . . . . 5 3 ( i i i) Ra t iona le . . . . . . . . . . . . . . . . . . . . . . . . . . . . . . . . . . . . . . . . . . . . . . . . . . . . . . . . . 5 3
( 3 ) Cont r ibu t ion bo th to Economy and Envi ronment . . . . . 5 3 (4 ) Mul t i -S takeho lde r Pa r t i c ipa t ion and va r ious fo rms

o f commi tmen t s . . . . . . . . . . . . . . . . . . . . . . . . . . . . . . . . . . . . . . . . . . . . . . . . . . . 5 3 ( i )Mul t i -S takeholder par t i c ipa t ion involv ing gove rnmen t s , i ndus t r i e s , NGOs, and Ind iv idua ls . . . 5 3 ( i i ) Var ious forms of commitments . . . . . . . . . . . . . . . . . . . . . . . . . . . 5 4
3 . Act ions fo r Cons t ruc t ing a Fu ture Sus ta inab le F ramework . . . . . . . . . . . . . . . . . . . . . . . . . . . . . . . . . . . . . . . . . . . . . . . . . . . . . . . . . . . . . 5 6
( 1 ) Mul t i -Face t Approach. . . . . . . . . . . . . . . . . . . . . . . . . . . . . . . . . . . . . . . . . . . 5 6( 2 ) Major Emit te rs In i t ia t ive . . . . . . . . . . . . . . . . . . . . . . . . . . . . . . . . . . . . . . 5 7
Conc lus ion . . . . . . . . . . . . . . . . . . . . . . . . . . . . . . . . . . . . . . . . . . . . . . . . . . . . . . . . . . . . . . . . . . . . 5 9

1
Introduction ( 1 ) Background o f Discuss ions at the Subcommittee
The climate change problem is a globally essential issue that mustbe addressed in the long term. Countries of the world have exerted effortsto create an international framework designed to cope with the climatechange problem. These efforts have culminated in the United NationsFramework Convention on Climate Change and the Kyoto Protocol underthis convention. The international community is now waiting to put theKyoto Protocol into force. It is very difficult for Japan to achieve theemission reduction target stipulated in the Kyoto Protocol, which is a 6%reduction compared with the 1990 level, because Japan has alreadyachieved high energy efficiency. Despite that difficulty, Japan will makethe utmost efforts to implement various measures steadily under the new“Climate Change Policy Program” in a step-by-step approach. However, theKyoto Protocol confines itself to specifying the targets pursued bydeveloped countries to reduce emissions of greenhouse gases until 2012.The Protocol represents an important first step toward long-term efforts tosolve the problem.
The United States, the world’s largest greenhouse gas emitter, hasannounced its intention not to ratify the Kyoto Protocol. Meanwhile,developing countries’ CO2 emissions are rapidly increasing and areprojected to exceed those of developed countries. Still, the Kyoto Protocoldoes not obligate developing countries to cut emissions of greenhouse gases.Accordingly, a truly meaningful framework for solving the climate changeproblem must be created.
The Kyoto Protocol mandates commencement of discussion about thenext commitment period by the end of 2005. With this in mind, researchand discussions have already started in various circles. At the 8thConference of the Parties to the United Nations Framework Convention onClimate Change (COP8) held in 2002 in New Delhi, India, participantsfocused on whether discussion on a framework after 2013 should becommenced or not. However, the disparity in positions amongparticipating countries was so significant that the conference came short ofdrawing a forward-looking conclusion. Overcoming considerabledifferences in views among the Parties that became apparent at the COP 8seems not to be an easy task.

2
In order to iron out these differences in viewpoints and build aneffective framework involving the United States and developing countries,flexible, creative and innovative ideas are needed. While reviewing theresults and lessons learned from the series of international negotiationsleading to the Kyoto Protocol, active discussions should take place aboutwhat factors must be given weight in proceeding to the next step and whatactions are needed to move ahead. And to expect fruitful results, suchdiscussions must be started early. Discussions at this subcommittee areaimed to bring forward a perspective from which a framework after 2013should be considered and to contribute to encouraging such discussions. (2)Discussions at the Subcommittee
Starting in October 2002, the Environmental Committee’s GlobalEnvironmental Subcommittee has been carefully studying a futureframework on climate change at its five sittings. While looking back onthe process of negotiations concerning the United Nations FrameworkConvention on Climate Change and the Kyoto Protocol, the subcommitteehas analyzed the actual situations in related countries from the viewpointof the energy demand and supply structure and cleared up the points thatshould be taken into account to construct a future framework on climatechange. The subcommittee invited the opinions of committee membersand experts specializing in international politics and international laws.
Based on these discussions, this subcommittee has drawn up thisInterim Report. International discussions and negotiations are yet tobegin and may take a considerable period of time. As a consequence, thissubcommittee’s discussions are expected to evolve as future negotiationsprogress. Therefore, this Interim Report represents a first step towardcreating active discussions and represents an interim summary of thesubcommittee’s views. This subcommittee hopes that the Interim Reportwill help arouse lively discussions and obtain diverse views and comments.

3
Chapter 1. Characteristics of the Global Warming Issue
In considering a framework on the global warming issue, clarifyingthe nature of the problem is the first and most important thing to do. Thefour essential characteristics of this issue are described below. 1.Global Public Goods
The atmospheric concentration of greenhouse gases is a globalpublic goods. As long as it is kept at an appropriate level, the earthmaintains its temperature within a certain range so that countries of theworld, their peoples and sebsequent generations can enjoy its benefit.From the economics point of view, it is difficult to exclude someone frombenefiting from the atmospheric concentration of greenhouse gases (non-exclusivity), and another person’s enjoying benefits does not alter the totalamount (non-competitiveness). Therefore, the atmospheric concentrationof greenhouse gases is typical public goods and, with its characteristic ofglobal stretch, it can be called the global public goods.
A country’s efforts to control global warming do not only serve theinterests of that country but also benefit all commons on the earth. In asense, such efforts have an altruistic aspect. In any attempt to encouragecountries of the world to participate in such efforts, such characteristics ofclimate measures should be taken into account.
As public goods may induce free-riding, leaving this problemunsolved will undermine the benefits to the commons, which leads todifficulty in keeping up the motivation of entities participating in theefforts, making the system fragile. Properly addressing this problem isessential in creating a framework that is sustainable for a long period oftime.
Furthermore, an appropriate approach is to take a facilitative,rather than strict, attitude toward countries that carry out measures forthe public goods (insiders). This is because priority must be given tocreating an environment that invites as many participants as possiblethrough facilitation of their burden-sharing acceptance. 2.Long-term Challenge Requiring a Technological Breakthrough
It is such a long-standing challenge that it takes several generationsto see the impact of anthropogenic greenhouse gas emissions becomingmore acute on a global scale. A significant proportion of the global

4
warming problem is caused by the emissions of CO2 produced by thecombustion of fossil fuel. However, viable alternative technologies capableof extracting and sequestrating CO2 from flue gases have not yet beendeveloped. And energy sources capable of completely replacing fossil fuels,or technologies capable of achieving more radical energy conservation thannow are yet to be developed.
Since countries’ economic growth, development and the use ofenergy are closely related to one another, the development of alternativetechnologies is ultimately essential in reconciling the climate measureswith economic growth and development. Efforts to cope with globalwarming must promote the development and diffusion of such technologiesas well as diffusion of existing technologies, and must be advanced fromthe long-term perspective, with due consideration to the lead time neededfor the development and diffusion of such technologies. 3.Challenge Requiring an Effort to Achieve Cost Effectiveness
Since sources of greenhouse gas emissions are very diverse, simplyregulating specific entities’ specific activities in certain countries andregions is not a satisfactory solution to deal with the climate changeproblem. Instead, wide-ranging economic activities should be dealt withthrough a wide variety of measures suitable for various countries, regionsor sectors. Reflecting a difference in the energy supply and demandstructure, the marginal costs of greenhouse gas reductions differ greatlyfrom country to country, from region to region, or from sector to sector.
The issue has such a magnitude that the world as a whole will berequired to bear tremendous costs to carry out these countermeasures. Inthis case, how to choose cost effective approaches from among variousoptions is a key question that must be answered in order to prevent globalwarming in a more effective manner.
In regard to this discussion, developing countries which are believedto incur relatively lower marginal costs of greenhouse gas reductions maycontend that consideration should be given to countries’ cost-bearingcapacities. It will be necessary to understand that the developingcountries attach high priority to economic development. It must berecognized that in developing countries, capacity for cost-bearing changesin accordance with development stage.
In shaping a future framework, the first priority is to address thequestion of how we can meet the need for protection of the global

5
environment as cost-effectively as possible while giving consideration todeveloping countries’ arguments about a difference in cost-bearingcapacities.
Moreover, the cost of climate measures is a factor that may have alarge impact on the modality of economic activities for country/sector. Andthis factor also affects conditions for competitiveness in the internationalmarketplace. One of the prerequisites to maintaining countries’motivation to participate in such efforts is to ensure that the perspective ofequity will be adequately incorporated in climate measures so as tominimize the impact on conditions for international competition. 4.Clarifying the Mechanism of Climate Change
Gases such as CO2, methane, nitrous oxide, and F-gases (e.g.hydrofluorocarbons) have the effect of preventing heat from escapingsurface of the earth into deep space, and as such, these gases are referredto as greenhouse gases. Scientific studies have revealed that the growingemissions of anthropogenically produced greenhouse gases have significantimpacts on the ecosystem, such as in the form of a rise in sea andtemperature levels, as well as on the economic and social activities ofhuman beings. In the meantime, the Intergovernmental Panel onClimate Change ’s (IPCC) Third Assessment Report in 2002 projects thatthe impact of global warming in 2100 will raise the earth’s temperature by1.4 celsius degrees to 5.8 celsius degrees and result in a sea-level rise of 9cm to 88 cm, thus providing a wide range of estimates (Table 1). A studyis in progress to look into what kinds of human activities would have whichkind of impact, and what the future of the earth would be like.
In this assessment, as several assumptions were used in regard tothe population growth rate and the economic growth rate, the number ofemission scenarios has increased. And these scenarios showed asubstantial difference in estimates for the concentration of greenhousegases, its impact on climate, and the degree of sea-level rise. As a result,the Third Assessment Report presented a wider range of estimates thanthe Second Assessment Report.
An attempt at devising an international framework for the globalwarming issue must bear in mind that a projection about global warmingstill involves some uncertainties.

6
<Information Column>Comments by Major Countries on the Scope and Structure of the IPCC
Fourth Assessment Report (April 2003)The United States• We would first note the importance of addressing recent criticisms of the
emissions scenarios used in the Third Assessment Report (TAR).Failure to do so in an appropriate manner could raise legitimate doubtsabout the result of the AR4 effort, severely undermining the the
credibility not only of the AR4, but also of the IPCC itself.• Scenarios to be used in the Fourth Assessment Report should reflect
new knowledge regarding the potential importance of concerns such as
carbon-based aerosols and the need to reconsider particularassumptions regarding such factors as population and economic growth.
• We also urge that efforts be made to identify which scenarios are more
likely than others. Germany
• Scenarios (of socio-economic development, the resulting emissions, aswell as climate) need updating and further development.
• High priority should be given to the issue of uncertainties in the
sensitivity of the climate system. Australia
The process will need to• Consider developing a probability distribution around the IPCC
temperature range in order to increase understanding of the likely
extent of temperature rises.• Investigate further the possible impact that using purchasing power
parities rather than market exchange rates would have on the SRES
scenarios.• Assess whether probabilities can be attached to each scenario.

7
Table-1 Publication of IPCC Assessment Reports
Date of IPCC Assessment
Report
Publication
First Assessment Report
April 1990
Second Assessment Report
December 1995
Third Assessment Report
March 2001
CO2 concentration
(by 2100)
About 800ppm 750-1000ppm 540-970ppm
Surface temperature
(by 2100)
Up by about
3 celsius degrees
Up by 1.0-3.5
celsius degrees
Up by 1.4-5.8
celsius degrees
Sea level
(by 2100)
Rise by about 0.65m Rise by 0.13-0.94m Rise by 0.09-0.88m

8
With the characteristics of the global warming issue in mind, this chaptersummarizes the development of the current framework for tackling globalwarming. 1.Accumulating Scientific Knowledge while Negotiating on the Convention andthe Protocol
Much still remains to be scientifically resolved as to the climate changeproblem. Thus, efforts are continuing to accumulate scientific knowledge of thisphenomenon. On the other hand, out of belief that shaping an internationalframework after the accumulation of adequate scientific knowledge would be abelated effort, negotiations concerning the Convention and the Protocol proceededwith certain scientific uncertainties as a premise.
Right from the beginning, discussions about the climate change problemhave been preceded by scientific debates, and debates conducted among scientistssince the 1970s were taken over by policy-makers in the late 1980s, paving theway for negotiations on the Framework Convention. In these circumstances, theclimate change problem came to arouse considerable concern. Not just a matterof scientific interest, climate change became a matter of social and economicconcern.
On the other hand, the mechanism of global warming, the extent of theimpact of human activities, and a future image of the earth are yet to be fullyelucidated. Accordingly, while negotiations on the Framework Convention andthe Protocol are going on, scientists are exerting ceaseless efforts to shed light onthis phenomenon.
The Intergovernmental Panel on Climate Change (IPCC) was establishedin 1988 jointly by the United Nations Environment Program (UNEP) and theWorld Meteorological Organization (WMO) with a view to gaining scientificknowledge, studying the impact of climate change and working out measures tocope with this problem. The IPCC has been playing a central role in achievingsubsequent progress in the accumulation of scientific knowledge. Since itsinception, the IPCC has been studying climate change under three workinggroups: (1) Evaluation of Scientific Knowledge, (2) Assessment of Social andEconomic Impacts, and (3) Formulation of Measures to Cope with Climate
Chapter 2. Progress of International Negotiations Concerning theUnited Nations Framework Convention on Climate Change and theKyoto Protocol

9
Change, with continuous revisions of organizational structures.The IPCC has been submitting assessment reports almost every five
years and this activity has been exerting an influence on the progress ofnegotiations concerning the Convention and the Protocol. The 1990 IPCC FirstAssessment Report projected that by 2100, atmospheric temperature would rise
by around 3 celsius degrees and sea levels would go up by 65 cm. This reportwas presented at the negotiating table on the Convention. The 1995 SecondAssessment Report came up with the temperature rise estimates of 1.0-3.5
celsius degrees, giving a boost to negotiations on the Kyoto Protocol. The 2001Third Assessment Report, which was submitted prior to the Marrakech Accords,
forecast that atmospheric temperatures would soar by 1.4-5.8 celsius degrees.During this period, as mentioned earlier, diverse scenarios have been produced,providing rather a wider range of temperature rise projections. Projections ontemperature and sea levels are still diverging.
The IPCC is scheduled to come up with the next assessment report in2007. By that time, international negotiations on the next framework would bemore likely to have been activated and, consequently, the extent to which furtherscientific knowledge will have been accumulated before the next assessmentreport is submitted is expected to have significant influence on the outcome ofthese negotiations. In this respect, Japan’s contribution to the effort to enhancescientific knowledge is of vital importance.
2.From the Framework Convention to the Legally Binding Protocol
The process of structuring an international framework on climate changeproceeded from the Framework Convention, which formulates a common basis forcountries’ activities on this issue, to the Protocol, which provides for legallybinding numerical targets.
During discussions among policy-makers in the late 1980s, the necessityof forging an international framework was perceived. In 1990, the UnitedNations General Assembly formed an intergovernmental negotiating committeefor the Framework Convention on Climate Change, and this FrameworkConvention was adopted in 1992. In the course of discussions about theConvention, some maintained that legally binding greenhouse gas reductiontargets should be imposed. In the final outcome, however, legally bindingnumerical targets were not specified and, instead, the Convention requiredparticipating countries to take steps to reduce greenhouse gas emissions.
Subsequently, participating countries vehemently argued that the

10
Framework Convention alone would not be enough as an internationalframework and, consequently, specific gas reduction targets should be set forcountries to accomplish. As a result, the First Conference of the Parties to theUnited Nations Framework Convention on Climate Change (COP 1), held in 1995,agreed on commencing negotiations concerning the Protocol (the Berlin Mandate).After preliminary negotiations took place during the period from 1995 to 1997,the COP 3, held in Kyoto in 1997, adopted the Kyoto Protocol imposing legallybinding numerical targets on countries.
The flow of efforts concerning the climate change problem from theFramework Convention to the Protocol can be described as a progression fromsoft law to hard law. This process implies the analogy with the internationalcommunity’s experience regarding the ozone layer protection that was addressedprior to the climate change problem. In regard to the ozone layer protection,which started based on a scientific hypothesis in the 1970s, the ViennaConvention as a framework convention was adopted in 1985 and the MontrealProtocol providing for more specific commitments to be met by countries wasadopted in 1987. In subsequent years, the Montreal Protocol was revised on thebasis of scientific elucidation.
Nevertheless, a large difference between the ozone layer protection issueand the climate change problem is observed in terms of types of gases coveredand the range of regulations applied. Compared to greenhouse gases such ascarbon dioxide which are not easily managed since they are produced from anextremely wide range of sources, places where ozone-depleting substances areproduced are limited to chemical factories. From the technological point of view,alternative technologies --- so-called CFC substitutes --- were already developed,so that manufacturers were able to take measures to comply with regulations.It should be noted that the Montreal Protocol contains provisions to limit tradewith non-member nations, thereby providing a free-rider prevention mechanism.
3.Numerical Targets Agreed without Calculation Formula
Whether or not numerical targets should be imposed on participatingcountries was the central issue that had been consistently discussed sincenegotiations began concerning the Framework Convention.
In negotiations on the Framework Convention, although Europeancountries and Japan set their own voluntary targets in 1990, opinion was dividedon whether legally binding targets should be prescribed by the Convention.Eventually the Parties agreed that the greenhouse gas reduction targets would

11
not be mandatory but, instead, that taking policies and measures for thepurpose of reducing greenhouse gas emissions back to the 1990 levels by 2000would be mandatory.
Negotiations on the Kyoto Protocol were conducted to set numericaltargets for developed countries, based on the Berlin Mandate agreed upon at theFirst Conference of the Parties to the United Nations Framework Convention onClimate Change (COP 1).
Two-year negotiations among countries proceeded with difficulty.Behind this was the fact that parties were unable to discuss numerical targetsalone because the relative difficulty of accomplishing reduction targets wouldvary from country to country depending on the range of gases covered and thepossibility of introducing flexibility mechanisms to be adopted as the Kyotomechanisms.
Participating countries put forward various proposals on indicators to beconsidered in setting numerical targets. Japan, for example, proposed that percapita emissions be adopted as an option for target value or that a target value beset with due consideration for indicators such as per capita emissions, emissionsper GDP, or the population growth rate. By contrast, the European Union (EU)maintained that a 15% reduction rate should be adopted, emphasizing its mostproactive position on the global warming issue. At the same time, the EUinsisted that the so-called “EU bubble” should be establihed. The process duringthis period continued to draw a great deal of worldwide attention. Howcountries could demonstrate a positive attitude toward the issue became anessential factor in negotiations. < Parties’ Proposals on the Methods of Differentiating Quantified Targets>
From the early stages of Ad hoc Group on Berlin Mandate (AGBM)meetings, intensive discussion took place on the subject of quantifiedtargets, i.e. whether to adopt uniform reduction rates or to acceptdifferentiation depending on each country. After AGBM5, theParties actively submitted practical proposals.
(1) “Optional” method (Proposed by Japan at AGBM5)
Annex I countries need to select either of:(a) Average CO2 emission quantity shall be less than p Carbon
ton per capita for (2000 + x) year till (2000 + x + [5]) yearOr(b) Reduce average CO2 emission quantity by q % from the 1990

12
level for (2000 + x) year till (2000 + x + [5]) year
(2) Method “to discount the reduction rates from the unified standardreduction rate, using indexes” (Proposed by Japan at AGBM8) l As a chair country of the 3rd Conference of Parties, the Japanese
Government proposed 5% as the standard reduction rate, which couldbe used to determine each Annex-I Party’s reduction target, assumingthat the country would accept the conditions (i) to (iii) stated below.(Base year 1990, and target period 2008 to 2012)
(i) The greenhouse gases subject to this proposal shall include CO2,
methane and nitrous oxide.(ii) The quantified targets here presently embrace some unpredictable
uncertainties, depending on technological innovation, energysituation, and industrial structure changes in the future.Therefore, the articles on compliance need to contain a certain levelof flexibility. The said flexibility shall be expressively stipulated ina protocol or any other legal documents.
(iii) Each party’s target shall be differentiated depending on perGDP emissions, per capita emissions, and population growth.The parties fulfilling the following conditions can apply any ofthe differentiated reduction rates stated below:(a) The emissions per GDP (A) of a Party in 1990 were less than the
emissions per GDP (B) of all Annex I countries in 1990: Reduction rate (%) = 5% x (A/B)
(b) Per capita emissions (C) of a Party in 1990 were less than the percapita emissions (D) of Annex I countries in 1990: Reduction rate (%) = 5% X (C/D)
(c) For countries that had population growth rates during the period1990 to 1995 greater than the average rate of all Annex Icountries for the same period, consideration shall be taken ofsuch higher rate of population growth when deciding eachParty’s target,. The practical method of determining areduction rate is to be established later .
l Banking, borrowing, emission trading, and joint implementation
should be adopted under certain conditions. l The total emission volume of the second budget period shall not exceed
the total emission volume of the first budget period. A more precisedifferentiation method shall be applied to the second budget period.
(3) System of “standard reduction rate + additional reduction commitment”

13
(Proposed by Hungary and other countries at AGBM5)
Each Party is to commit to the stabilization, and to notify (commit)additional reduction quantity
(4) Method of “differentiating target values using indexes” (Proposed bymany countries mainly at AGBM5) l 3 indexes of emissions per GDP, per capita emissions, and per capita
GDP (Norway)l 4 indexes of emissions per GDP, per capita emissions, per capita GDP,
and the share of renewable energies in consumption (Iceland)l 5 indexes of projected population growth, forecast on the growth of per
capita GDP, intensities of emissions against GDP, intensities ofemissions against exports, and intensities of fossil fuels against exports(Australia)
l Relative contribution to the increase of GHG atmosphericconcentration (historical emissions) (Brazil)
l Per capita emissions (France and Switzerland) (5) Method of “each party to commit for greater emission reduction in thenext term” (New Zealand at AGBM5) l Each party to commit to a certain reduction rate, with the next term to
have greater reduction than the previous term. (6) Method “to distribute after deciding the overall tolerance” (Netherlandsat AGBM3)
Safe Emission Corridor method, i.e. to determine the overalltolerance of total emissions from all developed countries, then todecide the emission quantity allowed for each developed countryParty.
(7) “Universal Bubble” method (Russia at AGBM8+)
Each Party to propose own individual reduction target, then adoptthe sum of individual targets as a collective target.
(8) Method “to list each Party’s target value” (At COP3)
List the negotiation result of each Party's target.
Before COP3, USA maintained its support for the uniformreduction rate. Their proposal at AGBM8 was as follows:

14
(1) Designate 2008-2012 as the first budget period, and determinethe fixed rate of reduction from the 1990 level during thatperiod. From the second budget period, emissions shall start togo below the 1990 level.
(2) Apply the uniform reduction rate. Target every greenhouse gasincluding fluorocarbon alternatives.
(3) Utilize flexibility mechanisms such as emissions trading, jointimplementation, and others including the net method.
(4)Seek developing country participation through the evolutionsystem (for future participation) and the voluntary commitment bydeveloping countries.
Eventually, negotiations failed to find any formula on whichcountries would agree. At the time when the COP3 commenced,participating countries were significantly divided in regard to reductiontargets. As a result of a compromise reached at the last minute of thenearly two-week session, countries finally agreed on numerical targets.Nevertheless, reduction targets imposed on Japan, the United States andthe EU - 6%, 7% and 8% - fell short of a scientific and objective basis ofcalculation. Furthermore, Russia, whose emissions already fellsubstantially below the 1990 level at the time of the agreement, was toaccomplish a reduction target of ±0 %, meaning that the country gained anenormous surplus quota.
Moreover, the agreement resulted in stirring up an argument fromthe perspective of the equitable principle since it required countries to bearsignificantly different costs of achieving reduction targets. 4.Developing Countries’ Participation
The contention that all participating countries should reducegreenhouse gas emissions was taken up whenever the opportunity arose ---when the Framework Convention was formulated, when the BerlinMandate was drawn up, and when the Kyoto Protocol was formed.However, countries have not reached an agreement yet on developingcountries’ meaningful participation.
In the course of formulating the Framework Convention, the secondintergovernmental negotiating committee took up a proposal to require allparticipating countries to commit themselves to achieve emissionsreduction, but in a relatively early stage the convention imposed a generalobligation on all participating countries, including developing countries, to
15
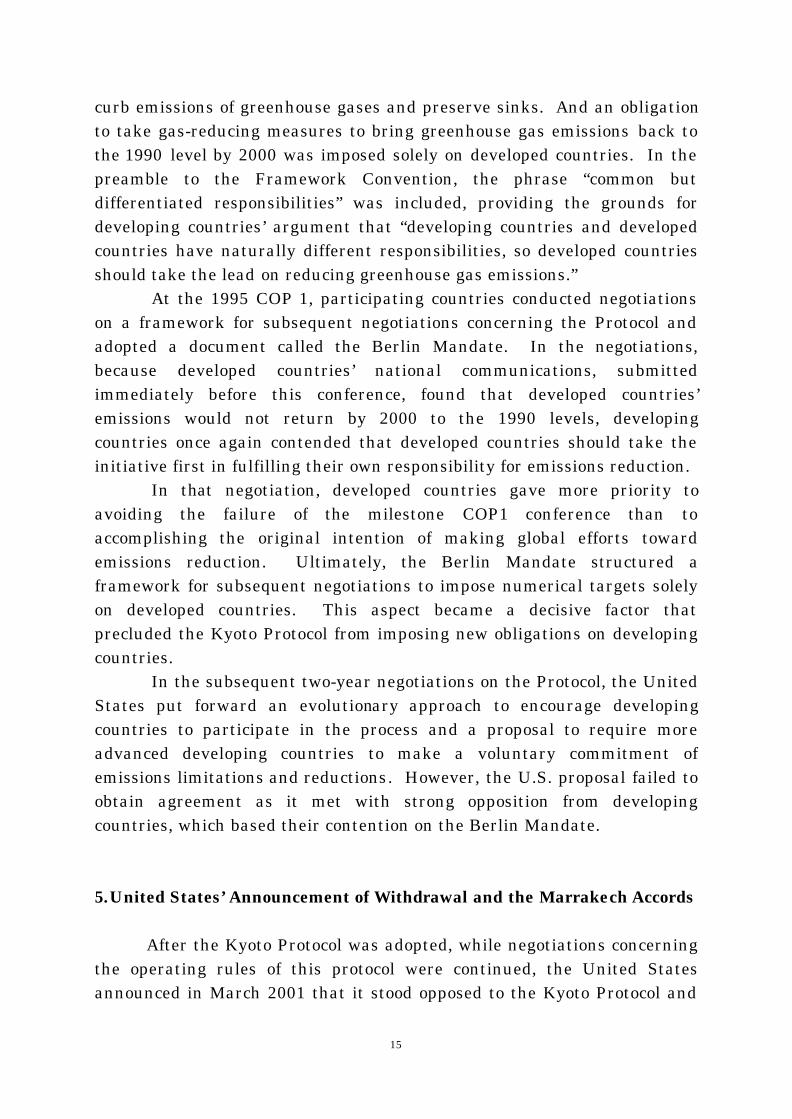
curb emissions of greenhouse gases and preserve sinks. And an obligationto take gas-reducing measures to bring greenhouse gas emissions back tothe 1990 level by 2000 was imposed solely on developed countries. In thepreamble to the Framework Convention, the phrase “common butdifferentiated responsibilities” was included, providing the grounds fordeveloping countries’ argument that “developing countries and developedcountries have naturally different responsibilities, so developed countriesshould take the lead on reducing greenhouse gas emissions.”
At the 1995 COP 1, participating countries conducted negotiationson a framework for subsequent negotiations concerning the Protocol andadopted a document called the Berlin Mandate. In the negotiations,because developed countries’ national communications, submittedimmediately before this conference, found that developed countries’emissions would not return by 2000 to the 1990 levels, developingcountries once again contended that developed countries should take theinitiative first in fulfilling their own responsibility for emissions reduction.
In that negotiation, developed countries gave more priority toavoiding the failure of the milestone COP1 conference than toaccomplishing the original intention of making global efforts towardemissions reduction. Ultimately, the Berlin Mandate structured aframework for subsequent negotiations to impose numerical targets solelyon developed countries. This aspect became a decisive factor thatprecluded the Kyoto Protocol from imposing new obligations on developingcountries.
In the subsequent two-year negotiations on the Protocol, the UnitedStates put forward an evolutionary approach to encourage developingcountries to participate in the process and a proposal to require moreadvanced developing countries to make a voluntary commitment ofemissions limitations and reductions. However, the U.S. proposal failed toobtain agreement as it met with strong opposition from developingcountries, which based their contention on the Berlin Mandate. 5.United States’ Announcement of Withdrawal and the Marrakech Accords
After the Kyoto Protocol was adopted, while negotiations concerningthe operating rules of this protocol were continued, the United Statesannounced in March 2001 that it stood opposed to the Kyoto Protocol and

16
had no intention of ratifying it.The United States explained the reason for its withdrawal as being
that the targets under the Kyoto Protocol would have a negative impact onthe U.S. economy and that developing countries did not take part incommitments for emissions reduction. In fact, this explanation had beenused as the condition for unacceptability to the United States in the Byrd-Hagel resolution that the U.S. Senate unanimously adopted in July 1997, 5months before the COP 3. Considering that the United States’ ratificationof this protocol will require an affirmative vote of the Senate majority oftwo-thirds, it seems that the Byrd-Hagel resolution carried a considerableweight just at the time when COP 3 negotiations commenced. Because ofsuch a resolution, at the time when the Kyoto Protocol was agreed upon, itwas predicted that the US ratification would encounter difficulties.
In February 2002, President Bush announced the “U.S. ClimateChange Strategy: A New Approach.” This initiative set the GDP intensitytarget, which is to reduce the emission per GDP by 18% by 2012 comparedwith 2002. Even if the US meets the target, emissions in 2012 areestimated to reach 32% above the 1990 level and thus a 39% differencecompared with the Kyoto Protocol target (-7%)(Fig.1). Fig.1 US GHG Emissions Trend and Outlook
Note: Emissions in 2002 and 2012 are estimated by METI using real GDP forecast at 2001
prices.
Kyoto Target-7%
38% up
32% up
(compared with 1990)
39% Differencewith KyotoProtocol
18401879
1648
1400
1600
1800
2000
2200
Million tons of Carbon
1990 1999 2002 2012
Current measures <2002 2012Intensity improves 14%>
Additional measures<2002 2012Intensity improve 18%>

17
After the United States announced its withdrawal from the KyotoProtocol in 2001, Australia also announced its policy of not ratifying theProtocol.
In these circumstances, negotiations on the operating rules of theKyoto Protocol continued and COP 6 bis in June 2001 reached a politicalagreement on the core issues (the Bonn Agreement). At the COP 7 inNovember of the same year, the operating rules were nearly completed (theMarrakech Accords). The United States was represented at theconferences where these agreements were reached, but it virtually did notparticipate in the negotiations.
In the negotiations concerning the operating rules in Marrakech,one of the principal focuses was the handling of sinks, such as forests. Inthe COP 3 negotiations on the Kyoto Protocol, when the inclusion of forestsand other sinks was allowed, Japan initially estimated that sinks wouldabsorb approximately 3.7% of its greenhouse gas emissions and, based onthis estimate, accepted achieving a 6% reduction target. Later on, the EUproposed handling forests and other sinks in a limited manner, coming intohard negotiation with Japan and other countries maintaining that makingthe most of forests and other sinks would be indispensable for achievingreduction targets under the Protocol. Participating countries also devotedconsiderable discussions to other issues, such as how flexibly the Kyotomechanisms would be used and what (compliance) measures should betaken in the event of failure to achieve targets.
The completion of the operating rules paved the way for ratificationby countries of the Protocol. So far, more than 100 countries, includingJapan, have ratified the Kyoto Protocol. 6.Discussions on the Framework beyond 2012
The Kyoto Protocol stipulate that consideration on a commitmentbeyond 2012 should begin by the end of 2005.
At the Eighth Conference of the Parties to the United NationsFramework Convention on Climate Change (COP 8) held in October toNovember 2002, the focus was whether discussion on a framework beyond2012 should begin early. Such parties as Japan, Canada, Norway and theEU argued for agreement on the early commencement of discussion, butdeveloping countries came out against it, adhering to their position thatthey would not accept any argument obligating them to cut greenhouse gas

18
emissions. The United States took a stance that it would not assume anyposition on a future framework and would not approve the commencementof discussion on it. Thus, while participating countries were sharplydivided in opinion, the Delhi Declaration was adopted. In regard to afuture framework, the Delhi Declaration states that: (1) Recognizing with concern the f indings of the IPCC Third
Assessment Report , which conf irm that s ignif icant cuts inglobal emissions wil l be necessary to meet the ult imateobject ive o f the Convent ion,
(2) Noting that mit igat ion act ions are now taking place bothin Annex I and non-Annex I countr ies and emphasizingthat mit igation of greenhouse gas emissions to combatcl imate change continues to have high priority under theprovis ions of the Convention,
(3) Part ies should promote informal exchange of informationon act ions relat ing to mit igation and adaptation to assistPart ies to continue to develop ef fect ive and appropriateresponses to c l imate change ;
The above statements were the product of a compromise reached on
the premise of the aforementioned differences in opinion. No agreementwas reached on the commencement of discussion on a future framework.In this process, Japan has consistently been insisting on establishing “acommon rule in which all countries, including the United States anddeveloping countries, participate”. This is because Japan attachesimportance to laying down truly desirable rules for the protection of theglobal environment as an essential element to be incorporated in a futureframework.
(Opinions at the Committee)Ø In the negotiations on transboundary pollution (acid rain) conducted in
Europe between the 1970s and the 1980s as well, diplomatic pressurerarely reinforced a country’s internal administration.
Ø International laws in the environmental field undergo a transitionfrom soft law to hard law and the rules of the game must be changed inorder to get back to soft law.
Ø The Kyoto Protocol set reduction targets because the progress of globalwarming was obvious. The problem will remain unsolved for ten or

19
twenty years ahead unless we carry this momentum to real action.Ø At the COP 8, the United States and developing countries
demonstrated a negative opinion on negotiations for structuring afuture framework. Participation of the United States, China, andIndia in a future framework is imperative.
Ø The United States would not take part in a framework during thesecond commitment period that is an extension of the Kyoto Protocol.
Ø A framework after 2013 must be presented before 2005, the time limitfor commencement of negotiations during the second commitmentperiod under the Kyoto Protocol.
Ø An alternative framework in which the United States and developingcountries would accept to participate must be presented.

20
Chapter 3 Characteristics of the Kyoto Protocol
In reviewing what the framework ought to be in the future,important clues are provided by looking into some aspects of the KyotoProtocol. This chapter discusses three points that should be borne inmind regarding the Kyoto Protocol from such a point of view. 1. Kyoto Protocol Currently Dealing with Approximately One-Third of the
World's Greenhouse Gas Emissions
One of the most important characteristics of the Kyoto Protocoladopted by the 3rd Conference of the Parties to the United NationsFramework Convention on Climate Change (COP3) in 1997 is the fact thatit set legally binding numerical targets for emissions of greenhouse gasesby developed countries. The protocol has become the first bindingframework to reduce emissions of the world's greenhouse gases. Underthe target prescribed by the protocol, the developed countries involved arerequired to reduce their emissions by 5.2% on average from the 1990 levelbetween 2008 and 2012.
In March 2001, however, the U.S. expressed its intention of notparticipating in this framework. Then, Australia followed suit.
Among the countries in the world, greenhouse gas emissions aresubstantially increasing in developing countries. CO2 emissions indeveloping countries are expected to account for half of the world's totalCO2 emissions (Fig.2). As the Kyoto Protocol has accepted the insistenceof developing countries, which have concerns on possible restraint on theirdevelopment and growth, developing countries are not committed to reducetheir emissions. The U.S. is the largest country for emissions, accountingfor about one-fourth of the world's total emissions, and its emissions havestill been increasing in recent years (Fig.4).

21
Fig.2 Prospects for the World's CO2 Emissions
Breaking down greenhouse gas emissions by country, neither the
U.S. (ranked first), China (ranked second), nor India (ranked fifth) iscommitted to the emission reduction target prescribed by the KyotoProtocol. Russia (ranked third) is required by the Kyoto Protocol to keepits emissions at plus or minus 0% from the 1990 level. But as its presentemissions are far lower than the 1990 level because of the impact of theeconomic situatation in the first half of the 1990s, Russia now has largeamounts of surplus allowances. Russia can be described as not beingcommitted to any reduction target in an actual sense.
Now, among the top countries that account for about half of theworld's total emissions (the countries placed in the right half of the piegraph below), Japan (ranked fourth) is the only country that has expressedits willingness to fulfill the emission reduction commitment prescribed bythe Kyoto Protocol. Bearing a heavy burden of achieving its reductiontarget, Japan is playing a leading role to establish and implement thisframework.
Annex I countries
Annex I Parties: the countries listed in the Annex I of the Framework Convention on Climate Change (advanced countries + CEIT). Under the Kyoto Protocol, the countries listed in
the annex are committed to reducing their greenhouse gas emissions.
Annex I countries
3547
2567 2834
2097
4886
0
2000
4000
6000
8000
10000
12000
(44%)
(24%)
(32%)
(50%)
(21%)
(29%)
(100%)
(100%)
If efforts are limited toJapan, Canada and Europe
Million tons of carbon
20202010
Except US and Aust. Except US and Aust.
US & Aust.US & Aust.
Annex I countries
Non-Annex I countries
Non-Annex I countries
The emissions released in developing countries are expected to account for half of the world's
total CO2 emissions.
(Source: Third Assessment Report of IPCC)

22
Fig.3 The World's Energy-Related CO2 Emissions
Source: IEA/OECD, CO2 Emissions from Fuel Combustion
Fig.4 CO2 Emissions in the U.S.
Source: OECD/IEA CO2 Emissions from Fuel Combustion
Canada
2%
Korea2%
UK2%
Germany
3%India
4%
Russia6%
Japan5%
Italy
2%
France2%
Mexico2%
China13%
others33%
Canada2%
Korea2%
UK2%
Germany3%
India4%
Russia6%
Japan5%
Italy2%
France2%
Mexico2%
US24%
4200
4400
4600
4800
5000
5200
5400
5600
5800
1990 1991 1992 1993 1994 1995 1996 1997 1998 1999 2000
Mil
lion
ton
s of
CO
2
17.8% upfrom '90
Source: IEA/OECD, CO2 Emissions from Fuel Combustion

23
Excluding the U.S. and Australia from the developed countries thatare mandated by the Kyoto Protocol to reduce their emissions, theemissions of the remaining developed countries account for only 35% of theworld's total emissions in 1990 as the base year. According to IPCC'sprospects, the share of emissions of these countries will continue todecrease even in a BAU case, and reach about 29% in 2020 (Fig.2)
To prevent global warming in the future, it is indeed important toreduce the emissions in countries other than the developed countries thatare committed to reduce their emissions under the Protocol. The KyotoProtocol has not covered the areas where emissions are expected tosignificantly increase and have a great impact on the progress of globalwarming in the future. 2. Commitment to Reduce Total Amount of Emissions by Countries
The Kyoto Protocol has included the total amount of greenhouse gasemissions by countries in its legally binding commitment. Needless to say,greenhouse gases are emitted from a variety of economic activities as wellas in everybody's daily life and the commitment should be met throughvoluntary and positive action by all, in accordance with their fairresponsibilities. The government, as one stakeholder, plays the role ofmaking basic and comprehensive policies and implementing them. Inorder to keep the total amount of emissions within a certain range, thegovernment may adopt strong restrictions on people’s broad economicactivities and daily lives, but such restrictions have a limit. Technicallyspeaking, of course, it is possible to achieve the reduction target throughinternational emissions trading for a certain period after the completion ofthe first commitment period. However, this is merely an ex post factomeasure for adjustment, and is not an essential factor of the reductioncommitment.
This is a unique example among international laws. Originally,most international laws define their commitments as certain "acts" thatcan be realized responsibly by the government that ratified the relevantinternational law. The Kyoto Protocol, on the other hand, defines itscommitment as "maintenance of certain status." In essence, its natureis realized by an integrated whole of economic activities, daily life, etc., andit has a limit that can be controlled by the government (government reach),if a market economy is a precondition.

24
As an alternative concept, it may be conceivable to select anapproach that accumulates elements of various acts and policies in eachsector, which are required to reduce greenhouse gas emissions. The KyotoProtocol selected an agreement on total amount of emissions by countries,while other treaties on environment such as the Montreal Protocol adopteddifferent approaches. Emission targets by countries are not necessarilythe only option in theory. 3. Factors Concerning Numerical Targets (1) Dif ferences in the Relative Dif f iculty of AccomplishingReduct ion Targets
According to the reduction targets prescribed by the Kyoto Protocolfor developed countries, the target of Japan is set at -6%, the U.S. at -7%,the EU at -8%, Canada at -6%, Russia at ±0%, and Australia at +8%. Thenumerical values of targets vary from country to country (Table 2).
Such relative difficulty of accomplishing reduction targets dependslargely on the energy-saving level that each country has already achieved.Japan has already achieved the world's highest level of energy efficiency.So, it is not at all easy for Japan to further reduce its emissions from thepresent level. Therefore, analyses show that Japan's reduction costswould be higher than costs in other countries. On the other hand, in thecountries where energy-saving levels are not comparatively high, there issignificant room for investment in energy conservation at relatively lowcosts. According to IPCC's analyses, there is also a wide range ofvariation in respect of how many additional measures are required toaccomplish reduction targets in consideration of the reality in each country,and the relative difficulty of accomplishing reduction targets varies widelyfrom country to country. It is pointed out that Japan's cost ofaccomplishing a reduction target is the highest among major developedcountries (Fig. 5).
Russia, on the other hand, has already been given a large amount ofsurplus allowances. It is deemed almost certain that Russia wouldaccomplish its numerical target without any special measures. It ispredicted that Russia will sell its surplus allowances to other countries.
Essentially, to promote the world's measures against global warmingin the most efficient manner, such measures have to be promoted in a waythat allows the marginal reduction costs to be equal. However, each

25
country's reduction target that was agreed upon in the process of workingout the Kyoto Protocol has not sufficiently allowed for such a point of view.
Such differences in the relative difficulty of accomplishing reductiontargets could be a factor that provokes arguments in terms of equity.
Table 2 Kyoto Protocol Annex B
Target EU Target Target TargetEC -8 EIT OthersPortugal -8 27 Ukraine 0 Iceland 10Greece -8 25 Russia 0 Australia 8Spain -8 15 Croatia -5 Norway 1Ireland -8 13 Hungary -6 NZ 0Sweden -8 4 Poland -6 Canada -6Finland -8 0 Bulgaria -8 Japan -6France -8 0 Czech -8 USA -7Netherlands -8 -6 Estonia -8 Monaco -8Italy -8 -6.5 Latvia -8 Switzerland -8Belgium -8 -7.5 Lithuania -8 Liechtenstein -8UK -8 -12.5 Romania -8Austria -8 -13 Slovakia -8Denmark -8 -21 Slovenia -8Germany -8 -21Luxembourg -8 -28

26
Fig. 5 Cost calculation for each country to achieve reduction target
Note: The vertical arrows represent the span of two or more trial calculations. The figures such as 400, 300 and 200 represent the average
values of various trial calculations.
(2) Base Year
It is pointed out that the differences mentioned above are attributable to the factthat the Kyoto Protocol has adopted the year 1990 as the base year of reduction targets.In considering the changes in the emissions of the world's greenhouse gases, the year1990 has special characteristics.
First, the economic activities in Russia and Eastern Europe remained sluggishin the first half of the 1990s due to the transition process from a planned economy to amarket economy. During this period, their greenhouse gas emissions drasticallydecreased (Fig. 6). The fact that emissions in 1990, before such a decrease took place,were adopted as the base year resulted in Russia and Eastern Europe being providedwith a large amount of surplus allowances.
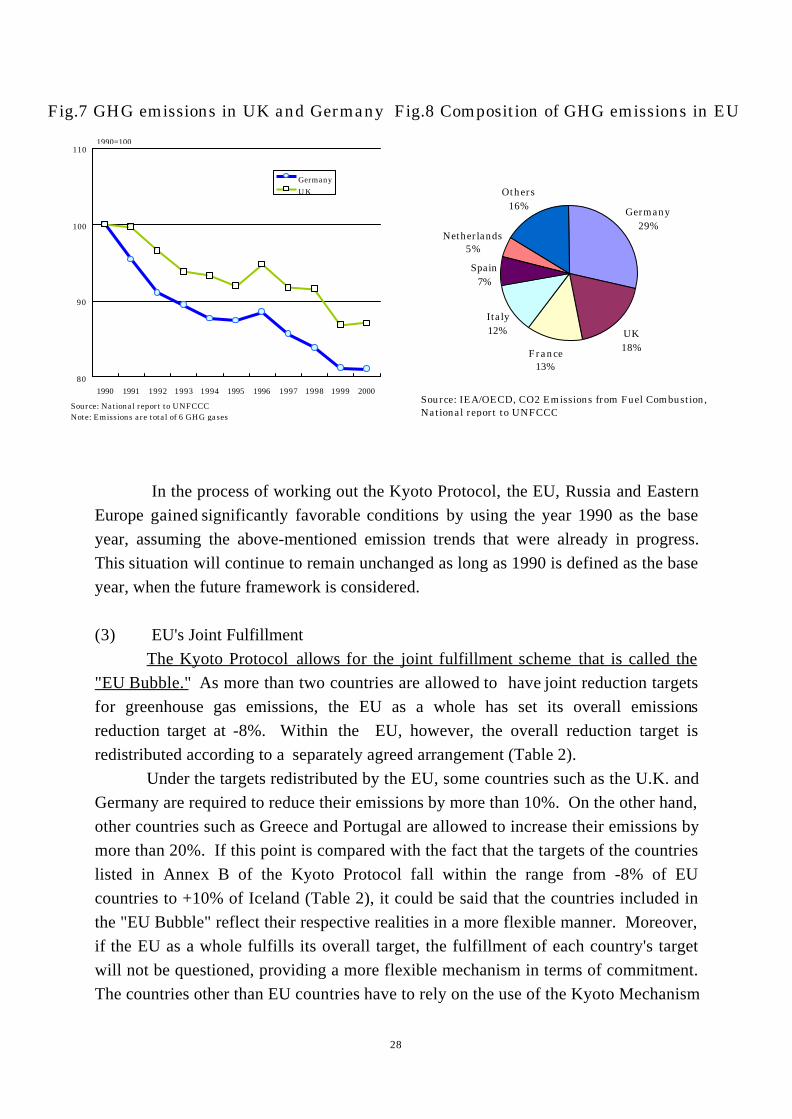
During the same period, moreover, the U.K. and Germany already developeddrastic changes in their energy supply and demand structure. First, the energy sourcesin the two countries shifted drastically from coal to natural gas in the 1990s, thusresulting in reduction of their greenhouse gas emissions (Fig. 7). The shift waspromoted by the cost reduction required for the privatization of electric powercompanies as well as by closings of coal mines in the two countries. In Japan, naturalgas is a clean but relatively expensive energy source because it is imported in aliquefied form. In Europe, on the other hand, natural gas is supplied through gaspipelines. So, the situations concerning natural gas are different in Japan and Europe.
If the price of natural gas for power generation in 1996 is set at 100, the prices
Cost calculation for each country to achieve reduction target(IPCC Third Assessment Report)
0
200
400
600
800
1000
1200
Japan EU USMar
gin
al r
edu
ctio
n c
ost
per
CO
2 to
n(U
S$/
CO
2 to
n)
1074
97
966
20
410
76
About 400About 300
About 200

27
of coal for power generation in European countries are 53.4 in Germany and 73.6 inthe U.K., according to data ("Competition and Liberalization in European GasMarkets" by Jonathan P. Stern). At first sight, the price of natural gas is higher thanthat of coal, but the unit cost of power generation is almost the same or lower withnatural gas, if the thermal power generation efficiency of coal (a little higher than30%) and the combined cycle efficiency of natural gas (50%) are taken intoconsideration. Fig.6 CO2 emissions in EIT countries
Moreover, East Germany and West Germany were unified in 1990. Then, inthe first half of the 1990s, inefficient facilities were closed or replaced by the newestfacilities in the former East Germany, reducing energy consumption in Germany as awhole.
Out of the EU's emissions in 1990, the U.K. and Germany accounted for abouthalf (Fig. 8). Significant reductions in emissions in these two countries are a largefactor that makes it more promising for EU as a whole to accomplish its reductiontargets.
All of these factors are caused as a result of the adoption of the year 1990 asthe base year. Originally, the Kyoto Protocol was negotiated as an extension of theFramework Convention on Climate Change. As the framework convention mentionedas a yardstick, "the return by the end of the present decade (2000) to earlier (1990)levels," the year 1990 has continued to be used as the base year.
40
50
60
70
80
90
100
110
1990
1991
1992
1993
1994
1995
1996
1997
1998
1999
2000
Targe
t
CzechHungary
PolandRomaniaRussia
Ukraine
1990=100 (For Russia and Ukraine 1992=100)
Source: IEA, CO2 Emissions from Fuel Combustion
28
FGHG emissions in UK and Germany Fig. 8 Composition of GHG emissions in
In the process of working out the Kyoto Protocol, the EU, Russia and EasternEurope gained significantly favorable conditions by using the year 1990 as the baseyear, assuming the above-mentioned emission trends that were already in progress.This situation will continue to remain unchanged as long as 1990 is defined as the baseyear, when the future framework is considered. (3) EU's Joint Fulfillment
The Kyoto Protocol allows for the joint fulfillment scheme that is called the"EU Bubble." As more than two countries are allowed to have joint reduction targetsfor greenhouse gas emissions, the EU as a whole has set its overall emissionsreduction target at -8%. Within the EU, however, the overall reduction target isredistributed according to a separately agreed arrangement (Table 2).
Under the targets redistributed by the EU, some countries such as the U.K. andGermany are required to reduce their emissions by more than 10%. On the other hand,other countries such as Greece and Portugal are allowed to increase their emissions bymore than 20%. If this point is compared with the fact that the targets of the countrieslisted in Annex B of the Kyoto Protocol fall within the range from -8% of EUcountries to +10% of Iceland (Table 2), it could be said that the countries included inthe "EU Bubble" reflect their respective realities in a more flexible manner. Moreover,if the EU as a whole fulfills its overall target, the fulfillment of each country's targetwill not be questioned, providing a more flexible mechanism in terms of commitment.The countries other than EU countries have to rely on the use of the Kyoto Mechanism
Fig.7 GHG emissions in UK and Germany Fig.8 Composition of GHG emissions in EU
80
90
100
110
1990 1991 1992 1993 1994 1995 1996 1997 1998 1999 2000
GermanyUK
1990=100
Source: National report to UNFCCCNote: Emissions are total of 6 GHG gases
Germany29%
UK18%France
13%
Italy12%
Spain7%
Netherlands5%
Others16%
Source: IEA/OECD, CO2 Emissions from Fuel Combustion,National report to UNFCCC

29
for the portions of emissions that they cannot reduce on their own. The EU countries,on the other hand, have gained a tool that allows them to flexibly and mutuallycoordinate their emissions without using the Kyoto Mechanism.
In the negotiations leading up to the COP3, Japan, the U.S., Canada, Australia,etc., had continued to oppose the idea of the EU Bubble because: "the relations ofcommitments between EU and member countries are ambiguous; there are concernsabout the transparency in the case where EU decides or changes the sharing ofcommitments with its member countries regarding the numerical targets and; allowingonly a part of EU countries to increase their emissions by a wide margin lacks equityand impairs the motivation of developing countries to address the reductions in theiremissions."
Moreover, the EU expansion scheduled in 2004 means that many EastEuropean countries that have a large amount of surplus allowances will be integratedinto EU. During the first commitment period, the scope of the EU Bubble is firmlylimited to the present 15 countries and not allowed to expand. But, in considering theframework in and after 2013, the factor of these new member countries will have to betaken into account, too. The emissions of the ten new member countries are shown inTable 3 on the next page. If the EU Bubble that incorporates these countries isallowed, the EU will gain a more advantageous situation under the future framework. (4) Penalties for Non-compliance
The measures which will be taken against any of the Parties that cannot complywith their reduction targets prescribed by the Kyoto Protocol are defined by theMarrakech Accords that were adopted by the 7th Conference of the Parties to theUnited Nations Framework Convention on Climate Change (COP7). Specifically, theaccords have measures or sanctions in a sense against the Parties such as deducting theemissions at the rate of 1.3 times the quantity not fulfilled from the allowancesallocated to the next commitment period. So, the Kyoto Protocol applies severeschemes to the countries that commit to its reduction targets, while containing nomeasures against countries that are not Parties to the Kyoto Protocol. Its mechanism issevere for insiders but more tolerant for outsiders.
In terms of the basic characteristics and factors of a global environment treaty,it is important to facilitate and appreciate the Parties’ intention to commit themselvesto the framework, rather than imposing sanctions on non-complying countries. If anyof the Parties cannot fulfill its commitment, it is important to "help" the Party to fulfillits commitment.
Moreover, in light of the request of global environmental issues to aim for aneffective mechanism by encouraging participation as wide as possible, it could be said

30
that such an approach that applies the "view of human nature as fundamentallydepraved" to the Parties is different from what it originally ought to be.
Whether the regulating measures against non-compliance should have legalbinding force or not is still subject to further negotiations, and this issue is going to bediscussed at the 1st Meeting of the Parties to the Kyoto Protocol that will be held afterthe Protocol enters into force. Japan is opposed to the idea of giving legal bindingforce to the Protocol because the establishment of severe measures will not serve as apositive factor, -- rather, it could work as an obstacle -- in expanding the framework inthe future.

31
Austria 85.8 89.2 3.9 -13Belgium 141.3 158.5 12.2 -7.5Denmark 68.9 67.9 -1.5 -21Finland 74.9 71.8 -4.2 0France 545.4 547.0 0.3 0Germany 1,202.3 992.6 -17.4 -21Greece 101.3 122.1 20.6 25Ireland 54.6 67.0 22.7 13Italy 514.1 538.6 4.8 -6.5Luxembourg 11.8 9.3 -21.0 -28Netherlands 214.1 223.9 4.6 -6Portugal 65.2 87.2 33.8 27Spain 290.3 389.4 34.1 15Sweden 70.4 70.5 0.1 4United Kingdom 748.8 659.0 -12.0 -12.5EU15 sub-total 4,189.2 4,094.0 -2.3 -8Czech Republic 185.9 142.0 -23.6 -8Estonia 39.0 17.2 -55.8 -8Hungary 104.2 83.8 -19.6 -6Latvia 29.5 11.0 -62.8 -8Lithuania 45.2 20.8 -54.0 -8Poland 532.8 376.3 -29.4 -6Slovakia 72.7 49.5 -31.8 -8Slovenia 18.4 19.8 7.7 -8EU25 Sub-total 5,216.9 4,814.4 -7.7Australia 415.8 497.5 19.7 8Canada 608.1 736.7 21.2 -6Iceland 2.8 3.2 12.9 10Japan 1,256.7 1,381.5 9.9 -6New Zealand 72.9 81.2 11.4 0Norway 50.7 57.8 14.0 1Switzerland 54.1 54.4 0.5 -8United States of America 6,167.2 7,020.7 13.8 -7Non-EU developed countries sub-total 8,628.3 9,833.0 14.0Russian Federation 3,031.1 2,006.9 -33.8 0Bulgaria 144.7 76.3 -47.3 -8Croatia 27.8 25.6 -7.6 -5Romania 267.4 121.2 -54.7 -8Ukraine 907.4 457.5 -49.6 0Economies In Transition Sub-total 4,378.4 2,687.5 -38.6Annex B total 18,223.6 17,334.9 -4.9 -5.2
Table 3 Total GHG Emissions of Annex B countries
(Source)IEA/OECD, CO2 Emissions from Fuel Combustion, UNFCCC National Communications(Note:1)Base year for HFC's, PFC's and SF6 is either 1990 or 1995, whichever is larger, and base year of some EIT countries (Bulgaria, Hungary, Poland and Romania) for CO2,CH4 and N20 is also 1995.(Note:2)EU25 excluding Malta and Cyprus
(Million-ton CO2)TotalGHG
CountryTotalGHG
% changeKyotoTarget

32
(Major Comments at the Committee)Ø Japan will have to make further strenuous efforts despite its high level of energy-
saving efficiency. On the other hand, developing countries do not have anyintention to participate. There is something wrong with such a mechanism, andit should be reconsidered.
Ø Though Russia made a commitment to reduce its emissions under the KyotoProtocol, it has no burden because of the so-called Hot Air.
Ø The Kyoto Protocol has a framework that places unnecessary costs on Japanonly. Such circumstances will have to be avoided in the future.
Ø The fairness in burden-sharing within Japan will have to be maintained, too.Ø The Kyoto Protocol does not take the export and import business into
consideration. Its mechanism counts low-CO2-emission products as emissions ofthe countries that export such products, and does not count them as the emissionsof the countries that import such products.
Ø The base year is a very important factor, and must be carefully reviewed underthe future framework.
Ø As Japan's ability to collect and provide information about the events in the EUin the 1990s (the post-Cold War period, the collapse of communist society,changes in energy supply and demand structure, etc.) was poor, the year 1990was adopted as the base year.
Ø Under the Kyoto Protocol, the differences in the BAU growth between countrieswere not taken into consideration. If numerical values are decided from theviewpoint that BAU is the starting point and emissions are reduced therefrom,the results will be more satisfactory.
Ø The Kyoto Protocol provides for sanctions during the second commitment periodas penalty measures for the first commitment period. With such sanctions,however, no agreement can be reached regarding the second commitment period.
Ø Considering participation of developing countries, too, the penalties must bereconsidered.
Ø The problems of the Kyoto Protocol are: (1) the establishment of "binding(enforcable) and fixed numerical targets by countries; and (2) lack of "significantparticipation of developing countries."
Ø Saying that keeping the total amount of emissions within a certain range isbeyond the scope of the governmentreach is almost equal to state that thegovernment will give up implementing counter measures for global warming.
Ø It is not impossible to restrict the people’s privilege for the sake of publicwelfare, however, those restrictions will not accepted due to scientificuncertainties, fairness among countries and effectiveness of the regulation.

33
When considering climate measures, the structures of world energy demand and supply andof greenhouse gas emissions are extremely important factors. If due attention is not paid tothose factors, any discussion will end up in an impractical solution, and cannot lead to anysustainable framework.
1. Trend of GHG Emission in Developed Countries (1) Large Gap in the Rooms of Emission Reduction among Countries
The analysis of energy demand and supply in major developed countries indicateslarge differences in terms of a room of emission reductions. In energy demand, there are considerable differences in energy efficiencies betweencountries. Japan has higher energy efficiencies in the country as a whole and in terms ofsector-specific indexes (Fig. 9 and 10). This is the result of large-scale energy savinginvestment carried out by Japanese industries since the two Oil Crises, and the reflection ofJapanese life-styles as well as the country’s geographic and climatic factors.
This fact indicates that Japan will incur relatively higher costs if it is to aim for thefurther improvement of energy efficiencies. Fig. 9 End Energy Consumption per GDP unit in Major Developed Countries
1 1 9
157149
206 195210
245
447
273 260
100
179203
0.0
0.1
0.2
0.3
0.4
Germany UK
Finlan
d
Swede
nFra
nce
Denmark Ita
ly
Netherl
ands
Norway
Cana
da US
Austra
liaJap
an
19902000
Oil equivalent million tons / billion US$ (1995)
*Numbers are indexes with Japan's level in 2000 as 100
Chapter 4 GHG Emissions and the World Energy Demand and SupplyStructure
Source: OECD/IEA, Energy Balances of OECD

34
Fig. 10 Energy Consumption Unit in the Iron & Steel and Cement industries of MajorCountries
820
1,322 1,288 1,241 1,241
151151157161
100
-
500
1,000
1,500
2,000
2,500
Japan US W. Europe Asia LatinAmerica
0
100
200
Energy consumption intensity Japan=100(right axis)
Mcal/cement ton
(Source: CEMBUREAU, World Cement Directory)
Source: Japan Iron and Steel Association
100 100 100
132 130
118119 116 112114
102 103
125
112 111
0
20
40
60
80
100
120
140
1980 1990 1994
Japan
US
UK
Gemany
France

35
Also in the energy supply aspect, the UK and Germany underwent significant fuelswitching in the 1990’s in the direction of departure from coal usage, as explained in theThird Chapter. One reason could be their extensive coal dependence in the past. Comparedwith these countries, Japan had, and has, lower dependency on coal, and coal-fueled thermalpower stations are large-scale using new, sophisticated and economizing technologiesconstructed with a view to ensuring stable energy supply, Therefore, they will not be easilyconverted to other fuels. Moreover, natural gas costs are higher in Japan than in Europe. Asseen here, the rooms for de-carbonization of fuels differ significantly depending on nationalcircumstances.
In Japan, nuclear power generation plays a significant role in the reduction ofgreenhouse gas.1 Unfortunately, the Marrakech Accord stipulates that the Parties refrain fromnuclear in using CDM and JI. The role of nuclear power on each country’s emissionreduction efforts should be addressed again in sincerity at the future negotiations.
Furthermore, the comparison of greenhouse gas composition in major developedcountries indicates a large gap in the ratio of CO2, which directly reflects economic activities.Japan has a relatively higher ratio of CO2 (about 90%), while many other major developedcountries have 70-80% CO2 ratios, and instead indicate relatively higher ratios of othergreenhouse gases such as methane and nitrous oxide (Fig. 11). The background of suchdifferences can be, for example, the difference in the production quantity and manufacturingprocesses of adipic acids, use of landfill for waste disposal that leads to the emissions ofmethane gas, and the presence of methane gas emitted from coal mines.
Therefore, some countries have effectively reduced nitrous oxide emissions by theconversion of adipic acid manufacturing processes, or methane gas emissions by theenforcement of EU waste treatment acts or by the closure of domestic coal mines. Suchdifferences in greenhouse composition can be another element of differentiating the emissionreduction costs.
1 Nuclear power generation has a significant role in the reduction of greenhouse gases inother countries such as the U.S., where the Bush Administration released the NationalEnergy Policy in May 2001, which supported the expansion of nuclear energy usagewhich does not emit greenhouse gases.

36
Fig. 11 Comparison of GHG Emission Components of Each Country
Sources: Each country’s report to UNFCCCNote: If 3 fluorocarbons values in 1995 were greater than those of 1990, 1995 values were plotted in place of 1990 values.Relevant countries include Denmark, Germany, Netherlands, Sweden, UK, Italy, Canada, and Japan.
(2) Emission Reductions by Factors Other Than Climate Measures
In regard to energy-derived CO2 emissions, Germany and the UK among Europeancountries realized reductions from their 1990 levels, while Russia and other economies intransition had significant reduction. (Table 4). The background of such reductions includesunique factors in Europe, such as the renovation of old and inefficient facilities in the formerEast Germany following the unification of East and West Germany, and the fuel switchingfrom coal to natural gas implemented in the UK. In the case of Russia and economies intransition, shrinking production activities are apparent in the amount of reduction in CO2
emissions.As seen here, a substantial part of emission reductions in energy-source CO2 up to
now was not due to the measures implemented to address global warming, but due to achanged economic situation or as a by-product of measures undertaken for some otherpurpose.
0 % 1 0 % 2 0 % 3 0 % 4 0 % 5 0 % 6 0 % 7 0 % 8 0 % 9 0 % 1 0 0 %
Denmark
France
Germany
Netherlands
Norway
Sweden
Finland
UK
Italy
Canada
USA
Australia
Japan
C O 2 C H 4 N 2 O 3 F l u o r o c a r b o n s
U p p e r b a r : 2 0 0 0 , L o w e r b a r : 1 9 9 0

37
(Million ton of CO2)
Austria 56.9 62.8 10.3Belgium 107.2 120.3 12.1Denmark 50.6 50.1 -0.9Finland 55.0 54.8 -0.3France 352.7 373.3 5.8Germany 964.1 833.0 -13.6Greece 70.6 87.8 24.3Ireland 30.3 41.2 36.2Italy 400.1 425.7 6.4Luxembourg 10.5 8.0 -23.2Netherlands 159.8 177.1 10.8Portugal 39.6 59.6 50.5Spain 206.5 284.7 37.9Sweden 51.2 52.0 1.6United Kingdom 559.9 531.5 -5.1EU15 sub-total 3,115.0 3,161.9 1.5Australia 259.7 329.3 26.8Canada 430.2 526.8 22.4Iceland 1.9 2.2 13.7Japan 1,018.7 1,154.8 13.4New Zealand 22.3 31.6 41.9Norway 28.5 33.6 17.7Switzerland 40.6 41.7 2.7United States of America 4,825.7 5,665.4 17.4Non-EU developed countries sub-total 6,627.6 7,785.4 17.5Russian Federation 2,297.0 1,505.7 -34.4Bulgaria 82.4 42.7 -48.1Croatia 17.3 17.8 2.8Czech Republic 153.8 118.8 -22.8Estonia 33.0 14.0 -57.6Hungary 82.7 55.2 -33.2Latvia 21.4 6.5 -69.5Lithuania 31.0 11.2 -63.7Poland 430.5 292.8 -32.0Romania 188.1 86.4 -54.0Slovakia 55.6 37.8 -31.9Slovenia 12.5 14.4 15.6Ukraine 660.3 301.0 -54.4Economies In Transition 4,065.6 2,504.3 -38.4Annex B total 13,808.2 13,451.6 -2.6
Table 4 CO2 Emissions of Annex B countries
Country
(Source)IEA/OECD, CO2 Emissions from Fuel Combustion(Note)Some EIT countries (Bulgaria, Hungary, Poland and Romania) base year is 1995
Total CO2(1990)
Total CO2(2000)
%change

38
(3) Issue Common to Countries: Increased Energy Consumption in Transport andResidential Sectors
The gross energy consumption of major developed countries is on the increase as awhole (Fig.12). The record of CO2 emissions in the past, however, indicates a considerablegap between countries, with some countries actually decreasing emissions. A major factor forthis was because some countries successfully advanced decarbonization by changing thecomposition of energy supplies.
The ratio of each sector of industries, transportation, and residential differ, fromcountry to country. Scandinavian countries (Finland, Norway, and Sweden) and Japan have ahigher ratio for the industrial sector, while US, UK, Germany and France have a relativelylower ratio for the industry sector with a higher ratio for the life-related sectors such astransport and residential. In addition, the US and Australia have a higher ratio for thetransportation sector (Fig.13).
Considering the changes in sectoral energy consumption for the past 10 years, theconsumption changes in the industrial sector showed a considerable gap between countries,but the transportation and residential sectors seemed to indicate an increasing trend as a whole(Fig.12). Failure to find fundamental solutions in these sectors is a common problem amongdeveloped countries.
Fig.12 End Energy Consumption in Major Developed Countries and the Contribution of EachSector
-20
-10
0
10
20
30
40
50
German
y UK
Finlan
d
Swede
nFra
nce
Denmark Ita
ly
Netherl
ands
Norway
Cana
da US
Austral
iaJap
an
Others
Residential
Transport
Industris
Consumption
Growth rate in the period [1990 - 2000]
Source: OECD/IEA, Energy Balances of OECD Countries
Note: Industrial sector includes agriculture.

39
Fig. 13 Sectoral Ratio of End Energy Consumption in Major Developed Countries (2000)
2. Energy-derived CO2 Emissions in Developing Countries (1) Increase in All Sectors
Energy-derived CO2 emissions in developing countries continue to show considerableincrease associated with economic growth and population increase, except in the case of a fewcountries (Fig.14). In view of sectoral increase, developing countries find the problem ofenergy consumption increases in the transportation and residential sectors in addition toindustrial sector, as in the case of developed countries (Fig.16).
0% 20% 40% 60% 80% 100%
USA
Denmark
UK
France
Germany
Italy
Australia
Canada
Sweden
Netherlands
Japan
Norway
Finland
IndustryTransportResidentialOthers
Source: OECD/IEA, Energy Balances of OECD CountriesNote: Industrial sector includes agriculture

40
Fig. 14 Energy-derived CO2 Emissions in Major Developing Countries (1990-2000)
(2) Potential for Significant Emission IncreaseDeveloping countries are expected to continue to have higher energy consumption
growth rates due to the improvement of living standards, the progress of motorization, and thedevelopment of the industrial sector.
In view of the relationship between economic growth and energy consumption, wecan find a certain interesting pattern depending on each stage of economic development.Countries with lower GDP per capita will show energy efficiency improvement along with theincrease of wages, in the course of their economic growth (First stage). Once GDP per capitaincreases to a certain level, energy efficiency deteriorates (Second stage). Further economicgrowth will result in the greater improvement of energy efficiencies at a pace faster than thepace of income increase (Third stage). Presupposing the economic growth of developingcountries, it will be important to consider how to prevent the deterioration of energyefficiencies during the second stage, and how to shorten the period of this stage (Fig.15).
For developing countries, it will be necessary to pay more attention to theircharacteristic of having great room to earn significant effects from energy saving investments,
4,852
1,049
82
53
113
255
108
104
80
138
145
138
181
201
291
297
237
591
2,421
5,718
1,184
115
118
119
123
132
135
159
206
257
272
286
308
340
369
444
961
3,213
0 1000 2000 3000 4000 5000 6000
USA
Japan
Egypt
Malaysia
Uzbekistan
Kazakhstan
Venezuela
Argentina
Thailand
Turkey
Saudi Arabia
Indonesia
Iran
Brazil
South Africa
Mexico
South Korea
India
China
20001990
Source: IEA/OECD, CO2 Emissions from Fuel Combustion Million tons of CO2
(33%)(62%)
(88%)
(24%)(17%)(53%)(58%)
(97%)(77%)(49%)(99%)
(30%)(23%)
(-52%)
(6%)(122%)(40%)
(13%)(18%)

41
with such investments leading to further development of their economies. Fig. 15 Per capita GDP and Primary Energy vs. GDP Intensity(Developed countries: 1960-2000, developing countries:1971-2000)
10
100
1,000
0 1 10 100
10
1,000
Indonesia
Malaysia
Turkey
Taiwan
KoreaSingapore
US
UK
Japan
Oil equivalent ton/1000
1,000US$/person
100
*Both axes in logarithm
19602000
1971
2000
-
1,000
2,000
3,000
4,000
0.0 0.5 1.0
China
India
(Source)OECD/IEA, Energy Balances of OECD Countries, Energy
Balances of NON-OECD Countries

42
Fig. 16 Contribution of Major Developing Countries to the Sectoral Changes of Final EnergyConsumption
Source: OECD/IEA, Energy Balances of Non-OECD Countries, Energy Balances of OECD Countries)
Note: Numbers for Kazakhstan and Uzbekistan are the changes in 199 5-2000. China and India are evaluated with their 1994-2000 data, since their previous data
did not include renewable energy consumption in residential sector.
Furthermore, developing countries find factors of greenhouse gas increase in an energysupply aspect as well as an energy demand aspect.
In view of energy mix in each country, those in the Asian region show a higher ratioof coal, while those in Middle East and Latin America show greater ratios of oil and naturalgas (Fig.17), which seem to reflect the situation of energy resources in each region. Coal-producing countries, such as China and Indonesia, are projected to maintain or even increasethe abundant amount of coal excavated within these countries, due to their views ofpreserving their own resources of oil exportable to other countries.
In addition, many developing countries have relatively higher dependence on non-commercial biomass energies (such as firewood and charcoals), but their dependence on suchnon-commercial energies will decrease while fuel switching to the commercial energy of
0%
36%
102%
6% 8%
39%
84%
51% 51% 52%
69%
52%
28%
-27%
19%
112%
53.2%
-40%
-20%
0%
20%
40%
60%
80%
100%
120%
China
India
Sou
th K
orea
Mexico
South A
frica
Brazil
Iran
Indonesia
Sau
di Arabia
Tu
rkey
Thailand
Argentina
Venezuela
Kazakh
stan
Uzbekistan
Malaysia
Egypt
Industry Transport Agriculture Commercial and Public services Residential Others
Growth rates for 1990-2000
*Numbers are end energy consumption growthrates

43
fossil fuels will advance, resulting in the increase of CO2 emissions. Already, majordeveloping countries such as China and India have shown a decreasing trend in the ratio ofbiomass such as firewood and charcoals, resulting in the greater ratio of fossil energies suchas coal, oil, and natural gas, instead.
Up to now, developed countries have attempted to change their energy mix, as shownin the promotion of decarbonization on the part of Europe, which contributed to the reductionand control of CO2 emissions. On the contrary, developing countries seem likely to move inthe opposite direction from developed countries, causing further increase in their CO2
emissions due to the changes in their energy supply structures.
Fig.17 Energy Mix of Primary Energy Supply in Major Developing Countries (2000)
(3) No Simple Distinction between Developed and Developing CountriesThe ranking of countries in several indexes related to greenhouse gas emissions
indicates that developing countries and developed countries cannot be distinguished in a
0% 10% 20% 30% 40% 50% 60% 70% 80% 90% 100%
China
India
South Korea
Indonesia
Thailand
Malaysia
Iran
Saudi Arabia
Kazakhstan
Turkey
Uzbekistan
Mexico
Brazil
Argentina
Venezuela
South Africa
Egypt
Coal Oil Gas Nuclear Hydro Renewable
Source: OECD/IEA, Energy Balances of non-OECD Countries and Energy Balances of OECD Countries

44
simple way (Table 5,6,7 and 8).2
In terms of energy-derived CO2 emissions, and energy-derived CO2 emissions perGDP, those with higher numbers are a mixture of developed countries and developingcountries. Energy-derived CO2 emissions in 2000 showed 15 developing countries in the top30, including China (ranked second), and India (ranked fifth). Japan ranked fourth in thisrespect (Table 5). Per GDP emissions in 2000 indicated that developing countries shared 21out of the top 30 countries. Japan ranked 65th (Table 8).
Moreover, energy-derived CO2 emissions per capita showed that developing countriesranked first to third (Qatar, Kuwait, and UAE) but the number of developing countries in thetop 30 was only 10. Japan was 21st (Table 7).
As seen here, the developing countries’ claim that “developed countries should takethe lead in addressing” the global-scale climate issue would largely depend on which index isreferred to and on the data to support such argument.
The argument presented by developing countries basically relies on the index of percapita emissions.
However, if we are to assume total emission as an index, then it is possible to claimthat the countries with higher emission quantities such as China, India, Korea, Mexico, SouthAfrica, Brazil, Iran, Indonesia, Saudi Arabia, Turkey, Thailand, Argentine, Venezuela,Kazakhstan, and Uzbekistan (developing countries in the top 30) should have responsibilitiesto take initiatives for the global environment.
Considering the method of burden sharing, it is necessary to adopt a compound viewusing various indexes, rather than adopting a single index.
2 Here, “developing countries” are those with no obligation for emission reduction underthe Kyoto Protocol. Therefore, OECD member countries such as Korea and Mexico areincluded in “developing countries.”

45
Table 5 Energy related CO2 EmissionsGDP Population CO2 Emission GDP/capita CO2/capita CO2/GDP
1billion US$(95) Million M ton-CO2 1,000$/capita t-CO2/capita t-CO2/1,000$A USA 8,986.90 275.42 5,718.30 32.63 20.76 0.64D China 1,204.92 1,269.26 3,213.40 0.95 2.53 2.67B Russia 357.32 145.46 1,524.22 2.46 10.48 4.27A Japan 5,680.57 126.92 1,184.30 44.76 9.33 0.21D India 466.68 1,015.92 960.64 0.46 0.95 2.06A Germany 2,686.50 82.17 820.10 32.70 9.98 0.31A United Kingdom 1,303.75 59.76 552.00 21.82 9.24 0.42A Canada 704.88 30.75 515.10 22.92 16.75 0.73C Republic of Korea 617.50 47.28 444.50 13.06 9.40 0.72A Italy 1,204.87 57.73 427.20 20.87 7.40 0.35C Mexico 374.40 97.22 369.30 3.85 3.80 0.99A France 1,755.62 60.43 353.50 29.05 5.85 0.20B Ukraine 44.35 49.50 345.71 0.90 6.98 7.80D South Africa 170.57 42.80 340.11 3.99 7.95 1.99A Australia 451.61 19.16 328.60 23.57 17.15 0.73D Brazil 788.03 170.41 308.32 4.62 1.81 0.39B Poland 163.35 38.65 296.30 4.23 7.67 1.81D Iran 104.99 63.66 286.03 1.65 4.49 2.72A Spain 704.05 39.93 285.90 17.63 7.16 0.41D Indonesia 209.10 210.42 272.18 0.99 1.29 1.30D Saudi Arabia 139.44 20.72 257.06 6.73 12.41 1.84C Turkey 205.10 66.84 206.00 3.07 3.08 1.00A Netherlands 496.95 15.92 173.10 31.22 10.87 0.35D Thailand 170.34 60.73 158.99 2.80 2.62 0.93D Argentina 293.77 37.03 135.42 7.93 3.66 0.46D Venezuela 79.77 24.17 132.40 3.30 5.48 1.66D Kazakhstan 22.49 14.87 123.10 1.51 8.28 5.47B Czech Republic 54.56 10.27 122.00 5.31 11.88 2.24A Belgium 317.96 10.25 121.50 31.01 11.85 0.38D Uzbekistan 12.01 24.75 119.29 0.49 4.82 9.93D Malaysia 111.62 23.27 117.90 4.80 5.07 1.06D Egypt 78.42 63.98 115.10 1.23 1.80 1.47D Pakistan 71.28 138.08 101.05 0.52 0.73 1.42B Romania 32.75 22.44 87.71 1.46 3.91 2.68A Greece 139.07 10.56 84.90 13.17 8.04 0.61D Iraq 81.29 23.26 77.51 3.49 3.33 0.95D Algeria 48.82 30.40 70.04 1.61 2.30 1.43D Philippines 88.23 75.78 69.34 1.16 0.92 0.79D UAE 49.33 2.91 69.27 16.95 23.80 1.40A Austria 267.02 8.11 62.50 32.93 7.71 0.23A Portugal 129.32 10.01 59.70 12.93 5.97 0.46D Singapore 113.43 4.02 59.52 28.22 14.81 0.52D Israel 106.38 6.23 59.43 17.08 9.54 0.56D Colombia 96.86 42.30 59.14 2.29 1.40 0.61D Belarus 27.62 10.01 58.64 2.76 5.86 2.12D Kuwait 26.88 1.98 57.52 13.58 29.05 2.14A Finland 165.54 5.18 55.90 31.98 10.80 0.34B Hungary 54.41 10.02 55.20 5.43 5.51 1.01D Chile 81.45 15.21 53.05 5.36 3.49 0.65A Denmark 206.08 5.34 50.30 38.61 9.42 0.24D Syrian Arab Republic 13.58 16.19 48.94 0.84 3.02 3.60A Sweden 277.94 8.87 47.40 31.33 5.34 0.17D Nigeria 32.18 126.91 46.90 0.25 0.37 1.46B Bulgaria 12.28 8.17 43.63 1.50 5.34 3.55A Ireland 106.63 3.79 41.50 28.16 10.96 0.39D Vietnam 27.93 78.52 40.88 0.36 0.52 1.46D Libyan Arab Jamahiriya 34.20 5.29 40.78 6.47 7.71 1.19A Switzerland 335.86 7.19 39.90 46.74 5.55 0.12B Slovakia 22.47 5.40 35.40 4.16 6.55 1.58D Qatar 11.55 0.59 34.58 19.58 58.61 2.99A Norway 170.45 4.49 34.40 37.95 7.66 0.20A New Zealand 68.72 3.83 32.20 17.94 8.41 0.47B Croatia 22.54 4.38 17.77 5.15 4.06 0.79B Estonia 6.07 1.37 14.72 4.43 10.74 2.43B Slovenia 23.18 1.99 14.42 11.65 7.25 0.62B Lithuania 7.60 3.70 11.29 2.05 3.05 1.49A Luxembourg 24.63 0.44 8.10 55.85 18.37 0.33B Latvia 6.16 2.37 6.49 2.60 2.74 1.05A Iceland 8.82 0.28 2.20 31.38 7.83 0.25
Source: OECD/IEA, CO2 Emissions from Fuel Combustion (Reference Approach Data)Note: A: Annex B, B: Annex B(EIT's), C: Non-Annex B(OECD member), D: Non-Annex B(developing countries)All data are from 2000
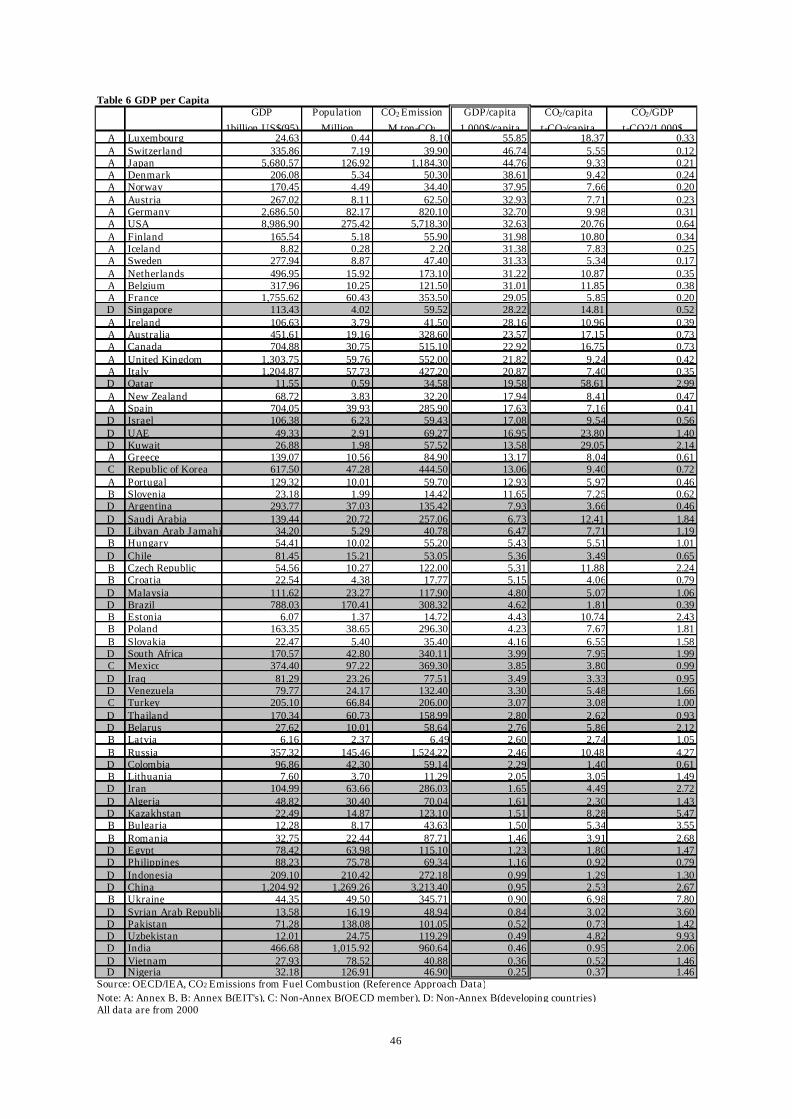
46
Table 6 GDP per CapitaGDP Population CO2 Emission GDP/capita CO2/capita CO2/GDP
1billion US$(95) Million M ton-CO2 1,000$/capita t-CO2/capita t-CO2/1,000$A Luxembourg 24.63 0.44 8.10 55.85 18.37 0.33A Switzerland 335.86 7.19 39.90 46.74 5.55 0.12A Japan 5,680.57 126.92 1,184.30 44.76 9.33 0.21A Denmark 206.08 5.34 50.30 38.61 9.42 0.24A Norway 170.45 4.49 34.40 37.95 7.66 0.20A Austria 267.02 8.11 62.50 32.93 7.71 0.23A Germany 2,686.50 82.17 820.10 32.70 9.98 0.31A USA 8,986.90 275.42 5,718.30 32.63 20.76 0.64A Finland 165.54 5.18 55.90 31.98 10.80 0.34A Iceland 8.82 0.28 2.20 31.38 7.83 0.25A Sweden 277.94 8.87 47.40 31.33 5.34 0.17A Netherlands 496.95 15.92 173.10 31.22 10.87 0.35A Belgium 317.96 10.25 121.50 31.01 11.85 0.38A France 1,755.62 60.43 353.50 29.05 5.85 0.20D Singapore 113.43 4.02 59.52 28.22 14.81 0.52A Ireland 106.63 3.79 41.50 28.16 10.96 0.39A Australia 451.61 19.16 328.60 23.57 17.15 0.73A Canada 704.88 30.75 515.10 22.92 16.75 0.73A United Kingdom 1,303.75 59.76 552.00 21.82 9.24 0.42A Italy 1,204.87 57.73 427.20 20.87 7.40 0.35D Qatar 11.55 0.59 34.58 19.58 58.61 2.99A New Zealand 68.72 3.83 32.20 17.94 8.41 0.47A Spain 704.05 39.93 285.90 17.63 7.16 0.41D Israel 106.38 6.23 59.43 17.08 9.54 0.56D UAE 49.33 2.91 69.27 16.95 23.80 1.40D Kuwait 26.88 1.98 57.52 13.58 29.05 2.14A Greece 139.07 10.56 84.90 13.17 8.04 0.61C Republic of Korea 617.50 47.28 444.50 13.06 9.40 0.72A Portugal 129.32 10.01 59.70 12.93 5.97 0.46B Slovenia 23.18 1.99 14.42 11.65 7.25 0.62D Argentina 293.77 37.03 135.42 7.93 3.66 0.46D Saudi Arabia 139.44 20.72 257.06 6.73 12.41 1.84D Libyan Arab Jamahiriya 34.20 5.29 40.78 6.47 7.71 1.19B Hungary 54.41 10.02 55.20 5.43 5.51 1.01D Chile 81.45 15.21 53.05 5.36 3.49 0.65B Czech Republic 54.56 10.27 122.00 5.31 11.88 2.24B Croatia 22.54 4.38 17.77 5.15 4.06 0.79D Malaysia 111.62 23.27 117.90 4.80 5.07 1.06D Brazil 788.03 170.41 308.32 4.62 1.81 0.39B Estonia 6.07 1.37 14.72 4.43 10.74 2.43B Poland 163.35 38.65 296.30 4.23 7.67 1.81B Slovakia 22.47 5.40 35.40 4.16 6.55 1.58D South Africa 170.57 42.80 340.11 3.99 7.95 1.99C Mexico 374.40 97.22 369.30 3.85 3.80 0.99D Iraq 81.29 23.26 77.51 3.49 3.33 0.95D Venezuela 79.77 24.17 132.40 3.30 5.48 1.66C Turkey 205.10 66.84 206.00 3.07 3.08 1.00D Thailand 170.34 60.73 158.99 2.80 2.62 0.93D Belarus 27.62 10.01 58.64 2.76 5.86 2.12B Latvia 6.16 2.37 6.49 2.60 2.74 1.05B Russia 357.32 145.46 1,524.22 2.46 10.48 4.27D Colombia 96.86 42.30 59.14 2.29 1.40 0.61B Lithuania 7.60 3.70 11.29 2.05 3.05 1.49D Iran 104.99 63.66 286.03 1.65 4.49 2.72D Algeria 48.82 30.40 70.04 1.61 2.30 1.43D Kazakhstan 22.49 14.87 123.10 1.51 8.28 5.47B Bulgaria 12.28 8.17 43.63 1.50 5.34 3.55B Romania 32.75 22.44 87.71 1.46 3.91 2.68D Egypt 78.42 63.98 115.10 1.23 1.80 1.47D Philippines 88.23 75.78 69.34 1.16 0.92 0.79D Indonesia 209.10 210.42 272.18 0.99 1.29 1.30D China 1,204.92 1,269.26 3,213.40 0.95 2.53 2.67B Ukraine 44.35 49.50 345.71 0.90 6.98 7.80D Syrian Arab Republic 13.58 16.19 48.94 0.84 3.02 3.60D Pakistan 71.28 138.08 101.05 0.52 0.73 1.42D Uzbekistan 12.01 24.75 119.29 0.49 4.82 9.93D India 466.68 1,015.92 960.64 0.46 0.95 2.06D Vietnam 27.93 78.52 40.88 0.36 0.52 1.46D Nigeria 32.18 126.91 46.90 0.25 0.37 1.46
Source: OECD/IEA, CO2 Emissions from Fuel Combustion (Reference Approach Data)Note: A: Annex B, B: Annex B(EIT's), C: Non-Annex B(OECD member), D: Non-Annex B(developing countries)All data are from 2000

47
Table 7 Energy related CO2 Emissions per CapitaGDP Population CO2 Emission GDP/capita CO2/capita CO2/GDP
1billion US$(95) Million M ton-CO2 1,000$/capita t-CO2/capita t-CO2/1,000$D Qatar 11.55 0.59 34.58 19.58 58.61 2.99D Kuwait 26.88 1.98 57.52 13.58 29.05 2.14D UAE 49.33 2.91 69.27 16.95 23.80 1.40A USA 8,986.90 275.42 5,718.30 32.63 20.76 0.64A Luxembourg 24.63 0.44 8.10 55.85 18.37 0.33A Australia 451.61 19.16 328.60 23.57 17.15 0.73A Canada 704.88 30.75 515.10 22.92 16.75 0.73D Singapore 113.43 4.02 59.52 28.22 14.81 0.52D Saudi Arabia 139.44 20.72 257.06 6.73 12.41 1.84B Czech Republic 54.56 10.27 122.00 5.31 11.88 2.24A Belgium 317.96 10.25 121.50 31.01 11.85 0.38A Ireland 106.63 3.79 41.50 28.16 10.96 0.39A Netherlands 496.95 15.92 173.10 31.22 10.87 0.35A Finland 165.54 5.18 55.90 31.98 10.80 0.34B Estonia 6.07 1.37 14.72 4.43 10.74 2.43B Russia 357.32 145.46 1,524.22 2.46 10.48 4.27A Germany 2,686.50 82.17 820.10 32.70 9.98 0.31D Israel 106.38 6.23 59.43 17.08 9.54 0.56A Denmark 206.08 5.34 50.30 38.61 9.42 0.24C Republic of Korea 617.50 47.28 444.50 13.06 9.40 0.72A Japan 5,680.57 126.92 1,184.30 44.76 9.33 0.21A United Kingdom 1,303.75 59.76 552.00 21.82 9.24 0.42A New Zealand 68.72 3.83 32.20 17.94 8.41 0.47D Kazakhstan 22.49 14.87 123.10 1.51 8.28 5.47A Greece 139.07 10.56 84.90 13.17 8.04 0.61D South Africa 170.57 42.80 340.11 3.99 7.95 1.99A Iceland 8.82 0.28 2.20 31.38 7.83 0.25D Libyan Arab Jamahiriya 34.20 5.29 40.78 6.47 7.71 1.19A Austria 267.02 8.11 62.50 32.93 7.71 0.23B Poland 163.35 38.65 296.30 4.23 7.67 1.81A Norway 170.45 4.49 34.40 37.95 7.66 0.20A Italy 1,204.87 57.73 427.20 20.87 7.40 0.35B Slovenia 23.18 1.99 14.42 11.65 7.25 0.62A Spain 704.05 39.93 285.90 17.63 7.16 0.41B Ukraine 44.35 49.50 345.71 0.90 6.98 7.80B Slovakia 22.47 5.40 35.40 4.16 6.55 1.58A Portugal 129.32 10.01 59.70 12.93 5.97 0.46D Belarus 27.62 10.01 58.64 2.76 5.86 2.12A France 1,755.62 60.43 353.50 29.05 5.85 0.20A Switzerland 335.86 7.19 39.90 46.74 5.55 0.12B Hungary 54.41 10.02 55.20 5.43 5.51 1.01D Venezuela 79.77 24.17 132.40 3.30 5.48 1.66A Sweden 277.94 8.87 47.40 31.33 5.34 0.17B Bulgaria 12.28 8.17 43.63 1.50 5.34 3.55D Malaysia 111.62 23.27 117.90 4.80 5.07 1.06D Uzbekistan 12.01 24.75 119.29 0.49 4.82 9.93D Iran 104.99 63.66 286.03 1.65 4.49 2.72B Croatia 22.54 4.38 17.77 5.15 4.06 0.79B Romania 32.75 22.44 87.71 1.46 3.91 2.68C Mexico 374.40 97.22 369.30 3.85 3.80 0.99D Argentina 293.77 37.03 135.42 7.93 3.66 0.46D Chile 81.45 15.21 53.05 5.36 3.49 0.65D Iraq 81.29 23.26 77.51 3.49 3.33 0.95C Turkey 205.10 66.84 206.00 3.07 3.08 1.00B Lithuania 7.60 3.70 11.29 2.05 3.05 1.49D Syrian Arab Republic 13.58 16.19 48.94 0.84 3.02 3.60B Latvia 6.16 2.37 6.49 2.60 2.74 1.05D Thailand 170.34 60.73 158.99 2.80 2.62 0.93D China 1,204.92 1,269.26 3,213.40 0.95 2.53 2.67D Algeria 48.82 30.40 70.04 1.61 2.30 1.43D Brazil 788.03 170.41 308.32 4.62 1.81 0.39D Egypt 78.42 63.98 115.10 1.23 1.80 1.47D Colombia 96.86 42.30 59.14 2.29 1.40 0.61D Indonesia 209.10 210.42 272.18 0.99 1.29 1.30D India 466.68 1,015.92 960.64 0.46 0.95 2.06D Philippines 88.23 75.78 69.34 1.16 0.92 0.79D Pakistan 71.28 138.08 101.05 0.52 0.73 1.42D Vietnam 27.93 78.52 40.88 0.36 0.52 1.46D Nigeria 32.18 126.91 46.90 0.25 0.37 1.46
Source: OECD/IEA, CO2 Emissions from Fuel Combustion (Reference Approach Data)Note: A: Annex B, B: Annex B(EIT's), C: Non-Annex B(OECD member), D: Non-Annex B(developing countries)All data are from 2000

48
Table 8 Energy related CO2 Emissions per GDPGDP Population CO2 Emission GDP/capita CO2/capita CO2/GDP
1billion US$(95) Million M ton-CO2 1,000$/capita t-CO2/capita t-CO2/1,000$D Uzbekistan 12.01 24.75 119.29 0.49 4.82 9.93B Ukraine 44.35 49.50 345.71 0.90 6.98 7.80D Kazakhstan 22.49 14.87 123.10 1.51 8.28 5.47B Russia 357.32 145.46 1,524.22 2.46 10.48 4.27D Syrian Arab Republic 13.58 16.19 48.94 0.84 3.02 3.60B Bulgaria 12.28 8.17 43.63 1.50 5.34 3.55D Qatar 11.55 0.59 34.58 19.58 58.61 2.99D Iran 104.99 63.66 286.03 1.65 4.49 2.72B Romania 32.75 22.44 87.71 1.46 3.91 2.68D China 1,204.92 1,269.26 3,213.40 0.95 2.53 2.67B Estonia 6.07 1.37 14.72 4.43 10.74 2.43B Czech Republic 54.56 10.27 122.00 5.31 11.88 2.24D Kuwait 26.88 1.98 57.52 13.58 29.05 2.14D Belarus 27.62 10.01 58.64 2.76 5.86 2.12D India 466.68 1,015.92 960.64 0.46 0.95 2.06D South Africa 170.57 42.80 340.11 3.99 7.95 1.99D Saudi Arabia 139.44 20.72 257.06 6.73 12.41 1.84B Poland 163.35 38.65 296.30 4.23 7.67 1.81D Venezuela 79.77 24.17 132.40 3.30 5.48 1.66B Slovakia 22.47 5.40 35.40 4.16 6.55 1.58B Lithuania 7.60 3.70 11.29 2.05 3.05 1.49D Egypt 78.42 63.98 115.10 1.23 1.80 1.47D Vietnam 27.93 78.52 40.88 0.36 0.52 1.46D Nigeria 32.18 126.91 46.90 0.25 0.37 1.46D Algeria 48.82 30.40 70.04 1.61 2.30 1.43D Pakistan 71.28 138.08 101.05 0.52 0.73 1.42D UAE 49.33 2.91 69.27 16.95 23.80 1.40D Indonesia 209.10 210.42 272.18 0.99 1.29 1.30D Libyan Arab Jamahiriya 34.20 5.29 40.78 6.47 7.71 1.19D Malaysia 111.62 23.27 117.90 4.80 5.07 1.06B Latvia 6.16 2.37 6.49 2.60 2.74 1.05B Hungary 54.41 10.02 55.20 5.43 5.51 1.01C Turkey 205.10 66.84 206.00 3.07 3.08 1.00C Mexico 374.40 97.22 369.30 3.85 3.80 0.99D Iraq 81.29 23.26 77.51 3.49 3.33 0.95D Thailand 170.34 60.73 158.99 2.80 2.62 0.93B Croatia 22.54 4.38 17.77 5.15 4.06 0.79D Philippines 88.23 75.78 69.34 1.16 0.92 0.79A Canada 704.88 30.75 515.10 22.92 16.75 0.73A Australia 451.61 19.16 328.60 23.57 17.15 0.73C Republic of Korea 617.50 47.28 444.50 13.06 9.40 0.72D Chile 81.45 15.21 53.05 5.36 3.49 0.65A USA 8,986.90 275.42 5,718.30 32.63 20.76 0.64B Slovenia 23.18 1.99 14.42 11.65 7.25 0.62D Colombia 96.86 42.30 59.14 2.29 1.40 0.61A Greece 139.07 10.56 84.90 13.17 8.04 0.61D Israel 106.38 6.23 59.43 17.08 9.54 0.56D Singapore 113.43 4.02 59.52 28.22 14.81 0.52A New Zealand 68.72 3.83 32.20 17.94 8.41 0.47A Portugal 129.32 10.01 59.70 12.93 5.97 0.46D Argentina 293.77 37.03 135.42 7.93 3.66 0.46A United Kingdom 1,303.75 59.76 552.00 21.82 9.24 0.42A Spain 704.05 39.93 285.90 17.63 7.16 0.41D Brazil 788.03 170.41 308.32 4.62 1.81 0.39A Ireland 106.63 3.79 41.50 28.16 10.96 0.39A Belgium 317.96 10.25 121.50 31.01 11.85 0.38A Italy 1,204.87 57.73 427.20 20.87 7.40 0.35A Netherlands 496.95 15.92 173.10 31.22 10.87 0.35A Finland 165.54 5.18 55.90 31.98 10.80 0.34A Luxembourg 24.63 0.44 8.10 55.85 18.37 0.33A Germany 2,686.50 82.17 820.10 32.70 9.98 0.31A Iceland 8.82 0.28 2.20 31.38 7.83 0.25A Denmark 206.08 5.34 50.30 38.61 9.42 0.24A Austria 267.02 8.11 62.50 32.93 7.71 0.23A Japan 5,680.57 126.92 1,184.30 44.76 9.33 0.21A Norway 170.45 4.49 34.40 37.95 7.66 0.20A France 1,755.62 60.43 353.50 29.05 5.85 0.20A Sweden 277.94 8.87 47.40 31.33 5.34 0.17A Switzerland 335.86 7.19 39.90 46.74 5.55 0.12
Source: OECD/IEA, CO2 Emissions from Fuel Combustion (Reference Approach Data)Note: A: Annex B, B: Annex B(EIT's), C: Non-Annex B(OECD member), D: Non-Annex B(developing countries)All data are from 2000

49
(Comments at the Committee)Ø In terms of energy supply structure, not only the prospect of CO2 emission reduction
but also the prospect of energy supply stability is an important issue. After overcomingtwo oil crises, Japan expanded the introduction of coal and promoted nuclear powergeneration. Attaining the best mix of power generation sources will continue to be animportant matter for Japan in terms of ensuring stable energy supply.
Ø Other important factors are measures in the residential and transportation sectors. Weneed a strategy to address these as issues of national scope affecting all citizens.
Ø As developing countries have shown significant changes in their economic growthrates, it may be a good idea to consider standards for determining the promotion fromdeveloping to developed country status.
Ø Efforts will also be needed to reflect the results of environmental ODA on a futureframework.
Ø OPEC countries are focusing on technology to refurbish oil and gas fields withoutburning flare gas, and on the alleviation of poverty caused by population growth.
Ø Coal production in China started to decrease from the latter half of the 1990’s in theirofficial statistics, but it has been said that a considerable part of production is notcovered in their statistics.
Ø Development of a statistical system is important for promoting developing countryparticipation.
Ø There are countries that reduce emissions at their own cost, and countries that do not. Ifa framework is established in a way that asks those countries with cost-bearing capacityto bear costs, then it will conform to the principles claimed by developing countriessuch as placing higher priorities on economic development and poverty alleviation.
Ø Developing countries will not have sufficient funds to allocate for climate measures.They have asked developed countries for funds and technologies. In this sensetechnological cooperation by the private sector will become a key.
Ø Developing countries need to implement their own national measures, based on theprinciple of common but differentiated responsibility.
Ø Considering significant changes in demographic, technological, and industrialstructures, negotiators should have clear standards on the prospects for the world ’sfuture, when participating in international negotiation.

50
Chapter 5 Perspectives and Actions to Construct a Future SustainableFramework To consider a future framework that addresses the global warming issue with theaforementioned elements in mind, this chapter will present various viewpoints fordiscussion. Although the future negotiation for such a framework may take a longtime, it will be beneficial for all countries to share, from early stage, theunderstandings on the important issues and the procedures that shall be taken. Theelements below can constitute a platform of discussion for such purpose. 1. Four Factors Concerning the Global Warming Problem When considering the international actions against global warming, the followingelements should be born in mind: (1) Need for Technological Breakthroughs The ultimate solution of the global warming issue requires breakthroughs intechnology still unrealized today as well as diffusion of existing technology. Therefore, when contemplating measures for this issue, it is important to draw a roadmap for the development and dissemination of innovative technologies and plan ouractions based on a long-term viewpoint founded on such a road map (2) Diversified Agenda in Each Nation, Region, and Sector Emissions of greenhouse gases are brought about by extremely diversified and broad-ranged economic and everyday activities, and closely tied to the nature of the economy,industry and lifestyle of each country. The actions required to prevent global warmingmay vary widely depending on the specific situation of each nation, region, and sector,and there are very significant variations in the costs for those actions. Furthermore, it is necessary to recognize that many of these elements are beyond thereach of direct control by governments, given the nature of market economies. (3) Tremendous Global Cost Prevention of global warming will require the world to bear enormous costs formeasures, since emissions of energy-source carbon dioxide dominate greenhouse gasemissions, and current technologies are not capable of substantially curtailing

51
emissions from energy use. Global efforts involving both developed and developing countries are essential. A keyrequirement for long-term, sustainable, and effective measures is determing how toproceed with addressing this issue in the most cost-effective way. In addition, costs for mitigation have very significant implications for economicactivities. Economic model analysis to determine the degree of impact can provideimportant suggestions on future measures. Gglobal warming is an environmental issue, an energy issue, and an economic issue.Negotiation on global warming is actually affected by the each nation's perception ofhow global warming alters their competitiveness and development strategy. Therefore, fully incorporating the equity viewpoint will be a prerequisite, in order tosustain the acceptance to bear costs and the motivation to participate in measures. (4) Scientific Uncertainties Remain As mentioned in Chapters 1 and 2, the mechanisms and effects of climate change stillhave significant uncertainties. IPCC’s Third Assessment Report indicated that itwould be necessary to promote further research in order to improve the ability todetect, attribute, and understand climate change, to reduce uncertainties, and to projectfuture climate changes. (Comments at the Committee)Ø In international law legislation, it will be important to discuss the extent of
governmental reach.Ø To build a framework, political and technological feasibilities should be closely
examined.Ø Cost effectiveness analysis may be an effective way to promote developing
countries’ awareness of the needs for participation in the framework. Throughcost analysis of the health hazards attributed to global warming, each country canpredict the required costs.
Ø Considering IPCC’s significant influence, support for, and utilization of, IPCCactivities should be given a higher priority.
Ø If the international community shares a consensus and a projection on the effectsof climate change, developing countries may not venture to expressly state theirnon-participation in the framework.
Ø Balancing adaptation and mitigation measures will be important in the long term,requiring constant and immediate responses and review at each stage.
52
2. Four Basic Concepts for a Sustainable Framework
Addressing global warming will require not merely adjustment of technicaldetails of the current framework, but also discussion with creative and flexiblethinking. Such discussion should be based on the concepts below:
(1) Focus on Technological Solutions
For addressing climate changes in the future, response measures need toreflect and incorporate scientific knowledge accumulation and technologicalinnovation, from a long term perspective . Any framework based on a shorter termviewpoint will make it difficult to consider responses that will incorporate thedevelopment and dissemination of new technologies. The future framework needs tobe evaluated from the viewpoint of its ability to contribute to the promotion oftechnological innovation needed for the ultimate solution of this issue and to theintroduction of such technologies.
In that process, due attention needs to be paid to such factors as technologicaldevelopment policies, standards on technologies to be introduced or adopted, andinternational cooperation for technology dissemination. Such measures are likely toenable us to reflect technological feasibility, directly address technological agenda ineach sector, and identify which direction each sector needs to aim for. (2) Simultaneous Achievement of Effectiveness, Efficiencies and Equity
(i) Need to cover most global emissions In order to ensure effectiveness, it is necessary to cover most global greenhouse gasemissions. If the effectiveness is questioned, any framework may impair themotivation of countries to participate, failing to achieve a sustainable framework. Climate measures will require costs from broad-ranging economic and everydayactivities. In order to maintain political consensus on such cost bearing, governmentsundoubtedly need to provide a rational explanation to the general public. What is veryimportant here is to prevent free-riders. These considerations lead us to recognize thatthe prerequisite for Japan’s participation in a framework beyond 2012 would be that aneffective framework be built with the participation of the US and major developingcountries.
In the light of characteristics of this issue affecting global public goods, futurediscussion will need to focus on how to incorporate the elements of free-riderprevention, participation incentives, and non-participation disincentives. Because of

53
this, minimizing the possibility of major countries’ withdrawal from the frameworkwill become an important element in the consensus building for the next framework. Itis necessary to take into consideration that developing countries have limited capacityto take measures depending on their development stages and necessity for adaptationmeasures such as counter-measures for floods and constructing seawalls. (ii) Pursuit of cost-effectiveness
In order to address this issue requiring enormous costs to be born by the wholeworld, an important viewpoint for the sake of effective conservation of the globalenvironment is how to respond as cost-effectively and efficiently as possible. (iii) Rationale
An important task is to ensure equity in each country’s commitment. This isbecause a system which imposes unevenly heavy burdens on some countries will notbe persuasive enough to the people of such countries who bear the economic and dailyburden. In other words, it is essential to have rational and logical explanations for howeach country’s commitment satisfies the requirement for equity. Thus, the first thingto do will be bottom-up type analysis and discussion based on the specific situation ofeach country and each sector, as well as estimating costs of measures and the room forfurther reduction.
Only through such processes can realistic discussion on commitments beachieved and, thereby, equity realized. In addition, the commitments must be basedon technological feasibilities, in other words the prospects for technologicaldevelopment and technology transfers. Any resolution not incorporating suchelements may not lead to a sustainable framework in the long term, although it mayhelp agreements to be realized more easily for the short term. (3) Contribution both to Economy and Environment
Since the ultimate solution of the global warming issue requires technologicalbreakthroughs and tremendous global costs to develop and disseminate technologies,the future framework must be founded on the concept of achieving dual targets foreconomy and environment. It is necessary to aim for the development anddissemination of technologies which are to be realized through economic growth. (4) Multi -stakeholder Participation and various forms of commitments (i) Multi -stakeholder participation involving governments, industries, NGOs, and

54
individualsAddressing the future measures for global warming will involve extremely
varied issues, with some beyond the government reach. Therefore, it will be essentialto involve not only the nation-states but also entities of broader scope and levelsincluding regions, sectors, industries, individuals, etc.
Bearing in mind that the global warming problem has many elements whichthe government cannot control fully, discussions, not only on international obligationsby governments but also on activities required for various sectors and entities, areexpected to be activated in various fora. The effective solution may be that suchdiscussions at various fora mutually complement one another, and thereby, constituteeffective measures as a whole.
When the government addresses climate change, hybrid responses realizedthrough various fora of global, regional and bilateral levels might be effective.
Entities other than governments, such as industries, NGOs, and individuals, areencouraged to aim for building international consensus and commitments based onconcrete actions in each sector, industry or daily life, in order to resolve the issue ofclimate change, reflecting on the responsibility and capability of each entity. (ii) Various forms of commitments
In order to promote multi-stakeholder participation, commitment should bepursued on qualitative aspects such as standards and technological requirements aswell as on the quantitative aspect. Such an approach is likely to effectivelyaccommodate equity issues, due to the capability of responding to actual situations ineach field. Furthermore, there should be a search for various options suitable to eachentity, including voluntary agreements and voluntary target setting. A framework shallnot contain features to induce each entity to postpone the participation in anticipationof non-compliance, but rather, shall serve as a scheme to encourage each entity to takethe lead in implementation, so that it can produce earlier and more concrete effects. (Comments at the Committee)Ø In international negotiation we need to make better use of Japan’s technology
development policies, such as internationally common technologicalbenchmarks, and top-runner methods.
Ø An approach to utilize sector-specific intensity will be important. The EU is inthe process of reviewing the introduction of best available technologies andbenchmarks for each sector.
Ø In terms of developing countries’ participation, we need to study efficiencybenchmarks for newly-constructed factories, indexes or targets in improvingautomobile fuel efficiencies, and other factors which are more acceptable to

55
developing countries.Ø We also need to demonstrate that , by combining the most advanced technologies
in the world, emissions can be reduced to a considerable extent using casestudies. It is meaningful to select an industry as the unit of entity for addressingthe issue.
Ø For domestic measures, the effect of voluntary action plans by industries havebeen identified already.
Ø Due to the tremendous costs of domestic measures, it is time for Japan to startpreparation for the emissions trading system.
Ø In addition to its reduction targets, the EU proposed taxes and technologicalstandards prior to the Kyoto Protocol, but maintained that their umbrella couldnot determine the details for making the system more flexible to incorporate eachnation’s unique situation. The EU ended up dropping the articles on policies andmeasures.
Ø If we are to propose a framework involving only technical standards and toeliminate the emission reduction target of each country, then that would leave thefields without technological elements not covered by the framework.
Ø It may be difficult to build an international consensus through the approach ofsumming up energy constituents only.
Ø For the future framework, we need to review the consideration of trade.International trade relates to the consumption, greenhouse gas emission, andindustrial structure of each country.
Ø The reduction of CO2 is inseparable from industrial competitiveness and theeconomy of each country.
Ø The essence of the Kyoto Protocol is who will bear the costs. Thus, even if theconsensus is achieved on the top-runner method, the result will not be differentfor Japan from the case of the Kyoto Protocol, as long as Japan is to bear thecosts of the top-runner method.
Ø We need to review the possibility of securing equity and fairness in the costburden of each country based on each country’s contribution to global warminganalyzed by the country-specific accumulation of greenhouse gas emissions andthe accumulation in the atmosphere.
Ø The position of nuclear power generation should be considered with its role inclimate measures. Japan needs more than ever to send out information on itssincerity in the addressing of nuclear power generation to other countries , and towin greater trust.
Ø Japan’s post-Kyoto strategy should be promoted from the two approaches of“principled diplomacy” (universal values and longer-term viewpoint) and“pragmatic diplomacy”.
Ø The global environmental issue as a universal value issue needs to acknowledgethe importance of political statements.
Ø We must accumulate scientific knowledge from the view point of a long time-span of one century, and need to constantly review such knowledge, andtechnological innovation.
Ø The important thing is how to formulate a concept. It would be necessary to re-define the principles of the Framework Convention (common but differentiated

56
responsibilities: if developed countries have responsibility for their past actions,developing countries have responsibility for the future), and sustainabledevelopment (as developing countries need long-term development, developedcountries need stable growth), and to shift from commitment to target tocommitment to actions.
Ø In regard to the issue of participation by the US and developing countries, weneed to study the possibility of voluntary measures and cooperation outside theframework of Kyoto.
Ø For the alliance with developing countries, we need to study voluntary financialand technological assistance, environmental support as a part of development,and a framework for regional cooperation.
Ø In regard to the joint efforts with the US, we must review the development ofuniversal values and concepts, cooperation in technological development, andthe formulation of a developed countries’ framework.
Ø As the basic characteristics and elements of global environmental treaties, weneed to consider: (1) the theory of parties being “innately good,” and non-parties“innately evil”; (2) voluntary commitment and mandatory commitment; (3)consideration of the special conditions of developing countries; and (4) theestablishment of an organization to secure the initiatives of major countries(special stakeholders).
Ø In regard to the pre-suppositions on a framework beyond and after 2013, weneed to consider: (1) the effectiveness of a method to add revisions to the KyotoProtocol on the basis of the Kyoto Protocol’s continuation (country-specific andfixed caps); (2) the review of elements needed for an alternative frameworkoutside the Kyoto Protocol; and (3) consideration of the political conditions,timing and methods of an alternate framework proposal.
Ø Major elements of a new framework to replace the Kyoto Protocol shall include:(1) setting a framework with WTO/GATT as a model; (2) establishing the“conferring country system” mainly consisting of major emitting countries; and(3) the idea of establishing the WEO (World Environment Organization) .
3. Actions for Constructing a Future Sustainable Framework
In expecting discussion based on the principles stated above, two optionsbelow are proposed. These options are not alternates , but rather complement eachother for simultaneous introduction. (1) Multi-Facet Approach
Each entity is expected to discuss and act on various stages, depending on itsresponsibility and capability. If a future framework relies on a single approach, forexample the setting of country-specific caps, there are considerable uncertaintieswhether the negotiation can lead to truly practical and meaningful measures. If we fail

57
to realize such measures, then the long process of negotiation in the past will bewasted. On the other hand, if a multi-facet approach is applied, in which variousparticipants will discuss various measures and accumulate one by one the actions foreach field and sector, then it will provide a benefit of continuously creating measuresthat can have direct impact while conforming to the actual situation in each field. The system of a multi-dimensional and multi-facet structure, in which varioustypes of negotiations and measures simultaneously progress and thereby bring aboutgreater effect as a whole, may lead to provide concrete and tangible effects in eachfield. If so, governments will be able to not only negotiate for treaties and protocols,but also to conduct international coordination in broader areas of regional, bilateral,and other levels. Similarly, and in parallel to such governmental actions, industries,NGOs, and individuals respectively can build their own feasible internationalagreements and commitments. By each sector and each level addressing the issue inthe multi-facet approach, the global scale action on the global scale issue can berealized. To implement the “multi-facet approach,” it will be important to considersolutions consistent with the actual status of greenhouse gas emission sources.Discussion must cover not only the total amount of emissions but also various aspectsincluding technological standards, research and development policy, and technologytransfers and diffusions in each sector. By adopting various classifications such asthose based on sectors including industries, transport, and residential, or those basedon fields of industries such as power generation, iron and steel, chemical, andautomobiles, it becomes possible to search for more practical solutions with moreextensive equity. Already countries and regions have introduced various measures includingtechnology requirements to improve energy efficiencies in various fields, legislationfor target values, and voluntary commitment by industries. It may be worthwhile toreview, for example, seeking international participation in these measures, startingfrom whichever areas are possible. (2) Major Emitters Initiative
Unless major emitting countries that dominate the top ranks of greenhouse gasemissions in the world will actually participate in the framework, it will not lead to aneffective solution.
No matter what successes international negotiation provides, it is likely to leadto only insignificant achievement if the framework lacks the participation of majoremitting countries. Major emitters have the responsibility to lead the discussion on the

58
future international framework, and need to present a sustainable system. It isnecessary to pursue an approach in which major emitting countries take an initiative,with authority and responsibility, to discuss measures for reduciton of greenhouse gasemissions.
It is highly likely that discussions among major emitting countries might pavethe way for a truly feasible and effective framework. In the review of such process,not only environmental ministers but also economy and energy ministers of eachcountry should be included in active discussion. Allowing the participation ofministers with responsibilities for response measures in various fields will lead to theclimate change discussion fully reflecting technology development and actualsituations in each field. A creative and more practical approach in terms of theconsensus building process is required in future international discussion.
(Comments at the Committee)Ø In international negotiation where stakeholders’ interests and calculations
intertwine in a very complex way, Japan needs to make good use of its pastexperience earned through the history of multilateral-trade negotiation.
Ø Not only multilateral negotiation but bilateral negotiation should be utilized toadvance discussion among major countries. Especially important is to earn tacitconsent from the channel of the biggest player, the US.
Ø The post-Cold War era of the 1990’s saw active cooperation in regionalenvironmental efforts. To involve developing countries and non-participatingcountries, we need to adopt the viewpoint of regional responsibility.
Ø As the WTO’s new round will include discussion on “Trade and Environment,”won’t it be possible to have discussions involving such peripheral activities?
Ø It may be necessary to depart from the preconceived idea of developing countriesversus developed countries. To have sector-specific commitment to actions suchas the promotion of cross-border measures in the same industry (for example, theautomobile manufacturing sector) may be feasible.
Ø The past system did not accommodate the synergy effect of industries andNGOs. Essentially, to presuppose governmental systems all the time is notreasonable. We must set a framework not for each country but for the world as awhole.
Ø The Japan-US Business Conference also addressed global environmentalproblems.
Ø There are huge differences in environmental measures between the USgovernment and its state governments and business corporations. To create afavorable environment for including NGOs and corporations from the early stagecan be an important step.
Ø In view of adding social pressures on developing countries, it is necessary tointegrate the activities of domestic NGOs and NPOs in China and India.
Ø The current Kyoto Protocol concept has some built-in difficulties. After the

59
second commitment period, it will be important to seek a change of concept.Ø Apart from the Kyoto Protocol, a flexible review of the issue shall be attempted.
What we need is a more down-to-earth approach.Ø In building a future framework, we need a strategy on “how to protect Japan’s
national interests.” Basically, it is important to base negotiation on “nationalinterests.”
Ø Since environmental diplomacy is founded on precedents, its progress tends tofollow the progress of previous international frameworks. If the framework forthe second commitment period will be a simple extension of the Kyoto Protocolframework, then Japan will have too heavy a burden.
Ø How about conducting a study of best available technology with Japan’sneighbors or under a Japanese initiative? In the global warming issue, we needto expand the energy-savings society on a global scale, despite the risk ofoverseas transfer of high efficiency manufacturing facilities, such as in the caseof emission reductions in the iron and steel industry of China.
Ø The current picture of negotiation suggests that the origin of developingcountries’ unity is their sharing of a view that the Kyoto Protocol constraint theirdevelopment. Although it is essential to promote consensus among developingcountries on how the global environmental issue is vital for them as well,developing countries will not likely move toward mitigation unless they feel asense of economic benefit from it.
Ø Japan needs to show the desirable direction for the Asian region as a whole totake. While keeping the possibility of future economic changes in mind, Japanneeds to consider involving China, Korea, and India in the discussion, includingindustry-wide burden sharing among Asian countries.
Conclusion
Fundamentally addressing climate change requires a continued search forappropriate measures and further analysis of actual situations based on a long termviewpoint.
As the Chair country of the Conference that adopted the Protocol named afterKyoto, Japan became one of the early ratifying parties of the Protocol, and maintains aposition of taking leadership in building a future framework on climate change.
Upon publication of this “Interim Report”, broader discussion on climatechange with participation by the general public in every sector and at every level isexpected to be facilitated. At the same time, it is sincerely hoped that furtherinternational discussion toward a truly effective and equitable framework on climatechange will take place.

60
(Comments at the sub-committee)Ø First, it is important to exert the utmost efforts for the first commitment period of
the Kyoto Protocol. In the negotiation of a future framework, it will beimportant for Japan to demonstrate such actions.
Ø Japan needs to demonstrate its diplomatic strategy in the field of globalenvironmental issues as a platform for creating a new national and diplomaticimage of Japan.