Embed Size (px)
Citation preview
Acid Deposition Monitoring Network in East Asia ( EANET )
Report of the Inter-laboratory Comparison
Project 2009
12th Inter-laboratory Comparison Project on Wet Deposition
5th Inter-laboratory Comparison Project on Dry Deposition
11th Inter-laboratory Comparison Project on Soil
10th Inter-laboratory Comparison Project
on Inland Aquatic Environment
February 2011 Network Center for EANET

Contents
1. INTRODUCTION ................................................................. 1
2. 12th INTER-LABORATORY COMPARISON PROJECT
ON WET DEPOSITION .............................. 3
2.1 Introduction ................................................................. 3
2.2 Procedures ................................................................. 3
2.3 Results ................................................................. 7
2.4 Comparison with past surveys ................................................................. 30
2.5 Recommendations for improvements ................................................................. 32
References ................................................................. 33
Appendix 2-1 ................................................................. 34
Appendix 2-2 ................................................................. 36
Appendix 2-3 ................................................................. 38
Appendix 2-4 ................................................................. 40
3. 5th INTER-LABORATORY COMPARISON
PROJECT ON DRY DEPOSITION............................... 45
3.1 Introduction ................................................................. 45
3.2 Procedures ................................................................. 45
3.3 Results ................................................................. 48
References ................................................................. 63
Appendix 3-1 ................................................................. 64
Appendix 3-2 ................................................................. 66
Appendix 3-3 ................................................................. 68
4. 11th INTER-LABORATORY COMPARISON PROJECT
ON SOIL....................................................... 71
4.1 Introduction ................................................................. 71
4.2 Procedures ................................................................. 72
4.3 Results ................................................................. 76
4.4 Comparison with past surveys ................................................................. 95
4.5 Recommendations for improvements ................................................................. 95
References ................................................................. 97
Appendix 4-1 ................................................................. 98
Appendix 4-2 ................................................................. 99
Appendix 4-3 ................................................................. 102
Appendix 4-4 ................................................................. 105
5. 10th INTER-LABORATORY COMPARISON PROJECT
ON INLAND AQUATIC ENVIRONMENT........................................... 109
5.1 Introduction ................................................................. 109
5.2 Procedures ................................................................. 109
5.3 Results ................................................................. 113
5.4 Comparison with past surveys ................................................................. 128
5.5 Recommendations for improvements ................................................................. 131
References ................................................................. 133
Appendix 5.1 ................................................................. 134
Appendix 5.2 ................................................................. 136
Appendix 5.3 ................................................................. 137
Appendix 5.4 ................................................................. 138
6. ACKNOWLEDGEMENT ................................................................. 143
7. CONTACT INFORMATION ................................................................. 143
1. INTRODUCTION
The inter-laboratory comparison project (round robin analysis survey) was conducted among the
analytical laboratories in participating countries of the Acid Deposition Monitoring Network in
East Asia (EANET), based on the Quality Assurance / Quality Control (QA/QC) Program of
EANET.
The objectives of the project are, through the evaluation of analytical results, analytical
equipment and its operating condition and other practices,
(i) to recognize the analytical precision and accuracy of the measurement in each
participating laboratory,
(ii) to give an opportunity to improve the quality of the analysis on wet deposition, dry
deposition monitoring (filter pack method), soil monitoring and inland aquatic
monitoring of EANET,
(iii) to improve reliability of analytical data through the assessment of suitable
analytical methods and techniques.
The inter-laboratory comparison project is implemented by the Network Center of EANET
(NC) annually for the following items:
a. Wet Deposition
b. Dry Deposition
c. Soil
d. Inland aquatic Environment
This report presented the results of the 12th inter-laboratory comparison project on wet
deposition, 5th inter-laboratory comparison project on dry deposition, 11th inter-laboratory
comparison project on soil, and 10th inter-laboratory comparison project on inland aquatic
environment.
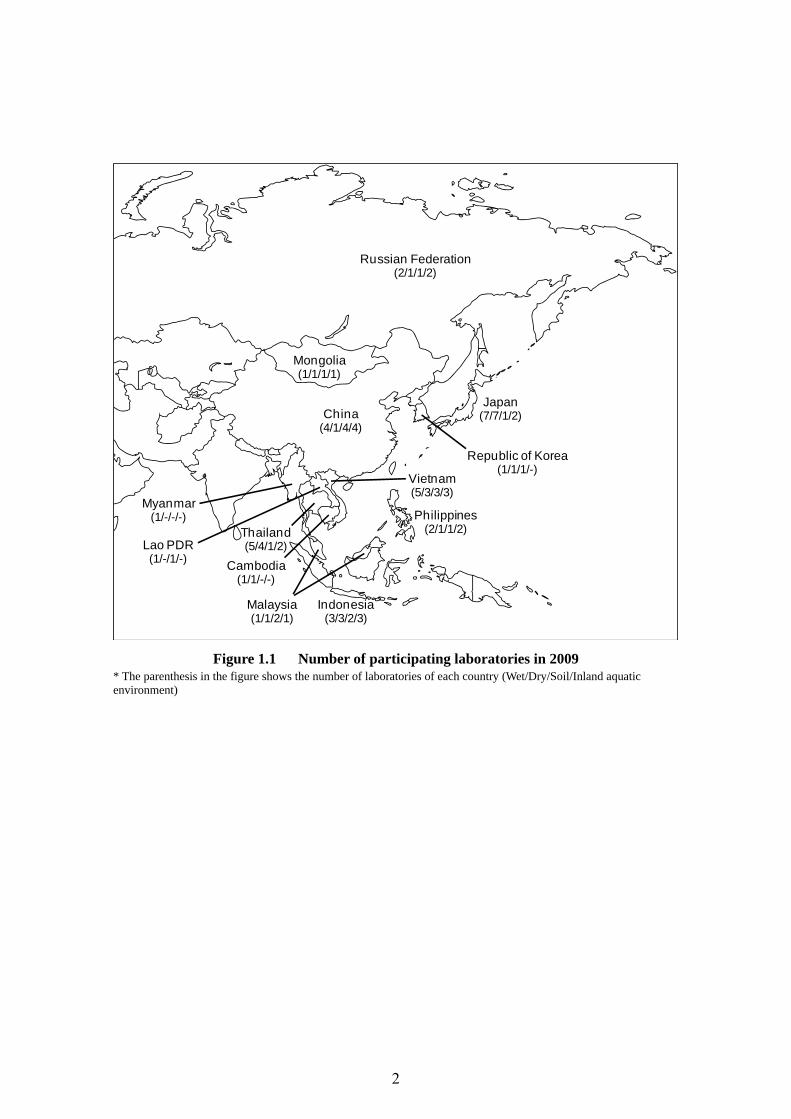
The number of laboratories from each country that participated in each of the projects was
shown in Figure 1.1.
1
Russian Federation(2/1/1/2)
Republic of Korea(1/1/1/-)
Japan(7/7/1/2)
Indonesia(3/3/2/3)
Philippines(2/1/1/2)
Vietnam(5/3/3/3)
Malaysia(1/1/2/1)
Cambodia(1/1/-/-)
Lao PDR(1/-/1/-)
Myanmar(1/-/-/-)
Thailand(5/4/1/2)
China(4/1/4/4)
Mongolia(1/1/1/1)
Figure 1.1 Number of participating laboratories in 2009 * The parenthesis in the figure shows the number of laboratories of each country (Wet/Dry/Soil/Inland aquatic environment)
2
2. 12th INTER-LABORATORY COMPARISON PROJECT ON WET DEPOSITION
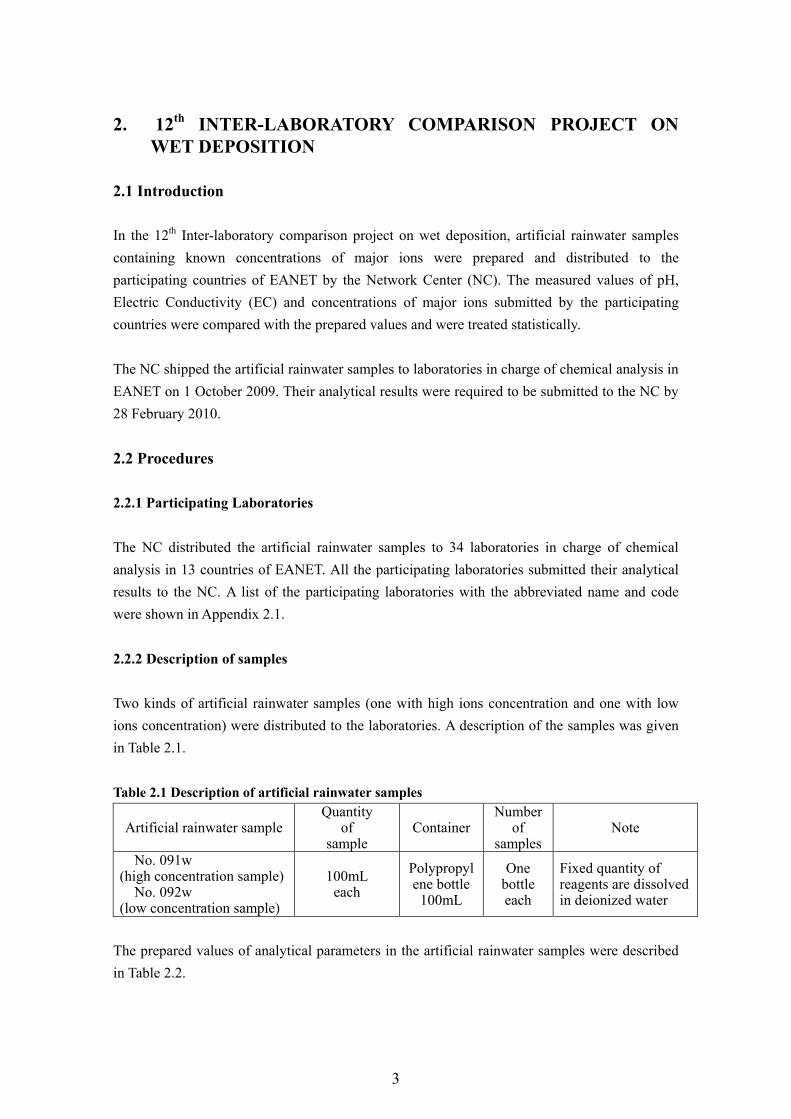
2.1 Introduction In the 12th Inter-laboratory comparison project on wet deposition, artificial rainwater samples containing known concentrations of major ions were prepared and distributed to the participating countries of EANET by the Network Center (NC). The measured values of pH, Electric Conductivity (EC) and concentrations of major ions submitted by the participating countries were compared with the prepared values and were treated statistically. The NC shipped the artificial rainwater samples to laboratories in charge of chemical analysis in EANET on 1 October 2009. Their analytical results were required to be submitted to the NC by 28 February 2010. 2.2 Procedures
2.2.1 Participating Laboratories The NC distributed the artificial rainwater samples to 34 laboratories in charge of chemical analysis in 13 countries of EANET. All the participating laboratories submitted their analytical results to the NC. A list of the participating laboratories with the abbreviated name and code were shown in Appendix 2.1. 2.2.2 Description of samples Two kinds of artificial rainwater samples (one with high ions concentration and one with low ions concentration) were distributed to the laboratories. A description of the samples was given in Table 2.1.
Table 2.1 Description of artificial rainwater samples
Artificial rainwater sample Quantity
of sample
Container Number
of samples
Note
No. 091w (high concentration sample)
No. 092w (low concentration sample)
100mL each
Polypropylene bottle
100mL
One bottle each
Fixed quantity of reagents are dissolved in deionized water
The prepared values of analytical parameters in the artificial rainwater samples were described in Table 2.2.
3
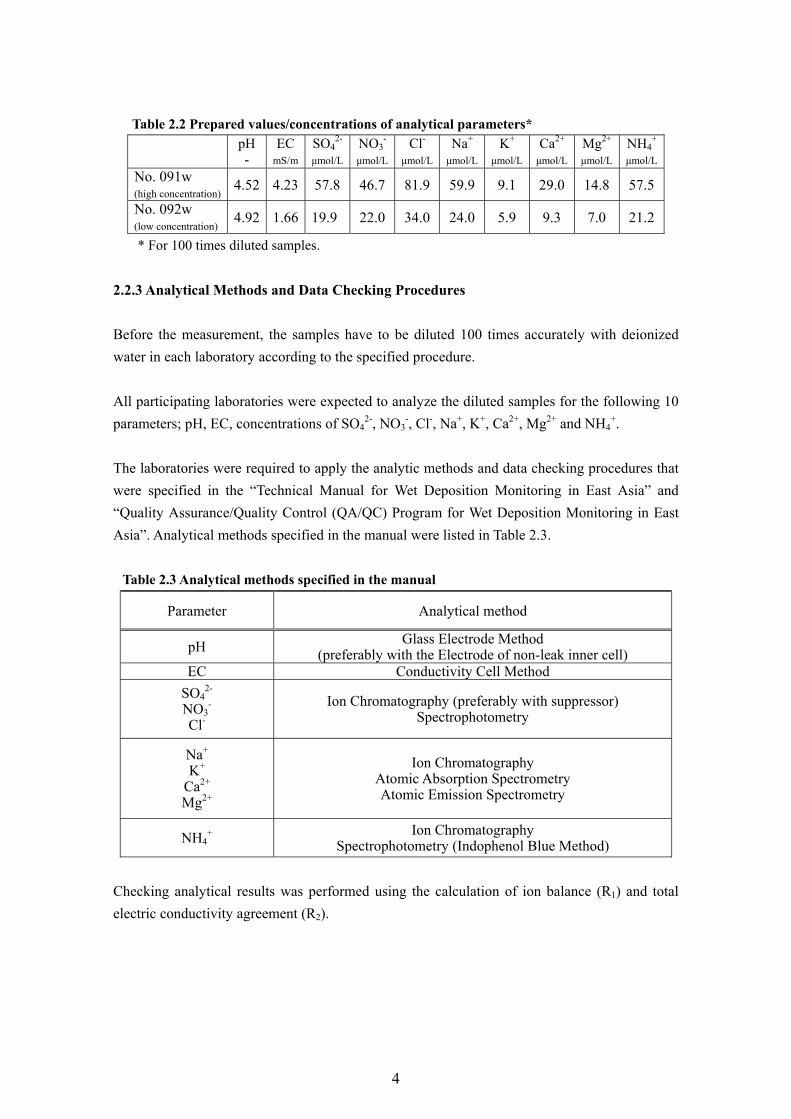
Table 2.2 Prepared values/concentrations of analytical parameters* pH
- EC
mS/m SO4
2-
μmol/LNO3
-
μmol/LCl-
μmol/LNa+
μmol/LK+
μmol/LCa2+ μmol/L
Mg2+ μmol/L
NH4+
μmol/LNo. 091w (high concentration)
4.52 4.23 57.8 46.7 81.9 59.9 9.1 29.0 14.8 57.5
No. 092w (low concentration)
4.92 1.66 19.9 22.0 34.0 24.0 5.9 9.3 7.0 21.2
* For 100 times diluted samples. 2.2.3 Analytical Methods and Data Checking Procedures Before the measurement, the samples have to be diluted 100 times accurately with deionized water in each laboratory according to the specified procedure. All participating laboratories were expected to analyze the diluted samples for the following 10 parameters; pH, EC, concentrations of SO4
2-, NO3-, Cl-, Na+, K+, Ca2+, Mg2+ and NH4
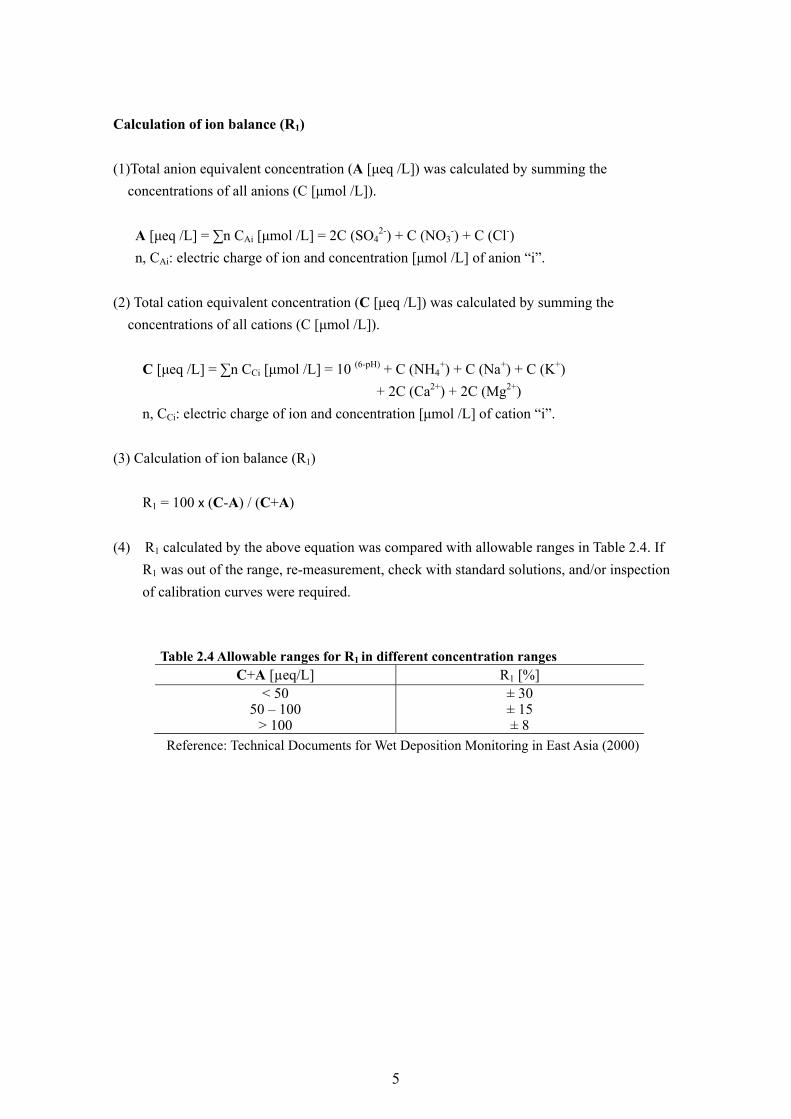
+. The laboratories were required to apply the analytic methods and data checking procedures that were specified in the “Technical Manual for Wet Deposition Monitoring in East Asia” and “Quality Assurance/Quality Control (QA/QC) Program for Wet Deposition Monitoring in East Asia”. Analytical methods specified in the manual were listed in Table 2.3.
Table 2.3 Analytical methods specified in the manual
Parameter Analytical method
pH Glass Electrode Method(preferably with the Electrode of non-leak inner cell)
EC Conductivity Cell MethodSO4
2- NO3
- Cl-
Ion Chromatography (preferably with suppressor) Spectrophotometry
Na+ K+
Ca2+ Mg2+
Ion Chromatography Atomic Absorption Spectrometry Atomic Emission Spectrometry
NH4+ Ion Chromatography
Spectrophotometry (Indophenol Blue Method) Checking analytical results was performed using the calculation of ion balance (R1) and total electric conductivity agreement (R2).
4
Calculation of ion balance (R1) (1)Total anion equivalent concentration (A [μeq /L]) was calculated by summing the
concentrations of all anions (C [μmol /L]). A [μeq /L] = ∑n CAi [μmol /L] = 2C (SO4
2-) + C (NO3-) + C (Cl-)
n, CAi: electric charge of ion and concentration [μmol /L] of anion “i”. (2) Total cation equivalent concentration (C [μeq /L]) was calculated by summing the
concentrations of all cations (C [μmol /L]). C [μeq /L] = ∑n CCi [μmol /L] = 10 (6-pH) + C (NH4
+) + C (Na+) + C (K+) + 2C (Ca2+) + 2C (Mg2+) n, CCi: electric charge of ion and concentration [μmol /L] of cation “i”. (3) Calculation of ion balance (R1)
R1 = 100 x (C-A) / (C+A)
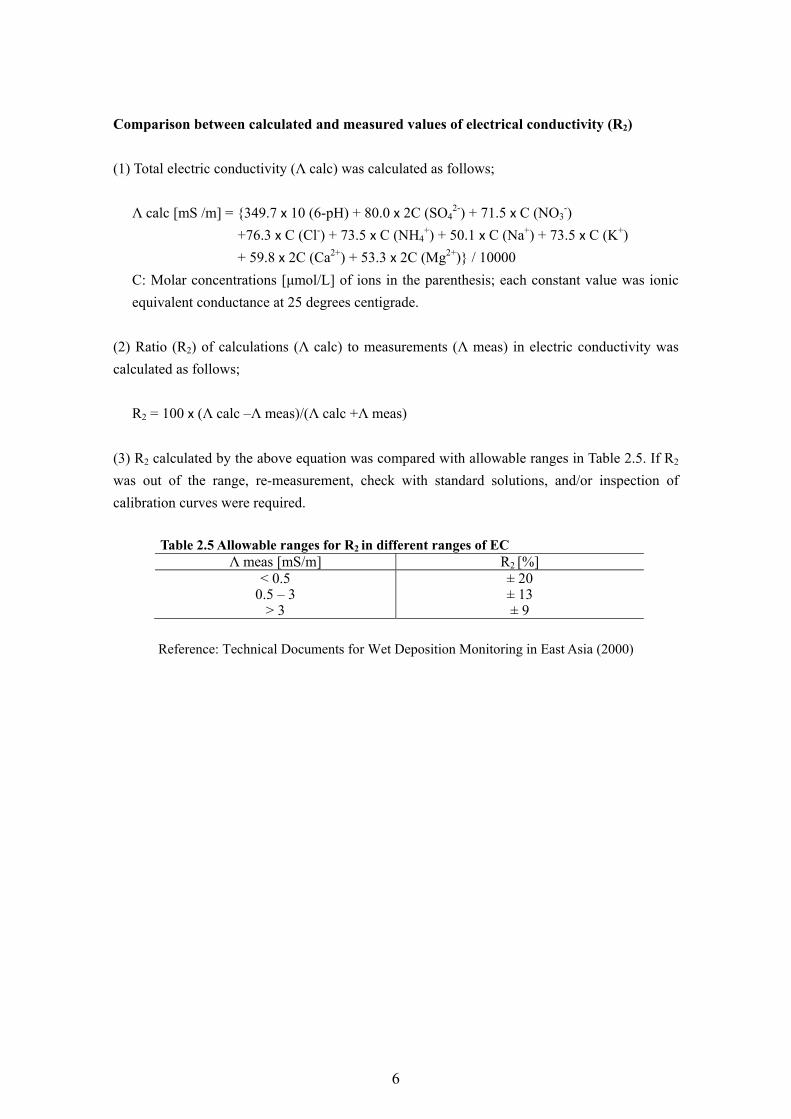
(4) R1 calculated by the above equation was compared with allowable ranges in Table 2.4. If
R1 was out of the range, re-measurement, check with standard solutions, and/or inspection of calibration curves were required.
Table 2.4 Allowable ranges for R1 in different concentration ranges C+A [µeq/L] R1 [%]
< 50 50 – 100
> 100
± 30± 15 ± 8
Reference: Technical Documents for Wet Deposition Monitoring in East Asia (2000)
5
Comparison between calculated and measured values of electrical conductivity (R2) (1) Total electric conductivity (Λ calc) was calculated as follows;
Λ calc [mS /m] = {349.7 x 10 (6-pH) + 80.0 x 2C (SO42-) + 71.5 x C (NO3
-) +76.3 x C (Cl-) + 73.5 x C (NH4
+) + 50.1 x C (Na+) + 73.5 x C (K+) + 59.8 x 2C (Ca2+) + 53.3 x 2C (Mg2+)} / 10000
C: Molar concentrations [μmol/L] of ions in the parenthesis; each constant value was ionic equivalent conductance at 25 degrees centigrade.
(2) Ratio (R2) of calculations (Λ calc) to measurements (Λ meas) in electric conductivity was calculated as follows;
R2 = 100 x (Λ calc –Λ meas)/(Λ calc +Λ meas) (3) R2 calculated by the above equation was compared with allowable ranges in Table 2.5. If R2 was out of the range, re-measurement, check with standard solutions, and/or inspection of calibration curves were required.
Table 2.5 Allowable ranges for R2 in different ranges of EC Λ meas [mS/m] R2 [%]
< 0.5 0.5 – 3
> 3
± 20± 13 ± 9
Reference: Technical Documents for Wet Deposition Monitoring in East Asia (2000)
6
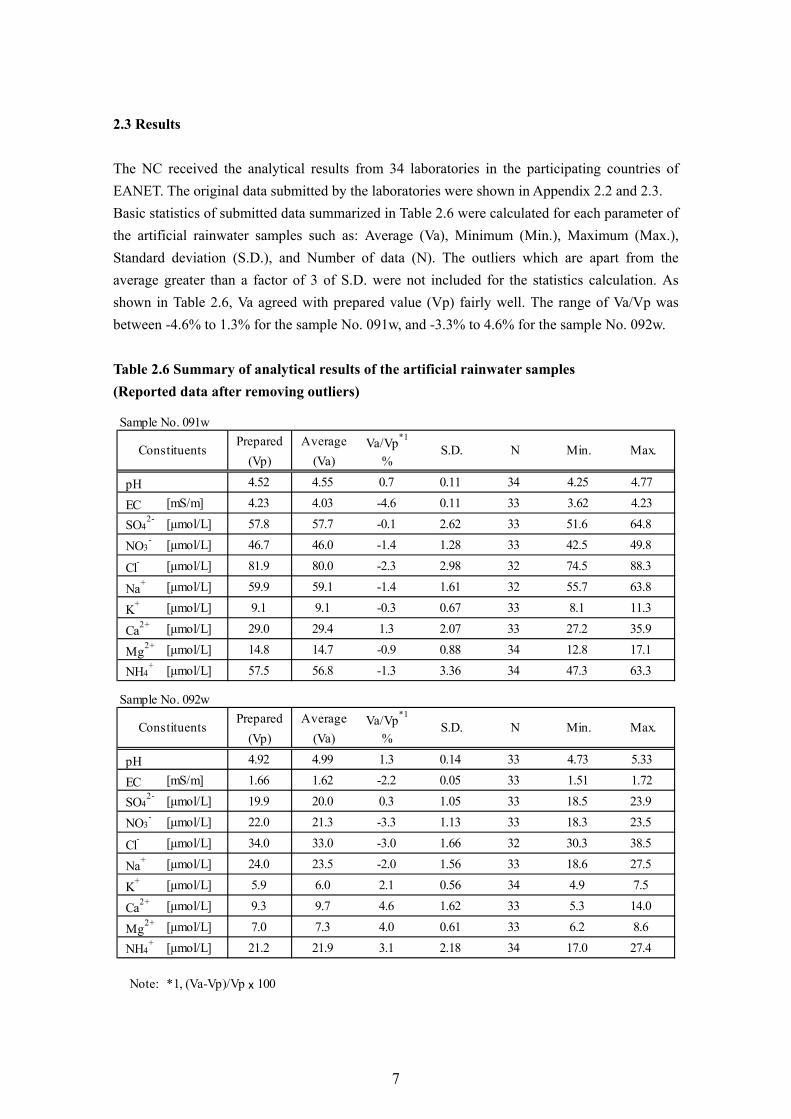
2.3 Results The NC received the analytical results from 34 laboratories in the participating countries of EANET. The original data submitted by the laboratories were shown in Appendix 2.2 and 2.3. Basic statistics of submitted data summarized in Table 2.6 were calculated for each parameter of the artificial rainwater samples such as: Average (Va), Minimum (Min.), Maximum (Max.), Standard deviation (S.D.), and Number of data (N). The outliers which are apart from the average greater than a factor of 3 of S.D. were not included for the statistics calculation. As shown in Table 2.6, Va agreed with prepared value (Vp) fairly well. The range of Va/Vp was between -4.6% to 1.3% for the sample No. 091w, and -3.3% to 4.6% for the sample No. 092w. Table 2.6 Summary of analytical results of the artificial rainwater samples (Reported data after removing outliers)
Sample No. 091wPrepared Average Va/Vp*1
(Vp) (Va) %
pH 4.52 4.55 0.7 0.11 34 4.25 4.77
EC [mS/m] 4.23 4.03 -4.6 0.11 33 3.62 4.23
SO42- [μmol/L] 57.8 57.7 -0.1 2.62 33 51.6 64.8
NO3- [μmol/L] 46.7 46.0 -1.4 1.28 33 42.5 49.8
Cl- [μmol/L] 81.9 80.0 -2.3 2.98 32 74.5 88.3
Na+ [μmol/L] 59.9 59.1 -1.4 1.61 32 55.7 63.8
K+ [μmol/L] 9.1 9.1 -0.3 0.67 33 8.1 11.3
Ca2+ [μmol/L] 29.0 29.4 1.3 2.07 33 27.2 35.9
Mg2+ [μmol/L] 14.8 14.7 -0.9 0.88 34 12.8 17.1
NH4+ [μmol/L] 57.5 56.8 -1.3 3.36 34 47.3 63.3
Sample No. 092wPrepared Average Va/Vp*1
(Vp) (Va) %
pH 4.92 4.99 1.3 0.14 33 4.73 5.33
EC [mS/m] 1.66 1.62 -2.2 0.05 33 1.51 1.72
SO42- [μmol/L] 19.9 20.0 0.3 1.05 33 18.5 23.9
NO3- [μmol/L] 22.0 21.3 -3.3 1.13 33 18.3 23.5
Cl- [μmol/L] 34.0 33.0 -3.0 1.66 32 30.3 38.5
Na+ [μmol/L] 24.0 23.5 -2.0 1.56 33 18.6 27.5
K+ [μmol/L] 5.9 6.0 2.1 0.56 34 4.9 7.5
Ca2+ [μmol/L] 9.3 9.7 4.6 1.62 33 5.3 14.0
Mg2+ [μmol/L] 7.0 7.3 4.0 0.61 33 6.2 8.6
NH4+ [μmol/L] 21.2 21.9 3.1 2.18 34 17.0 27.4
Note: *1, (Va-Vp)/Vp x 100
Max.Min.NS.D.Constituents
Constituents S.D. N Min. Max.
7
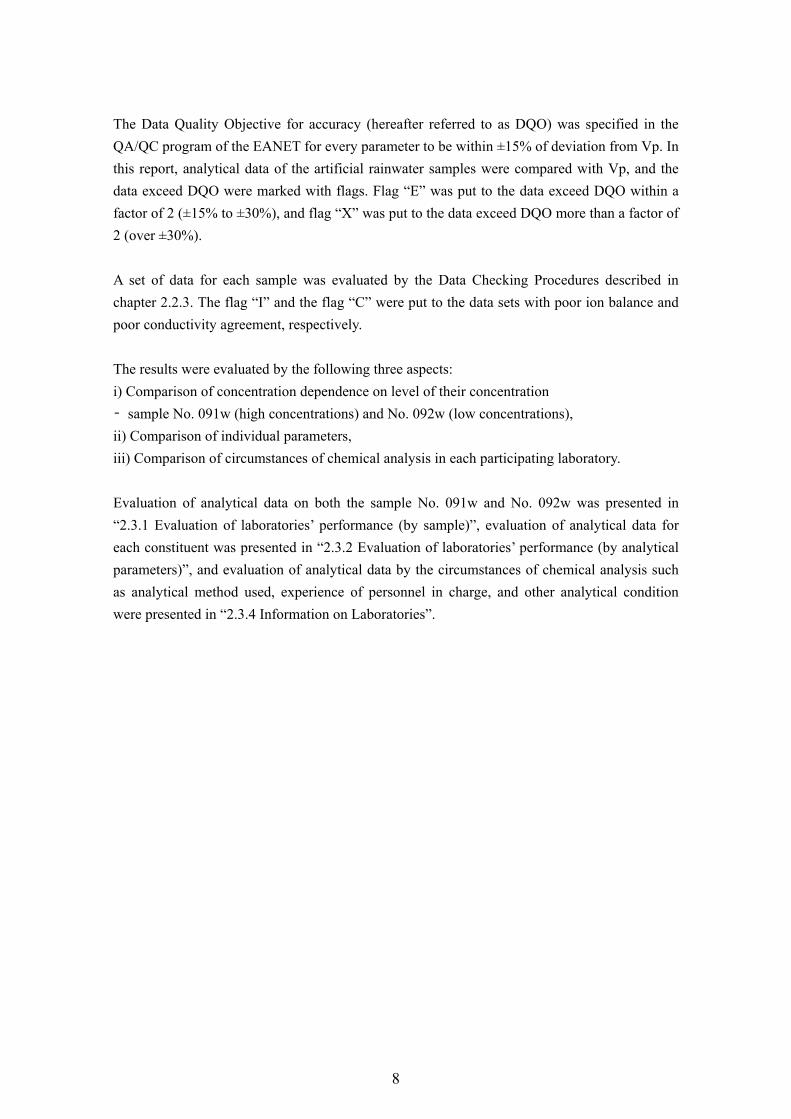
The Data Quality Objective for accuracy (hereafter referred to as DQO) was specified in the QA/QC program of the EANET for every parameter to be within ±15% of deviation from Vp. In this report, analytical data of the artificial rainwater samples were compared with Vp, and the data exceed DQO were marked with flags. Flag “E” was put to the data exceed DQO within a factor of 2 (±15% to ±30%), and flag “X” was put to the data exceed DQO more than a factor of 2 (over ±30%). A set of data for each sample was evaluated by the Data Checking Procedures described in chapter 2.2.3. The flag “I” and the flag “C” were put to the data sets with poor ion balance and poor conductivity agreement, respectively. The results were evaluated by the following three aspects: i) Comparison of concentration dependence on level of their concentration – sample No. 091w (high concentrations) and No. 092w (low concentrations), ii) Comparison of individual parameters, iii) Comparison of circumstances of chemical analysis in each participating laboratory. Evaluation of analytical data on both the sample No. 091w and No. 092w was presented in “2.3.1 Evaluation of laboratories’ performance (by sample)”, evaluation of analytical data for each constituent was presented in “2.3.2 Evaluation of laboratories’ performance (by analytical parameters)”, and evaluation of analytical data by the circumstances of chemical analysis such as analytical method used, experience of personnel in charge, and other analytical condition were presented in “2.3.4 Information on Laboratories”.
8
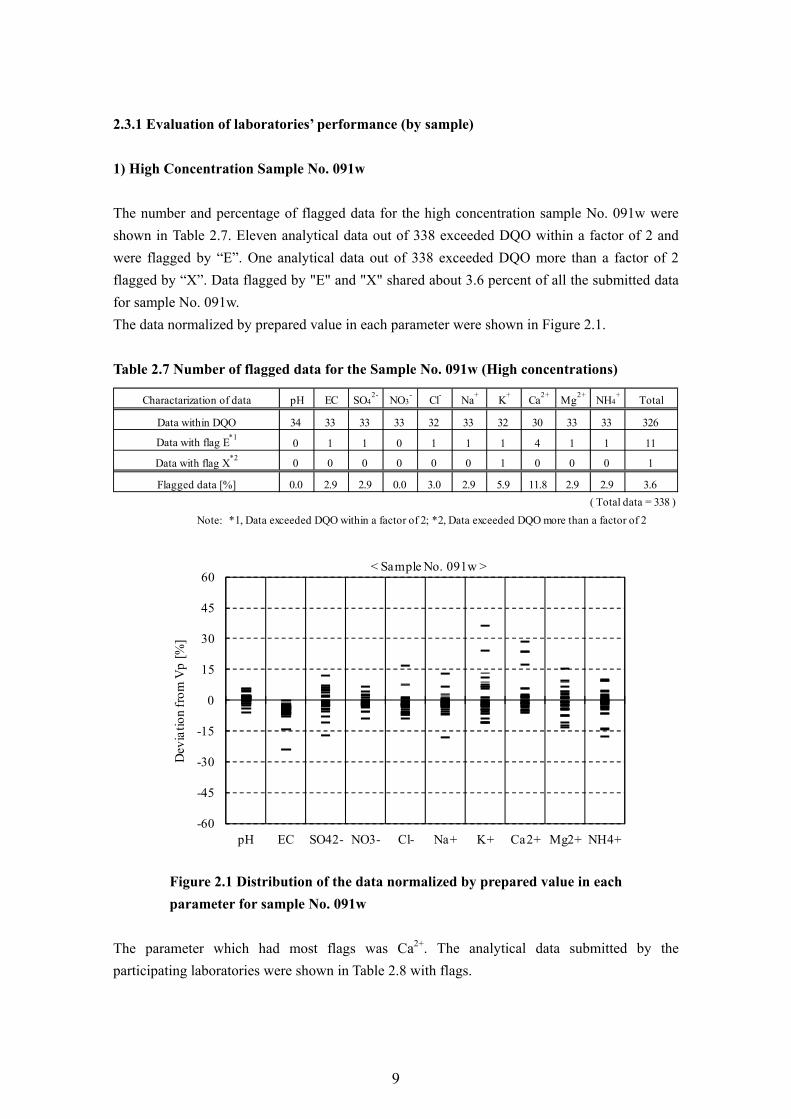
2.3.1 Evaluation of laboratories’ performance (by sample) 1) High Concentration Sample No. 091w The number and percentage of flagged data for the high concentration sample No. 091w were shown in Table 2.7. Eleven analytical data out of 338 exceeded DQO within a factor of 2 and were flagged by “E”. One analytical data out of 338 exceeded DQO more than a factor of 2 flagged by “X”. Data flagged by "E" and "X" shared about 3.6 percent of all the submitted data for sample No. 091w. The data normalized by prepared value in each parameter were shown in Figure 2.1. Table 2.7 Number of flagged data for the Sample No. 091w (High concentrations)
pH EC SO42- NO3
- Cl- Na+ K+ Ca2+ Mg2+ NH4+ Total
34 33 33 33 32 33 32 30 33 33 326
0 1 1 0 1 1 1 4 1 1 11
0 0 0 0 0 0 1 0 0 0 1
0.0 2.9 2.9 0.0 3.0 2.9 5.9 11.8 2.9 2.9 3.6( Total data = 338 )
Note: *1, Data exceeded DQO within a factor of 2; *2, Data exceeded DQO more than a factor of 2
Data within DQO
Data with flag E*1
Data with flag X*2
Flagged data [%]
Charactarization of data
Figure 2.1 Distribution of the data normalized by prepared value in each parameter for sample No. 091w
The parameter which had most flags was Ca2+. The analytical data submitted by the participating laboratories were shown in Table 2.8 with flags.
-60
-45
-30
-15
0
15
30
45
60
pH EC SO42- NO3- Cl- Na+ K+ Ca2+ Mg2+ NH4+
Dev
iatio
n fr
om V
p [%
]
< Sample No. 091w >
9
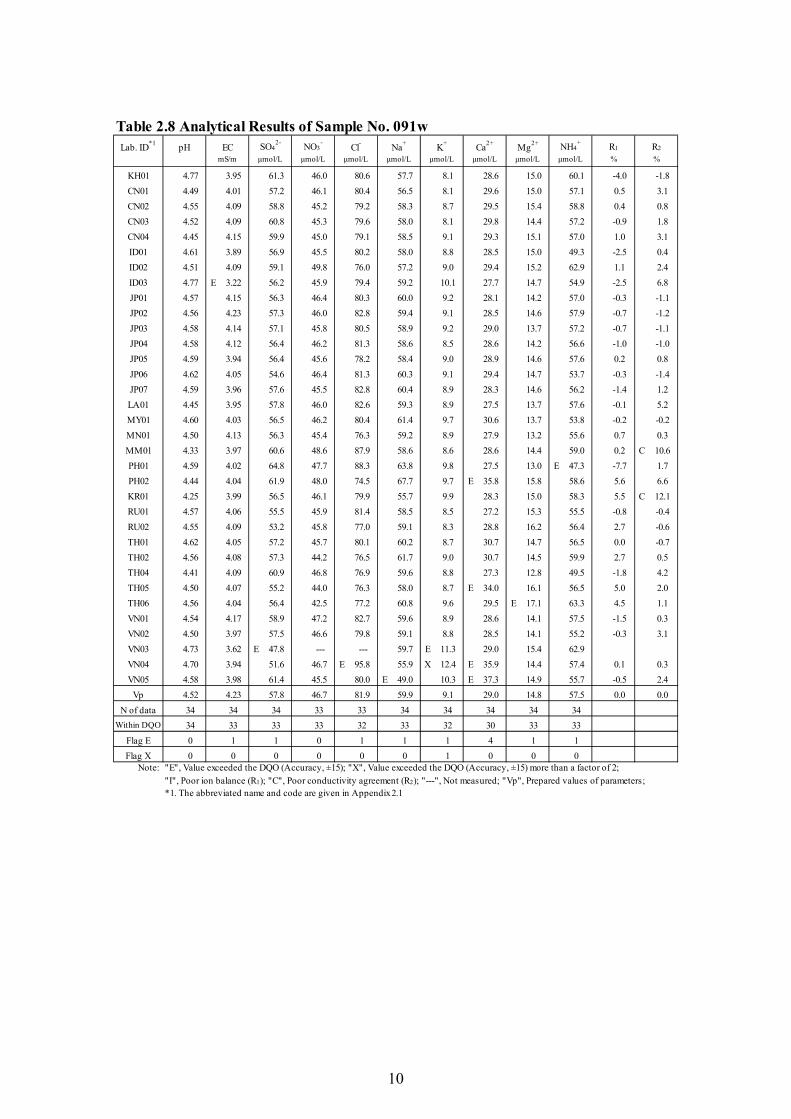
Table 2.8 Analytical Results of Sample No. 091wLab. ID*1
KH01 4.77 3.95 61.3 46.0 80.6 57.7 8.1 28.6 15.0 60.1 -4.0 -1.8CN01 4.49 4.01 57.2 46.1 80.4 56.5 8.1 29.6 15.0 57.1 0.5 3.1CN02 4.55 4.09 58.8 45.2 79.2 58.3 8.7 29.5 15.4 58.8 0.4 0.8CN03 4.52 4.09 60.8 45.3 79.6 58.0 8.1 29.8 14.4 57.2 -0.9 1.8CN04 4.45 4.15 59.9 45.0 79.1 58.5 9.1 29.3 15.1 57.0 1.0 3.1ID01 4.61 3.89 56.9 45.5 80.2 58.0 8.8 28.5 15.0 49.3 -2.5 0.4ID02 4.51 4.09 59.1 49.8 76.0 57.2 9.0 29.4 15.2 62.9 1.1 2.4ID03 4.77 E 3.22 56.2 45.9 79.4 59.2 10.1 27.7 14.7 54.9 -2.5 6.8JP01 4.57 4.15 56.3 46.4 80.3 60.0 9.2 28.1 14.2 57.0 -0.3 -1.1JP02 4.56 4.23 57.3 46.0 82.8 59.4 9.1 28.5 14.6 57.9 -0.7 -1.2JP03 4.58 4.14 57.1 45.8 80.5 58.9 9.2 29.0 13.7 57.2 -0.7 -1.1JP04 4.58 4.12 56.4 46.2 81.3 58.6 8.5 28.6 14.2 56.6 -1.0 -1.0JP05 4.59 3.94 56.4 45.6 78.2 58.4 9.0 28.9 14.6 57.6 0.2 0.8JP06 4.62 4.05 54.6 46.4 81.3 60.3 9.1 29.4 14.7 53.7 -0.3 -1.4JP07 4.59 3.96 57.6 45.5 82.8 60.4 8.9 28.3 14.6 56.2 -1.4 1.2LA01 4.45 3.95 57.8 46.0 82.6 59.3 8.9 27.5 13.7 57.6 -0.1 5.2MY01 4.60 4.03 56.5 46.2 80.4 61.4 9.7 30.6 13.7 53.8 -0.2 -0.2MN01 4.50 4.13 56.3 45.4 76.3 59.2 8.9 27.9 13.2 55.6 0.7 0.3MM01 4.33 3.97 60.6 48.6 87.9 58.6 8.6 28.6 14.4 59.0 0.2 C 10.6PH01 4.59 4.02 64.8 47.7 88.3 63.8 9.8 27.5 13.0 E 47.3 -7.7 1.7PH02 4.44 4.04 61.9 48.0 74.5 67.7 9.7 E 35.8 15.8 58.6 5.6 6.6KR01 4.25 3.99 56.5 46.1 79.9 55.7 9.9 28.3 15.0 58.3 5.5 C 12.1RU01 4.57 4.06 55.5 45.9 81.4 58.5 8.5 27.2 15.3 55.5 -0.8 -0.4RU02 4.55 4.09 53.2 45.8 77.0 59.1 8.3 28.8 16.2 56.4 2.7 -0.6TH01 4.62 4.05 57.2 45.7 80.1 60.2 8.7 30.7 14.7 56.5 0.0 -0.7TH02 4.56 4.08 57.3 44.2 76.5 61.7 9.0 30.7 14.5 59.9 2.7 0.5TH04 4.41 4.09 60.9 46.8 76.9 59.6 8.8 27.3 12.8 49.5 -1.8 4.2TH05 4.50 4.07 55.2 44.0 76.3 58.0 8.7 E 34.0 16.1 56.5 5.0 2.0TH06 4.56 4.04 56.4 42.5 77.2 60.8 9.6 29.5 E 17.1 63.3 4.5 1.1VN01 4.54 4.17 58.9 47.2 82.7 59.6 8.9 28.6 14.1 57.5 -1.5 0.3VN02 4.50 3.97 57.5 46.6 79.8 59.1 8.8 28.5 14.1 55.2 -0.3 3.1VN03 4.73 3.62 E 47.8 --- --- 59.7 E 11.3 29.0 15.4 62.9VN04 4.70 3.94 51.6 46.7 E 95.8 55.9 X 12.4 E 35.9 14.4 57.4 0.1 0.3VN05 4.58 3.98 61.4 45.5 80.0 E 49.0 10.3 E 37.3 14.9 55.7 -0.5 2.4
Vp 4.52 4.23 57.8 46.7 81.9 59.9 9.1 29.0 14.8 57.5 0.0 0.0N of data 34 34 34 33 33 34 34 34 34 34
Within DQO 34 33 33 33 32 33 32 30 33 33Flag E 0 1 1 0 1 1 1 4 1 1Flag X 0 0 0 0 0 0 1 0 0 0
Note: "E", Value exceeded the DQO (Accuracy, ±15); "X", Value exceeded the DQO (Accuracy, ±15) more than a factor of 2; "I", Poor ion balance (R1); "C", Poor conductivity agreement (R2); "---", Not measured; "Vp", Prepared values of parameters;*1. The abbreviated name and code are given in Appendix 2.1
NH4+ R1 R2
mS/m μmol/L μmol/L μmol/L μmol/L μmol/L μmol/L μmol/L μmol/L % %pH K+ Ca2+ Mg2+EC SO4
2- NO3- Cl- Na+
10
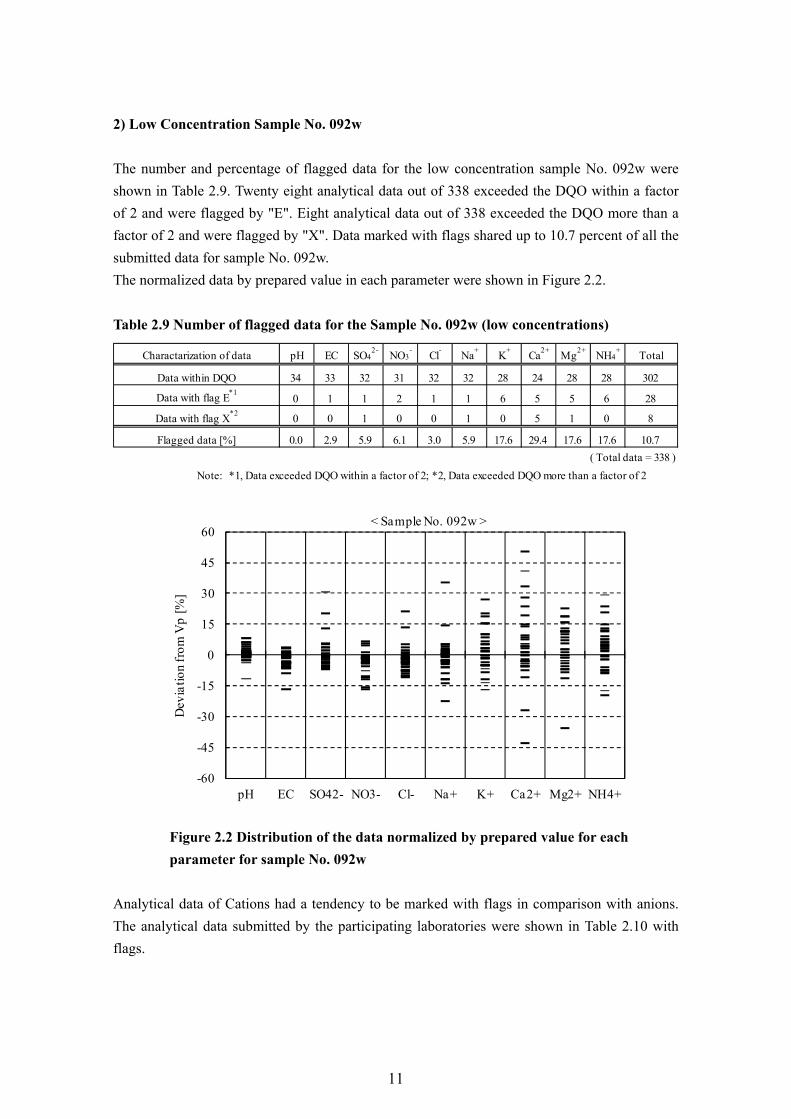
2) Low Concentration Sample No. 092w The number and percentage of flagged data for the low concentration sample No. 092w were shown in Table 2.9. Twenty eight analytical data out of 338 exceeded the DQO within a factor of 2 and were flagged by "E". Eight analytical data out of 338 exceeded the DQO more than a factor of 2 and were flagged by "X". Data marked with flags shared up to 10.7 percent of all the submitted data for sample No. 092w. The normalized data by prepared value in each parameter were shown in Figure 2.2. Table 2.9 Number of flagged data for the Sample No. 092w (low concentrations)
pH EC SO42- NO3
- Cl- Na+ K+ Ca2+ Mg2+ NH4+ Total
34 33 32 31 32 32 28 24 28 28 302
0 1 1 2 1 1 6 5 5 6 28
0 0 1 0 0 1 0 5 1 0 8
0.0 2.9 5.9 6.1 3.0 5.9 17.6 29.4 17.6 17.6 10.7( Total data = 338 )
Note: *1, Data exceeded DQO within a factor of 2; *2, Data exceeded DQO more than a factor of 2
Flagged data [%]
Data with flag X*2
Data with flag E*1
Data within DQO
Charactarization of data
Figure 2.2 Distribution of the data normalized by prepared value for each parameter for sample No. 092w
Analytical data of Cations had a tendency to be marked with flags in comparison with anions. The analytical data submitted by the participating laboratories were shown in Table 2.10 with flags.
-60
-45
-30
-15
0
15
30
45
60
pH EC SO42- NO3- Cl- Na+ K+ Ca2+ Mg2+ NH4+
Dev
iatio
n fr
om V
p [%
]
< Sample No. 092w >
11
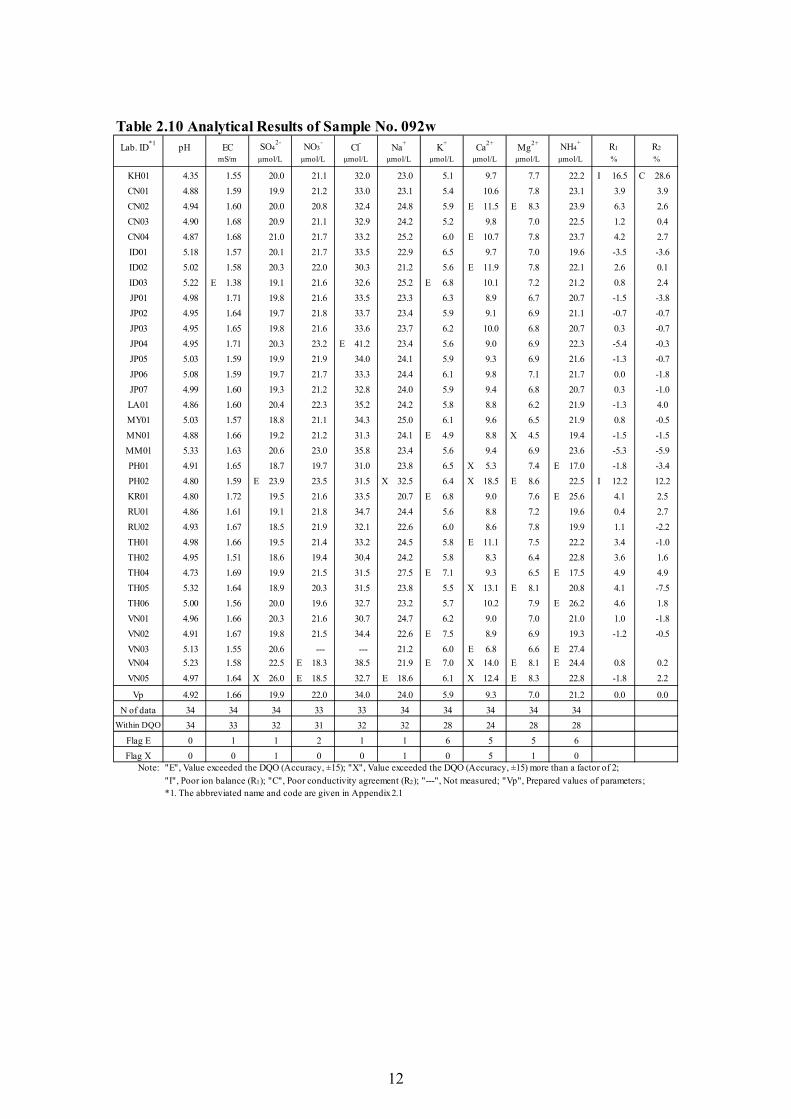
Table 2.10 Analytical Results of Sample No. 092wLab. ID*1
KH01 4.35 1.55 20.0 21.1 32.0 23.0 5.1 9.7 7.7 22.2 I 16.5 C 28.6CN01 4.88 1.59 19.9 21.2 33.0 23.1 5.4 10.6 7.8 23.1 3.9 3.9CN02 4.94 1.60 20.0 20.8 32.4 24.8 5.9 E 11.5 E 8.3 23.9 6.3 2.6CN03 4.90 1.68 20.9 21.1 32.9 24.2 5.2 9.8 7.0 22.5 1.2 0.4CN04 4.87 1.68 21.0 21.7 33.2 25.2 6.0 E 10.7 7.8 23.7 4.2 2.7ID01 5.18 1.57 20.1 21.7 33.5 22.9 6.5 9.7 7.0 19.6 -3.5 -3.6ID02 5.02 1.58 20.3 22.0 30.3 21.2 5.6 E 11.9 7.8 22.1 2.6 0.1ID03 5.22 E 1.38 19.1 21.6 32.6 25.2 E 6.8 10.1 7.2 21.2 0.8 2.4JP01 4.98 1.71 19.8 21.6 33.5 23.3 6.3 8.9 6.7 20.7 -1.5 -3.8JP02 4.95 1.64 19.7 21.8 33.7 23.4 5.9 9.1 6.9 21.1 -0.7 -0.7JP03 4.95 1.65 19.8 21.6 33.6 23.7 6.2 10.0 6.8 20.7 0.3 -0.7JP04 4.95 1.71 20.3 23.2 E 41.2 23.4 5.6 9.0 6.9 22.3 -5.4 -0.3JP05 5.03 1.59 19.9 21.9 34.0 24.1 5.9 9.3 6.9 21.6 -1.3 -0.7JP06 5.08 1.59 19.7 21.7 33.3 24.4 6.1 9.8 7.1 21.7 0.0 -1.8JP07 4.99 1.60 19.3 21.2 32.8 24.0 5.9 9.4 6.8 20.7 0.3 -1.0LA01 4.86 1.60 20.4 22.3 35.2 24.2 5.8 8.8 6.2 21.9 -1.3 4.0MY01 5.03 1.57 18.8 21.1 34.3 25.0 6.1 9.6 6.5 21.9 0.8 -0.5MN01 4.88 1.66 19.2 21.2 31.3 24.1 E 4.9 8.8 X 4.5 19.4 -1.5 -1.5MM01 5.33 1.63 20.6 23.0 35.8 23.4 5.6 9.4 6.9 23.6 -5.3 -5.9PH01 4.91 1.65 18.7 19.7 31.0 23.8 6.5 X 5.3 7.4 E 17.0 -1.8 -3.4PH02 4.80 1.59 E 23.9 23.5 31.5 X 32.5 6.4 X 18.5 E 8.6 22.5 I 12.2 12.2KR01 4.80 1.72 19.5 21.6 33.5 20.7 E 6.8 9.0 7.6 E 25.6 4.1 2.5RU01 4.86 1.61 19.1 21.8 34.7 24.4 5.6 8.8 7.2 19.6 0.4 2.7RU02 4.93 1.67 18.5 21.9 32.1 22.6 6.0 8.6 7.8 19.9 1.1 -2.2TH01 4.98 1.66 19.5 21.4 33.2 24.5 5.8 E 11.1 7.5 22.2 3.4 -1.0TH02 4.95 1.51 18.6 19.4 30.4 24.2 5.8 8.3 6.4 22.8 3.6 1.6TH04 4.73 1.69 19.9 21.5 31.5 27.5 E 7.1 9.3 6.5 E 17.5 4.9 4.9TH05 5.32 1.64 18.9 20.3 31.5 23.8 5.5 X 13.1 E 8.1 20.8 4.1 -7.5TH06 5.00 1.56 20.0 19.6 32.7 23.2 5.7 10.2 7.9 E 26.2 4.6 1.8VN01 4.96 1.66 20.3 21.6 30.7 24.7 6.2 9.0 7.0 21.0 1.0 -1.8VN02 4.91 1.67 19.8 21.5 34.4 22.6 E 7.5 8.9 6.9 19.3 -1.2 -0.5VN03 5.13 1.55 20.6 --- --- 21.2 6.0 E 6.8 6.6 E 27.4VN04 5.23 1.58 22.5 E 18.3 38.5 21.9 E 7.0 X 14.0 E 8.1 E 24.4 0.8 0.2VN05 4.97 1.64 X 26.0 E 18.5 32.7 E 18.6 6.1 X 12.4 E 8.3 22.8 -1.8 2.2
Vp 4.92 1.66 19.9 22.0 34.0 24.0 5.9 9.3 7.0 21.2 0.0 0.0N of data 34 34 34 33 33 34 34 34 34 34
Within DQO 34 33 32 31 32 32 28 24 28 28Flag E 0 1 1 2 1 1 6 5 5 6Flag X 0 0 1 0 0 1 0 5 1 0
Note: "E", Value exceeded the DQO (Accuracy, ±15); "X", Value exceeded the DQO (Accuracy, ±15) more than a factor of 2; "I", Poor ion balance (R1); "C", Poor conductivity agreement (R2); "---", Not measured; "Vp", Prepared values of parameters;*1. The abbreviated name and code are given in Appendix 2.1
%mS/m μmol/L μmol/L μmol/L μmol/L μmol/L μmol/L μmol/L μmol/L %R2pH EC SO4
2- NO3- Cl- Na+ K+ Ca2+ Mg2+ NH4
+ R1
12
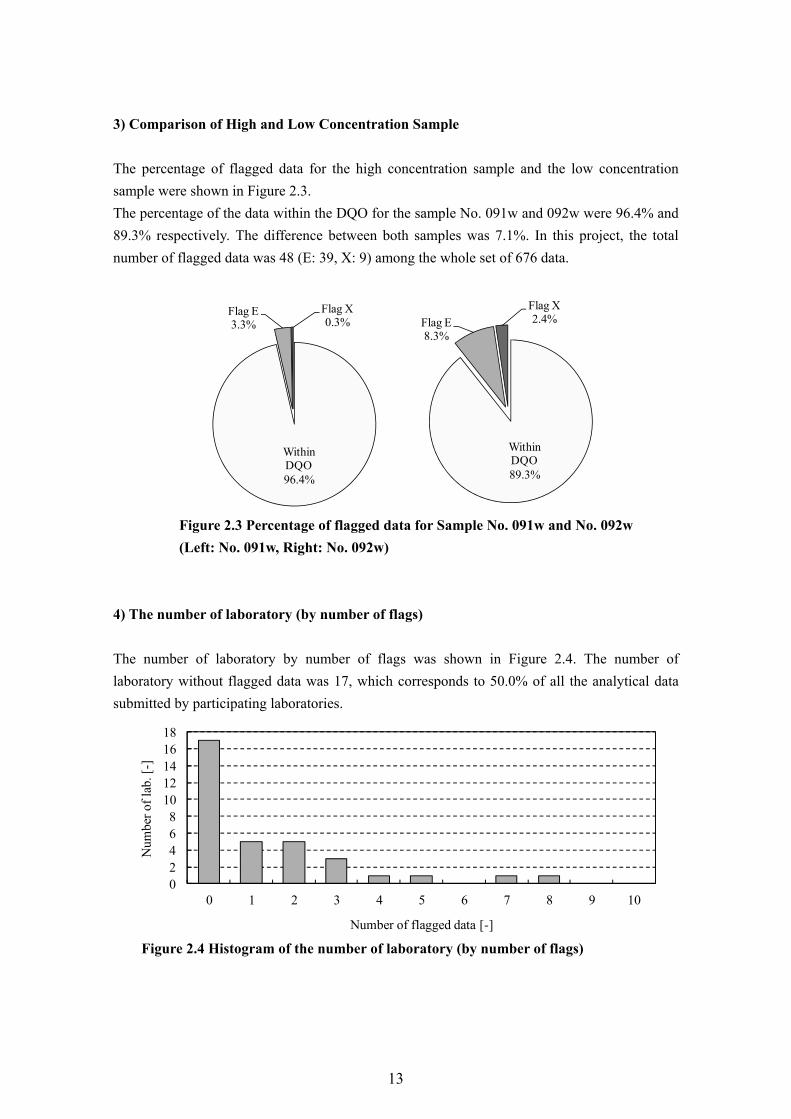
3) Comparison of High and Low Concentration Sample The percentage of flagged data for the high concentration sample and the low concentration sample were shown in Figure 2.3. The percentage of the data within the DQO for the sample No. 091w and 092w were 96.4% and 89.3% respectively. The difference between both samples was 7.1%. In this project, the total number of flagged data was 48 (E: 39, X: 9) among the whole set of 676 data.
Figure 2.3 Percentage of flagged data for Sample No. 091w and No. 092w (Left: No. 091w, Right: No. 092w)
4) The number of laboratory (by number of flags) The number of laboratory by number of flags was shown in Figure 2.4. The number of laboratory without flagged data was 17, which corresponds to 50.0% of all the analytical data submitted by participating laboratories.
Figure 2.4 Histogram of the number of laboratory (by number of flags)
Within DQO89.3%
Flag E8.3%
Flag X2.4%
Within DQO96.4%
Flag E3.3%
Flag X0.3%
02468
1012141618
0 1 2 3 4 5 6 7 8 9 10
Num
ber o
f lab
. [-]
Number of flagged data [-]
13
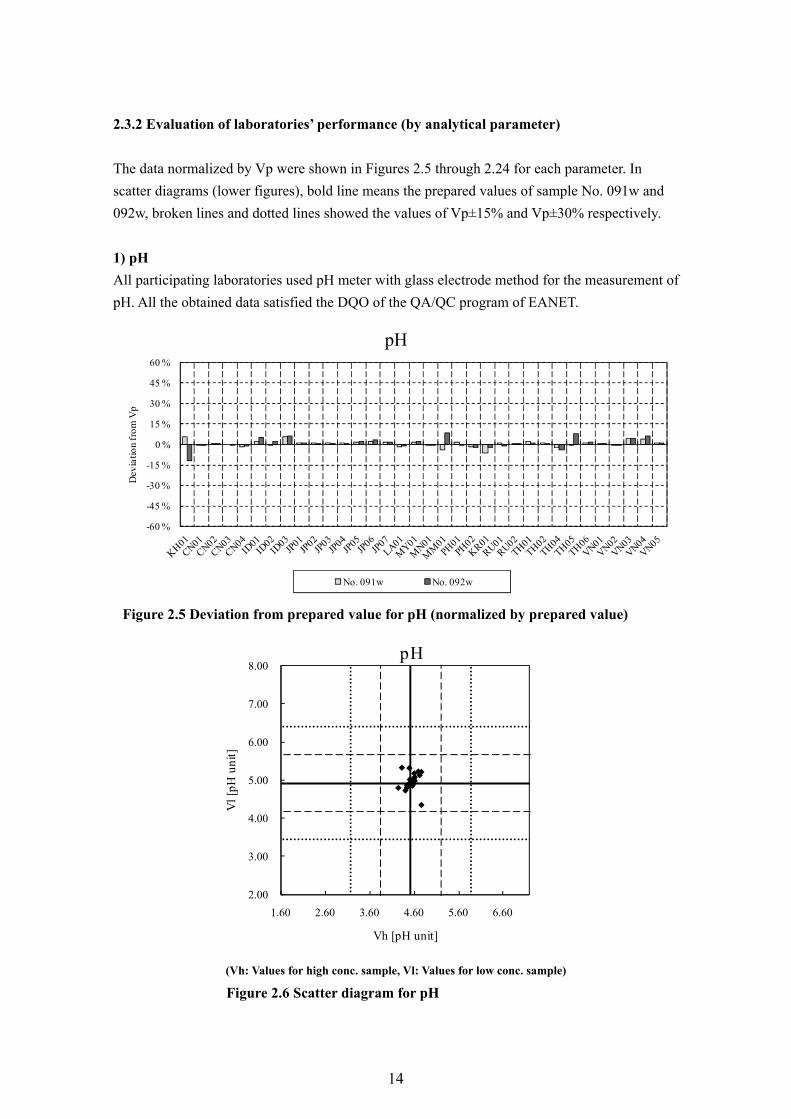
2.3.2 Evaluation of laboratories’ performance (by analytical parameter) The data normalized by Vp were shown in Figures 2.5 through 2.24 for each parameter. In scatter diagrams (lower figures), bold line means the prepared values of sample No. 091w and 092w, broken lines and dotted lines showed the values of Vp±15% and Vp±30% respectively. 1) pH All participating laboratories used pH meter with glass electrode method for the measurement of pH. All the obtained data satisfied the DQO of the QA/QC program of EANET.
Figure 2.5 Deviation from prepared value for pH (normalized by prepared value)
(Vh: Values for high conc. sample, Vl: Values for low conc. sample)
Figure 2.6 Scatter diagram for pH
-60 %
-45 %
-30 %
-15 %
0 %
15 %
30 %
45 %
60 %
Dev
iatio
n fr
om V
p
pH
No. 091w No. 092w
2.00
3.00
4.00
5.00
6.00
7.00
8.00
1.60 2.60 3.60 4.60 5.60 6.60
Vl [
pH u
nit]
Vh [pH unit]
pH
14
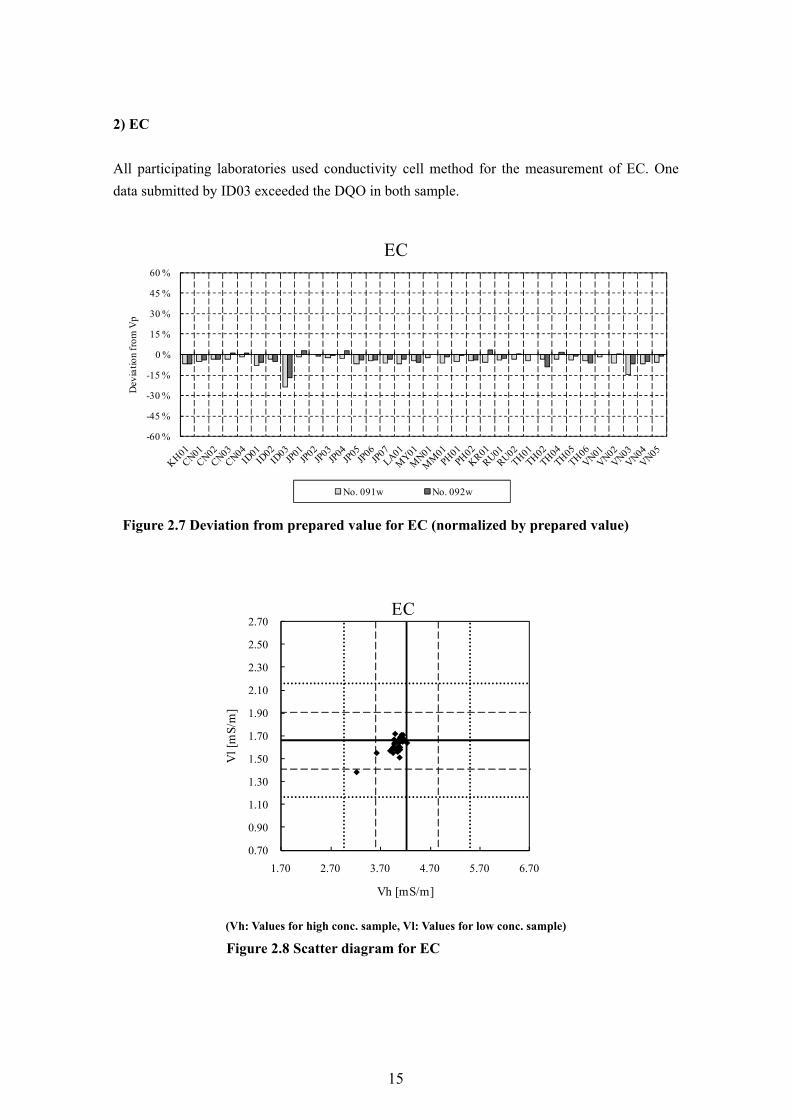
2) EC All participating laboratories used conductivity cell method for the measurement of EC. One data submitted by ID03 exceeded the DQO in both sample.
-60 %
-45 %
-30 %
-15 %
0 %
15 %
30 %
45 %
60 %
Dev
iatio
n fr
om V
p
EC
No. 091w No. 092w
Figure 2.7 Deviation from prepared value for EC (normalized by prepared value)
(Vh: Values for high conc. sample, Vl: Values for low conc. sample)
Figure 2.8 Scatter diagram for EC
0.70
0.90
1.10
1.30
1.50
1.70
1.90
2.10
2.30
2.50
2.70
1.70 2.70 3.70 4.70 5.70 6.70
Vl [
mS/
m]
Vh [mS/m]
EC
15
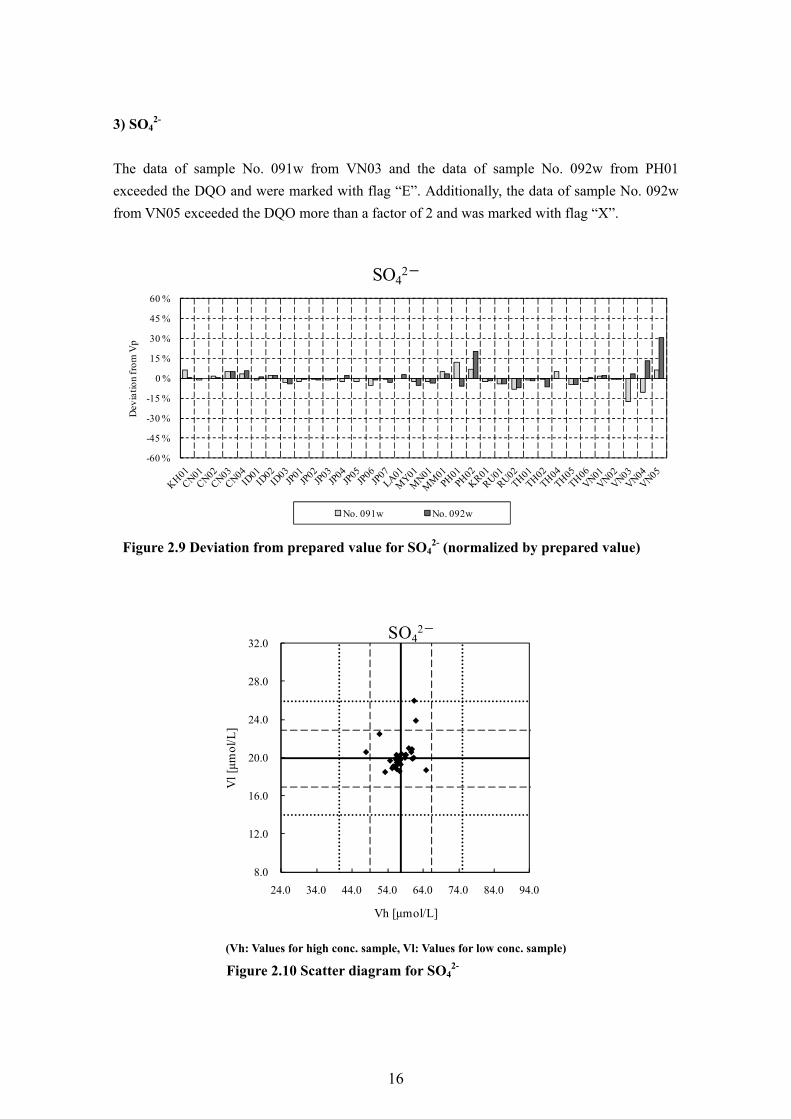
3) SO42-
The data of sample No. 091w from VN03 and the data of sample No. 092w from PH01 exceeded the DQO and were marked with flag “E”. Additionally, the data of sample No. 092w from VN05 exceeded the DQO more than a factor of 2 and was marked with flag “X”.
-60 %
-45 %
-30 %
-15 %
0 %
15 %
30 %
45 %
60 %
Dev
iatio
n fr
om V
p
SO42-
No. 091w No. 092w
Figure 2.9 Deviation from prepared value for SO42- (normalized by prepared value)
(Vh: Values for high conc. sample, Vl: Values for low conc. sample) Figure 2.10 Scatter diagram for SO4
2-
8.0
12.0
16.0
20.0
24.0
28.0
32.0
24.0 34.0 44.0 54.0 64.0 74.0 84.0 94.0
Vl [μm
ol/L
]
Vh [μmol/L]
SO42-
16
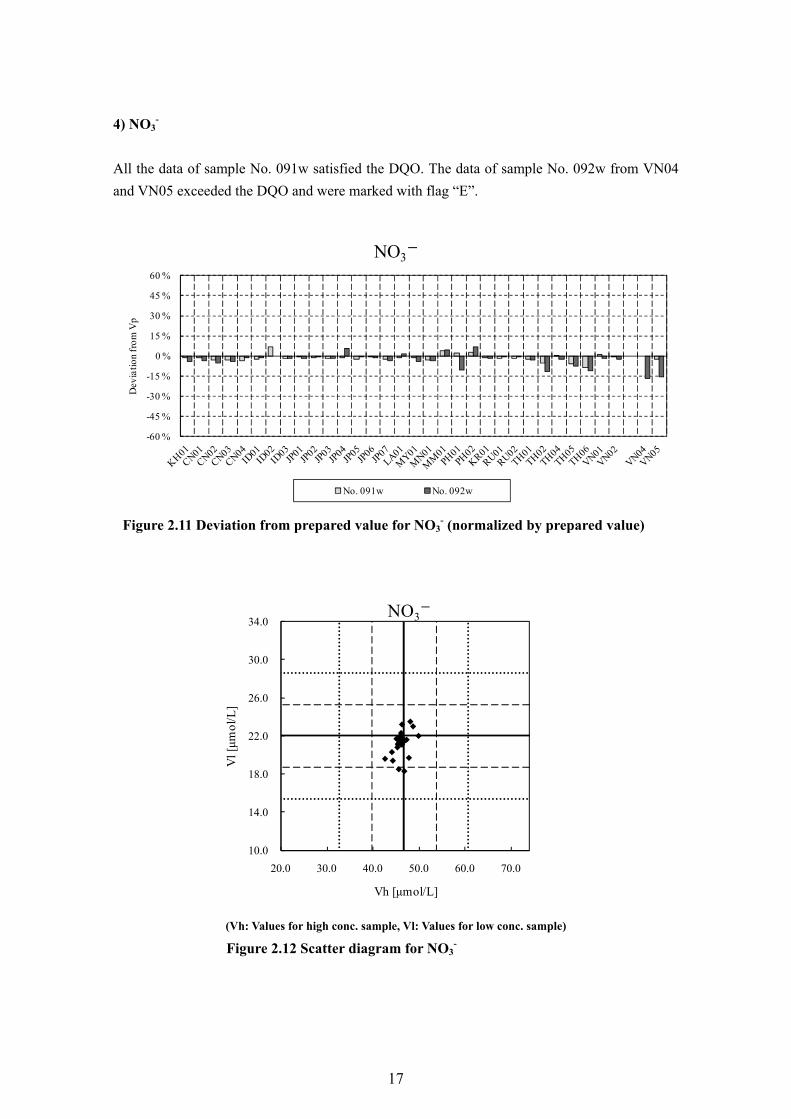
4) NO3-
All the data of sample No. 091w satisfied the DQO. The data of sample No. 092w from VN04 and VN05 exceeded the DQO and were marked with flag “E”.
-60 %
-45 %
-30 %
-15 %
0 %
15 %
30 %
45 %
60 %
Dev
iatio
n fr
om V
p
NO3-
No. 091w No. 092w
Figure 2.11 Deviation from prepared value for NO3- (normalized by prepared value)
(Vh: Values for high conc. sample, Vl: Values for low conc. sample) Figure 2.12 Scatter diagram for NO3
-
10.0
14.0
18.0
22.0
26.0
30.0
34.0
20.0 30.0 40.0 50.0 60.0 70.0
Vl [μm
ol/L
]
Vh [μmol/L]
NO3-
17
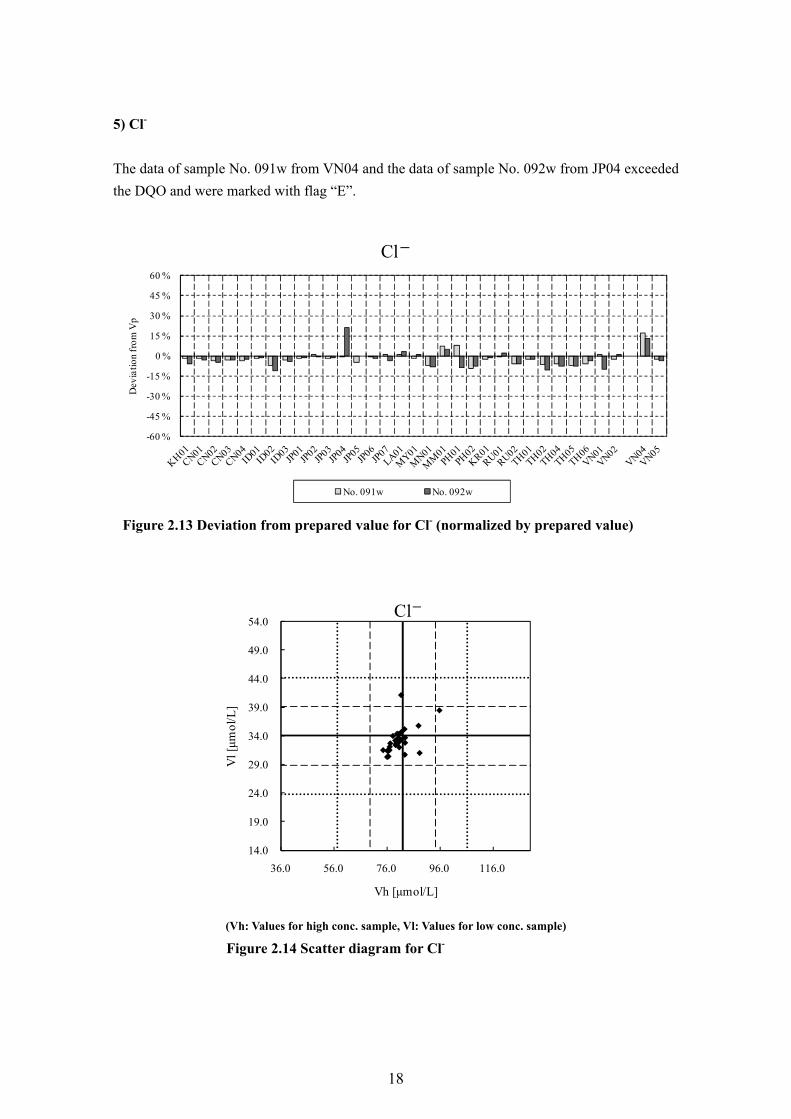
5) Cl- The data of sample No. 091w from VN04 and the data of sample No. 092w from JP04 exceeded the DQO and were marked with flag “E”.
-60 %
-45 %
-30 %
-15 %
0 %
15 %
30 %
45 %
60 %
Dev
iatio
n fr
om V
p
Cl-
No. 091w No. 092w
Figure 2.13 Deviation from prepared value for Cl- (normalized by prepared value)
(Vh: Values for high conc. sample, Vl: Values for low conc. sample) Figure 2.14 Scatter diagram for Cl-
14.0
19.0
24.0
29.0
34.0
39.0
44.0
49.0
54.0
36.0 56.0 76.0 96.0 116.0
Vl [μm
ol/L
]
Vh [μmol/L]
Cl-
18
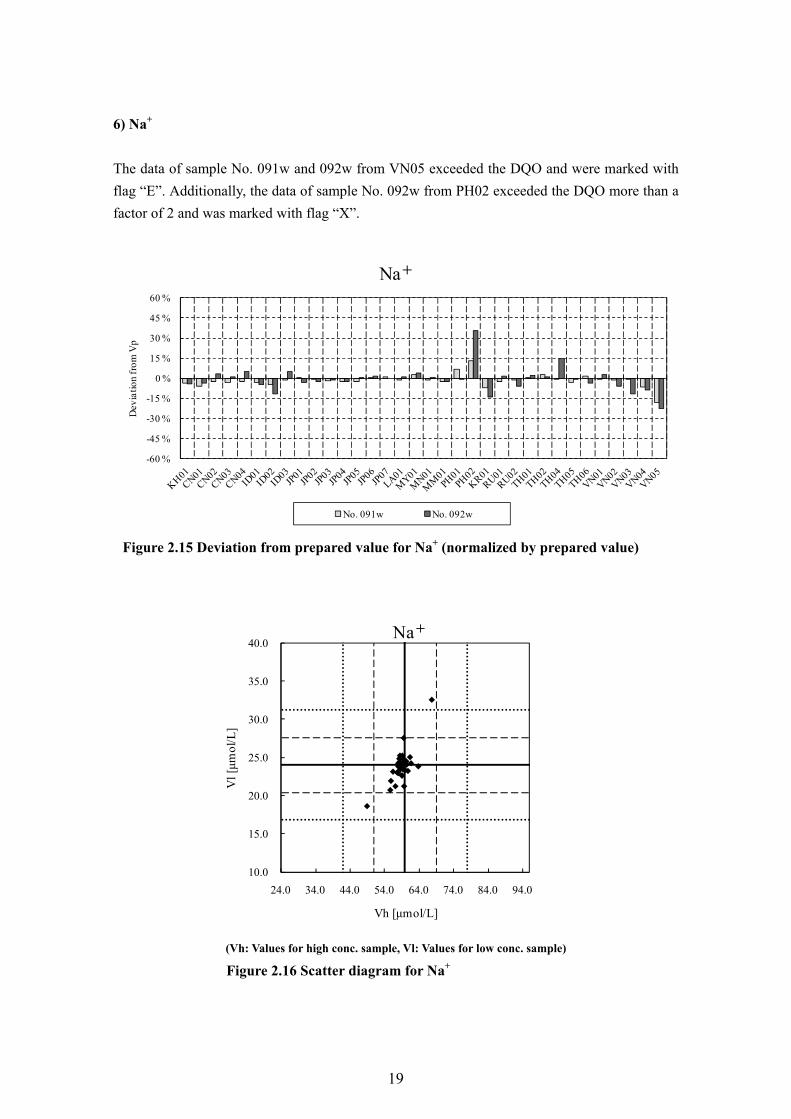
6) Na+ The data of sample No. 091w and 092w from VN05 exceeded the DQO and were marked with flag “E”. Additionally, the data of sample No. 092w from PH02 exceeded the DQO more than a factor of 2 and was marked with flag “X”.
-60 %
-45 %
-30 %
-15 %
0 %
15 %
30 %
45 %
60 %
Dev
iatio
n fr
om V
p
Na+
No. 091w No. 092w
Figure 2.15 Deviation from prepared value for Na+ (normalized by prepared value)
(Vh: Values for high conc. sample, Vl: Values for low conc. sample) Figure 2.16 Scatter diagram for Na+
10.0
15.0
20.0
25.0
30.0
35.0
40.0
24.0 34.0 44.0 54.0 64.0 74.0 84.0 94.0
Vl [μm
ol/L
]
Vh [μmol/L]
Na+
19
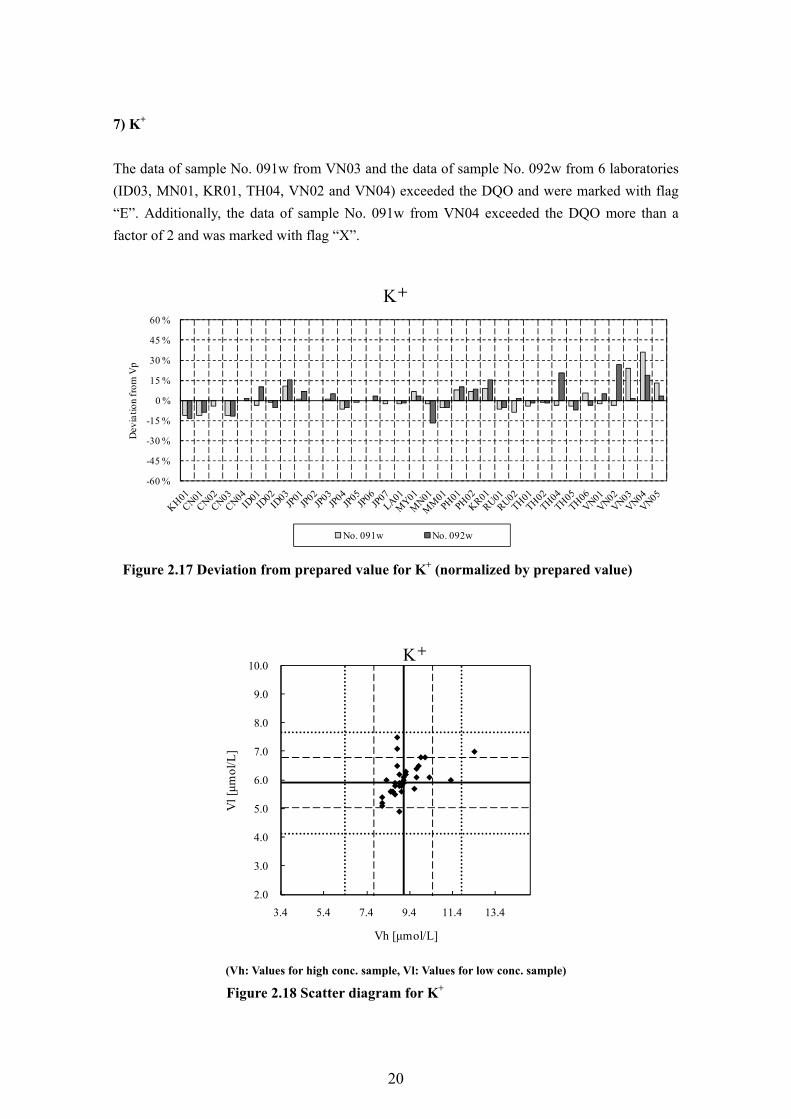
7) K+ The data of sample No. 091w from VN03 and the data of sample No. 092w from 6 laboratories (ID03, MN01, KR01, TH04, VN02 and VN04) exceeded the DQO and were marked with flag “E”. Additionally, the data of sample No. 091w from VN04 exceeded the DQO more than a factor of 2 and was marked with flag “X”.
-60 %
-45 %
-30 %
-15 %
0 %
15 %
30 %
45 %
60 %
Dev
iatio
n fr
om V
p
K+
No. 091w No. 092w
Figure 2.17 Deviation from prepared value for K+ (normalized by prepared value)
(Vh: Values for high conc. sample, Vl: Values for low conc. sample) Figure 2.18 Scatter diagram for K+
2.0
3.0
4.0
5.0
6.0
7.0
8.0
9.0
10.0
3.4 5.4 7.4 9.4 11.4 13.4
Vl [μm
ol/L
]
Vh [μmol/L]
K+
20
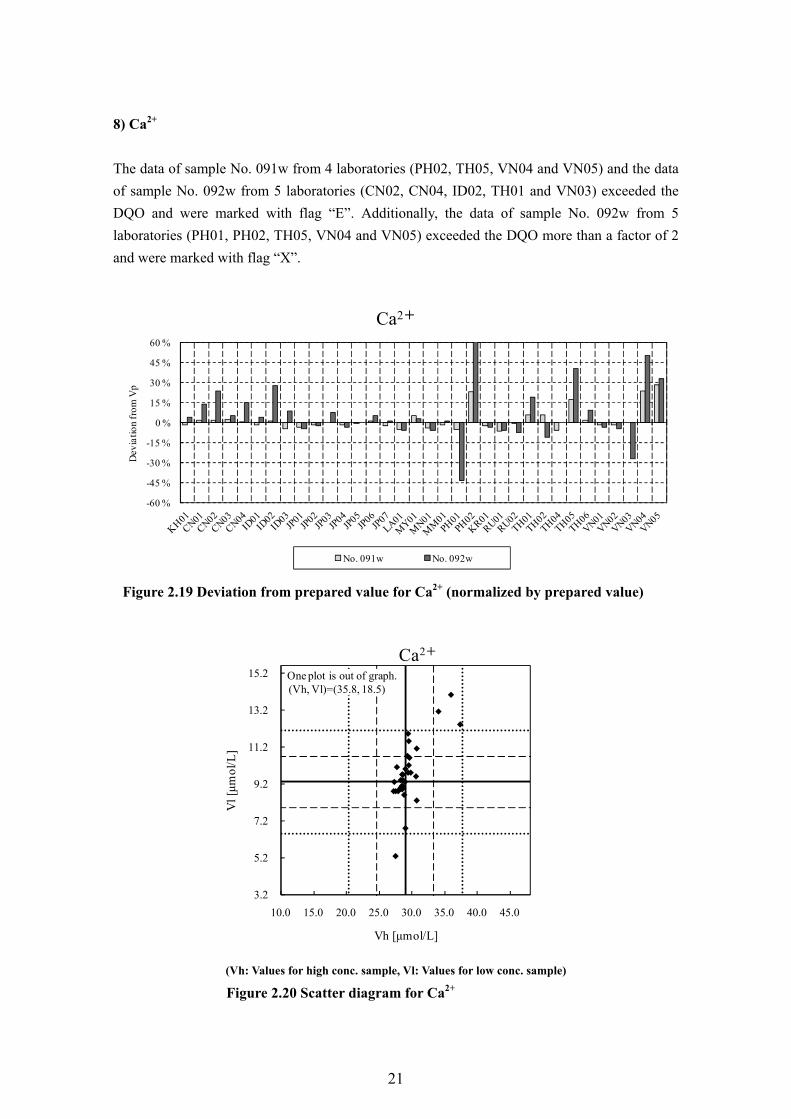
8) Ca2+ The data of sample No. 091w from 4 laboratories (PH02, TH05, VN04 and VN05) and the data of sample No. 092w from 5 laboratories (CN02, CN04, ID02, TH01 and VN03) exceeded the DQO and were marked with flag “E”. Additionally, the data of sample No. 092w from 5 laboratories (PH01, PH02, TH05, VN04 and VN05) exceeded the DQO more than a factor of 2 and were marked with flag “X”.
-60 %
-45 %
-30 %
-15 %
0 %
15 %
30 %
45 %
60 %
Dev
iatio
n fr
om V
p
Ca2+
No. 091w No. 092w
Figure 2.19 Deviation from prepared value for Ca2+ (normalized by prepared value)
(Vh: Values for high conc. sample, Vl: Values for low conc. sample) Figure 2.20 Scatter diagram for Ca2+
3.2
5.2
7.2
9.2
11.2
13.2
15.2
10.0 15.0 20.0 25.0 30.0 35.0 40.0 45.0
Vl [μm
ol/L
]
Vh [μmol/L]
Ca2+
One plot is out of graph. (Vh, Vl)=(35.8, 18.5)
21
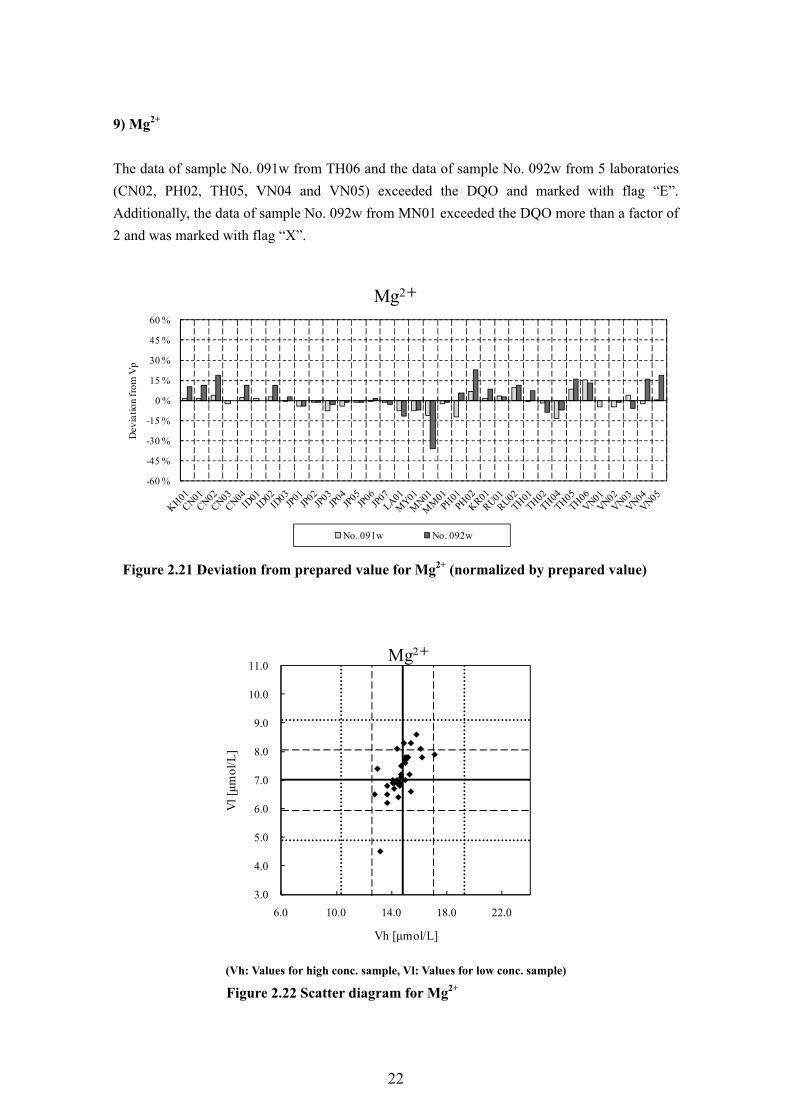
9) Mg2+ The data of sample No. 091w from TH06 and the data of sample No. 092w from 5 laboratories (CN02, PH02, TH05, VN04 and VN05) exceeded the DQO and marked with flag “E”. Additionally, the data of sample No. 092w from MN01 exceeded the DQO more than a factor of 2 and was marked with flag “X”.
-60 %
-45 %
-30 %
-15 %
0 %
15 %
30 %
45 %
60 %
Dev
iatio
n fr
om V
p
Mg2+
No. 091w No. 092w
Figure 2.21 Deviation from prepared value for Mg2+ (normalized by prepared value)
(Vh: Values for high conc. sample, Vl: Values for low conc. sample) Figure 2.22 Scatter diagram for Mg2+
3.0
4.0
5.0
6.0
7.0
8.0
9.0
10.0
11.0
6.0 10.0 14.0 18.0 22.0
Vl [μm
ol/L
]
Vh [μmol/L]
Mg2+
22
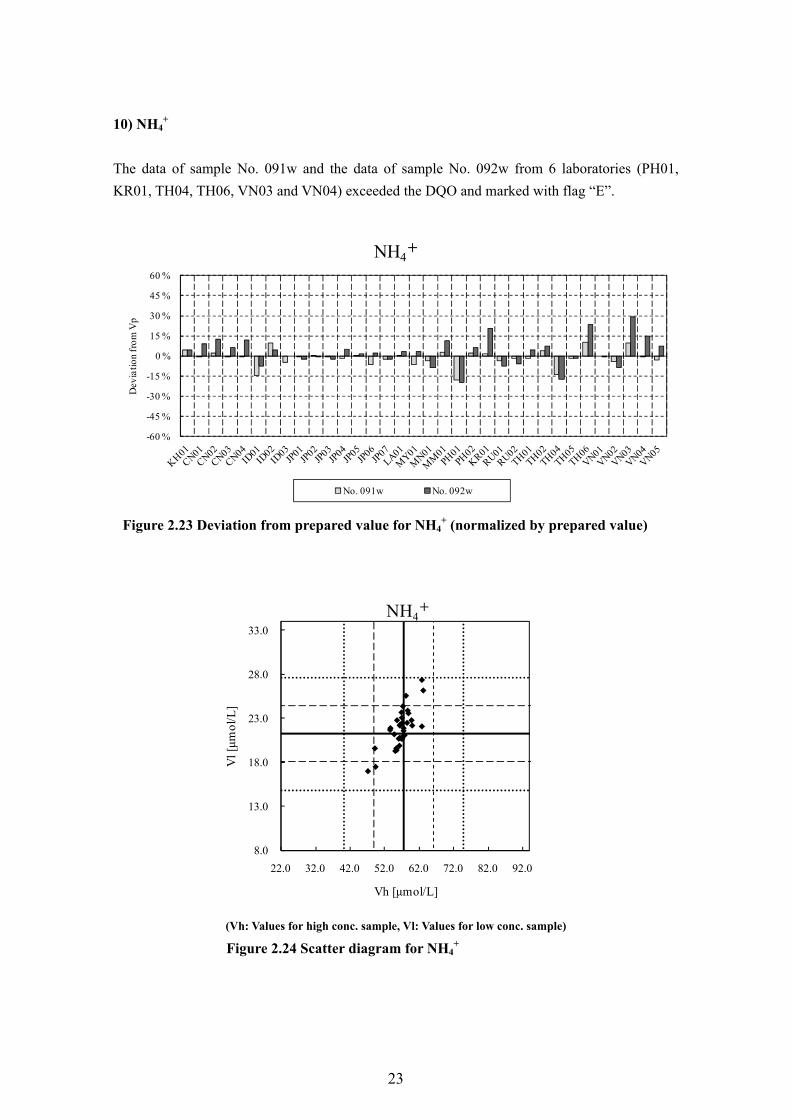
10) NH4+
The data of sample No. 091w and the data of sample No. 092w from 6 laboratories (PH01, KR01, TH04, TH06, VN03 and VN04) exceeded the DQO and marked with flag “E”.
-60 %
-45 %
-30 %
-15 %
0 %
15 %
30 %
45 %
60 %
Dev
iatio
n fr
om V
p
NH4+
No. 091w No. 092w
Figure 2.23 Deviation from prepared value for NH4+ (normalized by prepared value)
(Vh: Values for high conc. sample, Vl: Values for low conc. sample) Figure 2.24 Scatter diagram for NH4
+
8.0
13.0
18.0
23.0
28.0
33.0
22.0 32.0 42.0 52.0 62.0 72.0 82.0 92.0
Vl [μm
ol/L
]
Vh [μmol/L]
NH4+
23
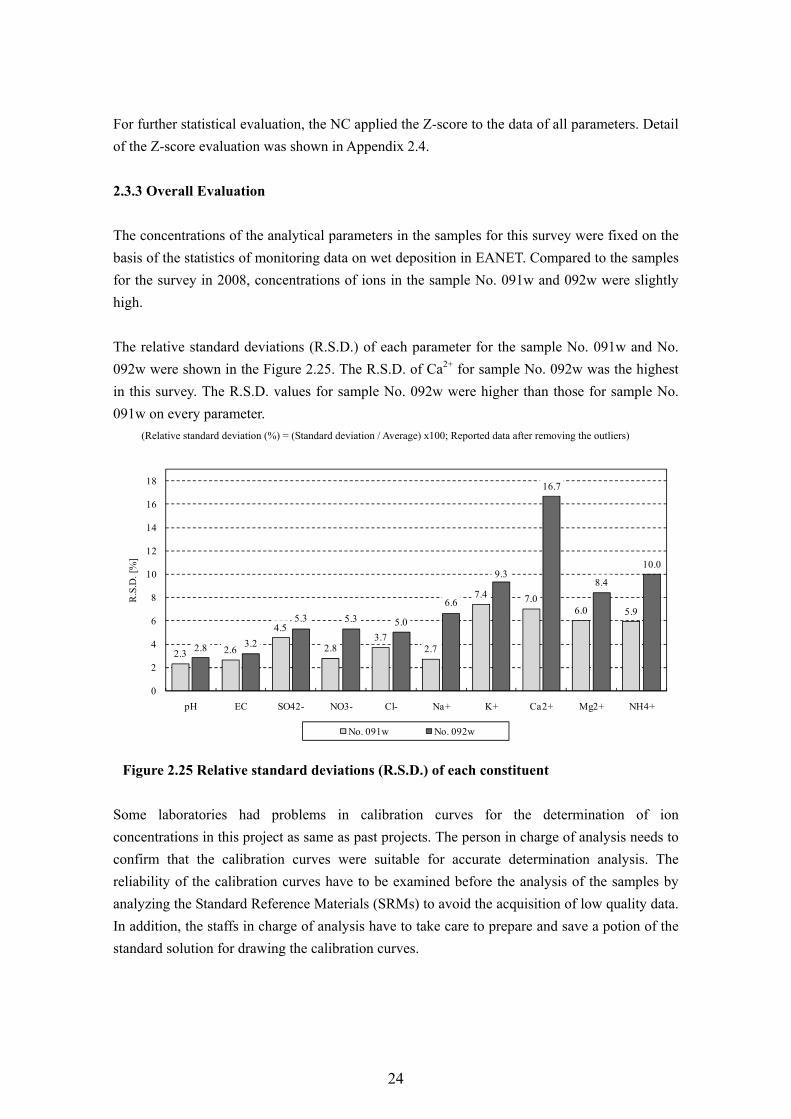
For further statistical evaluation, the NC applied the Z-score to the data of all parameters. Detail of the Z-score evaluation was shown in Appendix 2.4. 2.3.3 Overall Evaluation The concentrations of the analytical parameters in the samples for this survey were fixed on the basis of the statistics of monitoring data on wet deposition in EANET. Compared to the samples for the survey in 2008, concentrations of ions in the sample No. 091w and 092w were slightly high. The relative standard deviations (R.S.D.) of each parameter for the sample No. 091w and No. 092w were shown in the Figure 2.25. The R.S.D. of Ca2+ for sample No. 092w was the highest in this survey. The R.S.D. values for sample No. 092w were higher than those for sample No. 091w on every parameter.
(Relative standard deviation (%) = (Standard deviation / Average) x100; Reported data after removing the outliers)
2.3 2.6
4.5
2.8 3.7
2.7
7.4 7.0 6.0 5.9
2.8 3.2
5.3 5.3 5.0
6.6
9.3
16.7
8.4
10.0
0
2
4
6
8
10
12
14
16
18
pH EC SO42- NO3- Cl- Na+ K+ Ca2+ Mg2+ NH4+
R.S
.D. [
%]
No. 091w No. 092w
Figure 2.25 Relative standard deviations (R.S.D.) of each constituent Some laboratories had problems in calibration curves for the determination of ion concentrations in this project as same as past projects. The person in charge of analysis needs to confirm that the calibration curves were suitable for accurate determination analysis. The reliability of the calibration curves have to be examined before the analysis of the samples by analyzing the Standard Reference Materials (SRMs) to avoid the acquisition of low quality data. In addition, the staffs in charge of analysis have to take care to prepare and save a potion of the standard solution for drawing the calibration curves.
24
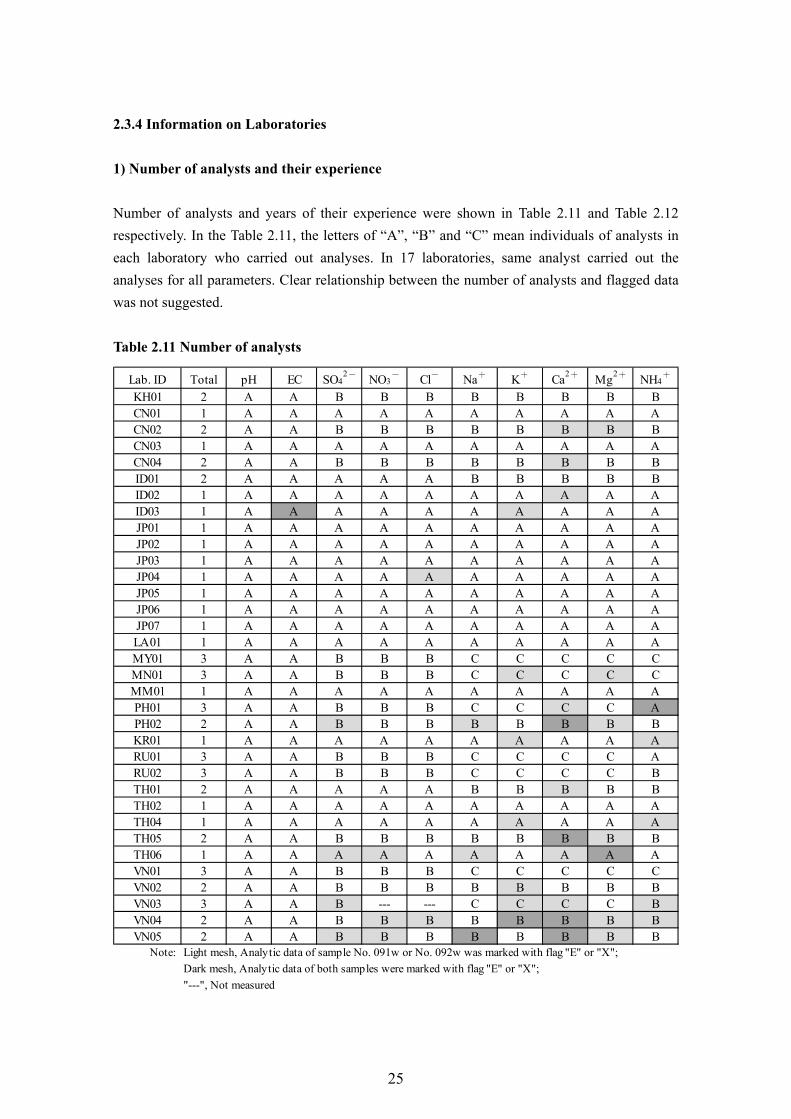
2.3.4 Information on Laboratories 1) Number of analysts and their experience Number of analysts and years of their experience were shown in Table 2.11 and Table 2.12 respectively. In the Table 2.11, the letters of “A”, “B” and “C” mean individuals of analysts in each laboratory who carried out analyses. In 17 laboratories, same analyst carried out the analyses for all parameters. Clear relationship between the number of analysts and flagged data was not suggested. Table 2.11 Number of analysts
Lab. ID Total pH EC SO42- NO3
- Cl- Na+ K+ Ca2+ Mg2+ NH4+
KH01 2 A A B B B B B B B BCN01 1 A A A A A A A A A ACN02 2 A A B B B B B B B BCN03 1 A A A A A A A A A ACN04 2 A A B B B B B B B BID01 2 A A A A A B B B B BID02 1 A A A A A A A A A AID03 1 A A A A A A A A A AJP01 1 A A A A A A A A A AJP02 1 A A A A A A A A A AJP03 1 A A A A A A A A A AJP04 1 A A A A A A A A A AJP05 1 A A A A A A A A A AJP06 1 A A A A A A A A A AJP07 1 A A A A A A A A A ALA01 1 A A A A A A A A A AMY01 3 A A B B B C C C C CMN01 3 A A B B B C C C C CMM01 1 A A A A A A A A A APH01 3 A A B B B C C C C APH02 2 A A B B B B B B B BKR01 1 A A A A A A A A A ARU01 3 A A B B B C C C C ARU02 3 A A B B B C C C C BTH01 2 A A A A A B B B B BTH02 1 A A A A A A A A A ATH04 1 A A A A A A A A A ATH05 2 A A B B B B B B B BTH06 1 A A A A A A A A A AVN01 3 A A B B B C C C C CVN02 2 A A B B B B B B B BVN03 3 A A B --- --- C C C C BVN04 2 A A B B B B B B B BVN05 2 A A B B B B B B B B
Note: Light mesh, Analytic data of sample No. 091w or No. 092w was marked with flag "E" or "X"; Dark mesh, Analytic data of both samples were marked with flag "E" or "X"; "---", Not measured
25
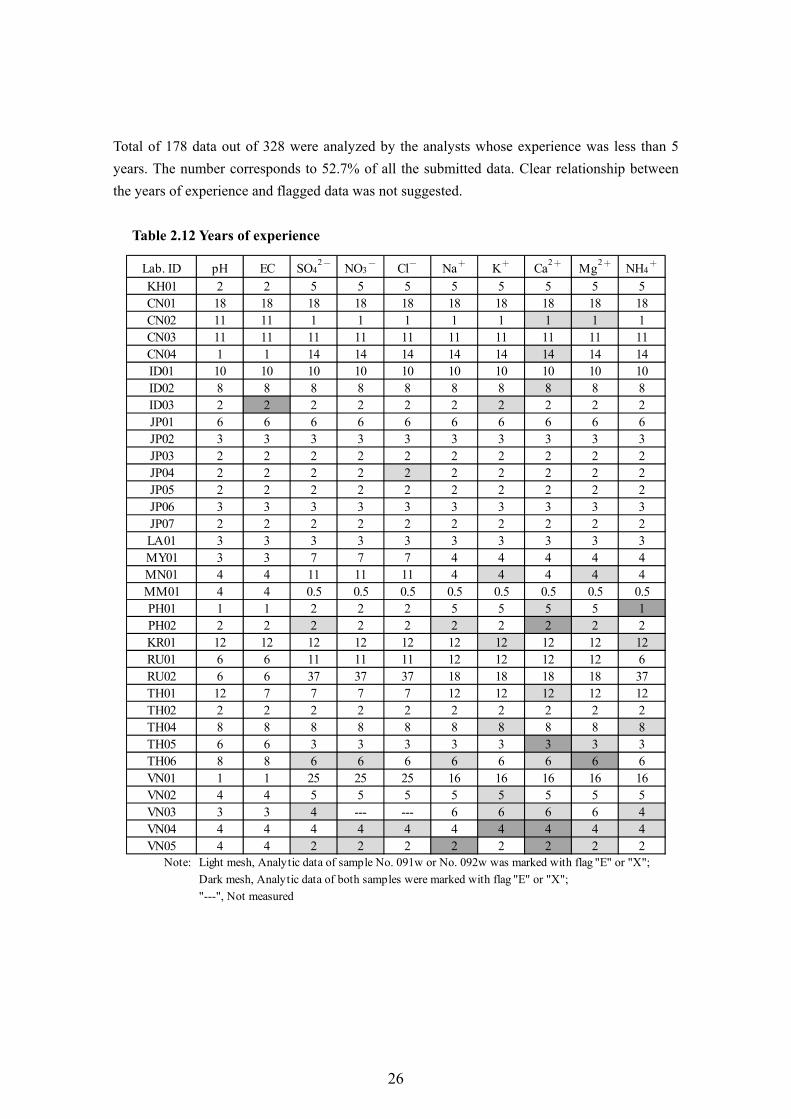
Total of 178 data out of 328 were analyzed by the analysts whose experience was less than 5 years. The number corresponds to 52.7% of all the submitted data. Clear relationship between the years of experience and flagged data was not suggested.
Table 2.12 Years of experience
Lab. ID pH EC SO42- NO3
- Cl- Na+ K+ Ca2+ Mg2+ NH4+
KH01 2 2 5 5 5 5 5 5 5 5CN01 18 18 18 18 18 18 18 18 18 18CN02 11 11 1 1 1 1 1 1 1 1CN03 11 11 11 11 11 11 11 11 11 11CN04 1 1 14 14 14 14 14 14 14 14ID01 10 10 10 10 10 10 10 10 10 10ID02 8 8 8 8 8 8 8 8 8 8ID03 2 2 2 2 2 2 2 2 2 2JP01 6 6 6 6 6 6 6 6 6 6JP02 3 3 3 3 3 3 3 3 3 3JP03 2 2 2 2 2 2 2 2 2 2JP04 2 2 2 2 2 2 2 2 2 2JP05 2 2 2 2 2 2 2 2 2 2JP06 3 3 3 3 3 3 3 3 3 3JP07 2 2 2 2 2 2 2 2 2 2LA01 3 3 3 3 3 3 3 3 3 3MY01 3 3 7 7 7 4 4 4 4 4MN01 4 4 11 11 11 4 4 4 4 4MM01 4 4 0.5 0.5 0.5 0.5 0.5 0.5 0.5 0.5PH01 1 1 2 2 2 5 5 5 5 1PH02 2 2 2 2 2 2 2 2 2 2KR01 12 12 12 12 12 12 12 12 12 12RU01 6 6 11 11 11 12 12 12 12 6RU02 6 6 37 37 37 18 18 18 18 37TH01 12 7 7 7 7 12 12 12 12 12TH02 2 2 2 2 2 2 2 2 2 2TH04 8 8 8 8 8 8 8 8 8 8TH05 6 6 3 3 3 3 3 3 3 3TH06 8 8 6 6 6 6 6 6 6 6VN01 1 1 25 25 25 16 16 16 16 16VN02 4 4 5 5 5 5 5 5 5 5VN03 3 3 4 --- --- 6 6 6 6 4VN04 4 4 4 4 4 4 4 4 4 4VN05 4 4 2 2 2 2 2 2 2 2
Note: Light mesh, Analytic data of sample No. 091w or No. 092w was marked with flag "E" or "X"; Dark mesh, Analytic data of both samples were marked with flag "E" or "X"; "---", Not measured
26
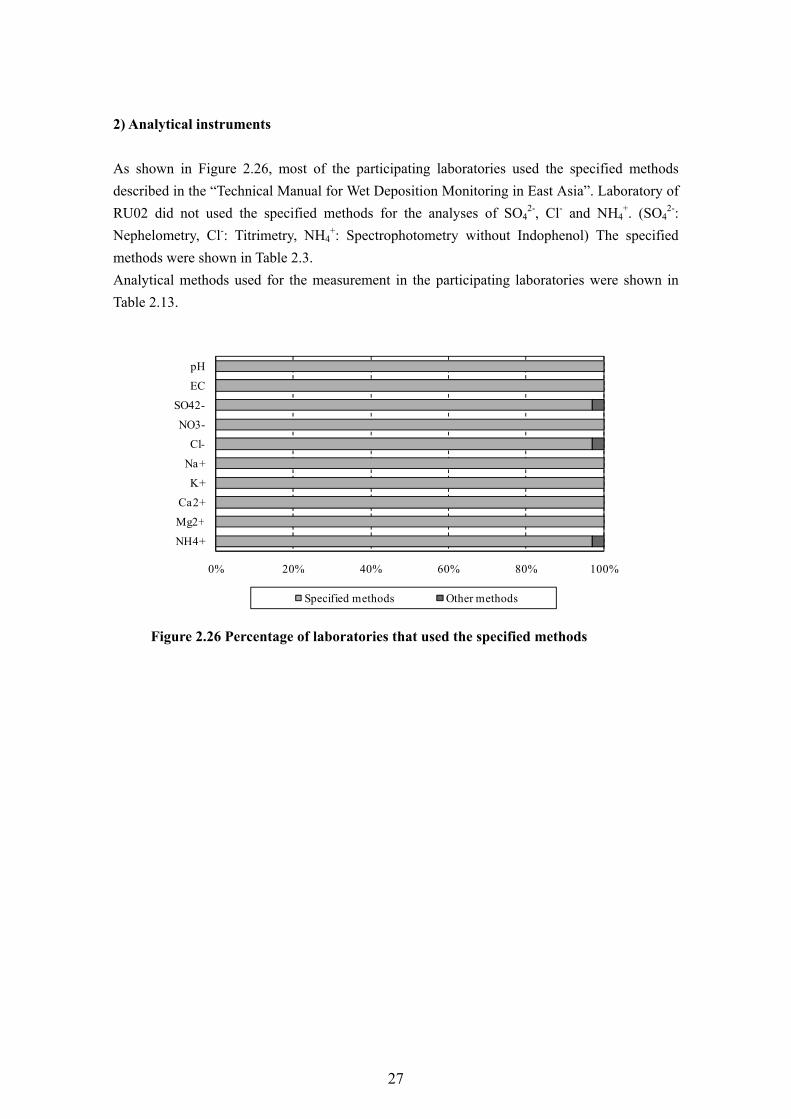
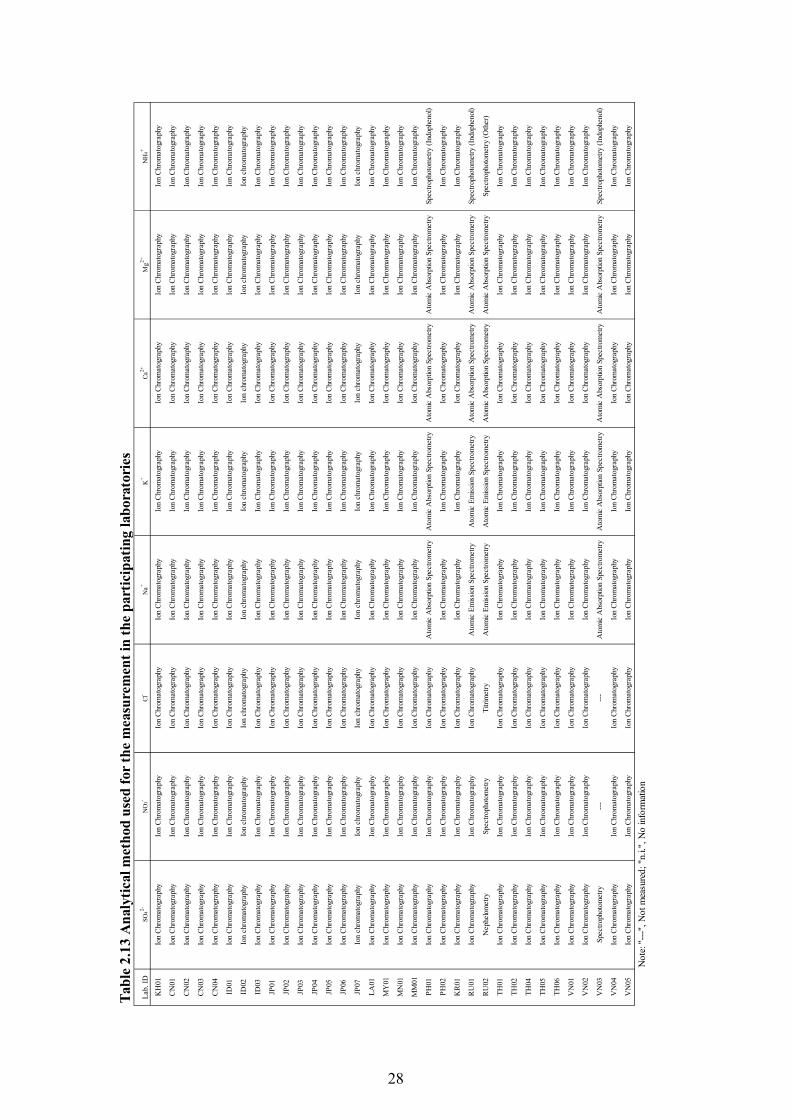
2) Analytical instruments As shown in Figure 2.26, most of the participating laboratories used the specified methods described in the “Technical Manual for Wet Deposition Monitoring in East Asia”. Laboratory of RU02 did not used the specified methods for the analyses of SO4
2-, Cl- and NH4+. (SO4
2-: Nephelometry, Cl-: Titrimetry, NH4
+: Spectrophotometry without Indophenol) The specified methods were shown in Table 2.3. Analytical methods used for the measurement in the participating laboratories were shown in Table 2.13.
0% 20% 40% 60% 80% 100%
NH4+
Mg2+
Ca2+
K+
Na+
Cl-
NO3-
SO42-
EC
pH
Specified methods Other methods
Figure 2.26 Percentage of laboratories that used the specified methods
27
Tabl
e 2.
13 A
naly
tical
met
hod
used
for t
he m
easu
rem
ent i
n th
e pa
rtic
ipat
ing
labo
rato
ries
Lab.
IDSO
42-N
O3-
Cl-
Na+
K+
Ca2+
Mg2+
NH
4+
KH
01Io
n C
hrom
atog
raph
yIo
n C
hrom
atog
raph
yIo
n C
hrom
atog
raph
yIo
n C
hrom
atog
raph
yIo
n C
hrom
atog
raph
yIo
n C
hrom
atog
raph
yIo
n C
hrom
atog
raph
yIo
n C
hrom
atog
raph
y
CN
01Io
n C
hrom
atog
raph
yIo
n C
hrom
atog
raph
yIo
n C
hrom
atog
raph
yIo
n C
hrom
atog
raph
yIo
n C
hrom
atog
raph
yIo
n C
hrom
atog
raph
yIo
n C
hrom
atog
raph
yIo
n C
hrom
atog
raph
y
CN
02Io
n C
hrom
atog
raph
yIo
n C
hrom
atog
raph
yIo
n C
hrom
atog
raph
yIo
n C
hrom
atog
raph
yIo
n C
hrom
atog
raph
yIo
n C
hrom
atog
raph
yIo
n C
hrom
atog
raph
yIo
n C
hrom
atog
raph
y
CN
03Io
n C
hrom
atog
raph
yIo
n C
hrom
atog
raph
yIo
n C
hrom
atog
raph
yIo
n C
hrom
atog
raph
yIo
n C
hrom
atog
raph
yIo
n C
hrom
atog
raph
yIo
n C
hrom
atog
raph
yIo
n C
hrom
atog
raph
y
CN
04Io
n C
hrom
atog
raph
yIo
n C
hrom
atog
raph
yIo
n C
hrom
atog
raph
yIo
n C
hrom
atog
raph
yIo
n C
hrom
atog
raph
yIo
n C
hrom
atog
raph
yIo
n C
hrom
atog
raph
yIo
n C
hrom
atog
raph
y
ID01
Ion
Chr
omat
ogra
phy
Ion
Chr
omat
ogra
phy
Ion
Chr
omat
ogra
phy
Ion
Chr
omat
ogra
phy
Ion
Chr
omat
ogra
phy
Ion
Chr
omat
ogra
phy
Ion
Chr
omat
ogra
phy
Ion
Chr
omat
ogra
phy
ID02
Ion
chro
mat
ogra
phy
Ion
chro
mat
ogra
phy
Ion
chro
mat
ogra
phy
Ion
chro
mat
ogra
phy
Ion
chro
mat
ogra
phy
Ion
chro
mat
ogra
phy
Ion
chro
mat
ogra
phy
Ion
chro
mat
ogra
phy
ID03
Ion
Chr
omat
ogra
phy
Ion
Chr
omat
ogra
phy
Ion
Chr
omat
ogra
phy
Ion
Chr
omat
ogra
phy
Ion
Chr
omat
ogra
phy
Ion
Chr
omat
ogra
phy
Ion
Chr
omat
ogra
phy
Ion
Chr
omat
ogra
phy
JP01
Ion
Chr
omat
ogra
phy
Ion
Chr
omat
ogra
phy
Ion
Chr
omat
ogra
phy
Ion
Chr
omat
ogra
phy
Ion
Chr
omat
ogra
phy
Ion
Chr
omat
ogra
phy
Ion
Chr
omat
ogra
phy
Ion
Chr
omat
ogra
phy
JP02
Ion
Chr
omat
ogra
phy
Ion
Chr
omat
ogra
phy
Ion
Chr
omat
ogra
phy
Ion
Chr
omat
ogra
phy
Ion
Chr
omat
ogra
phy
Ion
Chr
omat
ogra
phy
Ion
Chr
omat
ogra
phy
Ion
Chr
omat
ogra
phy
JP03
Ion
Chr
omat
ogra
phy
Ion
Chr
omat
ogra
phy
Ion
Chr
omat
ogra
phy
Ion
Chr
omat
ogra
phy
Ion
Chr
omat
ogra
phy
Ion
Chr
omat
ogra
phy
Ion
Chr
omat
ogra
phy
Ion
Chr
omat
ogra
phy
JP04
Ion
Chr
omat
ogra
phy
Ion
Chr
omat
ogra
phy
Ion
Chr
omat
ogra
phy
Ion
Chr
omat
ogra
phy
Ion
Chr
omat
ogra
phy
Ion
Chr
omat
ogra
phy
Ion
Chr
omat
ogra
phy
Ion
Chr
omat
ogra
phy
JP05
Ion
Chr
omat
ogra
phy
Ion
Chr
omat
ogra
phy
Ion
Chr
omat
ogra
phy
Ion
Chr
omat
ogra
phy
Ion
Chr
omat
ogra
phy
Ion
Chr
omat
ogra
phy
Ion
Chr
omat
ogra
phy
Ion
Chr
omat
ogra
phy
JP06
Ion
Chr
omat
ogra
phy
Ion
Chr
omat
ogra
phy
Ion
Chr
omat
ogra
phy
Ion
Chr
omat
ogra
phy
Ion
Chr
omat
ogra
phy
Ion
Chr
omat
ogra
phy
Ion
Chr
omat
ogra
phy
Ion
Chr
omat
ogra
phy
JP07
Ion
chro
mat
ogra
phy
Ion
chro
mat
ogra
phy
Ion
chro
mat
ogra
phy
Ion
chro
mat
ogra
phy
Ion
chro
mat
ogra
phy
Ion
chro
mat
ogra
phy
Ion
chro
mat
ogra
phy
Ion
chro
mat
ogra
phy
LA01
Ion
Chr
omat
ogra
phy
Ion
Chr
omat
ogra
phy
Ion
Chr
omat
ogra
phy
Ion
Chr
omat
ogra
phy
Ion
Chr
omat
ogra
phy
Ion
Chr
omat
ogra
phy
Ion
Chr
omat
ogra
phy
Ion
Chr
omat
ogra
phy
MY
01Io
n C
hrom
atog
raph
yIo
n C
hrom
atog
raph
yIo
n C
hrom
atog
raph
yIo
n C
hrom
atog
raph
yIo
n C
hrom
atog
raph
yIo
n C
hrom
atog
raph
yIo
n C
hrom
atog
raph
yIo
n C
hrom
atog
raph
y
MN
01Io
n C
hrom
atog
raph
yIo
n C
hrom
atog
raph
yIo
n C
hrom
atog
raph
yIo
n C
hrom
atog
raph
yIo
n C
hrom
atog
raph
yIo
n C
hrom
atog
raph
yIo
n C
hrom
atog
raph
yIo
n C
hrom
atog
raph
y
MM
01Io
n C
hrom
atog
raph
yIo
n C
hrom
atog
raph
yIo
n C
hrom
atog
raph
yIo
n C
hrom
atog
raph
yIo
n C
hrom
atog
raph
yIo
n C
hrom
atog
raph
yIo
n C
hrom
atog
raph
yIo
n C
hrom
atog
raph
y
PH01
Ion
Chr
omat
ogra
phy
Ion
Chr
omat
ogra
phy
Ion
Chr
omat
ogra
phy
Ato
mic
Abs
orpt
ion
Spec
trom
etry
Ato
mic
Abs
orpt
ion
Spec
trom
etry
Ato
mic
Abs
orpt
ion
Spec
trom
etry
Ato
mic
Abs
orpt
ion
Spec
trom
etry
Spec
troph
otom
etry
(Ind
ophe
nol)
PH02
Ion
Chr
omat
ogra
phy
Ion
Chr
omat
ogra
phy
Ion
Chr
omat
ogra
phy
Ion
Chr
omat
ogra
phy
Ion
Chr
omat
ogra
phy
Ion
Chr
omat
ogra
phy
Ion
Chr
omat
ogra
phy
Ion
Chr
omat
ogra
phy
KR
01Io
n C
hrom
atog
raph
yIo
n C
hrom
atog
raph
yIo
n C
hrom
atog
raph
yIo
n C
hrom
atog
raph
yIo
n C
hrom
atog
raph
yIo
n C
hrom
atog
raph
yIo
n C
hrom
atog
raph
yIo
n C
hrom
atog
raph
y
RU
01Io
n C
hrom
atog
raph
yIo
n C
hrom
atog
raph
yIo
n C
hrom
atog
raph
yA
tom
ic E
miss
ion
Spec
trom
etry
Ato
mic
Em
issio
n Sp
ectro
met
ryA
tom
ic A
bsor
ptio
n Sp
ectro
met
ryA
tom
ic A
bsor
ptio
n Sp
ectro
met
rySp
ectro
phot
omet
ry (I
ndop
heno
l)
RU
02N
ephe
lom
etry
Spec
troph
otom
etry
Titri
met
ryA
tom
ic E
miss
ion
Spec
trom
etry
Ato
mic
Em
issio
n Sp
ectro
met
ryA
tom
ic A
bsor
ptio
n Sp
ectro
met
ryA
tom
ic A
bsor
ptio
n Sp
ectro
met
rySp
ectro
phot
omet
ry (O
ther
)
TH01
Ion
Chr
omat
ogra
phy
Ion
Chr
omat
ogra
phy
Ion
Chr
omat
ogra
phy
Ion
Chr
omat
ogra
phy
Ion
Chr
omat
ogra
phy
Ion
Chr
omat
ogra
phy
Ion
Chr
omat
ogra
phy
Ion
Chr
omat
ogra
phy
TH02
Ion
Chr
omat
ogra
phy
Ion
Chr
omat
ogra
phy
Ion
Chr
omat
ogra
phy
Ion
Chr
omat
ogra
phy
Ion
Chr
omat
ogra
phy
Ion
Chr
omat
ogra
phy
Ion
Chr
omat
ogra
phy
Ion
Chr
omat
ogra
phy
TH04
Ion
Chr
omat
ogra
phy
Ion
Chr
omat
ogra
phy
Ion
Chr
omat
ogra
phy
Ion
Chr
omat
ogra
phy
Ion
Chr
omat
ogra
phy
Ion
Chr
omat
ogra
phy
Ion
Chr
omat
ogra
phy
Ion
Chr
omat
ogra
phy
TH05
Ion
Chr
omat
ogra
phy
Ion
Chr
omat
ogra
phy
Ion
Chr
omat
ogra
phy
Ion
Chr
omat
ogra
phy
Ion
Chr
omat
ogra
phy
Ion
Chr
omat
ogra
phy
Ion
Chr
omat
ogra
phy
Ion
Chr
omat
ogra
phy
TH06
Ion
Chr
omat
ogra
phy
Ion
Chr
omat
ogra
phy
Ion
Chr
omat
ogra
phy
Ion
Chr
omat
ogra
phy
Ion
Chr
omat
ogra
phy
Ion
Chr
omat
ogra
phy
Ion
Chr
omat
ogra
phy
Ion
Chr
omat
ogra
phy
VN
01Io
n C
hrom
atog
raph
yIo
n C
hrom
atog
raph
yIo
n C
hrom
atog
raph
yIo
n C
hrom
atog
raph
yIo
n C
hrom
atog
raph
yIo
n C
hrom
atog
raph
yIo
n C
hrom
atog
raph
yIo
n C
hrom
atog
raph
y
VN
02Io
n C
hrom
atog
raph
yIo
n C
hrom
atog
raph
yIo
n C
hrom
atog
raph
yIo
n C
hrom
atog
raph
yIo
n C
hrom
atog
raph
yIo
n C
hrom
atog
raph
yIo
n C
hrom
atog
raph
yIo
n C
hrom
atog
raph
y
VN
03Sp
ectro
phot
omet
ry--
---
-A
tom
ic A
bsor
ptio
n Sp
ectro
met
ryA
tom
ic A
bsor
ptio
n Sp
ectro
met
ryA
tom
ic A
bsor
ptio
n Sp
ectro
met
ryA
tom
ic A
bsor
ptio
n Sp
ectro
met
rySp
ectro
phot
omet
ry (I
ndop
heno
l)
VN
04Io
n C
hrom
atog
raph
yIo
n C
hrom
atog
raph
yIo
n C
hrom
atog
raph
yIo
n C
hrom
atog
raph
yIo
n C
hrom
atog
raph
yIo
n C
hrom
atog
raph
yIo
n C
hrom
atog
raph
yIo
n C
hrom
atog
raph
y
VN
05Io
n C
hrom
atog
raph
yIo
n C
hrom
atog
raph
yIo
n C
hrom
atog
raph
yIo
n C
hrom
atog
raph
yIo
n C
hrom
atog
raph
yIo
n C
hrom
atog
raph
yIo
n C
hrom
atog
raph
yIo
n C
hrom
atog
raph
y
Not
e: "-
--", N
ot m
easu
red;
"n.
i.", N
o in
form
atio
n
28
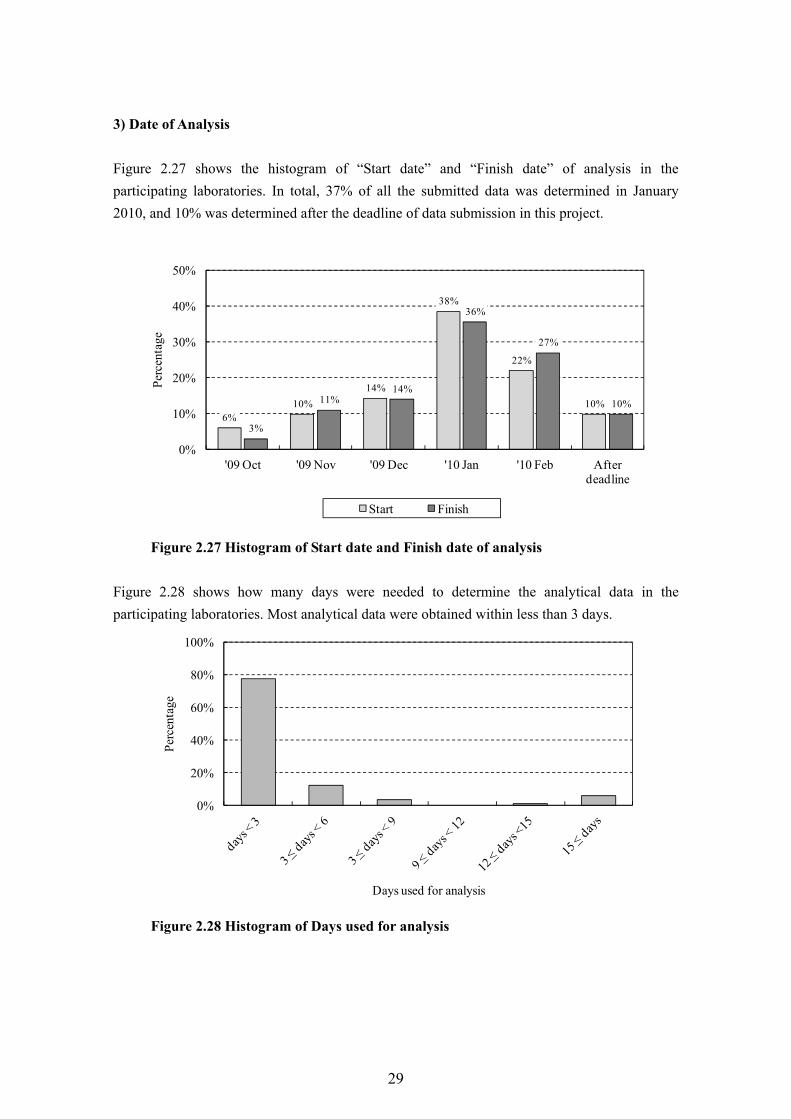
3) Date of Analysis Figure 2.27 shows the histogram of “Start date” and “Finish date” of analysis in the participating laboratories. In total, 37% of all the submitted data was determined in January 2010, and 10% was determined after the deadline of data submission in this project.
6%10%
14%
38%
22%
10%
3%
11%14%
36%
27%
10%
0%
10%
20%
30%
40%
50%
'09 Oct '09 Nov '09 Dec '10 Jan '10 Feb After deadline
Perc
enta
ge
Start Finish
Figure 2.27 Histogram of Start date and Finish date of analysis Figure 2.28 shows how many days were needed to determine the analytical data in the participating laboratories. Most analytical data were obtained within less than 3 days.
0%
20%
40%
60%
80%
100%
Perc
enta
ge
Days used for analysis
Figure 2.28 Histogram of Days used for analysis
29
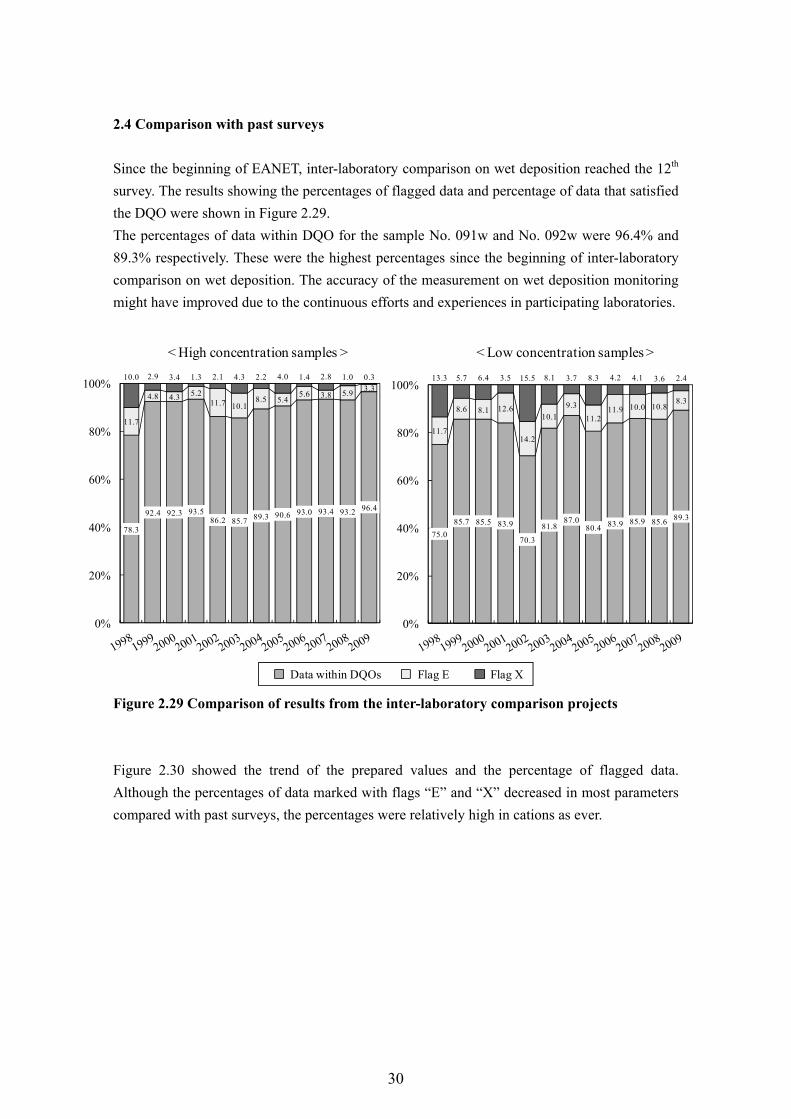
2.4 Comparison with past surveys Since the beginning of EANET, inter-laboratory comparison on wet deposition reached the 12th survey. The results showing the percentages of flagged data and percentage of data that satisfied the DQO were shown in Figure 2.29. The percentages of data within DQO for the sample No. 091w and No. 092w were 96.4% and 89.3% respectively. These were the highest percentages since the beginning of inter-laboratory comparison on wet deposition. The accuracy of the measurement on wet deposition monitoring might have improved due to the continuous efforts and experiences in participating laboratories. Figure 2.29 Comparison of results from the inter-laboratory comparison projects Figure 2.30 showed the trend of the prepared values and the percentage of flagged data. Although the percentages of data marked with flags “E” and “X” decreased in most parameters compared with past surveys, the percentages were relatively high in cations as ever.
75.0 85.7 85.5 83.9
70.3
81.8 87.0
80.4 83.9 85.9 85.6 89.3
11.7
8.6 8.1 12.6
14.2
10.1 9.3
11.2 11.9 10.0 10.8
8.3
13.3 5.7 6.4 3.5 15.5 8.1 3.7 8.3 4.2 4.1 3.6 2.4
0%
20%
40%
60%
80%
100%
< Low concentration samples >
78.3
92.4 92.3 93.5 86.2 85.7 89.3 90.6 93.0 93.4 93.2 96.4
11.7
4.8 4.3 5.2 11.7 10.1
8.5 5.4 5.6 3.8 5.9 3.3
10.0 2.9 3.4 1.3 2.1 4.3 2.2 4.0 1.4 2.8 1.0 0.3
0%
20%
40%
60%
80%
100%
< High concentration samples >
Data within DQOs Flag E Flag X
30
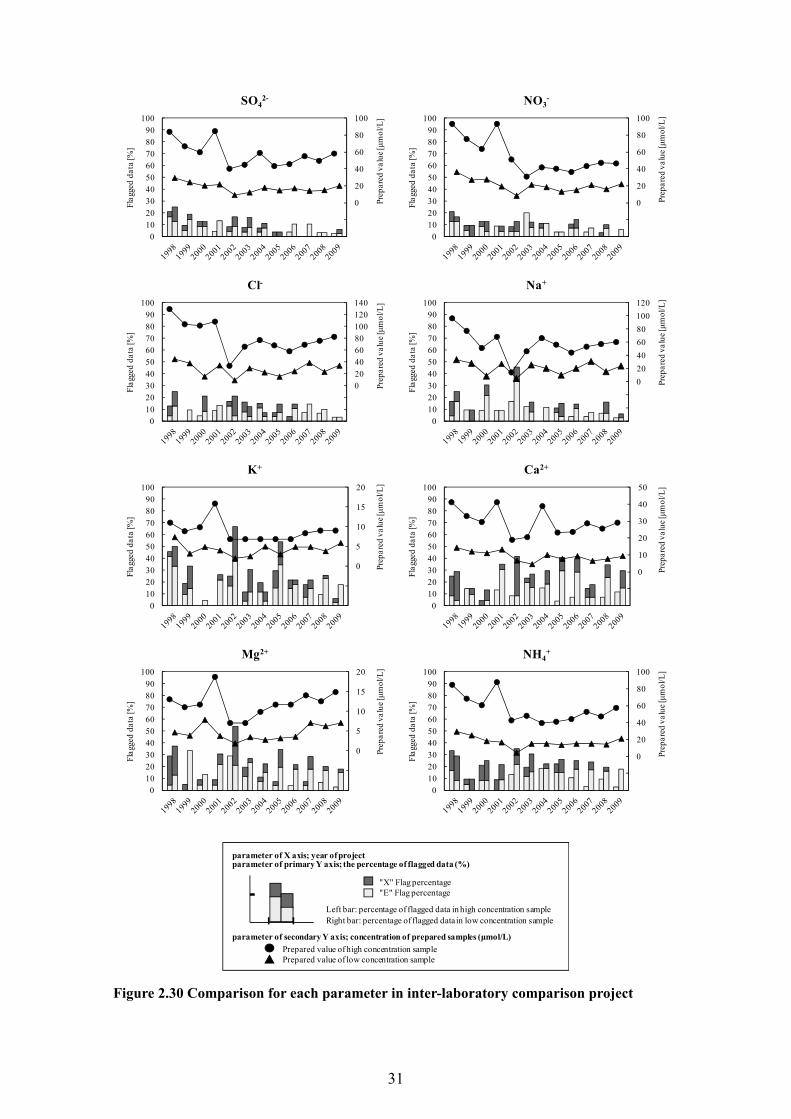
Figure 2.30 Comparison for each parameter in inter-laboratory comparison project
"X" Flag percentage
Prepared value of high concentration sample
Left bar: percentage of flagged data in high concentration sampleRight bar: percentage of flagged data in low concentration sample
parameter of primary Y axis; the percentage of flagged data (%)parameter of X axis; year of project
parameter of secondary Y axis; concentration of prepared samples (μmol/L)
Prepared value of low concentration sample
"E" Flag percentage
-40
-20
0
20
40
60
80
100
0102030405060708090
100
Prep
ared
val
ue [μ
mol
/L]
Flag
ged
data
[%]
NO3-
-60-40-20020406080100120140
0102030405060708090
100
Prep
ared
val
ue [μ
mol
/L]
Flag
ged
data
[%]
Cl-
-60-40-20020406080100120
0102030405060708090
100
Prep
ared
val
ue [μ
mol
/L]
Flag
ged
data
[%]
Na+
-10
-5
0
5
10
15
20
0102030405060708090
100
Prep
ared
val
ue [μ
mol
/L]
Flag
ged
data
[%]
K+
-20
-10
0
10
20
30
40
50
0102030405060708090
100
Prep
ared
val
ue [μ
mol
/L]
Flag
ged
data
[%]
Ca2+
-10
-5
0
5
10
15
20
0102030405060708090
100
Prep
ared
val
ue [μ
mol
/L]
Flag
ged
data
[%]
Mg2+
-40
-20
0
20
40
60
80
100
0102030405060708090
100Pr
epar
ed v
alue
[μm
ol/L
]
Flag
ged
data
[%]
NH4+
-40
-20
0
20
40
60
80
100
0102030405060708090
100
Prep
ared
val
ue [μ
mol
/L]
Flag
ged
data
[%]
SO42-
31
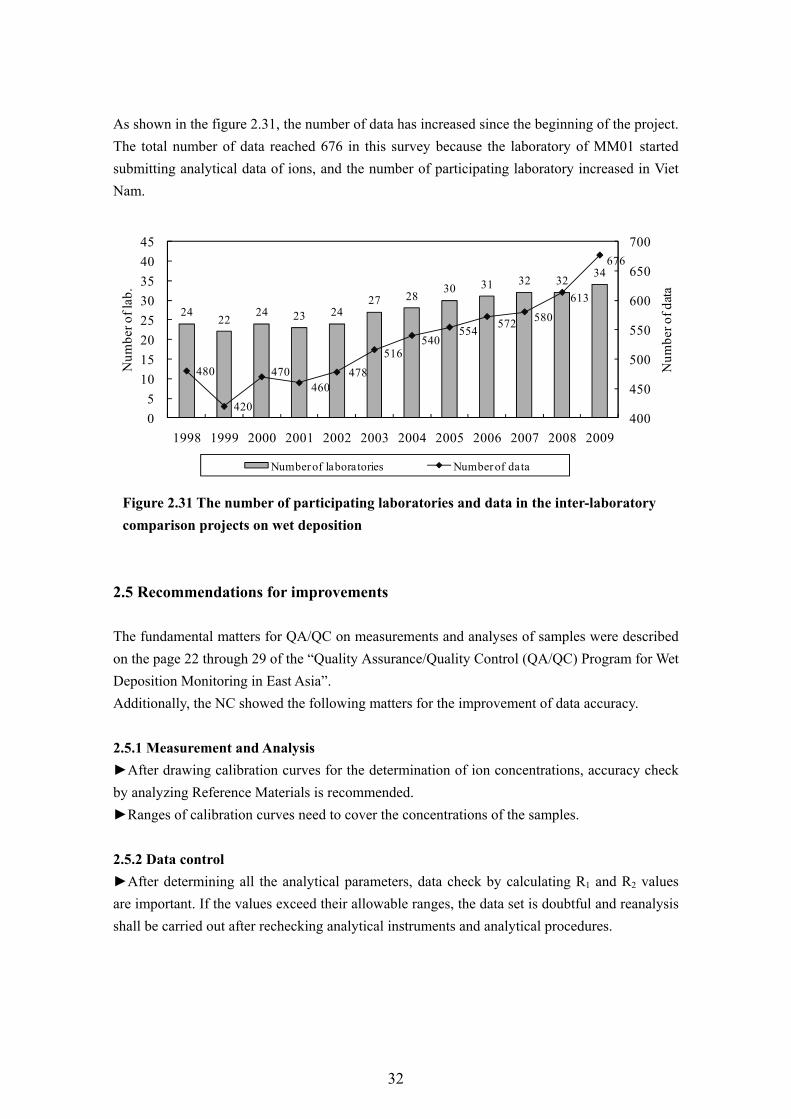
As shown in the figure 2.31, the number of data has increased since the beginning of the project. The total number of data reached 676 in this survey because the laboratory of MM01 started submitting analytical data of ions, and the number of participating laboratory increased in Viet Nam.
24 22
24 23 24 27 28
30 31 32 32 34
480
420
470 460
478 516
540 554 572 580
613
676
400
450
500
550
600
650
700
0 5
10 15 20 25 30 35 40 45
1998 1999 2000 2001 2002 2003 2004 2005 2006 2007 2008 2009
Num
ber o
f dat
a
Num
ber o
f lab
.
Number of laboratories Number of data
Figure 2.31 The number of participating laboratories and data in the inter-laboratory comparison projects on wet deposition
2.5 Recommendations for improvements The fundamental matters for QA/QC on measurements and analyses of samples were described on the page 22 through 29 of the “Quality Assurance/Quality Control (QA/QC) Program for Wet Deposition Monitoring in East Asia”. Additionally, the NC showed the following matters for the improvement of data accuracy. 2.5.1 Measurement and Analysis ►After drawing calibration curves for the determination of ion concentrations, accuracy check by analyzing Reference Materials is recommended. ►Ranges of calibration curves need to cover the concentrations of the samples. 2.5.2 Data control ►After determining all the analytical parameters, data check by calculating R1 and R2 values are important. If the values exceed their allowable ranges, the data set is doubtful and reanalysis shall be carried out after rechecking analytical instruments and analytical procedures.
32
References 1) Second Interim Scientific Advisory Group Meeting of Acid Deposition Monitoring Network in East Asia. 2000. Guidelines for Acid Deposition Monitoring in East Asia 2) Second Interim Scientific Advisory Group Meeting of Acid Deposition Monitoring Network in East Asia. 2000. Technical Documents for Wet Deposition Monitoring in East Asia 3) Acid Deposition and Oxidant Research Center. 1999. Report of the Inter-laboratory
Comparison Project 1998 (Round robin analysis survey), 1st Attempt. 4) Acid Deposition and Oxidant Research Center. 2000. Report of the Inter-laboratory
Comparison Project 1999 (Round robin analysis survey), 2nd Attempt. 5) Acid Deposition and Oxidant Research Center. 2001. Report of the Inter-laboratory
Comparison Project 2000 on Wet Deposition, 3rd Attempt. 6) Acid Deposition and Oxidant Research Center. 2002. Report of the Inter-laboratory
Comparison Project 2001 on Wet Deposition, 4th Attempt. 7) Acid Deposition and Oxidant Research Center. 2003. Report of the Inter-laboratory
Comparison Project 2002 on Wet Deposition, 5th Attempt. 8) Acid Deposition and Oxidant Research Center. 2004. Report of the Inter-laboratory
Comparison Project 2003 on Wet Deposition, 6th Attempt. 9) Acid Deposition and Oxidant Research Center. 2005. Report of the Inter-laboratory
Comparison Project 2004 on Wet Deposition, 7th Attempt. 10) Acid Deposition and Oxidant Research Center. 2006. Report of the Inter-laboratory
Comparison Project 2005 on Wet Deposition, 8th Attempt. 11) Network Center for EANET. 2007. Report of the Inter-laboratory Comparison Project 2006 12) Network Center for EANET. 2008. Report of the Inter-laboratory Comparison Project 2007 13) Network Center for EANET. 2009. Report of the Inter-laboratory Comparison Project 2008
33

Appendix 2.1 Participating laboratories CAMBODIA Code
1) Department of Pollution Control, Ministry of Environment (KH01) CHINA 2) Zhuhai Environmental Monitoring Station (CN01) 3) Xiamen Environmental Monitoring Station (CN02) 4) Xi’an Environmental Monitoring Station (CN03) 5) Chongqing Institute of Environmental Science (CN04) INDONESIA 6) Analysis Division, Meteorological and Geophysical Agency (BMG) (ID01) 7) Center for Environmental Impact Control Facilities (PUSARPEDAL),
Environmental Impact Management Agency (BAPEDAL) (ID02)
8) Indonesian National Institute of Aeronautic and Space (Lapan) (ID03) JAPAN 9) Hokkaido Institute of Environmental Sciences (JP01) 10) Nagano Research Institute for Health and Pollution (JP02) 11) Gifu Prefectural Research Institute of Health and Environmental Science (JP03) 12) Kochi Prefectural Environmental Research Center (JP04) 13) Shimane Prefectural Institute of Public Health and Environmental Science (JP05) 14) Okinawa Research Institute of Health and Environment (JP06) 15) Acid Deposition and Oxidant Research Center (ADORC) (JP07) LAO PDR 16) Environment Quality Monitoring Center, Environment Research Institute,
Science, Technology and Environment Agency (LA01)
MALAYSIA 17) Division of Environmental Health, Department of Chemistry (MY01) MONGOLIA 18) Central Laboratory of Environmental Monitoring,
National Agency for Meteorology, Hydrology and Environmental Monitoring, Ministry of Nature and Environment
(MN01)
MYANMAR 19) Department of Meteorology and Hydrology (DMH) (MM01)
34
PHILIPPINES Code 20) Research and Development Division, Environmental Management Bureau
(EMB-CO), Department of Environment and Natural Resources (DENR) 21) Environmental Management Bureau CAR (EMB-CAR),
(PH01) (PH02)
REPUBLIC OF KOREA 22) Atmospheric Chemistry Division, National Institute of Environment Research (NIER)
(KR01)
RUSSIA 23) Limnological Institute, Russian Academy of Sciences, Siberian Branch
(LI/RAS/SB) (RU01)
24) Primorsky Center for Environmental Monitoring, Roshydromet (PCEM) (RU02) THAILAND 25) Research and Training Centre (ERTC),
Department of Research and Environmental Quality Promotion (TH01)
26) Pollution Control Department (PCD) Ministry of Natural Resources and Environment (MONRE)
(TH02)
27) Meteorological Observation Division, Thailand Meteorological Department (TMD)
(TH04)
28) Chemistry Department, Science Faculty, Chiangmai University (CMU) (TH05) 29) Khon Kaen University (KKU) (TH06) VIET NAM 30) Environmental Laboratory – Center for Environmental Research – Vietnam Institute of Meteorology, Hydrology and Environment (IMHEN)- MoNRE – Vietnam
(VN01)
31) Middle of Central Regional Hydrometeorological Observatory, National Hydrometeorological Center (NHMS)
(VN02)
32) Sub-Institute of Hydrometeorology and Environment of South Vietnam (SIHYMETE)
(VN03)
33) Center for Hydrometeorological and Environmental Networks, National Hydrometeorological Service of Vietnam, MoNRE, Vietnam
(VN04)
34) Southern Region Hydrometeorological Center, National Hydrometeorological Service of Vietnam, MoNRE, Vietnam
(VN05)
35
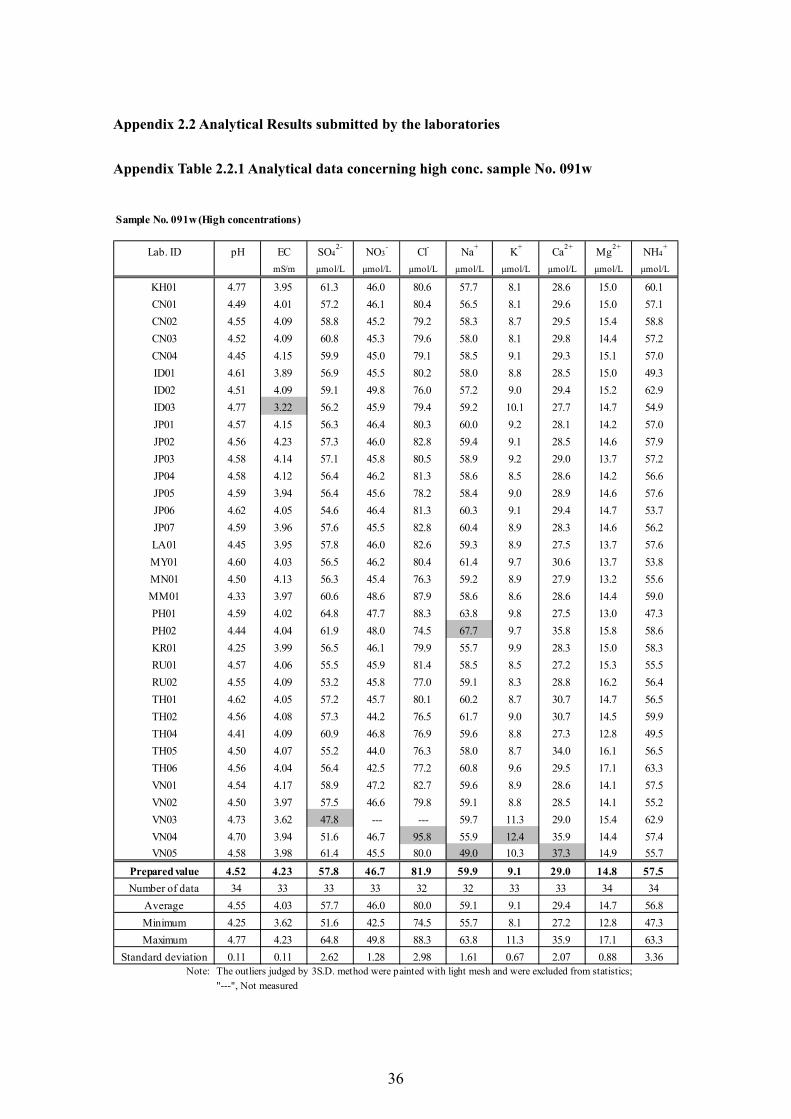
Appendix 2.2 Analytical Results submitted by the laboratories Appendix Table 2.2.1 Analytical data concerning high conc. sample No. 091w
Sample No. 091w (High concentrations)
Lab. ID pH EC SO42- NO3
- Cl- Na+ K+ Ca2+ Mg2+ NH4+
mS/m μmol/L μmol/L μmol/L μmol/L μmol/L μmol/L μmol/L μmol/L
KH01 4.77 3.95 61.3 46.0 80.6 57.7 8.1 28.6 15.0 60.1CN01 4.49 4.01 57.2 46.1 80.4 56.5 8.1 29.6 15.0 57.1CN02 4.55 4.09 58.8 45.2 79.2 58.3 8.7 29.5 15.4 58.8CN03 4.52 4.09 60.8 45.3 79.6 58.0 8.1 29.8 14.4 57.2CN04 4.45 4.15 59.9 45.0 79.1 58.5 9.1 29.3 15.1 57.0ID01 4.61 3.89 56.9 45.5 80.2 58.0 8.8 28.5 15.0 49.3ID02 4.51 4.09 59.1 49.8 76.0 57.2 9.0 29.4 15.2 62.9ID03 4.77 3.22 56.2 45.9 79.4 59.2 10.1 27.7 14.7 54.9JP01 4.57 4.15 56.3 46.4 80.3 60.0 9.2 28.1 14.2 57.0JP02 4.56 4.23 57.3 46.0 82.8 59.4 9.1 28.5 14.6 57.9JP03 4.58 4.14 57.1 45.8 80.5 58.9 9.2 29.0 13.7 57.2JP04 4.58 4.12 56.4 46.2 81.3 58.6 8.5 28.6 14.2 56.6JP05 4.59 3.94 56.4 45.6 78.2 58.4 9.0 28.9 14.6 57.6JP06 4.62 4.05 54.6 46.4 81.3 60.3 9.1 29.4 14.7 53.7JP07 4.59 3.96 57.6 45.5 82.8 60.4 8.9 28.3 14.6 56.2LA01 4.45 3.95 57.8 46.0 82.6 59.3 8.9 27.5 13.7 57.6MY01 4.60 4.03 56.5 46.2 80.4 61.4 9.7 30.6 13.7 53.8MN01 4.50 4.13 56.3 45.4 76.3 59.2 8.9 27.9 13.2 55.6MM01 4.33 3.97 60.6 48.6 87.9 58.6 8.6 28.6 14.4 59.0PH01 4.59 4.02 64.8 47.7 88.3 63.8 9.8 27.5 13.0 47.3PH02 4.44 4.04 61.9 48.0 74.5 67.7 9.7 35.8 15.8 58.6KR01 4.25 3.99 56.5 46.1 79.9 55.7 9.9 28.3 15.0 58.3RU01 4.57 4.06 55.5 45.9 81.4 58.5 8.5 27.2 15.3 55.5RU02 4.55 4.09 53.2 45.8 77.0 59.1 8.3 28.8 16.2 56.4TH01 4.62 4.05 57.2 45.7 80.1 60.2 8.7 30.7 14.7 56.5TH02 4.56 4.08 57.3 44.2 76.5 61.7 9.0 30.7 14.5 59.9TH04 4.41 4.09 60.9 46.8 76.9 59.6 8.8 27.3 12.8 49.5TH05 4.50 4.07 55.2 44.0 76.3 58.0 8.7 34.0 16.1 56.5TH06 4.56 4.04 56.4 42.5 77.2 60.8 9.6 29.5 17.1 63.3VN01 4.54 4.17 58.9 47.2 82.7 59.6 8.9 28.6 14.1 57.5VN02 4.50 3.97 57.5 46.6 79.8 59.1 8.8 28.5 14.1 55.2VN03 4.73 3.62 47.8 --- --- 59.7 11.3 29.0 15.4 62.9VN04 4.70 3.94 51.6 46.7 95.8 55.9 12.4 35.9 14.4 57.4VN05 4.58 3.98 61.4 45.5 80.0 49.0 10.3 37.3 14.9 55.7
Prepared value 4.52 4.23 57.8 46.7 81.9 59.9 9.1 29.0 14.8 57.5Number of data 34 33 33 33 32 32 33 33 34 34
Average 4.55 4.03 57.7 46.0 80.0 59.1 9.1 29.4 14.7 56.8Minimum 4.25 3.62 51.6 42.5 74.5 55.7 8.1 27.2 12.8 47.3Maximum 4.77 4.23 64.8 49.8 88.3 63.8 11.3 35.9 17.1 63.3
Standard deviation 0.11 0.11 2.62 1.28 2.98 1.61 0.67 2.07 0.88 3.36Note: The outliers judged by 3S.D. method were painted with light mesh and were excluded from statistics;
"---", Not measured
36
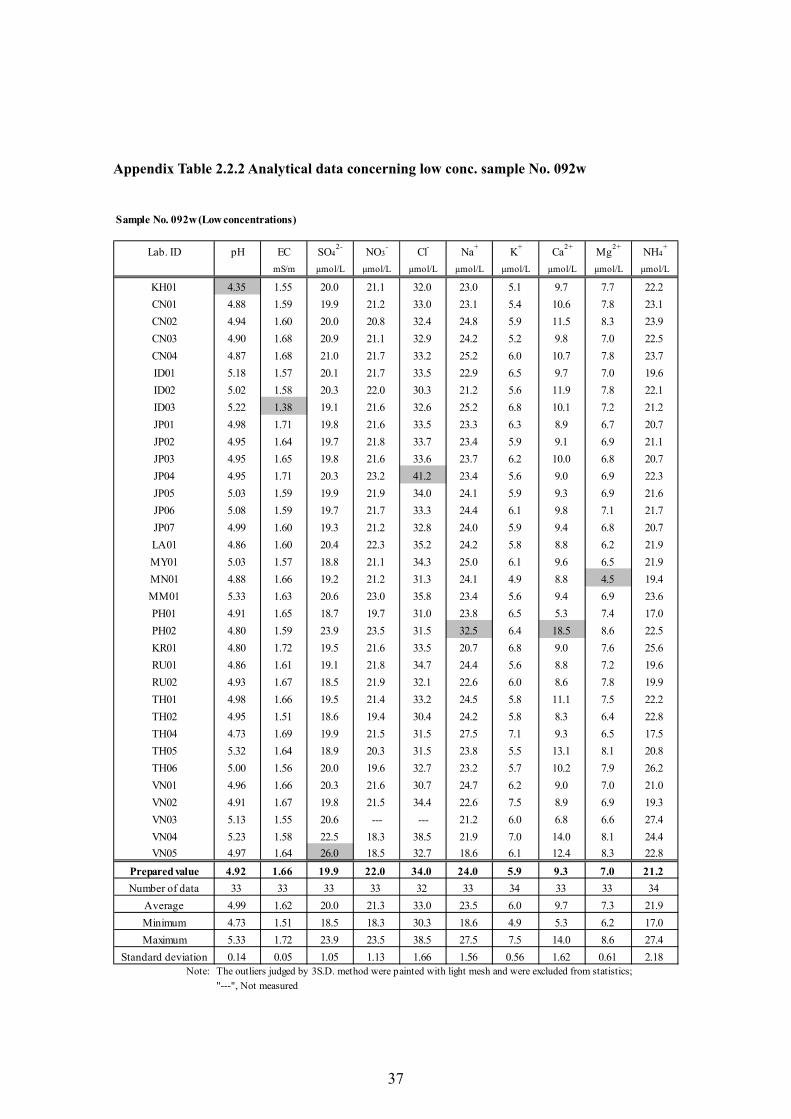
Appendix Table 2.2.2 Analytical data concerning low conc. sample No. 092w
Sample No. 092w (Low concentrations)
Lab. ID pH EC SO42- NO3
- Cl- Na+ K+ Ca2+ Mg2+ NH4+
mS/m μmol/L μmol/L μmol/L μmol/L μmol/L μmol/L μmol/L μmol/L
KH01 4.35 1.55 20.0 21.1 32.0 23.0 5.1 9.7 7.7 22.2CN01 4.88 1.59 19.9 21.2 33.0 23.1 5.4 10.6 7.8 23.1CN02 4.94 1.60 20.0 20.8 32.4 24.8 5.9 11.5 8.3 23.9CN03 4.90 1.68 20.9 21.1 32.9 24.2 5.2 9.8 7.0 22.5CN04 4.87 1.68 21.0 21.7 33.2 25.2 6.0 10.7 7.8 23.7ID01 5.18 1.57 20.1 21.7 33.5 22.9 6.5 9.7 7.0 19.6ID02 5.02 1.58 20.3 22.0 30.3 21.2 5.6 11.9 7.8 22.1ID03 5.22 1.38 19.1 21.6 32.6 25.2 6.8 10.1 7.2 21.2JP01 4.98 1.71 19.8 21.6 33.5 23.3 6.3 8.9 6.7 20.7JP02 4.95 1.64 19.7 21.8 33.7 23.4 5.9 9.1 6.9 21.1JP03 4.95 1.65 19.8 21.6 33.6 23.7 6.2 10.0 6.8 20.7JP04 4.95 1.71 20.3 23.2 41.2 23.4 5.6 9.0 6.9 22.3JP05 5.03 1.59 19.9 21.9 34.0 24.1 5.9 9.3 6.9 21.6JP06 5.08 1.59 19.7 21.7 33.3 24.4 6.1 9.8 7.1 21.7JP07 4.99 1.60 19.3 21.2 32.8 24.0 5.9 9.4 6.8 20.7LA01 4.86 1.60 20.4 22.3 35.2 24.2 5.8 8.8 6.2 21.9MY01 5.03 1.57 18.8 21.1 34.3 25.0 6.1 9.6 6.5 21.9MN01 4.88 1.66 19.2 21.2 31.3 24.1 4.9 8.8 4.5 19.4MM01 5.33 1.63 20.6 23.0 35.8 23.4 5.6 9.4 6.9 23.6PH01 4.91 1.65 18.7 19.7 31.0 23.8 6.5 5.3 7.4 17.0PH02 4.80 1.59 23.9 23.5 31.5 32.5 6.4 18.5 8.6 22.5KR01 4.80 1.72 19.5 21.6 33.5 20.7 6.8 9.0 7.6 25.6RU01 4.86 1.61 19.1 21.8 34.7 24.4 5.6 8.8 7.2 19.6RU02 4.93 1.67 18.5 21.9 32.1 22.6 6.0 8.6 7.8 19.9TH01 4.98 1.66 19.5 21.4 33.2 24.5 5.8 11.1 7.5 22.2TH02 4.95 1.51 18.6 19.4 30.4 24.2 5.8 8.3 6.4 22.8TH04 4.73 1.69 19.9 21.5 31.5 27.5 7.1 9.3 6.5 17.5TH05 5.32 1.64 18.9 20.3 31.5 23.8 5.5 13.1 8.1 20.8TH06 5.00 1.56 20.0 19.6 32.7 23.2 5.7 10.2 7.9 26.2VN01 4.96 1.66 20.3 21.6 30.7 24.7 6.2 9.0 7.0 21.0VN02 4.91 1.67 19.8 21.5 34.4 22.6 7.5 8.9 6.9 19.3VN03 5.13 1.55 20.6 --- --- 21.2 6.0 6.8 6.6 27.4VN04 5.23 1.58 22.5 18.3 38.5 21.9 7.0 14.0 8.1 24.4VN05 4.97 1.64 26.0 18.5 32.7 18.6 6.1 12.4 8.3 22.8
Prepared value 4.92 1.66 19.9 22.0 34.0 24.0 5.9 9.3 7.0 21.2Number of data 33 33 33 33 32 33 34 33 33 34
Average 4.99 1.62 20.0 21.3 33.0 23.5 6.0 9.7 7.3 21.9Minimum 4.73 1.51 18.5 18.3 30.3 18.6 4.9 5.3 6.2 17.0Maximum 5.33 1.72 23.9 23.5 38.5 27.5 7.5 14.0 8.6 27.4
Standard deviation 0.14 0.05 1.05 1.13 1.66 1.56 0.56 1.62 0.61 2.18Note: The outliers judged by 3S.D. method were painted with light mesh and were excluded from statistics;
"---", Not measured
37
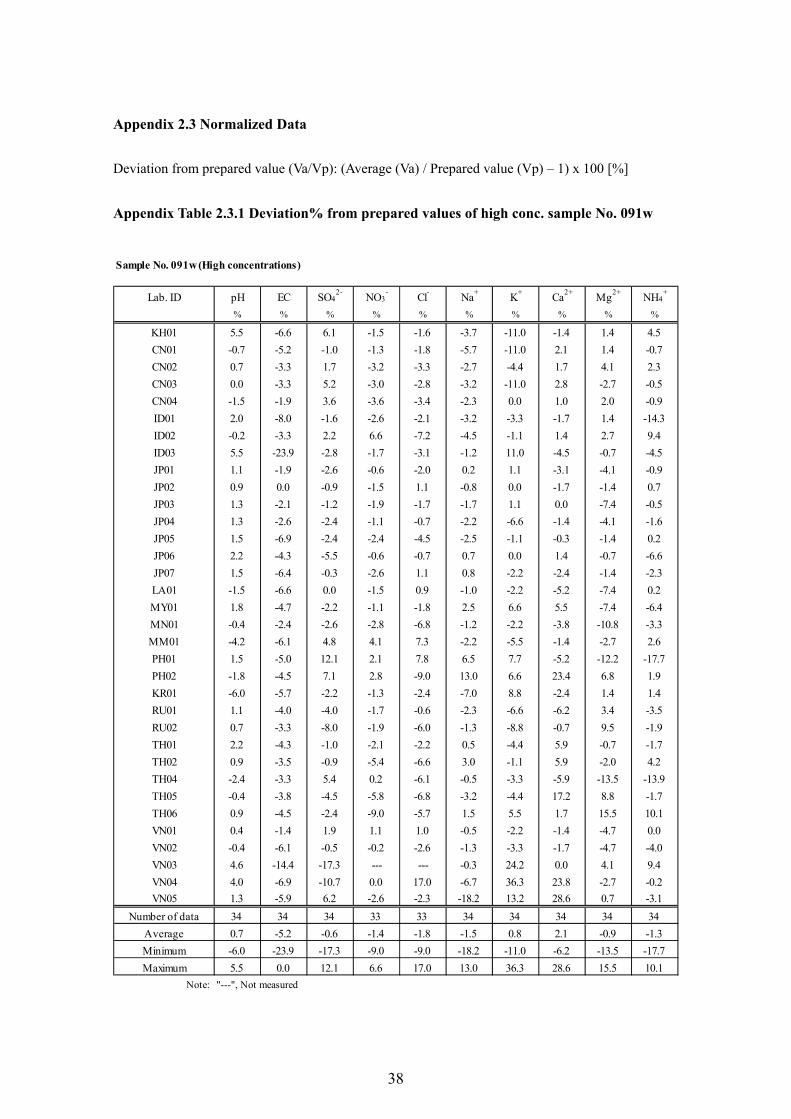
Appendix 2.3 Normalized Data Deviation from prepared value (Va/Vp): (Average (Va) / Prepared value (Vp) – 1) x 100 [%] Appendix Table 2.3.1 Deviation% from prepared values of high conc. sample No. 091w
Sample No. 091w (High concentrations)
Lab. ID pH EC SO42- NO3
- Cl- Na+ K+ Ca2+ Mg2+ NH4+
% % % % % % % % % %
KH01 5.5 -6.6 6.1 -1.5 -1.6 -3.7 -11.0 -1.4 1.4 4.5CN01 -0.7 -5.2 -1.0 -1.3 -1.8 -5.7 -11.0 2.1 1.4 -0.7CN02 0.7 -3.3 1.7 -3.2 -3.3 -2.7 -4.4 1.7 4.1 2.3CN03 0.0 -3.3 5.2 -3.0 -2.8 -3.2 -11.0 2.8 -2.7 -0.5CN04 -1.5 -1.9 3.6 -3.6 -3.4 -2.3 0.0 1.0 2.0 -0.9ID01 2.0 -8.0 -1.6 -2.6 -2.1 -3.2 -3.3 -1.7 1.4 -14.3ID02 -0.2 -3.3 2.2 6.6 -7.2 -4.5 -1.1 1.4 2.7 9.4ID03 5.5 -23.9 -2.8 -1.7 -3.1 -1.2 11.0 -4.5 -0.7 -4.5JP01 1.1 -1.9 -2.6 -0.6 -2.0 0.2 1.1 -3.1 -4.1 -0.9JP02 0.9 0.0 -0.9 -1.5 1.1 -0.8 0.0 -1.7 -1.4 0.7JP03 1.3 -2.1 -1.2 -1.9 -1.7 -1.7 1.1 0.0 -7.4 -0.5JP04 1.3 -2.6 -2.4 -1.1 -0.7 -2.2 -6.6 -1.4 -4.1 -1.6JP05 1.5 -6.9 -2.4 -2.4 -4.5 -2.5 -1.1 -0.3 -1.4 0.2JP06 2.2 -4.3 -5.5 -0.6 -0.7 0.7 0.0 1.4 -0.7 -6.6JP07 1.5 -6.4 -0.3 -2.6 1.1 0.8 -2.2 -2.4 -1.4 -2.3LA01 -1.5 -6.6 0.0 -1.5 0.9 -1.0 -2.2 -5.2 -7.4 0.2MY01 1.8 -4.7 -2.2 -1.1 -1.8 2.5 6.6 5.5 -7.4 -6.4MN01 -0.4 -2.4 -2.6 -2.8 -6.8 -1.2 -2.2 -3.8 -10.8 -3.3MM01 -4.2 -6.1 4.8 4.1 7.3 -2.2 -5.5 -1.4 -2.7 2.6PH01 1.5 -5.0 12.1 2.1 7.8 6.5 7.7 -5.2 -12.2 -17.7PH02 -1.8 -4.5 7.1 2.8 -9.0 13.0 6.6 23.4 6.8 1.9KR01 -6.0 -5.7 -2.2 -1.3 -2.4 -7.0 8.8 -2.4 1.4 1.4RU01 1.1 -4.0 -4.0 -1.7 -0.6 -2.3 -6.6 -6.2 3.4 -3.5RU02 0.7 -3.3 -8.0 -1.9 -6.0 -1.3 -8.8 -0.7 9.5 -1.9TH01 2.2 -4.3 -1.0 -2.1 -2.2 0.5 -4.4 5.9 -0.7 -1.7TH02 0.9 -3.5 -0.9 -5.4 -6.6 3.0 -1.1 5.9 -2.0 4.2TH04 -2.4 -3.3 5.4 0.2 -6.1 -0.5 -3.3 -5.9 -13.5 -13.9TH05 -0.4 -3.8 -4.5 -5.8 -6.8 -3.2 -4.4 17.2 8.8 -1.7TH06 0.9 -4.5 -2.4 -9.0 -5.7 1.5 5.5 1.7 15.5 10.1VN01 0.4 -1.4 1.9 1.1 1.0 -0.5 -2.2 -1.4 -4.7 0.0VN02 -0.4 -6.1 -0.5 -0.2 -2.6 -1.3 -3.3 -1.7 -4.7 -4.0VN03 4.6 -14.4 -17.3 --- --- -0.3 24.2 0.0 4.1 9.4VN04 4.0 -6.9 -10.7 0.0 17.0 -6.7 36.3 23.8 -2.7 -0.2VN05 1.3 -5.9 6.2 -2.6 -2.3 -18.2 13.2 28.6 0.7 -3.1
Number of data 34 34 34 33 33 34 34 34 34 34Average 0.7 -5.2 -0.6 -1.4 -1.8 -1.5 0.8 2.1 -0.9 -1.3Minimum -6.0 -23.9 -17.3 -9.0 -9.0 -18.2 -11.0 -6.2 -13.5 -17.7Maximum 5.5 0.0 12.1 6.6 17.0 13.0 36.3 28.6 15.5 10.1
Note: "---", Not measured
38
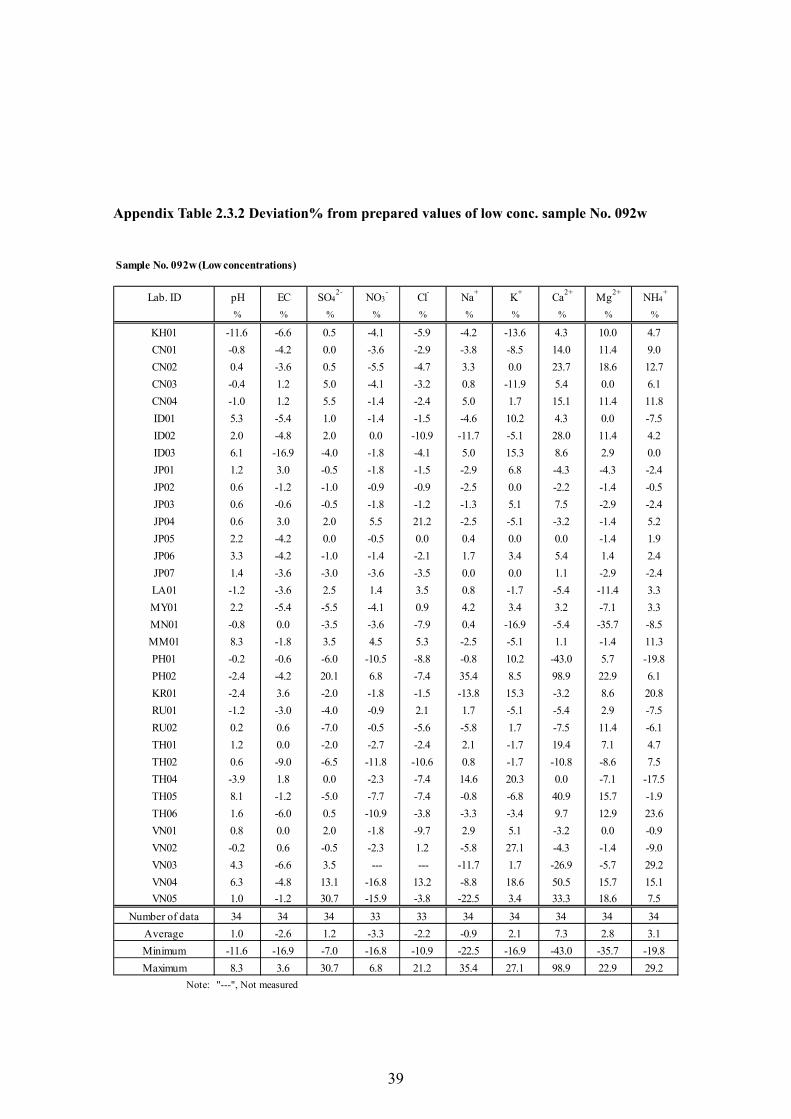
Appendix Table 2.3.2 Deviation% from prepared values of low conc. sample No. 092w
Sample No. 092w (Low concentrations)
Lab. ID pH EC SO42- NO3
- Cl- Na+ K+ Ca2+ Mg2+ NH4+
% % % % % % % % % %
KH01 -11.6 -6.6 0.5 -4.1 -5.9 -4.2 -13.6 4.3 10.0 4.7CN01 -0.8 -4.2 0.0 -3.6 -2.9 -3.8 -8.5 14.0 11.4 9.0CN02 0.4 -3.6 0.5 -5.5 -4.7 3.3 0.0 23.7 18.6 12.7CN03 -0.4 1.2 5.0 -4.1 -3.2 0.8 -11.9 5.4 0.0 6.1CN04 -1.0 1.2 5.5 -1.4 -2.4 5.0 1.7 15.1 11.4 11.8ID01 5.3 -5.4 1.0 -1.4 -1.5 -4.6 10.2 4.3 0.0 -7.5ID02 2.0 -4.8 2.0 0.0 -10.9 -11.7 -5.1 28.0 11.4 4.2ID03 6.1 -16.9 -4.0 -1.8 -4.1 5.0 15.3 8.6 2.9 0.0JP01 1.2 3.0 -0.5 -1.8 -1.5 -2.9 6.8 -4.3 -4.3 -2.4JP02 0.6 -1.2 -1.0 -0.9 -0.9 -2.5 0.0 -2.2 -1.4 -0.5JP03 0.6 -0.6 -0.5 -1.8 -1.2 -1.3 5.1 7.5 -2.9 -2.4JP04 0.6 3.0 2.0 5.5 21.2 -2.5 -5.1 -3.2 -1.4 5.2JP05 2.2 -4.2 0.0 -0.5 0.0 0.4 0.0 0.0 -1.4 1.9JP06 3.3 -4.2 -1.0 -1.4 -2.1 1.7 3.4 5.4 1.4 2.4JP07 1.4 -3.6 -3.0 -3.6 -3.5 0.0 0.0 1.1 -2.9 -2.4LA01 -1.2 -3.6 2.5 1.4 3.5 0.8 -1.7 -5.4 -11.4 3.3MY01 2.2 -5.4 -5.5 -4.1 0.9 4.2 3.4 3.2 -7.1 3.3MN01 -0.8 0.0 -3.5 -3.6 -7.9 0.4 -16.9 -5.4 -35.7 -8.5MM01 8.3 -1.8 3.5 4.5 5.3 -2.5 -5.1 1.1 -1.4 11.3PH01 -0.2 -0.6 -6.0 -10.5 -8.8 -0.8 10.2 -43.0 5.7 -19.8PH02 -2.4 -4.2 20.1 6.8 -7.4 35.4 8.5 98.9 22.9 6.1KR01 -2.4 3.6 -2.0 -1.8 -1.5 -13.8 15.3 -3.2 8.6 20.8RU01 -1.2 -3.0 -4.0 -0.9 2.1 1.7 -5.1 -5.4 2.9 -7.5RU02 0.2 0.6 -7.0 -0.5 -5.6 -5.8 1.7 -7.5 11.4 -6.1TH01 1.2 0.0 -2.0 -2.7 -2.4 2.1 -1.7 19.4 7.1 4.7TH02 0.6 -9.0 -6.5 -11.8 -10.6 0.8 -1.7 -10.8 -8.6 7.5TH04 -3.9 1.8 0.0 -2.3 -7.4 14.6 20.3 0.0 -7.1 -17.5TH05 8.1 -1.2 -5.0 -7.7 -7.4 -0.8 -6.8 40.9 15.7 -1.9TH06 1.6 -6.0 0.5 -10.9 -3.8 -3.3 -3.4 9.7 12.9 23.6VN01 0.8 0.0 2.0 -1.8 -9.7 2.9 5.1 -3.2 0.0 -0.9VN02 -0.2 0.6 -0.5 -2.3 1.2 -5.8 27.1 -4.3 -1.4 -9.0VN03 4.3 -6.6 3.5 --- --- -11.7 1.7 -26.9 -5.7 29.2VN04 6.3 -4.8 13.1 -16.8 13.2 -8.8 18.6 50.5 15.7 15.1VN05 1.0 -1.2 30.7 -15.9 -3.8 -22.5 3.4 33.3 18.6 7.5
Number of data 34 34 34 33 33 34 34 34 34 34Average 1.0 -2.6 1.2 -3.3 -2.2 -0.9 2.1 7.3 2.8 3.1Minimum -11.6 -16.9 -7.0 -16.8 -10.9 -22.5 -16.9 -43.0 -35.7 -19.8Maximum 8.3 3.6 30.7 6.8 21.2 35.4 27.1 98.9 22.9 29.2
Note: "---", Not measured
39
Appendix 2.4 Z-score evaluation The NC applied Z-score for further statistical evaluation of the analytical values in the inter-laboratory comparison on wet deposition.
Definition of Z-score Z-score is one of the statistical measures that quantify the distance from the mean of a data set. The formula for the calculation of Z-score (Robust method) was shown below:
where X: Measurement values of samples
Q1: The 1st quartile value of entire data Q2: The 2nd quartile value of entire data (i.e. Median) Q3: The 3rd quartile value of entire data
Evaluation of calculated Z-score
Z-score was given to each data submitted by the participating laboratories, and was evaluated as follows:
|Z| ≤ 2 : Satisfactory 2 < |Z| < 3 : Questionable
3 ≤ |Z| : Unsatisfactory The calculated Z-scores were shown in Appendix Table 2.4.1 and 2.4.2, and were also graphed in Appendix Figure 2.4.1 through 2.4.10.
Z = 0.7413 x (Q3 – Q1)
X – Q2
40
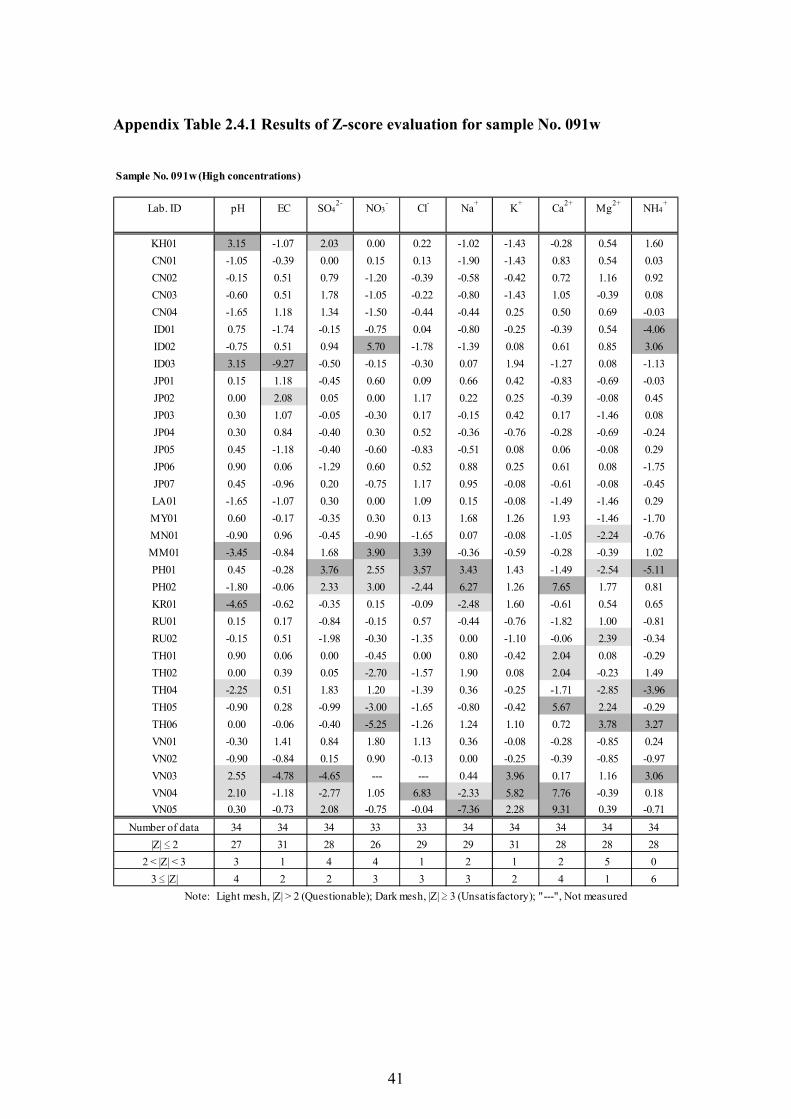
Appendix Table 2.4.1 Results of Z-score evaluation for sample No. 091w
Sample No. 091w (High concentrations)
Lab. ID pH EC SO42- NO3
- Cl- Na+ K+ Ca2+ Mg2+ NH4+
KH01 3.15 -1.07 2.03 0.00 0.22 -1.02 -1.43 -0.28 0.54 1.60CN01 -1.05 -0.39 0.00 0.15 0.13 -1.90 -1.43 0.83 0.54 0.03CN02 -0.15 0.51 0.79 -1.20 -0.39 -0.58 -0.42 0.72 1.16 0.92CN03 -0.60 0.51 1.78 -1.05 -0.22 -0.80 -1.43 1.05 -0.39 0.08CN04 -1.65 1.18 1.34 -1.50 -0.44 -0.44 0.25 0.50 0.69 -0.03ID01 0.75 -1.74 -0.15 -0.75 0.04 -0.80 -0.25 -0.39 0.54 -4.06ID02 -0.75 0.51 0.94 5.70 -1.78 -1.39 0.08 0.61 0.85 3.06ID03 3.15 -9.27 -0.50 -0.15 -0.30 0.07 1.94 -1.27 0.08 -1.13JP01 0.15 1.18 -0.45 0.60 0.09 0.66 0.42 -0.83 -0.69 -0.03JP02 0.00 2.08 0.05 0.00 1.17 0.22 0.25 -0.39 -0.08 0.45JP03 0.30 1.07 -0.05 -0.30 0.17 -0.15 0.42 0.17 -1.46 0.08JP04 0.30 0.84 -0.40 0.30 0.52 -0.36 -0.76 -0.28 -0.69 -0.24JP05 0.45 -1.18 -0.40 -0.60 -0.83 -0.51 0.08 0.06 -0.08 0.29JP06 0.90 0.06 -1.29 0.60 0.52 0.88 0.25 0.61 0.08 -1.75JP07 0.45 -0.96 0.20 -0.75 1.17 0.95 -0.08 -0.61 -0.08 -0.45LA01 -1.65 -1.07 0.30 0.00 1.09 0.15 -0.08 -1.49 -1.46 0.29MY01 0.60 -0.17 -0.35 0.30 0.13 1.68 1.26 1.93 -1.46 -1.70MN01 -0.90 0.96 -0.45 -0.90 -1.65 0.07 -0.08 -1.05 -2.24 -0.76MM01 -3.45 -0.84 1.68 3.90 3.39 -0.36 -0.59 -0.28 -0.39 1.02PH01 0.45 -0.28 3.76 2.55 3.57 3.43 1.43 -1.49 -2.54 -5.11PH02 -1.80 -0.06 2.33 3.00 -2.44 6.27 1.26 7.65 1.77 0.81KR01 -4.65 -0.62 -0.35 0.15 -0.09 -2.48 1.60 -0.61 0.54 0.65RU01 0.15 0.17 -0.84 -0.15 0.57 -0.44 -0.76 -1.82 1.00 -0.81RU02 -0.15 0.51 -1.98 -0.30 -1.35 0.00 -1.10 -0.06 2.39 -0.34TH01 0.90 0.06 0.00 -0.45 0.00 0.80 -0.42 2.04 0.08 -0.29TH02 0.00 0.39 0.05 -2.70 -1.57 1.90 0.08 2.04 -0.23 1.49TH04 -2.25 0.51 1.83 1.20 -1.39 0.36 -0.25 -1.71 -2.85 -3.96TH05 -0.90 0.28 -0.99 -3.00 -1.65 -0.80 -0.42 5.67 2.24 -0.29TH06 0.00 -0.06 -0.40 -5.25 -1.26 1.24 1.10 0.72 3.78 3.27VN01 -0.30 1.41 0.84 1.80 1.13 0.36 -0.08 -0.28 -0.85 0.24VN02 -0.90 -0.84 0.15 0.90 -0.13 0.00 -0.25 -0.39 -0.85 -0.97VN03 2.55 -4.78 -4.65 --- --- 0.44 3.96 0.17 1.16 3.06VN04 2.10 -1.18 -2.77 1.05 6.83 -2.33 5.82 7.76 -0.39 0.18VN05 0.30 -0.73 2.08 -0.75 -0.04 -7.36 2.28 9.31 0.39 -0.71
Number of data 34 34 34 33 33 34 34 34 34 34|Z| ≤ 2 27 31 28 26 29 29 31 28 28 28
2 < |Z| < 3 3 1 4 4 1 2 1 2 5 03 ≤ |Z| 4 2 2 3 3 3 2 4 1 6
Note: Light mesh, |Z| > 2 (Questionable); Dark mesh, |Z| ≥ 3 (Unsatisfactory); "---", Not measured
41
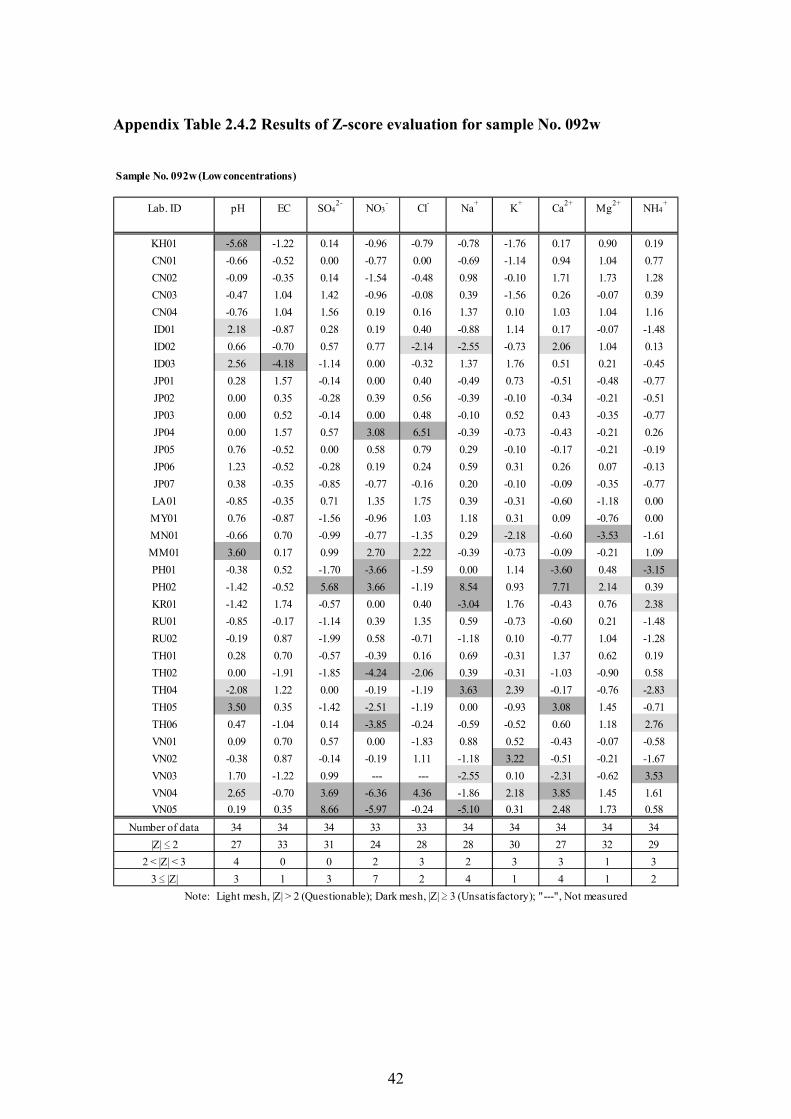
Appendix Table 2.4.2 Results of Z-score evaluation for sample No. 092w
Sample No. 092w (Low concentrations)
Lab. ID pH EC SO42- NO3
- Cl- Na+ K+ Ca2+ Mg2+ NH4+
KH01 -5.68 -1.22 0.14 -0.96 -0.79 -0.78 -1.76 0.17 0.90 0.19CN01 -0.66 -0.52 0.00 -0.77 0.00 -0.69 -1.14 0.94 1.04 0.77CN02 -0.09 -0.35 0.14 -1.54 -0.48 0.98 -0.10 1.71 1.73 1.28CN03 -0.47 1.04 1.42 -0.96 -0.08 0.39 -1.56 0.26 -0.07 0.39CN04 -0.76 1.04 1.56 0.19 0.16 1.37 0.10 1.03 1.04 1.16ID01 2.18 -0.87 0.28 0.19 0.40 -0.88 1.14 0.17 -0.07 -1.48ID02 0.66 -0.70 0.57 0.77 -2.14 -2.55 -0.73 2.06 1.04 0.13ID03 2.56 -4.18 -1.14 0.00 -0.32 1.37 1.76 0.51 0.21 -0.45JP01 0.28 1.57 -0.14 0.00 0.40 -0.49 0.73 -0.51 -0.48 -0.77JP02 0.00 0.35 -0.28 0.39 0.56 -0.39 -0.10 -0.34 -0.21 -0.51JP03 0.00 0.52 -0.14 0.00 0.48 -0.10 0.52 0.43 -0.35 -0.77JP04 0.00 1.57 0.57 3.08 6.51 -0.39 -0.73 -0.43 -0.21 0.26JP05 0.76 -0.52 0.00 0.58 0.79 0.29 -0.10 -0.17 -0.21 -0.19JP06 1.23 -0.52 -0.28 0.19 0.24 0.59 0.31 0.26 0.07 -0.13JP07 0.38 -0.35 -0.85 -0.77 -0.16 0.20 -0.10 -0.09 -0.35 -0.77LA01 -0.85 -0.35 0.71 1.35 1.75 0.39 -0.31 -0.60 -1.18 0.00MY01 0.76 -0.87 -1.56 -0.96 1.03 1.18 0.31 0.09 -0.76 0.00MN01 -0.66 0.70 -0.99 -0.77 -1.35 0.29 -2.18 -0.60 -3.53 -1.61MM01 3.60 0.17 0.99 2.70 2.22 -0.39 -0.73 -0.09 -0.21 1.09PH01 -0.38 0.52 -1.70 -3.66 -1.59 0.00 1.14 -3.60 0.48 -3.15PH02 -1.42 -0.52 5.68 3.66 -1.19 8.54 0.93 7.71 2.14 0.39KR01 -1.42 1.74 -0.57 0.00 0.40 -3.04 1.76 -0.43 0.76 2.38RU01 -0.85 -0.17 -1.14 0.39 1.35 0.59 -0.73 -0.60 0.21 -1.48RU02 -0.19 0.87 -1.99 0.58 -0.71 -1.18 0.10 -0.77 1.04 -1.28TH01 0.28 0.70 -0.57 -0.39 0.16 0.69 -0.31 1.37 0.62 0.19TH02 0.00 -1.91 -1.85 -4.24 -2.06 0.39 -0.31 -1.03 -0.90 0.58TH04 -2.08 1.22 0.00 -0.19 -1.19 3.63 2.39 -0.17 -0.76 -2.83TH05 3.50 0.35 -1.42 -2.51 -1.19 0.00 -0.93 3.08 1.45 -0.71TH06 0.47 -1.04 0.14 -3.85 -0.24 -0.59 -0.52 0.60 1.18 2.76VN01 0.09 0.70 0.57 0.00 -1.83 0.88 0.52 -0.43 -0.07 -0.58VN02 -0.38 0.87 -0.14 -0.19 1.11 -1.18 3.22 -0.51 -0.21 -1.67VN03 1.70 -1.22 0.99 --- --- -2.55 0.10 -2.31 -0.62 3.53VN04 2.65 -0.70 3.69 -6.36 4.36 -1.86 2.18 3.85 1.45 1.61VN05 0.19 0.35 8.66 -5.97 -0.24 -5.10 0.31 2.48 1.73 0.58
Number of data 34 34 34 33 33 34 34 34 34 34|Z| ≤ 2 27 33 31 24 28 28 30 27 32 29
2 < |Z| < 3 4 0 0 2 3 2 3 3 1 33 ≤ |Z| 3 1 3 7 2 4 1 4 1 2
Note: Light mesh, |Z| > 2 (Questionable); Dark mesh, |Z| ≥ 3 (Unsatisfactory); "---", Not measured
42
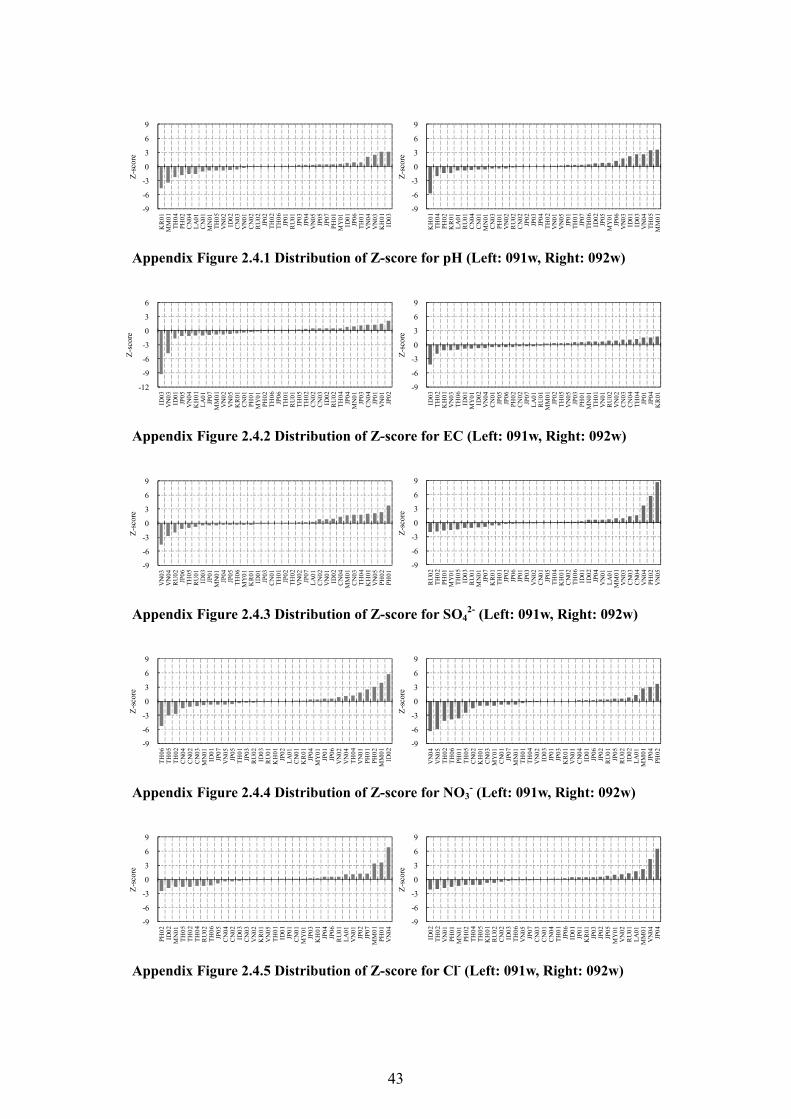
-9
-6
-3
0
3
6
9
KR
01M
M01
TH04
PH02
CN
04LA
01C
N01
MN
01TH
05V
N02
ID02
CN
03V
N01
CN
02R
U02
JP02
TH02
TH06
JP01
RU
01JP
03JP
04V
N05
JP05
JP07
PH01
MY
01ID
01JP
06TH
01V
N04
VN
03K
H01
ID03
Z-sc
ore
-9
-6
-3
0
3
6
9
KH
01TH
04PH
02K
R01
LA01
RU
01C
N04
CN
01M
N01
CN
03PH
01V
N02
RU
02C
N02
JP02
JP03
JP04
TH02
VN
01V
N05
JP01
TH01
JP07
TH06
ID02
JP05
MY
01JP
06V
N03
ID01
ID03
VN
04TH
05M
M01
Z-sc
ore
Appendix Figure 2.4.1 Distribution of Z-score for pH (Left: 091w, Right: 092w)
-12
-9
-6
-3
0
3
6
ID03
VN
03ID
01JP
05V
N04
KH
01LA
01JP
07M
M01
VN
02V
N05
KR
01C
N01
PH01
MY
01PH
02TH
06JP
06TH
01R
U01
TH05
TH02
CN
02C
N03
ID02
RU
02TH
04JP
04M
N01
JP03
CN
04JP
01V
N01
JP02
Z-sc
ore
-9
-6
-3
0
3
6
9
ID03
TH02
KH
01V
N03
TH06
ID01
MY
01ID
02V
N04
CN
01JP
05JP
06PH
02C
N02
JP07
LA01
RU
01M
M01
JP02
TH05
VN
05JP
03PH
01M
N01
TH01
VN
01R
U02
VN
02C
N03
CN
04TH
04JP
01JP
04K
R01
Z-sc
ore
Appendix Figure 2.4.2 Distribution of Z-score for EC (Left: 091w, Right: 092w)
-9
-6
-3
0
3
6
9
VN
03V
N04
RU
02JP
06TH
05R
U01
ID03
JP01
MN
01JP
04JP
05TH
06M
Y01
KR
01ID
01JP
03C
N01
TH01
JP02
TH02
VN
02JP
07LA
01C
N02
VN
01ID
02C
N04
MM
01C
N03
TH04
KH
01V
N05
PH02
PH01
Z-sc
ore
-9
-6
-3
0
3
6
9
RU
02TH
02PH
01M
Y01
TH05
ID03
RU
01M
N01
JP07
KR
01TH
01JP
02JP
06JP
01JP
03V
N02
CN
01JP
05TH
04K
H01
CN
02TH
06ID
01ID
02JP
04V
N01
LA01
MM
01V
N03
CN
03C
N04
VN
04PH
02V
N05
Z-sc
ore
Appendix Figure 2.4.3 Distribution of Z-score for SO4
2- (Left: 091w, Right: 092w)
-9
-6
-3
0
3
6
9
TH06
TH05
TH02
CN
04C
N02
CN
03M
N01
ID01
JP07
VN
05JP
05TH
01JP
03R
U02
ID03
RU
01K
H01
JP02
LA01
CN
01K
R01
JP04
MY
01JP
01JP
06V
N02
VN
04TH
04V
N01
PH01
PH02
MM
01ID
02
Z-sc
ore
-9
-6
-3
0
3
6
9
VN
04V
N05
TH02
TH06
PH01
TH05
CN
02K
H01
CN
03M
Y01
CN
01JP
07M
N01
TH01
TH04
VN
02ID
03JP
01JP
03K
R01
VN
01C
N04
ID01
JP06
JP02
RU
01JP
05R
U02
ID02
LA01
MM
01JP
04PH
02
Z-sc
ore
Appendix Figure 2.4.4 Distribution of Z-score for NO3
- (Left: 091w, Right: 092w)
-9
-6
-3
0
3
6
9
PH02
ID02
MN
01TH
05TH
02TH
04R
U02
TH06
JP05
CN
04C
N02
ID03
CN
03V
N02
KR
01V
N05
TH01
ID01
JP01
CN
01M
Y01
JP03
KH
01JP
04JP
06R
U01
LA01
VN
01JP
02JP
07M
M01
PH01
VN
04
Z-sc
ore
-9
-6
-3
0
3
6
9
ID02
TH02
VN
01PH
01M
N01
PH02
TH04
TH05
KH
01R
U02
CN
02ID
03TH
06V
N05
JP07
CN
03C
N01
CN
04TH
01JP
06ID
01JP
01K
R01
JP03
JP02
JP05
MY
01V
N02
RU
01LA
01M
M01
VN
04JP
04
Z-sc
ore
Appendix Figure 2.4.5 Distribution of Z-score for Cl- (Left: 091w, Right: 092w)
43
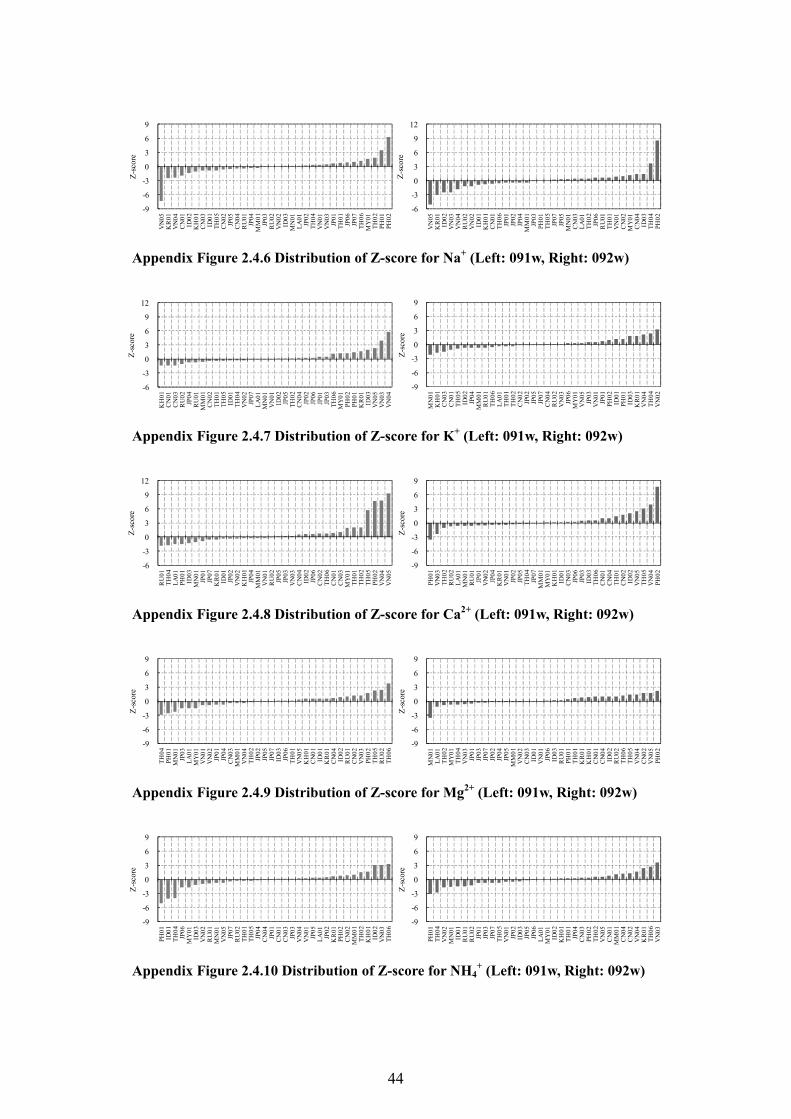
-9
-6
-3
0
3
6
9
VN
05K
R01
VN
04C
N01
ID02
KH
01C
N03
ID01
TH05
CN
02JP
05C
N04
RU
01JP
04M
M01
JP03
RU
02V
N02
ID03
MN
01LA
01JP
02TH
04V
N01
VN
03JP
01TH
01JP
06JP
07TH
06M
Y01
TH02
PH01
PH02
Z-sc
ore
-6
-3
0
3
6
9
12
VN
05K
R01
ID02
VN
03V
N04
RU
02V
N02
ID01
KH
01C
N01
TH06
JP01
JP02
JP04
MM
01JP
03PH
01TH
05JP
07JP
05M
N01
CN
03LA
01TH
02JP
06R
U01
TH01
VN
01C
N02
MY
01C
N04
ID03
TH04
PH02
Z-sc
ore
Appendix Figure 2.4.6 Distribution of Z-score for Na+ (Left: 091w, Right: 092w)
-6
-3
0
3
6
9
12
KH
01C
N01
CN
03R
U02
JP04
RU
01M
M01
CN
02TH
01TH
05ID
01TH
04V
N02
JP07
LA01
MN
01V
N01
ID02
JP05
TH02
CN
04JP
02JP
06JP
01JP
03TH
06M
Y01
PH02
PH01
KR
01ID
03V
N05
VN
03V
N04
Z-sc
ore
-9
-6
-3
0
3
6
9
MN
01K
H01
CN
03C
N01
TH05
ID02
JP04
MM
01R
U01
TH06
LA01
TH01
TH02
CN
02JP
02JP
05JP
07C
N04
RU
02V
N03
JP06
MY
01V
N05
JP03
VN
01JP
01PH
02ID
01PH
01ID
03K
R01
VN
04TH
04V
N02
Z-sc
ore
Appendix Figure 2.4.7 Distribution of Z-score for K+ (Left: 091w, Right: 092w)
-6
-3
0
3
6
9
12
RU
01TH
04LA
01PH
01ID
03M
N01
JP01
JP07
KR
01ID
01JP
02V
N02
KH
01JP
04M
M01
VN
01R
U02
JP05
JP03
VN
03C
N04
ID02
JP06
CN
02TH
06C
N01
CN
03M
Y01
TH01
TH02
TH05
PH02
VN
04V
N05
Z-sc
ore
-9
-6
-3
0
3
6
9
PH01
VN
03TH
02R
U02
LA01
MN
01R
U01
JP01
VN
02JP
04K
R01
VN
01JP
02JP
05TH
04JP
07M
M01
MY
01K
H01
ID01
CN
03JP
06JP
03ID
03TH
06C
N01
CN
04TH
01C
N02
ID02
VN
05TH
05V
N04
PH02
Z-sc
ore
Appendix Figure 2.4.8 Distribution of Z-score for Ca2+ (Left: 091w, Right: 092w)
-9
-6
-3
0
3
6
9
TH04
PH01
MN
01JP
03LA
01M
Y01
VN
01V
N02
JP01
JP04
CN
03M
M01
VN
04TH
02JP
02JP
05JP
07ID
03JP
06TH
01V
N05
KH
01C
N01
ID01
KR
01C
N04
ID02
RU
01C
N02
VN
03PH
02TH
05R
U02
TH06
Z-sc
ore
-9
-6
-3
0
3
6
9
MN
01LA
01TH
02M
Y01
TH04
VN
03JP
01JP
03JP
07JP
02JP
04JP
05M
M01
VN
02C
N03
ID01
VN
01JP
06ID
03R
U01
PH01
TH01
KR
01K
H01
CN
01C
N04
ID02
RU
02TH
06TH
05V
N04
CN
02V
N05
PH02
Z-sc
ore
Appendix Figure 2.4.9 Distribution of Z-score for Mg2+ (Left: 091w, Right: 092w)
-9
-6
-3
0
3
6
9
PH01
ID01
TH04
JP06
MY
01ID
03V
N02
RU
01M
N01
VN
05JP
07R
U02
TH01
TH05
JP04
CN
04JP
01C
N01
CN
03JP
03V
N04
VN
01JP
05LA
01JP
02K
R01
PH02
CN
02M
M01
TH02
KH
01ID
02V
N03
TH06
Z-sc
ore
-9
-6
-3
0
3
6
9
PH01
TH04
VN
02M
N01
ID01
RU
01R
U02
JP01
JP03
JP07
TH05
VN
01JP
02ID
03JP
05JP
06LA
01M
Y01
ID02
KH
01TH
01JP
04C
N03
PH02
TH02
VN
05C
N01
MM
01C
N04
CN
02V
N04
KR
01TH
06V
N03
Z-sc
ore
Appendix Figure 2.4.10 Distribution of Z-score for NH4
+ (Left: 091w, Right: 092w)
44
3. 5th INTER-LABORATORY COMPARISON PROJECT ON DRY DEPOSITION
3.1 Introduction
In the Inter-laboratory Comparison for dry deposition, impregnated filters which contained
either SO42-and Cl-, or NH4
+ were prepared and distributed to the participating laboratories by
the Network Center (NC) in October 2009. Most of the laboratories participating in EANET
joined this activity and submitted their analytical results to the NC. These results for SO42-, Cl-,
and NH4+ on the filter were compared with the corresponding prepared value and statistically
analyzed.
3.2 Procedures
3.2.1 Participating Laboratories
A total of 24 laboratories in charge of EANET monitoring in 11 countries of EANET
participated in this fifth activity. All participating laboratories with their abbreviated names and
codes are listed in Appendix 3-1.
3.2.2 Description of Samples
Two kinds of sample filters, one contained two ions (SO42-and Cl-), the other contained one ion
(NH4+), were prepared and distributed to the laboratories. The blank filters, which were
impregnated with K2CO3 or H3PO4 but did not contain any SO42-, Cl-, or NH4
+, were also
prepared and distributed. The details of the sample filters were described in Table 3.1. The
analytical precision and accuracy on the individual analyte were summarized through statistical
calculations of the submitted analytical results from each participating laboratory.
Table 3.1 Outline of filter samples
Name Details Container Number of
filters Note
No.091d-1 Alkali-Impregnated
filter (small quantity)
Polyethylene
centrifuge tube
3
The K2CO3 impregnated
filter contains two ions
(SO42- and Cl-).
No.091d-2 Acid-Impregnated
filter (small quantity)
Polyethylene
centrifuge tube
3 The H3PO4 impregnated
filter contains one ion
(NH4+).
45
No.092d-1 Alkali-Impregnated
filter (large quantity)
Polyethylene
centrifuge tube
3 The K2CO3 impregnated
filter contains two ions
(SO42- and Cl-).
No.092d-2 Acid-Impregnated
filter (large quantity)
Polyethylene
centrifuge tube
3 The H3PO4 impregnated
filter contains one ion
(NH4+).
No.093d-1 Alkali-Impregnated
filter (blank)
Polyethylene
centrifuge tube
3 The filter impregnated with
K2CO3.
No.093d-2 Acid-Impregnated
filter (blank)
Polyethylene
centrifuge tube
3 The filter impregnated with
H3PO4.
3.2.3 Analytes
All participating laboratories were expected to analyze these sample filters and to submit their
values as the net quantity of each ion (SO42-, Cl-, and NH4
+) in micrograms (µg).
3.2.4 Analytical Methodologies
The recommended procedure for sampling and analyzing by the filter pack method is described
in EANET Document, “Technical Document for Filter Pack Method in EAST Asia” (The NC,
2003). Each sample filter was put in a centrifuge tube, a solvent was directly poured into the
tube for extraction. The extraction procedure was as follows;
(1) Sample No.091d-1, No.092d-1, No.093d-1
Add 20 mL of H2O2 solution (0.05%-v/v) as an extracting solvent into each centrifuge tube, then
shake or agitate them for 20 minutes using a shaker or an ultrasonic bath for extraction.
(2) Sample No.091d-2, No.092d-2, No.093d-2
Add 20 mL of deionized water as an extracting solvent into each centrifuge tube, then shake or
agitate them for 20 minutes using a shaker or an ultrasonic bath for extraction.
(3) Filtration
Remove insoluble matter from the solution using a membrane filter (pore size 0.45 µm). The
membrane filter must be prewashed with pure water (more than 100 mL) before filtration. After
filtration, those filtrates are assigned identification numbers and sealed tightly.
Note 1) Carry out the analysis immediately after extraction.
Note 2) In principle, it is strongly recommended that the filtrates be analyzed immediately
after extraction, however, in the case that they need to be kept for certain reasons, store them
in a refrigerator at 4℃.
46
The participating laboratories were expected to use the same analytical methods. Analytical
methods specified in the Technical Document were shown in Table 3.2.
Table 3.2 Analytical methods specified in the Technical Document
Analyte Analytical method
SO42-
Ion Chromatography or Spectrophotometry Cl-
NH4+
Ion Chromatography
Spectrophotometry (Indophenol Blue)
3.2.5 Data Check Procedures
All participating laboratories were requested to report as the net quantity of each ion (SO42-, Cl-,
and NH4+) in the sample filter.
Each quantity (Msol) was calculated as follows:
Msol = Csol x Vsol (1)
where Msol : quantity of each component in the filtrate (µg) ;
Csol : concentration of each component in the filtrate (mg/L);
Vsol : volume of the solvent (20 mL).
The net quantity of each ion (netMsol) was calculated as follows :
net Msol = Msol, Sample - Msol, Blank (2)
where netMsol : net quantity of each ion on the filter.
Msol,Sample: quantity (µg) of each component in the filtrate from sample
No.091d-1,No.091d-2,No.092d-1 and No.092d-2;
Msol,Blank: the average quantity (µg) in the filtrate from blank sample No.093d-1 and
No.093d-2.
Note 3) netMsol was automatically calculated by entering their values of Msol,sample and Msol, blank
on Excell file. (File name : 2009Dry_report1_2_format.xls.)
47
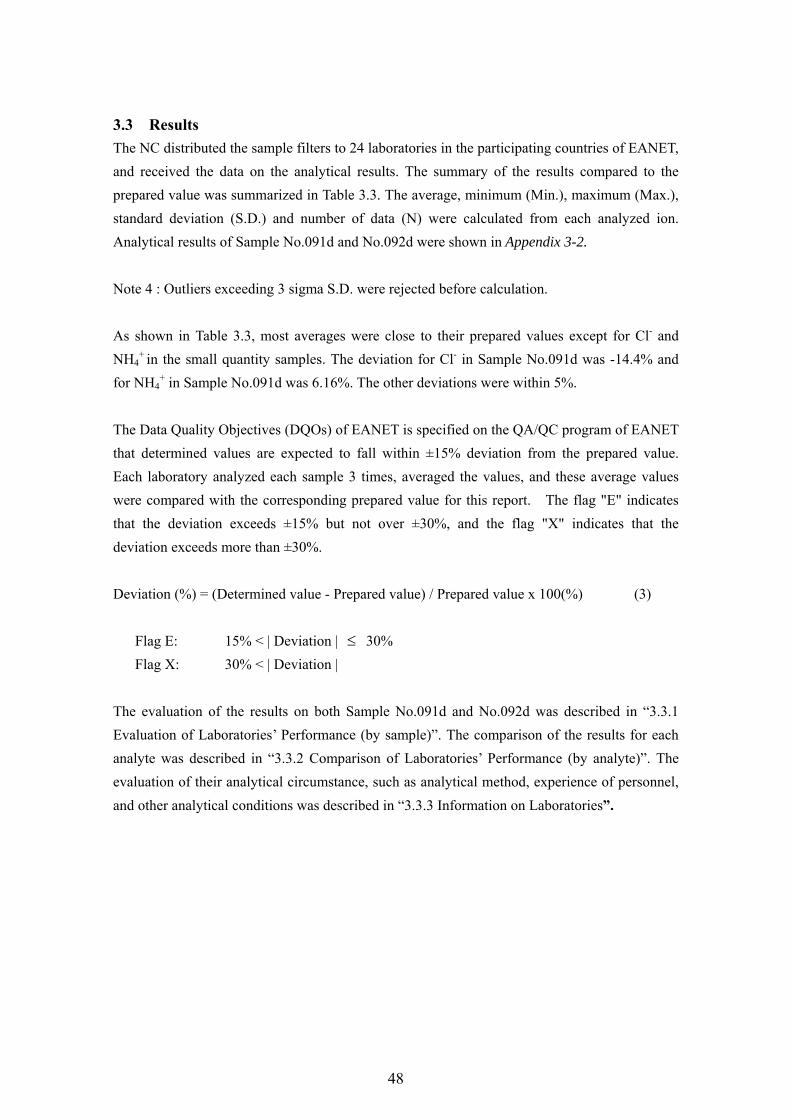
3.3 Results
The NC distributed the sample filters to 24 laboratories in the participating countries of EANET,
and received the data on the analytical results. The summary of the results compared to the
prepared value was summarized in Table 3.3. The average, minimum (Min.), maximum (Max.),
standard deviation (S.D.) and number of data (N) were calculated from each analyzed ion.
Analytical results of Sample No.091d and No.092d were shown in Appendix 3-2.
Note 4 : Outliers exceeding 3 sigma S.D. were rejected before calculation.
As shown in Table 3.3, most averages were close to their prepared values except for Cl- and
NH4+ in the small quantity samples. The deviation for Cl- in Sample No.091d was -14.4% and
for NH4+ in Sample No.091d was 6.16%. The other deviations were within 5%.
The Data Quality Objectives (DQOs) of EANET is specified on the QA/QC program of EANET
that determined values are expected to fall within ±15% deviation from the prepared value.
Each laboratory analyzed each sample 3 times, averaged the values, and these average values
were compared with the corresponding prepared value for this report. The flag "E" indicates
that the deviation exceeds ±15% but not over ±30%, and the flag "X" indicates that the
deviation exceeds more than ±30%.
Deviation (%) = (Determined value - Prepared value) / Prepared value x 100(%) (3)
Flag E: 15% < | Deviation | 30%
Flag X: 30% < | Deviation |
The evaluation of the results on both Sample No.091d and No.092d was described in “3.3.1
Evaluation of Laboratories’ Performance (by sample)”. The comparison of the results for each
analyte was described in “3.3.2 Comparison of Laboratories’ Performance (by analyte)”. The
evaluation of their analytical circumstance, such as analytical method, experience of personnel,
and other analytical conditions was described in “3.3.3 Information on Laboratories”.
48
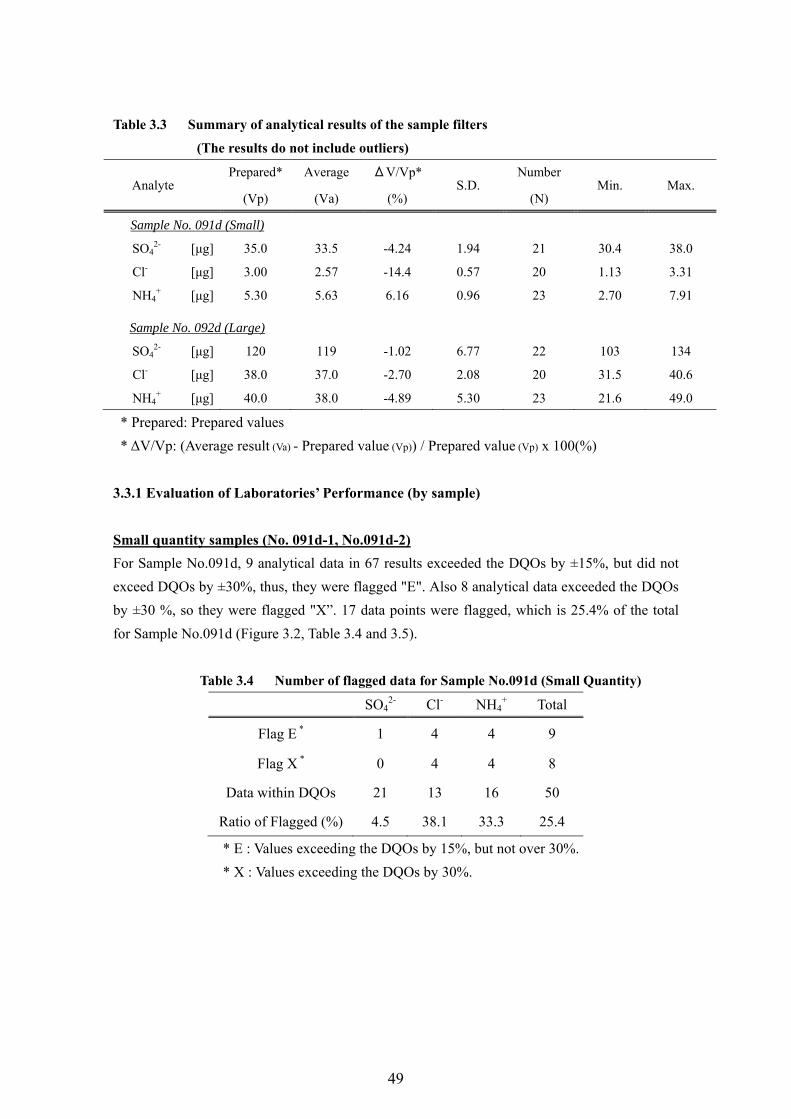
Table 3.3 Summary of analytical results of the sample filters
(The results do not include outliers)
Analyte Prepared* Average ΔV/Vp*
S.D. Number
Min. Max. (Vp) (Va) (%) (N)
Sample No. 091d (Small)
SO42- [μg] 35.0 33.5 -4.24 1.94 21 30.4 38.0
Cl- [μg] 3.00 2.57 -14.4 0.57 20 1.13 3.31
NH4+ [μg] 5.30 5.63 6.16 0.96 23 2.70 7.91
Sample No. 092d (Large)
SO42- [μg] 120 119 -1.02 6.77 22 103 134
Cl- [μg] 38.0 37.0 -2.70 2.08 20 31.5 40.6
NH4+ [μg] 40.0 38.0 -4.89 5.30 23 21.6 49.0
* Prepared: Prepared values
* ΔV/Vp: (Average result (Va) - Prepared value (Vp)) / Prepared value (Vp) x 100(%)
3.3.1 Evaluation of Laboratories’ Performance (by sample)
Small quantity samples (No. 091d-1, No.091d-2)
For Sample No.091d, 9 analytical data in 67 results exceeded the DQOs by ±15%, but did not
exceed DQOs by ±30%, thus, they were flagged "E". Also 8 analytical data exceeded the DQOs
by ±30 %, so they were flagged "X”. 17 data points were flagged, which is 25.4% of the total
for Sample No.091d (Figure 3.2, Table 3.4 and 3.5).
Table 3.4 Number of flagged data for Sample No.091d (Small Quantity)
SO42- Cl- NH4
+ Total
Flag E * 1 4 4 9
Flag X * 0 4 4 8
Data within DQOs 21 13 16 50
Ratio of Flagged (%) 4.5 38.1 33.3 25.4
* E : Values exceeding the DQOs by 15%, but not over 30%.
* X : Values exceeding the DQOs by 30%.
49
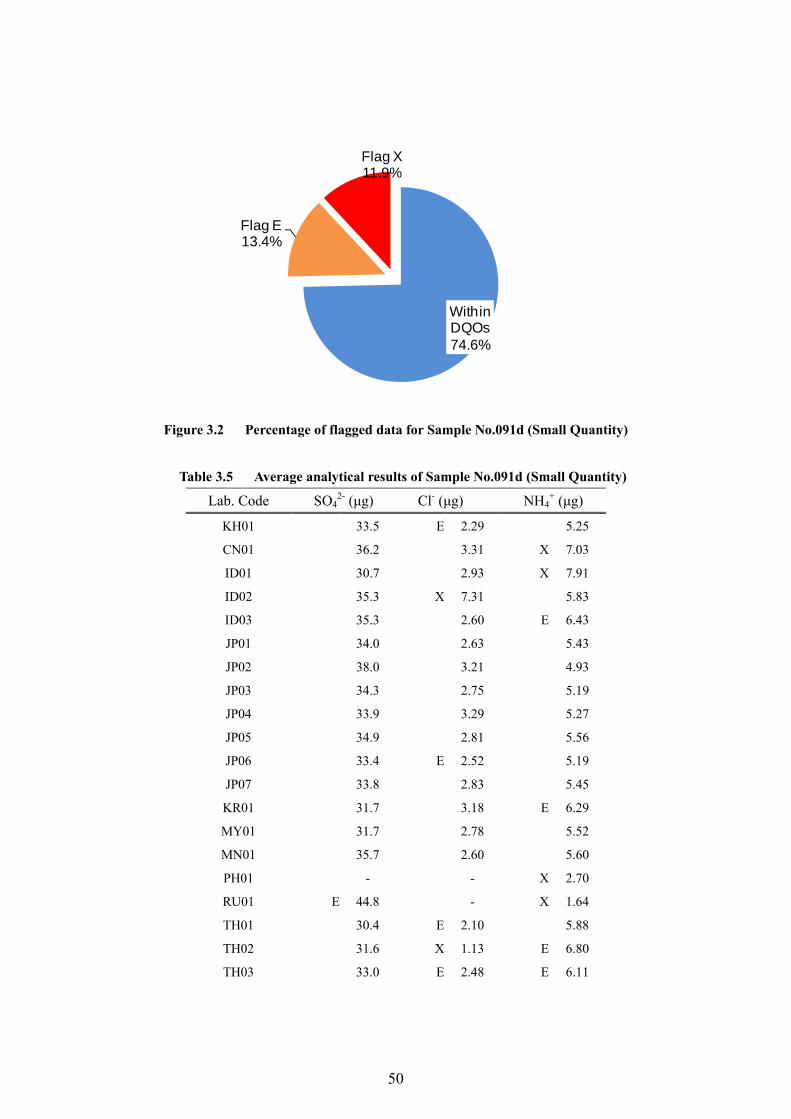
Within DQOs74.6%
Flag E13.4%
Flag X11.9%
Figure 3.2 Percentage of flagged data for Sample No.091d (Small Quantity)
Table 3.5 Average analytical results of Sample No.091d (Small Quantity)
Lab. Code SO42- (μg) Cl- (μg) NH4
+ (μg)
KH01 33.5 E 2.29 5.25
CN01 36.2 3.31 X 7.03
ID01 30.7 2.93 X 7.91
ID02 35.3 X 7.31 5.83
ID03 35.3 2.60 E 6.43
JP01 34.0 2.63 5.43
JP02 38.0 3.21 4.93
JP03 34.3 2.75 5.19
JP04 33.9 3.29 5.27
JP05 34.9 2.81 5.56
JP06 33.4 E 2.52 5.19
JP07 33.8 2.83 5.45
KR01 31.7 3.18 E 6.29
MY01 31.7 2.78 5.52
MN01 35.7 2.60 5.60
PH01 - - X 2.70
RU01 E 44.8 - X 1.64
TH01 30.4 E 2.10 5.88
TH02 31.6 X 1.13 E 6.80
TH03 33.0 E 2.48 E 6.11
50
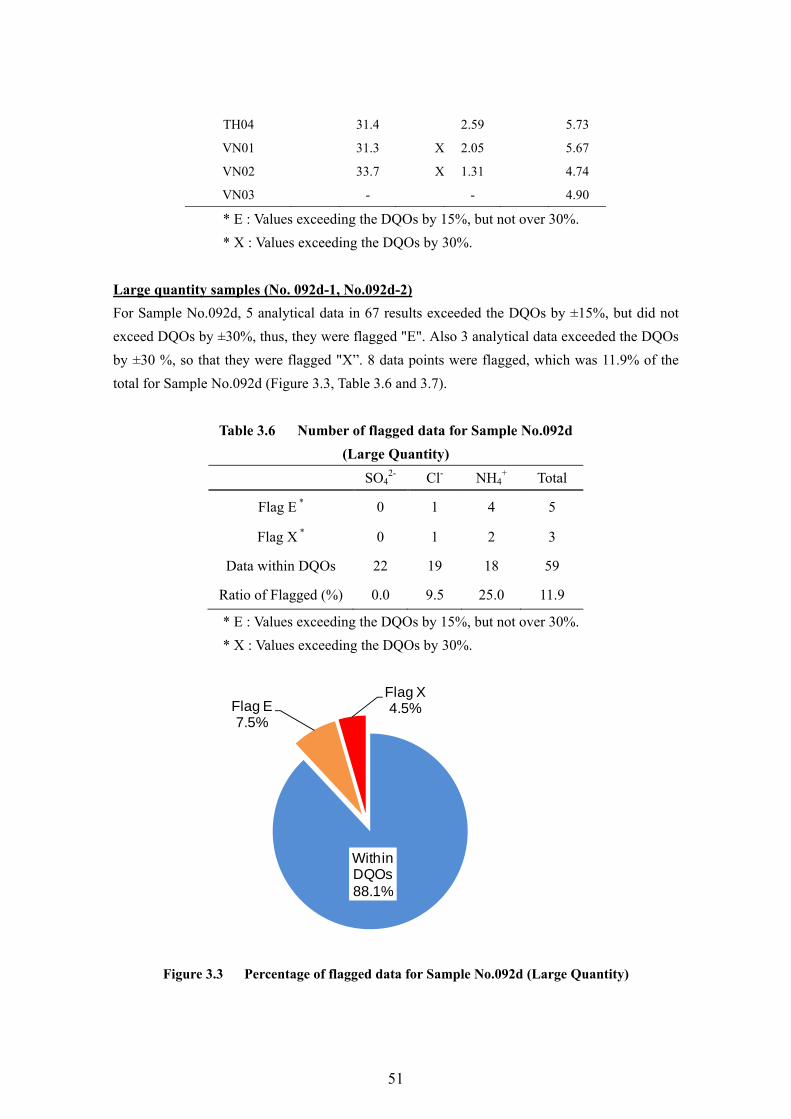
TH04 31.4 2.59 5.73
VN01 31.3 X 2.05 5.67
VN02 33.7 X 1.31 4.74
VN03 - - 4.90
* E : Values exceeding the DQOs by 15%, but not over 30%.
* X : Values exceeding the DQOs by 30%.
Large quantity samples (No. 092d-1, No.092d-2)
For Sample No.092d, 5 analytical data in 67 results exceeded the DQOs by ±15%, but did not
exceed DQOs by ±30%, thus, they were flagged "E". Also 3 analytical data exceeded the DQOs
by ±30 %, so that they were flagged "X”. 8 data points were flagged, which was 11.9% of the
total for Sample No.092d (Figure 3.3, Table 3.6 and 3.7).
Table 3.6 Number of flagged data for Sample No.092d
(Large Quantity)
SO42- Cl- NH4
+ Total
Flag E * 0 1 4 5
Flag X * 0 1 2 3
Data within DQOs 22 19 18 59
Ratio of Flagged (%) 0.0 9.5 25.0 11.9
* E : Values exceeding the DQOs by 15%, but not over 30%.
* X : Values exceeding the DQOs by 30%.
Figure 3.3 Percentage of flagged data for Sample No.092d (Large Quantity)
Within DQOs88.1%
Flag E7.5%
Flag X4.5%
51
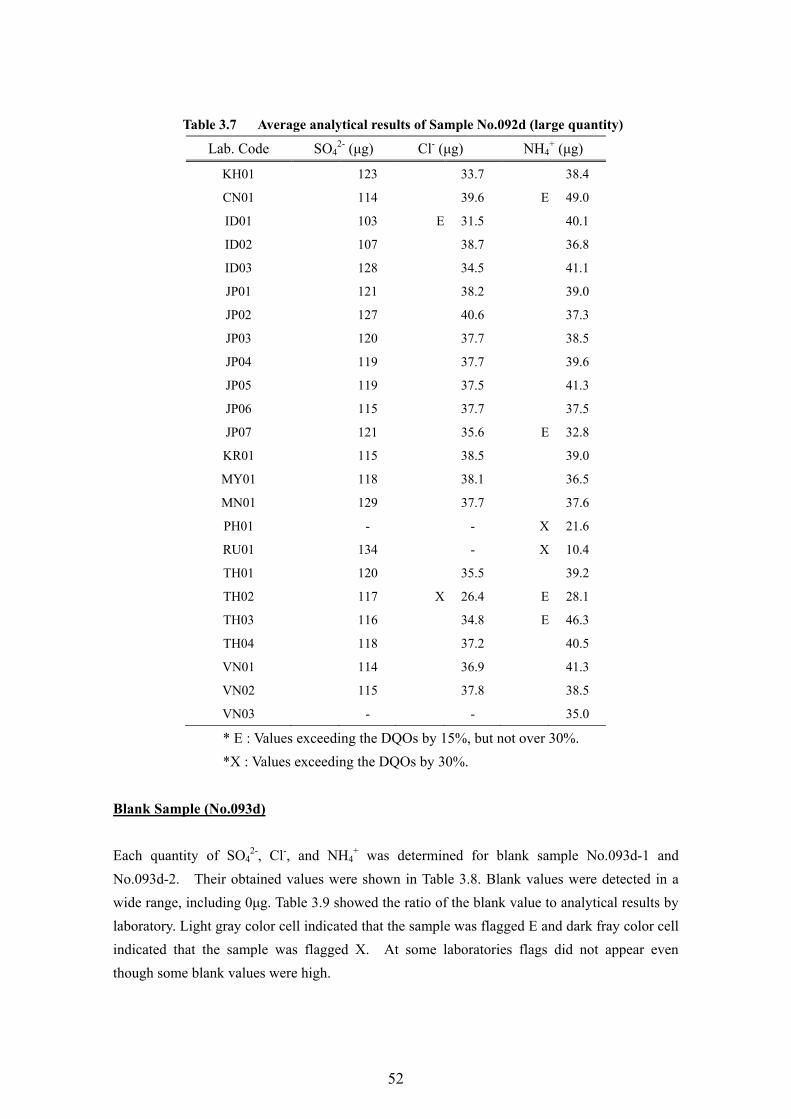
Table 3.7 Average analytical results of Sample No.092d (large quantity)
Lab. Code SO42- (μg) Cl- (μg) NH4
+ (μg)
KH01 123 33.7 38.4
CN01 114 39.6 E 49.0
ID01 103 E 31.5 40.1
ID02 107 38.7 36.8
ID03 128 34.5 41.1
JP01 121 38.2 39.0
JP02 127 40.6 37.3
JP03 120 37.7 38.5
JP04 119 37.7 39.6
JP05 119 37.5 41.3
JP06 115 37.7 37.5
JP07 121 35.6 E 32.8
KR01 115 38.5 39.0
MY01 118 38.1 36.5
MN01 129 37.7 37.6
PH01 - - X 21.6
RU01 134 - X 10.4
TH01 120 35.5 39.2
TH02 117 X 26.4 E 28.1
TH03 116 34.8 E 46.3
TH04 118 37.2 40.5
VN01 114 36.9 41.3
VN02 115 37.8 38.5
VN03 - - 35.0
* E : Values exceeding the DQOs by 15%, but not over 30%.
*X : Values exceeding the DQOs by 30%.
Blank Sample (No.093d)
Each quantity of SO42-, Cl-, and NH4
+ was determined for blank sample No.093d-1 and
No.093d-2. Their obtained values were shown in Table 3.8. Blank values were detected in a
wide range, including 0μg. Table 3.9 showed the ratio of the blank value to analytical results by
laboratory. Light gray color cell indicated that the sample was flagged E and dark fray color cell
indicated that the sample was flagged X. At some laboratories flags did not appear even
though some blank values were high.
52
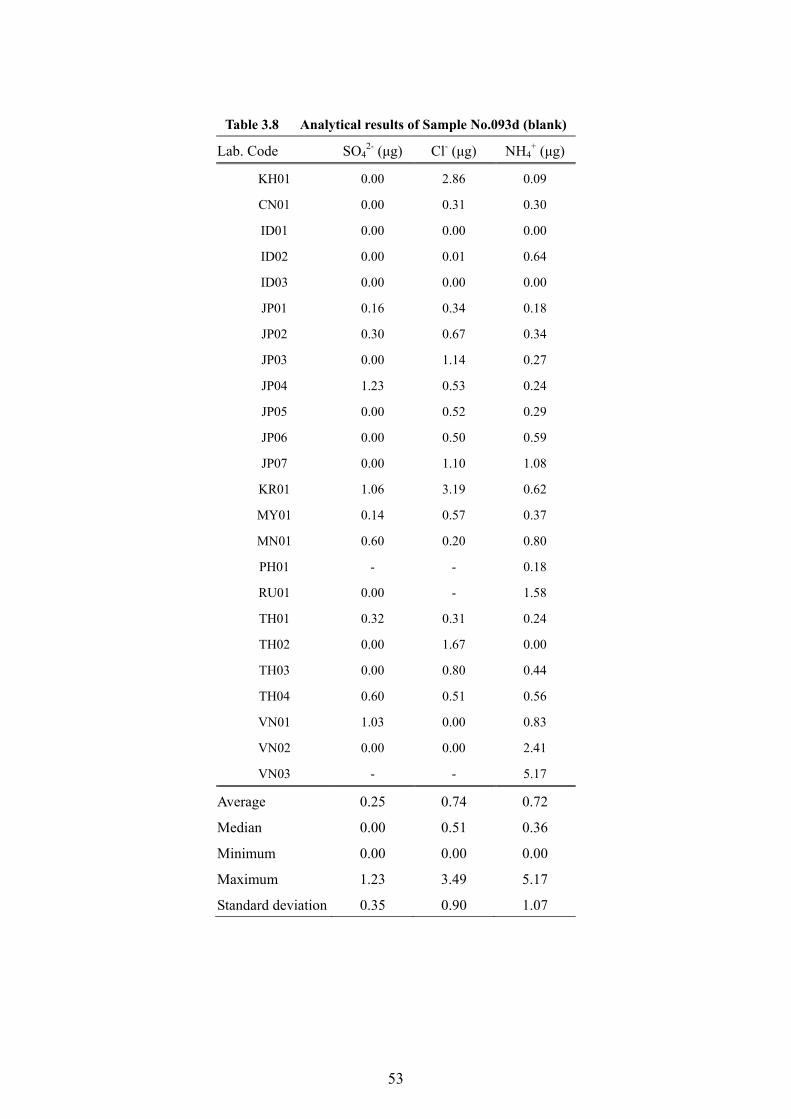
Table 3.8 Analytical results of Sample No.093d (blank)
Lab. Code SO42- (μg) Cl- (μg) NH4
+ (μg)
KH01 0.00 2.86 0.09
CN01 0.00 0.31 0.30
ID01 0.00 0.00 0.00
ID02 0.00 0.01 0.64
ID03 0.00 0.00 0.00
JP01 0.16 0.34 0.18
JP02 0.30 0.67 0.34
JP03 0.00 1.14 0.27
JP04 1.23 0.53 0.24
JP05 0.00 0.52 0.29
JP06 0.00 0.50 0.59
JP07 0.00 1.10 1.08
KR01 1.06 3.19 0.62
MY01 0.14 0.57 0.37
MN01 0.60 0.20 0.80
PH01 - - 0.18
RU01 0.00 - 1.58
TH01 0.32 0.31 0.24
TH02 0.00 1.67 0.00
TH03 0.00 0.80 0.44
TH04 0.60 0.51 0.56
VN01 1.03 0.00 0.83
VN02 0.00 0.00 2.41
VN03 - - 5.17
Average 0.25 0.74 0.72
Median 0.00 0.51 0.36
Minimum 0.00 0.00 0.00
Maximum 1.23 3.49 5.17
Standard deviation 0.35 0.90 1.07
53
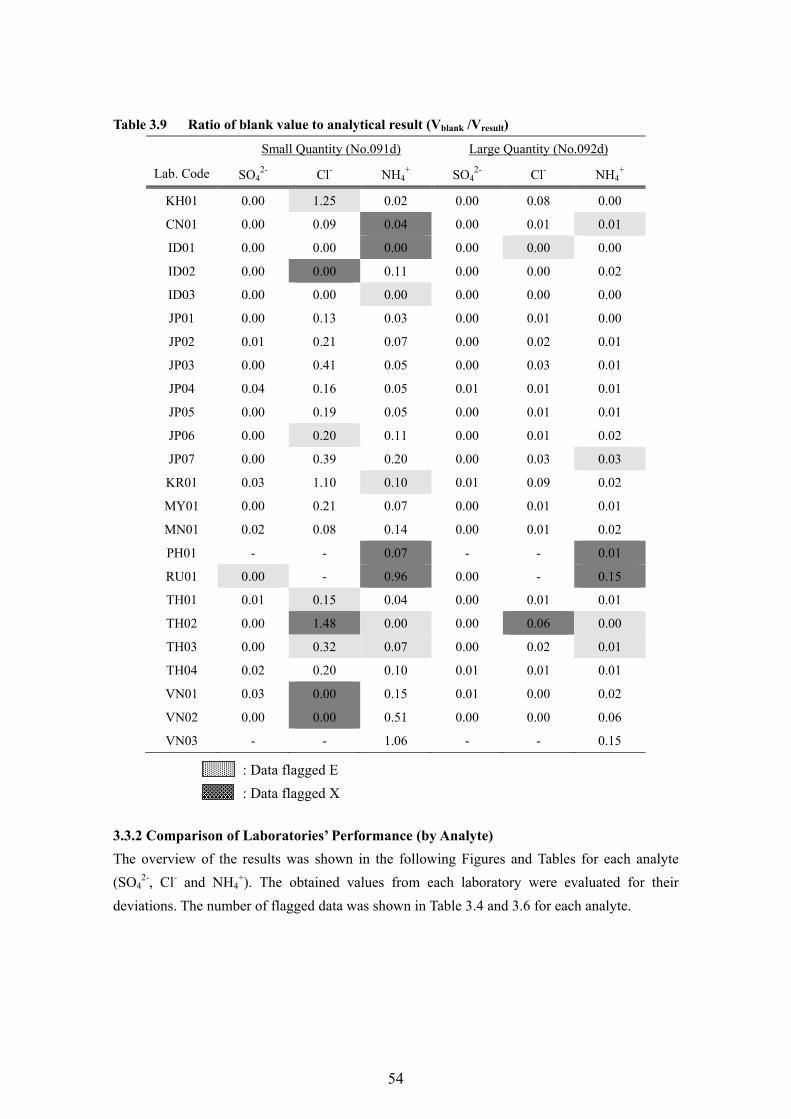
Table 3.9 Ratio of blank value to analytical result (Vblank /Vresult)
Small Quantity (No.091d) Large Quantity (No.092d)
Lab. Code SO42- Cl- NH4
+ SO42- Cl- NH4
+
KH01 0.00 1.25 0.02 0.00 0.08 0.00
CN01 0.00 0.09 0.04 0.00 0.01 0.01
ID01 0.00 0.00 0.00 0.00 0.00 0.00
ID02 0.00 0.00 0.11 0.00 0.00 0.02
ID03 0.00 0.00 0.00 0.00 0.00 0.00
JP01 0.00 0.13 0.03 0.00 0.01 0.00
JP02 0.01 0.21 0.07 0.00 0.02 0.01
JP03 0.00 0.41 0.05 0.00 0.03 0.01
JP04 0.04 0.16 0.05 0.01 0.01 0.01
JP05 0.00 0.19 0.05 0.00 0.01 0.01
JP06 0.00 0.20 0.11 0.00 0.01 0.02
JP07 0.00 0.39 0.20 0.00 0.03 0.03
KR01 0.03 1.10 0.10 0.01 0.09 0.02
MY01 0.00 0.21 0.07 0.00 0.01 0.01
MN01 0.02 0.08 0.14 0.00 0.01 0.02
PH01 - - 0.07 - - 0.01
RU01 0.00 - 0.96 0.00 - 0.15
TH01 0.01 0.15 0.04 0.00 0.01 0.01
TH02 0.00 1.48 0.00 0.00 0.06 0.00
TH03 0.00 0.32 0.07 0.00 0.02 0.01
TH04 0.02 0.20 0.10 0.01 0.01 0.01
VN01 0.03 0.00 0.15 0.01 0.00 0.02
VN02 0.00 0.00 0.51 0.00 0.00 0.06
VN03 - - 1.06 - - 0.15
3.3.2 Comparison of Laboratories’ Performance (by Analyte)
The overview of the results was shown in the following Figures and Tables for each analyte
(SO42-, Cl- and NH4
+). The obtained values from each laboratory were evaluated for their
deviations. The number of flagged data was shown in Table 3.4 and 3.6 for each analyte.
: Data flagged E
: Data flagged X
54
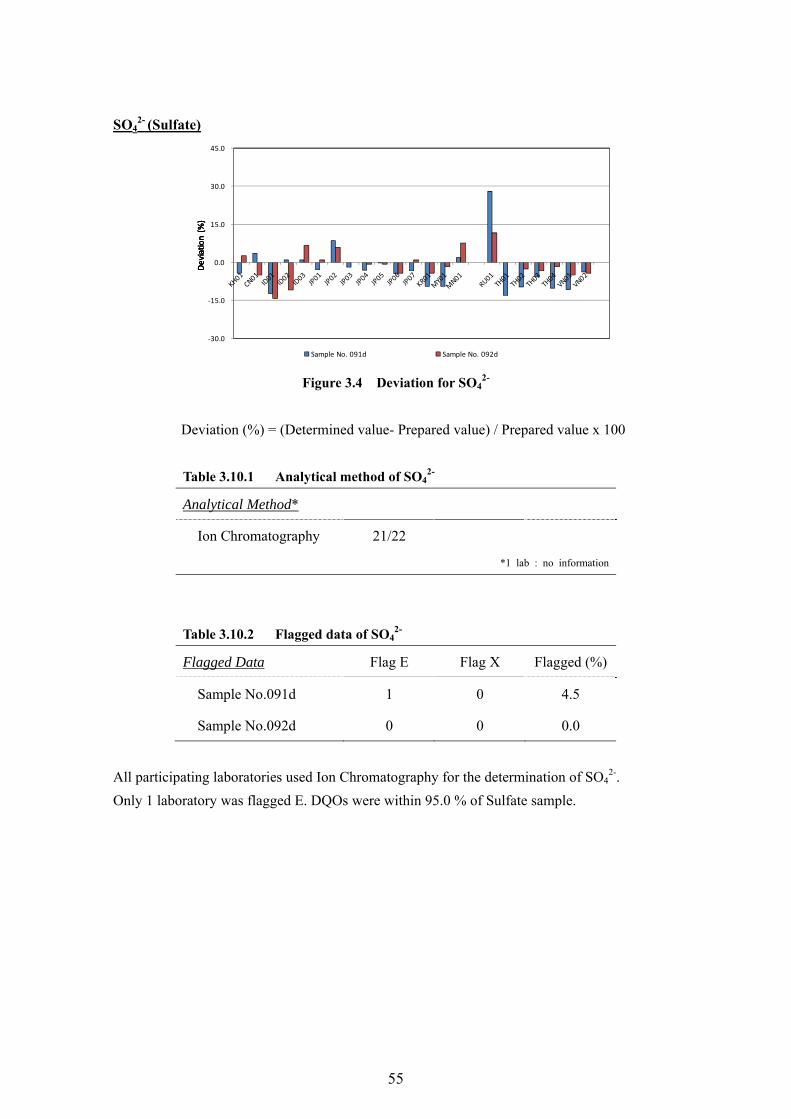
SO42- (Sulfate)
‐30.0
‐15.0
0.0
15.0
30.0
45.0
Sample No. 091d Sample No. 092d
Deviation (%)
Deviation (%)
Deviation (%)
Deviation (%)
Figure 3.4 Deviation for SO42-
Deviation (%) = (Determined value- Prepared value) / Prepared value x 100
Table 3.10.1 Analytical method of SO42-
Analytical Method*
Ion Chromatography 21/22
*1 lab : no information
Table 3.10.2 Flagged data of SO42-
Flagged Data Flag E Flag X Flagged (%)
Sample No.091d 1 0 4.5
Sample No.092d 0 0 0.0
All participating laboratories used Ion Chromatography for the determination of SO42-.
Only 1 laboratory was flagged E. DQOs were within 95.0 % of Sulfate sample.
55
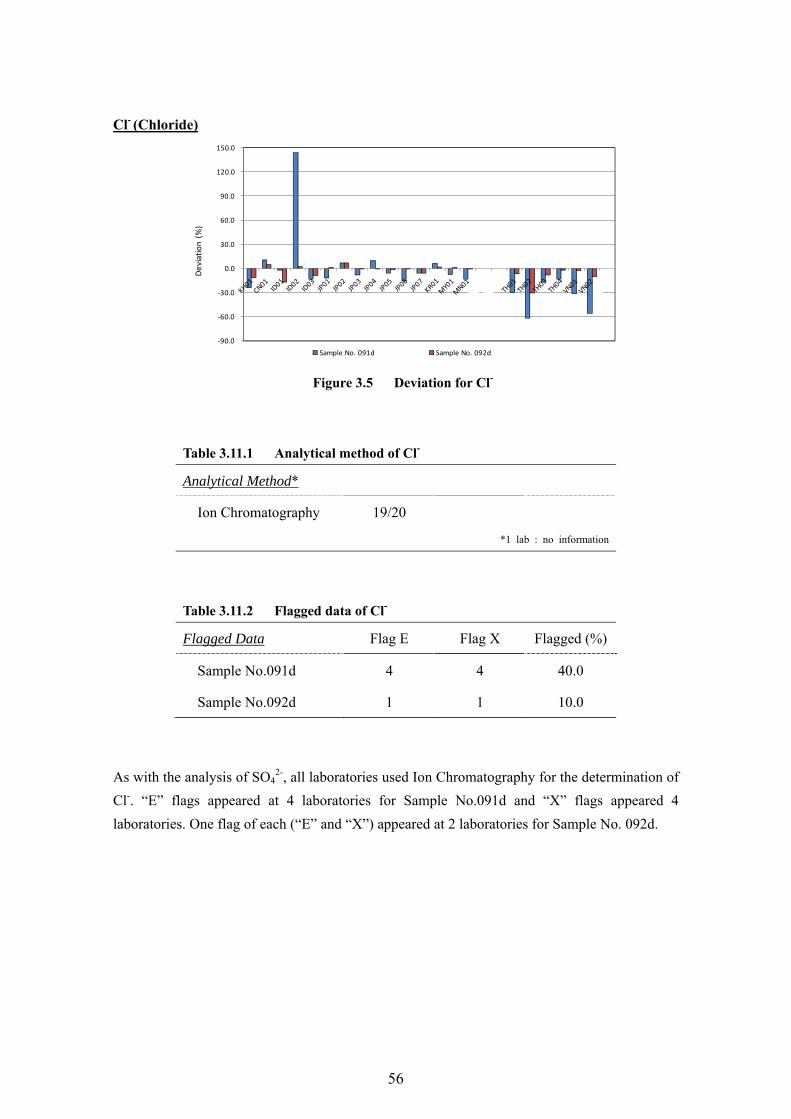
Cl- (Chloride)
‐90.0
‐60.0
‐30.0
0.0
30.0
60.0
90.0
120.0
150.0
Sample No. 091d Sample No. 092d
Deviation(%
)
Figure 3.5 Deviation for Cl-
Table 3.11.1 Analytical method of Cl-
Analytical Method*
Ion Chromatography 19/20
*1 lab : no information
Table 3.11.2 Flagged data of Cl-
Flagged Data Flag E Flag X Flagged (%)
Sample No.091d 4 4 40.0
Sample No.092d 1 1 10.0
As with the analysis of SO42-, all laboratories used Ion Chromatography for the determination of
Cl-. “E” flags appeared at 4 laboratories for Sample No.091d and “X” flags appeared 4
laboratories. One flag of each (“E” and “X”) appeared at 2 laboratories for Sample No. 092d.
56
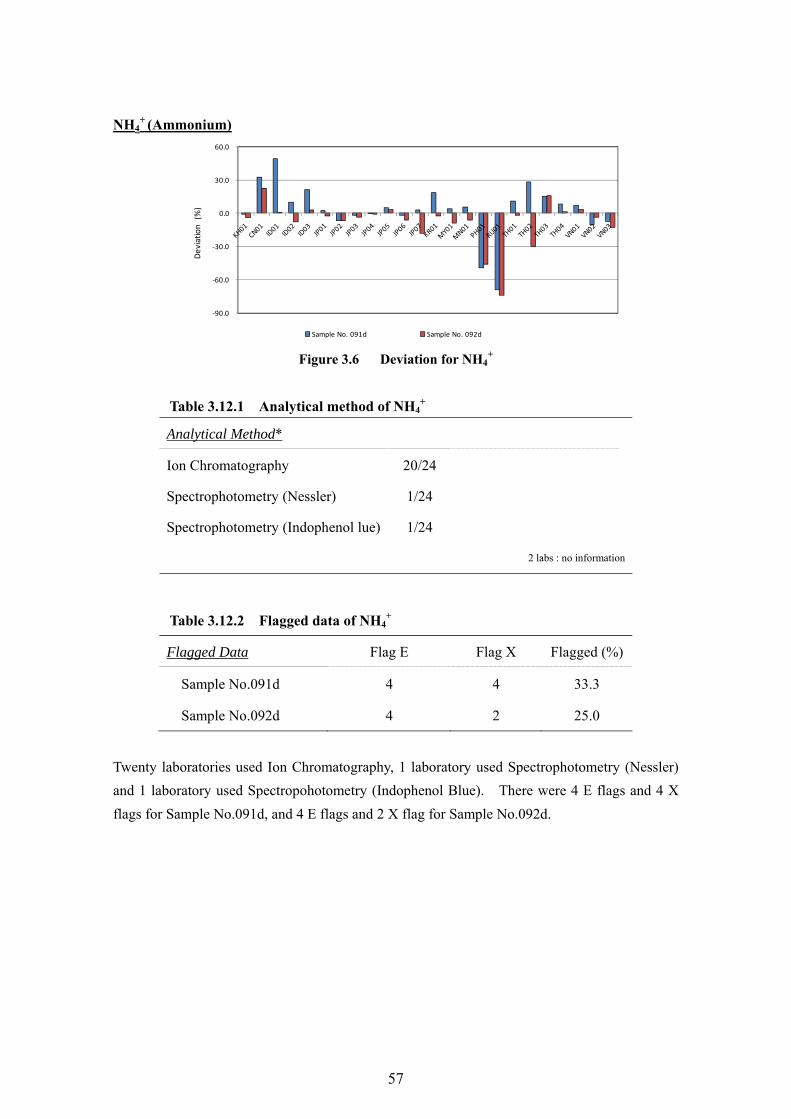
NH4+ (Ammonium)
‐90.0
‐60.0
‐30.0
0.0
30.0
60.0
Sample No. 091d Sample No. 092d
Deviation
(%)
Figure 3.6 Deviation for NH4
+
Table 3.12.1 Analytical method of NH4+
Analytical Method*
Ion Chromatography 20/24
Spectrophotometry (Nessler) 1/24
Spectrophotometry (Indophenol lue) 1/24
2 labs : no information
Table 3.12.2 Flagged data of NH4+
Flagged Data Flag E Flag X Flagged (%)
Sample No.091d 4 4 33.3
Sample No.092d 4 2 25.0
Twenty laboratories used Ion Chromatography, 1 laboratory used Spectrophotometry (Nessler)
and 1 laboratory used Spectropohotometry (Indophenol Blue). There were 4 E flags and 4 X
flags for Sample No.091d, and 4 E flags and 2 X flag for Sample No.092d.
57
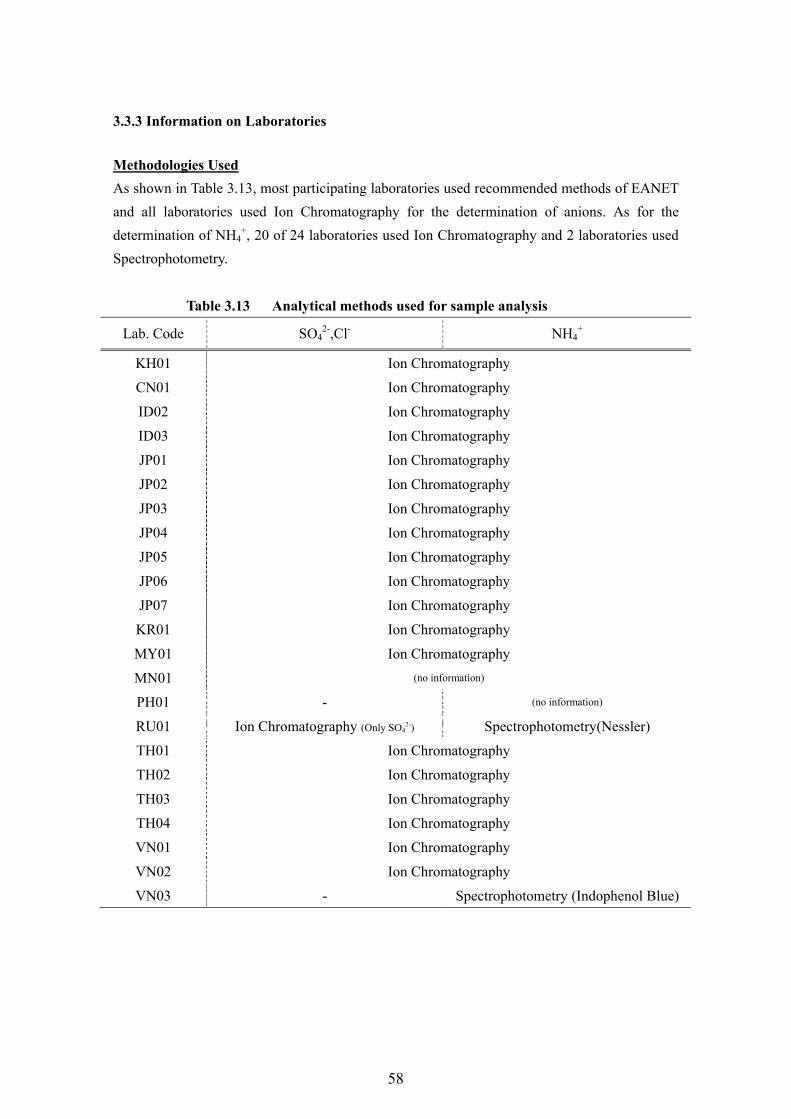
3.3.3 Information on Laboratories
Methodologies Used
As shown in Table 3.13, most participating laboratories used recommended methods of EANET
and all laboratories used Ion Chromatography for the determination of anions. As for the
determination of NH4+, 20 of 24 laboratories used Ion Chromatography and 2 laboratories used
Spectrophotometry.
Table 3.13 Analytical methods used for sample analysis
Lab. Code SO42-,Cl- NH4
+
KH01 Ion Chromatography
CN01 Ion Chromatography
ID02 Ion Chromatography
ID03 Ion Chromatography
JP01 Ion Chromatography
JP02 Ion Chromatography
JP03 Ion Chromatography
JP04 Ion Chromatography
JP05 Ion Chromatography
JP06 Ion Chromatography
JP07 Ion Chromatography
KR01 Ion Chromatography
MY01 Ion Chromatography
MN01 (no information)
PH01 - (no information)
RU01 Ion Chromatography (Only SO42-) Spectrophotometry(Nessler)
TH01 Ion Chromatography
TH02 Ion Chromatography
TH03 Ion Chromatography
TH04 Ion Chromatography
VN01 Ion Chromatography
VN02 Ion Chromatography
VN03 - Spectrophotometry (Indophenol Blue)
58
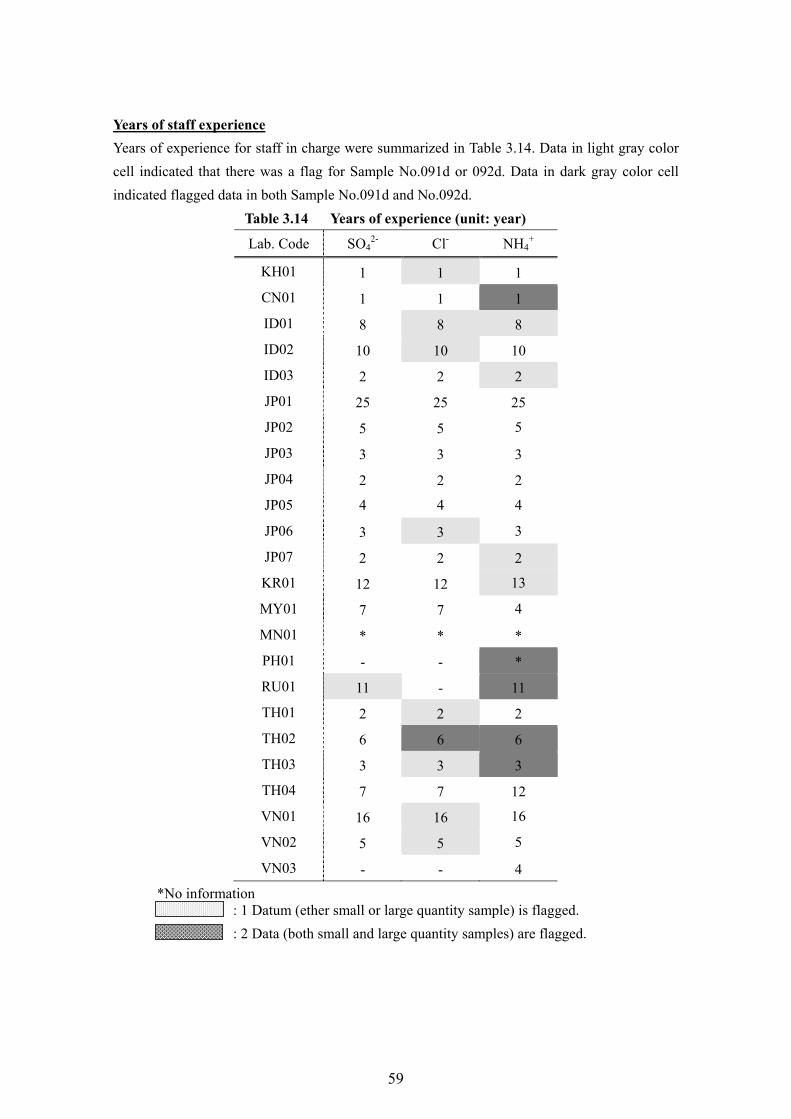
Years of staff experience
Years of experience for staff in charge were summarized in Table 3.14. Data in light gray color
cell indicated that there was a flag for Sample No.091d or 092d. Data in dark gray color cell
indicated flagged data in both Sample No.091d and No.092d.
Table 3.14 Years of experience (unit: year)
Lab. Code SO42- Cl- NH4
+
KH01 1 1 1
CN01 1 1 1
ID01 8 8 8
ID02 10 10 10
ID03 2 2 2
JP01 25 25 25
JP02 5 5 5
JP03 3 3 3
JP04 2 2 2
JP05 4 4 4
JP06 3 3 3
JP07 2 2 2
KR01 12 12 13
MY01 7 7 4
MN01 * * *
PH01 - - *
RU01 11 - 11
TH01 2 2 2
TH02 6 6 6
TH03 3 3 3
TH04 7 7 12
VN01 16 16 16
VN02 5 5 5
VN03 - - 4
*No information
: 1 Datum (ether small or large quantity sample) is flagged.
: 2 Data (both small and large quantity samples) are flagged.
59
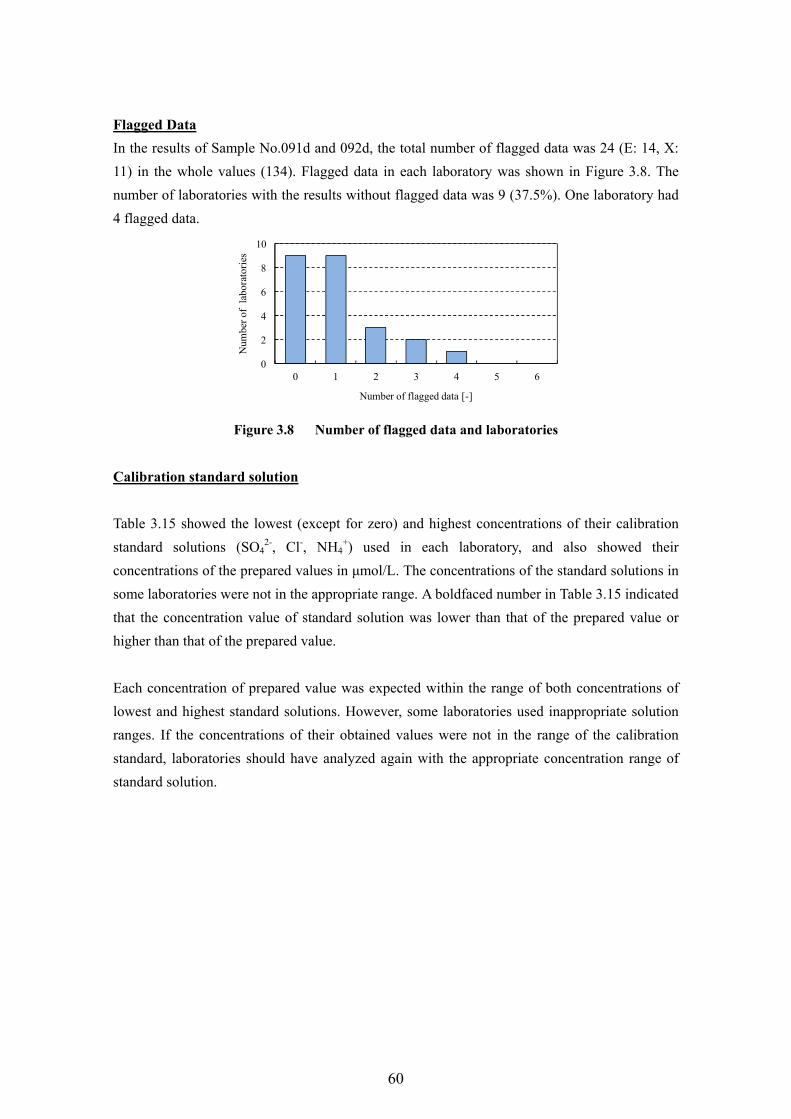
Flagged Data
In the results of Sample No.091d and 092d, the total number of flagged data was 24 (E: 14, X:
11) in the whole values (134). Flagged data in each laboratory was shown in Figure 3.8. The
number of laboratories with the results without flagged data was 9 (37.5%). One laboratory had
4 flagged data.
0
2
4
6
8
10
0 1 2 3 4 5 6
Num
ber
of l
abor
ator
ies
Number of flagged data [-]
Figure 3.8 Number of flagged data and laboratories
Calibration standard solution
Table 3.15 showed the lowest (except for zero) and highest concentrations of their calibration
standard solutions (SO42-, Cl-, NH4
+) used in each laboratory, and also showed their
concentrations of the prepared values in μmol/L. The concentrations of the standard solutions in
some laboratories were not in the appropriate range. A boldfaced number in Table 3.15 indicated
that the concentration value of standard solution was lower than that of the prepared value or
higher than that of the prepared value.
Each concentration of prepared value was expected within the range of both concentrations of
lowest and highest standard solutions. However, some laboratories used inappropriate solution
ranges. If the concentrations of their obtained values were not in the range of the calibration
standard, laboratories should have analyzed again with the appropriate concentration range of
standard solution.
60
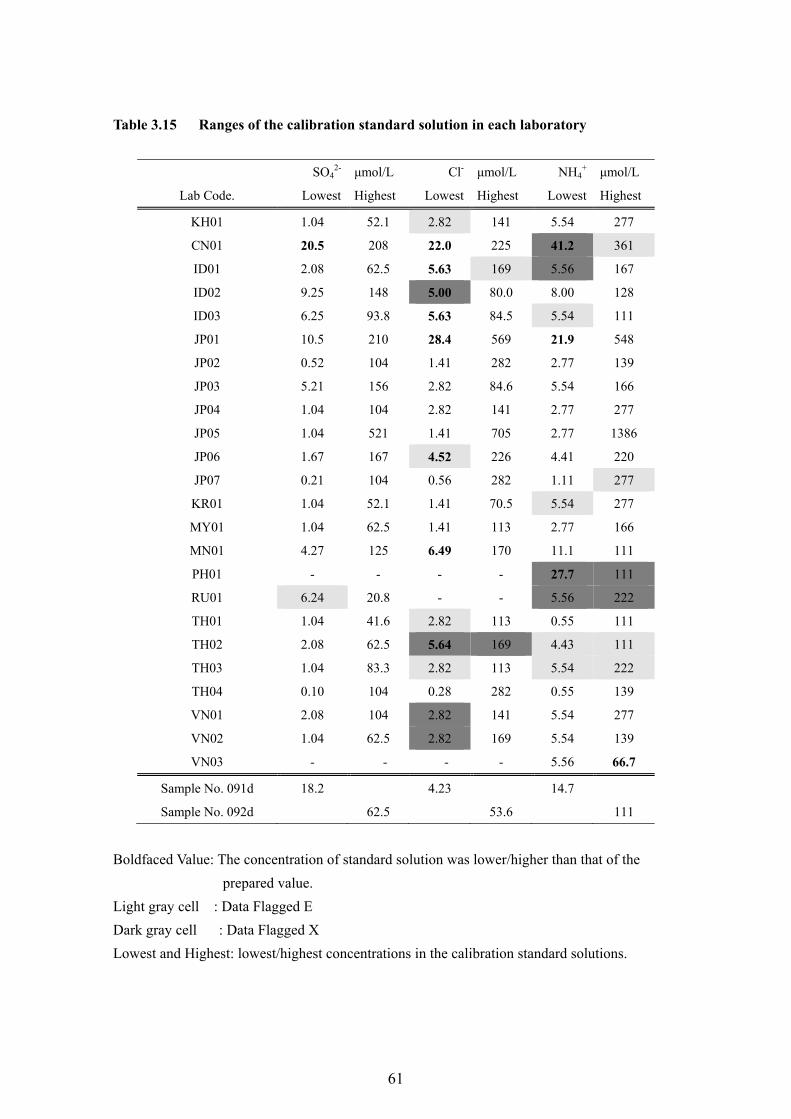
Table 3.15 Ranges of the calibration standard solution in each laboratory
SO42- μmol/L Cl- μmol/L NH4
+ μmol/L
Lab Code. Lowest Highest Lowest Highest Lowest Highest
KH01 1.04 52.1 2.82 141 5.54 277
CN01 20.5 208 22.0 225 41.2 361
ID01 2.08 62.5 5.63 169 5.56 167
ID02 9.25 148 5.00 80.0 8.00 128
ID03 6.25 93.8 5.63 84.5 5.54 111
JP01 10.5 210 28.4 569 21.9 548
JP02 0.52 104 1.41 282 2.77 139
JP03 5.21 156 2.82 84.6 5.54 166
JP04 1.04 104 2.82 141 2.77 277
JP05 1.04 521 1.41 705 2.77 1386
JP06 1.67 167 4.52 226 4.41 220
JP07 0.21 104 0.56 282 1.11 277
KR01 1.04 52.1 1.41 70.5 5.54 277
MY01 1.04 62.5 1.41 113 2.77 166
MN01 4.27 125 6.49 170 11.1 111
PH01 - - - - 27.7 111
RU01 6.24 20.8 - - 5.56 222
TH01 1.04 41.6 2.82 113 0.55 111
TH02 2.08 62.5 5.64 169 4.43 111
TH03 1.04 83.3 2.82 113 5.54 222
TH04 0.10 104 0.28 282 0.55 139
VN01 2.08 104 2.82 141 5.54 277
VN02 1.04 62.5 2.82 169 5.54 139
VN03 - - - - 5.56 66.7
Sample No. 091d 18.2 4.23 14.7
Sample No. 092d 62.5 53.6 111
Boldfaced Value: The concentration of standard solution was lower/higher than that of the
prepared value.
Light gray cell : Data Flagged E
Dark gray cell : Data Flagged X
Lowest and Highest: lowest/highest concentrations in the calibration standard solutions.
61
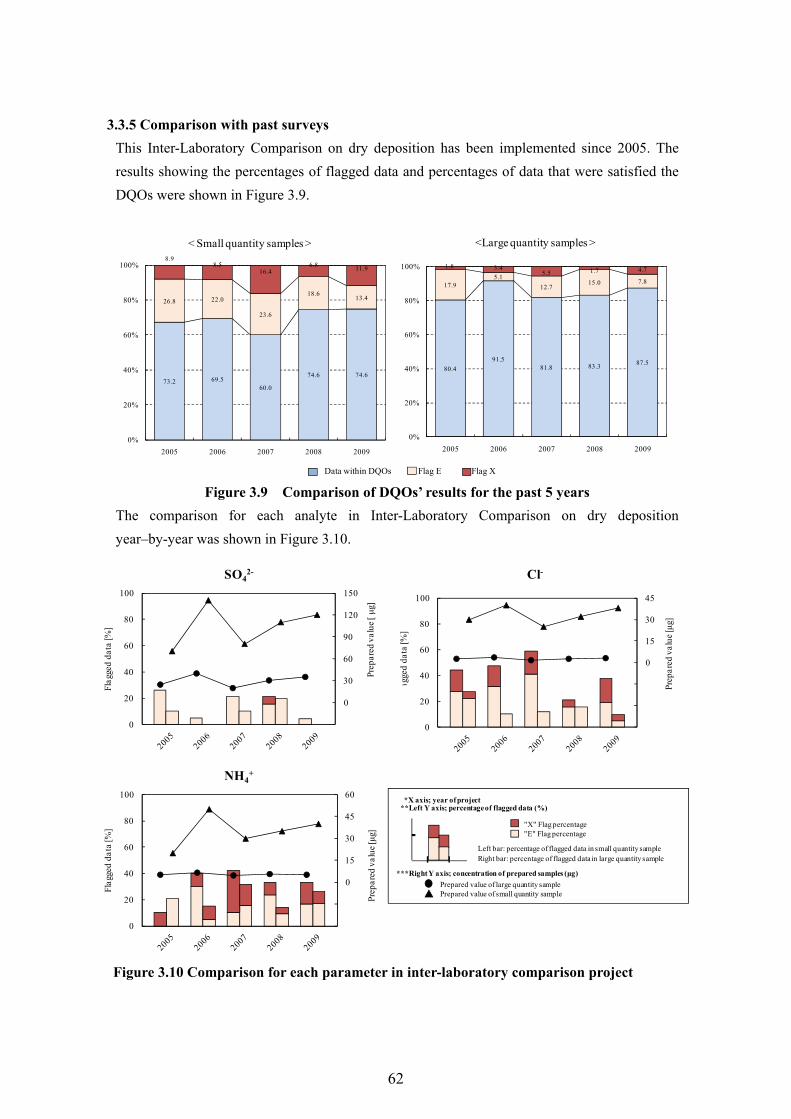
"X" Flag percentage
Prepared value of large quantity sample
Left bar: percentage of flagged data in small quantity sampleRight bar: percentage of flagged data in large quantity sample
**Left Y axis; percentage of flagged data (%)*X axis; year of project
***Right Y axis; concentration of prepared samples (μg)
Prepared value of small quantity sample
"E" Flag percentage
-45
-30
-15
0
15
30
45
0
20
40
60
80
100
Prep
ared
val
ue [μ
g]
Flag
ged
data
[%]
Cl-
-30
-15
0
15
30
45
60
0
20
40
60
80
100
Prep
ared
val
ue [μ
g]
Flag
ged
data
[%]
NH4+
-30
0
30
60
90
120
150
0
20
40
60
80
100
Prep
ared
val
ue [ μg
]
Flag
ged
data
[%]
SO42-
3.3.5 Comparison with past surveys
This Inter-Laboratory Comparison on dry deposition has been implemented since 2005. The
results showing the percentages of flagged data and percentages of data that were satisfied the
DQOs were shown in Figure 3.9.
Figure 3.9 Comparison of DQOs’ results for the past 5 years
The comparison for each analyte in Inter-Laboratory Comparison on dry deposition
year–by-year was shown in Figure 3.10.
Figure 3.10 Comparison for each parameter in inter-laboratory comparison project
73.2 69.5 60.0
74.6 74.6
26.8 22.0
23.6
18.6 13.4
8.9 8.5
16.4 6.8
11.9
0%
20%
40%
60%
80%
100%
2005 2006 2007 2008 2009
< Small quantity samples >
80.4
91.5 81.8 83.3 87.5
17.9 5.1
12.7 15.0 7.8
1.8 3.4 5.5 1.7 4.7
0%
20%
40%
60%
80%
100%
2005 2006 2007 2008 2009
<Large quantity samples >
Data within DQOs Flag E Flag X
62
References
1) The Second Interim Scientific Advisory Group Meeting of Acid Deposition Monitoring
Network in East Asia. 2000. Guidelines for Acid Deposition Monitoring in East Asia.
Network Center for EANET. Acid Deposition and Oxidant Research Center, Niigata, Japan.
2) The Second Interim Scientific Advisory Group Meeting of Acid Deposition Monitoring
Network in East Asia. 2000. Technical Documents for Wet Deposition Monitoring in East
Asia. Network Center for EANET. Acid Deposition and Oxidant Research Center. Niigata,
Japan.
3) The Third Session of the Scientific Advisory Committee (SAC3). 2003. Technical
Documents for Filter Pack Method in East Asia. Network Center for EANET. Acid
Deposition and Oxidant Research Center, Niigata, Japan.
63
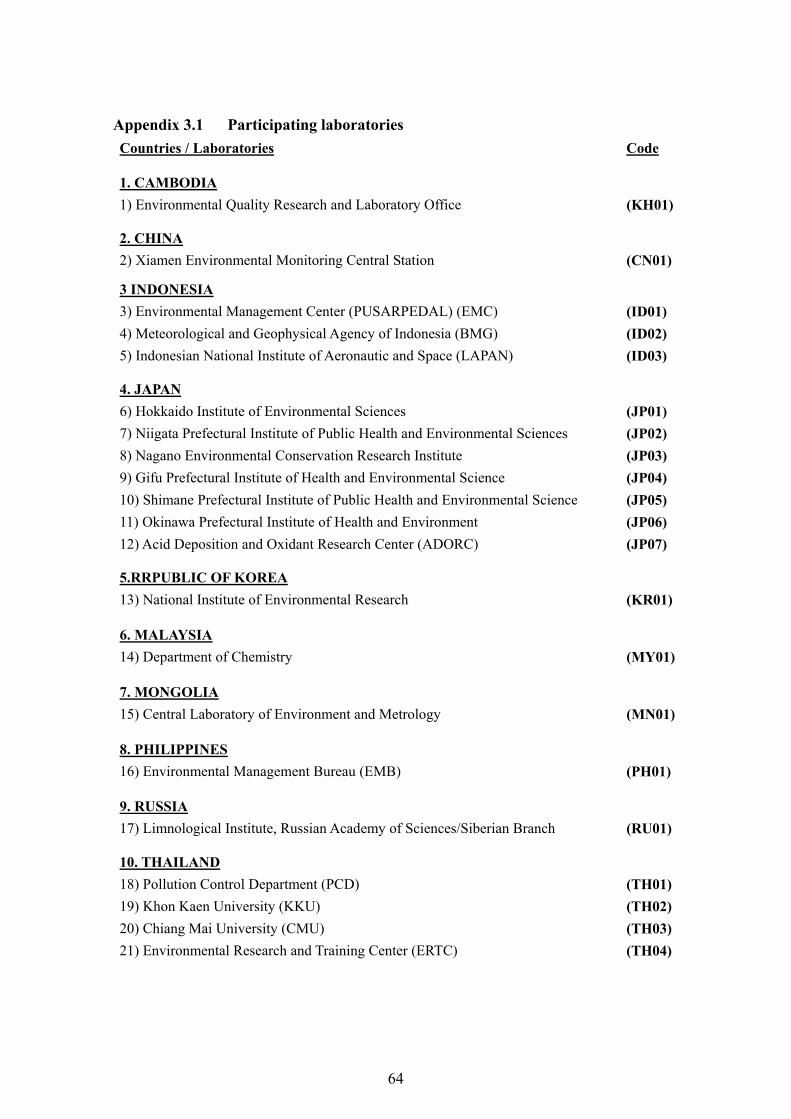
Appendix 3.1 Participating laboratories
Countries / Laboratories Code
1. CAMBODIA
1) Environmental Quality Research and Laboratory Office (KH01)
2. CHINA
2) Xiamen Environmental Monitoring Central Station (CN01)
3 INDONESIA
3) Environmental Management Center (PUSARPEDAL) (EMC) (ID01)
4) Meteorological and Geophysical Agency of Indonesia (BMG) (ID02)
5) Indonesian National Institute of Aeronautic and Space (LAPAN) (ID03)
4. JAPAN
6) Hokkaido Institute of Environmental Sciences (JP01)
7) Niigata Prefectural Institute of Public Health and Environmental Sciences (JP02)
8) Nagano Environmental Conservation Research Institute (JP03)
9) Gifu Prefectural Institute of Health and Environmental Science (JP04)
10) Shimane Prefectural Institute of Public Health and Environmental Science (JP05)
11) Okinawa Prefectural Institute of Health and Environment (JP06)
12) Acid Deposition and Oxidant Research Center (ADORC) (JP07)
5.RRPUBLIC OF KOREA
13) National Institute of Environmental Research (KR01)
6. MALAYSIA
14) Department of Chemistry (MY01)
7. MONGOLIA
15) Central Laboratory of Environment and Metrology (MN01)
8. PHILIPPINES
16) Environmental Management Bureau (EMB) (PH01)
9. RUSSIA
17) Limnological Institute, Russian Academy of Sciences/Siberian Branch (RU01)
10. THAILAND
18) Pollution Control Department (PCD) (TH01)
19) Khon Kaen University (KKU) (TH02)
20) Chiang Mai University (CMU) (TH03)
21) Environmental Research and Training Center (ERTC) (TH04)
64
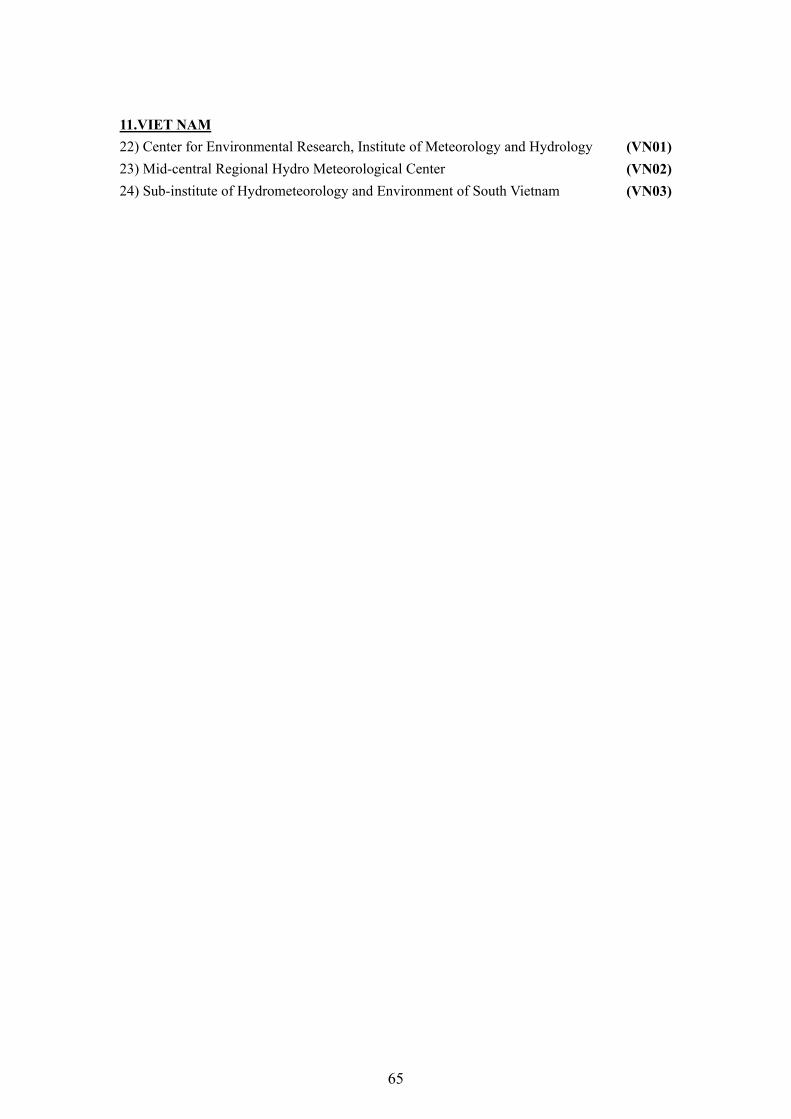
11.VIET NAM
22) Center for Environmental Research, Institute of Meteorology and Hydrology (VN01)
23) Mid-central Regional Hydro Meteorological Center (VN02)
24) Sub-institute of Hydrometeorology and Environment of South Vietnam (VN03)
65
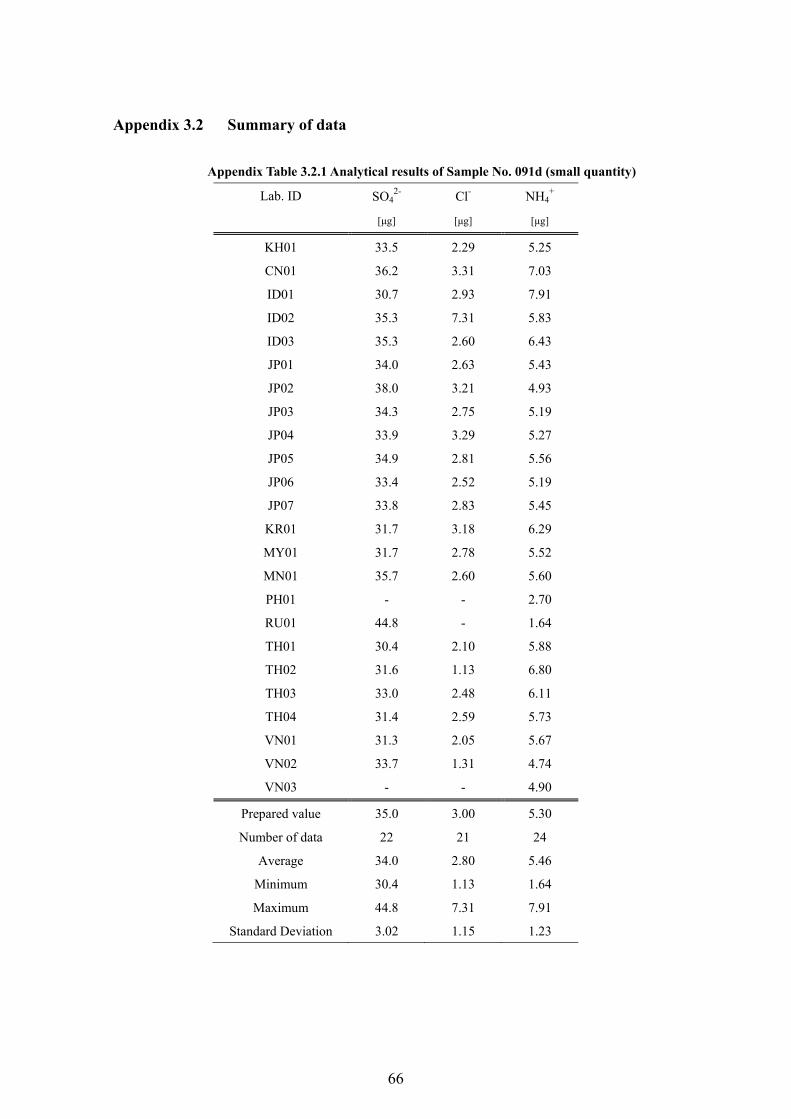
Appendix 3.2 Summary of data
Appendix Table 3.2.1 Analytical results of Sample No. 091d (small quantity)
Lab. ID SO42- Cl- NH4
+
[μg] [μg] [μg]
KH01 33.5 2.29 5.25
CN01 36.2 3.31 7.03
ID01 30.7 2.93 7.91
ID02 35.3 7.31 5.83
ID03 35.3 2.60 6.43
JP01 34.0 2.63 5.43
JP02 38.0 3.21 4.93
JP03 34.3 2.75 5.19
JP04 33.9 3.29 5.27
JP05 34.9 2.81 5.56
JP06 33.4 2.52 5.19
JP07 33.8 2.83 5.45
KR01 31.7 3.18 6.29
MY01 31.7 2.78 5.52
MN01 35.7 2.60 5.60
PH01 - - 2.70
RU01 44.8 - 1.64
TH01 30.4 2.10 5.88
TH02 31.6 1.13 6.80
TH03 33.0 2.48 6.11
TH04 31.4 2.59 5.73
VN01 31.3 2.05 5.67
VN02 33.7 1.31 4.74
VN03 - - 4.90
Prepared value 35.0 3.00 5.30
Number of data 22 21 24
Average 34.0 2.80 5.46
Minimum 30.4 1.13 1.64
Maximum 44.8 7.31 7.91
Standard Deviation 3.02 1.15 1.23
66
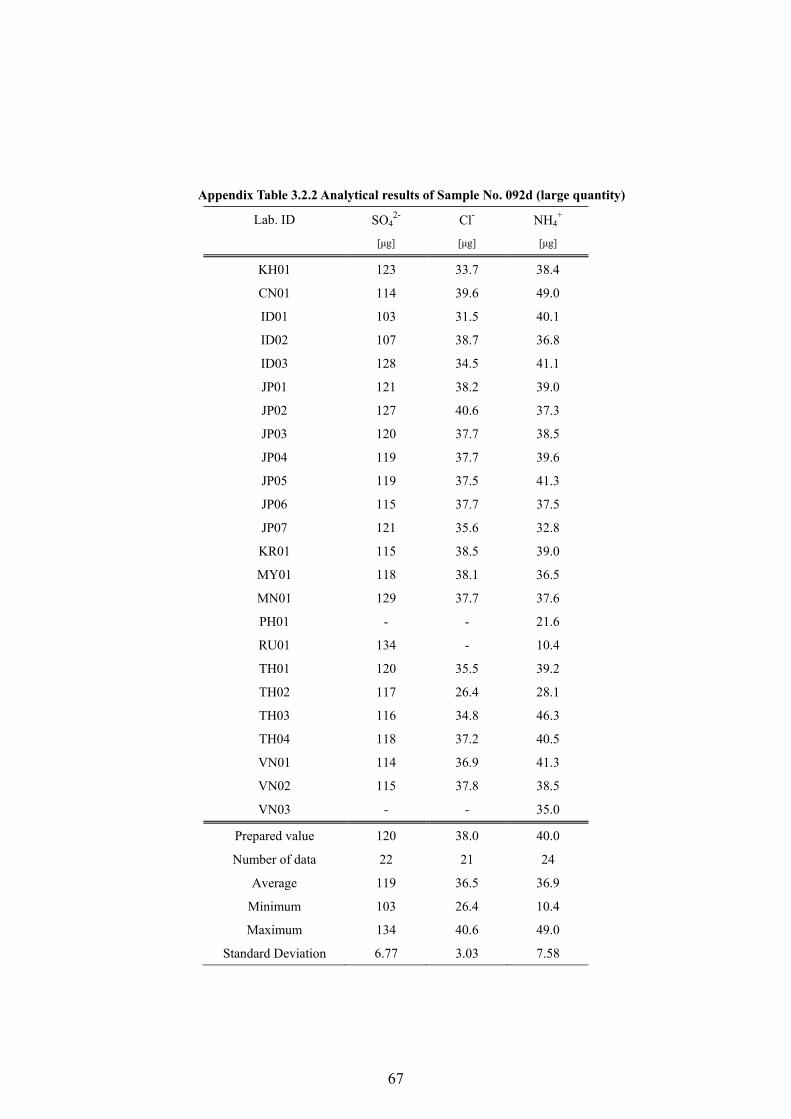
Appendix Table 3.2.2 Analytical results of Sample No. 092d (large quantity)
Lab. ID SO42- Cl- NH4
+
[μg] [μg] [μg]
KH01 123 33.7 38.4
CN01 114 39.6 49.0
ID01 103 31.5 40.1
ID02 107 38.7 36.8
ID03 128 34.5 41.1
JP01 121 38.2 39.0
JP02 127 40.6 37.3
JP03 120 37.7 38.5
JP04 119 37.7 39.6
JP05 119 37.5 41.3
JP06 115 37.7 37.5
JP07 121 35.6 32.8
KR01 115 38.5 39.0
MY01 118 38.1 36.5
MN01 129 37.7 37.6
PH01 - - 21.6
RU01 134 - 10.4
TH01 120 35.5 39.2
TH02 117 26.4 28.1
TH03 116 34.8 46.3
TH04 118 37.2 40.5
VN01 114 36.9 41.3
VN02 115 37.8 38.5
VN03 - - 35.0
Prepared value 120 38.0 40.0
Number of data 22 21 24
Average 119 36.5 36.9
Minimum 103 26.4 10.4
Maximum 134 40.6 49.0
Standard Deviation 6.77 3.03 7.58
67
Appendix 3.3 Z-score evaluation
The NC applied Z-score for further statistical evaluation of the analytical values in the
inter-laboratory comparison on dry deposition.
Definition of Z-score
Z-score is one of the statistical measures that quantify the distance from the mean of a data set.
The formula for the calculation of Z-score (Robust method) was shown below:
where X: Measurement values of samples
Q1: The 1st quartile value of entire data
Q2: The 2nd quartile value of entire data (i.e. Median)
Q3: The 3rd quartile value of entire data
Evaluation of calculated Z-score
Z-score was given to each data submitted by the participating laboratories, and was evaluated as
follows:
|Z| ≤ 2 : Satisfactory
2 < |Z| < 3 : Questionable3 ≤ |Z| : Unsatisfactory
The calculated Z-scores were shown in Appendix Table 3.3.1 and were also graphed in
Appendix Figure 3.3.1 through 3.3.3.
Z = 0.7413 x (Q3 – Q1)
X – Q2
68
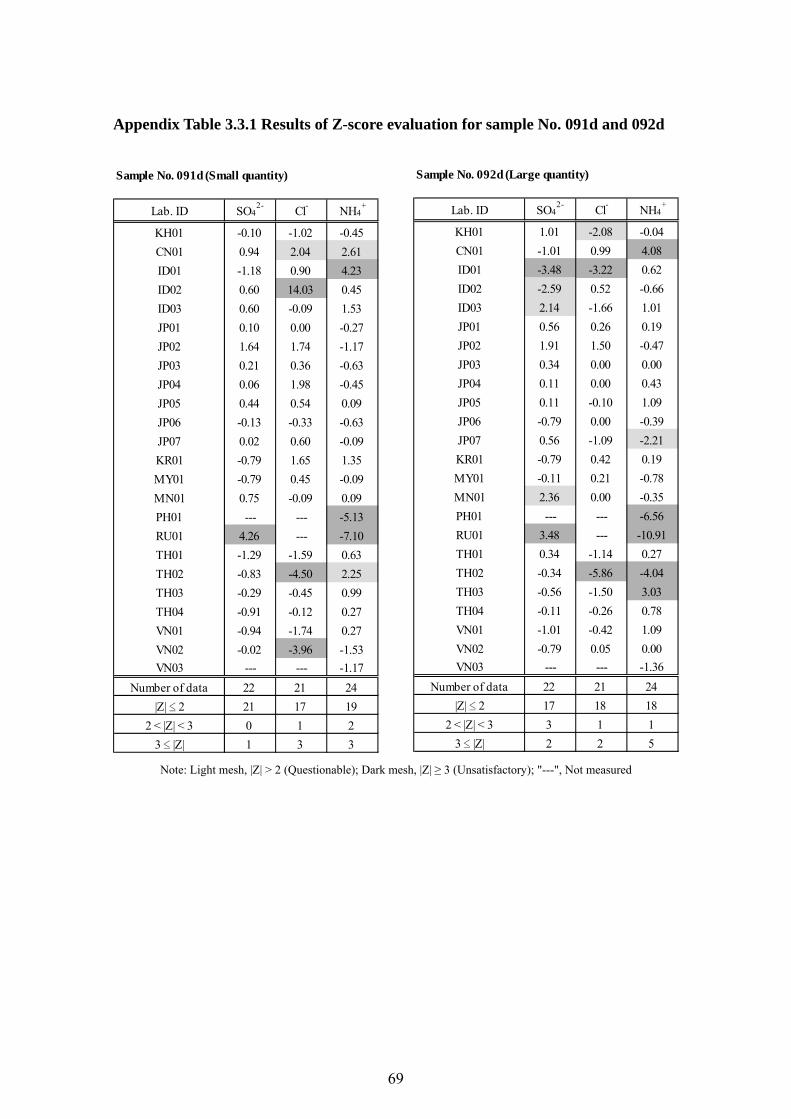
Appendix Table 3.3.1 Results of Z-score evaluation for sample No. 091d and 092d
Note: Light mesh, |Z| > 2 (Questionable); Dark mesh, |Z| ≥ 3 (Unsatisfactory); "---", Not measured
Sample No. 092d (Large quantity)
Lab. ID SO42-
Cl-
NH4+
KH01 1.01 -2.08 -0.04
CN01 -1.01 0.99 4.08
ID01 -3.48 -3.22 0.62
ID02 -2.59 0.52 -0.66
ID03 2.14 -1.66 1.01
JP01 0.56 0.26 0.19
JP02 1.91 1.50 -0.47
JP03 0.34 0.00 0.00
JP04 0.11 0.00 0.43
JP05 0.11 -0.10 1.09
JP06 -0.79 0.00 -0.39
JP07 0.56 -1.09 -2.21
KR01 -0.79 0.42 0.19
MY01 -0.11 0.21 -0.78
MN01 2.36 0.00 -0.35
PH01 --- --- -6.56
RU01 3.48 --- -10.91
TH01 0.34 -1.14 0.27
TH02 -0.34 -5.86 -4.04
TH03 -0.56 -1.50 3.03
TH04 -0.11 -0.26 0.78
VN01 -1.01 -0.42 1.09
VN02 -0.79 0.05 0.00
VN03 --- --- -1.36
Number of data 22 21 24
|Z| ≤ 2 17 18 18
2 < |Z| < 3 3 1 1
3 ≤ |Z| 2 2 5
Sample No. 091d (Small quantity)
Lab. ID SO42-
Cl-
NH4+
KH01 -0.10 -1.02 -0.45
CN01 0.94 2.04 2.61
ID01 -1.18 0.90 4.23
ID02 0.60 14.03 0.45
ID03 0.60 -0.09 1.53
JP01 0.10 0.00 -0.27
JP02 1.64 1.74 -1.17
JP03 0.21 0.36 -0.63
JP04 0.06 1.98 -0.45
JP05 0.44 0.54 0.09
JP06 -0.13 -0.33 -0.63
JP07 0.02 0.60 -0.09
KR01 -0.79 1.65 1.35
MY01 -0.79 0.45 -0.09
MN01 0.75 -0.09 0.09
PH01 --- --- -5.13
RU01 4.26 --- -7.10
TH01 -1.29 -1.59 0.63
TH02 -0.83 -4.50 2.25
TH03 -0.29 -0.45 0.99
TH04 -0.91 -0.12 0.27
VN01 -0.94 -1.74 0.27
VN02 -0.02 -3.96 -1.53
VN03 --- --- -1.17
Number of data 22 21 24
|Z| ≤ 2 21 17 19
2 < |Z| < 3 0 1 2
3 ≤ |Z| 1 3 3
69
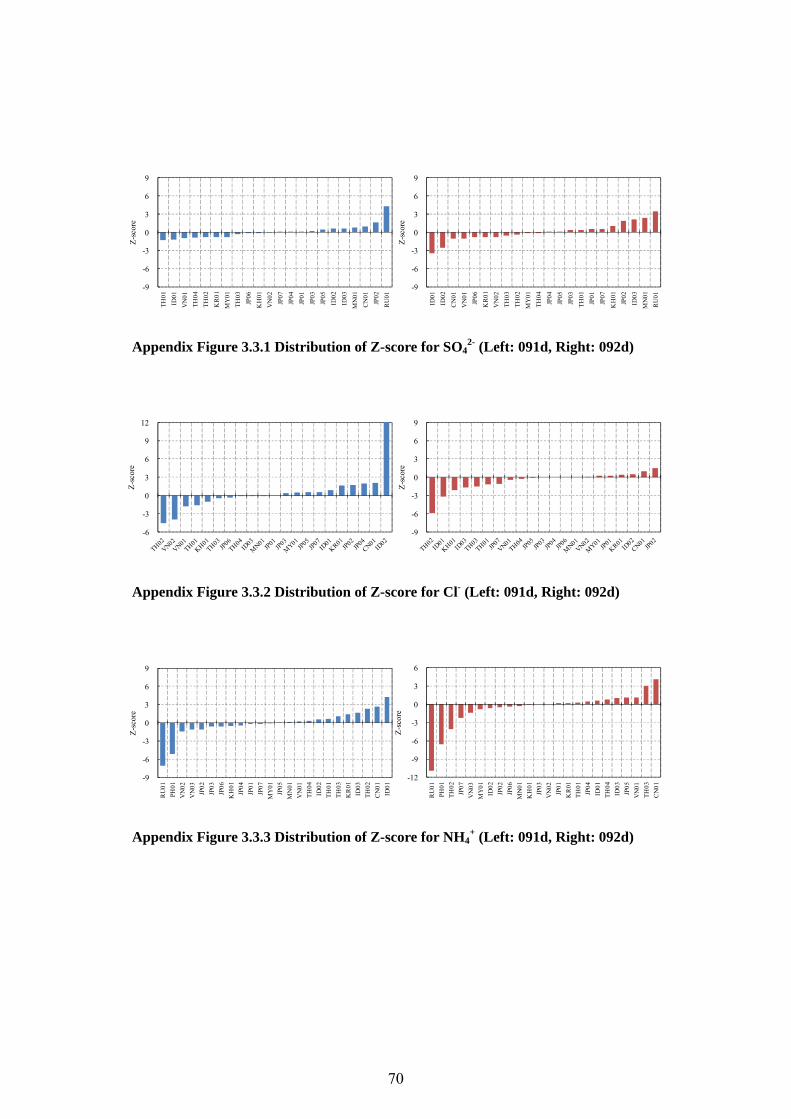
-9
-6
-3
0
3
6
9
TH
01
ID01
VN
01
TH
04
TH
02
KR
01
MY
01
TH
03
JP06
KH
01
VN
02
JP07
JP04
JP01
JP03
JP05
ID02
ID03
MN
01
CN
01
JP02
RU
01
Z-s
core
-9
-6
-3
0
3
6
9
ID01
ID02
CN
01
VN
01
JP06
KR
01
VN
02
TH
03
TH
02
MY
01
TH
04
JP04
JP05
JP03
TH
01
JP01
JP07
KH
01
JP02
ID03
MN
01
RU
01
Z-s
core
Appendix Figure 3.3.1 Distribution of Z-score for SO42- (Left: 091d, Right: 092d)
-6
-3
0
3
6
9
12
Z-s
core
-9
-6
-3
0
3
6
9
Z-s
core
Appendix Figure 3.3.2 Distribution of Z-score for Cl- (Left: 091d, Right: 092d)
-9
-6
-3
0
3
6
9
RU
01
PH01
VN
02
VN
03
JP02
JP03
JP06
KH
01
JP04
JP01
JP07
MY
01
JP05
MN
01
VN
01
TH
04
ID02
TH
01
TH
03
KR
01
ID03
TH
02
CN
01
ID01
Z-s
core
-12
-9
-6
-3
0
3
6
RU
01
PH01
TH
02
JP07
VN
03
MY
01
ID02
JP02
JP06
MN
01
KH
01
JP03
VN
02
JP01
KR
01
TH
01
JP04
ID01
TH
04
ID03
JP05
VN
01
TH
03
CN
01
Z-s
core
Appendix Figure 3.3.3 Distribution of Z-score for NH4+ (Left: 091d, Right: 092d)
70
4. 11th INTER-LABORATORY COMPARISON PROJECT ON SOIL
4.1 Introduction
The Inter-laboratory comparison project on soil analysis started in 1999 as the activities within the QA/QC
program on Soil and Vegetation Monitoring. The inter-laboratory precision should be clarified as well as
the within-laboratory and repeatability precisions in the project to improve the analytical quality of the
EANET laboratories. Factors of precision have been discussed through the previous projects.
Soil analysis has complicated procedures and steps in comparison with environment water. Steps in the
procedures of soil analysis may be related to the variation among laboratories; e.g. extraction,
instrumental analysis and/or titration. Results of the first three projects from 1999 to 2001 suggested
that instrumental analysis have relatively large effect on the total precision of soil analysis, and the
following analytical conditions could affect results:
Addition of La or Sr solution for AAS analysis of Ex-Ca
Preparation method of standard solution
Instrument for Ex-K and Na analysis
The participating laboratories shared the information on these possible factors to improve the
precisions.
Other possible factors, such as level of the concentrations, were suggested in the previous projects.
Further investigation should be considered taking concentrations of the samples into account.
In the 11th project, NC provided two soil samples (No.091 and 092) to laboratories to improve the
inter-laboratory precision further more by standardization of methods. In this report, the data from
participating laboratories were evaluated statistically according to the QA/QC program for soil
monitoring, and the results may be utilized for estimation of inter-laboratory variation in soil
monitoring, and provide useful information to improve precision of soil analysis on EANET.
71
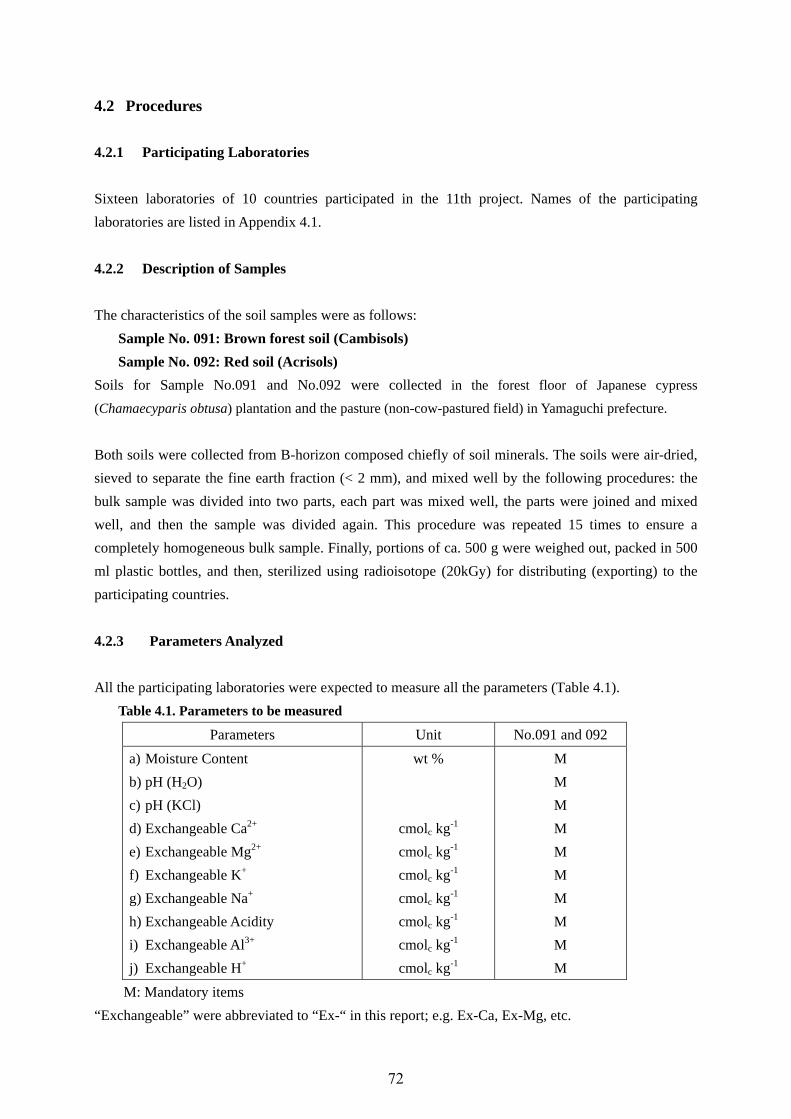
4.2 Procedures
4.2.1 Participating Laboratories
Sixteen laboratories of 10 countries participated in the 11th project. Names of the participating
laboratories are listed in Appendix 4.1.
4.2.2 Description of Samples
The characteristics of the soil samples were as follows:
Sample No. 091: Brown forest soil (Cambisols)
Sample No. 092: Red soil (Acrisols)
Soils for Sample No.091 and No.092 were collected in the forest floor of Japanese cypress
(Chamaecyparis obtusa) plantation and the pasture (non-cow-pastured field) in Yamaguchi prefecture.
Both soils were collected from B-horizon composed chiefly of soil minerals. The soils were air-dried,
sieved to separate the fine earth fraction (< 2 mm), and mixed well by the following procedures: the
bulk sample was divided into two parts, each part was mixed well, the parts were joined and mixed
well, and then the sample was divided again. This procedure was repeated 15 times to ensure a
completely homogeneous bulk sample. Finally, portions of ca. 500 g were weighed out, packed in 500
ml plastic bottles, and then, sterilized using radioisotope (20kGy) for distributing (exporting) to the
participating countries.
4.2.3 Parameters Analyzed
All the participating laboratories were expected to measure all the parameters (Table 4.1).
Table 4.1. Parameters to be measured
Parameters Unit No.091 and 092
a) Moisture Content
b) pH (H2O)
c) pH (KCl)
d) Exchangeable Ca2+
e) Exchangeable Mg2+
f) Exchangeable K+
g) Exchangeable Na+
h) Exchangeable Acidity
i) Exchangeable Al3+
j) Exchangeable H+
wt %
cmolc kg-1
cmolc kg-1
cmolc kg-1
cmolc kg-1
cmolc kg-1
cmolc kg-1
cmolc kg-1
M
M
M
M
M
M
M
M
M
M
M: Mandatory items
“Exchangeable” were abbreviated to “Ex-“ in this report; e.g. Ex-Ca, Ex-Mg, etc.
72
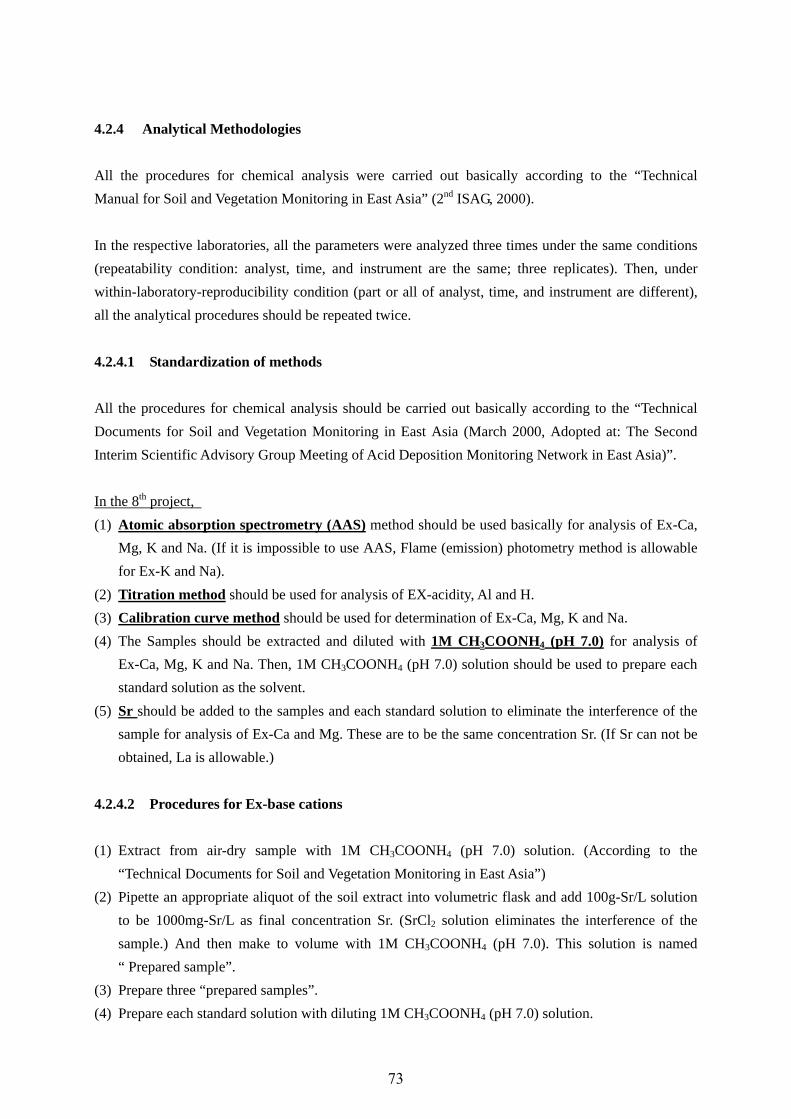
4.2.4 Analytical Methodologies
All the procedures for chemical analysis were carried out basically according to the “Technical
Manual for Soil and Vegetation Monitoring in East Asia” (2nd ISAG, 2000).
In the respective laboratories, all the parameters were analyzed three times under the same conditions
(repeatability condition: analyst, time, and instrument are the same; three replicates). Then, under
within-laboratory-reproducibility condition (part or all of analyst, time, and instrument are different),
all the analytical procedures should be repeated twice.
4.2.4.1 Standardization of methods
All the procedures for chemical analysis should be carried out basically according to the “Technical
Documents for Soil and Vegetation Monitoring in East Asia (March 2000, Adopted at: The Second
Interim Scientific Advisory Group Meeting of Acid Deposition Monitoring Network in East Asia)”.
In the 8th project,
(1) Atomic absorption spectrometry (AAS) method should be used basically for analysis of Ex-Ca,
Mg, K and Na. (If it is impossible to use AAS, Flame (emission) photometry method is allowable
for Ex-K and Na).
(2) Titration method should be used for analysis of EX-acidity, Al and H.
(3) Calibration curve method should be used for determination of Ex-Ca, Mg, K and Na.
(4) The Samples should be extracted and diluted with 1M CH3COONH4 (pH 7.0) for analysis of
Ex-Ca, Mg, K and Na. Then, 1M CH3COONH4 (pH 7.0) solution should be used to prepare each
standard solution as the solvent.
(5) Sr should be added to the samples and each standard solution to eliminate the interference of the
sample for analysis of Ex-Ca and Mg. These are to be the same concentration Sr. (If Sr can not be
obtained, La is allowable.)
4.2.4.2 Procedures for Ex-base cations
(1) Extract from air-dry sample with 1M CH3COONH4 (pH 7.0) solution. (According to the
“Technical Documents for Soil and Vegetation Monitoring in East Asia”)
(2) Pipette an appropriate aliquot of the soil extract into volumetric flask and add 100g-Sr/L solution
to be 1000mg-Sr/L as final concentration Sr. (SrCl2 solution eliminates the interference of the
sample.) And then make to volume with 1M CH3COONH4 (pH 7.0). This solution is named
“ Prepared sample”.
(3) Prepare three “prepared samples”.
(4) Prepare each standard solution with diluting 1M CH3COONH4 (pH 7.0) solution.
73
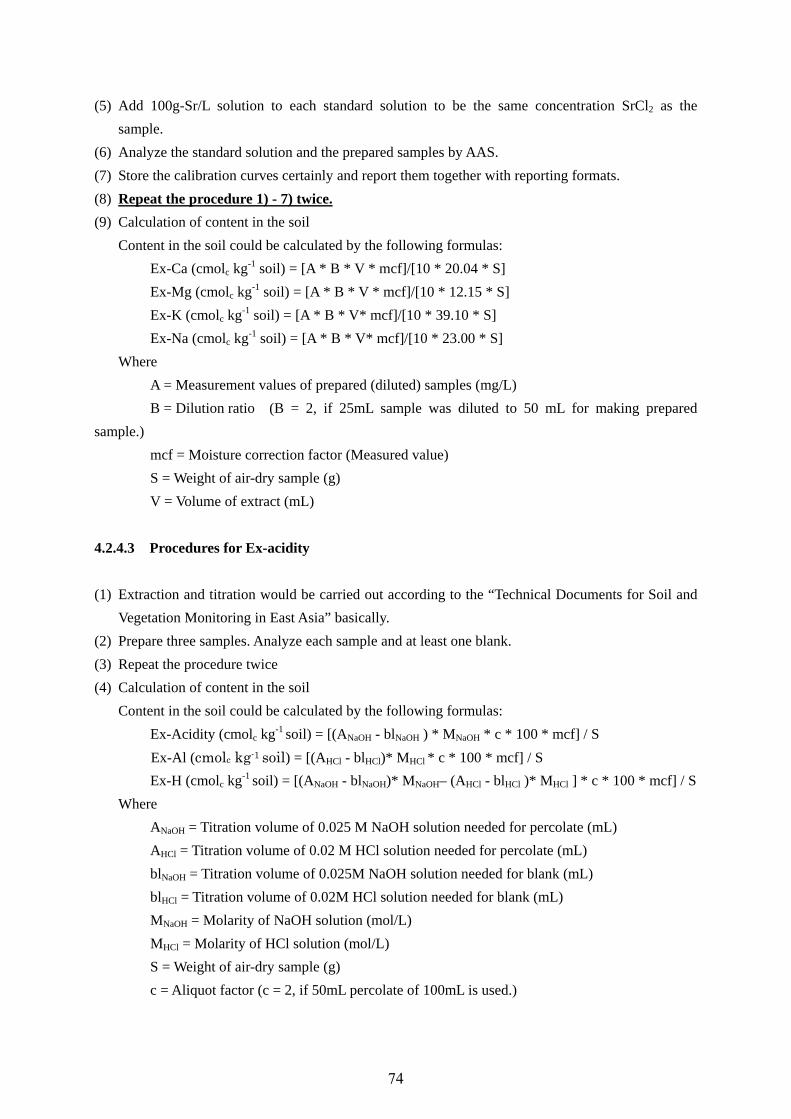
(5) Add 100g-Sr/L solution to each standard solution to be the same concentration SrCl2 as the
sample.
(6) Analyze the standard solution and the prepared samples by AAS.
(7) Store the calibration curves certainly and report them together with reporting formats.
(8) Repeat the procedure 1) - 7) twice.
(9) Calculation of content in the soil
Content in the soil could be calculated by the following formulas:
Ex-Ca (cmolc kg-1 soil) = [A * B * V * mcf]/[10 * 20.04 * S]
Ex-Mg (cmolc kg-1 soil) = [A * B * V * mcf]/[10 * 12.15 * S]
Ex-K (cmolc kg-1 soil) = [A * B * V* mcf]/[10 * 39.10 * S]
Ex-Na (cmolc kg-1 soil) = [A * B * V* mcf]/[10 * 23.00 * S]
Where
A = Measurement values of prepared (diluted) samples (mg/L)
B = Dilution ratio (B = 2, if 25mL sample was diluted to 50 mL for making prepared
sample.)
mcf = Moisture correction factor (Measured value)
S = Weight of air-dry sample (g)
V = Volume of extract (mL)
4.2.4.3 Procedures for Ex-acidity
(1) Extraction and titration would be carried out according to the “Technical Documents for Soil and
Vegetation Monitoring in East Asia” basically.
(2) Prepare three samples. Analyze each sample and at least one blank.
(3) Repeat the procedure twice
(4) Calculation of content in the soil
Content in the soil could be calculated by the following formulas:
Ex-Acidity (cmolc kg-1 soil) = [(ANaOH - blNaOH ) * MNaOH * c * 100 * mcf] / S
Ex-Al (cmolc kg-1 soil) = [(AHCl - blHCl)* MHCl * c * 100 * mcf] / S
Ex-H (cmolc kg-1 soil) = [(ANaOH - blNaOH)* MNaOH– (AHCl - blHCl )* MHCl ] * c * 100 * mcf] / S
Where
ANaOH = Titration volume of 0.025 M NaOH solution needed for percolate (mL)
AHCl = Titration volume of 0.02 M HCl solution needed for percolate (mL)
blNaOH = Titration volume of 0.025M NaOH solution needed for blank (mL)
blHCl = Titration volume of 0.02M HCl solution needed for blank (mL)
MNaOH = Molarity of NaOH solution (mol/L)
MHCl = Molarity of HCl solution (mol/L)
S = Weight of air-dry sample (g)
c = Aliquot factor (c = 2, if 50mL percolate of 100mL is used.)
74
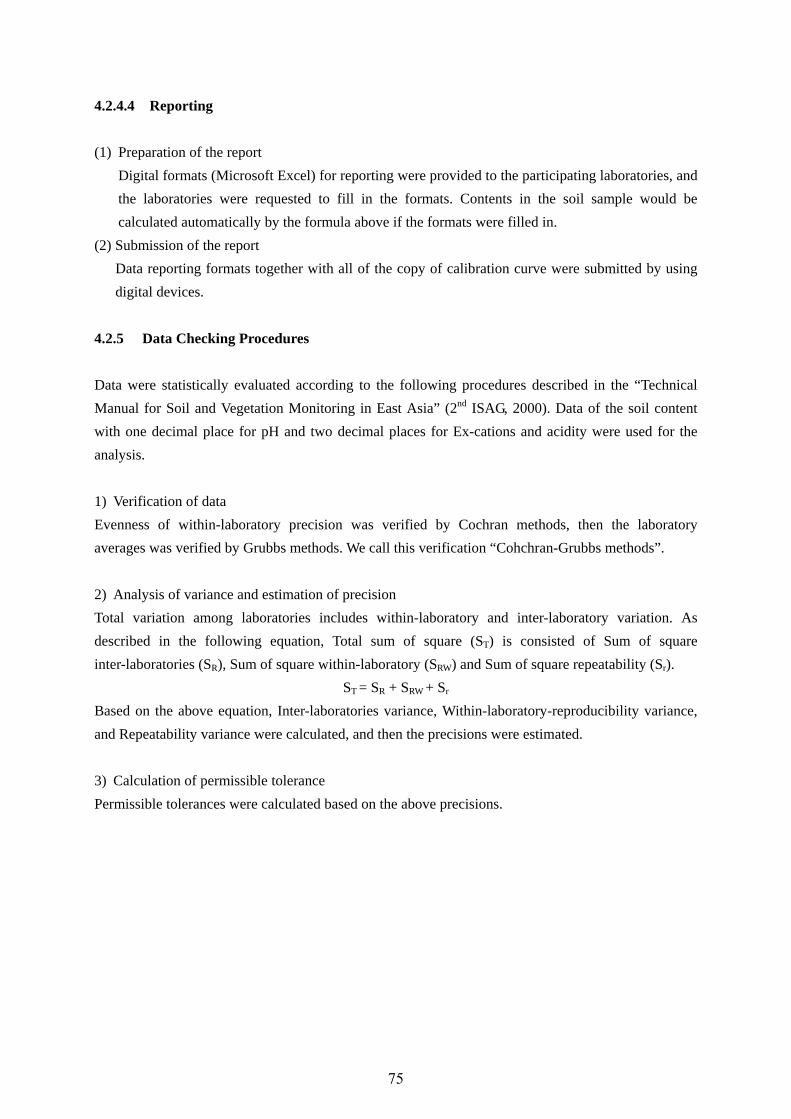
4.2.4.4 Reporting
(1) Preparation of the report
Digital formats (Microsoft Excel) for reporting were provided to the participating laboratories, and
the laboratories were requested to fill in the formats. Contents in the soil sample would be
calculated automatically by the formula above if the formats were filled in.
(2) Submission of the report
Data reporting formats together with all of the copy of calibration curve were submitted by using
digital devices.
4.2.5 Data Checking Procedures
Data were statistically evaluated according to the following procedures described in the “Technical
Manual for Soil and Vegetation Monitoring in East Asia” (2nd ISAG, 2000). Data of the soil content
with one decimal place for pH and two decimal places for Ex-cations and acidity were used for the
analysis.
1) Verification of data
Evenness of within-laboratory precision was verified by Cochran methods, then the laboratory
averages was verified by Grubbs methods. We call this verification “Cohchran-Grubbs methods”.
2) Analysis of variance and estimation of precision
Total variation among laboratories includes within-laboratory and inter-laboratory variation. As
described in the following equation, Total sum of square (ST) is consisted of Sum of square
inter-laboratories (SR), Sum of square within-laboratory (SRW) and Sum of square repeatability (Sr).
ST = SR + SRW + Sr
Based on the above equation, Inter-laboratories variance, Within-laboratory-reproducibility variance,
and Repeatability variance were calculated, and then the precisions were estimated.
3) Calculation of permissible tolerance
Permissible tolerances were calculated based on the above precisions.
75
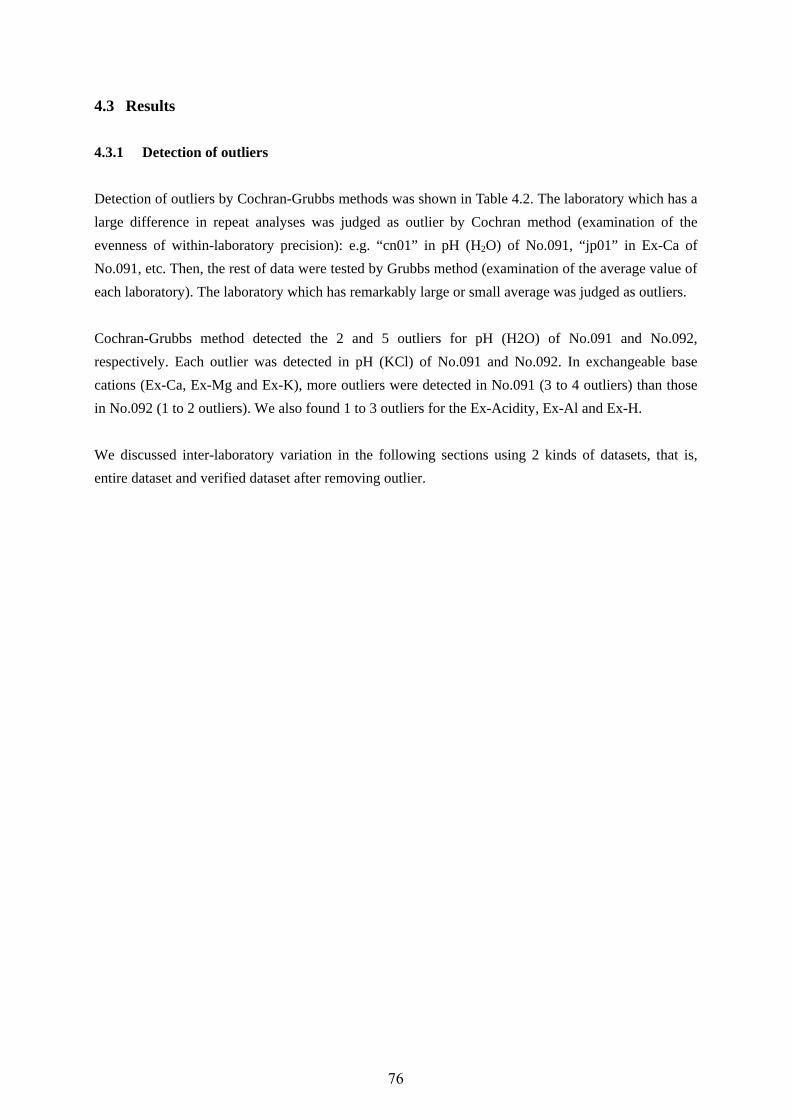
4.3 Results
4.3.1 Detection of outliers
Detection of outliers by Cochran-Grubbs methods was shown in Table 4.2. The laboratory which has a
large difference in repeat analyses was judged as outlier by Cochran method (examination of the
evenness of within-laboratory precision): e.g. “cn01” in pH (H2O) of No.091, “jp01” in Ex-Ca of
No.091, etc. Then, the rest of data were tested by Grubbs method (examination of the average value of
each laboratory). The laboratory which has remarkably large or small average was judged as outliers.
Cochran-Grubbs method detected the 2 and 5 outliers for pH (H2O) of No.091 and No.092,
respectively. Each outlier was detected in pH (KCl) of No.091 and No.092. In exchangeable base
cations (Ex-Ca, Ex-Mg and Ex-K), more outliers were detected in No.091 (3 to 4 outliers) than those
in No.092 (1 to 2 outliers). We also found 1 to 3 outliers for the Ex-Acidity, Ex-Al and Ex-H.
We discussed inter-laboratory variation in the following sections using 2 kinds of datasets, that is,
entire dataset and verified dataset after removing outlier.
76
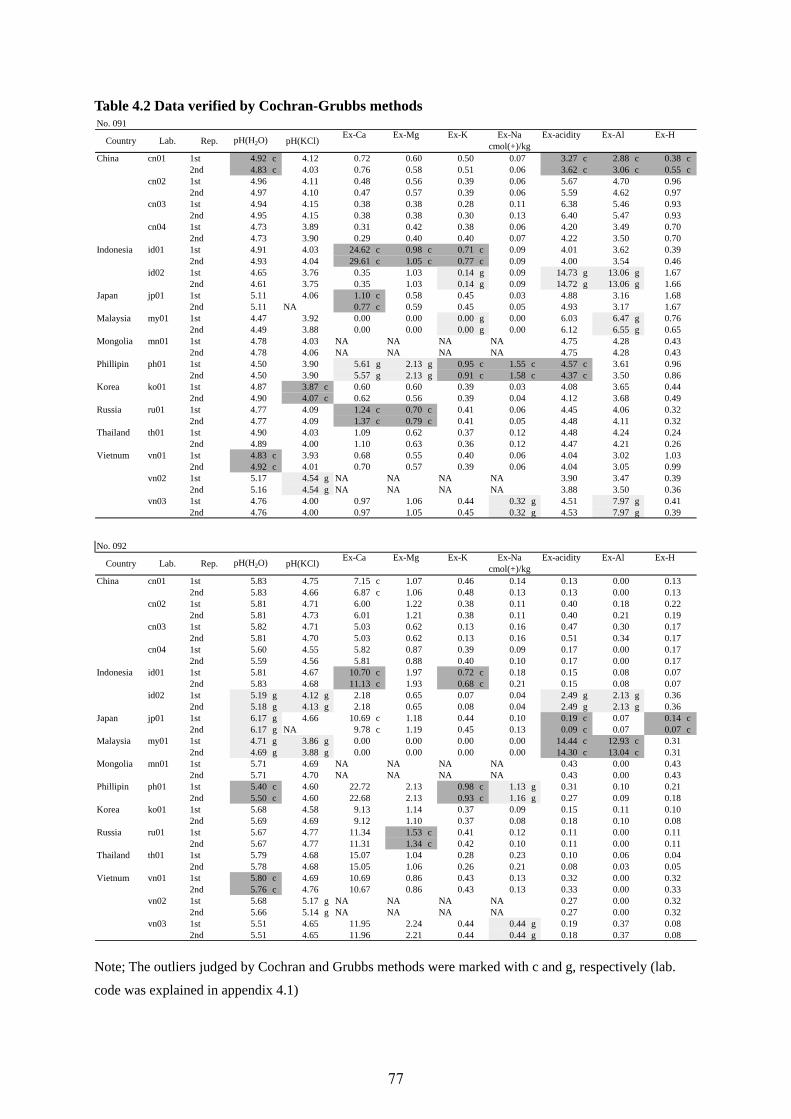
Table 4.2 Data verified by Cochran-Grubbs methods No. 091
Ex-Ca Ex-Mg Ex-K Ex-Na Ex-acidity Ex-Al Ex-H
China cn01 1st 4.92 c 4.12 0.72 0.60 0.50 0.07 3.27 c 2.88 c 0.38 c2nd 4.83 c 4.03 0.76 0.58 0.51 0.06 3.62 c 3.06 c 0.55 c
cn02 1st 4.96 4.11 0.48 0.56 0.39 0.06 5.67 4.70 0.962nd 4.97 4.10 0.47 0.57 0.39 0.06 5.59 4.62 0.97
cn03 1st 4.94 4.15 0.38 0.38 0.28 0.11 6.38 5.46 0.932nd 4.95 4.15 0.38 0.38 0.30 0.13 6.40 5.47 0.93
cn04 1st 4.73 3.89 0.31 0.42 0.38 0.06 4.20 3.49 0.702nd 4.73 3.90 0.29 0.40 0.40 0.07 4.22 3.50 0.70
Indonesia id01 1st 4.91 4.03 24.62 c 0.98 c 0.71 c 0.09 4.01 3.62 0.392nd 4.93 4.04 29.61 c 1.05 c 0.77 c 0.09 4.00 3.54 0.46
id02 1st 4.65 3.76 0.35 1.03 0.14 g 0.09 14.73 g 13.06 g 1.672nd 4.61 3.75 0.35 1.03 0.14 g 0.09 14.72 g 13.06 g 1.66
Japan jp01 1st 5.11 4.06 1.10 c 0.58 0.45 0.03 4.88 3.16 1.682nd 5.11 NA 0.77 c 0.59 0.45 0.05 4.93 3.17 1.67
Malaysia my01 1st 4.47 3.92 0.00 0.00 0.00 g 0.00 6.03 6.47 g 0.762nd 4.49 3.88 0.00 0.00 0.00 g 0.00 6.12 6.55 g 0.65
Mongolia mn01 1st 4.78 4.03 NA NA NA NA 4.75 4.28 0.432nd 4.78 4.06 NA NA NA NA 4.75 4.28 0.43
Phillipin ph01 1st 4.50 3.90 5.61 g 2.13 g 0.95 c 1.55 c 4.57 c 3.61 0.962nd 4.50 3.90 5.57 g 2.13 g 0.91 c 1.58 c 4.37 c 3.50 0.86
Korea ko01 1st 4.87 3.87 c 0.60 0.60 0.39 0.03 4.08 3.65 0.442nd 4.90 4.07 c 0.62 0.56 0.39 0.04 4.12 3.68 0.49
Russia ru01 1st 4.77 4.09 1.24 c 0.70 c 0.41 0.06 4.45 4.06 0.322nd 4.77 4.09 1.37 c 0.79 c 0.41 0.05 4.48 4.11 0.32
Thailand th01 1st 4.90 4.03 1.09 0.62 0.37 0.12 4.48 4.24 0.242nd 4.89 4.00 1.10 0.63 0.36 0.12 4.47 4.21 0.26
Vietnum vn01 1st 4.83 c 3.93 0.68 0.55 0.40 0.06 4.04 3.02 1.032nd 4.92 c 4.01 0.70 0.57 0.39 0.06 4.04 3.05 0.99
vn02 1st 5.17 4.54 g NA NA NA NA 3.90 3.47 0.392nd 5.16 4.54 g NA NA NA NA 3.88 3.50 0.36
vn03 1st 4.76 4.00 0.97 1.06 0.44 0.32 g 4.51 7.97 g 0.412nd 4.76 4.00 0.97 1.05 0.45 0.32 g 4.53 7.97 g 0.39
No. 092Ex-Ca Ex-Mg Ex-K Ex-Na Ex-acidity Ex-Al Ex-H
China cn01 1st 5.83 4.75 7.15 c 1.07 0.46 0.14 0.13 0.00 0.132nd 5.83 4.66 6.87 c 1.06 0.48 0.13 0.13 0.00 0.13
cn02 1st 5.81 4.71 6.00 1.22 0.38 0.11 0.40 0.18 0.222nd 5.81 4.73 6.01 1.21 0.38 0.11 0.40 0.21 0.19
cn03 1st 5.82 4.71 5.03 0.62 0.13 0.16 0.47 0.30 0.172nd 5.81 4.70 5.03 0.62 0.13 0.16 0.51 0.34 0.17
cn04 1st 5.60 4.55 5.82 0.87 0.39 0.09 0.17 0.00 0.172nd 5.59 4.56 5.81 0.88 0.40 0.10 0.17 0.00 0.17
Indonesia id01 1st 5.81 4.67 10.70 c 1.97 0.72 c 0.18 0.15 0.08 0.072nd 5.83 4.68 11.13 c 1.93 0.68 c 0.21 0.15 0.08 0.07
id02 1st 5.19 g 4.12 g 2.18 0.65 0.07 0.04 2.49 g 2.13 g 0.362nd 5.18 g 4.13 g 2.18 0.65 0.08 0.04 2.49 g 2.13 g 0.36
Japan jp01 1st 6.17 g 4.66 10.69 c 1.18 0.44 0.10 0.19 c 0.07 0.14 c2nd 6.17 g NA 9.78 c 1.19 0.45 0.13 0.09 c 0.07 0.07 c
Malaysia my01 1st 4.71 g 3.86 g 0.00 0.00 0.00 0.00 14.44 c 12.93 c 0.312nd 4.69 g 3.88 g 0.00 0.00 0.00 0.00 14.30 c 13.04 c 0.31
Mongolia mn01 1st 5.71 4.69 NA NA NA NA 0.43 0.00 0.432nd 5.71 4.70 NA NA NA NA 0.43 0.00 0.43
Phillipin ph01 1st 5.40 c 4.60 22.72 2.13 0.98 c 1.13 g 0.31 0.10 0.212nd 5.50 c 4.60 22.68 2.13 0.93 c 1.16 g 0.27 0.09 0.18
Korea ko01 1st 5.68 4.58 9.13 1.14 0.37 0.09 0.15 0.11 0.102nd 5.69 4.69 9.12 1.10 0.37 0.08 0.18 0.10 0.08
Russia ru01 1st 5.67 4.77 11.34 1.53 c 0.41 0.12 0.11 0.00 0.112nd 5.67 4.77 11.31 1.34 c 0.42 0.10 0.11 0.00 0.11
Thailand th01 1st 5.79 4.68 15.07 1.04 0.28 0.23 0.10 0.06 0.042nd 5.78 4.68 15.05 1.06 0.26 0.21 0.08 0.03 0.05
Vietnum vn01 1st 5.80 c 4.69 10.69 0.86 0.43 0.13 0.32 0.00 0.322nd 5.76 c 4.76 10.67 0.86 0.43 0.13 0.33 0.00 0.33
vn02 1st 5.68 5.17 g NA NA NA NA 0.27 0.00 0.322nd 5.66 5.14 g NA NA NA NA 0.27 0.00 0.32
vn03 1st 5.51 4.65 11.95 2.24 0.44 0.44 g 0.19 0.37 0.082nd 5.51 4.65 11.96 2.21 0.44 0.44 g 0.18 0.37 0.08
Country Lab. Rep. pH(H2O) pH(KCl)cmol(+)/kg
Country Lab. Rep. pH(H2O) pH(KCl)cmol(+)/kg
Note; The outliers judged by Cochran and Grubbs methods were marked with c and g, respectively (lab.
code was explained in appendix 4.1)
77
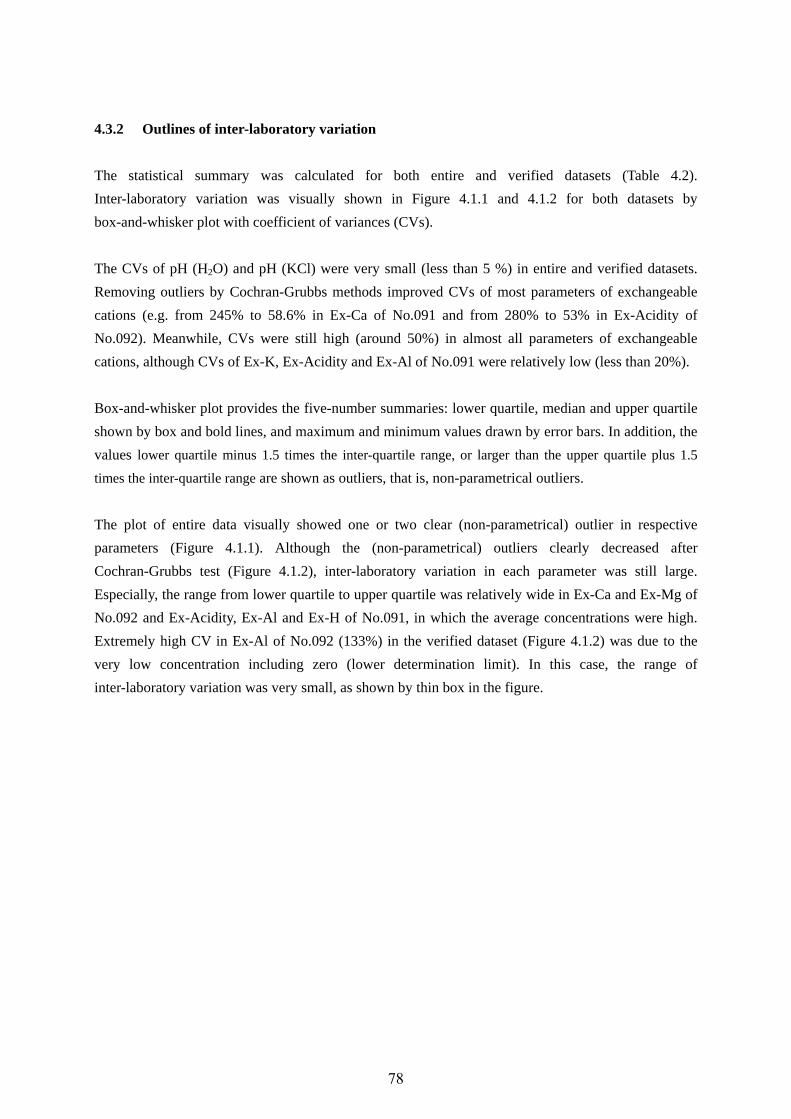
4.3.2 Outlines of inter-laboratory variation
The statistical summary was calculated for both entire and verified datasets (Table 4.2).
Inter-laboratory variation was visually shown in Figure 4.1.1 and 4.1.2 for both datasets by
box-and-whisker plot with coefficient of variances (CVs).
The CVs of pH (H2O) and pH (KCl) were very small (less than 5 %) in entire and verified datasets.
Removing outliers by Cochran-Grubbs methods improved CVs of most parameters of exchangeable
cations (e.g. from 245% to 58.6% in Ex-Ca of No.091 and from 280% to 53% in Ex-Acidity of
No.092). Meanwhile, CVs were still high (around 50%) in almost all parameters of exchangeable
cations, although CVs of Ex-K, Ex-Acidity and Ex-Al of No.091 were relatively low (less than 20%).
Box-and-whisker plot provides the five-number summaries: lower quartile, median and upper quartile
shown by box and bold lines, and maximum and minimum values drawn by error bars. In addition, the
values lower quartile minus 1.5 times the inter-quartile range, or larger than the upper quartile plus 1.5
times the inter-quartile range are shown as outliers, that is, non-parametrical outliers.
The plot of entire data visually showed one or two clear (non-parametrical) outlier in respective
parameters (Figure 4.1.1). Although the (non-parametrical) outliers clearly decreased after
Cochran-Grubbs test (Figure 4.1.2), inter-laboratory variation in each parameter was still large.
Especially, the range from lower quartile to upper quartile was relatively wide in Ex-Ca and Ex-Mg of
No.092 and Ex-Acidity, Ex-Al and Ex-H of No.091, in which the average concentrations were high.
Extremely high CV in Ex-Al of No.092 (133%) in the verified dataset (Figure 4.1.2) was due to the
very low concentration including zero (lower determination limit). In this case, the range of
inter-laboratory variation was very small, as shown by thin box in the figure.
78
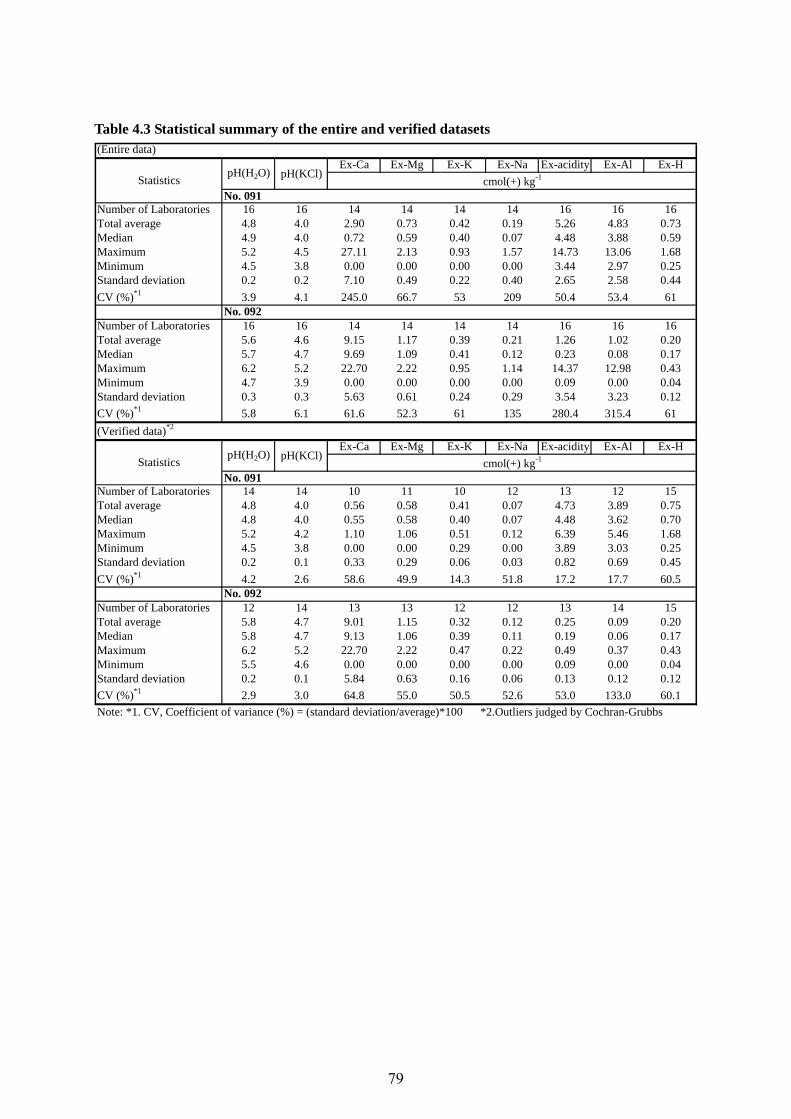
Table 4.3 Statistical summary of the entire and verified datasets (Entire data)
Ex-Ca Ex-Mg Ex-K Ex-Na Ex-acidity Ex-Al Ex-H
Number of Laboratories 16 16 14 14 14 14 16 16 16Total average 4.8 4.0 2.90 0.73 0.42 0.19 5.26 4.83 0.73Median 4.9 4.0 0.72 0.59 0.40 0.07 4.48 3.88 0.59Maximum 5.2 4.5 27.11 2.13 0.93 1.57 14.73 13.06 1.68Minimum 4.5 3.8 0.00 0.00 0.00 0.00 3.44 2.97 0.25Standard deviation 0.2 0.2 7.10 0.49 0.22 0.40 2.65 2.58 0.44
CV (%)*1 3.9 4.1 245.0 66.7 53 209 50.4 53.4 61
Number of Laboratories 16 16 14 14 14 14 16 16 16Total average 5.6 4.6 9.15 1.17 0.39 0.21 1.26 1.02 0.20Median 5.7 4.7 9.69 1.09 0.41 0.12 0.23 0.08 0.17Maximum 6.2 5.2 22.70 2.22 0.95 1.14 14.37 12.98 0.43Minimum 4.7 3.9 0.00 0.00 0.00 0.00 0.09 0.00 0.04Standard deviation 0.3 0.3 5.63 0.61 0.24 0.29 3.54 3.23 0.12
CV (%)*1 5.8 6.1 61.6 52.3 61 135 280.4 315.4 61
(Verified data)*2
Ex-Ca Ex-Mg Ex-K Ex-Na Ex-acidity Ex-Al Ex-H
Number of Laboratories 14 14 10 11 10 12 13 12 15Total average 4.8 4.0 0.56 0.58 0.41 0.07 4.73 3.89 0.75Median 4.8 4.0 0.55 0.58 0.40 0.07 4.48 3.62 0.70Maximum 5.2 4.2 1.10 1.06 0.51 0.12 6.39 5.46 1.68Minimum 4.5 3.8 0.00 0.00 0.29 0.00 3.89 3.03 0.25Standard deviation 0.2 0.1 0.33 0.29 0.06 0.03 0.82 0.69 0.45
CV (%)*1 4.2 2.6 58.6 49.9 14.3 51.8 17.2 17.7 60.5
Number of Laboratories 12 14 13 13 12 12 13 14 15Total average 5.8 4.7 9.01 1.15 0.32 0.12 0.25 0.09 0.20Median 5.8 4.7 9.13 1.06 0.39 0.11 0.19 0.06 0.17Maximum 6.2 5.2 22.70 2.22 0.47 0.22 0.49 0.37 0.43Minimum 5.5 4.6 0.00 0.00 0.00 0.00 0.09 0.00 0.04Standard deviation 0.2 0.1 5.84 0.63 0.16 0.06 0.13 0.12 0.12
CV (%)*1 2.9 3.0 64.8 55.0 50.5 52.6 53.0 133.0 60.1
Note: *1. CV, Coefficient of variance (%) = (standard deviation/average)*100 *2.Outliers judged by Cochran-Grubbs
StatisticspH(H2O) pH(KCl)
cmol(+) kg-1
No. 091
No. 092
StatisticspH(H2O) pH(KCl)
cmol(+) kg-1
No. 091
No. 092
79
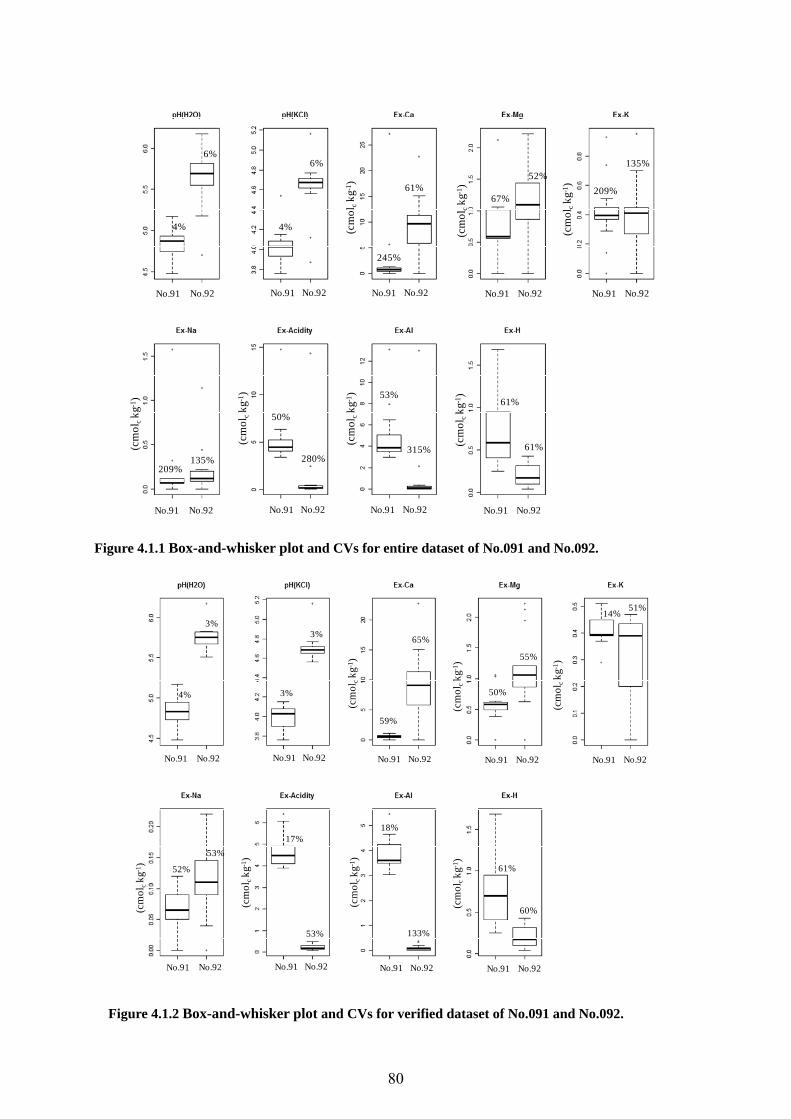
245%
61%
50%
280%
53%
315%
No.91 No.92 No.91 No.92 No.91 No.92 No.91 No.92 No.91 No.92
No.91 No.92 No.91 No.92 No.91 No.92 No.91 No.92
(cm
olckg
-1)
(cm
olckg
-1)
(cm
olckg
-1)
(cm
olckg
-1)
(cm
olckg
-1)
(cm
olckg
-1)
(cm
olckg
-1)
4%
6%
4%
6%
67%
52%
209%
135%
209%135%
61%
61%
Figure 4.1.1 Box-and-whisker plot and CVs for entire dataset of No.091 and No.092.
59%
65%
17%
53%
18%
133%
No.91 No.92 No.91 No.92 No.91 No.92 No.91 No.92 No.91 No.92
No.91 No.92 No.91 No.92 No.91 No.92 No.91 No.92
(cm
olckg
-1)
(cm
olckg
-1)
(cm
olckg
-1)
(cm
olckg
-1)
(cm
olckg
-1)
(cm
olckg
-1)
(cm
olckg
-1)
4%
3%
3%
3%
50%
55%
14%51%
52%
53%
61%
60%
Figure 4.1.2 Box-and-whisker plot and CVs for verified dataset of No.091 and No.092.
80
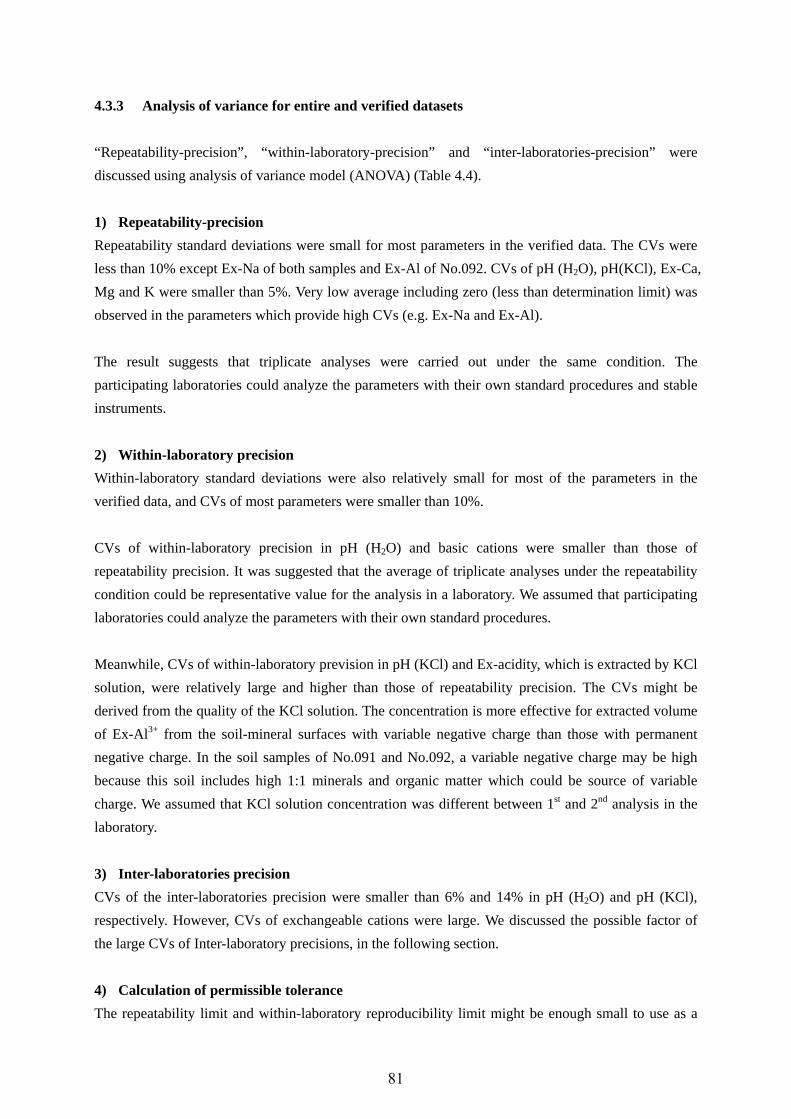
4.3.3 Analysis of variance for entire and verified datasets
“Repeatability-precision”, “within-laboratory-precision” and “inter-laboratories-precision” were
discussed using analysis of variance model (ANOVA) (Table 4.4).
1) Repeatability-precision
Repeatability standard deviations were small for most parameters in the verified data. The CVs were
less than 10% except Ex-Na of both samples and Ex-Al of No.092. CVs of pH (H2O), pH(KCl), Ex-Ca,
Mg and K were smaller than 5%. Very low average including zero (less than determination limit) was
observed in the parameters which provide high CVs (e.g. Ex-Na and Ex-Al).
The result suggests that triplicate analyses were carried out under the same condition. The
participating laboratories could analyze the parameters with their own standard procedures and stable
instruments.
2) Within-laboratory precision
Within-laboratory standard deviations were also relatively small for most of the parameters in the
verified data, and CVs of most parameters were smaller than 10%.
CVs of within-laboratory precision in pH (H2O) and basic cations were smaller than those of
repeatability precision. It was suggested that the average of triplicate analyses under the repeatability
condition could be representative value for the analysis in a laboratory. We assumed that participating
laboratories could analyze the parameters with their own standard procedures.
Meanwhile, CVs of within-laboratory prevision in pH (KCl) and Ex-acidity, which is extracted by KCl
solution, were relatively large and higher than those of repeatability precision. The CVs might be
derived from the quality of the KCl solution. The concentration is more effective for extracted volume
of Ex-Al3+ from the soil-mineral surfaces with variable negative charge than those with permanent
negative charge. In the soil samples of No.091 and No.092, a variable negative charge may be high
because this soil includes high 1:1 minerals and organic matter which could be source of variable
charge. We assumed that KCl solution concentration was different between 1st and 2nd analysis in the
laboratory.
3) Inter-laboratories precision
CVs of the inter-laboratories precision were smaller than 6% and 14% in pH (H2O) and pH (KCl),
respectively. However, CVs of exchangeable cations were large. We discussed the possible factor of
the large CVs of Inter-laboratory precisions, in the following section.
4) Calculation of permissible tolerance
The repeatability limit and within-laboratory reproducibility limit might be enough small to use as a
81
reference value for the repeat analysis on the instrumental analysis in the respective laboratory. The
reproducibility limit and inter-laboratories precision should be improved for exchangeable cations. We
discussed the factor of inter-laboratory variation in each parameter, in the following section.
82
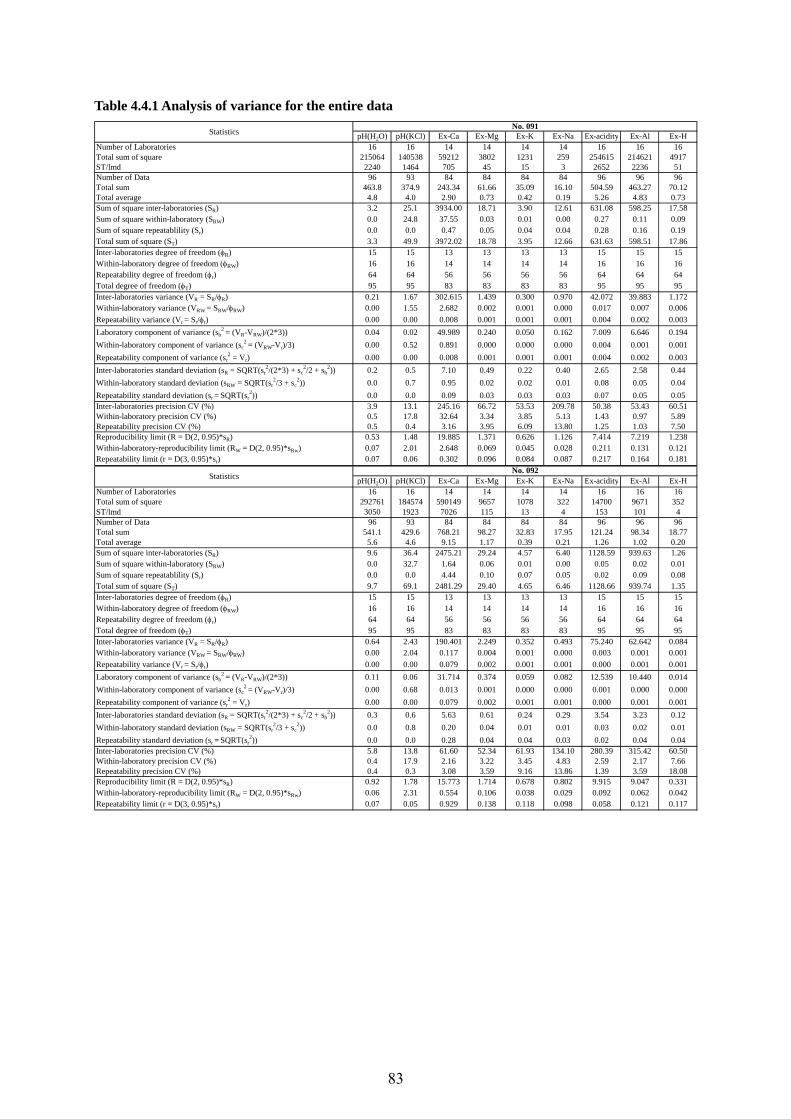
Table 4.4.1 Analysis of variance for the entire data
pH(H2O) pH(KCl) Ex-Ca Ex-Mg Ex-K Ex-Na Ex-acidity Ex-Al Ex-HNumber of Laboratories 16 16 14 14 14 14 16 16 16Total sum of square 215064 140538 59212 3802 1231 259 254615 214621 4917ST/lmd 2240 1464 705 45 15 3 2652 2236 51Number of Data 96 93 84 84 84 84 96 96 96Total sum 463.8 374.9 243.34 61.66 35.09 16.10 504.59 463.27 70.12Total average 4.8 4.0 2.90 0.73 0.42 0.19 5.26 4.83 0.73Sum of square inter-laboratories (SR) 3.2 25.1 3934.00 18.71 3.90 12.61 631.08 598.25 17.58Sum of square within-laboratory (SRW) 0.0 24.8 37.55 0.03 0.01 0.00 0.27 0.11 0.09Sum of square repeatablility (Sr) 0.0 0.0 0.47 0.05 0.04 0.04 0.28 0.16 0.19Total sum of square (ST) 3.3 49.9 3972.02 18.78 3.95 12.66 631.63 598.51 17.86Inter-laboratories degree of freedom (φR) 15 15 13 13 13 13 15 15 15Within-laboratory degree of freedom (φRW) 16 16 14 14 14 14 16 16 16Repeatability degree of freedom (φr) 64 64 56 56 56 56 64 64 64Total degree of freedom (φT) 95 95 83 83 83 83 95 95 95Inter-laboratories variance (VR = SR/φR) 0.21 1.67 302.615 1.439 0.300 0.970 42.072 39.883 1.172Within-laboratory variance (VRW = SRW/φRW) 0.00 1.55 2.682 0.002 0.001 0.000 0.017 0.007 0.006
Repeatability variance (Vr = Sr/φr) 0.00 0.00 0.008 0.001 0.001 0.001 0.004 0.002 0.003
Laboratory component of variance (sb2 = (VR-VRW)/(2*3)) 0.04 0.02 49.989 0.240 0.050 0.162 7.009 6.646 0.194
Within-laboratory component of variance (sc2 = (VRW-Vr)/3) 0.00 0.52 0.891 0.000 0.000 0.000 0.004 0.001 0.001
Repeatability component of variance (sr2 = Vr) 0.00 0.00 0.008 0.001 0.001 0.001 0.004 0.002 0.003
Inter-laboratories standard deviation (sR = SQRT(sr2/(2*3) + sc
2/2 + sb2)) 0.2 0.5 7.10 0.49 0.22 0.40 2.65 2.58 0.44
Within-laboratory standard deviation (sRW = SQRT(sr2/3 + sc
2)) 0.0 0.7 0.95 0.02 0.02 0.01 0.08 0.05 0.04
Repeatability standard deviation (sr = SQRT(sr2)) 0.0 0.0 0.09 0.03 0.03 0.03 0.07 0.05 0.05
Inter-laboratories precision CV (%) 3.9 13.1 245.16 66.72 53.53 209.78 50.38 53.43 60.51Within-laboratory precision CV (%) 0.5 17.8 32.64 3.34 3.85 5.13 1.43 0.97 5.89Repeatability precision CV (%) 0.5 0.4 3.16 3.95 6.09 13.80 1.25 1.03 7.50Reproducibility limit (R = D(2, 0.95)*sR) 0.53 1.48 19.885 1.371 0.626 1.126 7.414 7.219 1.238Within-laboratory-reproducibility limit (RW = D(2, 0.95)*sRw) 0.07 2.01 2.648 0.069 0.045 0.028 0.211 0.131 0.121Repeatability limit (r = D(3, 0.95)*sr) 0.07 0.06 0.302 0.096 0.084 0.087 0.217 0.164 0.181
pH(H2O) pH(KCl) Ex-Ca Ex-Mg Ex-K Ex-Na Ex-acidity Ex-Al Ex-HNumber of Laboratories 16 16 14 14 14 14 16 16 16Total sum of square 292761 184574 590149 9657 1078 322 14700 9671 352ST/lmd 3050 1923 7026 115 13 4 153 101 4Number of Data 96 93 84 84 84 84 96 96 96Total sum 541.1 429.6 768.21 98.27 32.83 17.95 121.24 98.34 18.77Total average 5.6 4.6 9.15 1.17 0.39 0.21 1.26 1.02 0.20Sum of square inter-laboratories (SR) 9.6 36.4 2475.21 29.24 4.57 6.40 1128.59 939.63 1.26Sum of square within-laboratory (SRW) 0.0 32.7 1.64 0.06 0.01 0.00 0.05 0.02 0.01Sum of square repeatablility (Sr) 0.0 0.0 4.44 0.10 0.07 0.05 0.02 0.09 0.08Total sum of square (ST) 9.7 69.1 2481.29 29.40 4.65 6.46 1128.66 939.74 1.35Inter-laboratories degree of freedom (φR) 15 15 13 13 13 13 15 15 15Within-laboratory degree of freedom (φRW) 16 16 14 14 14 14 16 16 16Repeatability degree of freedom (φr) 64 64 56 56 56 56 64 64 64Total degree of freedom (φT) 95 95 83 83 83 83 95 95 95Inter-laboratories variance (VR = SR/φR) 0.64 2.43 190.401 2.249 0.352 0.493 75.240 62.642 0.084Within-laboratory variance (VRW = SRW/φRW) 0.00 2.04 0.117 0.004 0.001 0.000 0.003 0.001 0.001
Repeatability variance (Vr = Sr/φr) 0.00 0.00 0.079 0.002 0.001 0.001 0.000 0.001 0.001
Laboratory component of variance (sb2 = (VR-VRW)/(2*3)) 0.11 0.06 31.714 0.374 0.059 0.082 12.539 10.440 0.014
Within-laboratory component of variance (sc2 = (VRW-Vr)/3) 0.00 0.68 0.013 0.001 0.000 0.000 0.001 0.000 0.000
Repeatability component of variance (sr2 = Vr) 0.00 0.00 0.079 0.002 0.001 0.001 0.000 0.001 0.001
Inter-laboratories standard deviation (sR = SQRT(sr2/(2*3) + sc
2/2 + sb2)) 0.3 0.6 5.63 0.61 0.24 0.29 3.54 3.23 0.12
Within-laboratory standard deviation (sRW = SQRT(sr2/3 + sc
2)) 0.0 0.8 0.20 0.04 0.01 0.01 0.03 0.02 0.01
Repeatability standard deviation (sr = SQRT(sr2)) 0.0 0.0 0.28 0.04 0.04 0.03 0.02 0.04 0.04
Inter-laboratories precision CV (%) 5.8 13.8 61.60 52.34 61.93 134.10 280.39 315.42 60.50Within-laboratory precision CV (%) 0.4 17.9 2.16 3.22 3.45 4.83 2.59 2.17 7.66Repeatability precision CV (%) 0.4 0.3 3.08 3.59 9.16 13.86 1.39 3.59 18.08Reproducibility limit (R = D(2, 0.95)*sR) 0.92 1.78 15.773 1.714 0.678 0.802 9.915 9.047 0.331Within-laboratory-reproducibility limit (RW = D(2, 0.95)*sRw) 0.06 2.31 0.554 0.106 0.038 0.029 0.092 0.062 0.042Repeatability limit (r = D(3, 0.95)*sr) 0.07 0.05 0.929 0.138 0.118 0.098 0.058 0.121 0.117
StatisticsNo. 092
StatisticsNo. 091
83

Table 4.4.2 Analysis of variance for the verified data
pH(H2O) pH(KCl) Ex-Ca Ex-Mg Ex-K Ex-Na Ex-acidity Ex-Al Ex-HNumber of Laboratories 14 14 10 11 11 12 15 14 16Total sum of square 164228 104875 1131 1470 588 23 144117 83731 4757ST/lmd 1955 1249 19 22 9 0 1601 997 50Number of Data 84 81 60 66 60 72 81 75 93Total sum 405.3 323.8 33.63 38.34 24.24 4.81 379.63 289.36 68.97Total average 4.8 4.0 0.56 0.58 0.40 0.07 4.69 3.86 0.74Sum of square inter-laboratories (SR) 3.2 22.4 5.83 5.01 1.06 0.08 209.64 138.81 18.39Sum of square within-laboratory (SRW) 0.0 24.7 0.00 0.00 0.00 0.00 19.64 14.12 0.50Sum of square repeatablility (Sr) 0.0 0.0 0.02 0.02 0.02 0.00 0.26 0.11 0.17Total sum of square (ST) 3.2 47.2 5.86 5.03 1.08 0.08 229.53 153.03 19.07Inter-laboratories degree of freedom (φR) 13 13 9 10 10 11 14 13 15Within-laboratory degree of freedom (φRW) 14 14 10 11 11 12 15 14 16Repeatability degree of freedom (φr) 56 56 40 44 44 48 60 56 64Total degree of freedom (φT) 83 83 59 65 65 71 89 83 95Inter-laboratories variance (VR = SR/φR) 0.24 1.72 0.648 0.501 0.106 0.007 14.974 10.677 1.226Within-laboratory variance (VRW = SRW/φRW) 0.00 1.77 0.000 0.000 0.000 0.000 1.309 1.009 0.031
Repeatability variance (Vr = Sr/φr) 0.00 0.00 0.001 0.001 0.000 0.000 0.004 0.002 0.003
Laboratory component of variance (sb2 = (VR-VRW)/(2*3)) 0.04 -0.01 0.108 0.083 0.018 0.001 2.277 1.611 0.199
Within-laboratory component of variance (sc2 = (VRW-Vr)/3) 0.00 0.59 0.000 0.000 0.000 0.000 0.435 0.336 0.010
Repeatability component of variance (sr2 = Vr) 0.00 0.00 0.001 0.001 0.000 0.000 0.004 0.002 0.003
Inter-laboratories standard deviation (sR = SQRT(sr2/(2*3) + sc
2/2 + sb2)) 0.2 0.5 0.33 0.29 0.13 0.03 1.58 1.33 0.45
Within-laboratory standard deviation (sRW = SQRT(sr2/3 + sc
2)) 0.0 0.8 0.01 0.01 0.01 0.01 0.66 0.58 0.10
Repeatability standard deviation (sr = SQRT(sr2)) 0.0 0.0 0.02 0.02 0.02 0.01 0.07 0.04 0.05
Inter-laboratories precision CV (%) 4.2 13.4 58.63 49.73 32.95 51.55 33.71 34.58 60.96Within-laboratory precision CV (%) 0.2 19.2 2.09 2.05 2.09 10.76 14.09 15.03 13.80Repeatability precision CV (%) 0.4 0.4 4.07 3.95 4.90 13.31 1.39 1.14 6.96Reproducibility limit (R = D(2, 0.95)*sR) 0.57 1.50 0.920 0.809 0.373 0.096 4.423 3.735 1.266Within-laboratory-reproducibility limit (RW = D(2, 0.95)*sRw) 0.03 2.15 0.033 0.033 0.024 0.020 1.850 1.623 0.287Repeatability limit (r = D(3, 0.95)*sr) 0.07 0.06 0.075 0.076 0.065 0.029 0.215 0.146 0.170
pH(H2O) pH(KCl) Ex-Ca Ex-Mg Ex-K Ex-Na Ex-acidity Ex-Al Ex-HNumber of Laboratories 12 15 13 13 12 12 14 9 15Total sum of square 142381 145657 493823 8037 525 72 370 59 329ST/lmd 1978 1618 6331 103 7 1 4 1 4Number of Data 66 81 78 78 72 72 78 84 90Total sum 377.3 381.7 702.73 89.65 22.92 8.46 19.24 7.67 18.13Total average 5.7 4.7 9.01 1.15 0.32 0.12 0.25 0.09 0.20Sum of square inter-laboratories (SR) 180.4 148.7 2454.99 28.78 1.72 0.25 1.59 0.76 1.21Sum of square within-laboratory (SRW) 0.0 32.7 1.37 0.01 0.00 0.00 0.01 0.00 0.00Sum of square repeatablility (Sr) 0.0 0.0 3.74 0.05 0.01 0.01 0.01 0.08 0.02Total sum of square (ST) 180.4 181.4 2460.10 28.84 1.73 0.26 1.60 0.84 1.23Inter-laboratories degree of freedom (φR) 11 14 12 12 11 11 13 8 14Within-laboratory degree of freedom (φRW) 12 15 13 13 12 12 14 9 15Repeatability degree of freedom (φr) 48 60 52 52 48 48 56 36 60Total degree of freedom (φT) 71 89 77 77 71 71 83 53 89Inter-laboratories variance (VR = SR/φR) 16.40 10.62 204.582 2.398 0.157 0.022 0.122 0.095 0.086Within-laboratory variance (VRW = SRW/φRW) 0.00 2.18 0.106 0.000 0.000 0.000 0.000 0.000 0.000
Repeatability variance (Vr = Sr/φr) 0.00 0.00 0.072 0.001 0.000 0.000 0.000 0.002 0.000
Laboratory component of variance (sb2 = (VR-VRW)/(2*3)) 2.73 1.41 34.079 0.400 0.026 0.004 0.020 0.016 0.014
Within-laboratory component of variance (sc2 = (VRW-Vr)/3) 0.00 0.73 0.011 0.000 0.000 0.000 0.000 -0.001 0.000
Repeatability component of variance (sr2 = Vr) 0.00 0.00 0.072 0.001 0.000 0.000 0.000 0.002 0.000
Inter-laboratories standard deviation (sR = SQRT(sr2/(2*3) + sc
2/2 + sb2)) 1.7 1.3 5.84 0.63 0.16 0.06 0.14 0.13 0.12
Within-laboratory standard deviation (sRW = SQRT(sr2/3 + sc
2)) 0.0 0.9 0.19 0.01 0.01 0.01 0.01 0.01 0.01
Repeatability standard deviation (sr = SQRT(sr2)) 0.0 0.0 0.27 0.03 0.01 0.01 0.01 0.05 0.02
Inter-laboratories precision CV (%) 28.9 28.2 64.81 55.01 50.75 51.90 57.86 137.91 59.57Within-laboratory precision CV (%) 0.2 18.1 2.08 1.11 1.79 8.48 4.83 13.69 4.14Repeatability precision CV (%) 0.4 0.3 2.98 2.76 3.64 11.16 4.63 50.94 8.78Reproducibility limit (R = D(2, 0.95)*sR) 4.63 3.73 16.350 1.770 0.452 0.171 0.400 0.352 0.336Within-laboratory-reproducibility limit (RW = D(2, 0.95)*sRw) 0.03 2.39 0.525 0.036 0.016 0.028 0.033 0.035 0.023Repeatability limit (r = D(3, 0.95)*sr) 0.07 0.04 0.886 0.105 0.038 0.043 0.038 0.153 0.058
StatisticsNo. 091
StatisticsNo. 092
84
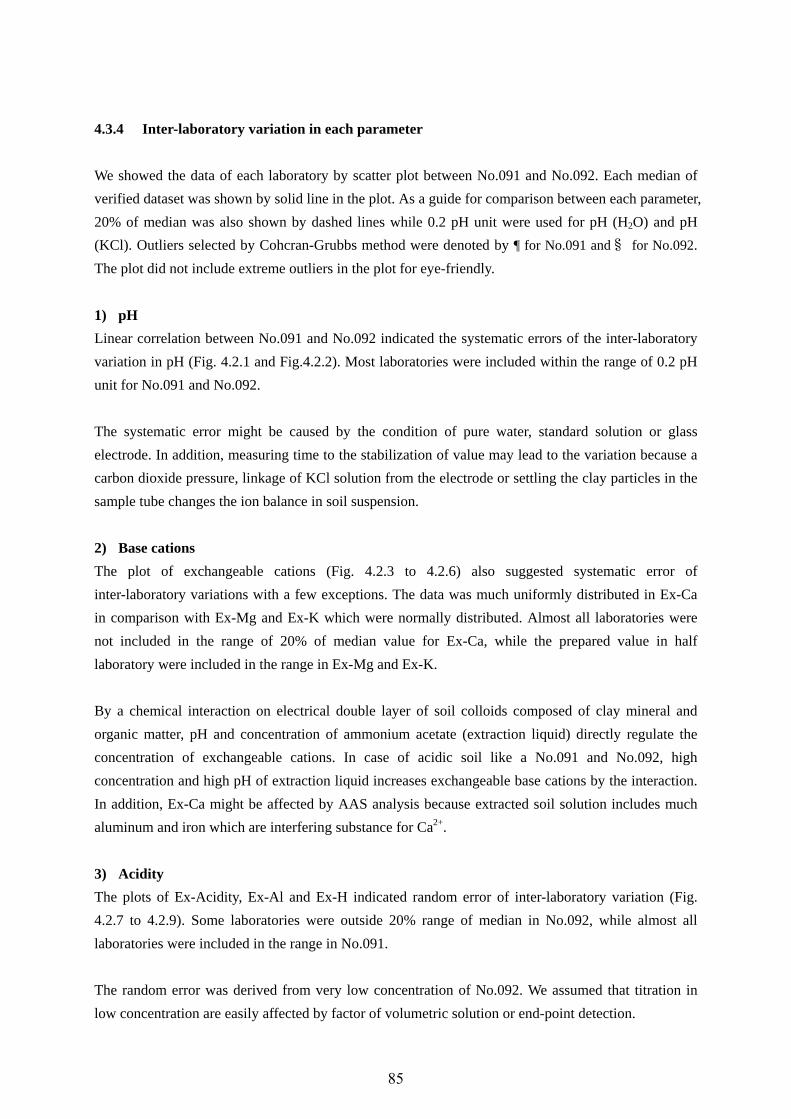
4.3.4 Inter-laboratory variation in each parameter
We showed the data of each laboratory by scatter plot between No.091 and No.092. Each median of
verified dataset was shown by solid line in the plot. As a guide for comparison between each parameter,
20% of median was also shown by dashed lines while 0.2 pH unit were used for pH (H2O) and pH
(KCl). Outliers selected by Cohcran-Grubbs method were denoted by ¶ for No.091 and§ for No.092.
The plot did not include extreme outliers in the plot for eye-friendly.
1) pH
Linear correlation between No.091 and No.092 indicated the systematic errors of the inter-laboratory
variation in pH (Fig. 4.2.1 and Fig.4.2.2). Most laboratories were included within the range of 0.2 pH
unit for No.091 and No.092.
The systematic error might be caused by the condition of pure water, standard solution or glass
electrode. In addition, measuring time to the stabilization of value may lead to the variation because a
carbon dioxide pressure, linkage of KCl solution from the electrode or settling the clay particles in the
sample tube changes the ion balance in soil suspension.
2) Base cations
The plot of exchangeable cations (Fig. 4.2.3 to 4.2.6) also suggested systematic error of
inter-laboratory variations with a few exceptions. The data was much uniformly distributed in Ex-Ca
in comparison with Ex-Mg and Ex-K which were normally distributed. Almost all laboratories were
not included in the range of 20% of median value for Ex-Ca, while the prepared value in half
laboratory were included in the range in Ex-Mg and Ex-K.
By a chemical interaction on electrical double layer of soil colloids composed of clay mineral and
organic matter, pH and concentration of ammonium acetate (extraction liquid) directly regulate the
concentration of exchangeable cations. In case of acidic soil like a No.091 and No.092, high
concentration and high pH of extraction liquid increases exchangeable base cations by the interaction.
In addition, Ex-Ca might be affected by AAS analysis because extracted soil solution includes much
aluminum and iron which are interfering substance for Ca2+.
3) Acidity
The plots of Ex-Acidity, Ex-Al and Ex-H indicated random error of inter-laboratory variation (Fig.
4.2.7 to 4.2.9). Some laboratories were outside 20% range of median in No.092, while almost all
laboratories were included in the range in No.091.
The random error was derived from very low concentration of No.092. We assumed that titration in
low concentration are easily affected by factor of volumetric solution or end-point detection.
85
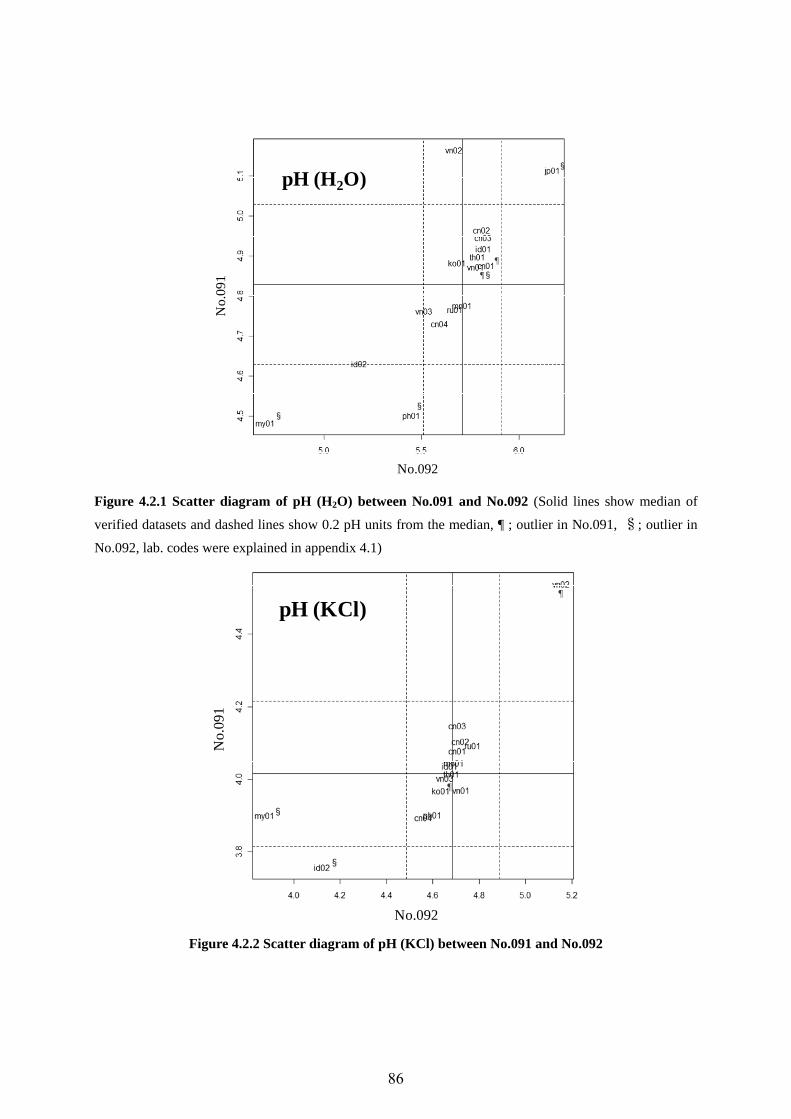
pH (H2O)
No.
091
No.092
¶
¶
§
§§
§
Figure 4.2.1 Scatter diagram of pH (H2O) between No.091 and No.092 (Solid lines show median of
verified datasets and dashed lines show 0.2 pH units from the median, ¶ ; outlier in No.091, §; outlier in
No.092, lab. codes were explained in appendix 4.1)
pH (KCl)
No.
091
No.092
¶
§
¶
§
Figure 4.2.2 Scatter diagram of pH (KCl) between No.091 and No.092
86
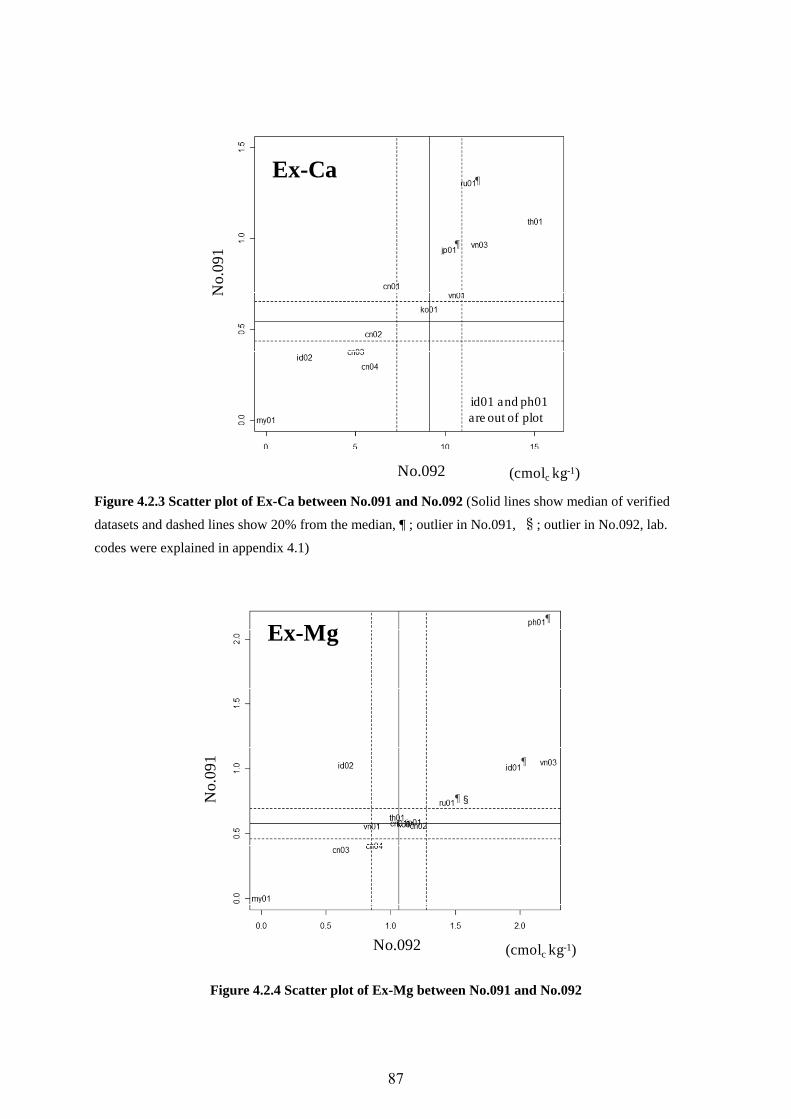
Ex-Ca
No.
091
No.092 (cmolc kg-1)
¶
id01 and ph01 are out of plot
¶
Figure 4.2.3 Scatter plot of Ex-Ca between No.091 and No.092 (Solid lines show median of verified
datasets and dashed lines show 20% from the median, ¶ ; outlier in No.091, §; outlier in No.092, lab.
codes were explained in appendix 4.1)
Ex-Mg
No.
091
No.092 (cmolc kg-1)
¶
¶
¶§
Figure 4.2.4 Scatter plot of Ex-Mg between No.091 and No.092
87
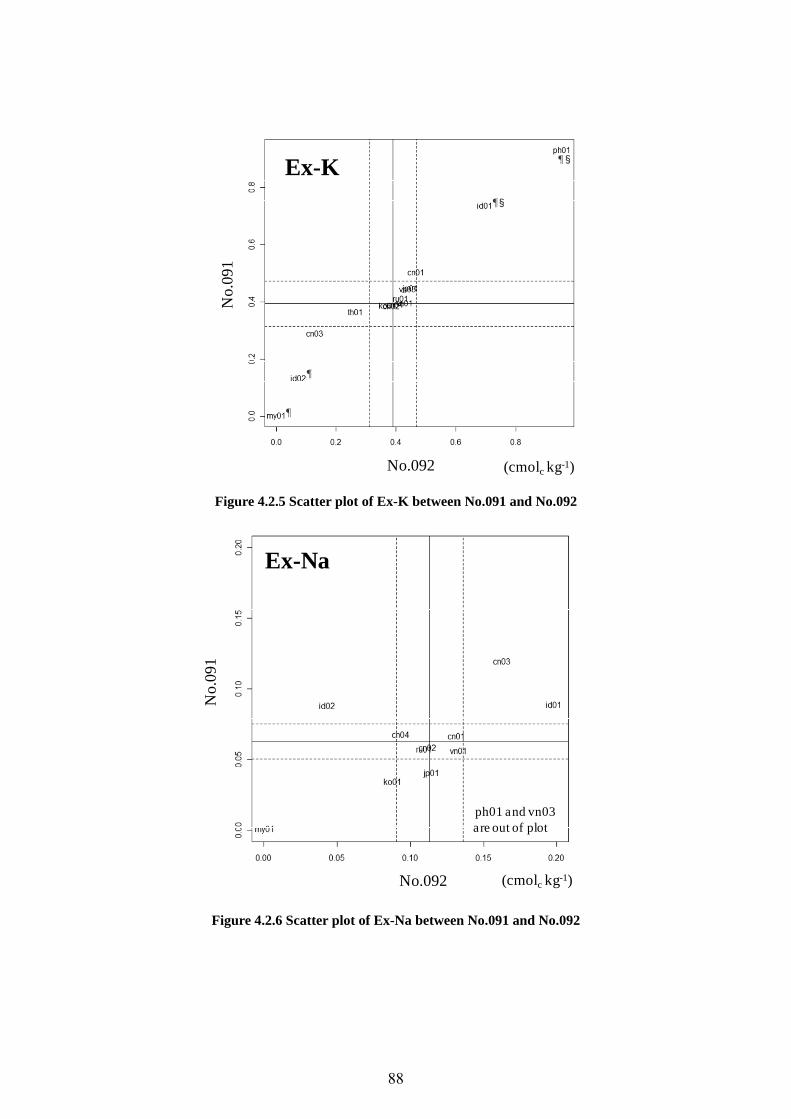
Ex-K
No.
091
No.092 (cmolc kg-1)
¶
¶
¶
¶
§
§
Figure 4.2.5 Scatter plot of Ex-K between No.091 and No.092
Ex-Na
No.
091
No.092 (cmolc kg-1)
ph01 and vn03 are out of plot
Figure 4.2.6 Scatter plot of Ex-Na between No.091 and No.092
88
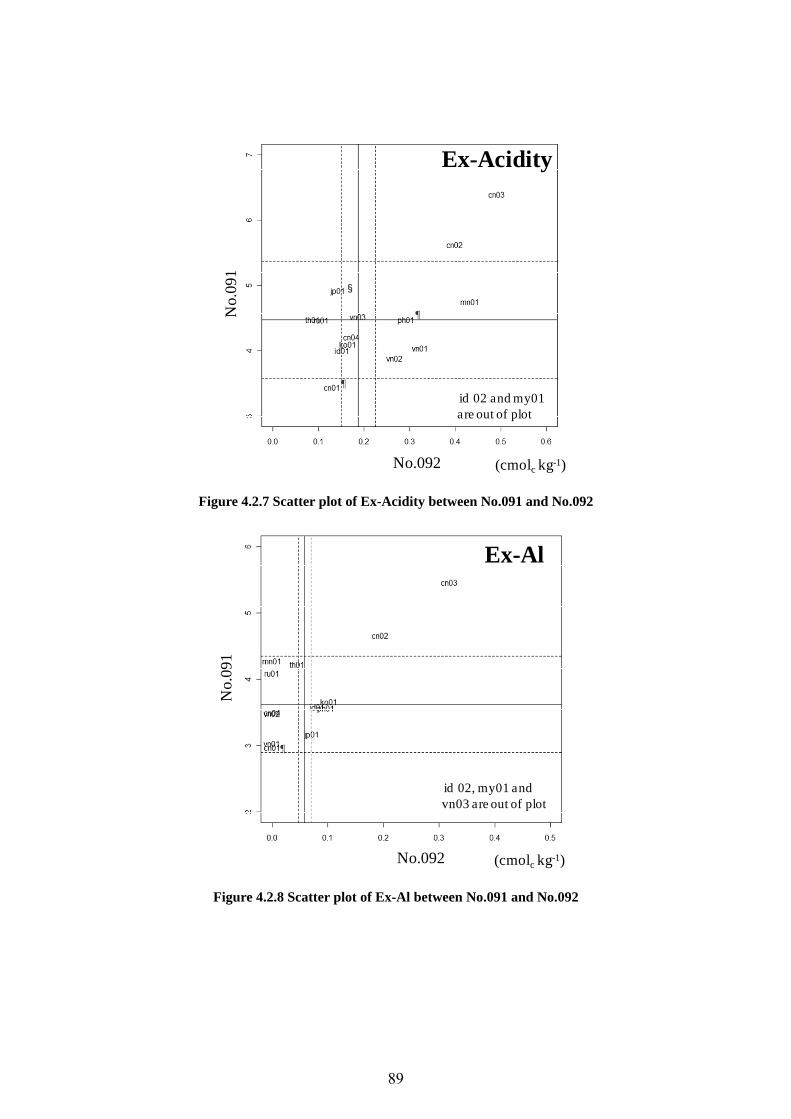
Ex-Acidity
No.
091
No.092 (cmolc kg-1)
¶
¶
id 02 and my01 are out of plot
§
Figure 4.2.7 Scatter plot of Ex-Acidity between No.091 and No.092
Ex-Al
No.
091
No.092 (cmolc kg-1)
id 02, my01 and vn03 are out of plot
¶
Figure 4.2.8 Scatter plot of Ex-Al between No.091 and No.092
89
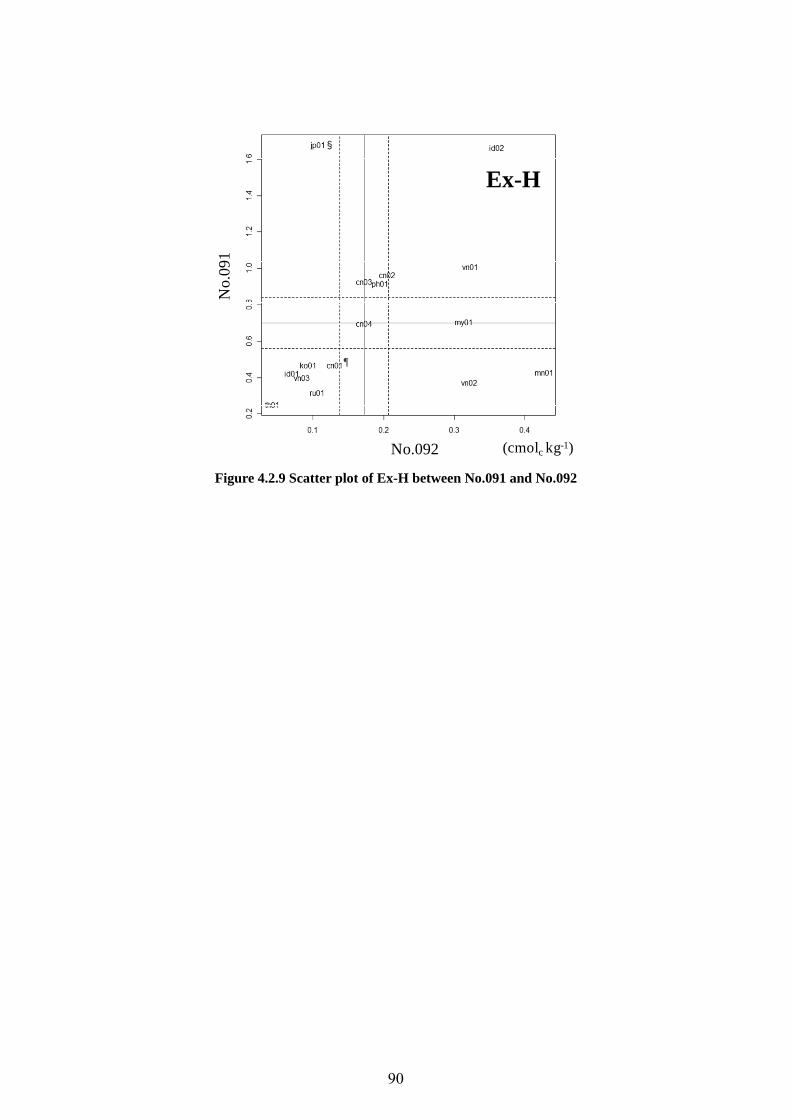
Ex-H
No.
091
No.092 (cmolc kg-1)
§
¶
Figure 4.2.9 Scatter plot of Ex-H between No.091 and No.092
90
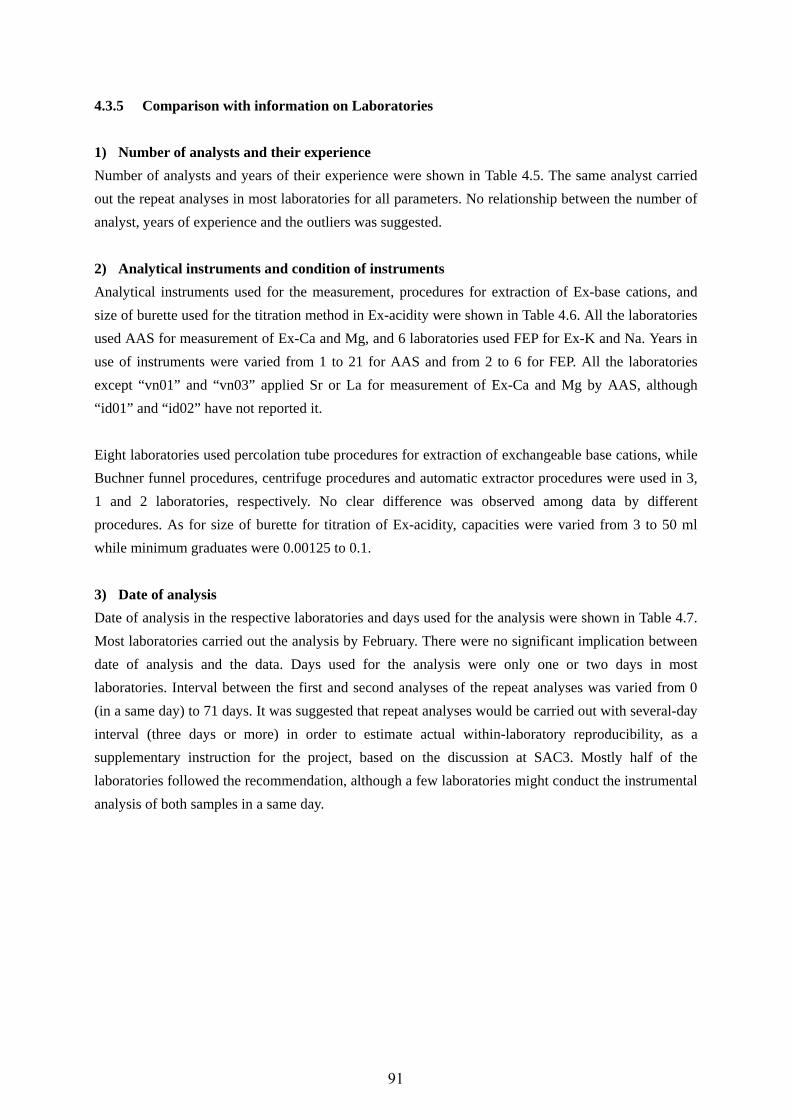
4.3.5 Comparison with information on Laboratories
1) Number of analysts and their experience
Number of analysts and years of their experience were shown in Table 4.5. The same analyst carried
out the repeat analyses in most laboratories for all parameters. No relationship between the number of
analyst, years of experience and the outliers was suggested.
2) Analytical instruments and condition of instruments
Analytical instruments used for the measurement, procedures for extraction of Ex-base cations, and
size of burette used for the titration method in Ex-acidity were shown in Table 4.6. All the laboratories
used AAS for measurement of Ex-Ca and Mg, and 6 laboratories used FEP for Ex-K and Na. Years in
use of instruments were varied from 1 to 21 for AAS and from 2 to 6 for FEP. All the laboratories
except “vn01” and “vn03” applied Sr or La for measurement of Ex-Ca and Mg by AAS, although
“id01” and “id02” have not reported it.
Eight laboratories used percolation tube procedures for extraction of exchangeable base cations, while
Buchner funnel procedures, centrifuge procedures and automatic extractor procedures were used in 3,
1 and 2 laboratories, respectively. No clear difference was observed among data by different
procedures. As for size of burette for titration of Ex-acidity, capacities were varied from 3 to 50 ml
while minimum graduates were 0.00125 to 0.1.
3) Date of analysis
Date of analysis in the respective laboratories and days used for the analysis were shown in Table 4.7.
Most laboratories carried out the analysis by February. There were no significant implication between
date of analysis and the data. Days used for the analysis were only one or two days in most
laboratories. Interval between the first and second analyses of the repeat analyses was varied from 0
(in a same day) to 71 days. It was suggested that repeat analyses would be carried out with several-day
interval (three days or more) in order to estimate actual within-laboratory reproducibility, as a
supplementary instruction for the project, based on the discussion at SAC3. Mostly half of the
laboratories followed the recommendation, although a few laboratories might conduct the instrumental
analysis of both samples in a same day.
91
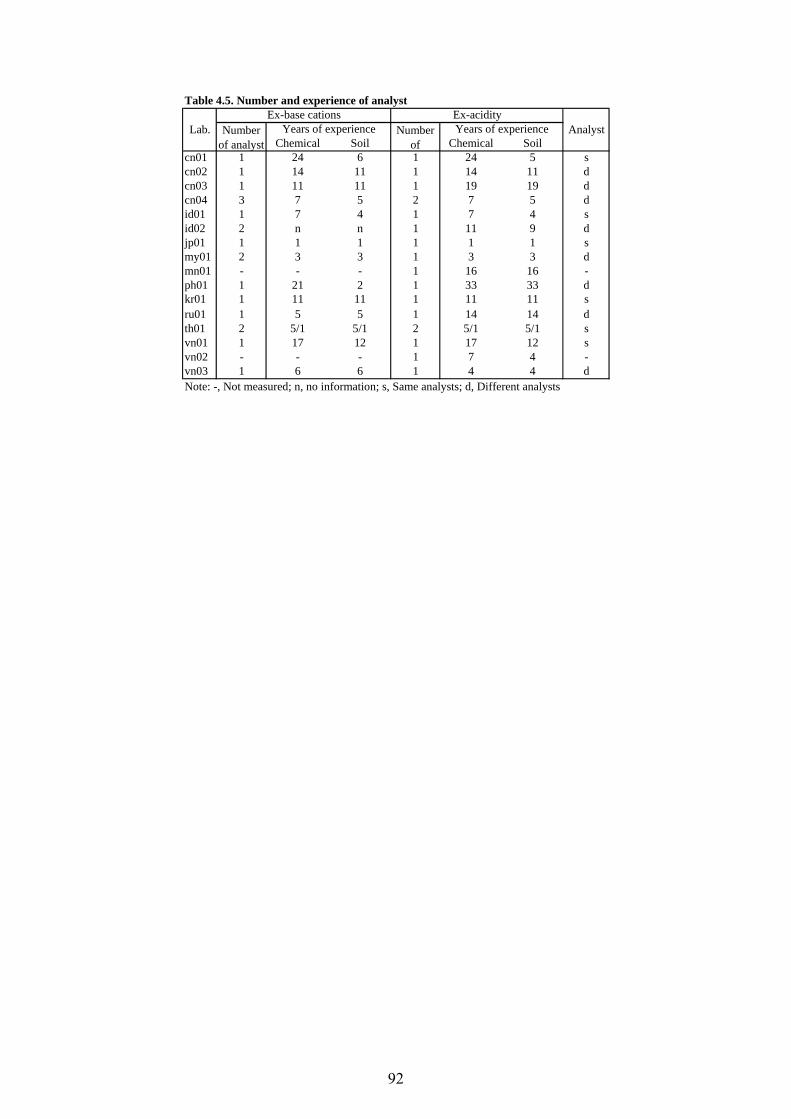
Table 4.5. Number and experience of analyst
Chemical Soil Chemical Soilcn01 1 24 6 1 24 5 scn02 1 14 11 1 14 11 dcn03 1 11 11 1 19 19 dcn04 3 7 5 2 7 5 did01 1 7 4 1 7 4 sid02 2 n n 1 11 9 djp01 1 1 1 1 1 1 smy01 2 3 3 1 3 3 dmn01 - - - 1 16 16 -ph01 1 21 2 1 33 33 dkr01 1 11 11 1 11 11 sru01 1 5 5 1 14 14 dth01 2 5/1 5/1 2 5/1 5/1 svn01 1 17 12 1 17 12 svn02 - - - 1 7 4 -vn03 1 6 6 1 4 4 dNote: -, Not measured; n, no information; s, Same analysts; d, Different analysts
Ex-base cations Ex-acidityLab. AnalystNumber
of analystNumber
ofYears of experience Years of experience
92
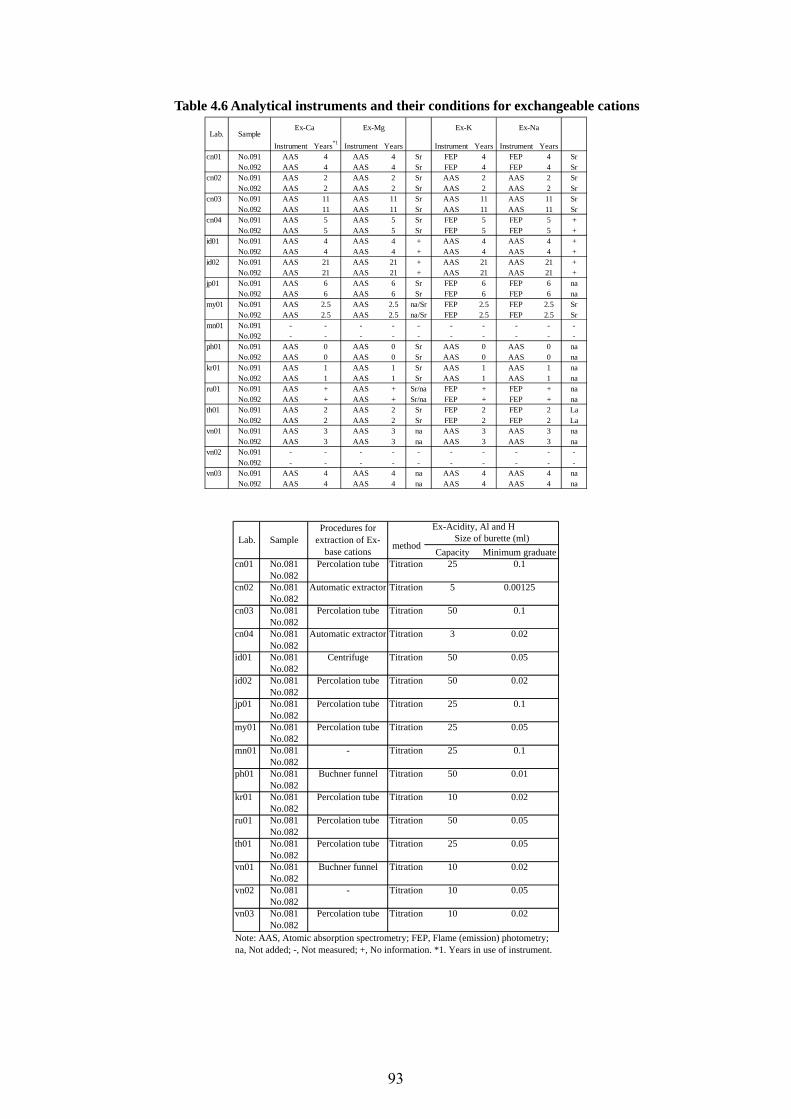
Table 4.6 Analytical instruments and their conditions for exchangeable cations
Instrument Years*1
Instrument Years Instrument Years Instrument Yearscn01 No.091 AAS 4 AAS 4 Sr FEP 4 FEP 4 Sr
No.092 AAS 4 AAS 4 Sr FEP 4 FEP 4 Srcn02 No.091 AAS 2 AAS 2 Sr AAS 2 AAS 2 Sr
No.092 AAS 2 AAS 2 Sr AAS 2 AAS 2 Srcn03 No.091 AAS 11 AAS 11 Sr AAS 11 AAS 11 Sr
No.092 AAS 11 AAS 11 Sr AAS 11 AAS 11 Srcn04 No.091 AAS 5 AAS 5 Sr FEP 5 FEP 5 +
No.092 AAS 5 AAS 5 Sr FEP 5 FEP 5 +id01 No.091 AAS 4 AAS 4 + AAS 4 AAS 4 +
No.092 AAS 4 AAS 4 + AAS 4 AAS 4 +id02 No.091 AAS 21 AAS 21 + AAS 21 AAS 21 +
No.092 AAS 21 AAS 21 + AAS 21 AAS 21 +jp01 No.091 AAS 6 AAS 6 Sr FEP 6 FEP 6 na
No.092 AAS 6 AAS 6 Sr FEP 6 FEP 6 namy01 No.091 AAS 2.5 AAS 2.5 na/Sr FEP 2.5 FEP 2.5 Sr
No.092 AAS 2.5 AAS 2.5 na/Sr FEP 2.5 FEP 2.5 Srmn01 No.091 - - - - - - - - - -
No.092 - - - - - - - - - -ph01 No.091 AAS 0 AAS 0 Sr AAS 0 AAS 0 na
No.092 AAS 0 AAS 0 Sr AAS 0 AAS 0 nakr01 No.091 AAS 1 AAS 1 Sr AAS 1 AAS 1 na
No.092 AAS 1 AAS 1 Sr AAS 1 AAS 1 naru01 No.091 AAS + AAS + Sr/na FEP + FEP + na
No.092 AAS + AAS + Sr/na FEP + FEP + nath01 No.091 AAS 2 AAS 2 Sr FEP 2 FEP 2 La
No.092 AAS 2 AAS 2 Sr FEP 2 FEP 2 Lavn01 No.091 AAS 3 AAS 3 na AAS 3 AAS 3 na
No.092 AAS 3 AAS 3 na AAS 3 AAS 3 navn02 No.091 - - - - - - - - - -
No.092 - - - - - - - - - -vn03 No.091 AAS 4 AAS 4 na AAS 4 AAS 4 na
No.092 AAS 4 AAS 4 na AAS 4 AAS 4 na
Ex-Ca Ex-Mg Ex-K Ex-NaSampleLab.
Capacity Minimum graduatecn01 No.081 Percolation tube Titration 25 0.1
No.082cn02 No.081 Automatic extractor Titration 5 0.00125
No.082cn03 No.081 Percolation tube Titration 50 0.1
No.082cn04 No.081 Automatic extractor Titration 3 0.02
No.082id01 No.081 Centrifuge Titration 50 0.05
No.082id02 No.081 Percolation tube Titration 50 0.02
No.082jp01 No.081 Percolation tube Titration 25 0.1
No.082my01 No.081 Percolation tube Titration 25 0.05
No.082mn01 No.081 - Titration 25 0.1
No.082ph01 No.081 Buchner funnel Titration 50 0.01
No.082kr01 No.081 Percolation tube Titration 10 0.02
No.082ru01 No.081 Percolation tube Titration 50 0.05
No.082th01 No.081 Percolation tube Titration 25 0.05
No.082vn01 No.081 Buchner funnel Titration 10 0.02
No.082vn02 No.081 - Titration 10 0.05
No.082vn03 No.081 Percolation tube Titration 10 0.02
No.082Note: AAS, Atomic absorption spectrometry; FEP, Flame (emission) photometry;na, Not added; -, Not measured; +, No information. *1. Years in use of instrument.
Procedures forextraction of Ex-
base cations
Ex-Acidity, Al and H
methodSize of burette (ml)Lab. Sample
93
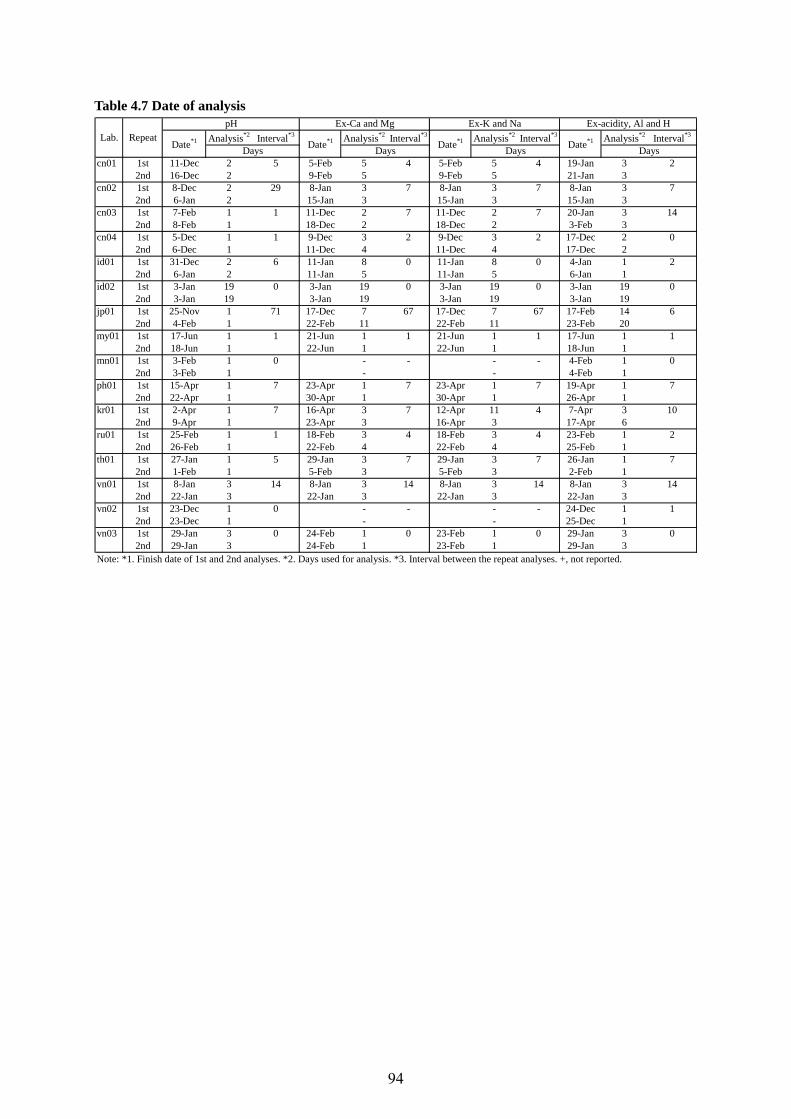
Table 4.7 Date of analysis
Analysis*2 Interval*3 Analysis*2 Interval*3 Analysis*2 Interval*3 Analysis*2 Interval*3
cn01 1st 11-Dec 2 5 5-Feb 5 4 5-Feb 5 4 19-Jan 3 22nd 16-Dec 2 9-Feb 5 9-Feb 5 21-Jan 3
cn02 1st 8-Dec 2 29 8-Jan 3 7 8-Jan 3 7 8-Jan 3 72nd 6-Jan 2 15-Jan 3 15-Jan 3 15-Jan 3
cn03 1st 7-Feb 1 1 11-Dec 2 7 11-Dec 2 7 20-Jan 3 142nd 8-Feb 1 18-Dec 2 18-Dec 2 3-Feb 3
cn04 1st 5-Dec 1 1 9-Dec 3 2 9-Dec 3 2 17-Dec 2 02nd 6-Dec 1 11-Dec 4 11-Dec 4 17-Dec 2
id01 1st 31-Dec 2 6 11-Jan 8 0 11-Jan 8 0 4-Jan 1 22nd 6-Jan 2 11-Jan 5 11-Jan 5 6-Jan 1
id02 1st 3-Jan 19 0 3-Jan 19 0 3-Jan 19 0 3-Jan 19 02nd 3-Jan 19 3-Jan 19 3-Jan 19 3-Jan 19
jp01 1st 25-Nov 1 71 17-Dec 7 67 17-Dec 7 67 17-Feb 14 62nd 4-Feb 1 22-Feb 11 22-Feb 11 23-Feb 20
my01 1st 17-Jun 1 1 21-Jun 1 1 21-Jun 1 1 17-Jun 1 12nd 18-Jun 1 22-Jun 1 22-Jun 1 18-Jun 1
mn01 1st 3-Feb 1 0 - - - - 4-Feb 1 02nd 3-Feb 1 - - 4-Feb 1
ph01 1st 15-Apr 1 7 23-Apr 1 7 23-Apr 1 7 19-Apr 1 72nd 22-Apr 1 30-Apr 1 30-Apr 1 26-Apr 1
kr01 1st 2-Apr 1 7 16-Apr 3 7 12-Apr 11 4 7-Apr 3 102nd 9-Apr 1 23-Apr 3 16-Apr 3 17-Apr 6
ru01 1st 25-Feb 1 1 18-Feb 3 4 18-Feb 3 4 23-Feb 1 22nd 26-Feb 1 22-Feb 4 22-Feb 4 25-Feb 1
th01 1st 27-Jan 1 5 29-Jan 3 7 29-Jan 3 7 26-Jan 1 72nd 1-Feb 1 5-Feb 3 5-Feb 3 2-Feb 1
vn01 1st 8-Jan 3 14 8-Jan 3 14 8-Jan 3 14 8-Jan 3 142nd 22-Jan 3 22-Jan 3 22-Jan 3 22-Jan 3
vn02 1st 23-Dec 1 0 - - - - 24-Dec 1 12nd 23-Dec 1 - - 25-Dec 1
vn03 1st 29-Jan 3 0 24-Feb 1 0 23-Feb 1 0 29-Jan 3 02nd 29-Jan 3 24-Feb 1 23-Feb 1 29-Jan 3
Note: *1. Finish date of 1st and 2nd analyses. *2. Days used for analysis. *3. Interval between the repeat analyses. +, not reported.
Lab. Repeat
Ex-Ca and Mg Ex-acidity, Al and H
Days Days Days
pH
Date*1 Date*1 Date*1
Ex-K and Na
Date*1
Days
94
4.4 Comparison with past surveys
Inter-laboratory variations in pH (H2O) and pH (KCl) were very small during 2002 to 2009, as shown
by CVs less than 10%. The ranges from upper to lower quartile, which are indicated by box, are kept
within 0.2 pH units in almost all samples (Figure 4.4). We speculate from the figure that participating
countries can detect the difference of around 0.5 pH unit. Meanwhile, there were a few extreme
outliers in each sample. This outlier might be critical for the temporal variation within the same plot.
Inter-laboratory variation in Ex-Ca and Ex-Acidity were shown on the scales of high concentration
and low concentration (Figure 4.4). Large variation in Ex-Ca has been observed for 8 years, as shown
by CVs more than 50%. On a large scale (0 to 15 cmolc kg-1) we can detect the difference between the
sample more than 2 or 3 cmolc kg-1 (high concentration sample) and the others (low concentration
sample). However, at the area of low concentration, inter-laboratory variation might be well over the
difference between the samples. Because exchangeable base cations do not drastically change in time
at the same site, accuracy of analysis should be improved in the participating country covered with
poor-nutrient soils (e.g. tropical soil or undeveloped soil like a desert). In addition, the minimum
values of Ex-Ca were very low in almost all samples, even if the median value were very high. We
propose that the laboratory providing the minimum value has a fatal fault for measuring the
exchangeable base cations (e.g. background of extraction liquid, maintenance of AAS and so on).
Inter-laboratory variations in Ex-Acidity were relatively small in comparison with Ex-Ca, except the
samples of very low concentration (e.g. No.052 and No.092). From each range as shown by boxes, we
assume that participating country can enough detect the temporal variation in soil acidity of not only
strong acidic soil but also moderately or weakly acidic soil.
4.5 Recommendations for Improvement
Inter-laboratory variation is enough small to detect the change of general soil acidity (pH and
Ex-Acidity) in participating countries. Meanwhile, a few outliers may affect the detection of temporal
variation in the same site. Therefore, reducing the outliers of pH and Ex-Acidity should be considered
firstly. The condition of glass electrode, standard solution, KCl solution should be checked.
In this time, we found the clear systematic error of inter-laboratory variations in exchangeable cations
(Figure 4.2.3 to 4.2.5), that is, the variation is not derived from specific error of laboratories or analyst.
The result suggests that a careful preparing the extraction liquid (ammonium acetate) or appropriate
AAS analysis in each laboratory improve the large variation in exchangeable cations.
Not only analytical procedures but also reporting procedures should be checked carefully in the
respective laboratories.
95
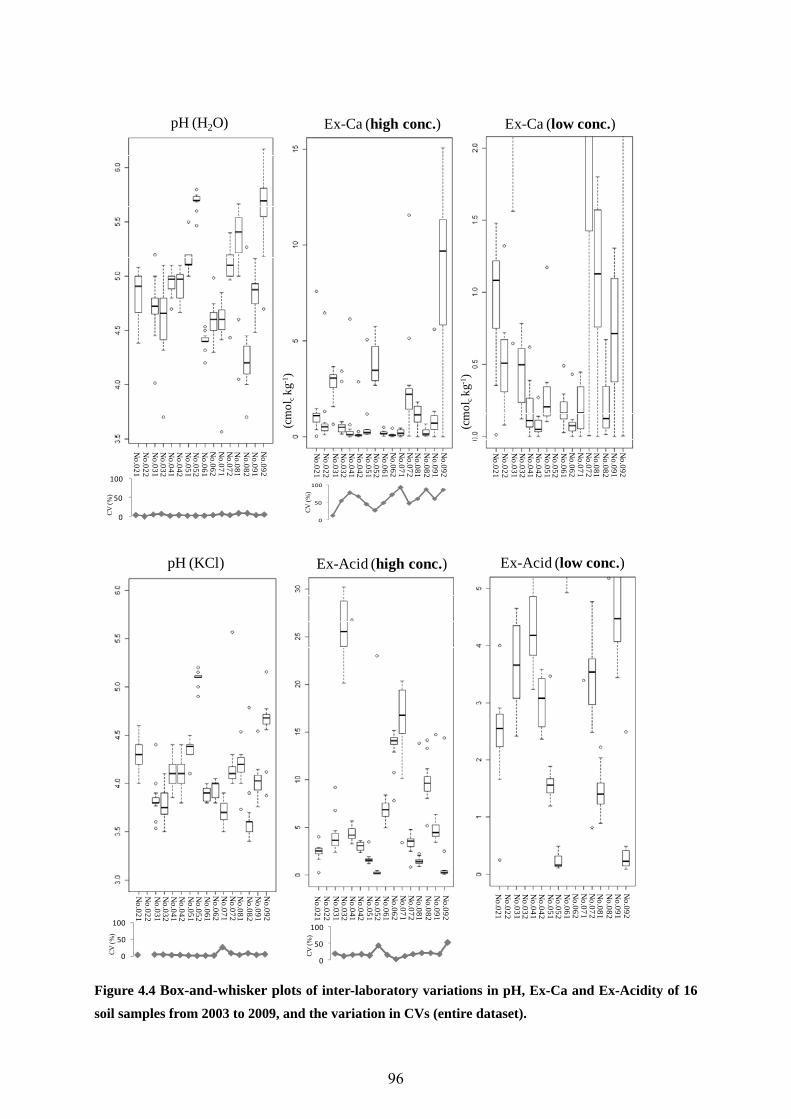
Ex-Ca (high conc.) Ex-Ca (low conc.)
No.091
No.092
No.082
No.081
No.072
No.071
No.062
No.061
No.052
No.051
No.042
No.041
No.032
No.031
No.022
No.021
No.091
No.092
No.082
No.081
No.072
No.071
No.062
No.061
No.052
No.051
No.042
No.041
No.032
No.031
No.022
No.021
CV
(%)
0
50
100
pH (H2O)
No.091
No.092
No.082
No.081
No.072
No.071
No.062
No.061
No.052
No.051
No.042
No.041
No.032
No.031
No.022
No.021
0
50
100
CV
(%)
(cm
olckg
-1)
(cm
olckg
-1)
Ex-Acid (high conc.) Ex-Acid (low conc.)
No.091
No.092
No.082
No.081
No.072
No.071
No.062
No.061
No.052
No.051
No.042
No.041
No.032
No.031
No.022
No.021
No.091
No.092
No.082
No.081
No.072
No.071
No.062
No.061
No.052
No.051
No.042
No.041
No.032
No.031
No.022
No.021
0
50
100
CV
(%)
pH (KCl)
No.091
No.092
No.082
No.081
No.072
No.071
No.062
No.061
No.052
No.051
No.042
No.041
No.032
No.031
No.022
No.021
0
50
100
CV
(%)
Figure 4.4 Box-and-whisker plots of inter-laboratory variations in pH, Ex-Ca and Ex-Acidity of 16
soil samples from 2003 to 2009, and the variation in CVs (entire dataset).
96
References
1) Environment Agency, Government of Japan, 1997. Monitoring Guidelines and Technical Manuals
for Soil and Vegetation Monitoring.
2) EANET, 2000. The Second Interim Scientific Advisory Group Meeting of Acid Deposition
Monitoring Network in East Asia (2000): Technical Manuals for Soil and Vegetation Monitoring
in East Asia.
3) Japanese Standard Association, 1991. General rules for permissible tolerance of chemical analyses
and physical tests (JIS Z-8402-1991), Japanese Industrial Standard.
4) Acid Deposition and Oxidant Research Center, 2001a. Report of the inter-laboratory comparison
project 1999 on soil.
5) Acid Deposition and Oxidant Research Center, 2001b. Report of the inter-laboratory comparison
project 2000 on soil.
6) Acid Deposition and Oxidant Research Center, 2002. Report of the inter-laboratory comparison
project 2001 on soil.
97
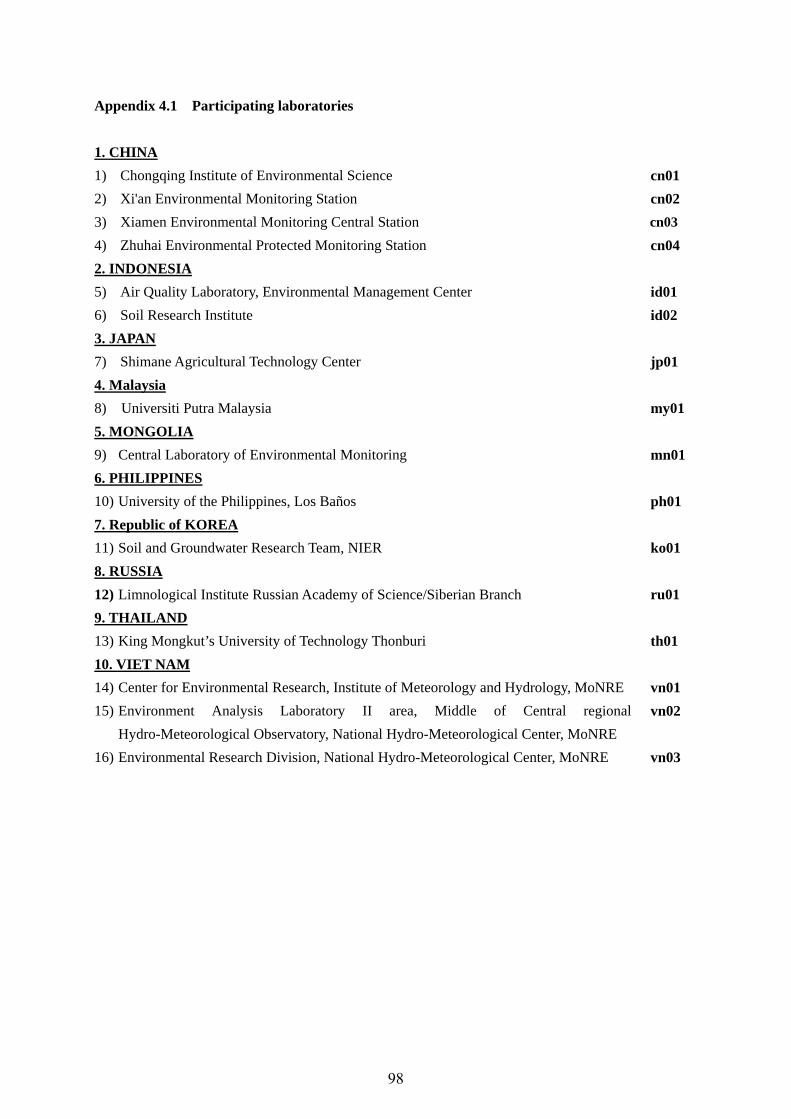
Appendix 4.1 Participating laboratories
1. CHINA
1) Chongqing Institute of Environmental Science cn01
2) Xi'an Environmental Monitoring Station cn02
3) Xiamen Environmental Monitoring Central Station cn03
4) Zhuhai Environmental Protected Monitoring Station cn04
2. INDONESIA
5) Air Quality Laboratory, Environmental Management Center id01
6) Soil Research Institute id02
3. JAPAN
7) Shimane Agricultural Technology Center jp01
4. Malaysia
8) Universiti Putra Malaysia
my01
5. MONGOLIA
9) Central Laboratory of Environmental Monitoring mn01
6. PHILIPPINES
10) University of the Philippines, Los Baños ph01
7. Republic of KOREA
11) Soil and Groundwater Research Team, NIER ko01
8. RUSSIA
12) Limnological Institute Russian Academy of Science/Siberian Branch ru01
9. THAILAND
13) King Mongkut’s University of Technology Thonburi th01
10. VIET NAM
14) Center for Environmental Research, Institute of Meteorology and Hydrology, MoNRE vn01
15) Environment Analysis Laboratory II area, Middle of Central regional
Hydro-Meteorological Observatory, National Hydro-Meteorological Center, MoNRE
vn02
16) Environmental Research Division, National Hydro-Meteorological Center, MoNRE vn03
98
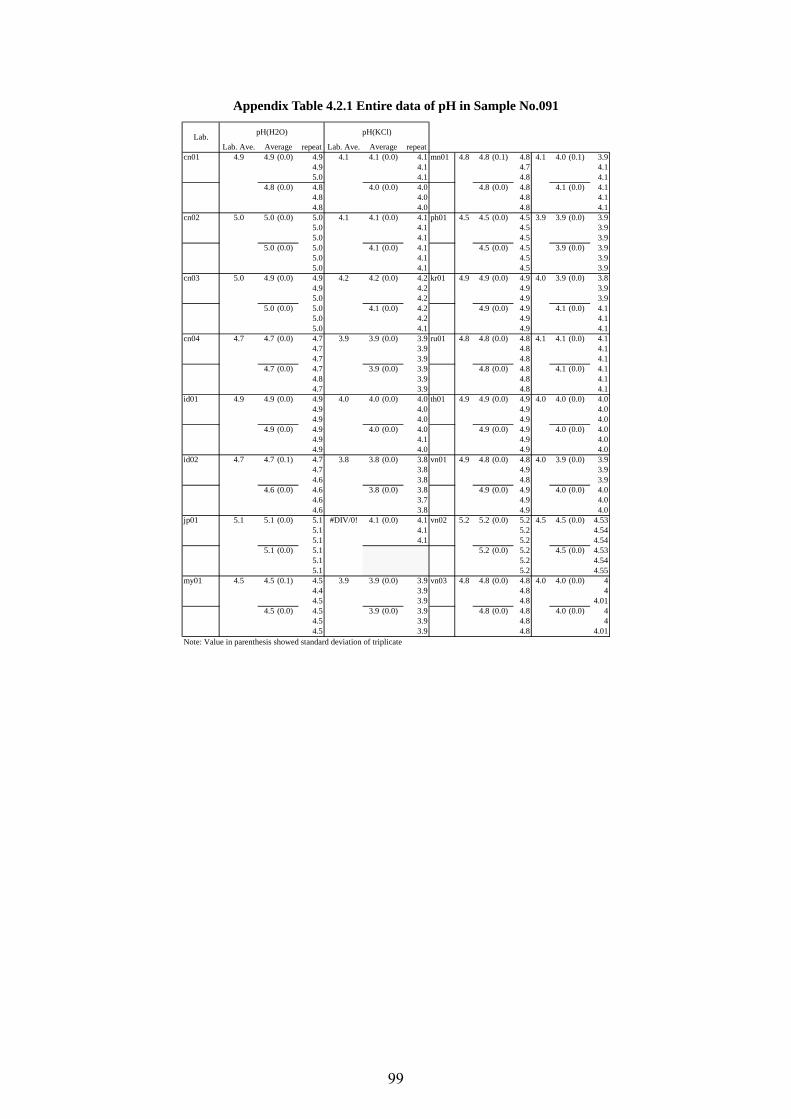
Appendix Table 4.2.1 Entire data of pH in Sample No.091
Lab. Ave. repeat Lab. Ave. repeatcn01 4.9 4.9 (0.0) 4.9 4.1 4.1 (0.0) 4.1 mn01 4.8 4.8 (0.1) 4.8 4.1 4.0 (0.1) 3.9
4.9 4.1 4.7 4.15.0 4.1 4.8 4.1
4.8 (0.0) 4.8 4.0 (0.0) 4.0 4.8 (0.0) 4.8 4.1 (0.0) 4.14.8 4.0 4.8 4.14.8 4.0 4.8 4.1
cn02 5.0 5.0 (0.0) 5.0 4.1 4.1 (0.0) 4.1 ph01 4.5 4.5 (0.0) 4.5 3.9 3.9 (0.0) 3.95.0 4.1 4.5 3.95.0 4.1 4.5 3.9
5.0 (0.0) 5.0 4.1 (0.0) 4.1 4.5 (0.0) 4.5 3.9 (0.0) 3.95.0 4.1 4.5 3.95.0 4.1 4.5 3.9
cn03 5.0 4.9 (0.0) 4.9 4.2 4.2 (0.0) 4.2 kr01 4.9 4.9 (0.0) 4.9 4.0 3.9 (0.0) 3.84.9 4.2 4.9 3.95.0 4.2 4.9 3.9
5.0 (0.0) 5.0 4.1 (0.0) 4.2 4.9 (0.0) 4.9 4.1 (0.0) 4.15.0 4.2 4.9 4.15.0 4.1 4.9 4.1
cn04 4.7 4.7 (0.0) 4.7 3.9 3.9 (0.0) 3.9 ru01 4.8 4.8 (0.0) 4.8 4.1 4.1 (0.0) 4.14.7 3.9 4.8 4.14.7 3.9 4.8 4.1
4.7 (0.0) 4.7 3.9 (0.0) 3.9 4.8 (0.0) 4.8 4.1 (0.0) 4.14.8 3.9 4.8 4.14.7 3.9 4.8 4.1
id01 4.9 4.9 (0.0) 4.9 4.0 4.0 (0.0) 4.0 th01 4.9 4.9 (0.0) 4.9 4.0 4.0 (0.0) 4.04.9 4.0 4.9 4.04.9 4.0 4.9 4.0
4.9 (0.0) 4.9 4.0 (0.0) 4.0 4.9 (0.0) 4.9 4.0 (0.0) 4.04.9 4.1 4.9 4.04.9 4.0 4.9 4.0
id02 4.7 4.7 (0.1) 4.7 3.8 3.8 (0.0) 3.8 vn01 4.9 4.8 (0.0) 4.8 4.0 3.9 (0.0) 3.94.7 3.8 4.9 3.94.6 3.8 4.8 3.9
4.6 (0.0) 4.6 3.8 (0.0) 3.8 4.9 (0.0) 4.9 4.0 (0.0) 4.04.6 3.7 4.9 4.04.6 3.8 4.9 4.0
jp01 5.1 5.1 (0.0) 5.1 #DIV/0! 4.1 (0.0) 4.1 vn02 5.2 5.2 (0.0) 5.2 4.5 4.5 (0.0) 4.535.1 4.1 5.2 4.545.1 4.1 5.2 4.54
5.1 (0.0) 5.1 5.2 (0.0) 5.2 4.5 (0.0) 4.535.1 5.2 4.545.1 5.2 4.55
my01 4.5 4.5 (0.1) 4.5 3.9 3.9 (0.0) 3.9 vn03 4.8 4.8 (0.0) 4.8 4.0 4.0 (0.0) 44.4 3.9 4.8 44.5 3.9 4.8 4.01
4.5 (0.0) 4.5 3.9 (0.0) 3.9 4.8 (0.0) 4.8 4.0 (0.0) 44.5 3.9 4.8 44.5 3.9 4.8 4.01
Note: Value in parenthesis showed standard deviation of triplicate
Lab.pH(H2O) pH(KCl)
Average Average
99
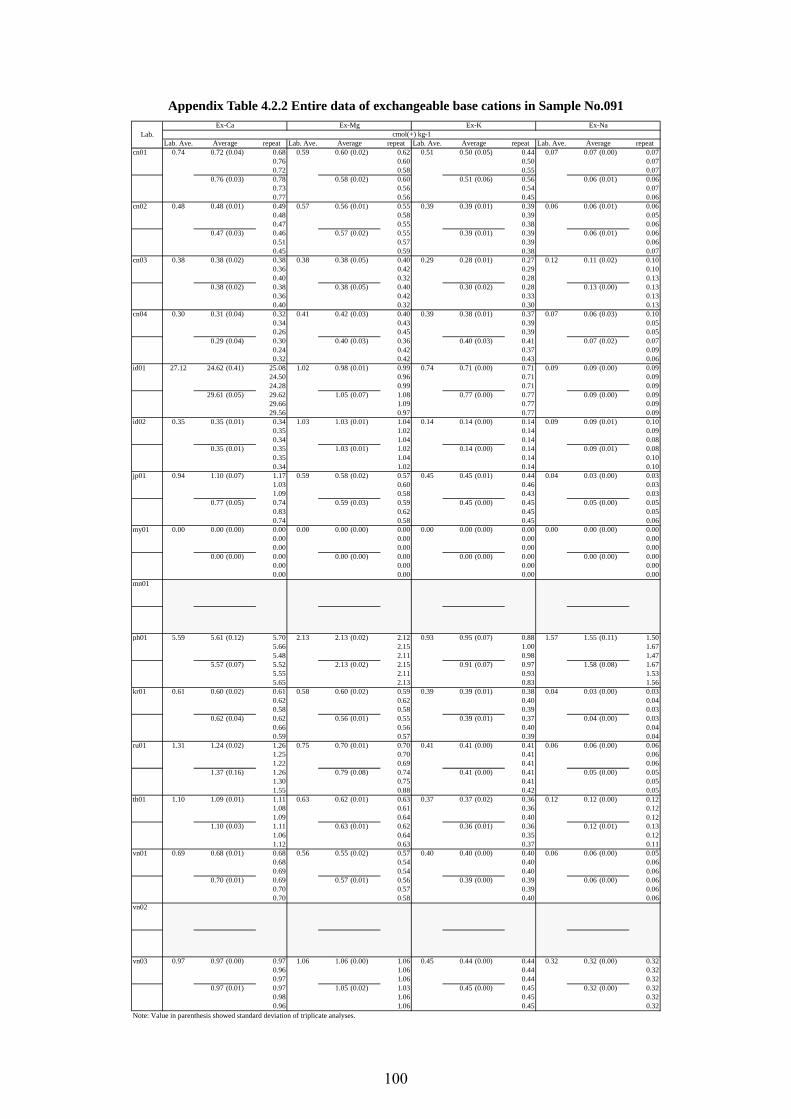
Appendix Table 4.2.2 Entire data of exchangeable base cations in Sample No.091
Lab. Ave. repeat Lab. Ave. repeat Lab. Ave. repeat Lab. Ave. repeatcn01 0.74 0.72 (0.04) 0.68 0.59 0.60 (0.02) 0.62 0.51 0.50 (0.05) 0.44 0.07 0.07 (0.00) 0.07
0.76 0.60 0.50 0.070.72 0.58 0.55 0.07
0.76 (0.03) 0.78 0.58 (0.02) 0.60 0.51 (0.06) 0.56 0.06 (0.01) 0.060.73 0.56 0.54 0.070.77 0.56 0.45 0.06
cn02 0.48 0.48 (0.01) 0.49 0.57 0.56 (0.01) 0.55 0.39 0.39 (0.01) 0.39 0.06 0.06 (0.01) 0.060.48 0.58 0.39 0.050.47 0.55 0.38 0.06
0.47 (0.03) 0.46 0.57 (0.02) 0.55 0.39 (0.01) 0.39 0.06 (0.01) 0.060.51 0.57 0.39 0.060.45 0.59 0.38 0.07
cn03 0.38 0.38 (0.02) 0.38 0.38 0.38 (0.05) 0.40 0.29 0.28 (0.01) 0.27 0.12 0.11 (0.02) 0.100.36 0.42 0.29 0.100.40 0.32 0.28 0.13
0.38 (0.02) 0.38 0.38 (0.05) 0.40 0.30 (0.02) 0.28 0.13 (0.00) 0.130.36 0.42 0.33 0.130.40 0.32 0.30 0.13
cn04 0.30 0.31 (0.04) 0.32 0.41 0.42 (0.03) 0.40 0.39 0.38 (0.01) 0.37 0.07 0.06 (0.03) 0.100.34 0.43 0.39 0.050.26 0.45 0.39 0.05
0.29 (0.04) 0.30 0.40 (0.03) 0.36 0.40 (0.03) 0.41 0.07 (0.02) 0.070.24 0.42 0.37 0.090.32 0.42 0.43 0.06
id01 27.12 24.62 (0.41) 25.08 1.02 0.98 (0.01) 0.99 0.74 0.71 (0.00) 0.71 0.09 0.09 (0.00) 0.0924.50 0.96 0.71 0.0924.28 0.99 0.71 0.09
29.61 (0.05) 29.62 1.05 (0.07) 1.08 0.77 (0.00) 0.77 0.09 (0.00) 0.0929.66 1.09 0.77 0.0929.56 0.97 0.77 0.09
id02 0.35 0.35 (0.01) 0.34 1.03 1.03 (0.01) 1.04 0.14 0.14 (0.00) 0.14 0.09 0.09 (0.01) 0.100.35 1.02 0.14 0.090.34 1.04 0.14 0.08
0.35 (0.01) 0.35 1.03 (0.01) 1.02 0.14 (0.00) 0.14 0.09 (0.01) 0.080.35 1.04 0.14 0.100.34 1.02 0.14 0.10
jp01 0.94 1.10 (0.07) 1.17 0.59 0.58 (0.02) 0.57 0.45 0.45 (0.01) 0.44 0.04 0.03 (0.00) 0.031.03 0.60 0.46 0.031.09 0.58 0.43 0.03
0.77 (0.05) 0.74 0.59 (0.03) 0.59 0.45 (0.00) 0.45 0.05 (0.00) 0.050.83 0.62 0.45 0.050.74 0.58 0.45 0.06
my01 0.00 0.00 (0.00) 0.00 0.00 0.00 (0.00) 0.00 0.00 0.00 (0.00) 0.00 0.00 0.00 (0.00) 0.000.00 0.00 0.00 0.000.00 0.00 0.00 0.00
0.00 (0.00) 0.00 0.00 (0.00) 0.00 0.00 (0.00) 0.00 0.00 (0.00) 0.000.00 0.00 0.00 0.000.00 0.00 0.00 0.00
mn01
ph01 5.59 5.61 (0.12) 5.70 2.13 2.13 (0.02) 2.12 0.93 0.95 (0.07) 0.88 1.57 1.55 (0.11) 1.505.66 2.15 1.00 1.675.48 2.11 0.98 1.47
5.57 (0.07) 5.52 2.13 (0.02) 2.15 0.91 (0.07) 0.97 1.58 (0.08) 1.675.55 2.11 0.93 1.535.65 2.13 0.83 1.56
kr01 0.61 0.60 (0.02) 0.61 0.58 0.60 (0.02) 0.59 0.39 0.39 (0.01) 0.38 0.04 0.03 (0.00) 0.030.62 0.62 0.40 0.040.58 0.58 0.39 0.03
0.62 (0.04) 0.62 0.56 (0.01) 0.55 0.39 (0.01) 0.37 0.04 (0.00) 0.030.66 0.56 0.40 0.040.59 0.57 0.39 0.04
ru01 1.31 1.24 (0.02) 1.26 0.75 0.70 (0.01) 0.70 0.41 0.41 (0.00) 0.41 0.06 0.06 (0.00) 0.061.25 0.70 0.41 0.061.22 0.69 0.41 0.06
1.37 (0.16) 1.26 0.79 (0.08) 0.74 0.41 (0.00) 0.41 0.05 (0.00) 0.051.30 0.75 0.41 0.051.55 0.88 0.42 0.05
th01 1.10 1.09 (0.01) 1.11 0.63 0.62 (0.01) 0.63 0.37 0.37 (0.02) 0.36 0.12 0.12 (0.00) 0.121.08 0.61 0.36 0.121.09 0.64 0.40 0.12
1.10 (0.03) 1.11 0.63 (0.01) 0.62 0.36 (0.01) 0.36 0.12 (0.01) 0.131.06 0.64 0.35 0.121.12 0.63 0.37 0.11
vn01 0.69 0.68 (0.01) 0.68 0.56 0.55 (0.02) 0.57 0.40 0.40 (0.00) 0.40 0.06 0.06 (0.00) 0.050.68 0.54 0.40 0.060.69 0.54 0.40 0.06
0.70 (0.01) 0.69 0.57 (0.01) 0.56 0.39 (0.00) 0.39 0.06 (0.00) 0.060.70 0.57 0.39 0.060.70 0.58 0.40 0.06
vn02
vn03 0.97 0.97 (0.00) 0.97 1.06 1.06 (0.00) 1.06 0.45 0.44 (0.00) 0.44 0.32 0.32 (0.00) 0.320.96 1.06 0.44 0.320.97 1.06 0.44 0.32
0.97 (0.01) 0.97 1.05 (0.02) 1.03 0.45 (0.00) 0.45 0.32 (0.00) 0.320.98 1.06 0.45 0.320.96 1.06 0.45 0.32
Note: Value in parenthesis showed standard deviation of triplicate analyses.
Average Average
Ex-K Ex-Nacmol(+) kg-1
Average AverageLab.
Ex-Ca Ex-Mg
100
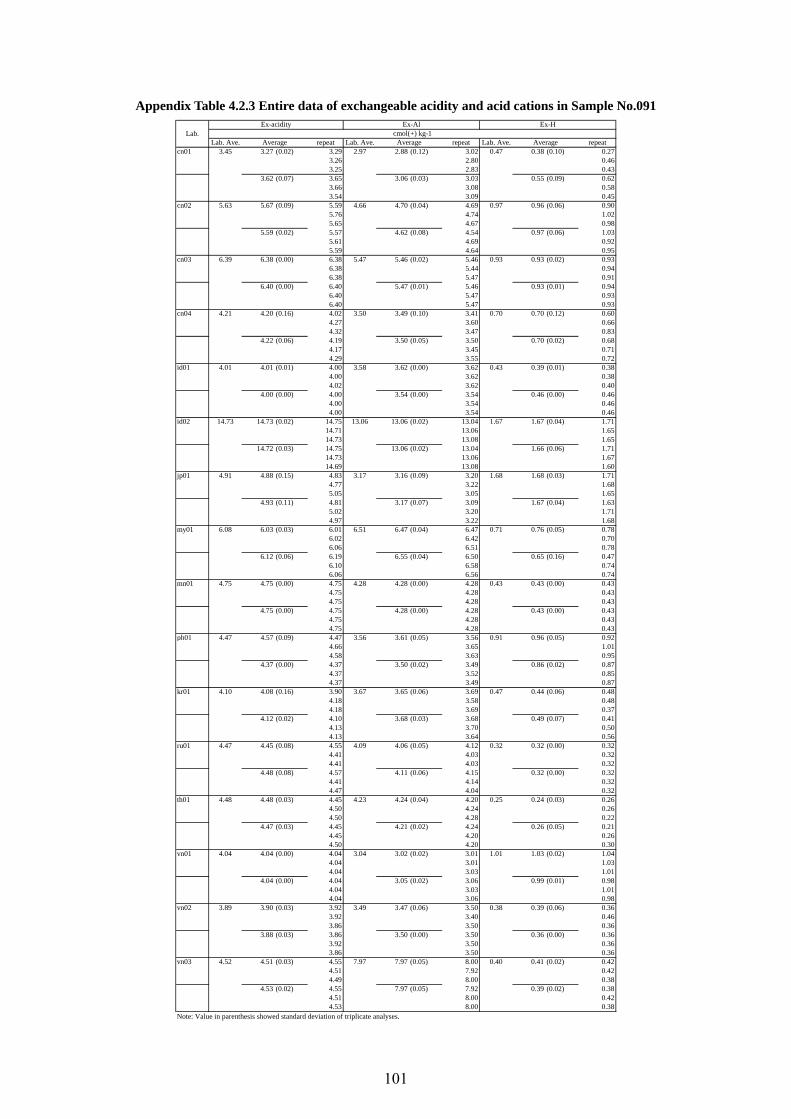
Appendix Table 4.2.3 Entire data of exchangeable acidity and acid cations in Sample No.091
Lab. Ave. repeat Lab. Ave. repeat Lab. Ave. repeatcn01 3.45 3.27 (0.02) 3.29 2.97 2.88 (0.12) 3.02 0.47 0.38 (0.10) 0.27
3.26 2.80 0.463.25 2.83 0.43
3.62 (0.07) 3.65 3.06 (0.03) 3.03 0.55 (0.09) 0.623.66 3.08 0.583.54 3.09 0.45
cn02 5.63 5.67 (0.09) 5.59 4.66 4.70 (0.04) 4.69 0.97 0.96 (0.06) 0.905.76 4.74 1.025.65 4.67 0.98
5.59 (0.02) 5.57 4.62 (0.08) 4.54 0.97 (0.06) 1.035.61 4.69 0.925.59 4.64 0.95
cn03 6.39 6.38 (0.00) 6.38 5.47 5.46 (0.02) 5.46 0.93 0.93 (0.02) 0.936.38 5.44 0.946.38 5.47 0.91
6.40 (0.00) 6.40 5.47 (0.01) 5.46 0.93 (0.01) 0.946.40 5.47 0.936.40 5.47 0.93
cn04 4.21 4.20 (0.16) 4.02 3.50 3.49 (0.10) 3.41 0.70 0.70 (0.12) 0.604.27 3.60 0.664.32 3.47 0.83
4.22 (0.06) 4.19 3.50 (0.05) 3.50 0.70 (0.02) 0.684.17 3.45 0.714.29 3.55 0.72
id01 4.01 4.01 (0.01) 4.00 3.58 3.62 (0.00) 3.62 0.43 0.39 (0.01) 0.384.00 3.62 0.384.02 3.62 0.40
4.00 (0.00) 4.00 3.54 (0.00) 3.54 0.46 (0.00) 0.464.00 3.54 0.464.00 3.54 0.46
id02 14.73 14.73 (0.02) 14.75 13.06 13.06 (0.02) 13.04 1.67 1.67 (0.04) 1.7114.71 13.06 1.6514.73 13.08 1.65
14.72 (0.03) 14.75 13.06 (0.02) 13.04 1.66 (0.06) 1.7114.73 13.06 1.6714.69 13.08 1.60
jp01 4.91 4.88 (0.15) 4.83 3.17 3.16 (0.09) 3.20 1.68 1.68 (0.03) 1.714.77 3.22 1.685.05 3.05 1.65
4.93 (0.11) 4.81 3.17 (0.07) 3.09 1.67 (0.04) 1.635.02 3.20 1.714.97 3.22 1.68
my01 6.08 6.03 (0.03) 6.01 6.51 6.47 (0.04) 6.47 0.71 0.76 (0.05) 0.786.02 6.42 0.706.06 6.51 0.78
6.12 (0.06) 6.19 6.55 (0.04) 6.50 0.65 (0.16) 0.476.10 6.58 0.746.06 6.56 0.74
mn01 4.75 4.75 (0.00) 4.75 4.28 4.28 (0.00) 4.28 0.43 0.43 (0.00) 0.434.75 4.28 0.434.75 4.28 0.43
4.75 (0.00) 4.75 4.28 (0.00) 4.28 0.43 (0.00) 0.434.75 4.28 0.434.75 4.28 0.43
ph01 4.47 4.57 (0.09) 4.47 3.56 3.61 (0.05) 3.56 0.91 0.96 (0.05) 0.924.66 3.65 1.014.58 3.63 0.95
4.37 (0.00) 4.37 3.50 (0.02) 3.49 0.86 (0.02) 0.874.37 3.52 0.854.37 3.49 0.87
kr01 4.10 4.08 (0.16) 3.90 3.67 3.65 (0.06) 3.69 0.47 0.44 (0.06) 0.484.18 3.58 0.484.18 3.69 0.37
4.12 (0.02) 4.10 3.68 (0.03) 3.68 0.49 (0.07) 0.414.13 3.70 0.504.13 3.64 0.56
ru01 4.47 4.45 (0.08) 4.55 4.09 4.06 (0.05) 4.12 0.32 0.32 (0.00) 0.324.41 4.03 0.324.41 4.03 0.32
4.48 (0.08) 4.57 4.11 (0.06) 4.15 0.32 (0.00) 0.324.41 4.14 0.324.47 4.04 0.32
th01 4.48 4.48 (0.03) 4.45 4.23 4.24 (0.04) 4.20 0.25 0.24 (0.03) 0.264.50 4.24 0.264.50 4.28 0.22
4.47 (0.03) 4.45 4.21 (0.02) 4.24 0.26 (0.05) 0.214.45 4.20 0.264.50 4.20 0.30
vn01 4.04 4.04 (0.00) 4.04 3.04 3.02 (0.02) 3.01 1.01 1.03 (0.02) 1.044.04 3.01 1.034.04 3.03 1.01
4.04 (0.00) 4.04 3.05 (0.02) 3.06 0.99 (0.01) 0.984.04 3.03 1.014.04 3.06 0.98
vn02 3.89 3.90 (0.03) 3.92 3.49 3.47 (0.06) 3.50 0.38 0.39 (0.06) 0.363.92 3.40 0.463.86 3.50 0.36
3.88 (0.03) 3.86 3.50 (0.00) 3.50 0.36 (0.00) 0.363.92 3.50 0.363.86 3.50 0.36
vn03 4.52 4.51 (0.03) 4.55 7.97 7.97 (0.05) 8.00 0.40 0.41 (0.02) 0.424.51 7.92 0.424.49 8.00 0.38
4.53 (0.02) 4.55 7.97 (0.05) 7.92 0.39 (0.02) 0.384.51 8.00 0.424.53 8.00 0.38
Note: Value in parenthesis showed standard deviation of triplicate analyses.
Average Average AverageLab.
Ex-acidity Ex-Al Ex-Hcmol(+) kg-1
101
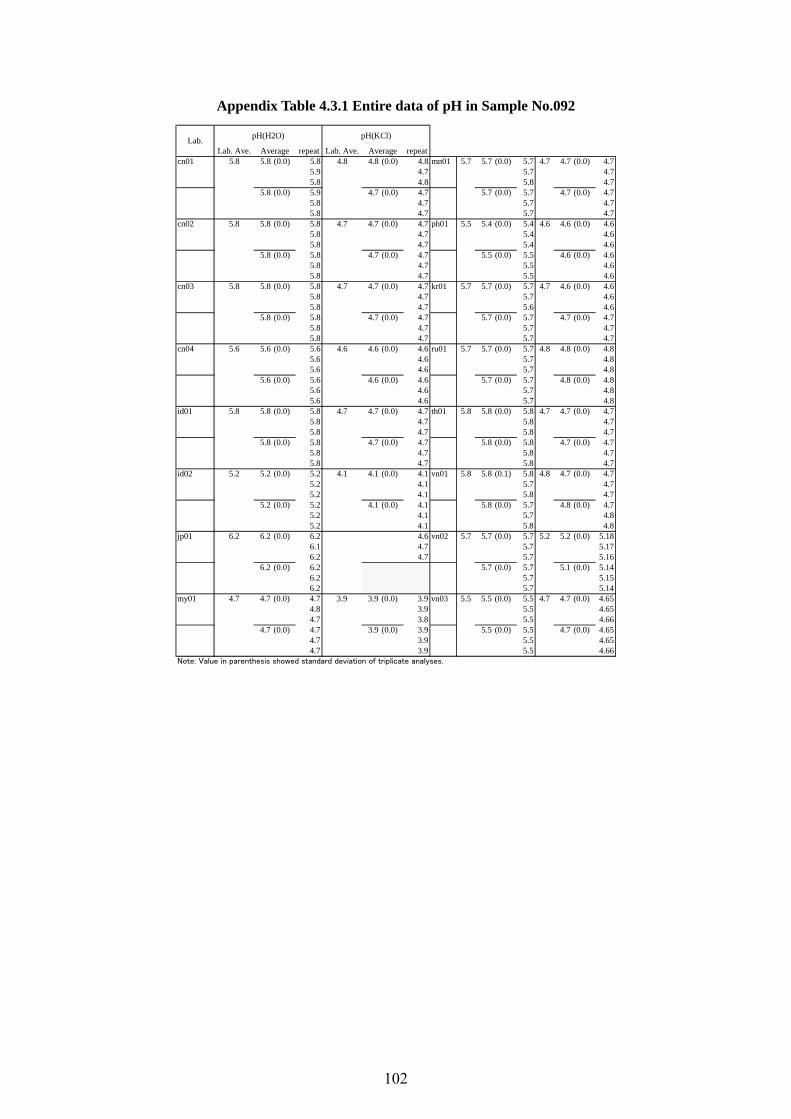
Appendix Table 4.3.1 Entire data of pH in Sample No.092
Lab. Ave. repeat Lab. Ave. repeatcn01 5.8 5.8 (0.0) 5.8 4.8 4.8 (0.0) 4.8 mn01 5.7 5.7 (0.0) 5.7 4.7 4.7 (0.0) 4.7
5.9 4.7 5.7 4.75.8 4.8 5.8 4.7
5.8 (0.0) 5.9 4.7 (0.0) 4.7 5.7 (0.0) 5.7 4.7 (0.0) 4.75.8 4.7 5.7 4.75.8 4.7 5.7 4.7
cn02 5.8 5.8 (0.0) 5.8 4.7 4.7 (0.0) 4.7 ph01 5.5 5.4 (0.0) 5.4 4.6 4.6 (0.0) 4.65.8 4.7 5.4 4.65.8 4.7 5.4 4.6
5.8 (0.0) 5.8 4.7 (0.0) 4.7 5.5 (0.0) 5.5 4.6 (0.0) 4.65.8 4.7 5.5 4.65.8 4.7 5.5 4.6
cn03 5.8 5.8 (0.0) 5.8 4.7 4.7 (0.0) 4.7 kr01 5.7 5.7 (0.0) 5.7 4.7 4.6 (0.0) 4.65.8 4.7 5.7 4.65.8 4.7 5.6 4.6
5.8 (0.0) 5.8 4.7 (0.0) 4.7 5.7 (0.0) 5.7 4.7 (0.0) 4.75.8 4.7 5.7 4.75.8 4.7 5.7 4.7
cn04 5.6 5.6 (0.0) 5.6 4.6 4.6 (0.0) 4.6 ru01 5.7 5.7 (0.0) 5.7 4.8 4.8 (0.0) 4.85.6 4.6 5.7 4.85.6 4.6 5.7 4.8
5.6 (0.0) 5.6 4.6 (0.0) 4.6 5.7 (0.0) 5.7 4.8 (0.0) 4.85.6 4.6 5.7 4.85.6 4.6 5.7 4.8
id01 5.8 5.8 (0.0) 5.8 4.7 4.7 (0.0) 4.7 th01 5.8 5.8 (0.0) 5.8 4.7 4.7 (0.0) 4.75.8 4.7 5.8 4.75.8 4.7 5.8 4.7
5.8 (0.0) 5.8 4.7 (0.0) 4.7 5.8 (0.0) 5.8 4.7 (0.0) 4.75.8 4.7 5.8 4.75.8 4.7 5.8 4.7
id02 5.2 5.2 (0.0) 5.2 4.1 4.1 (0.0) 4.1 vn01 5.8 5.8 (0.1) 5.8 4.8 4.7 (0.0) 4.75.2 4.1 5.7 4.75.2 4.1 5.8 4.7
5.2 (0.0) 5.2 4.1 (0.0) 4.1 5.8 (0.0) 5.7 4.8 (0.0) 4.75.2 4.1 5.7 4.85.2 4.1 5.8 4.8
jp01 6.2 6.2 (0.0) 6.2 4.6 vn02 5.7 5.7 (0.0) 5.7 5.2 5.2 (0.0) 5.186.1 4.7 5.7 5.176.2 4.7 5.7 5.16
6.2 (0.0) 6.2 5.7 (0.0) 5.7 5.1 (0.0) 5.146.2 5.7 5.156.2 5.7 5.14
my01 4.7 4.7 (0.0) 4.7 3.9 3.9 (0.0) 3.9 vn03 5.5 5.5 (0.0) 5.5 4.7 4.7 (0.0) 4.654.8 3.9 5.5 4.654.7 3.8 5.5 4.66
4.7 (0.0) 4.7 3.9 (0.0) 3.9 5.5 (0.0) 5.5 4.7 (0.0) 4.654.7 3.9 5.5 4.654.7 3.9 5.5 4.66
Note: Value in parenthesis showed standard deviation of triplicate analyses.
Lab.pH(H2O) pH(KCl)
Average Average
102
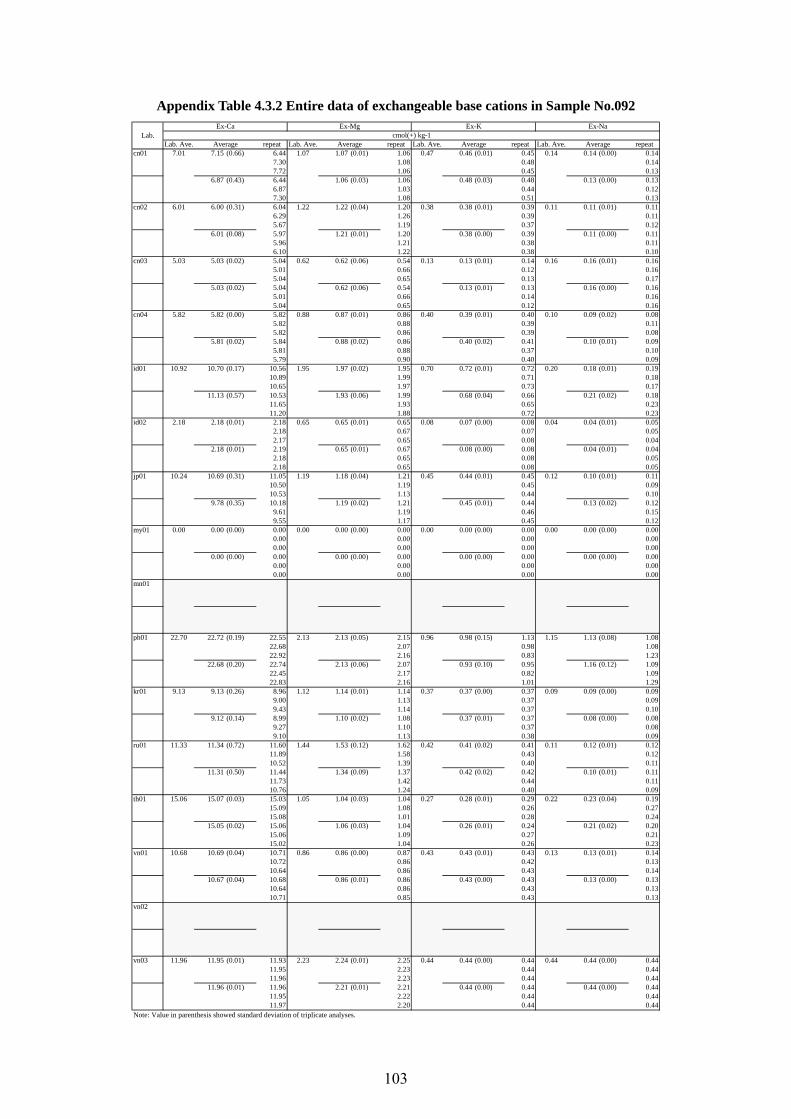
Appendix Table 4.3.2 Entire data of exchangeable base cations in Sample No.092
Lab. Ave. repeat Lab. Ave. repeat Lab. Ave. repeat Lab. Ave. repeatcn01 7.01 7.15 (0.66) 6.44 1.07 1.07 (0.01) 1.06 0.47 0.46 (0.01) 0.45 0.14 0.14 (0.00) 0.14
7.30 1.08 0.48 0.147.72 1.06 0.45 0.13
6.87 (0.43) 6.44 1.06 (0.03) 1.06 0.48 (0.03) 0.48 0.13 (0.00) 0.136.87 1.03 0.44 0.127.30 1.08 0.51 0.13
cn02 6.01 6.00 (0.31) 6.04 1.22 1.22 (0.04) 1.20 0.38 0.38 (0.01) 0.39 0.11 0.11 (0.01) 0.116.29 1.26 0.39 0.115.67 1.19 0.37 0.12
6.01 (0.08) 5.97 1.21 (0.01) 1.20 0.38 (0.00) 0.39 0.11 (0.00) 0.115.96 1.21 0.38 0.116.10 1.22 0.38 0.10
cn03 5.03 5.03 (0.02) 5.04 0.62 0.62 (0.06) 0.54 0.13 0.13 (0.01) 0.14 0.16 0.16 (0.01) 0.165.01 0.66 0.12 0.165.04 0.65 0.13 0.17
5.03 (0.02) 5.04 0.62 (0.06) 0.54 0.13 (0.01) 0.13 0.16 (0.00) 0.165.01 0.66 0.14 0.165.04 0.65 0.12 0.16
cn04 5.82 5.82 (0.00) 5.82 0.88 0.87 (0.01) 0.86 0.40 0.39 (0.01) 0.40 0.10 0.09 (0.02) 0.085.82 0.88 0.39 0.115.82 0.86 0.39 0.08
5.81 (0.02) 5.84 0.88 (0.02) 0.86 0.40 (0.02) 0.41 0.10 (0.01) 0.095.81 0.88 0.37 0.105.79 0.90 0.40 0.09
id01 10.92 10.70 (0.17) 10.56 1.95 1.97 (0.02) 1.95 0.70 0.72 (0.01) 0.72 0.20 0.18 (0.01) 0.1910.89 1.99 0.71 0.1810.65 1.97 0.73 0.17
11.13 (0.57) 10.53 1.93 (0.06) 1.99 0.68 (0.04) 0.66 0.21 (0.02) 0.1811.65 1.93 0.65 0.2311.20 1.88 0.72 0.23
id02 2.18 2.18 (0.01) 2.18 0.65 0.65 (0.01) 0.65 0.08 0.07 (0.00) 0.08 0.04 0.04 (0.01) 0.052.18 0.67 0.07 0.052.17 0.65 0.08 0.04
2.18 (0.01) 2.19 0.65 (0.01) 0.67 0.08 (0.00) 0.08 0.04 (0.01) 0.042.18 0.65 0.08 0.052.18 0.65 0.08 0.05
jp01 10.24 10.69 (0.31) 11.05 1.19 1.18 (0.04) 1.21 0.45 0.44 (0.01) 0.45 0.12 0.10 (0.01) 0.1110.50 1.19 0.45 0.0910.53 1.13 0.44 0.10
9.78 (0.35) 10.18 1.19 (0.02) 1.21 0.45 (0.01) 0.44 0.13 (0.02) 0.129.61 1.19 0.46 0.159.55 1.17 0.45 0.12
my01 0.00 0.00 (0.00) 0.00 0.00 0.00 (0.00) 0.00 0.00 0.00 (0.00) 0.00 0.00 0.00 (0.00) 0.000.00 0.00 0.00 0.000.00 0.00 0.00 0.00
0.00 (0.00) 0.00 0.00 (0.00) 0.00 0.00 (0.00) 0.00 0.00 (0.00) 0.000.00 0.00 0.00 0.000.00 0.00 0.00 0.00
mn01
ph01 22.70 22.72 (0.19) 22.55 2.13 2.13 (0.05) 2.15 0.96 0.98 (0.15) 1.13 1.15 1.13 (0.08) 1.0822.68 2.07 0.98 1.0822.92 2.16 0.83 1.23
22.68 (0.20) 22.74 2.13 (0.06) 2.07 0.93 (0.10) 0.95 1.16 (0.12) 1.0922.45 2.17 0.82 1.0922.83 2.16 1.01 1.29
kr01 9.13 9.13 (0.26) 8.96 1.12 1.14 (0.01) 1.14 0.37 0.37 (0.00) 0.37 0.09 0.09 (0.00) 0.099.00 1.13 0.37 0.099.43 1.14 0.37 0.10
9.12 (0.14) 8.99 1.10 (0.02) 1.08 0.37 (0.01) 0.37 0.08 (0.00) 0.089.27 1.10 0.37 0.089.10 1.13 0.38 0.09
ru01 11.33 11.34 (0.72) 11.60 1.44 1.53 (0.12) 1.62 0.42 0.41 (0.02) 0.41 0.11 0.12 (0.01) 0.1211.89 1.58 0.43 0.1210.52 1.39 0.40 0.11
11.31 (0.50) 11.44 1.34 (0.09) 1.37 0.42 (0.02) 0.42 0.10 (0.01) 0.1111.73 1.42 0.44 0.1110.76 1.24 0.40 0.09
th01 15.06 15.07 (0.03) 15.03 1.05 1.04 (0.03) 1.04 0.27 0.28 (0.01) 0.29 0.22 0.23 (0.04) 0.1915.09 1.08 0.26 0.2715.08 1.01 0.28 0.24
15.05 (0.02) 15.06 1.06 (0.03) 1.04 0.26 (0.01) 0.24 0.21 (0.02) 0.2015.06 1.09 0.27 0.2115.02 1.04 0.26 0.23
vn01 10.68 10.69 (0.04) 10.71 0.86 0.86 (0.00) 0.87 0.43 0.43 (0.01) 0.43 0.13 0.13 (0.01) 0.1410.72 0.86 0.42 0.1310.64 0.86 0.43 0.14
10.67 (0.04) 10.68 0.86 (0.01) 0.86 0.43 (0.00) 0.43 0.13 (0.00) 0.1310.64 0.86 0.43 0.1310.71 0.85 0.43 0.13
vn02
vn03 11.96 11.95 (0.01) 11.93 2.23 2.24 (0.01) 2.25 0.44 0.44 (0.00) 0.44 0.44 0.44 (0.00) 0.4411.95 2.23 0.44 0.4411.96 2.23 0.44 0.44
11.96 (0.01) 11.96 2.21 (0.01) 2.21 0.44 (0.00) 0.44 0.44 (0.00) 0.4411.95 2.22 0.44 0.4411.97 2.20 0.44 0.44
Note: Value in parenthesis showed standard deviation of triplicate analyses.
Average Average
Ex-K Ex-Nacmol(+) kg-1
Average AverageLab.
Ex-Ca Ex-Mg
103
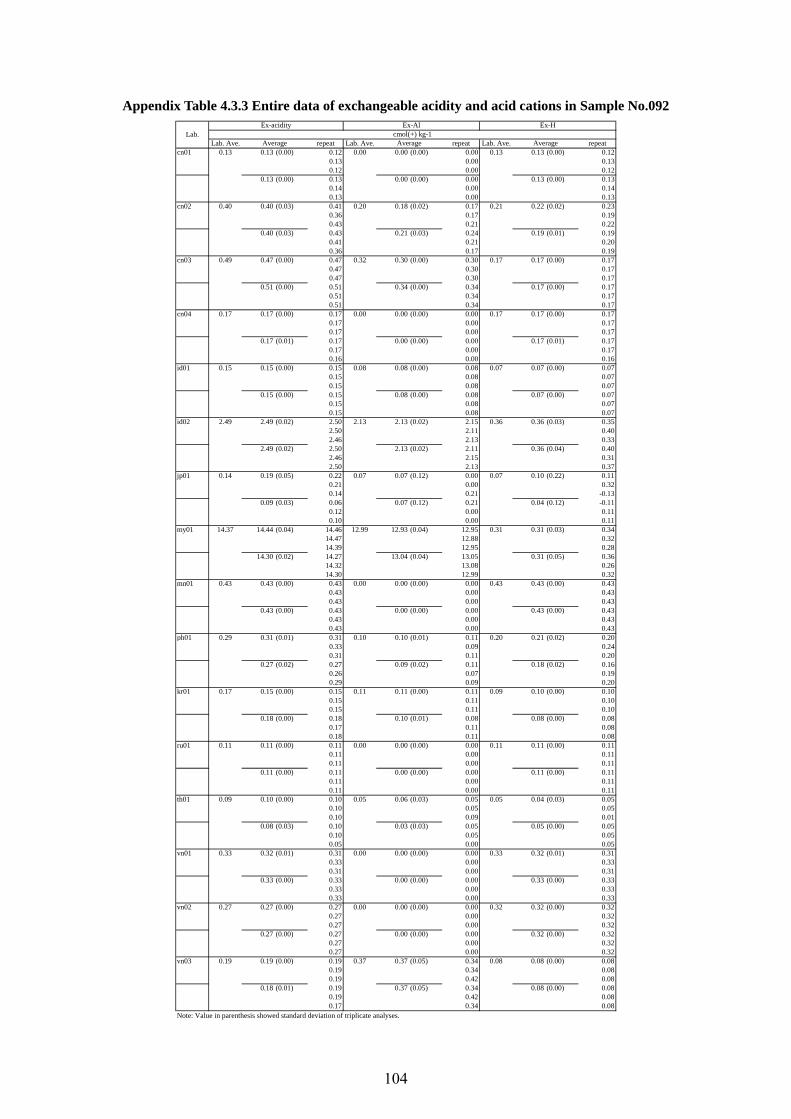
Appendix Table 4.3.3 Entire data of exchangeable acidity and acid cations in Sample No.092
Lab. Ave. repeat Lab. Ave. repeat Lab. Ave. repeatcn01 0.13 0.13 (0.00) 0.12 0.00 0.00 (0.00) 0.00 0.13 0.13 (0.00) 0.12
0.13 0.00 0.130.12 0.00 0.12
0.13 (0.00) 0.13 0.00 (0.00) 0.00 0.13 (0.00) 0.130.14 0.00 0.140.13 0.00 0.13
cn02 0.40 0.40 (0.03) 0.41 0.20 0.18 (0.02) 0.17 0.21 0.22 (0.02) 0.230.36 0.17 0.190.43 0.21 0.22
0.40 (0.03) 0.43 0.21 (0.03) 0.24 0.19 (0.01) 0.190.41 0.21 0.200.36 0.17 0.19
cn03 0.49 0.47 (0.00) 0.47 0.32 0.30 (0.00) 0.30 0.17 0.17 (0.00) 0.170.47 0.30 0.170.47 0.30 0.17
0.51 (0.00) 0.51 0.34 (0.00) 0.34 0.17 (0.00) 0.170.51 0.34 0.170.51 0.34 0.17
cn04 0.17 0.17 (0.00) 0.17 0.00 0.00 (0.00) 0.00 0.17 0.17 (0.00) 0.170.17 0.00 0.170.17 0.00 0.17
0.17 (0.01) 0.17 0.00 (0.00) 0.00 0.17 (0.01) 0.170.17 0.00 0.170.16 0.00 0.16
id01 0.15 0.15 (0.00) 0.15 0.08 0.08 (0.00) 0.08 0.07 0.07 (0.00) 0.070.15 0.08 0.070.15 0.08 0.07
0.15 (0.00) 0.15 0.08 (0.00) 0.08 0.07 (0.00) 0.070.15 0.08 0.070.15 0.08 0.07
id02 2.49 2.49 (0.02) 2.50 2.13 2.13 (0.02) 2.15 0.36 0.36 (0.03) 0.352.50 2.11 0.402.46 2.13 0.33
2.49 (0.02) 2.50 2.13 (0.02) 2.11 0.36 (0.04) 0.402.46 2.15 0.312.50 2.13 0.37
jp01 0.14 0.19 (0.05) 0.22 0.07 0.07 (0.12) 0.00 0.07 0.10 (0.22) 0.110.21 0.00 0.320.14 0.21 -0.13
0.09 (0.03) 0.06 0.07 (0.12) 0.21 0.04 (0.12) -0.110.12 0.00 0.110.10 0.00 0.11
my01 14.37 14.44 (0.04) 14.46 12.99 12.93 (0.04) 12.95 0.31 0.31 (0.03) 0.3414.47 12.88 0.3214.39 12.95 0.28
14.30 (0.02) 14.27 13.04 (0.04) 13.05 0.31 (0.05) 0.3614.32 13.08 0.2614.30 12.99 0.32
mn01 0.43 0.43 (0.00) 0.43 0.00 0.00 (0.00) 0.00 0.43 0.43 (0.00) 0.430.43 0.00 0.430.43 0.00 0.43
0.43 (0.00) 0.43 0.00 (0.00) 0.00 0.43 (0.00) 0.430.43 0.00 0.430.43 0.00 0.43
ph01 0.29 0.31 (0.01) 0.31 0.10 0.10 (0.01) 0.11 0.20 0.21 (0.02) 0.200.33 0.09 0.240.31 0.11 0.20
0.27 (0.02) 0.27 0.09 (0.02) 0.11 0.18 (0.02) 0.160.26 0.07 0.190.29 0.09 0.20
kr01 0.17 0.15 (0.00) 0.15 0.11 0.11 (0.00) 0.11 0.09 0.10 (0.00) 0.100.15 0.11 0.100.15 0.11 0.10
0.18 (0.00) 0.18 0.10 (0.01) 0.08 0.08 (0.00) 0.080.17 0.11 0.080.18 0.11 0.08
ru01 0.11 0.11 (0.00) 0.11 0.00 0.00 (0.00) 0.00 0.11 0.11 (0.00) 0.110.11 0.00 0.110.11 0.00 0.11
0.11 (0.00) 0.11 0.00 (0.00) 0.00 0.11 (0.00) 0.110.11 0.00 0.110.11 0.00 0.11
th01 0.09 0.10 (0.00) 0.10 0.05 0.06 (0.03) 0.05 0.05 0.04 (0.03) 0.050.10 0.05 0.050.10 0.09 0.01
0.08 (0.03) 0.10 0.03 (0.03) 0.05 0.05 (0.00) 0.050.10 0.05 0.050.05 0.00 0.05
vn01 0.33 0.32 (0.01) 0.31 0.00 0.00 (0.00) 0.00 0.33 0.32 (0.01) 0.310.33 0.00 0.330.31 0.00 0.31
0.33 (0.00) 0.33 0.00 (0.00) 0.00 0.33 (0.00) 0.330.33 0.00 0.330.33 0.00 0.33
vn02 0.27 0.27 (0.00) 0.27 0.00 0.00 (0.00) 0.00 0.32 0.32 (0.00) 0.320.27 0.00 0.320.27 0.00 0.32
0.27 (0.00) 0.27 0.00 (0.00) 0.00 0.32 (0.00) 0.320.27 0.00 0.320.27 0.00 0.32
vn03 0.19 0.19 (0.00) 0.19 0.37 0.37 (0.05) 0.34 0.08 0.08 (0.00) 0.080.19 0.34 0.080.19 0.42 0.08
0.18 (0.01) 0.19 0.37 (0.05) 0.34 0.08 (0.00) 0.080.19 0.42 0.080.17 0.34 0.08
Note: Value in parenthesis showed standard deviation of triplicate analyses.
Average Average AverageLab.
Ex-acidity Ex-Al Ex-Hcmol(+) kg-1
104
Appendix 4.4 Z-score evaluation The NC applied Z-score for further statistical evaluation of the analytical values in the inter-laboratory comparison on soil.
Definition of Z-score
Z-score is one of the statistical measures that quantify the distance from the mean of a data set. The formula for the calculation of Z-score (Robust method) was shown below:
where X: Measurement values of samples
Q1: The 1st quartile value of entire data Q2: The 2nd quartile value of entire data (i.e. Median) Q3: The 3rd quartile value of entire data
Evaluation of calculated Z-score
Z-score was given to each data submitted by the participating laboratories, and was evaluated as follows:
|Z| ≤ 2 : Satisfactory 2 < |Z| < 3 : Questionable
3 ≤ |Z| : Unsatisfactory The calculated Z-scores were shown in Appendix Table 4.4.1 and 4.4.2, and were also graphed in Appendix Figure 4.4.1 through 4.4.9.
Z = 0.7413 x (Q3 – Q1)
X – Q2
105
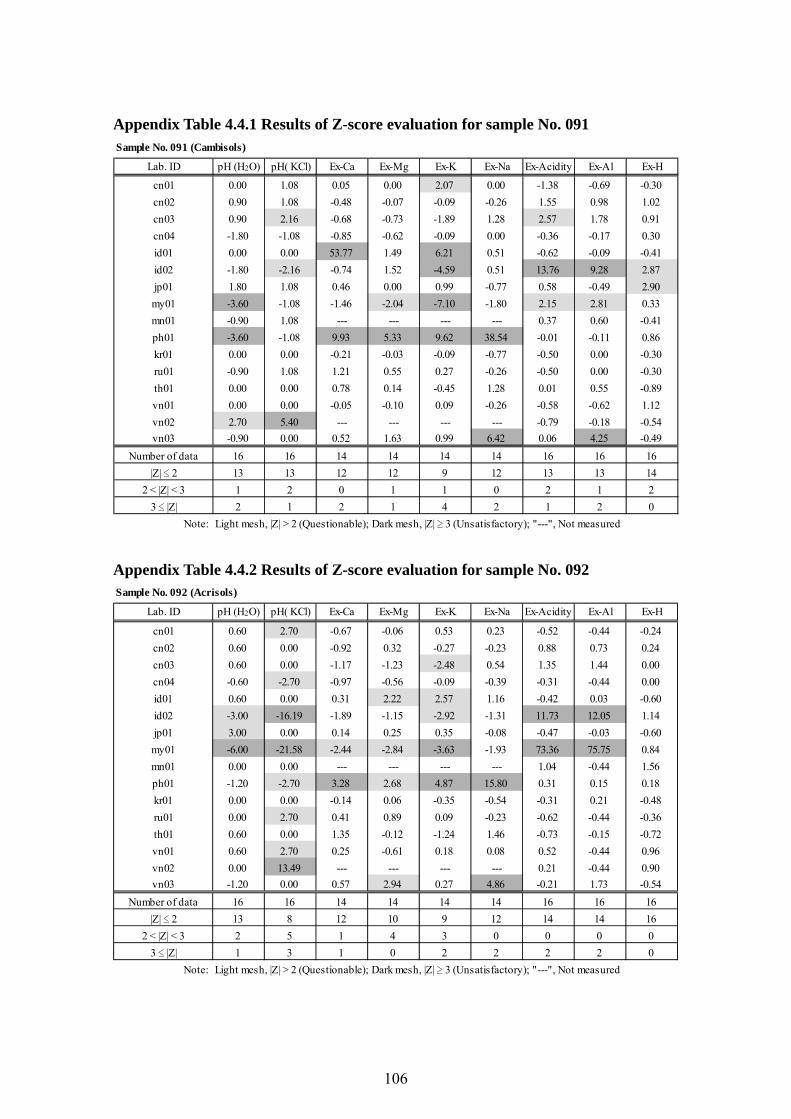
Appendix Table 4.4.1 Results of Z-score evaluation for sample No. 091 Sample No. 091 (Cambisols)
Lab. ID pH (H2O) pH( KCl) Ex-Ca Ex-Mg Ex-K Ex-Na Ex-Acidity Ex-Al Ex-H
cn01 0.00 1.08 0.05 0.00 2.07 0.00 -1.38 -0.69 -0.30cn02 0.90 1.08 -0.48 -0.07 -0.09 -0.26 1.55 0.98 1.02cn03 0.90 2.16 -0.68 -0.73 -1.89 1.28 2.57 1.78 0.91cn04 -1.80 -1.08 -0.85 -0.62 -0.09 0.00 -0.36 -0.17 0.30id01 0.00 0.00 53.77 1.49 6.21 0.51 -0.62 -0.09 -0.41id02 -1.80 -2.16 -0.74 1.52 -4.59 0.51 13.76 9.28 2.87jp01 1.80 1.08 0.46 0.00 0.99 -0.77 0.58 -0.49 2.90my01 -3.60 -1.08 -1.46 -2.04 -7.10 -1.80 2.15 2.81 0.33mn01 -0.90 1.08 --- --- --- --- 0.37 0.60 -0.41ph01 -3.60 -1.08 9.93 5.33 9.62 38.54 -0.01 -0.11 0.86kr01 0.00 0.00 -0.21 -0.03 -0.09 -0.77 -0.50 0.00 -0.30ru01 -0.90 1.08 1.21 0.55 0.27 -0.26 -0.50 0.00 -0.30th01 0.00 0.00 0.78 0.14 -0.45 1.28 0.01 0.55 -0.89vn01 0.00 0.00 -0.05 -0.10 0.09 -0.26 -0.58 -0.62 1.12vn02 2.70 5.40 --- --- --- --- -0.79 -0.18 -0.54vn03 -0.90 0.00 0.52 1.63 0.99 6.42 0.06 4.25 -0.49
Number of data 16 16 14 14 14 14 16 16 16|Z| ≤ 2 13 13 12 12 9 12 13 13 14
2 < |Z| < 3 1 2 0 1 1 0 2 1 23 ≤ |Z| 2 1 2 1 4 2 1 2 0
Note: Light mesh, |Z| > 2 (Questionable); Dark mesh, |Z| ≥ 3 (Unsatisfactory); "---", Not measured Appendix Table 4.4.2 Results of Z-score evaluation for sample No. 092 Sample No. 092 (Acrisols)
Lab. ID pH (H2O) pH( KCl) Ex-Ca Ex-Mg Ex-K Ex-Na Ex-Acidity Ex-Al Ex-H
cn01 0.60 2.70 -0.67 -0.06 0.53 0.23 -0.52 -0.44 -0.24cn02 0.60 0.00 -0.92 0.32 -0.27 -0.23 0.88 0.73 0.24cn03 0.60 0.00 -1.17 -1.23 -2.48 0.54 1.35 1.44 0.00cn04 -0.60 -2.70 -0.97 -0.56 -0.09 -0.39 -0.31 -0.44 0.00id01 0.60 0.00 0.31 2.22 2.57 1.16 -0.42 0.03 -0.60id02 -3.00 -16.19 -1.89 -1.15 -2.92 -1.31 11.73 12.05 1.14jp01 3.00 0.00 0.14 0.25 0.35 -0.08 -0.47 -0.03 -0.60my01 -6.00 -21.58 -2.44 -2.84 -3.63 -1.93 73.36 75.75 0.84mn01 0.00 0.00 --- --- --- --- 1.04 -0.44 1.56ph01 -1.20 -2.70 3.28 2.68 4.87 15.80 0.31 0.15 0.18kr01 0.00 0.00 -0.14 0.06 -0.35 -0.54 -0.31 0.21 -0.48ru01 0.00 2.70 0.41 0.89 0.09 -0.23 -0.62 -0.44 -0.36th01 0.60 0.00 1.35 -0.12 -1.24 1.46 -0.73 -0.15 -0.72vn01 0.60 2.70 0.25 -0.61 0.18 0.08 0.52 -0.44 0.96vn02 0.00 13.49 --- --- --- --- 0.21 -0.44 0.90vn03 -1.20 0.00 0.57 2.94 0.27 4.86 -0.21 1.73 -0.54
Number of data 16 16 14 14 14 14 16 16 16|Z| ≤ 2 13 8 12 10 9 12 14 14 16
2 < |Z| < 3 2 5 1 4 3 0 0 0 03 ≤ |Z| 1 3 1 0 2 2 2 2 0
Note: Light mesh, |Z| > 2 (Questionable); Dark mesh, |Z| ≥ 3 (Unsatisfactory); "---", Not measured
106
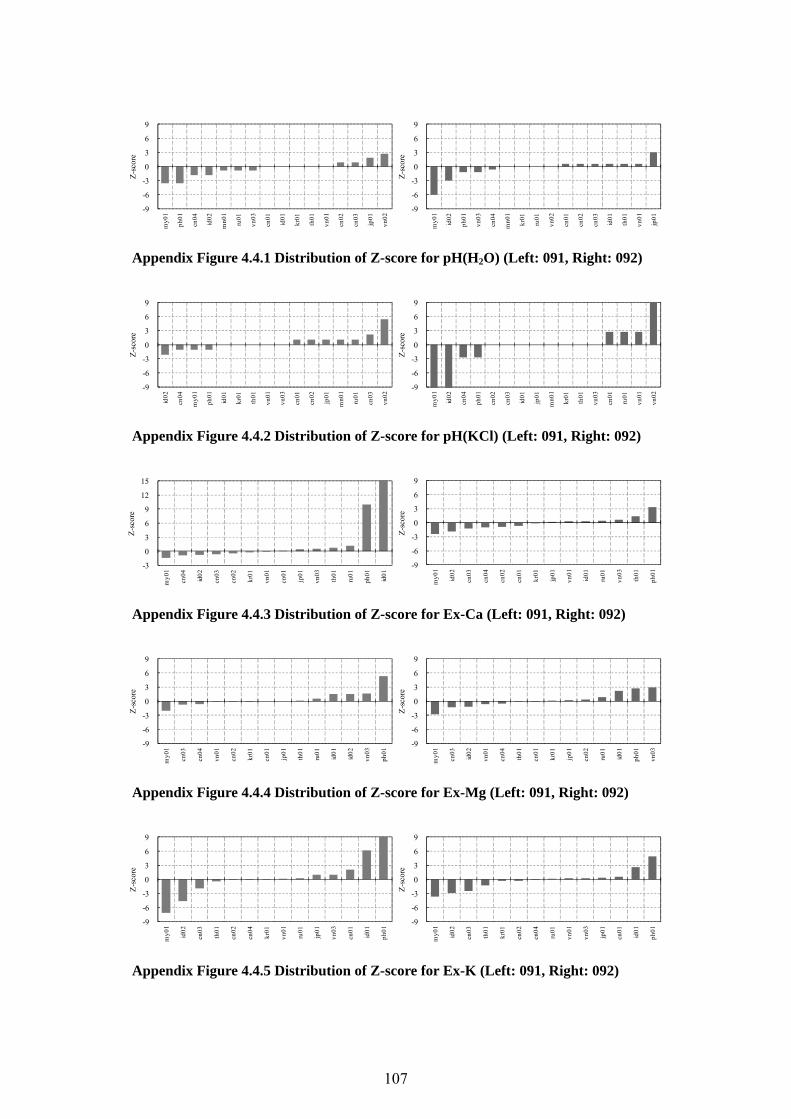
-9
-6
-3
0
3
6
9
my0
1
ph01
cn04
id02
mn0
1
ru01
vn03
cn01
id01
kr01
th01
vn01
cn02
cn03
jp01
vn02
Z-sc
ore
-9
-6
-3
0
3
6
9
my0
1
id02
ph01
vn03
cn04
mn0
1
kr01
ru01
vn02
cn01
cn02
cn03
id01
th01
vn01
jp01
Z-sc
ore
Appendix Figure 4.4.1 Distribution of Z-score for pH(H2O) (Left: 091, Right: 092)
-9
-6
-3
0
3
6
9
id02
cn04
my0
1
ph01
id01
kr01
th01
vn01
vn03
cn01
cn02
jp01
mn0
1
ru01
cn03
vn02
Z-sc
ore
-9
-6
-3
0
3
6
9
my0
1
id02
cn04
ph01
cn02
cn03
id01
jp01
mn0
1
kr01
th01
vn03
cn01
ru01
vn01
vn02
Z-sc
ore
Appendix Figure 4.4.2 Distribution of Z-score for pH(KCl) (Left: 091, Right: 092)
-3
0
3
6
9
12
15
my0
1
cn04
id02
cn03
cn02
kr01
vn01
cn01
jp01
vn03
th01
ru01
ph01
id01
Z-sc
ore
-9
-6
-3
0
3
6
9
my0
1
id02
cn03
cn04
cn02
cn01
kr01
jp01
vn01
id01
ru01
vn03
th01
ph01
Z-sc
ore
Appendix Figure 4.4.3 Distribution of Z-score for Ex-Ca (Left: 091, Right: 092)
-9
-6
-3
0
3
6
9
my0
1
cn03
cn04
vn01
cn02
kr01
cn01
jp01
th01
ru01
id01
id02
vn03
ph01
Z-sc
ore
-9
-6
-3
0
3
6
9
my0
1
cn03
id02
vn01
cn04
th01
cn01
kr01
jp01
cn02
ru01
id01
ph01
vn03
Z-sc
ore
Appendix Figure 4.4.4 Distribution of Z-score for Ex-Mg (Left: 091, Right: 092)
-9
-6
-3
0
3
6
9
my0
1
id02
cn03
th01
cn02
cn04
kr01
vn01
ru01
jp01
vn03
cn01
id01
ph01
Z-sc
ore
-9
-6
-3
0
3
6
9
my0
1
id02
cn03
th01
kr01
cn02
cn04
ru01
vn01
vn03
jp01
cn01
id01
ph01
Z-sc
ore
Appendix Figure 4.4.5 Distribution of Z-score for Ex-K (Left: 091, Right: 092)
107
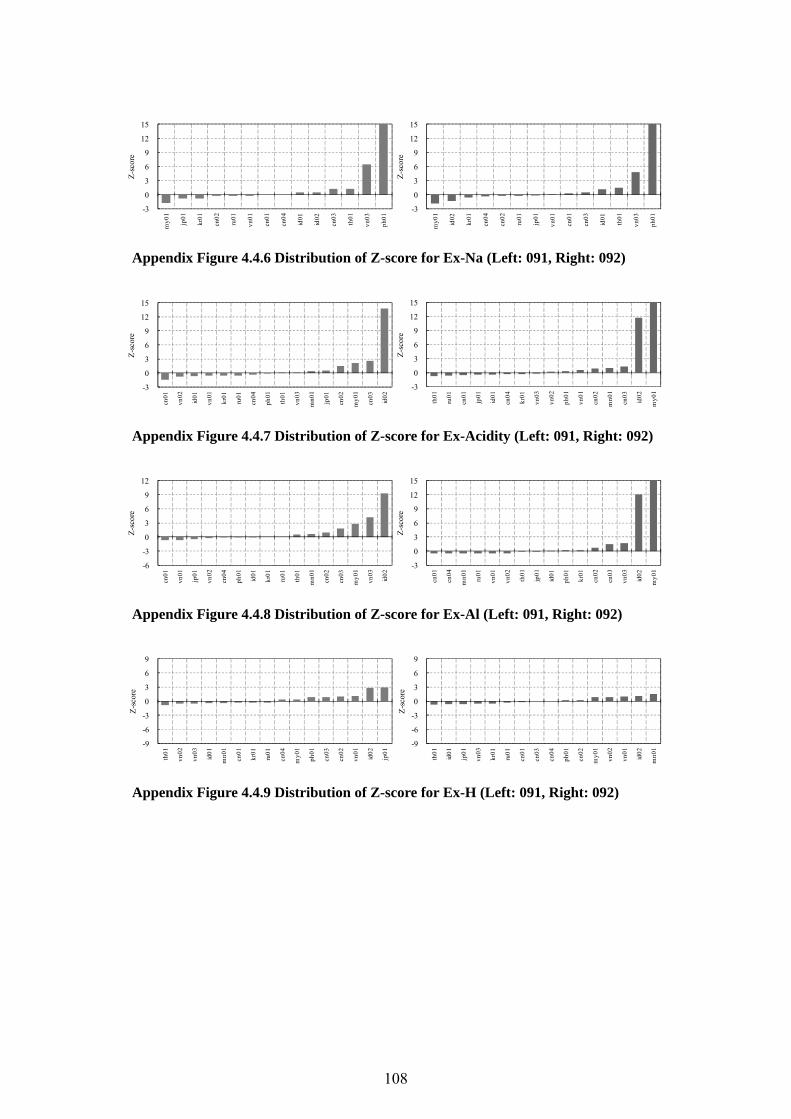
-3
0
3
6
9
12
15
my0
1
jp01
kr01
cn02
ru01
vn01
cn01
cn04
id01
id02
cn03
th01
vn03
ph01
Z-sc
ore
-3
0
3
6
9
12
15
my0
1
id02
kr01
cn04
cn02
ru01
jp01
vn01
cn01
cn03
id01
th01
vn03
ph01
Z-sc
ore
Appendix Figure 4.4.6 Distribution of Z-score for Ex-Na (Left: 091, Right: 092)
-3
0
3
6
9
12
15
cn01
vn02
id01
vn01
kr01
ru01
cn04
ph01
th01
vn03
mn0
1
jp01
cn02
my0
1
cn03
id02
Z-sc
ore
-3
0
3
6
9
12
15
th01
ru01
cn01
jp01
id01
cn04
kr01
vn03
vn02
ph01
vn01
cn02
mn0
1
cn03
id02
my0
1
Z-sc
ore
Appendix Figure 4.4.7 Distribution of Z-score for Ex-Acidity (Left: 091, Right: 092)
-6
-3
0
3
6
9
12
cn01
vn01
jp01
vn02
cn04
ph01
id01
kr01
ru01
th01
mn0
1
cn02
cn03
my0
1
vn03
id02
Z-sc
ore
-3
0
3
6
9
12
15
cn01
cn04
mn0
1
ru01
vn01
vn02
th01
jp01
id01
ph01
kr01
cn02
cn03
vn03
id02
my0
1
Z-sc
ore
Appendix Figure 4.4.8 Distribution of Z-score for Ex-Al (Left: 091, Right: 092)
-9
-6
-3
0
3
6
9
th01
vn02
vn03
id01
mn0
1
cn01
kr01
ru01
cn04
my0
1
ph01
cn03
cn02
vn01
id02
jp01
Z-sc
ore
-9
-6
-3
0
3
6
9
th01
id01
jp01
vn03
kr01
ru01
cn01
cn03
cn04
ph01
cn02
my0
1
vn02
vn01
id02
mn0
1
Z-sc
ore
Appendix Figure 4.4.9 Distribution of Z-score for Ex-H (Left: 091, Right: 092)
108
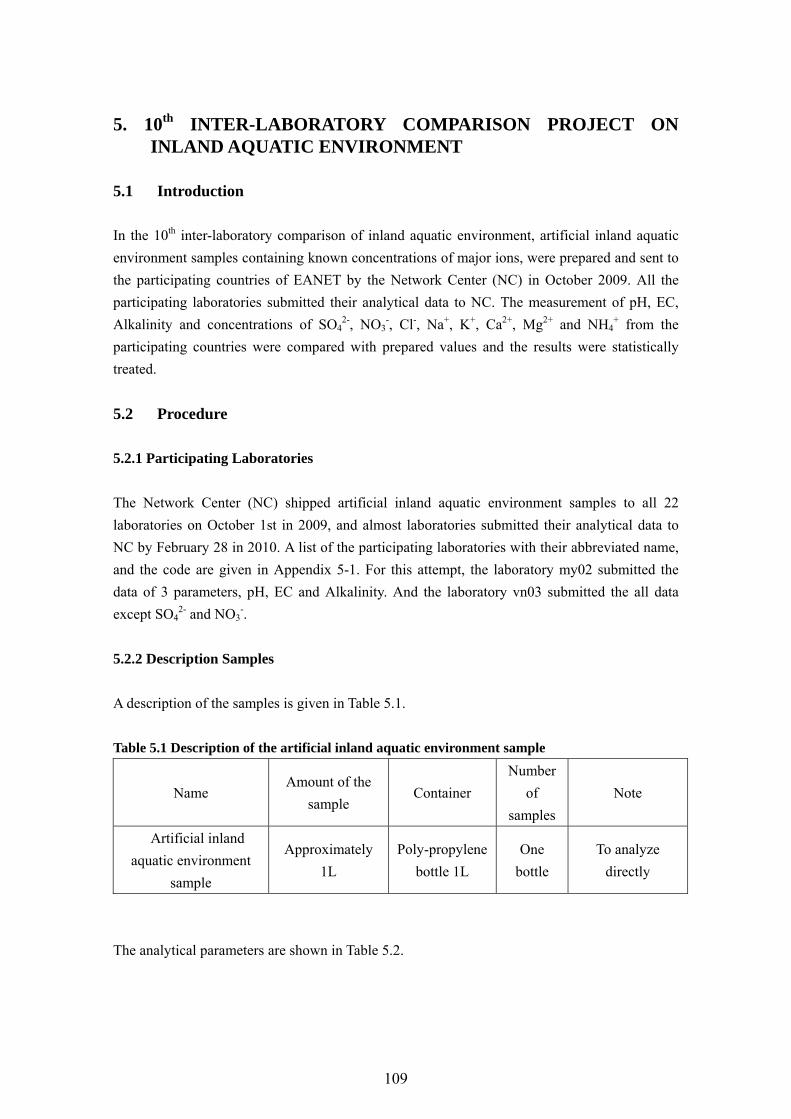
5. 10th INTER-LABORATORY COMPARISON PROJECT ON INLAND AQUATIC ENVIRONMENT
5.1 Introduction
In the 10th inter-laboratory comparison of inland aquatic environment, artificial inland aquatic environment samples containing known concentrations of major ions, were prepared and sent to the participating countries of EANET by the Network Center (NC) in October 2009. All the participating laboratories submitted their analytical data to NC. The measurement of pH, EC, Alkalinity and concentrations of SO4
2-, NO3-, Cl-, Na+, K+, Ca2+, Mg2+ and NH4
+ from the participating countries were compared with prepared values and the results were statistically treated.
5.2 Procedure
5.2.1 Participating Laboratories
The Network Center (NC) shipped artificial inland aquatic environment samples to all 22 laboratories on October 1st in 2009, and almost laboratories submitted their analytical data to NC by February 28 in 2010. A list of the participating laboratories with their abbreviated name, and the code are given in Appendix 5-1. For this attempt, the laboratory my02 submitted the data of 3 parameters, pH, EC and Alkalinity. And the laboratory vn03 submitted the all data except SO4
2- and NO3-.
5.2.2 Description Samples
A description of the samples is given in Table 5.1. Table 5.1 Description of the artificial inland aquatic environment sample
Name Amount of the
sample Container
Number of
samples Note
Artificial inland aquatic environment
sample
Approximately 1L
Poly-propylene bottle 1L
One bottle
To analyze directly
The analytical parameters are shown in Table 5.2.
109
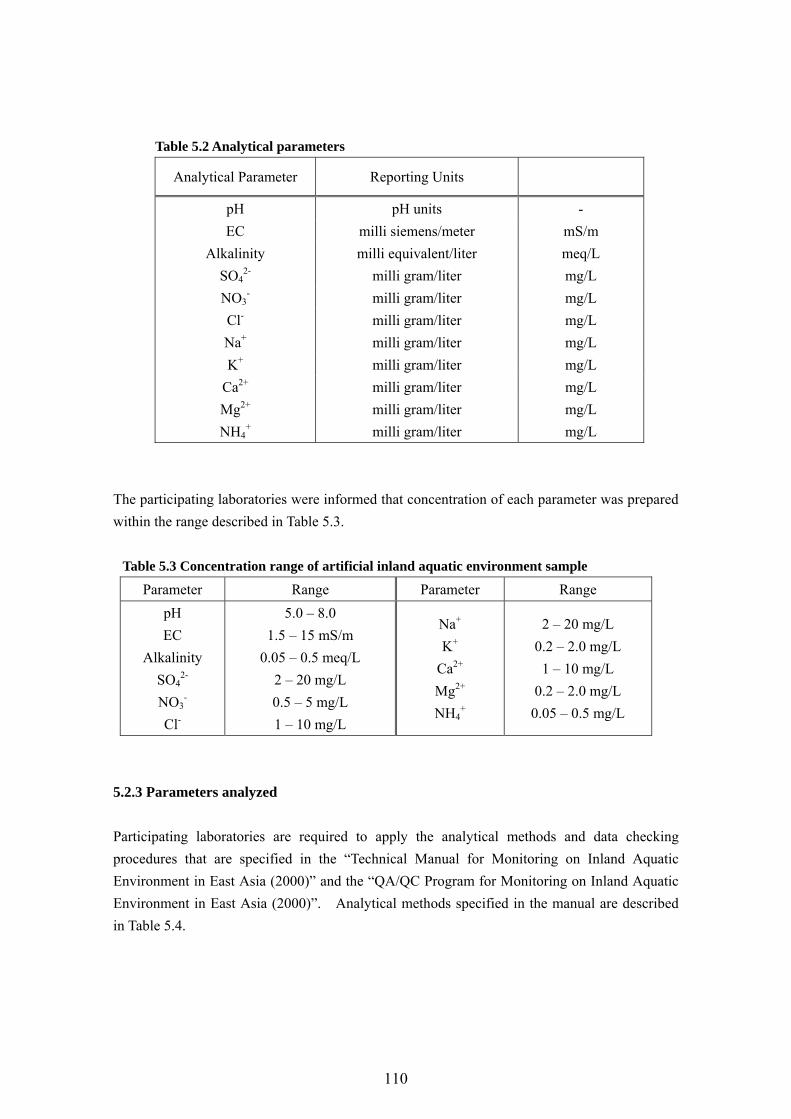
Table 5.2 Analytical parameters
Analytical Parameter Reporting Units
pH pH units - EC milli siemens/meter mS/m
Alkalinity milli equivalent/liter meq/L SO4
2- milli gram/liter mg/L NO3
- milli gram/liter mg/L Cl- milli gram/liter mg/L Na+ milli gram/liter mg/L K+ milli gram/liter mg/L
Ca2+ milli gram/liter mg/L Mg2+ milli gram/liter mg/L NH4
+ milli gram/liter mg/L
The participating laboratories were informed that concentration of each parameter was prepared within the range described in Table 5.3.
Table 5.3 Concentration range of artificial inland aquatic environment sample
Parameter Range Parameter Range pH EC
Alkalinity SO4
2- NO3
-
Cl-
5.0 – 8.0 1.5 – 15 mS/m
0.05 – 0.5 meq/L 2 – 20 mg/L 0.5 – 5 mg/L 1 – 10 mg/L
Na+
K+
Ca2+ Mg2+
NH4+
2 – 20 mg/L 0.2 – 2.0 mg/L
1 – 10 mg/L 0.2 – 2.0 mg/L
0.05 – 0.5 mg/L
5.2.3 Parameters analyzed
Participating laboratories are required to apply the analytical methods and data checking procedures that are specified in the “Technical Manual for Monitoring on Inland Aquatic Environment in East Asia (2000)” and the “QA/QC Program for Monitoring on Inland Aquatic Environment in East Asia (2000)”. Analytical methods specified in the manual are described in Table 5.4.
110

Table 5.4 Analytical methods specified in the manual
Parameter Analytical method
pH Glass electrode EC Conductivity cell
Alkalinity Titration by Burette or Digital Burette with pH Meter (end-point pH4.8)
SO42-
NO3-
Ion Chromatography or Spectrophotometry
Cl- Ion Chromatography or Titration Na+
K+
Ca2+ Mg2+
Ion Chromatography or Atomic Absorption / Flame (emission) photometry
NH4+ Ion Chromatography or Spectrophotometry (Indophenol blue)
5.2.4 Data Checking Procedures
a) Calculation of ion balance (R1) (1) Total anion (A) equivalent concentration (µeq/L) is calculated by sum up the concentration
of anions (C: µmol/L) and Alkalinity (ALK: µeq/L). Alkalinity considered to be corresponded to bicarbonate ions (HCO3
-). A (µeq/L) =Σn CAi (µmol/L) = C (SO4
2-) + C (NO3-) + C (Cl-) + (ALK)
CAi: electric charge of ion and concentration (µmol/L) of anion “i”. (2) Total cation (C) equivalent concentration (µeq/L) is calculated by sum up the concentration
of all cations (C: µmol/L). C (µeq/L) = Σn CCi (µmol/L) = 10 (6-pH) + C (NH4
+) + C (Na+) + C (K+) + C (Ca2+) + C (Mg2+) CCi: electric charge of ion and concentration (µmol/L) of cation “i”. (3) Calculation of ion balance (R1)
R1 = 100 x (C-A) / (C+A) [%]
(4) R1, which is calculated using the above equation, should be compared with standard values in Table 5.5. Re-measurement, check with standard solutions, and/or inspection of calibration curves should be undertaken, when R1 is not within the range.
111
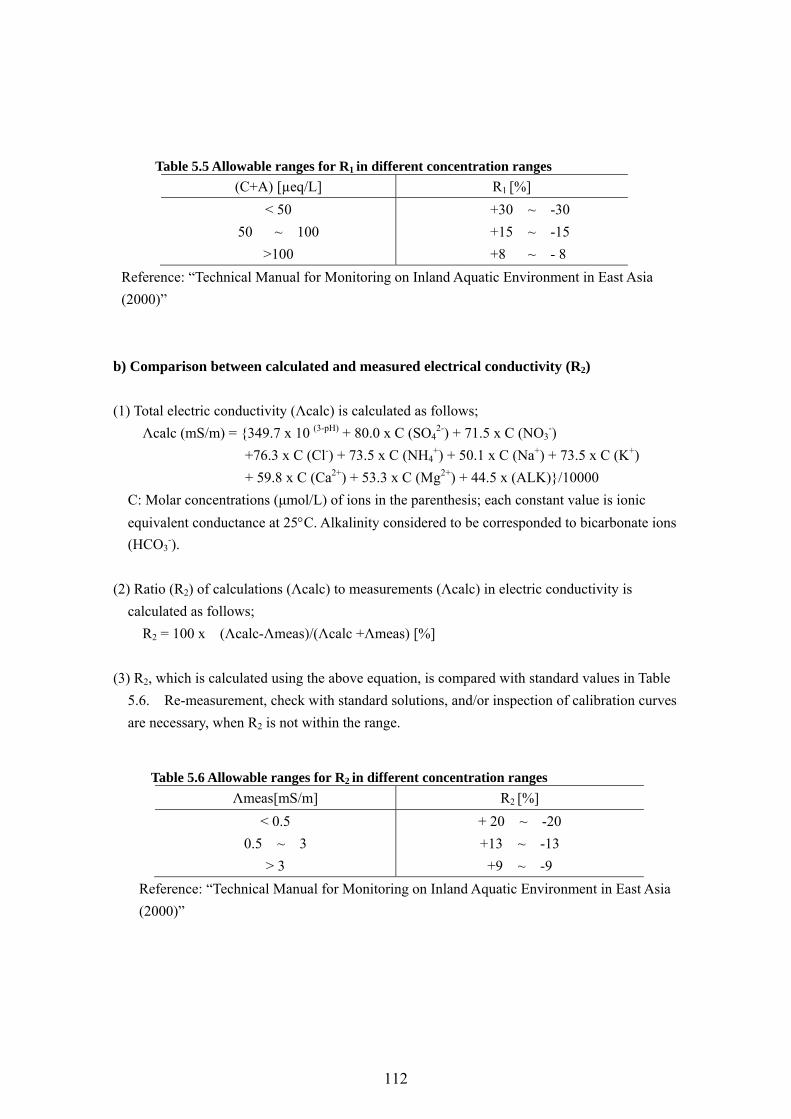
Table 5.5 Allowable ranges for R1 in different concentration ranges
(C+A) [µeq/L] R1 [%] < 50
50 ~ 100 >100
+30 ~ -30 +15 ~ -15 +8 ~ - 8
Reference: “Technical Manual for Monitoring on Inland Aquatic Environment in East Asia (2000)”
b) Comparison between calculated and measured electrical conductivity (R2)
(1) Total electric conductivity (Λcalc) is calculated as follows; Λcalc (mS/m) = {349.7 x 10 (3-pH) + 80.0 x C (SO4
2-) + 71.5 x C (NO3-)
+76.3 x C (Cl-) + 73.5 x C (NH4+) + 50.1 x C (Na+) + 73.5 x C (K+)
+ 59.8 x C (Ca2+) + 53.3 x C (Mg2+) + 44.5 x (ALK)}/10000 C: Molar concentrations (μmol/L) of ions in the parenthesis; each constant value is ionic
equivalent conductance at 25°C. Alkalinity considered to be corresponded to bicarbonate ions (HCO3
-). (2) Ratio (R2) of calculations (Λcalc) to measurements (Λcalc) in electric conductivity is
calculated as follows; R2 = 100 x (Λcalc-Λmeas)/(Λcalc +Λmeas) [%]
(3) R2, which is calculated using the above equation, is compared with standard values in Table
5.6. Re-measurement, check with standard solutions, and/or inspection of calibration curves are necessary, when R2 is not within the range.
Table 5.6 Allowable ranges for R2 in different concentration ranges
Λmeas[mS/m] R2 [%] < 0.5
0.5 ~ 3 > 3
+ 20 ~ -20 +13 ~ -13
+9 ~ -9 Reference: “Technical Manual for Monitoring on Inland Aquatic Environment in East Asia (2000)”
112
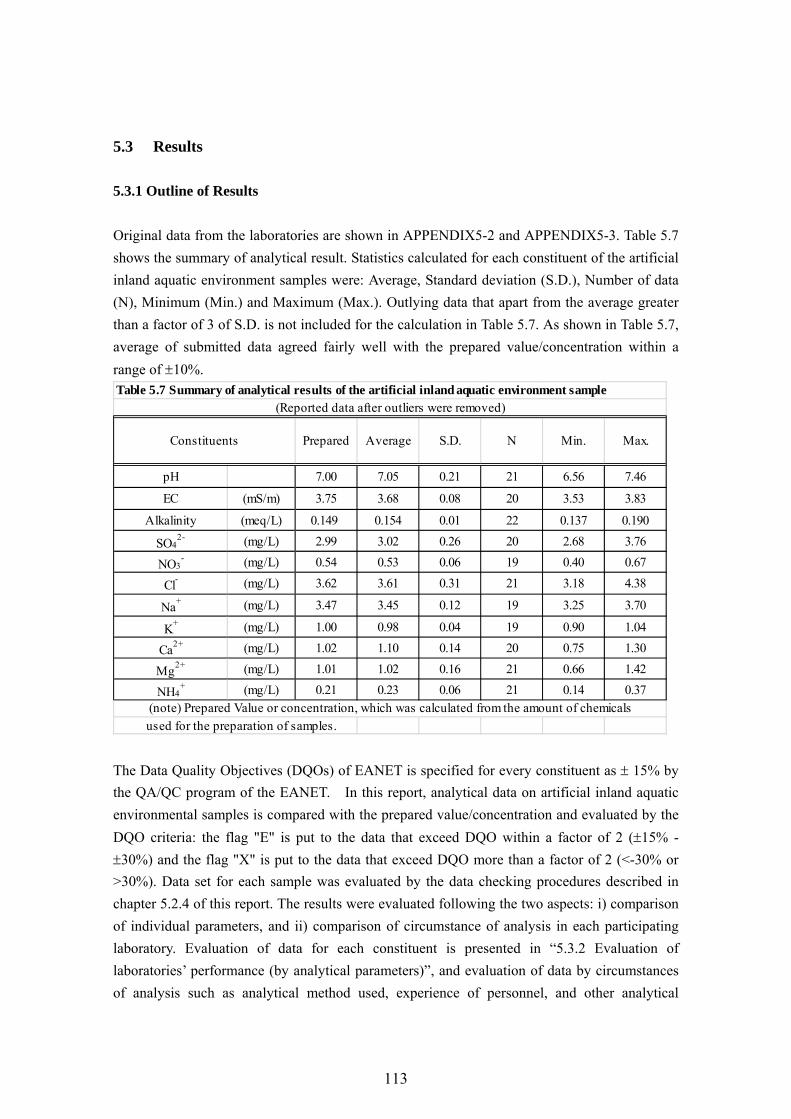
5.3 Results
5.3.1 Outline of Results
Original data from the laboratories are shown in APPENDIX5-2 and APPENDIX5-3. Table 5.7 shows the summary of analytical result. Statistics calculated for each constituent of the artificial inland aquatic environment samples were: Average, Standard deviation (S.D.), Number of data (N), Minimum (Min.) and Maximum (Max.). Outlying data that apart from the average greater than a factor of 3 of S.D. is not included for the calculation in Table 5.7. As shown in Table 5.7, average of submitted data agreed fairly well with the prepared value/concentration within a range of ±10%.
pH 7.00 7.05 0.21 21 6.56 7.46
EC (mS/m) 3.75 3.68 0.08 20 3.53 3.83
Alkalinity (meq/L) 0.149 0.154 0.01 22 0.137 0.190
SO42- (mg/L) 2.99 3.02 0.26 20 2.68 3.76
NO3- (mg/L) 0.54 0.53 0.06 19 0.40 0.67
Cl- (mg/L) 3.62 3.61 0.31 21 3.18 4.38
Na+ (mg/L) 3.47 3.45 0.12 19 3.25 3.70
K+ (mg/L) 1.00 0.98 0.04 19 0.90 1.04
Ca2+ (mg/L) 1.02 1.10 0.14 20 0.75 1.30
Mg2+ (mg/L) 1.01 1.02 0.16 21 0.66 1.42
NH4+ (mg/L) 0.21 0.23 0.06 21 0.14 0.37
used for the preparation of samples.(note) Prepared Value or concentration, which was calculated from the amount of chemicals
S.D. NConstituents Min. Max.
Table 5.7 Summary of analytical results of the artificial inland aquatic environment sample (Reported data after outliers were removed)
Prepared Average
The Data Quality Objectives (DQOs) of EANET is specified for every constituent as ± 15% by the QA/QC program of the EANET. In this report, analytical data on artificial inland aquatic environmental samples is compared with the prepared value/concentration and evaluated by the DQO criteria: the flag "E" is put to the data that exceed DQO within a factor of 2 (±15% - ±30%) and the flag "X" is put to the data that exceed DQO more than a factor of 2 (<-30% or >30%). Data set for each sample was evaluated by the data checking procedures described in chapter 5.2.4 of this report. The results were evaluated following the two aspects: i) comparison of individual parameters, and ii) comparison of circumstance of analysis in each participating laboratory. Evaluation of data for each constituent is presented in “5.3.2 Evaluation of laboratories’ performance (by analytical parameters)”, and evaluation of data by circumstances of analysis such as analytical method used, experience of personnel, and other analytical
113
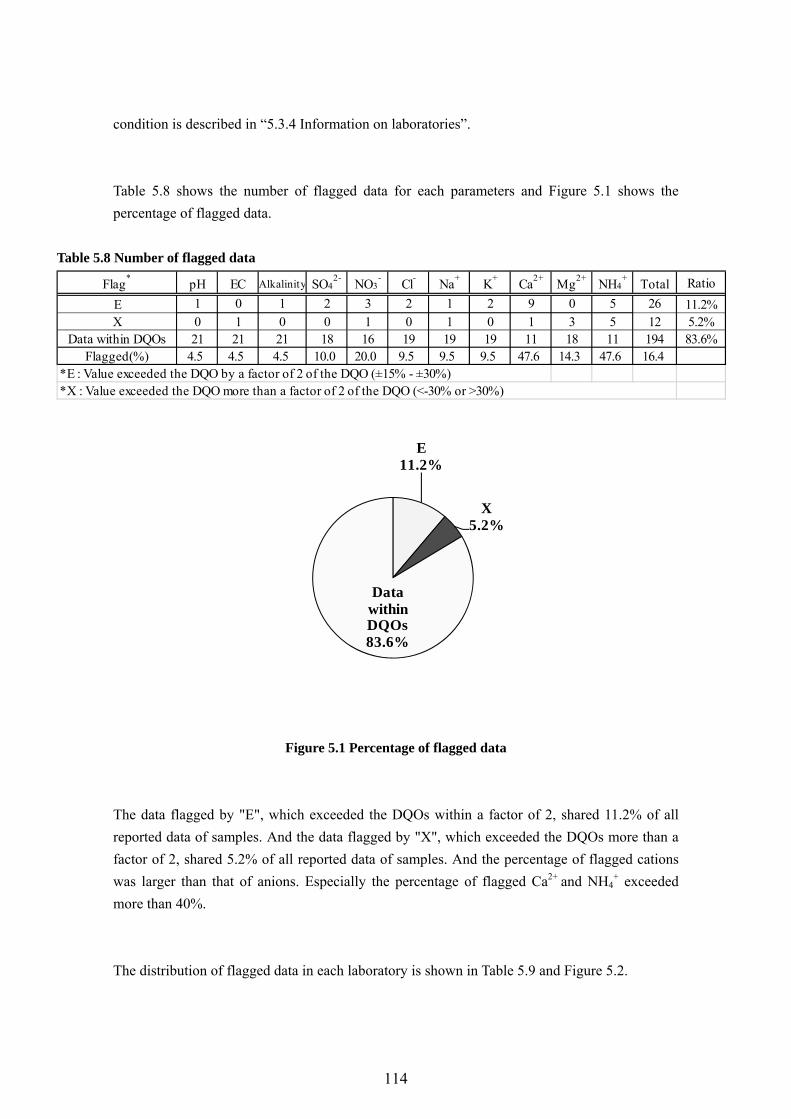
condition is described in “5.3.4 Information on laboratories”. Table 5.8 shows the number of flagged data for each parameters and Figure 5.1 shows the percentage of flagged data.
Table 5.8 Number of flagged data
Flag* pH EC Alkalinity SO42- NO3
- Cl- Na+ K+ Ca2+ Mg2+ NH4+ Total Ratio
E 1 0 1 2 3 2 1 2 9 0 5 26 11.2%X 0 1 0 0 1 0 1 0 1 3 5 12 5.2%
Data within DQOs 21 21 21 18 16 19 19 19 11 18 11 194 83.6%Flagged(%) 4.5 4.5 4.5 10.0 20.0 9.5 9.5 9.5 47.6 14.3 47.6 16.4
*E : Value exceeded the DQO by a factor of 2 of the DQO (±15% - ±30%)*X : Value exceeded the DQO more than a factor of 2 of the DQO (<-30% or >30%)
E11.2%
X5.2%
Data within DQOs83.6%
Figure 5.1 Percentage of flagged data
The data flagged by "E", which exceeded the DQOs within a factor of 2, shared 11.2% of all reported data of samples. And the data flagged by "X", which exceeded the DQOs more than a factor of 2, shared 5.2% of all reported data of samples. And the percentage of flagged cations was larger than that of anions. Especially the percentage of flagged Ca2+ and NH4
+ exceeded more than 40%.
The distribution of flagged data in each laboratory is shown in Table 5.9 and Figure 5.2.
114
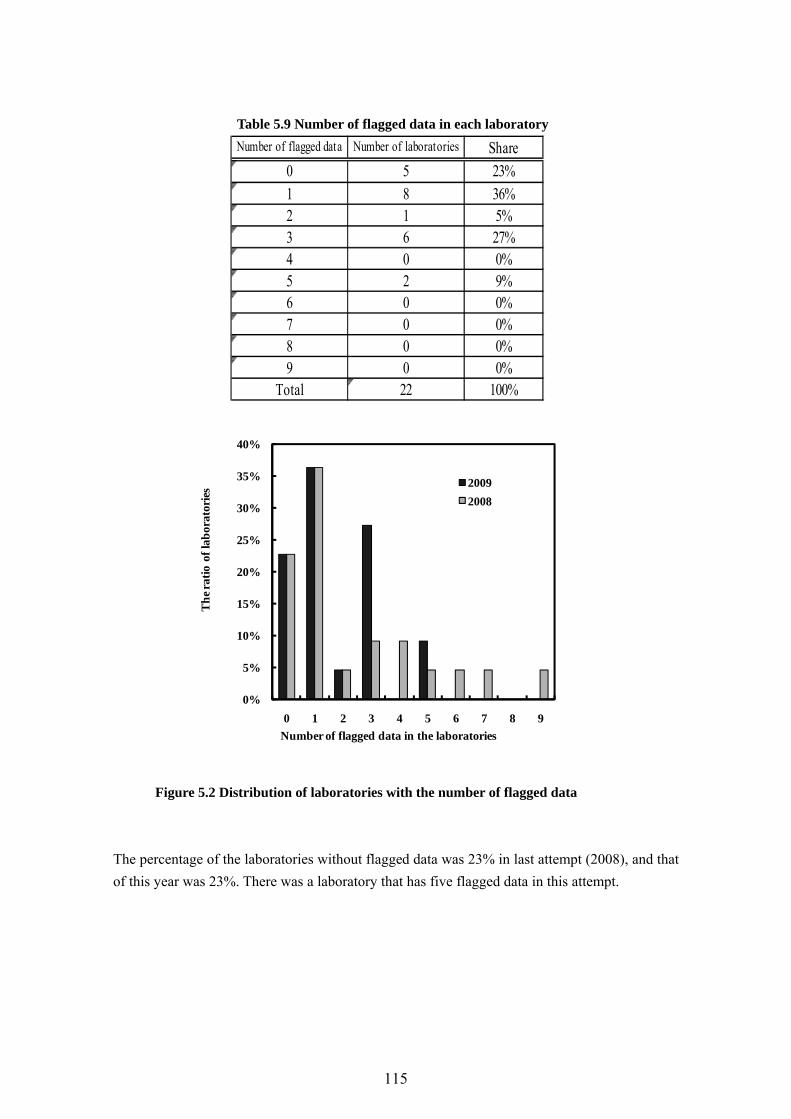
Table 5.9 Number of flagged data in each laboratory
Number of flagged data Number of laboratories Share0 5 23%1 8 36%2 1 5%3 6 27%4 0 0%5 2 9%6 0 0%7 0 0%8 0 0%9 0 0%
Total 22 100%
0%
5%
10%
15%
20%
25%
30%
35%
40%
0 1 2 3 4 5 6 7 8 9
Th
e ra
tio
of la
bor
ator
ies
Number of flagged data in the laboratories
2009
2008
Figure 5.2 Distribution of laboratories with the number of flagged data
The percentage of the laboratories without flagged data was 23% in last attempt (2008), and that of this year was 23%. There was a laboratory that has five flagged data in this attempt.
115
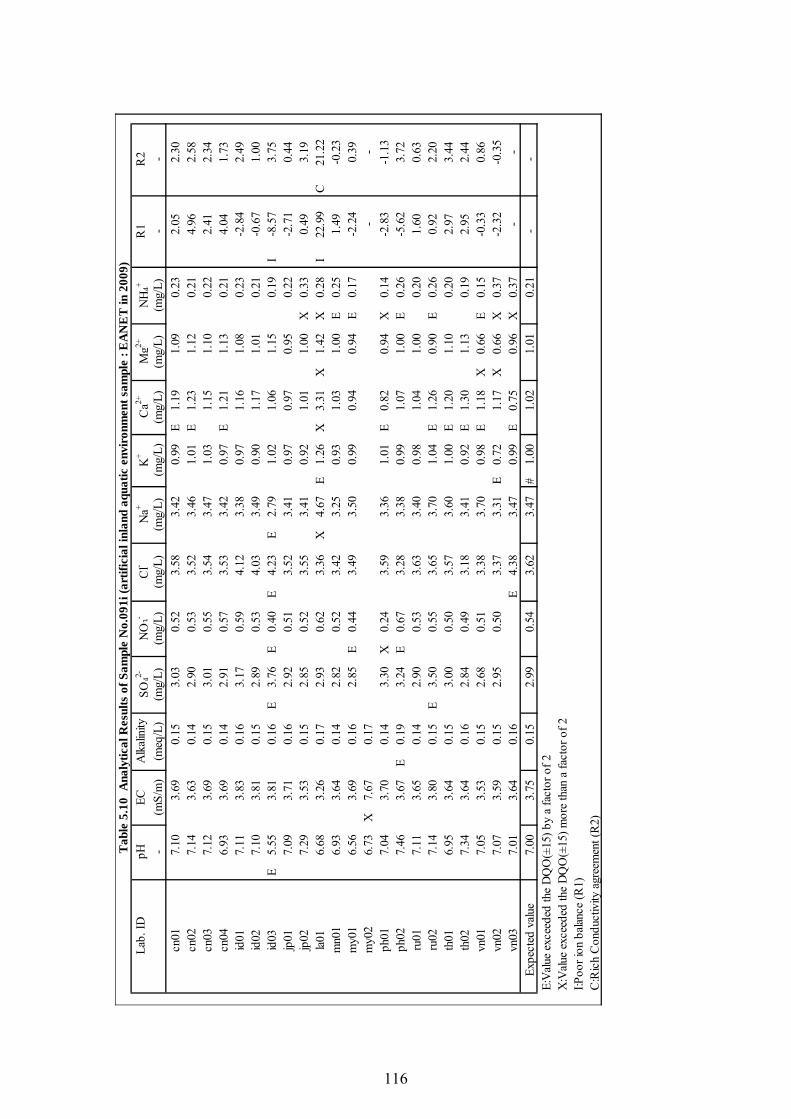
cn01
7.10
3.69
0.15
3.03
0.52
3.58
3.42
0.99
E1.
191.
090.
232.
052.
30cn
027.
143.
630.
142.
900.
533.
523.
461.
01E
1.23
1.12
0.21
4.96
2.58
cn03
7.12
3.69
0.15
3.01
0.55
3.54
3.47
1.03
1.15
1.10
0.22
2.41
2.34
cn04
6.93
3.69
0.14
2.91
0.57
3.53
3.42
0.97
E1.
211.
130.
214.
041.
73id
017.
113.
830.
163.
170.
594.
123.
380.
971.
161.
080.
23-2
.84
2.49
id02
7.10
3.81
0.15
2.89
0.53
4.03
3.49
0.90
1.17
1.01
0.21
-0.6
71.
00id
03E
5.55
3.81
0.16
E3.
76E
0.40
E4.
23E
2.79
1.02
1.06
1.15
0.19
I-8
.57
3.75
jp01
7.09
3.71
0.16
2.92
0.51
3.52
3.41
0.97
0.97
0.95
0.22
-2.7
10.
44jp
027.
293.
530.
152.
850.
523.
553.
410.
921.
011.
00X
0.33
0.49
3.19
la01
6.68
3.26
0.17
2.93
0.62
3.36
X4.
67E
1.26
X3.
31X
1.42
X0.
28I
22.9
9C
21.2
2m
n01
6.93
3.64
0.14
2.82
0.52
3.42
3.25
0.93
1.03
1.00
E0.
251.
49-0
.23
my0
16.
563.
690.
162.
85E
0.44
3.49
3.50
0.99
0.94
0.94
E0.
17-2
.24
0.39
my0
26.
73X
7.67
0.17
--
ph01
7.04
3.70
0.14
3.30
X0.
243.
593.
361.
01E
0.82
0.94
X0.
14-2
.83
-1.1
3ph
027.
463.
67E
0.19
3.24
E0.
673.
283.
380.
991.
071.
00E
0.26
-5.6
23.
72ru
017.
113.
650.
142.
900.
533.
633.
400.
981.
041.
000.
201.
600.
63ru
027.
143.
800.
15E
3.50
0.55
3.65
3.70
1.04
E1.
260.
90E
0.26
0.92
2.20
th01
6.95
3.64
0.15
3.00
0.50
3.57
3.60
1.00
E1.
201.
100.
202.
973.
44th
027.
343.
640.
162.
840.
493.
183.
410.
92E
1.30
1.13
0.19
2.95
2.44
vn01
7.05
3.53
0.15
2.68
0.51
3.38
3.70
0.98
E1.
18X
0.66
E0.
15-0
.33
0.86
vn02
7.07
3.59
0.15
2.95
0.50
3.37
3.31
E0.
721.
17X
0.66
X0.
37-2
.32
-0.3
5vn
037.
013.
640.
16E
4.38
3.47
0.99
E0.
750.
96X
0.37
--
Expe
cted
valu
e7.
003.
750.
152.
990.
543.
623.
47#
1.00
1.02
1.01
0.21
E:V
alue
exce
eded
the
DQ
O(±
15) b
y a
fact
or o
f 2
X:V
alue
exce
eded
the
DQ
O(±
15) m
ore
than
a fa
ctor
of 2
I:Poo
r ion
bala
nce
(R1)
C:R
ich
Con
duct
ivity
agr
eem
ent (
R2)
Alk
alini
tyN
O3-
Cl-
Na+
K+
Ca2+
Mg2+
NH
4+
Tab
le 5
.10
Ana
lyti
cal R
esul
ts o
f S
ampl
e N
o.09
1i (
arti
fici
al in
land
aqu
atic
env
iron
men
t sa
mpl
e : E
AN
ET
in 2
009)
(meq
/L)
Lab.
IDpH
ECSO
42-R
1R
2-
(mS/
m)
(mg/
L)(m
g/L)
(mg/
L)(m
g/L)
(mg/
L)-
--
(mg/
L)(m
g/L)
(mg/
L)-
116
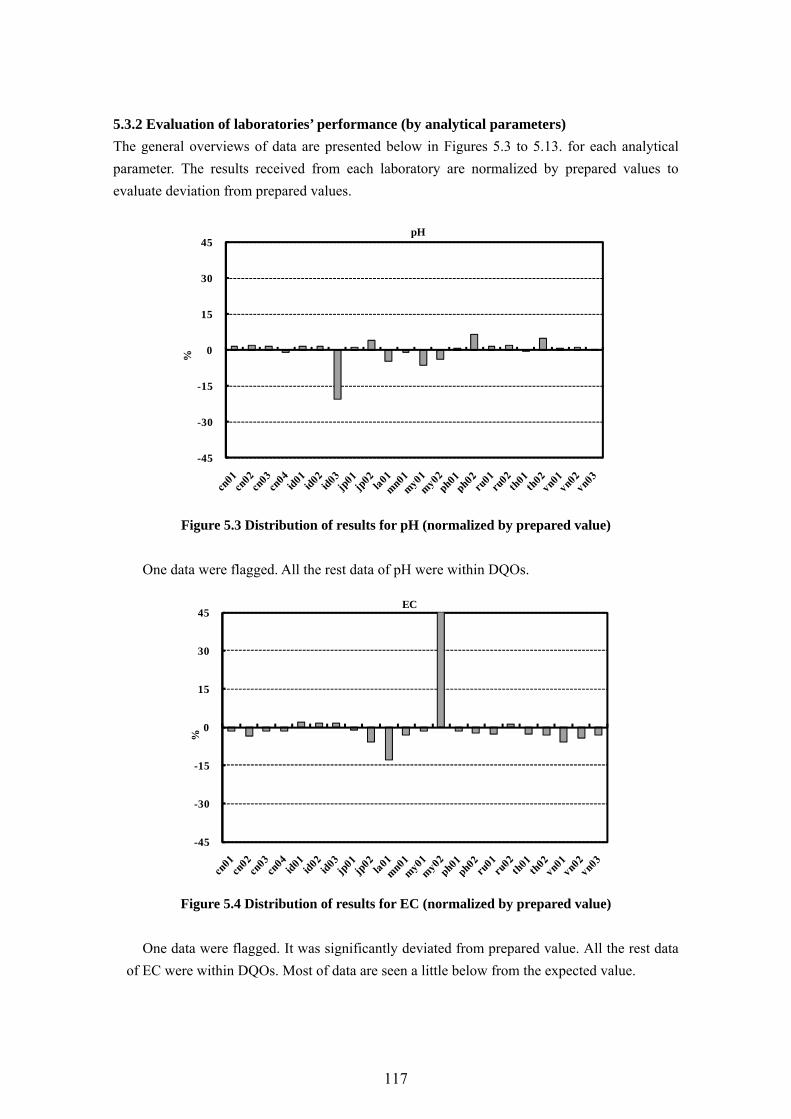
5.3.2 Evaluation of laboratories’ performance (by analytical parameters)
The general overviews of data are presented below in Figures 5.3 to 5.13. for each analytical parameter. The results received from each laboratory are normalized by prepared values to evaluate deviation from prepared values.
-45
-30
-15
0
15
30
45
%
pH
Figure 5.3 Distribution of results for pH (normalized by prepared value)
One data were flagged. All the rest data of pH were within DQOs.
-45
-30
-15
0
15
30
45
%
EC
Figure 5.4 Distribution of results for EC (normalized by prepared value)
One data were flagged. It was significantly deviated from prepared value. All the rest data
of EC were within DQOs. Most of data are seen a little below from the expected value.
117
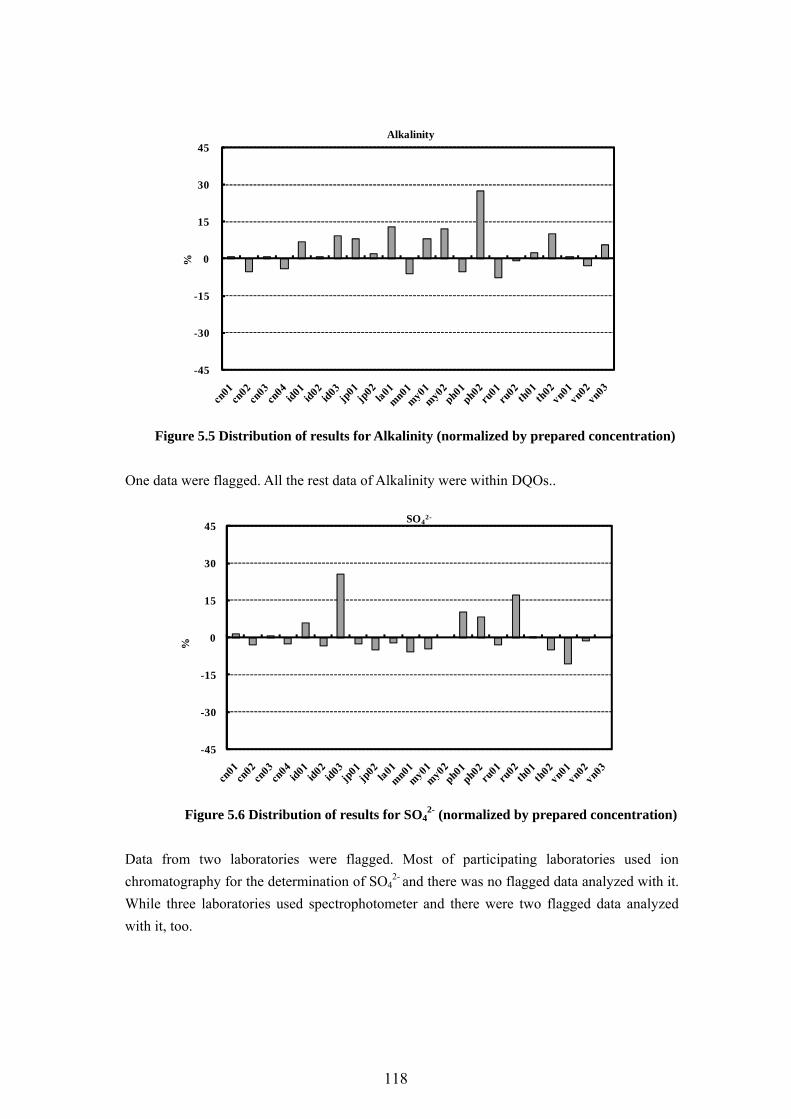
-45
-30
-15
0
15
30
45
%
Alkalinity
Figure 5.5 Distribution of results for Alkalinity (normalized by prepared concentration)
One data were flagged. All the rest data of Alkalinity were within DQOs..
-45
-30
-15
0
15
30
45
%
SO42-
Figure 5.6 Distribution of results for SO4
2- (normalized by prepared concentration)
Data from two laboratories were flagged. Most of participating laboratories used ion chromatography for the determination of SO4
2- and there was no flagged data analyzed with it. While three laboratories used spectrophotometer and there were two flagged data analyzed with it, too.
118
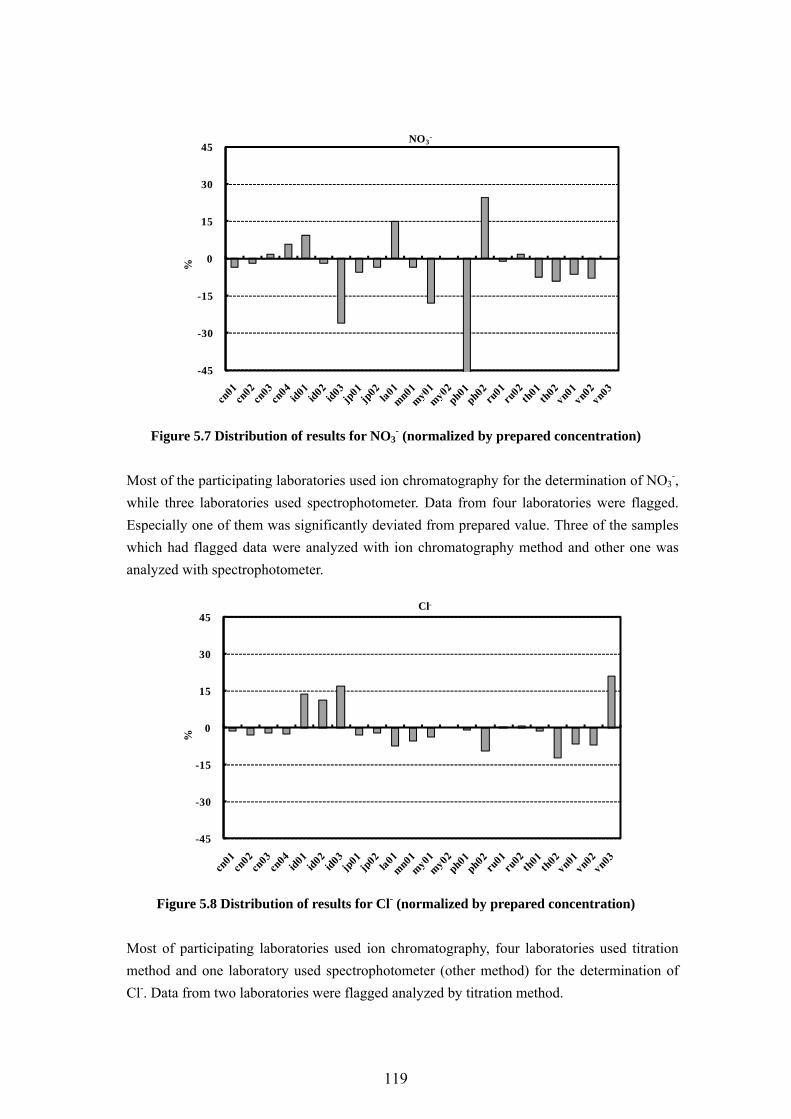
-45
-30
-15
0
15
30
45
%
NO3-
Figure 5.7 Distribution of results for NO3
- (normalized by prepared concentration)
Most of the participating laboratories used ion chromatography for the determination of NO3-,
while three laboratories used spectrophotometer. Data from four laboratories were flagged. Especially one of them was significantly deviated from prepared value. Three of the samples which had flagged data were analyzed with ion chromatography method and other one was analyzed with spectrophotometer.
-45
-30
-15
0
15
30
45
%
Cl-
Figure 5.8 Distribution of results for Cl- (normalized by prepared concentration)
Most of participating laboratories used ion chromatography, four laboratories used titration method and one laboratory used spectrophotometer (other method) for the determination of Cl-. Data from two laboratories were flagged analyzed by titration method.
119
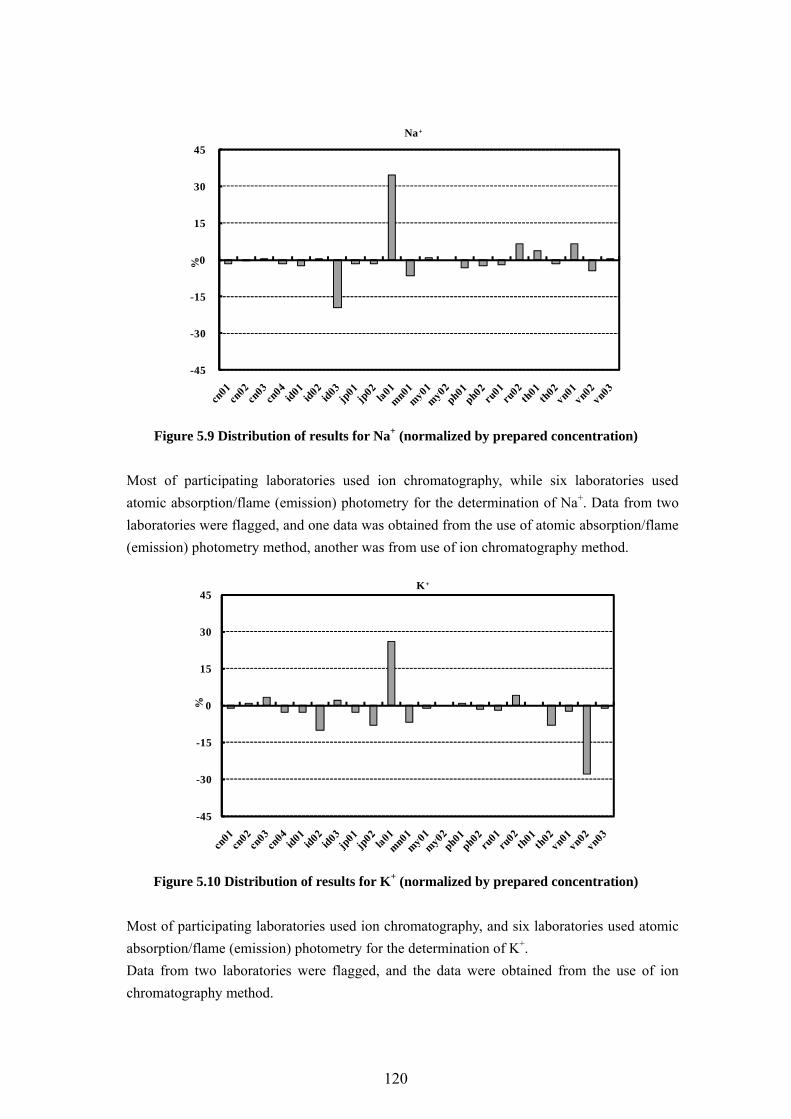
-45
-30
-15
0
15
30
45
%
Na+
Figure 5.9 Distribution of results for Na+ (normalized by prepared concentration)
Most of participating laboratories used ion chromatography, while six laboratories used atomic absorption/flame (emission) photometry for the determination of Na+. Data from two laboratories were flagged, and one data was obtained from the use of atomic absorption/flame (emission) photometry method, another was from use of ion chromatography method.
-45
-30
-15
0
15
30
45
%
K+
Figure 5.10 Distribution of results for K+ (normalized by prepared concentration)
Most of participating laboratories used ion chromatography, and six laboratories used atomic absorption/flame (emission) photometry for the determination of K+. Data from two laboratories were flagged, and the data were obtained from the use of ion chromatography method.
120
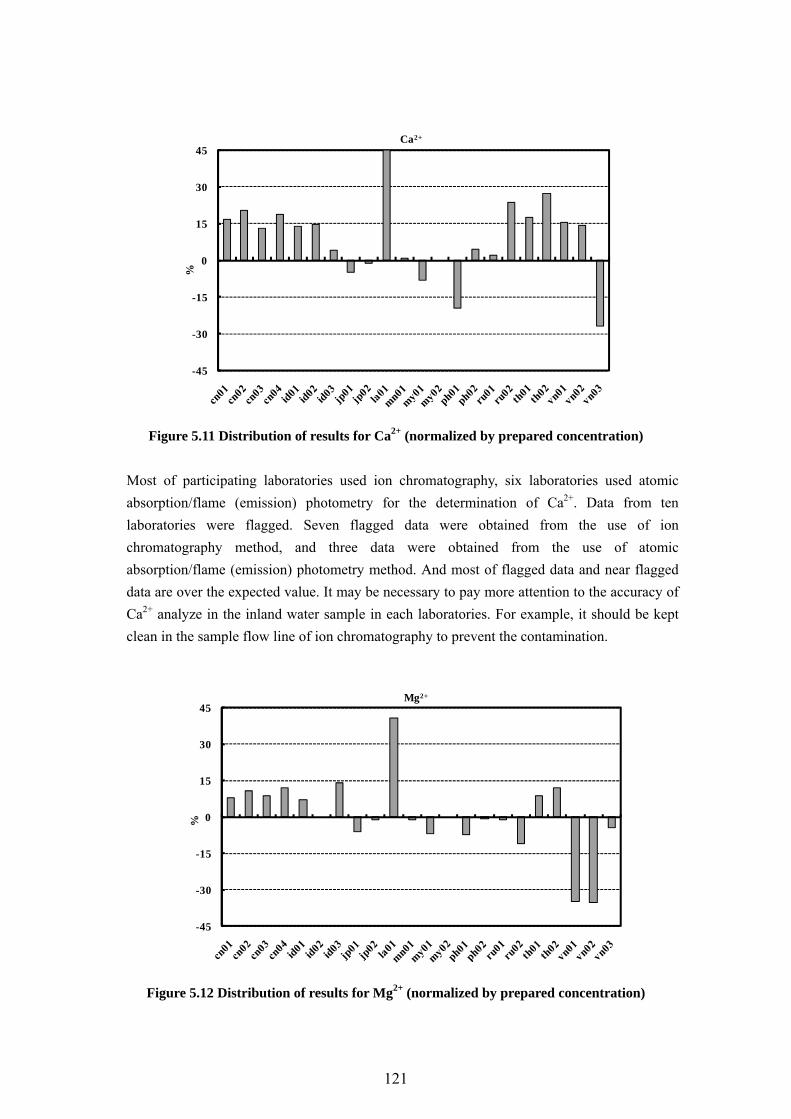
-45
-30
-15
0
15
30
45
%
Ca2+
Figure 5.11 Distribution of results for Ca2+ (normalized by prepared concentration)
Most of participating laboratories used ion chromatography, six laboratories used atomic absorption/flame (emission) photometry for the determination of Ca2+. Data from ten laboratories were flagged. Seven flagged data were obtained from the use of ion chromatography method, and three data were obtained from the use of atomic absorption/flame (emission) photometry method. And most of flagged data and near flagged data are over the expected value. It may be necessary to pay more attention to the accuracy of Ca2+ analyze in the inland water sample in each laboratories. For example, it should be kept clean in the sample flow line of ion chromatography to prevent the contamination.
-45
-30
-15
0
15
30
45
%
Mg2+
Figure 5.12 Distribution of results for Mg2+ (normalized by prepared concentration)
121
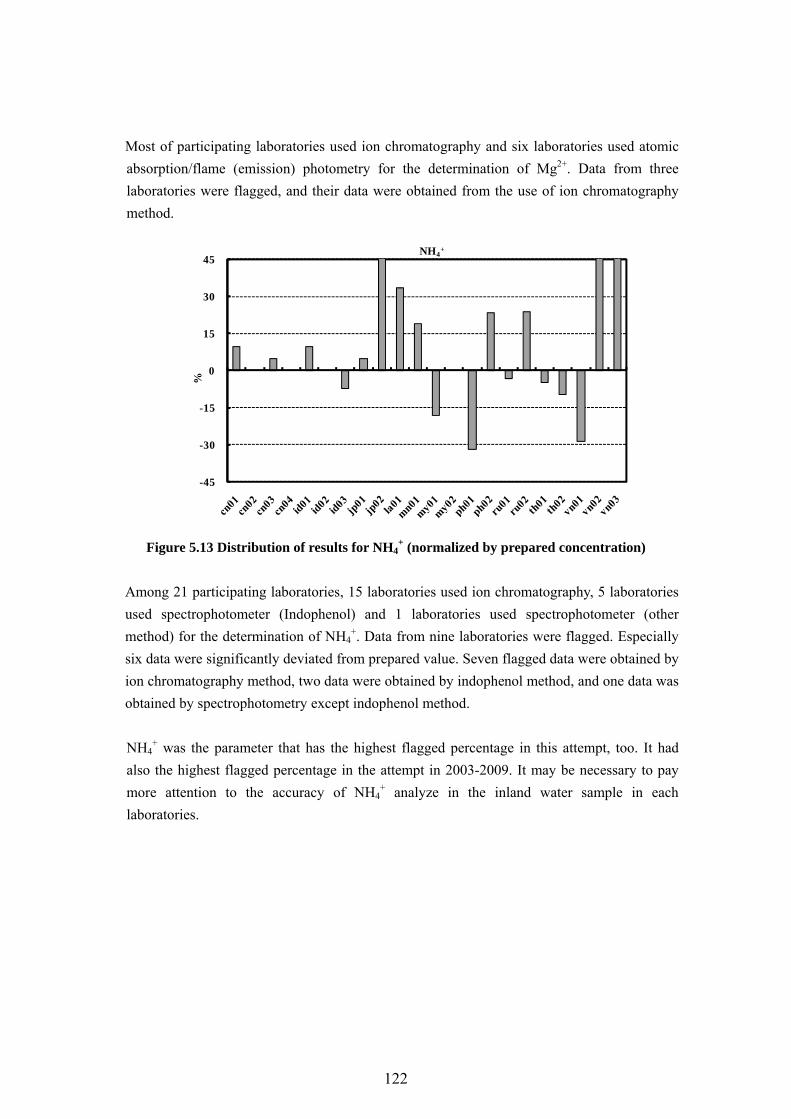
Most of participating laboratories used ion chromatography and six laboratories used atomic absorption/flame (emission) photometry for the determination of Mg2+. Data from three laboratories were flagged, and their data were obtained from the use of ion chromatography method.
-45
-30
-15
0
15
30
45
%
NH4+
Figure 5.13 Distribution of results for NH4
+ (normalized by prepared concentration)
Among 21 participating laboratories, 15 laboratories used ion chromatography, 5 laboratories used spectrophotometer (Indophenol) and 1 laboratories used spectrophotometer (other method) for the determination of NH4
+. Data from nine laboratories were flagged. Especially six data were significantly deviated from prepared value. Seven flagged data were obtained by ion chromatography method, two data were obtained by indophenol method, and one data was obtained by spectrophotometry except indophenol method. NH4
+ was the parameter that has the highest flagged percentage in this attempt, too. It had also the highest flagged percentage in the attempt in 2003-2009. It may be necessary to pay more attention to the accuracy of NH4
+ analyze in the inland water sample in each laboratories.
122
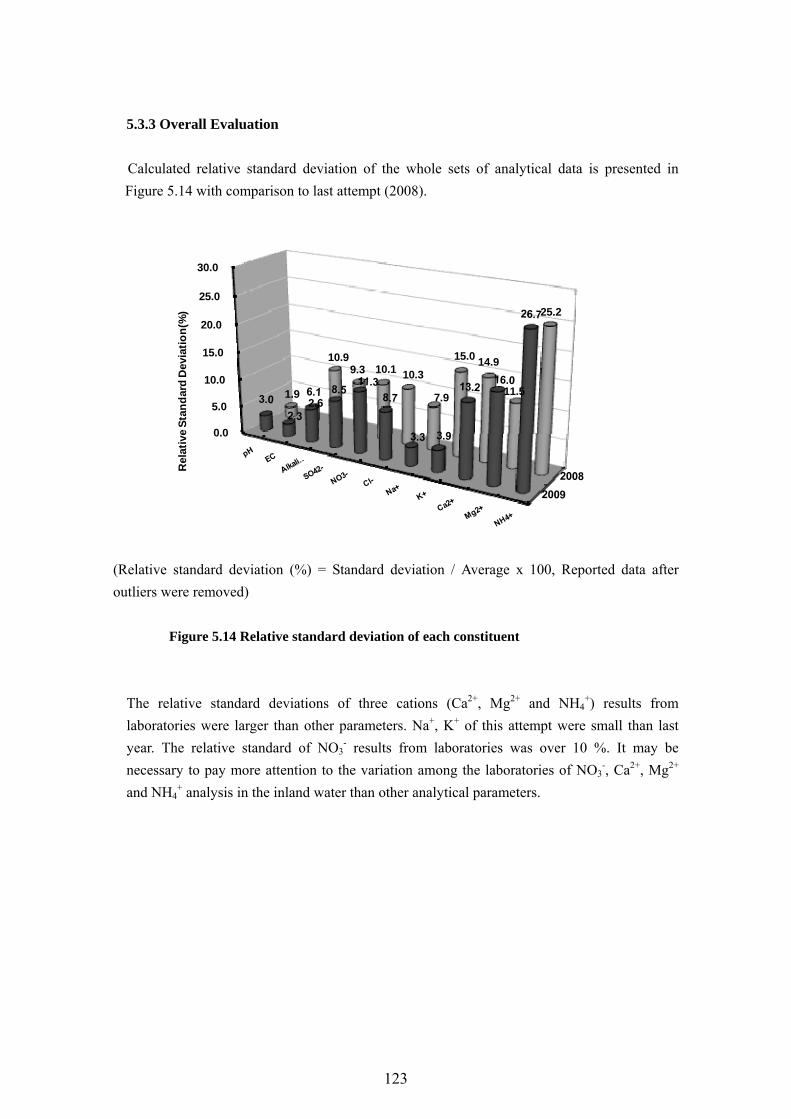
5.3.3 Overall Evaluation
Calculated relative standard deviation of the whole sets of analytical data is presented in Figure 5.14 with comparison to last attempt (2008).
0.0
5.0
10.0
15.0
20.0
25.0
30.0
1.9 2.6
10.9 9.3 10.1 10.3
7.9
15.0 14.9
11.5
25.2
Rel
ativ
e S
tan
dar
d D
evia
tio
n(%
)
(Relative standard deviation (%) = Standard deviation / Average x 100, Reported data after outliers were removed)
Figure 5.14 Relative standard deviation of each constituent
The relative standard deviations of three cations (Ca2+, Mg2+ and NH4+) results from
laboratories were larger than other parameters. Na+, K+ of this attempt were small than last year. The relative standard of NO3
- results from laboratories was over 10 %. It may be necessary to pay more attention to the variation among the laboratories of NO3
-, Ca2+, Mg2+ and NH4
+ analysis in the inland water than other analytical parameters.
123
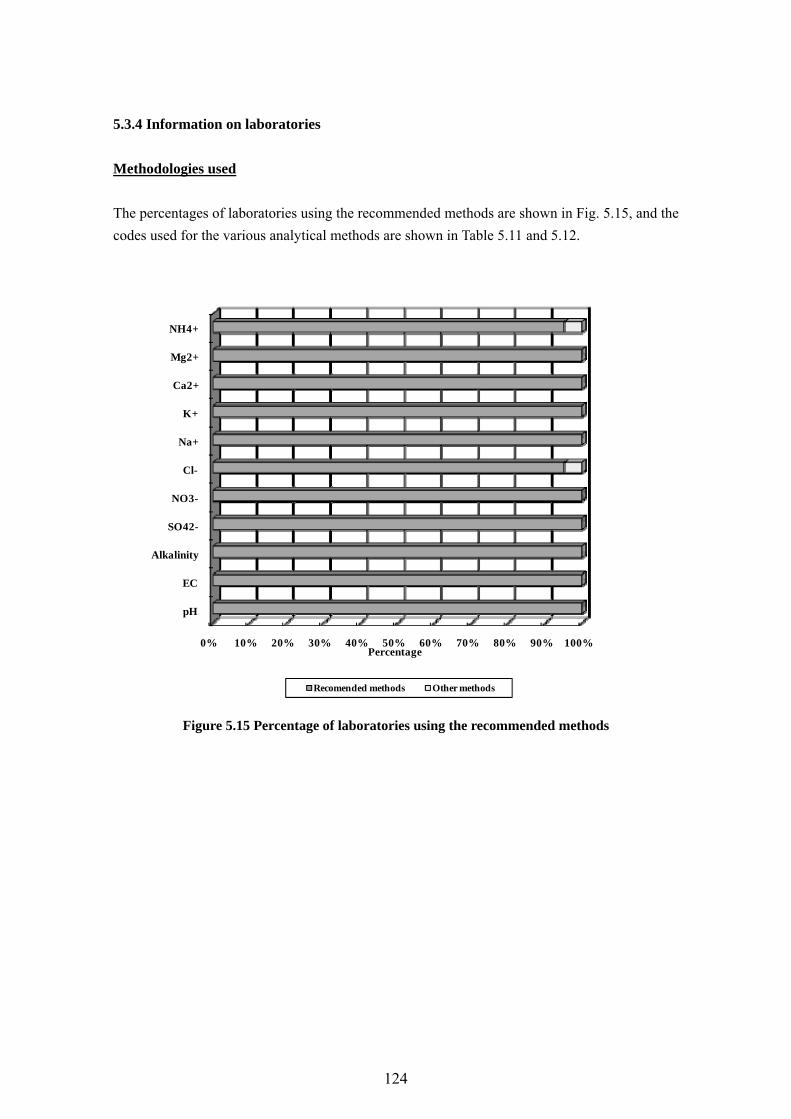
5.3.4 Information on laboratories
Methodologies used
The percentages of laboratories using the recommended methods are shown in Fig. 5.15, and the codes used for the various analytical methods are shown in Table 5.11 and 5.12.
0% 10% 20% 30% 40% 50% 60% 70% 80% 90% 100%
pH
EC
Alkalinity
SO42-
NO3-
Cl-
Na+
K+
Ca2+
Mg2+
NH4+
Percentage
Recomended methods Other methods
Figure 5.15 Percentage of laboratories using the recommended methods
124
Table 5.11 List of methods
Code Method 0 1 2 3 4 5 6 7 8 9
10 11
pH meter with electrode Conductivity cell Titration Atomic absorption / Flame (emission) photometry Ion chromatography Inductively Coupled Plasma - Atomic Emission Spectrometry (ICP - AES) Calculation Spectrophotometry Spectrophotometry (Indophenol blue) Inductively Coupled Plasma - Mass Spectrometry (ICP - MS) Graphite Furnace Atomic Absorption spectrometry (GFAA) Other method
Table 5.12 Analytical methods
Code pH EC Alkalinity SO42- NO3
- Cl- Na+ K+ Ca2+ Mg2+ NH4+
0 22(1)1 22(1)2 22(1) 4(2)3 6(1) 6 6(3) 64 17 17(3) 16 15(1) 15(2) 15(7) 15(3) 15(7)567 3(2) 3(1) 1 1(1)8 5(2)91011
Flagged E 1 0 1 2 3 2 1 2 9 0 5Flagged X 0 1 0 0 1 0 1 0 1 3 5
Reverse mesh is a recommended method of EANET( ) : Number of data, which flagged by "E" or "X"
The participating laboratories used recommended methods of EANET except measurement of Cl- and NH4
+. One laboratories used spectrophotometer instead of indophenol blue for NH4+
analysis, and its data was flagged. One laboratory used spectrophotometer for Cl-. The percentages of flagged cations were larger than those of anions. For the determination of cations, most of participating laboratories used ion chromatography, and some of them used atomic absorption/flame (emission) photometry. There is a tendency the laboratories without ion chromatography has many flagged data more than laboratories with IC, however 2 of 6 the laboratories without ion chromatography has no flagged data in this attempt.
125
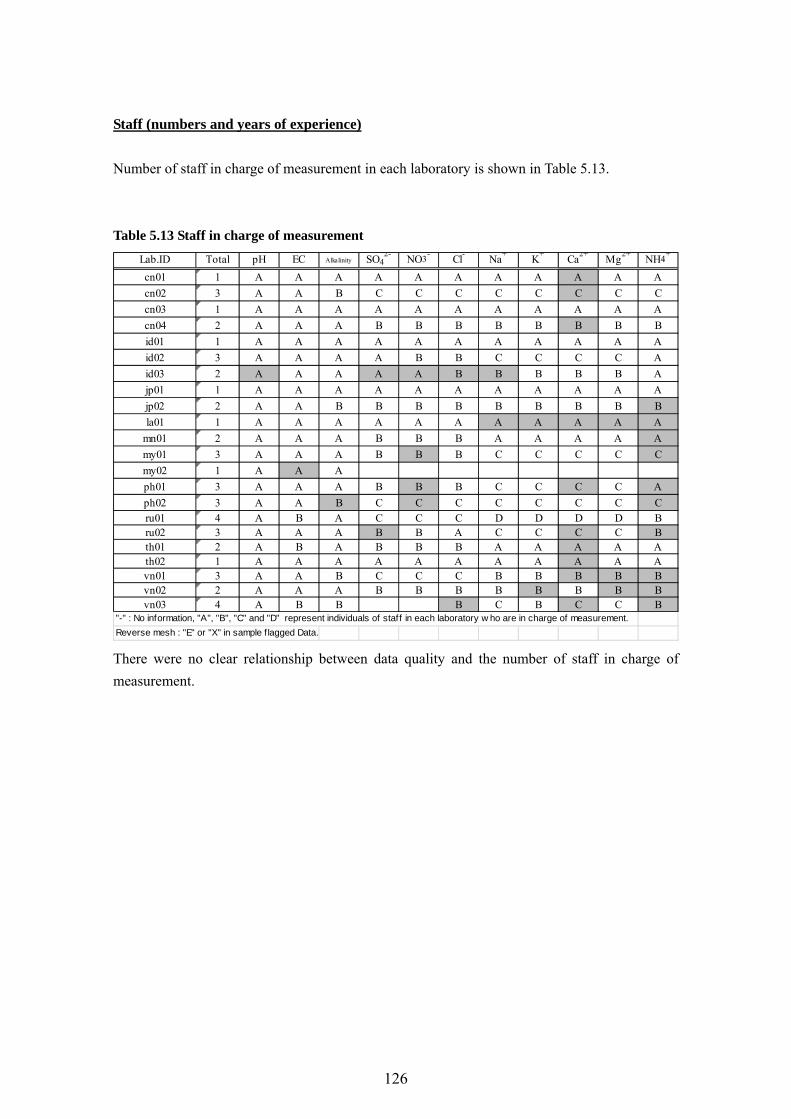
Staff (numbers and years of experience)
Number of staff in charge of measurement in each laboratory is shown in Table 5.13. Table 5.13 Staff in charge of measurement
Lab.ID Total pH EC Alkalinity SO42- NO3- Cl- Na+ K+ Ca2+ Mg2+ NH4+
cn01 1 A A A A A A A A A A Acn02 3 A A B C C C C C C C Ccn03 1 A A A A A A A A A A Acn04 2 A A A B B B B B B B Bid01 1 A A A A A A A A A A Aid02 3 A A A A B B C C C C Aid03 2 A A A A A B B B B B Ajp01 1 A A A A A A A A A A Ajp02 2 A A B B B B B B B B Bla01 1 A A A A A A A A A A A
mn01 2 A A A B B B A A A A Amy01 3 A A A B B B C C C C Cmy02 1 A A Aph01 3 A A A B B B C C C C Aph02 3 A A B C C C C C C C Cru01 4 A B A C C C D D D D Bru02 3 A A A B B A C C C C Bth01 2 A B A B B B A A A A Ath02 1 A A A A A A A A A A Avn01 3 A A B C C C B B B B Bvn02 2 A A A B B B B B B B Bvn03 4 A B B B C B C C B
"-" : No information, "A", "B", "C" and "D" represent individuals of staff in each laboratory w ho are in charge of measurement. Reverse mesh : "E" or "X" in sample f lagged Data.
There were no clear relationship between data quality and the number of staff in charge of measurement.
126
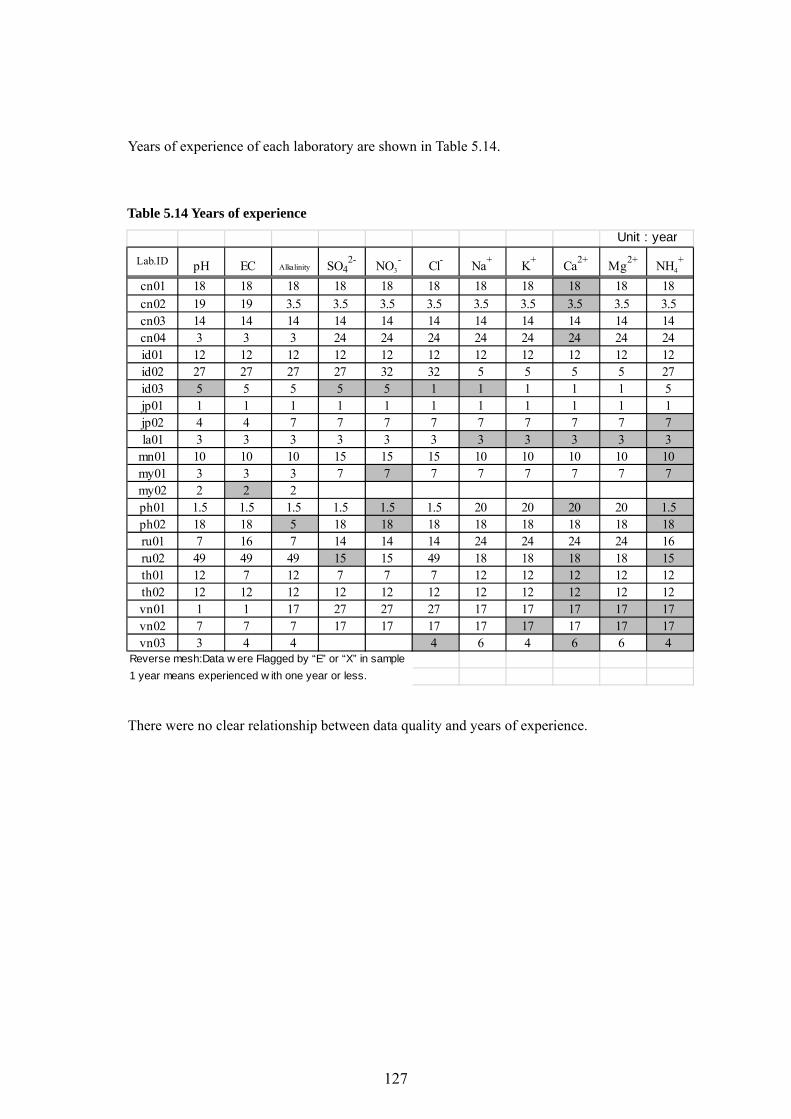
Years of experience of each laboratory are shown in Table 5.14.
Table 5.14 Years of experience
Lab.ID pH EC Alkalinity SO42- NO3
- Cl- Na+ K+ Ca2+ Mg2+ NH4+
cn01 18 18 18 18 18 18 18 18 18 18 18cn02 19 19 3.5 3.5 3.5 3.5 3.5 3.5 3.5 3.5 3.5cn03 14 14 14 14 14 14 14 14 14 14 14cn04 3 3 3 24 24 24 24 24 24 24 24id01 12 12 12 12 12 12 12 12 12 12 12id02 27 27 27 27 32 32 5 5 5 5 27id03 5 5 5 5 5 1 1 1 1 1 5jp01 1 1 1 1 1 1 1 1 1 1 1jp02 4 4 7 7 7 7 7 7 7 7 7la01 3 3 3 3 3 3 3 3 3 3 3
mn01 10 10 10 15 15 15 10 10 10 10 10my01 3 3 3 7 7 7 7 7 7 7 7my02 2 2 2ph01 1.5 1.5 1.5 1.5 1.5 1.5 20 20 20 20 1.5ph02 18 18 5 18 18 18 18 18 18 18 18ru01 7 16 7 14 14 14 24 24 24 24 16ru02 49 49 49 15 15 49 18 18 18 18 15th01 12 7 12 7 7 7 12 12 12 12 12th02 12 12 12 12 12 12 12 12 12 12 12vn01 1 1 17 27 27 27 17 17 17 17 17vn02 7 7 7 17 17 17 17 17 17 17 17vn03 3 4 4 4 6 4 6 6 4
Reverse mesh:Data w ere Flagged by “E” or “X” in sample1 year means experienced w ith one year or less.
Unit : year
There were no clear relationship between data quality and years of experience.
127
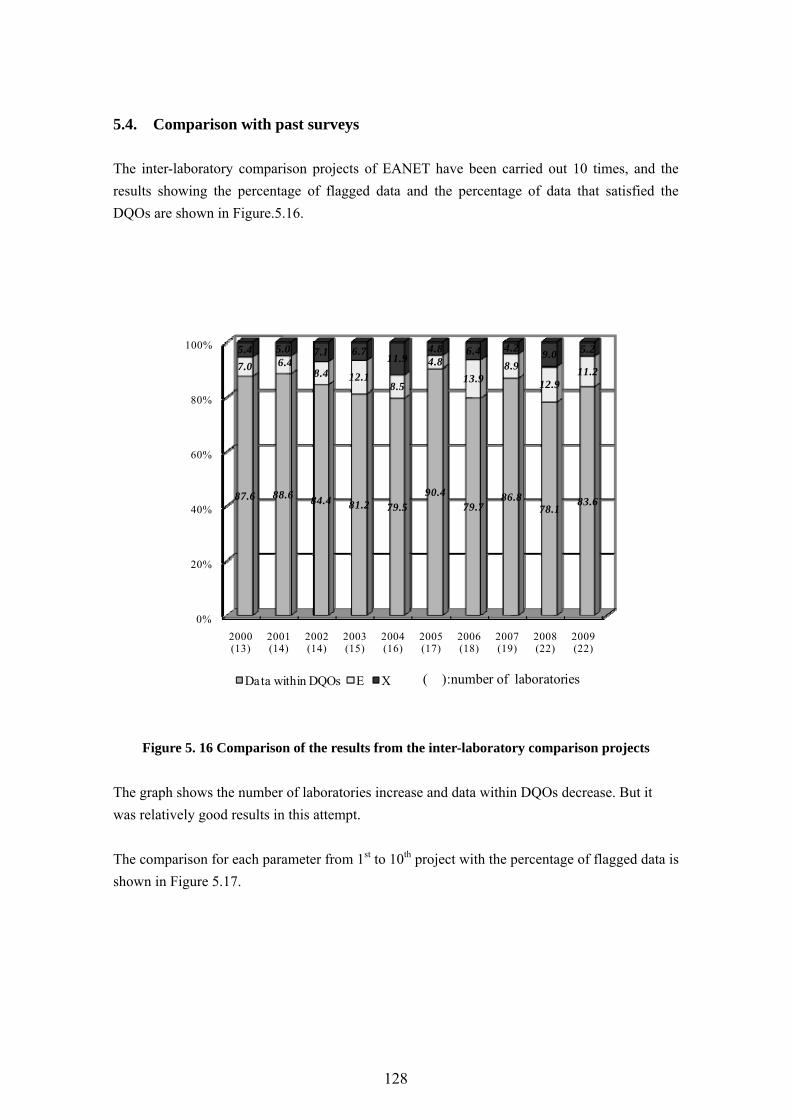
5.4. Comparison with past surveys The inter-laboratory comparison projects of EANET have been carried out 10 times, and the results showing the percentage of flagged data and the percentage of data that satisfied the DQOs are shown in Figure.5.16.
0%
20%
40%
60%
80%
100%
2000(13)
2001(14)
2002(14)
2003(15)
2004(16)
2005(17)
2006(18)
2007(19)
2008(22)
2009(22)
87.6 88.6 84.4 81.2 79.5 90.4
79.7 86.8
78.1 83.6
7.0 6.4 8.4 12.1
8.5
4.8 13.9
8.9
12.9 11.2
5.4 5.0 7.1 6.7 11.9 4.8 6.4 4.2 9.0 5.2
Data within DQOs E X ( ):number of laboratories
Figure 5. 16 Comparison of the results from the inter-laboratory comparison projects
The graph shows the number of laboratories increase and data within DQOs decrease. But it was relatively good results in this attempt. The comparison for each parameter from 1st to 10th project with the percentage of flagged data is shown in Figure 5.17.
128
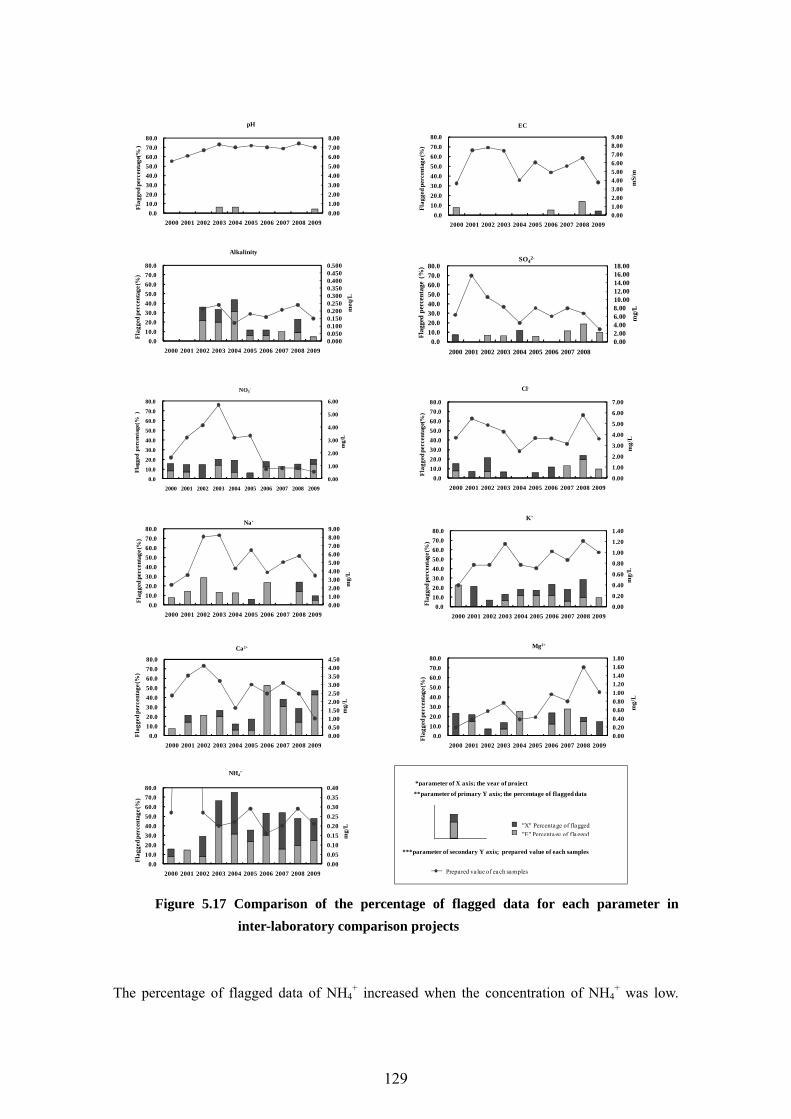
0.00
1.00
2.00
3.00
4.00
5.00
6.00
0.0
10.0
20.0
30.0
40.0
50.0
60.0
70.0
80.0
2000 2001 2002 2003 2004 2005 2006 2007 2008 2009
mg/
L
NO3-
Fla
gged
per
cen
tage
(% )
0.00
1.00
2.00
3.00
4.00
5.00
6.00
7.00
0.0
10.0
20.0
30.0
40.0
50.0
60.0
70.0
80.0
2000 2001 2002 2003 2004 2005 2006 2007 2008 2009
mg/
L
Cl-
Fla
gged
per
cent
age(
%)
0.002.004.006.008.0010.0012.0014.0016.0018.00
0.0 10.0
20.0
30.0 40.0
50.0
60.0 70.0
80.0
2000 2001 2002 2003 2004 2005 2006 2007 2008
mg/
L
SO42-
Fla
gged
per
cen
tage
(%
)
0.001.002.003.004.005.006.007.008.009.00
0.0
10.0
20.0
30.0
40.0
50.0
60.0
70.0
80.0
2000 2001 2002 2003 2004 2005 2006 2007 2008 2009
mS/
m
EC
Fla
gged
per
cent
age (
%)
0.00
1.00
2.00
3.00
4.00
5.00
6.00
7.00
8.00
0.0
10.0
20.0
30.0
40.0
50.0
60.0
70.0
80.0
2000 2001 2002 2003 2004 2005 2006 2007 2008 2009
pH
Fla
gged
per
cent
age(
% )
0.001.002.003.004.005.006.007.008.009.00
0.0
10.0
20.0
30.0
40.0
50.0
60.0
70.0
80.0
2000 2001 2002 2003 2004 2005 2006 2007 2008 2009
mg/
L
Na+
Fla
gged
per
cent
age (
%)
0.00
0.20
0.40
0.60
0.80
1.00
1.20
1.40
0.0
10.0
20.0
30.0
40.0
50.0
60.0
70.0
80.0
2000 2001 2002 2003 2004 2005 2006 2007 2008 2009
mg/
L
K+
Fla
gged
per
cent
age (
%)
0.000.501.001.502.002.503.003.504.004.50
0.0
10.0
20.0
30.0
40.0
50.0
60.0
70.0
80.0
2000 2001 2002 2003 2004 2005 2006 2007 2008 2009
mg/
L
Ca2+
Fla
gged
per
cent
age (
%)
0.000.200.400.600.801.001.201.401.601.80
0.0
10.0
20.0
30.0
40.0
50.0
60.0
70.0
80.0
2000 2001 2002 2003 2004 2005 2006 2007 2008 2009
mg/
L
Mg2+
Fla
gged
per
cent
age (
%)
0.00
0.05
0.10
0.15
0.20
0.25
0.30
0.35
0.40
0.0
10.0
20.0
30.0
40.0
50.0
60.0
70.0
80.0
2000 2001 2002 2003 2004 2005 2006 2007 2008 2009
mg/
L
NH4+
Fla
gged
per
cent
age (
%)
0.000 0.050 0.100 0.150 0.200 0.250 0.300 0.350 0.400 0.450 0.500
0.0
10.0
20.0
30.0
40.0
50.0
60.0
70.0
80.0
2000 2001 2002 2003 2004 2005 2006 2007 2008 2009m
eq/L
Alkalinity
Fla
gged
per
cent
age (
%)
**parameter of primary Y axis; the percentage of flagged data
*parameter of X axis; the year of project
***parameter of secondary Y axis; prepared value of each samples
"E" Percentage of flagged"X" Percentage of flagged
Prepared value of each samples
Figure 5.17 Comparison of the percentage of flagged data for each parameter in
inter-laboratory comparison projects
The percentage of flagged data of NH4
+ increased when the concentration of NH4+ was low.
129
Concerning other parameters, there were no clear relationship between the concentration and the percentage of flagged data. The percentages of flagged cations were larger than those of anions in this project. Especially the percentages of flagged Ca2+ and NH4
+ were more than 25%. The percentage of flagged NH4+
was larger than other parameters in every survey except 1st- 3rd project. The percentage of flagged Ca2+ of 7th - 10th project was relatively high. It was not clear why the number of flagged data for Ca2+ increased. In this project the percentage flagged K+ was lower than last attempt.
But it seems that there is necessity to pay attention to the analysis of Ca2+ and NH4+ in inland
aquatic water.
130
5.5. Recommendations for improvement
The following fundamental matters should be taken into account in measurement, analysis, and data control processes for improvement of precision. The analytical method for analyzing an inland aquatic water sample is almost the same as that for analyzing wet deposition samples. Therefore the recommendations for improvements listed below are similar. 5.5.1 Measurement and Analysis
1) General
►Clearance from contamination of the apparatus, materials and reagents used for measurement and analysis must be confirmed beforehand.
►Blank values of target substances should be as low as possible. ►Measurement and analysis should be conducted by persons who are well trained. ►To maintain high analytical quality, SOPs must be prepared for the management of
apparatus, reagents, and procedure of operation. 2) Deionized water ►Water with conductivity less than 0.15mS/m is acceptable for measurements, analyses,
dilution of precipitation samples and cleaning. 3) Certified materials and certified samples ►The measurements are evaluated by comparison of measured results of samples and
certified materials. ►In order to assure the reliability of measurements, the certified solutions and materials
should be used as much as possible. 4) Pretreatment of samples at analytical laboratory ►Conductivity and pH should be measured as soon as possible after sample receiving, and
checking agreement of samples and sample list. ►Effort should be made to start analysis of the other parameters within a week of sample
arrival in the laboratory and to complete the data sets by measuring EC, pH and all other chemical parameters.
5) Calibration of analytical instruments ►Each of the analytical instruments must be calibrated when they are used, and they should
be adjusted as appropriate.
131
5.5.2 Evaluation of reliability
1) Sensitivity fluctuation of analytical instruments
When numerous samples are measured, measurements should only be continued after confirming that the sensitivity fluctuation is within the prescribed range.
For example, in Ion chromatography ►A new calibration should be performed before the measurements are reached to over 30
samples. ►Reference materials should be measured after the calibration. It should also be done once or
twice before the next calibration.
►Control charts should be applied for the measurement of the reference materials. ►Standard solutions and reference solutions must be prepared from different stock solutions
in order to be independent. ►If the results of the control solutions are outside of 3 standard deviations, or out of 15 %
from the expected value, the reasons should be found and corrections should be made, and reference solution should be measured again.
►If the retention time changes slowly while the separator column is deteriorating, then adequate actions should be taken as appropriate. If it changes significantly in a relatively short time, the reasons should be found and removed, then the reference material must be measured again.
5.5.3 Data control
1) Data checks by the analytical laboratories
►When the sensitivity of instruments is not stable, when the results of duplicate analyses or re-measurements are significantly different, or when the percentage of a theoretical value to that for determined data in ion balances and electrical conductivity is significantly different from 1.0, measurement should be repeated since reliability is low.
►When samples seem to be obviously contaminated, these data should be treated as unrecorded data.
►Abnormal or unrecorded data can corrupt research results. So, careful checks are needed to avoid data of questionable quality. When abnormal or unrecorded data is detected, the process should be carefully reviewed to prevent the occurrence of the same problem in the future.
132
References 1) EANET, March 2000. Technical Manual for Monitoring on Inland Aquatic Environment in
East Asia: Adopted at The Second Interim Scientific Advisory Group Meeting of Acid Deposition Monitoring Network in East Asia
2) EANET, March 2000. Quality Assurance / Quality Control (QA/QC) Program for
Monitoring on Inland Aquatic Environment in East Asia: Adopted at The Second Interim Scientific Advisory Group Meeting of Acid Deposition Monitoring Network in East Asia
3) Acid Deposition and Oxidant Research Center, November 2001. Report of the
Inter-laboratory Comparison Project 2000 on Inland Aquatic Environment, 1St attempt,
4) Acid Deposition and Oxidant Research Center, November 2002. Report of the Inter-laboratory Comparison Project 2001 on Inland Aquatic Environment, 2nd attempt
5) Acid Deposition and Oxidant Research Center, November 2003. Report of the Inter-laboratory Comparison Project 2002 on Inland Aquatic Environment, 3rd attempt
6) Acid Deposition and Oxidant Research Center, November 2004. Report of the Inter-laboratory Comparison Project 2003 on Inland Aquatic Environment, 4th attempt
7) Acid Deposition and Oxidant Research Center, November 2005. Report of the Inter-laboratory Comparison Project 2004 on Inland Aquatic Environment,5th attempt
8) Acid Deposition and Oxidant Research Center, November 2006. Report of the Inter-laboratory Comparison Project 2005 on Inland Aquatic Environment, 6th attempt
9) Network Center for EANET. Report of the Inter-laboratory Comparison Project 2006
10) Network Center for EANET. Report of the Inter-laboratory Comparison Project 2007
11) Network Center for EANET. Report of the Inter-laboratory Comparison Project 2008
133
Appendix 5.1 Participating laboratories CHINA
1) Zhuhai Environmental Monitoring Station ( cn 01) 2) Xiamen Environmental Monitoring Central Station ( cn 02) 3) Xi’an Environmental Monitoring Station ( cn 03) 4) Chongqing Institute of Environmental Science ( cn 04) INDONESIA
5) Environmental Management Center (EMC) ( id01) 6)Research Center for Water Resources(RCWR), Agency for Research and
Development, Ministry of Public Works ( id02)
7) )Research Center for Limnology(RCL), Indonesian Institute of Sciences(LIPI) Cibinong Sciences Center
(id03)
JAPAN
8) Gifu Prefectural Institute of Health and Environmental Science ( jp01) 9) Shimane Prefectural Institute of Public Health and Environmental Science ( jp02) Lao PDR 10)Environment Quality Monitoring Centre, Environment Research Institute, Water Resources and Environment Administration
(la01)
MALAYSIA 11) Division of Environmental Health, Department of Chemistry(DOC) (my01) 12) Faculty of Applied Science, University Technology Mara (UiTM) (my02) MONGOLIA
13)Central Laboratory of Environmental Monitoring(CLEM) (mn01) PHILIPPINES
14)Environmental Management Bureau (EMB), (ph01) 15)Environmental Management Bureau Cordillera Administrative Region (EMB-CAR),
(ph02)
RUSSIA 16)Limnologcal Institute of Russian Academy of Science/Siberian Branch (RAS/SB)
(ru01)
17)Primorskii Environmental Monitoring Center of Roshydromet (Laboratory for Monitoring of inland water Pollution)
(ru02)
THAILAND 18)Environmental Research and Training Center (ERTC) (th01) 19)Air Quality and Noise Management Division, Pollution Control Department(PCD) Ministry of Science Technology and Environment(MSTE)
(th02)
VIET NAM 20) Environmental Laboratory - Center for Environmental Research - Vietnam Institute of Meteorology, Hydrology and Environment (IMHEN)
(vn01)
21) Middle of Central regional Hydro-Meteorological Observatory National (vn02)
134
Hydro -Meteorological Center (NHMS) 22)Environmental research Division, Sub-Institute of HydroMeteorology and Environment of South Vietnam (SIHYMETE)
(vn03)
135
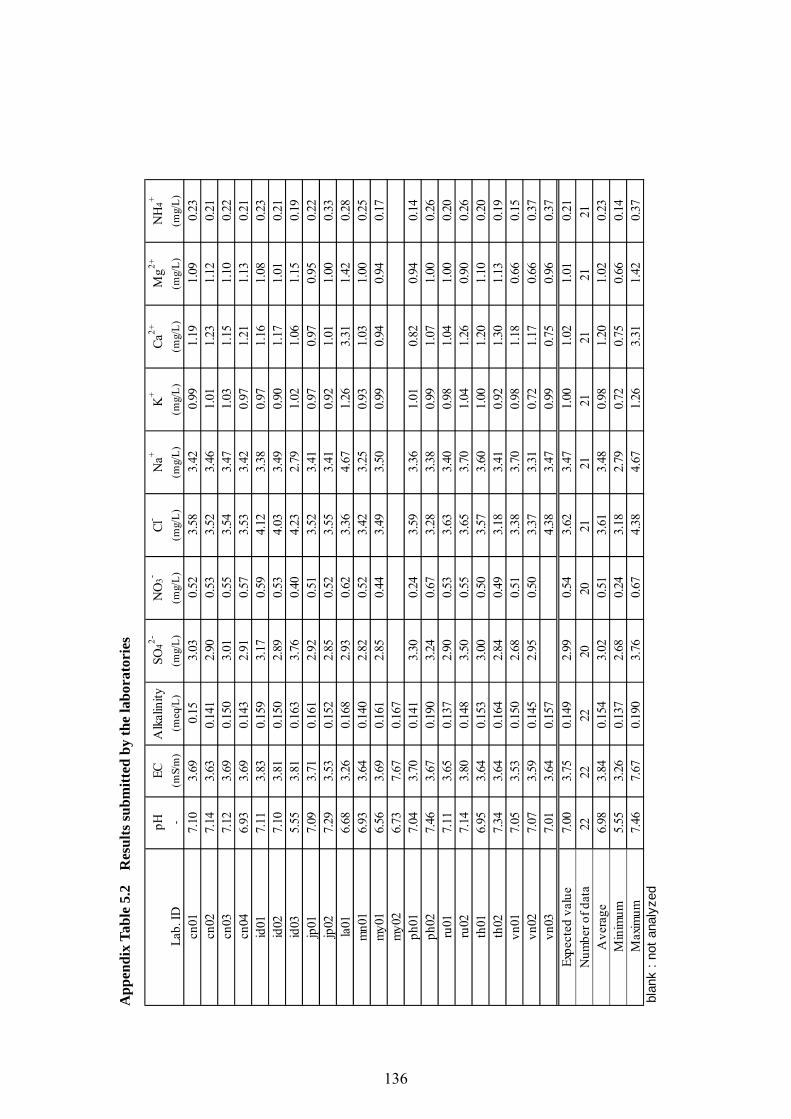
Ap
pen
dix
Tab
le 5
.2
Res
ult
s su
bm
itte
d b
y th
e la
bor
ator
ies
pHEC
Alk
alin
itySO
42-N
O3-
Cl-
Na+
K+
Ca2+
Mg2+
NH
4+
Lab.
ID-
(mS/
m)
(meq
/L)
(mg/
L)(m
g/L)
(mg/
L)(m
g/L)
(mg/
L)(m
g/L)
(mg/
L)(m
g/L)
cn01
7.10
3.69
0.15
3.03
0.52
3.58
3.42
0.99
1.19
1.09
0.23
cn02
7.14
3.63
0.14
12.
900.
533.
523.
461.
011.
231.
120.
21cn
037.
123.
690.
150
3.01
0.55
3.54
3.47
1.03
1.15
1.10
0.22
cn04
6.93
3.69
0.14
32.
910.
573.
533.
420.
971.
211.
130.
21id
017.
113.
830.
159
3.17
0.59
4.12
3.38
0.97
1.16
1.08
0.23
id02
7.10
3.81
0.15
02.
890.
534.
033.
490.
901.
171.
010.
21id
035.
553.
810.
163
3.76
0.40
4.23
2.79
1.02
1.06
1.15
0.19
jp01
7.09
3.71
0.16
12.
920.
513.
523.
410.
970.
970.
950.
22jp
027.
293.
530.
152
2.85
0.52
3.55
3.41
0.92
1.01
1.00
0.33
la01
6.68
3.26
0.16
82.
930.
623.
364.
671.
263.
311.
420.
28m
n01
6.93
3.64
0.14
02.
820.
523.
423.
250.
931.
031.
000.
25m
y01
6.56
3.69
0.16
12.
850.
443.
493.
500.
990.
940.
940.
17m
y02
6.73
7.67
0.16
7ph
017.
043.
700.
141
3.30
0.24
3.59
3.36
1.01
0.82
0.94
0.14
ph02
7.46
3.67
0.19
03.
240.
673.
283.
380.
991.
071.
000.
26ru
017.
113.
650.
137
2.90
0.53
3.63
3.40
0.98
1.04
1.00
0.20
ru02
7.14
3.80
0.14
83.
500.
553.
653.
701.
041.
260.
900.
26th
016.
953.
640.
153
3.00
0.50
3.57
3.60
1.00
1.20
1.10
0.20
th02
7.34
3.64
0.16
42.
840.
493.
183.
410.
921.
301.
130.
19vn
017.
053.
530.
150
2.68
0.51
3.38
3.70
0.98
1.18
0.66
0.15
vn02
7.07
3.59
0.14
52.
950.
503.
373.
310.
721.
170.
660.
37vn
037.
013.
640.
157
4.38
3.47
0.99
0.75
0.96
0.37
Expe
cted
val
ue7.
003.
750.
149
2.99
0.54
3.62
3.47
1.00
1.02
1.01
0.21
Num
ber o
f dat
a22
2222
2020
2121
2121
2121
Ave
rage
6.98
3.84
0.15
43.
020.
513.
613.
480.
981.
201.
020.
23M
inim
um5.
553.
260.
137
2.68
0.24
3.18
2.79
0.72
0.75
0.66
0.14
Max
imum
7.46
7.67
0.19
03.
760.
674.
384.
671.
263.
311.
420.
37bl
ank
: not
ana
lyze
d
136
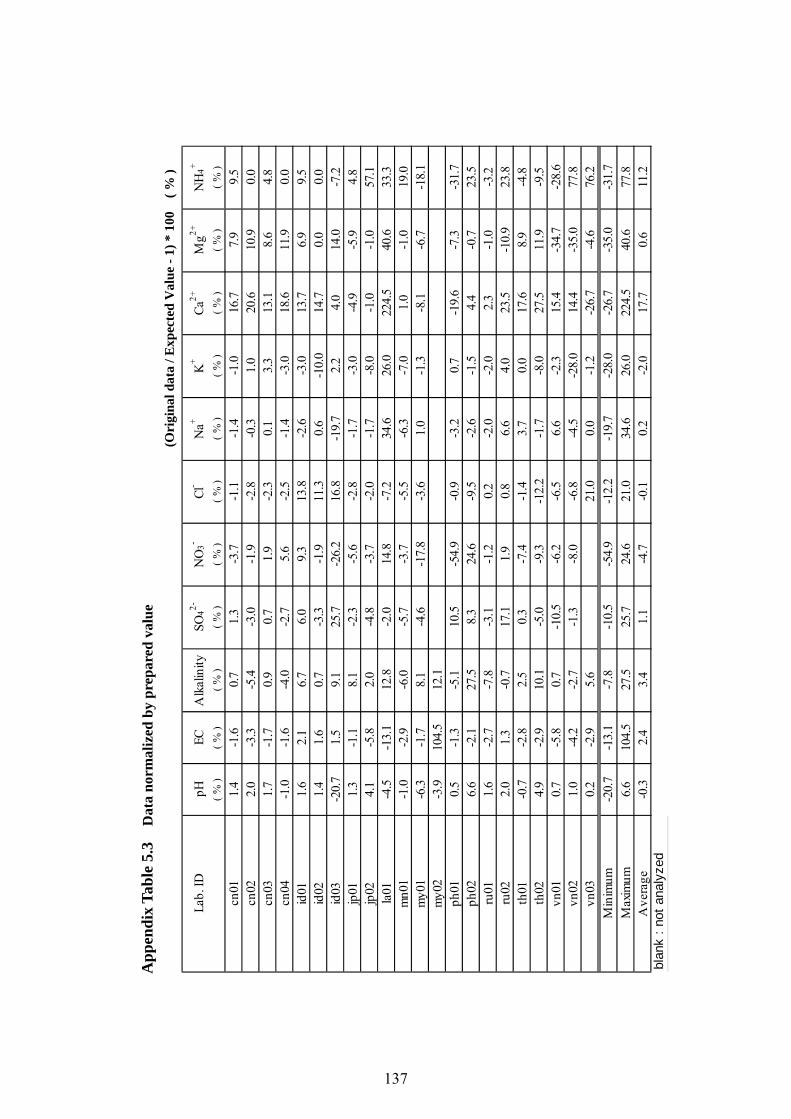
Ap
pen
dix
Tab
le 5
.3
Dat
a n
orm
aliz
ed b
y p
rep
ared
val
ue
(Ori
gin
al d
ata
/ Exp
ecte
d V
alu
e -
1) *
100
(
% )
Lab.
IDpH
ECA
lkal
inity
SO42-
NO
3-Cl
-N
a+K
+Ca
2+M
g2+N
H4+
( % )
( % )
( % )
( % )
( % )
( % )
( % )
( % )
( % )
( % )
( % )
cn01
1.4
-1.6
0.7
1.3
-3.7
-1.1
-1.4
-1.0
16.7
7.9
9.5
cn02
2.0
-3.3
-5.4
-3.0
-1.9
-2.8
-0.3
1.0
20.6
10.9
0.0
cn03
1.7
-1.7
0.9
0.7
1.9
-2.3
0.1
3.3
13.1
8.6
4.8
cn04
-1.0
-1.6
-4.0
-2.7
5.6
-2.5
-1.4
-3.0
18.6
11.9
0.0
id01
1.6
2.1
6.7
6.0
9.3
13.8
-2.6
-3.0
13.7
6.9
9.5
id02
1.4
1.6
0.7
-3.3
-1.9
11.3
0.6
-10.
014
.70.
00.
0id
03-2
0.7
1.5
9.1
25.7
-26.
216
.8-1
9.7
2.2
4.0
14.0
-7.2
jp01
1.3
-1.1
8.1
-2.3
-5.6
-2.8
-1.7
-3.0
-4.9
-5.9
4.8
jp02
4.1
-5.8
2.0
-4.8
-3.7
-2.0
-1.7
-8.0
-1.0
-1.0
57.1
la01
-4.5
-13.
112
.8-2
.014
.8-7
.234
.626
.022
4.5
40.6
33.3
mn0
1-1
.0-2
.9-6
.0-5
.7-3
.7-5
.5-6
.3-7
.01.
0-1
.019
.0m
y01
-6.3
-1.7
8.1
-4.6
-17.
8-3
.61.
0-1
.3-8
.1-6
.7-1
8.1
my0
2-3
.910
4.5
12.1
ph01
0.5
-1.3
-5.1
10.5
-54.
9-0
.9-3
.20.
7-1
9.6
-7.3
-31.
7ph
026.
6-2
.127
.58.
324
.6-9
.5-2
.6-1
.54.
4-0
.723
.5ru
011.
6-2
.7-7
.8-3
.1-1
.20.
2-2
.0-2
.02.
3-1
.0-3
.2ru
022.
01.
3-0
.717
.11.
90.
86.
64.
023
.5-1
0.9
23.8
th01
-0.7
-2.8
2.5
0.3
-7.4
-1.4
3.7
0.0
17.6
8.9
-4.8
th02
4.9
-2.9
10.1
-5.0
-9.3
-12.
2-1
.7-8
.027
.511
.9-9
.5vn
010.
7-5
.80.
7-1
0.5
-6.2
-6.5
6.6
-2.3
15.4
-34.
7-2
8.6
vn02
1.0
-4.2
-2.7
-1.3
-8.0
-6.8
-4.5
-28.
014
.4-3
5.0
77.8
vn03
0.2
-2.9
5.6
21.0
0.0
-1.2
-26.
7-4
.676
.2M
inim
um-2
0.7
-13.
1-7
.8-1
0.5
-54.
9-1
2.2
-19.
7-2
8.0
-26.
7-3
5.0
-31.
7M
axim
um6.
610
4.5
27.5
25.7
24.6
21.0
34.6
26.0
224.
540
.677
.8A
vera
ge-0
.32.
43.
41.
1-4
.7-0
.10.
2-2
.017
.70.
611
.2bl
ank
: not
ana
lyze
d
137
Appendix 5.4 Z-score evaluation The NC applied Z-score for further statistical evaluation of the analytical values in the inter-laboratory comparison on inland aquatic environment.
Definition of Z-score
Z-score is one of the statistical measures that quantify the distance from the mean of a data set. The formula for the calculation of Z-score (Robust method) was shown below:
where X: Measurement values of samples
Q1: The 1st quartile value of entire data Q2: The 2nd quartile value of entire data (i.e. Median) Q3: The 3rd quartile value of entire data
Evaluation of calculated Z-score
Z-score was given to each data submitted by the participating laboratories, and was evaluated as follows:
|Z| ≤ 2 : Satisfactory 2 < |Z| < 3 : Questionable
3 ≤ |Z| : Unsatisfactory The calculated Z-scores were shown in Appendix Table 5.4.1 and 5.4.2, and were also graphed in Appendix Figure 5.4.1 through 5.4.11.
Z = 0.7413 x (Q3 – Q1)
X – Q2
138
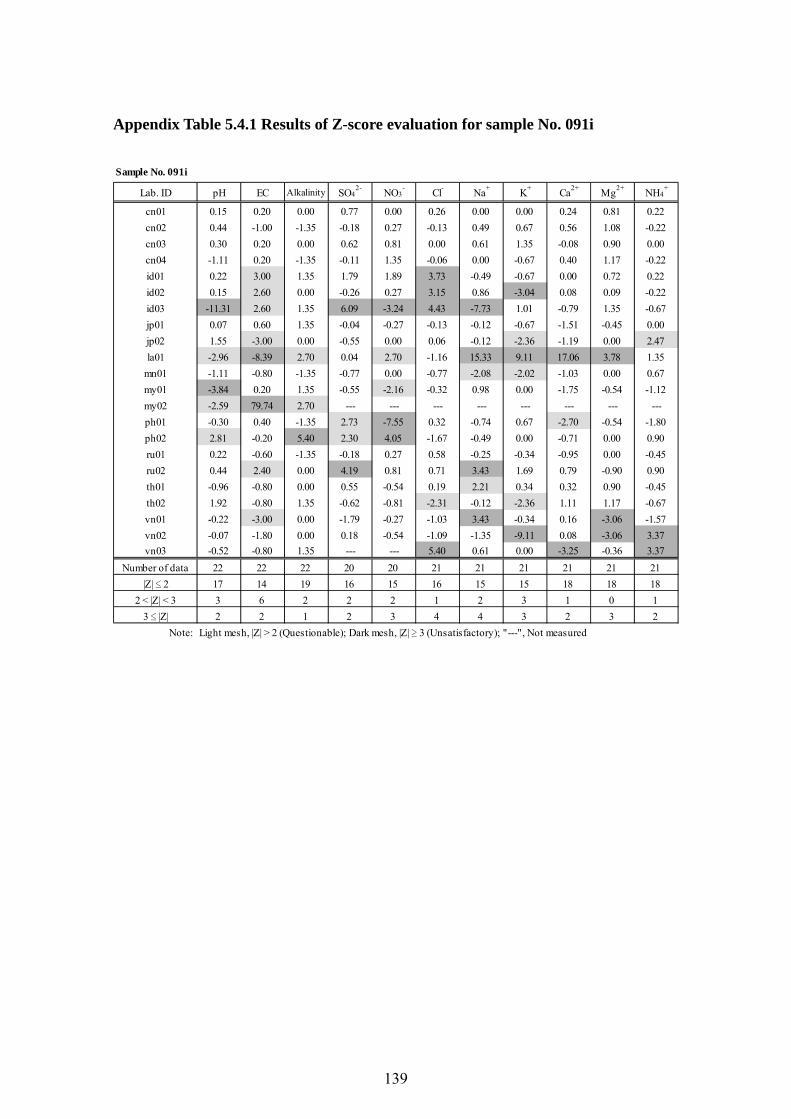
Appendix Table 5.4.1 Results of Z-score evaluation for sample No. 091i
Sample No. 091i
Lab. ID pH EC Alkalinity SO42- NO3
- Cl- Na+ K+ Ca2+ Mg2+ NH4+
cn01 0.15 0.20 0.00 0.77 0.00 0.26 0.00 0.00 0.24 0.81 0.22cn02 0.44 -1.00 -1.35 -0.18 0.27 -0.13 0.49 0.67 0.56 1.08 -0.22cn03 0.30 0.20 0.00 0.62 0.81 0.00 0.61 1.35 -0.08 0.90 0.00cn04 -1.11 0.20 -1.35 -0.11 1.35 -0.06 0.00 -0.67 0.40 1.17 -0.22id01 0.22 3.00 1.35 1.79 1.89 3.73 -0.49 -0.67 0.00 0.72 0.22id02 0.15 2.60 0.00 -0.26 0.27 3.15 0.86 -3.04 0.08 0.09 -0.22id03 -11.31 2.60 1.35 6.09 -3.24 4.43 -7.73 1.01 -0.79 1.35 -0.67jp01 0.07 0.60 1.35 -0.04 -0.27 -0.13 -0.12 -0.67 -1.51 -0.45 0.00jp02 1.55 -3.00 0.00 -0.55 0.00 0.06 -0.12 -2.36 -1.19 0.00 2.47la01 -2.96 -8.39 2.70 0.04 2.70 -1.16 15.33 9.11 17.06 3.78 1.35
mn01 -1.11 -0.80 -1.35 -0.77 0.00 -0.77 -2.08 -2.02 -1.03 0.00 0.67my01 -3.84 0.20 1.35 -0.55 -2.16 -0.32 0.98 0.00 -1.75 -0.54 -1.12my02 -2.59 79.74 2.70 --- --- --- --- --- --- --- ---ph01 -0.30 0.40 -1.35 2.73 -7.55 0.32 -0.74 0.67 -2.70 -0.54 -1.80ph02 2.81 -0.20 5.40 2.30 4.05 -1.67 -0.49 0.00 -0.71 0.00 0.90ru01 0.22 -0.60 -1.35 -0.18 0.27 0.58 -0.25 -0.34 -0.95 0.00 -0.45ru02 0.44 2.40 0.00 4.19 0.81 0.71 3.43 1.69 0.79 -0.90 0.90th01 -0.96 -0.80 0.00 0.55 -0.54 0.19 2.21 0.34 0.32 0.90 -0.45th02 1.92 -0.80 1.35 -0.62 -0.81 -2.31 -0.12 -2.36 1.11 1.17 -0.67vn01 -0.22 -3.00 0.00 -1.79 -0.27 -1.03 3.43 -0.34 0.16 -3.06 -1.57vn02 -0.07 -1.80 0.00 0.18 -0.54 -1.09 -1.35 -9.11 0.08 -3.06 3.37vn03 -0.52 -0.80 1.35 --- --- 5.40 0.61 0.00 -3.25 -0.36 3.37
Number of data 22 22 22 20 20 21 21 21 21 21 21|Z| ≤ 2 17 14 19 16 15 16 15 15 18 18 18
2 < |Z| < 3 3 6 2 2 2 1 2 3 1 0 13 ≤ |Z| 2 2 1 2 3 4 4 3 2 3 2
Note: Light mesh, |Z| > 2 (Questionable); Dark mesh, |Z| ≥ 3 (Unsatisfactory); "---", Not measured
139
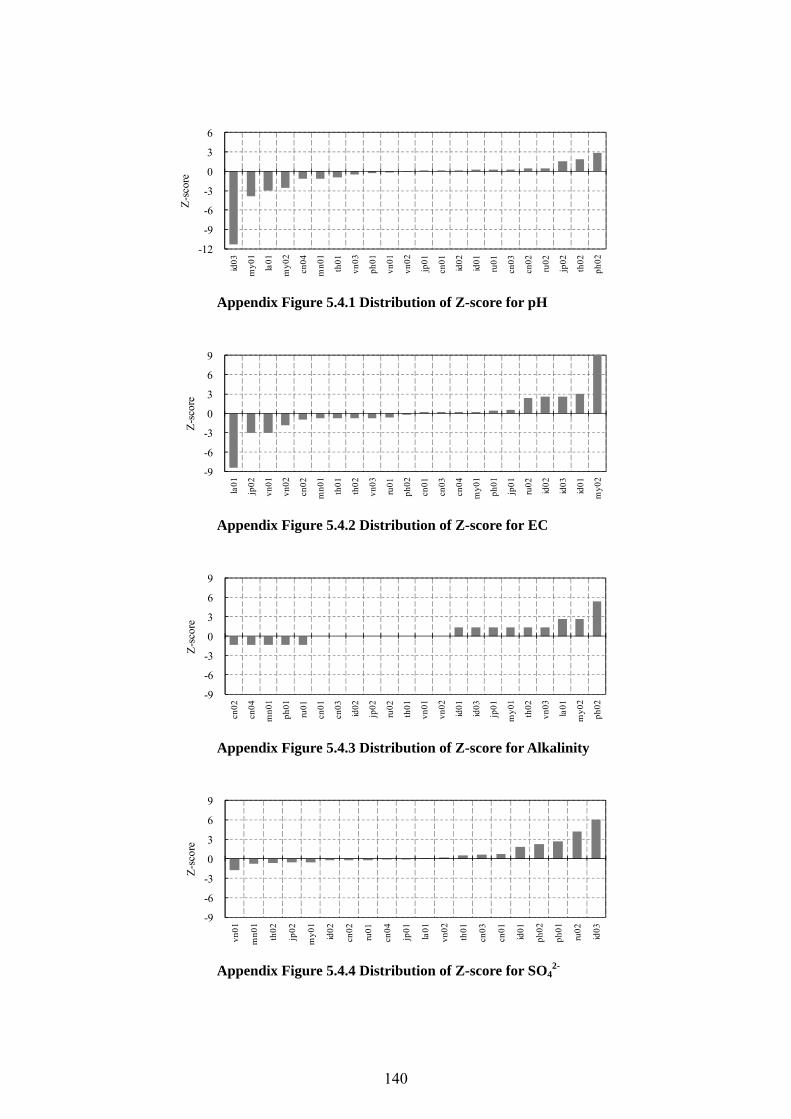
-12
-9
-6
-3
0
3
6
id03
my0
1
la01
my0
2
cn04
mn0
1
th01
vn03
ph01
vn01
vn02
jp01
cn01
id02
id01
ru01
cn03
cn02
ru02
jp02
th02
ph02
Z-sc
ore
Appendix Figure 5.4.1 Distribution of Z-score for pH
-9
-6
-3
0
3
6
9
la01
jp02
vn01
vn02
cn02
mn0
1
th01
th02
vn03
ru01
ph02
cn01
cn03
cn04
my0
1
ph01
jp01
ru02
id02
id03
id01
my0
2
Z-sc
ore
Appendix Figure 5.4.2 Distribution of Z-score for EC
-9
-6
-3
0
3
6
9
cn02
cn04
mn0
1
ph01
ru01
cn01
cn03
id02
jp02
ru02
th01
vn01
vn02
id01
id03
jp01
my0
1
th02
vn03
la01
my0
2
ph02
Z-sc
ore
Appendix Figure 5.4.3 Distribution of Z-score for Alkalinity
-9
-6
-3
0
3
6
9
vn01
mn0
1
th02
jp02
my0
1
id02
cn02
ru01
cn04
jp01
la01
vn02
th01
cn03
cn01
id01
ph02
ph01
ru02
id03
Z-sc
ore
Appendix Figure 5.4.4 Distribution of Z-score for SO42-
140
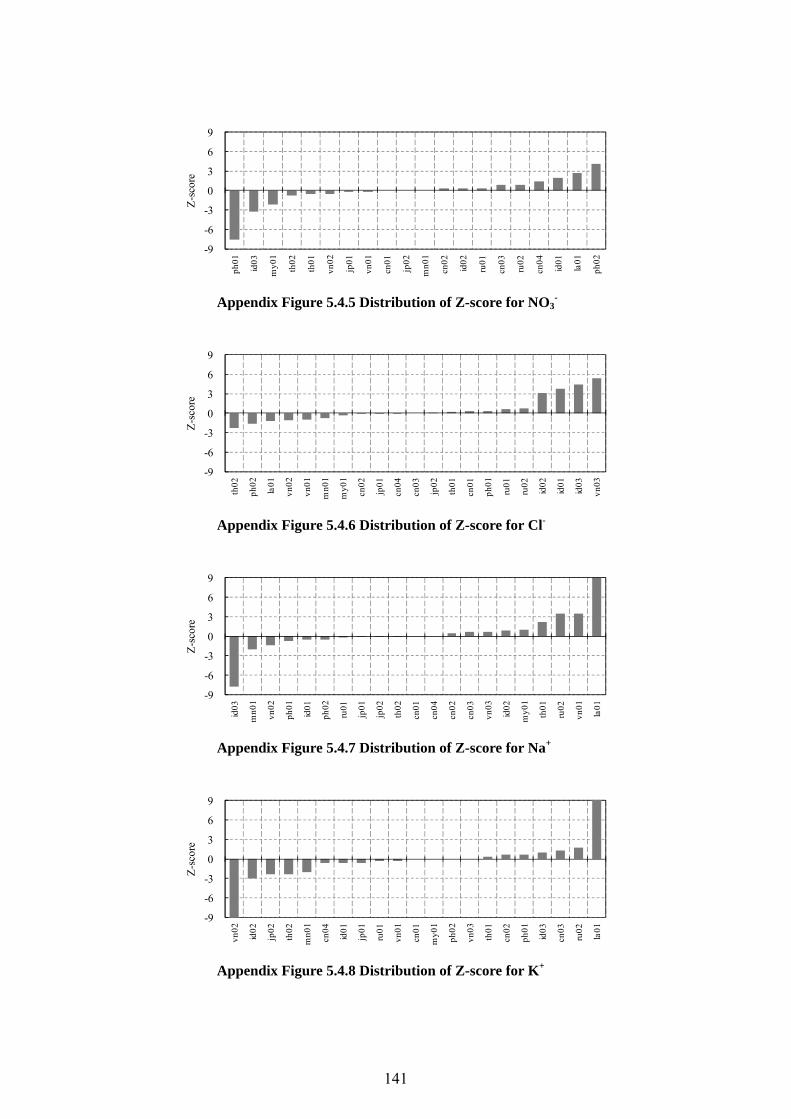
-9
-6
-3
0
3
6
9
ph01
id03
my0
1
th02
th01
vn02
jp01
vn01
cn01
jp02
mn0
1
cn02
id02
ru01
cn03
ru02
cn04
id01
la01
ph02
Z-sc
ore
Appendix Figure 5.4.5 Distribution of Z-score for NO3-
-9
-6
-3
0
3
6
9
th02
ph02
la01
vn02
vn01
mn0
1
my0
1
cn02
jp01
cn04
cn03
jp02
th01
cn01
ph01
ru01
ru02
id02
id01
id03
vn03
Z-sc
ore
Appendix Figure 5.4.6 Distribution of Z-score for Cl-
-9
-6
-3
0
3
6
9
id03
mn0
1
vn02
ph01
id01
ph02
ru01
jp01
jp02
th02
cn01
cn04
cn02
cn03
vn03
id02
my0
1
th01
ru02
vn01
la01
Z-sc
ore
Appendix Figure 5.4.7 Distribution of Z-score for Na+
-9
-6
-3
0
3
6
9
vn02
id02
jp02
th02
mn0
1
cn04
id01
jp01
ru01
vn01
cn01
my0
1
ph02
vn03
th01
cn02
ph01
id03
cn03
ru02
la01
Z-sc
ore
Appendix Figure 5.4.8 Distribution of Z-score for K+
141
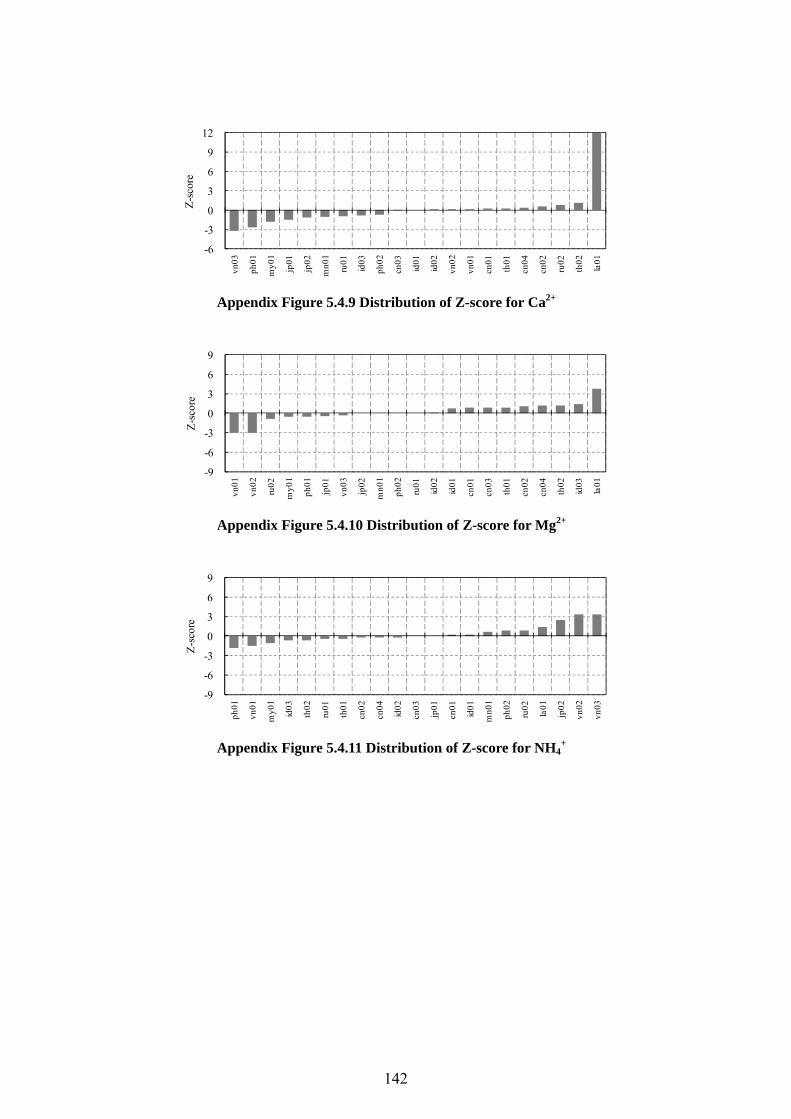
-6
-3
0
3
6
9
12
vn03
ph01
my0
1
jp01
jp02
mn0
1
ru01
id03
ph02
cn03
id01
id02
vn02
vn01
cn01
th01
cn04
cn02
ru02
th02
la01
Z-sc
ore
Appendix Figure 5.4.9 Distribution of Z-score for Ca2+
-9
-6
-3
0
3
6
9
vn01
vn02
ru02
my0
1
ph01
jp01
vn03
jp02
mn0
1
ph02
ru01
id02
id01
cn01
cn03
th01
cn02
cn04
th02
id03
la01
Z-sc
ore
Appendix Figure 5.4.10 Distribution of Z-score for Mg2+
-9
-6
-3
0
3
6
9
ph01
vn01
my0
1
id03
th02
ru01
th01
cn02
cn04
id02
cn03
jp01
cn01
id01
mn0
1
ph02
ru02
la01
jp02
vn02
vn03
Z-sc
ore
Appendix Figure 5.4.11 Distribution of Z-score for NH4+
142

6. ACKKNOWLEDGEMENT
ACAP wishes to thank Yamaguchi Prefecture for their cooperation in the collection of
soil samples used for the soil inter-laboratory comparison project.
7. CONTACT INFORMATION
Please address all inquiries, comments and suggestions to:
Asia Canter for Air Pollution Research (ACAP)
1182, Sowa, Nishi-ku, Niigata-shi, 950-2144, Japan
Tel: +81 25-263-0550
Fax: +81 25-263-0567
E-mail: [email protected]
URL: http://www.eanet.cc
Contact person:
Name Department & E-mail address
Dr. Takuya SHIOZAKI
(EANET QA/QC Manager)
Dept. Head, Data Management Department
E-mail: [email protected]
143