Embed Size (px)
Citation preview
November 2020
Canadian COVID-19 Wastewater Coalition
Phase 1 Inter-Laboratory StudyComparison of Approaches to Quantify SARS-CoV-2 RNA in Wastewater
i
This report summarizes and analyzes results from the Canadian COVID-19 Wastewater Coalition’s Phase I Inter-Laboratory Study conducted in August 2020, as well as subsequent discussions convened via teleconference and email correspondence. The content herein will also be prepared for a separate peer-reviewed publication.
Recommended Citation
Canadian Water Network. (2020). Phase I Inter-Laboratory Study: Comparison of approaches to quantify SARS-CoV-2 RNA in wastewater. https://cwn-rce.ca/covid-19-wastewater-coalition/ phase-1-inter-laboratory-study
The information in this report does not necessarily represent the views of the National Microbiology Lab, City of Winnipeg, participating laboratories, expert advisors or their employers.
This publication has been prepared as a non-authoritative guidance. Canadian Water Network and the author do not accept any responsibility or liability that might occur directly or indirectly as a consequence of the use, application or reliance on this material.
ii
Contents Acknowledgements ....................................................................................................................... 1
Glossary ....................................................................................................................................................... 2
Executive Summary .................................................................................................................................... 5
Background ................................................................................................................................................. 9
Inter-Laboratory Study Design ............................................................................................................... 10
Results ........................................................................................................................................................ 12
Discussion .................................................................................................................................................. 17
References ................................................................................................................................................. 21
List of Tables Table 1. Summary of Winnipeg, Manitoba wastewater characteristics .................................... 111
Table 2. List of surrogates deployed in the Phase I Inter-Laboratory Study ................................ 11
Table 3. Surrogate spike samples (100 mL wastewater matrix) received by each laboratory ..... 12
List of Figures Figure 1. Participating laboratories, COVID-19 Wastewater Coalition Inter-Laboratory Study ..... 9
Figure 2. Concentration estimates of SARS-CoV-2 RNA quantified in three wastewater samples with no-spike, low-spike and high-spike ....................................................................................... 14
Figure 3. Reported Ct values of SARS-CoV-2 RNA quantified in three wastewater samples with no-spike, low-spike and high-spike ........................................................................................... 155
Figure 4. Reported Ct values of HCoV-229E RNA quantified in three wastewater samples with no-spike, low-spike and high-spike ............................................................................................. 16
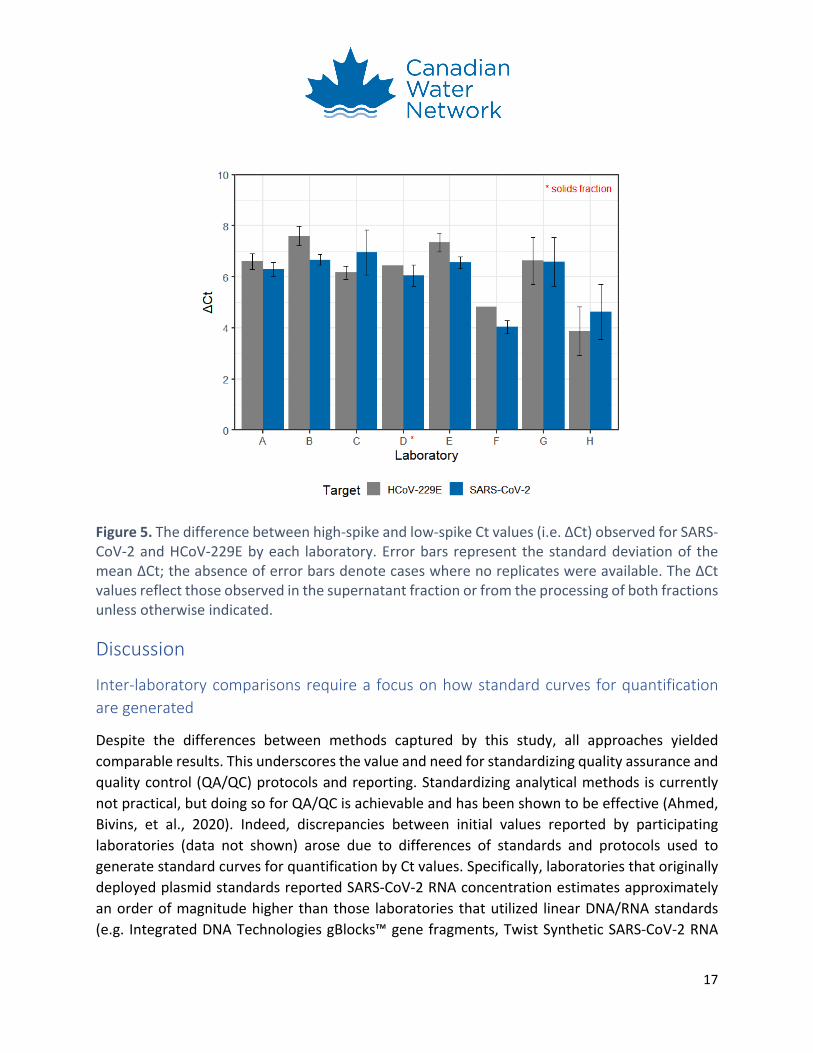
Figure 5. The difference between high-spike and low-spike Ct values observed for SARS-CoV-2 and HCoV-229E by each laboratory ............................................................................................ 17
Figure 6. An example of standard curves generated from a plasmid DNA standard and an RNA standard ...................................................................................................................................... 18
1
Acknowledgements
Canadian Water Network (CWN) thanks the laboratories and scientists who participated in this Inter-Laboratory Study. The National Microbiology Laboratory in Winnipeg played a critical role as the coordinating laboratory and their support from concept to execution was invaluable. The City of Winnipeg and University of Alberta research team are also thanked for their coordination and provision of wastewater samples and spiking materials, respectively.
Alex H.S. Chik coordinated the study and developed this report. We also thank members of the Canadian COVID-19 Wastewater Coalition’s research advisory group and public health advisory group, who have generously shared their time and expertise. In particular, we’d like to recognize Bernadette Conant (CWN) and Steve E. Hrudey (Chair, Canadian COVID-19 Wastewater Coalition) for their leadership since April 2020, when the need for a coordinated national wastewater surveillance response was first identified by CWN. These two individuals have been a driving force in shaping the Coalition’s focus, framework, activities and responsiveness to the needs of Canadian stakeholders and decision makers.
The following scientists made substantial contributions to the Phase I Inter-Laboratory study:
Patrick D’Aoust, University of Ottawa
Jean-Baptiste Burnet, Polytechnique Montréal
Robert Delatolla, University of Ottawa
Sarah Dorner, Polytechnique Montréal
Qiudi Geng, Great Lakes Institute for Environmental Research, University of Windsor
John P. Giesy Jr., Veterinary Biomedical Sciences & Toxicology Centre, University of Saskatchewan
Melissa Glier, BC Centre for Disease Control
Eyerusalem Goitom, Polytechnique Montréal
Chand Mangat, National Microbiology Laboratory, Public Health Agency of Canada
Robert (Mike) McKay, Great Lakes Institute for Environmental Research, University of Windsor
Xiaoli (Lilly) Pang, Public Health Laboratory – Alberta Precision Laboratory; University of Alberta
Natalie Prystajecky, BC Centre for Disease Control; University of British Columbia
Judy Yuanyuan Qiu, University of Alberta
Mark Servos, University of Waterloo
Nivetha Srikanthan, University of Waterloo
Yuanmin Wu, Great Lakes Institute for Environmental Research/S.M. Research Inc.
Yuwei Xie, Toxicology Centre, University of Saskatchewan
2
Glossary
Cycle threshold (Ct): The number of amplification cycles using quantitative reverse transcription Polymerase Chain Reaction (qRT-PCR) required for the signal associated with a PCR product (i.e. the target/amplicon) to be detected above a baseline signal that would be present in the assay regardless of whether the target is present.
Inhibition: Inhibitory substances may be present that impede or prevent PCR from running efficiently or effectively, ultimately resulting in delayed Ct quantification (higher Ct) for the actual target of the analysis. Inhibition effects can be monitored by comparing the number of cycles required for detecting a target in a spiked sample matrix compared to that of a distilled water control spiked at the same concentration.
Instrument cycle threshold: The value that can be set manually or automatically on the instrument software for a series of assays that denotes the limit of reliable signal for quantifying the PCR product, beyond which represents exceedance of the background signal (scale is instrument- and software-specific).
Internal matrix spike: Viruses/surrogates that are introduced to a wastewater sample as a whole process control and used for the estimation of recovery efficiency.
Particle-associated fraction: During wastewater sample preparation, the proportion of viruses found to be associated with the solids-rich fraction (which may differ depending on the preparation method used) that is separated from the wastewater matrix by filtration, crystallization, precipitation, centrifugation or other process.
Phase partitioning: Viruses and biomarkers can be divided in terms of their presence and concentrations between the aqueous or solids phases within the wastewater matrix; their distribution can be estimated by analyzing the supernatant and the particle-associated fractions separately.
Polymerase Chain Reaction (PCR): The process through which genetic material (DNA) can be amplified exponentially through multiple cycles of denaturing, annealing and extension that allows the DNA to self replicate.
Quality assurance/quality control (QA/QC): A component of quality management focused on providing confidence that specific quality requirements will be fulfilled, and the fulfillment of the requirements specified; relates to how a process is performed to ensure quality requirements are met and the subsequent inspection aspect of quality management.
3
Quantitative nucleic acid amplification: Various approaches that rely on the amplification of genetic materials that facilitate the detection and quantification of the target, including quantitative reverse transcription polymerase chain reaction (RT-qPCR), digital droplet PCR (ddPCR) and loop-mediated isothermal amplification (LAMP).
Recovery: The proportion of a specific target (e.g. SARS-CoV-2 genetic material) from the total analytical portion of a test material (e.g. wastewater sample) that was successfully extracted and detected/represented by the final measurement.
RT-qPCR: Quantitative reverse transcription PCR. When the target material for the analysis is RNA, it is first transcribed into complementary DNA by reverse transcription. The resulting genetic fragment is then used as the template for the qPCR reaction, which enables the quantification of the target material relative to quantified standards. Performing RT-qPCR for wastewater samples typically involves the following steps:
Sample preparation: The wastewater sample collected may be separated into supernatant and particle-associated fractions (i.e. liquid-solid partitioning) during this stage as an initial step. SARS-CoV-2 viruses are concentrated from either or both fractions of the wastewater matrix using approaches such as precipitation by polyethylene glycol or centrifugal ultrafiltration.
RNA extraction: The genetic material is isolated from the concentrated viruses obtained from the sample preparation stage.
Detection and quantification: One-step or two-step approaches can be applied for the detection and quantification of the genetic material obtained from the sample. In a one-step approach, reverse transcriptase and DNA polymerase are introduced simultaneously to the genetic material isolated from RNA extraction. This allows for the simultaneous conversion of the target RNA into complementary DNA (cDNA) and its amplification in a single reaction. In a two-step approach, the reverse transcription is completed first, with the amplification of the cDNA amplified in a separate reaction. The signal obtained from the amplified target using either approach can then be quantified against a standard curve.
Spike-and-recovery: A known amount of analyte is added (spiked) into the natural test sample matrix and its response is measured (recovered) in the assay.
Supernatant: During wastewater sample preparation, the liquid fraction (which may differ depending on the preparation method used) is separated from the matrix after filtration, crystallization, precipitation, centrifugation or other process.
4
Surrogate: A substance that usually shares characteristics of the target of interest and is therefore assumed to exhibit similar behaviour in response to the analytical procedure. It is used to evaluate the effects and responses to selected processing treatments. In the context of microbial spike-and-recovery studies, model organisms (e.g. gamma irradiated inactivated SARS-CoV-2) that exhibit similar properties of the organisms of concern (i.e. SARS-CoV-2) allow inferences to be drawn about the ability of the organisms of concern to be recovered using a particular method.
Wastewater-based epidemiology (WBE): The use of temporal and spatial results of chemical analysis of pollutants and biomarkers in raw wastewater to obtain qualitative and quantitative data used to assist in interpreting the presence and spread of a target health-related factor within a given wastewater catchment (Lorenzo & Picó, 2019).
5
Executive Summary
The detection of SARS-CoV-2 genetic fragments in wastewater, specifically its ribonucleic acid (RNA), may be a useful tool for inferring COVID-19 prevalence at community scales. Wastewater-based epidemiology has the ability to detect asymptomatic, pre-symptomatic and symptomatic infections and seeks to provide a reflection ― and potentially, an early warning ― of increased COVID-19 infections in a community. Information on spatial and temporal trends can potentially be used to inform public health decisions and responses to the COVID-19 pandemic, such as targeted clinical testing or an indicator of the effectiveness of implemented public health measures.
Despite the rapid increase and evolution of research and trials across the globe since the results of early research involving the detection of SARS-CoV-2 in wastewater were published in late March 2020 (Medema, Heijnen, et al., 2020), the methods for extraction and concentration of SARS-CoV-2, extraction of viral RNA and subsequent quantification are still far from standardized. A broad range of methodologies are being deployed and it is not yet clear what level of variation in results is due to the differences in methods and techniques. A lack of experience with how the different techniques impact results makes it difficult to assess or infer inter- and intra-laboratory variability of the results, confounding comparisons of data between communities or confidence in applying the techniques across communities.
To better understand the variations resulting from different techniques and facilitate data comparisons nationally and internationally, Canadian Water Network (CWN) initiated an Inter-Laboratory Study as the first phase of the Canadian COVID-19 Wastewater Coalition’s proof-of-concept pilot. The purpose of this initial phase is to characterize the inter- and intra-laboratory variability of results that can be expected when using various methods currently deployed across Canada. The National Microbiology Laboratory (NML) collaborated as the reference laboratory. A cross-section of seven laboratories were then selected that had demonstrated experience and capacity to analyze SARS-CoV-2 RNA in wastewater by quantitative reverse transcription polymerase chain reaction (RT-qPCR).
It was expected that most variability would arise from differences in the wastewater sample preparation method used (including concentration of viral RNA), so this initial phase of testing was conducted to determine how the results varied for common, shared, spiked samples. The study assessed whether currently deployed methods can reliably discern amounts of surrogates for SARS-CoV-2 that were spiked into a common wastewater matrix and provided blind by NML to all laboratories. This approach was designed to reflect the collective experience, capacity and expertise of individual laboratories, to allow for broader inferences to be drawn related to differences in data generation and handling approaches, as well as reflect external constraints such as the availability of reagents and supplies. Imposing a common analytical methodology was
6
not feasible for a variety of practical limitations, including analytical equipment available in the participating laboratories and supply chain restrictions on materials and reagents.
Phase 1 Inter-Laboratory Study Approach and Findings
Using a spike-and-recovery approach, a wastewater grab sample collected on August 31, 2020 from Winnipeg, Manitoba was aliquoted and inoculated with “high-spike,” “low-spike” and “no-spike” of two viral surrogates: gamma irradiated inactivated SARS-CoV-2 (1800 ± 200 gene copies/mL; 18 ± 2 gene copies/mL; N/A) and human coronavirus strain 229E (HCoV-229E) (1000 infectious units/mL; 10 infectious units/mL; N/A). Triplicate 100 mL aliquots were prepared for each condition. A total of eight laboratories (including NML) participated in the analysis of these samples by RT-qPCR. Key observations and findings included:
1) Different methods provided similar results overall.
Despite using different protocols for sample processing and analysis, participating laboratories reliably distinguished high- and low- spikes of both viral surrogates. Furthermore, quantitative differences between the laboratories were consistently within an order of magnitude of each other, underscoring flexibility of sample preparation methods to yield reliable results. The two viral surrogates were not consistently detected within all three aliquots of the low-spike samples; however, this was expected as the low-spike level used in this study was at/or near the level of sensitivity typically attainable using RT-qPCR methods. In a future study, regression design using a gradient of spike concentrations would allow for each laboratory to rigorously quantify method sensitivity.
2) Surrogate spikes may exhibit different solids or aqueous partitioning behavior relative to SARS-CoV-2.
Spiked viral surrogates were present in both supernatant and particle-associated phases. Due to the spike preparation method and the relatively short time between sample spiking and sample processing applied in this study (for sample shipping), the spike-and-recovery approach used might not be representative of the behaviour of authentic in situ SARS-CoV-2 partitioning in real wastewater samples. The nature of the partitioning of both the SARS-CoV-2 and sample surrogates could play a significant role in the interpretations and the apparent effectiveness of the method. The impact of partitioning behaviour of spiked surrogates is therefore an important consideration in the recovery of SARS-CoV-2 from wastewater matrices. This suggests the importance of processing the entire wastewater sample (i.e. both particle-associated and supernatant fractions) to assess RNA presence. If the sample is partitioned prior to analysis, the value of examining both phases for SARS-CoV-2 RNA should be considered.
7
3) Detection of SARS-CoV-2 RNA in the “no-spike” samples may reflect low background levels present in the wastewater sample used as the matrix.
The laboratories reported either non-detects or trace levels (<20 gene copies/mL) of SARS-CoV-2 RNA for the “no-spike” samples. Such trace levels could be attributable to background levels of SARS-CoV-2 RNA indicative of the ~85 active cases of COVID-19 in Winnipeg at the time that the sample was collected. Trace levels detected appear linked to methods deployed that included or focused on particle-associated phases, which warrants a more rigorous examination of whether methods that target the solids phase of primary sewage, or even sludge, may allow for greater sensitivity than analyzing the supernatant for quantifying SARS-CoV-2 gene sequences in authentic wastewater matrices.
A review of blinded results with the laboratories subsequent to the study generated a consensus view that the various approaches used for preparation and analysis of samples applied during this study can yield comparable results, with the critical caveat that sufficient quality assurance/quality control (QA/QC) protocols must be in place and reported in adequate detail.
QA/QC Recommendations:
1) Inter-laboratory comparisons require a focus on how standard curves for quantification are generated.
In this study, discrepancies between the values reported by different laboratories were originally observed due to different standards and protocols used to generate standard curves for relative quantification based on Ct values. Multiple standards, including RNA, linear DNA and circular plasmid DNA standards, are available and the choice of quantitative standards can lead to biased estimates of qPCR results. Although SARS-CoV-2 plasmid DNA standards are available and often used because of their relative stability, their use for developing standard curves without linearization led to an overestimation of gene copies, which in this project was almost an order of magnitude. RNA standards have been recommended as they possess the same characteristics as the target template, but these are less stable and rather expensive. Linear DNA standards may offer a compromise between stability (and therefore accuracy) and cost. To facilitate direct inter-comparisons between province- or nation-wide wastewater-based epidemiology surveillance efforts, the coordination of reference materials for quantification by standard curve is recommended.
2) Performing inhibition controls and addressing inhibition are critical.
Inhibition of PCR must be monitored and addressed as a key component of QA/QC as it can confound results and contribute to false-negative results. The effects of wastewater matrices causing inhibition for qPCR techniques can be highly specific to different wastewater systems/sources. Testing for the presence of PCR inhibitors should be
8
conducted and documented; assuming that methods or commercial kits designed to limit inhibitors are consistently and successfully removing inhibition is not reliable.
3) Process controls and better understanding of surrogate behaviour are needed to quantify method recovery efficiency.
Losses of SARS-CoV-2 virion and/or their RNA occur during sample processing and can also contribute to false-negative results. Conducting internal process controls (i.e. internal matrix spikes) on every sample is desirable for capturing recovery variability that may be attributable to changing wastewater matrix conditions when defining trends over time for a wastewater source. However, the use of internal process controls to enable better correction of quantitated SARS-CoV-2 concentration estimates for method losses can be complicated by the wide range of surrogates that can be used and the logistics associated with performing sample-specific matrix spikes. Many surrogates used as internal process controls are assumed to be adequately representative of native SARS-CoV-2 recovery from wastewater; however, this assumption remains unconfirmed. Moreover, assuming that surrogates are adequately representative of SARS-CoV-2 recovery, it is often impractical to perform internal matrix spikes on every sample. This can further lead to inconsistent approaches for handling quantitated results (e.g. what to do if a matrix spike was not performed for every sample). Accordingly, reporting quantitated SARS-CoV-2 concentration estimates without adjusting for recovery, along with an estimate of recovery efficiency and the surrogate used, would enable a more transparent consideration of the data.
4) Use of fecal biomarkers to assist in “normalizing” results is a recent approach receiving increasing focus.
Indicators of fecal contributions from wastewater, such as the Pepper Mild Mottle virus (PMMoV) and crAssphage, have been increasingly advocated as a means to enable improved detection of trends through its use to normalize SARS-CoV-2 RNA concentration estimates. This normalization may be useful to determine trends because different sewer systems will have differing levels of storm sewage dilution or groundwater infiltration. Likewise, variability in water use in communities will cause differences in the dilution of sewage wastes. These differing levels of dilution can also change over time within a single community, making normalization important within a single community. However, these fecal biomarker/indicator viruses that are endogenous to wastewater (rather than controlled/spiked surrogates) will be inherently variable and are therefore not considered as appropriate for use in calculating analytical recovery or determining PCR inhibition.
9
Background
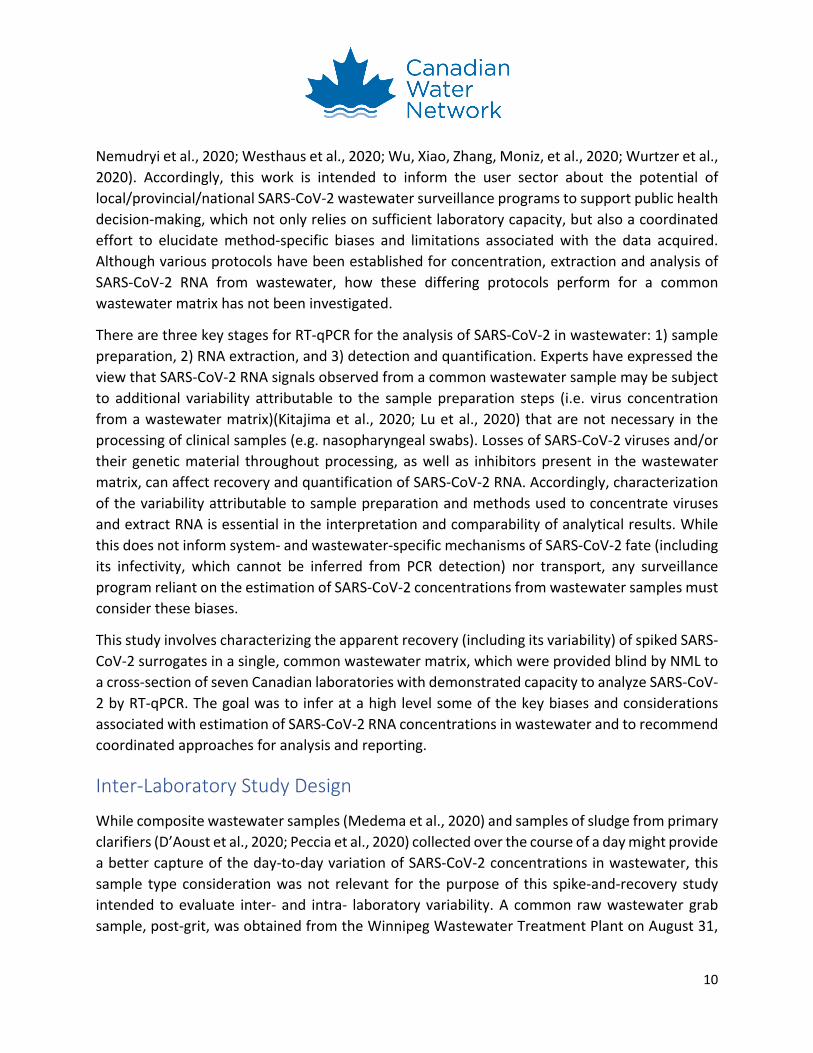
Canadian Water Network (CWN) initiated the Inter-Laboratory Study as the first phase of the Canadian COVID-19 Wastewater Coalition’s national proof-of-concept pilot. The purpose of the study was to characterize the inter- and intra- laboratory variability associated with results emanating from quantifying RNA of SARS-CoV-2 using RT-qPCR after extraction from a common wastewater matrix. This study was conducted in collaboration with the National Microbiology Laboratory (NML) in Winnipeg, Manitoba. Seven Canadian laboratories (located in in Vancouver, Edmonton, Saskatoon, Windsor, Waterloo, Ottawa and Montreal) that had already demonstrated experience and capacity to analyze SARS-CoV-2 RNA in wastewater by RT-qPCR were selected to participate.
Figure 1. Participating laboratories, COVID-19 Wastewater Coalition Inter-Laboratory Study
This evaluation has critical implications for the interpretation of results within a sewer network (sewershed) and inter-comparisons between sewersheds. There is evidence in the scientific community that early detection of occurrence/re-emergence is possible with such surveillance programs (e.g. Ahmed, Angel, et al., 2020; Daughton, 2020; Hrudey et al., 2020; Kumar et al., 2020; Medema, Heijnen, et al., 2020; Randazzo et al., 2020; Street et al., 2020). However, each program must be tailored to site- and wastewater-specific conditions (Kitajima et al., 2020;
10
Nemudryi et al., 2020; Westhaus et al., 2020; Wu, Xiao, Zhang, Moniz, et al., 2020; Wurtzer et al., 2020). Accordingly, this work is intended to inform the user sector about the potential of local/provincial/national SARS-CoV-2 wastewater surveillance programs to support public health decision-making, which not only relies on sufficient laboratory capacity, but also a coordinated effort to elucidate method-specific biases and limitations associated with the data acquired. Although various protocols have been established for concentration, extraction and analysis of SARS-CoV-2 RNA from wastewater, how these differing protocols perform for a common wastewater matrix has not been investigated.
There are three key stages for RT-qPCR for the analysis of SARS-CoV-2 in wastewater: 1) sample preparation, 2) RNA extraction, and 3) detection and quantification. Experts have expressed the view that SARS-CoV-2 RNA signals observed from a common wastewater sample may be subject to additional variability attributable to the sample preparation steps (i.e. virus concentration from a wastewater matrix)(Kitajima et al., 2020; Lu et al., 2020) that are not necessary in the processing of clinical samples (e.g. nasopharyngeal swabs). Losses of SARS-CoV-2 viruses and/or their genetic material throughout processing, as well as inhibitors present in the wastewater matrix, can affect recovery and quantification of SARS-CoV-2 RNA. Accordingly, characterization of the variability attributable to sample preparation and methods used to concentrate viruses and extract RNA is essential in the interpretation and comparability of analytical results. While this does not inform system- and wastewater-specific mechanisms of SARS-CoV-2 fate (including its infectivity, which cannot be inferred from PCR detection) nor transport, any surveillance program reliant on the estimation of SARS-CoV-2 concentrations from wastewater samples must consider these biases.
This study involves characterizing the apparent recovery (including its variability) of spiked SARS-CoV-2 surrogates in a single, common wastewater matrix, which were provided blind by NML to a cross-section of seven Canadian laboratories with demonstrated capacity to analyze SARS-CoV-2 by RT-qPCR. The goal was to infer at a high level some of the key biases and considerations associated with estimation of SARS-CoV-2 RNA concentrations in wastewater and to recommend coordinated approaches for analysis and reporting.
Inter-Laboratory Study Design
While composite wastewater samples (Medema et al., 2020) and samples of sludge from primary clarifiers (D’Aoust et al., 2020; Peccia et al., 2020) collected over the course of a day might provide a better capture of the day-to-day variation of SARS-CoV-2 concentrations in wastewater, this sample type consideration was not relevant for the purpose of this spike-and-recovery study intended to evaluate inter- and intra- laboratory variability. A common raw wastewater grab sample, post-grit, was obtained from the Winnipeg Wastewater Treatment Plant on August 31,
11
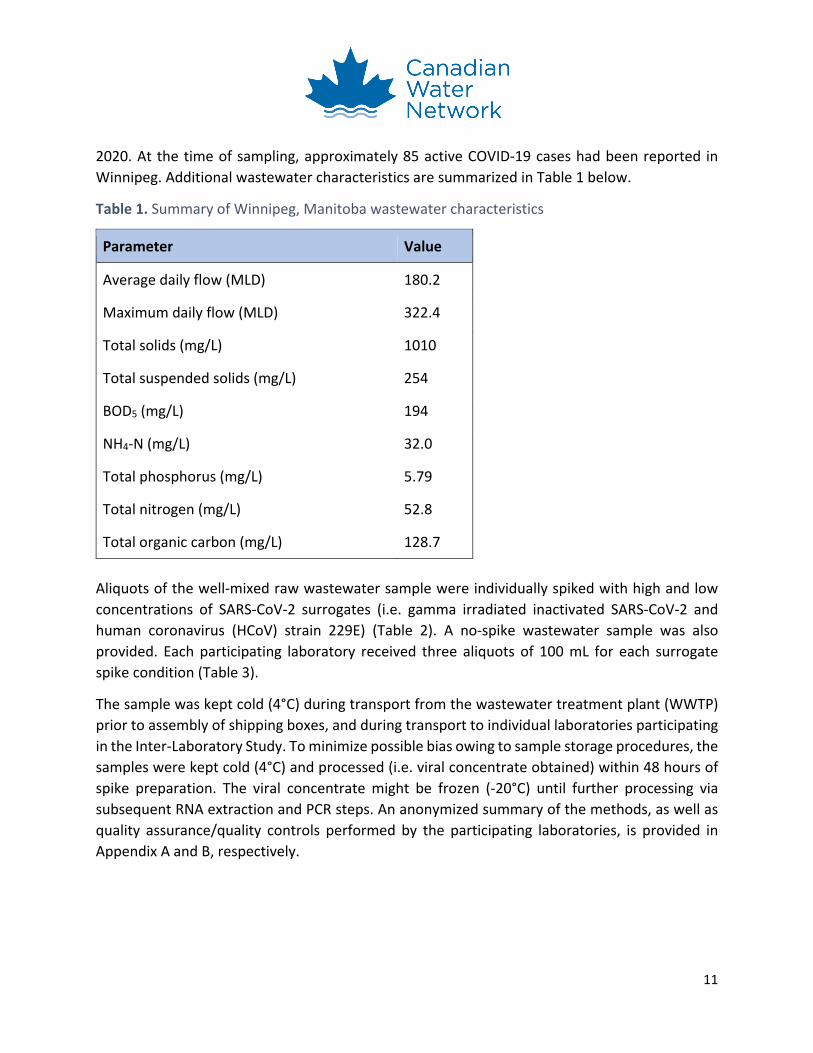
2020. At the time of sampling, approximately 85 active COVID-19 cases had been reported in Winnipeg. Additional wastewater characteristics are summarized in Table 1 below.
Table 1. Summary of Winnipeg, Manitoba wastewater characteristics
Parameter Value
Average daily flow (MLD) 180.2
Maximum daily flow (MLD) 322.4
Total solids (mg/L) 1010
Total suspended solids (mg/L) 254
BOD5 (mg/L) 194
NH4-N (mg/L) 32.0
Total phosphorus (mg/L) 5.79
Total nitrogen (mg/L) 52.8
Total organic carbon (mg/L) 128.7
Aliquots of the well-mixed raw wastewater sample were individually spiked with high and low concentrations of SARS-CoV-2 surrogates (i.e. gamma irradiated inactivated SARS-CoV-2 and human coronavirus (HCoV) strain 229E) (Table 2). A no-spike wastewater sample was also provided. Each participating laboratory received three aliquots of 100 mL for each surrogate spike condition (Table 3).
The sample was kept cold (4°C) during transport from the wastewater treatment plant (WWTP) prior to assembly of shipping boxes, and during transport to individual laboratories participating in the Inter-Laboratory Study. To minimize possible bias owing to sample storage procedures, the samples were kept cold (4°C) and processed (i.e. viral concentrate obtained) within 48 hours of spike preparation. The viral concentrate might be frozen (-20°C) until further processing via subsequent RNA extraction and PCR steps. An anonymized summary of the methods, as well as quality assurance/quality controls performed by the participating laboratories, is provided in Appendix A and B, respectively.
12
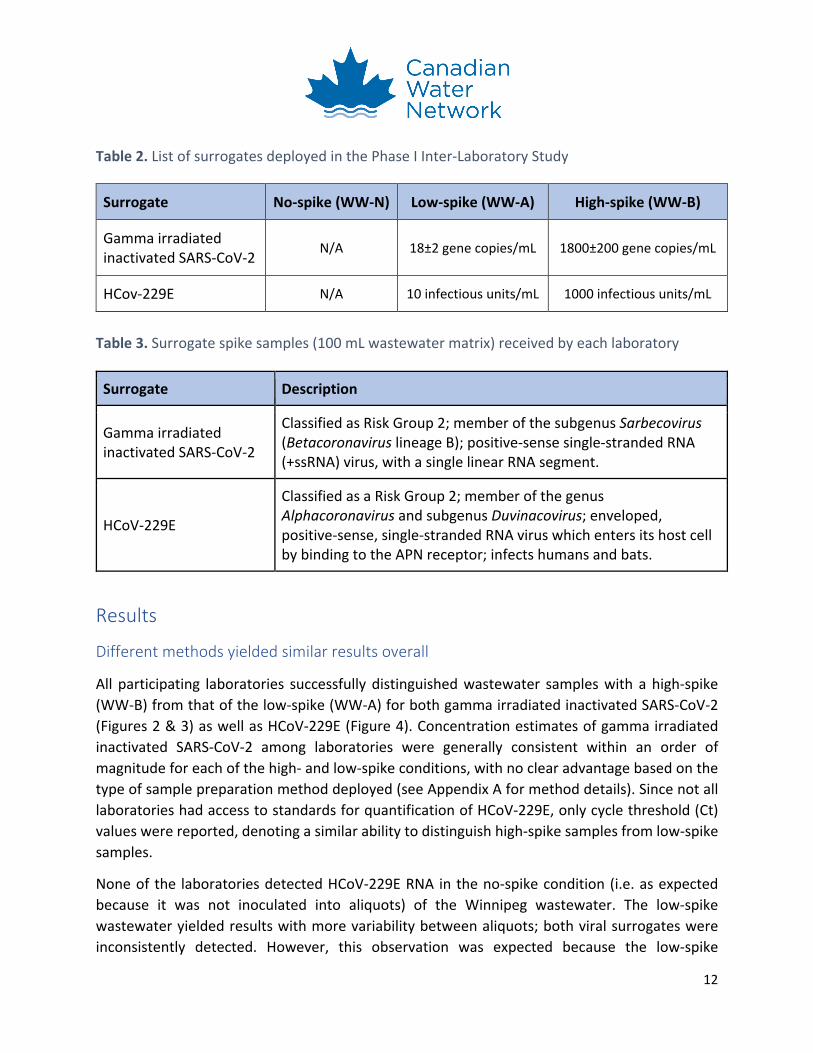
Table 2. List of surrogates deployed in the Phase I Inter-Laboratory Study
Table 3. Surrogate spike samples (100 mL wastewater matrix) received by each laboratory
Results
Different methods yielded similar results overall
All participating laboratories successfully distinguished wastewater samples with a high-spike (WW-B) from that of the low-spike (WW-A) for both gamma irradiated inactivated SARS-CoV-2 (Figures 2 & 3) as well as HCoV-229E (Figure 4). Concentration estimates of gamma irradiated inactivated SARS-CoV-2 among laboratories were generally consistent within an order of magnitude for each of the high- and low-spike conditions, with no clear advantage based on the type of sample preparation method deployed (see Appendix A for method details). Since not all laboratories had access to standards for quantification of HCoV-229E, only cycle threshold (Ct) values were reported, denoting a similar ability to distinguish high-spike samples from low-spike samples.
None of the laboratories detected HCoV-229E RNA in the no-spike condition (i.e. as expected because it was not inoculated into aliquots) of the Winnipeg wastewater. The low-spike wastewater yielded results with more variability between aliquots; both viral surrogates were inconsistently detected. However, this observation was expected because the low-spike
Surrogate No-spike (WW-N) Low-spike (WW-A) High-spike (WW-B)
Gamma irradiated inactivated SARS-CoV-2
N/A 18±2 gene copies/mL 1800±200 gene copies/mL
HCov-229E N/A 10 infectious units/mL 1000 infectious units/mL
Surrogate Description
Gamma irradiated inactivated SARS-CoV-2
Classified as Risk Group 2; member of the subgenus Sarbecovirus (Betacoronavirus lineage B); positive-sense single-stranded RNA (+ssRNA) virus, with a single linear RNA segment.
HCoV-229E
Classified as a Risk Group 2; member of the genus Alphacoronavirus and subgenus Duvinacovirus; enveloped, positive-sense, single-stranded RNA virus which enters its host cell by binding to the APN receptor; infects humans and bats.
13
concentration applied in this study approached the level of sensitivity typically attainable using RT-qPCR methods. In the future, a regression design using a gradient of spike concentrations would allow for a more rigorous examination of method sensitivity at this lower end of spike concentrations. This would be particularly useful for understanding the limitations of the method for monitoring in areas where active COVID-19 cases are less prevalent.
Given that viral surrogates were spiked at the same target levels for both gamma irradiated inactivated SARS-CoV-2 and HCoV-229E, the positively correlated Ct values reported across both surrogates for the same laboratory were expected (i.e. laboratories that estimated higher levels of one viral surrogate also tended to observe higher levels of the other viral surrogate) (Figure 5). Most laboratories were able to observe an approximately 100-fold difference (ΔCt ≈ 6.6) in concentration between low- and high-spikes for both surrogates. However, it was recognized that the Ct values observed for the low-spike is not likely in the linear range of PCR amplification (i.e. approaching the level of sensitivity attainable by RT-qPCR methods) and may have contributed to the inability of some laboratories to observe the 100-fold difference. Therefore, the Ct value obtained from analysis of the surrogates in the low-spike sample (and the ΔCt calculated therefrom) may not lend for an accurate evaluation of variation in this study. Collectively, these results underscore the flexibility of sample preparation methods to yield comparable results given a common wastewater matrix and supports the notion that currently deployed methods can reliably distinguish high from low levels of viral surrogates at the conditions investigated.
Surrogate spikes may partition differently in wastewater than native SARS-CoV-2
Where the method deployed allowed for the distinction of the supernatant and particle-associated fractions of the wastewater matrix, more of the spiked viral surrogates (gamma irradiated inactivated SARS-CoV-2 and HCoV-229E) were generally detected in supernatants rather than particle-associated phases. Given the spike preparation method and the relatively short time between sample spiking and sample processing in this study, it was recognized that spike-and-recovery approaches might not adequately represent the recovery of authentic in-situ SARS-CoV-2 that are likely to be transported predominantly via fecal matter in the wastewater matrix. This underscores that phase partitioning of the virus can substantially influence the apparent effectiveness of the methods used in this study.
Trace levels of SARS-CoV-2 RNA detected in “no-spike” wastewater samples
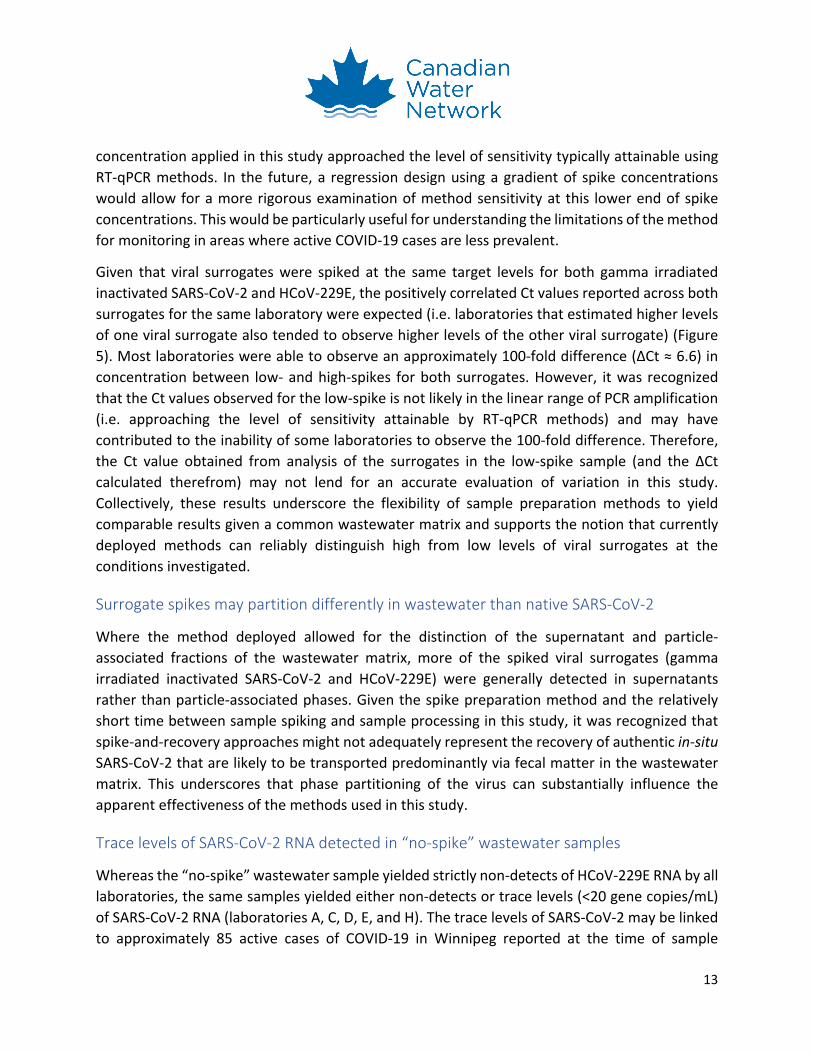
Whereas the “no-spike” wastewater sample yielded strictly non-detects of HCoV-229E RNA by all laboratories, the same samples yielded either non-detects or trace levels (<20 gene copies/mL) of SARS-CoV-2 RNA (laboratories A, C, D, E, and H). The trace levels of SARS-CoV-2 may be linked to approximately 85 active cases of COVID-19 in Winnipeg reported at the time of sample
14
collection and their detection appear linked to laboratories deploying methods that included or focused on the particle-associated fraction of the wastewater rather than the supernatant (laboratories C, D, E). This is in apparent contrast to the partitioning exhibited by spiked viral surrogates in this study and underscores the need to better understand the fate (i.e. partitioning) of SARS-CoV-2 in different wastewater matrices.
Figure 2. Concentration estimates of SARS-CoV-2 RNA quantified in three wastewater samples with no-spike (WW-N), low-spike (WW-A, 18±2 gene copies/mL) and high-spike (WW-B, 1800±200 gene copies/mL). The spiked concentrations are denoted by the dashed lines. Non-detects (o), detected but not quantifiable (+), as well as samples not analyzed (◊) are also shown. Laboratories have been anonymized; laboratory A was the coordinating laboratory that was responsible for the preparation and dissemination of the spiked wastewater samples.
15
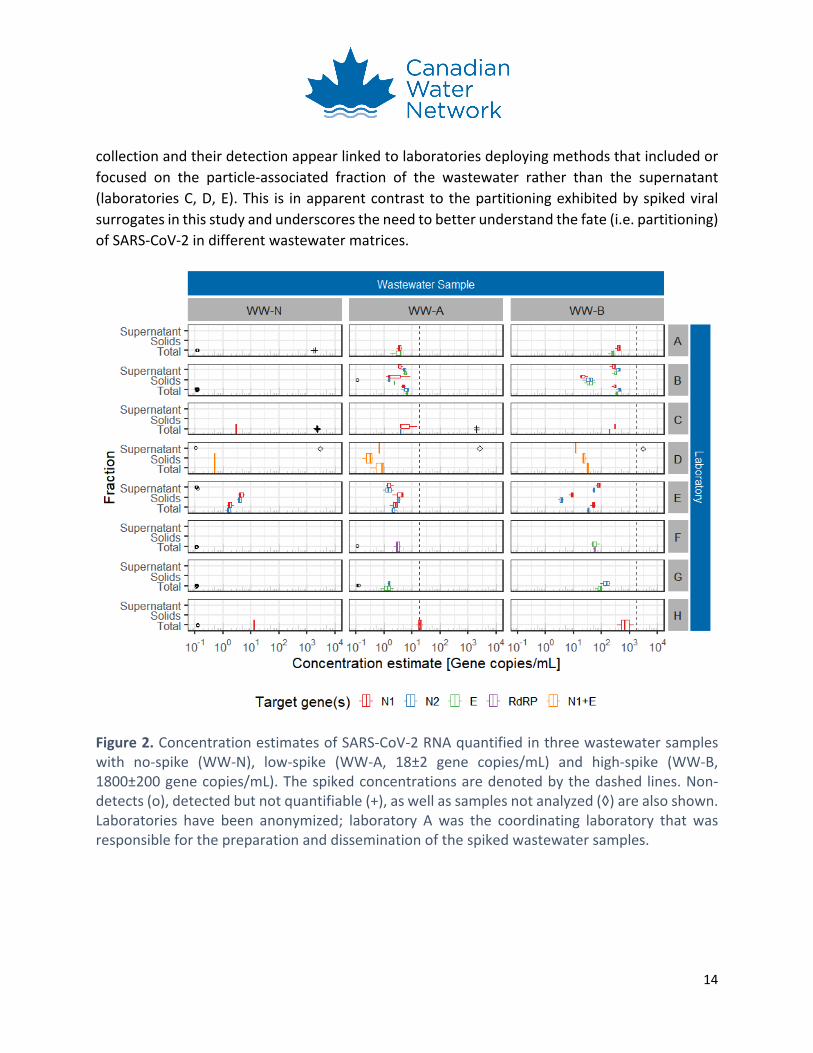
Figure 3. Reported Ct values of SARS-CoV-2 RNA quantified in three wastewater samples with no-spike (WW-N), low-spike (WW-A, 18±2 gene copies/mL) and high-spike (WW-B, 1800±200 gene copies/mL). Non-detects (o), detected but not quantifiable (+), as well as samples not analyzed (◊) are also shown.
16
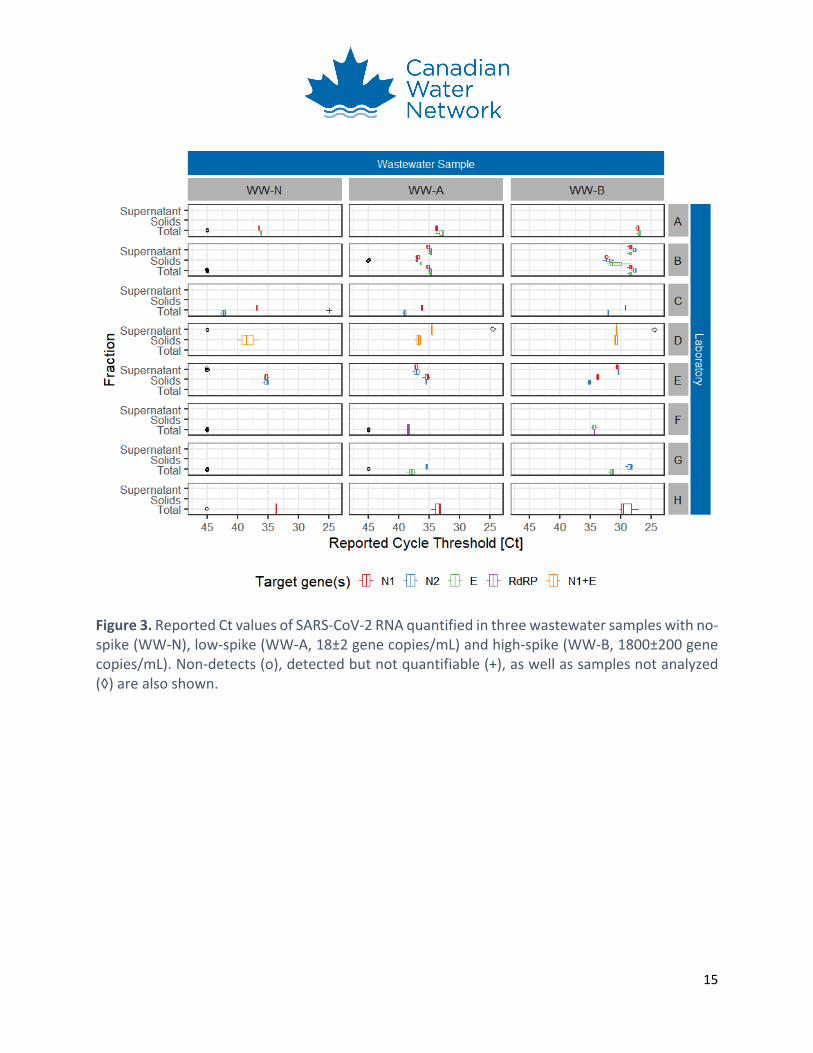
Figure 4. Reported Ct values of HCoV-229E RNA quantified in three wastewater samples with no-spike (WW-N), low-spike (WW-A, 10 infectious units/mL) and high-spike (WW-B, 1000 infectious units/mL). Non-detects (o), detected but not quantifiable (+), as well as samples not analyzed (◊) are also shown.
17
Figure 5. The difference between high-spike and low-spike Ct values (i.e. ΔCt) observed for SARS-CoV-2 and HCoV-229E by each laboratory. Error bars represent the standard deviation of the mean ΔCt; the absence of error bars denote cases where no replicates were available. The ΔCt values reflect those observed in the supernatant fraction or from the processing of both fractions unless otherwise indicated.
Discussion
Inter-laboratory comparisons require a focus on how standard curves for quantification are generated
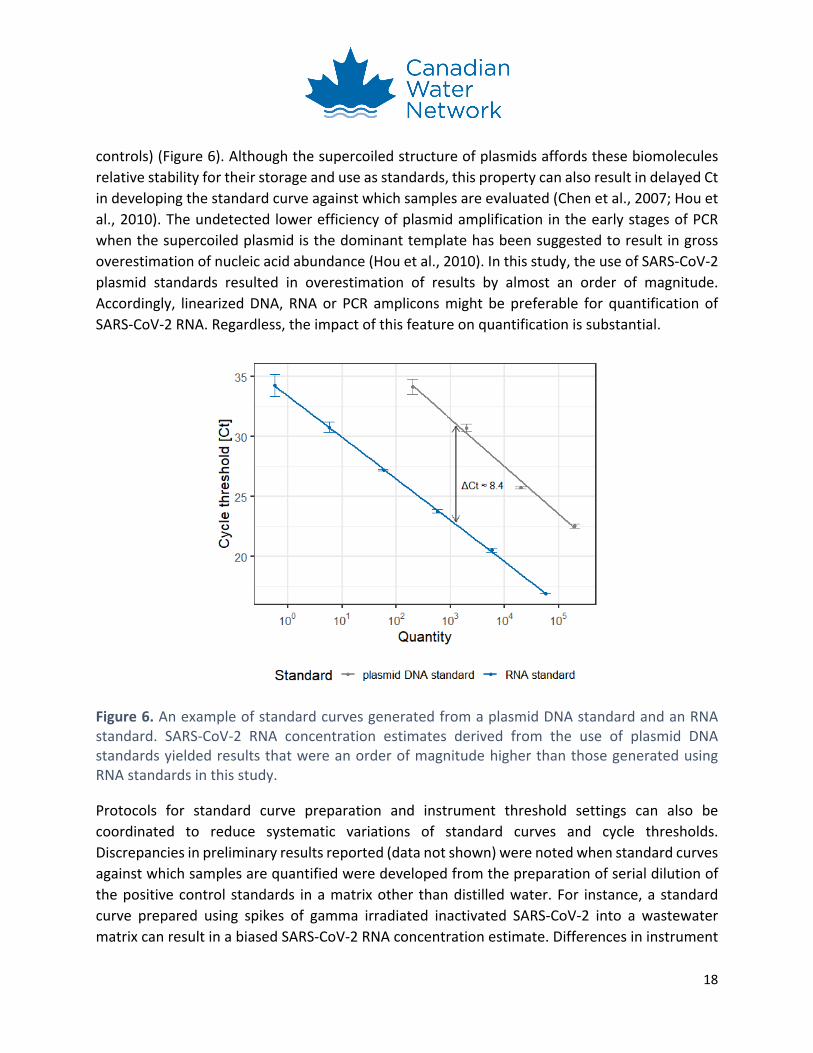
Despite the differences between methods captured by this study, all approaches yielded comparable results. This underscores the value and need for standardizing quality assurance and quality control (QA/QC) protocols and reporting. Standardizing analytical methods is currently not practical, but doing so for QA/QC is achievable and has been shown to be effective (Ahmed, Bivins, et al., 2020). Indeed, discrepancies between initial values reported by participating laboratories (data not shown) arose due to differences of standards and protocols used to generate standard curves for quantification by Ct values. Specifically, laboratories that originally deployed plasmid standards reported SARS-CoV-2 RNA concentration estimates approximately an order of magnitude higher than those laboratories that utilized linear DNA/RNA standards (e.g. Integrated DNA Technologies gBlocks™ gene fragments, Twist Synthetic SARS-CoV-2 RNA
18
controls) (Figure 6). Although the supercoiled structure of plasmids affords these biomolecules relative stability for their storage and use as standards, this property can also result in delayed Ct in developing the standard curve against which samples are evaluated (Chen et al., 2007; Hou et al., 2010). The undetected lower efficiency of plasmid amplification in the early stages of PCR when the supercoiled plasmid is the dominant template has been suggested to result in gross overestimation of nucleic acid abundance (Hou et al., 2010). In this study, the use of SARS-CoV-2 plasmid standards resulted in overestimation of results by almost an order of magnitude. Accordingly, linearized DNA, RNA or PCR amplicons might be preferable for quantification of SARS-CoV-2 RNA. Regardless, the impact of this feature on quantification is substantial.
Figure 6. An example of standard curves generated from a plasmid DNA standard and an RNA standard. SARS-CoV-2 RNA concentration estimates derived from the use of plasmid DNA standards yielded results that were an order of magnitude higher than those generated using RNA standards in this study.
Protocols for standard curve preparation and instrument threshold settings can also be coordinated to reduce systematic variations of standard curves and cycle thresholds. Discrepancies in preliminary results reported (data not shown) were noted when standard curves against which samples are quantified were developed from the preparation of serial dilution of the positive control standards in a matrix other than distilled water. For instance, a standard curve prepared using spikes of gamma irradiated inactivated SARS-CoV-2 into a wastewater matrix can result in a biased SARS-CoV-2 RNA concentration estimate. Differences in instrument
19
threshold settings were also noted as potential contributors to inter-laboratory variability. Collectively, reference materials for quantification, protocols for standard curve preparation and instrument threshold settings should be coordinated to better facilitate direct inter-laboratory comparisons of these results.
Monitoring and addressing PCR inhibition as a key component of QA/QC
Because PCR inhibitors are widespread in environmental samples, PCR can be partially or completely inhibited (Schrader et al., 2012), possibly leading to false-negatives (Kitajima et al., 2020). Consequently, quantified RT-qPCR results must not be presumed void of inhibition effects by making the inaccurate presumption that inhibition is consistently and successfully mitigated by the choice of reagent kits utilized. An appropriate reference target must be deployed as an inhibition control; substantially delayed amplification (higher Ct) of this reference target with the sample matrix will be indicative of PCR inhibition. This should be monitored and documented along with steps taken to minimize inhibition. Dilution or use of a smaller effective sample volume of the viral concentrate are common approaches to mitigating inhibition effects; however, it can result in the loss of method sensitivity (Eckhart et al., 2000; Monteiro et al., 1997; Schrader et al., 2012; Scipioni, Bourgot, et al., 2008; Scipioni, Mauroy, et al., 2008; Widjojoatmodjo et al., 1992). Other strategies (e.g. heat treatment, chemical addition) for the removal of PCR inhibitors from stool and environmental matrices also exist and are summarized elsewhere (Schrader et al., 2012). Nevertheless, the strategy chosen must be tailored for the individual wastewater matrix analyzed. Ultimately, inhibition must be found to be negligible to provide assurance that the level of gene fragments quantified are not negatively confounded by inefficient/unsuccessful PCR amplification (i.e. the levels quantified after PCR are a sole reflection of their abundance rather than [partial] failure to amplify gene sequences that were actually present in the sample).
Process controls and better understanding of surrogate behaviour are needed to evaluate method recovery efficiency
Accurate estimates of the target viral concentration in wastewater require an adjustment of the observed result from the RT-qPCR assay using the estimated process recovery efficiency due to losses incurred throughout the various sample processing, RNA extraction and quantification steps (Ahmed, Bertsch, et al., 2020; Bustin et al., 2009; Huggett et al., 2005). To date, model viruses with similar structural and morphological characteristics that are absent from the wastewater matrix have been used as internal matrix spikes to estimate process recovery efficiency because of stringent biosafety requirements associated with SARS-CoV-2 (Ahmed, Bertsch, et al., 2020). The recovery of other enveloped viruses (e.g. murine hepatitis virus; Ahmed, Bertsch, et al., 2020) and synthetic standards such as quantified armored RNA (Hietala
20
& Crossley, 2006) have also been used and assumed to reflect SARS-CoV-2 process recovery efficiency, though often without additional experimental validation (Bustin et al., 2009).
In this study, HCoV-229E RNA was not detected by any of the participating laboratories in the no-spike wastewater samples. HCoV-229E are enveloped viruses of the same coronavirus family (i.e. Coronaviridae, subfamily Orthocoronavirinae) as SARS-CoV-2 (references in Li et al., 2020) and have been previously documented to be absent from stool samples (Esper et al., 2010). Therefore, HCoV-229E may be a promising candidate as a common internal matrix spike. However, further validation of its ability to reflect SARS-CoV-2 recovery from wastewater is necessary. Given the lack of evidence that all surrogates (including spiked-in HCoV-229E) comparably represent the recovery of SARS-CoV-2 viruses from wastewater, the effort required to perform internal matrix spikes in every sample (that would be desirable to characterize recovery variability attributable to changing wastewater matrix conditions) is not likely warranted. Therefore, a preferred approach might be to report quantitated SARS-CoV-2 concentrations prior to adjusting for recovery, along with an estimate of the recovery efficiency itself and the internal process control surrogate used in the absence of rigorous experimental validation of the surrogate.
Use of fecal biomarkers/indicators to normalize results for improved trend detection
Viral indicators of fecal contributions from wastewater such as PMMoV (Graham et al., 2020; Jafferali et al., 2020), crAssphage (Green et al., 2020; Jennings et al., 2020; Stachler et al., 2017), or other human fecal specific bacteriophages or biomarkers have been increasingly advocated as a means to normalize SARS-CoV-2 RNA concentration estimates that might enable improved detection of trends. Both merit and potential have been shown regarding compensation for the dilution of sewage with stormwater in combined sewer systems or for systems with substantial groundwater infiltration (Alpaslan Kocamemi et al., 2020; Balboa et al., 2020; Kaplan et al., 2020; Peccia et al., 2020; Wu, Xiao, Zhang, Gu, et al., 2020). The applicability of these indicators to provide a consistent fecal signature for normalizing SARS-CoV-2 concentration estimates presumes that their persistence and variability in fecal contributions are consistent with the behaviour of SARS-CoV-2 in a given system. Although potentially useful for improved detection of trends, viruses endogenous to the wastewater collected should not be used in estimating recovery efficiency or detecting PCR inhibition given their relatively uncertain and/or variable nature.
21
References
Ahmed, W., Angel, N., Edson, J., Bibby, K., Bivins, A., O’Brien, J. W., Choi, P. M., Kitajima, M., Simpson, S. L., & Li, J. (2020). First confirmed detection of SARS-CoV-2 in untreated wastewater in Australia: A proof of concept for the wastewater surveillance of COVID-19 in the community. Science of The Total Environment, 138764.
Ahmed, W., Bertsch, P. M., Bivins, A., Bibby, K., Farkas, K., Gathercole, A., Haramoto, E., Gyawali, P., Korajkic, A., McMinn, B. R., Mueller, J. F., Simpson, S. L., Smith, W. J. M., Symonds, E. M., Thomas, K. V., Verhagen, R., & Kitajima, M. (2020). Comparison of virus concentration methods for the RT-qPCR-based recovery of murine hepatitis virus, a surrogate for SARS-CoV-2 from untreated wastewater. Science of The Total Environment, 739, 139960. https://doi.org/10.1016/j.scitotenv.2020.139960
Ahmed, W., Bivins, A., Bertsch, P. M., Bibby, K., Choi, P. M., Farkas, K., Gyawali, P., Hamilton, K. A., Haramoto, E., Kitajima, M., Simpson, S. L., Tandukar, S., Thomas, K., & Mueller, J. F. (2020). Surveillance of SARS-CoV-2 RNA in wastewater: Methods optimization and quality control are crucial for generating reliable public health information. Current Opinion in Environmental Science & Health. https://doi.org/10.1016/j.coesh.2020.09.003
Alpaslan Kocamemi, B., Kurt, H., Sait, A., Sarac, F., Saatci, A. M., & Pakdemirli, B. (2020). SARS-CoV-2 Detection in Istanbul Wastewater Treatment Plant Sludges. MedRxiv, 2020.05.12.20099358. https://doi.org/10.1101/2020.05.12.20099358
Balboa, S., Mauricio-Iglesias, M., Rodríguez, S., Martínez-Lamas, L., Vasallo, F. J., Regueiro, B., & Lema, J. M. (2020). The fate of SARS-CoV-2 in wastewater treatment plants points out the sludge line as a suitable spot for incidence monitoring. MedRxiv, 2020.05.25.20112706. https://doi.org/10.1101/2020.05.25.20112706
Bustin, S. A., Benes, V., Garson, J. A., Hellemans, J., Huggett, J., Kubista, M., Mueller, R., Nolan, T., Pfaffl, M. W., Shipley, G. L., Vandesompele, J., & Wittwer, C. T. (2009). The MIQE Guidelines: Minimum Information for Publication of Quantitative Real-Time PCR Experiments. Clinical Chemistry, 55(4), 611–622. https://doi.org/10.1373/clinchem.2008.112797
Chen, J., Kadlubar, F. F., & Chen, J. Z. (2007). DNA supercoiling suppresses real-time PCR: A new approach to the quantification of mitochondrial DNA damage and repair. Nucleic Acids Research, 35(4), 1377–1388.
D’Aoust, P. M., Mercier, E., Montpetit, D., Jia, J.-J., Alexandrov, I., Neault, N., Baig, A. T., Mayne, J., Zhang, X., Alain, T., Servos, M. R., MacKenzie, M., Figeys, D., MacKenzie, A. E., Graber, T. E., & Delatolla, R. (2020). Quantitative analysis of SARS-CoV-2 RNA from wastewater solids in communities with low COVID-19 incidence and prevalence. MedRxiv, 2020.08.11.20173062. https://doi.org/10.1101/2020.08.11.20173062
22
Daughton, C. G. (2020). Wastewater surveillance for population-wide Covid-19: The present and future. Science of The Total Environment, 736, 139631. https://doi.org/10.1016/j.scitotenv.2020.139631
Eckhart, L., Bach, J., Ban, J., & Tschachler, E. (2000). Melanin Binds Reversibly to Thermostable DNA Polymerase and Inhibits Its Activity. Biochemical and Biophysical Research Communications, 271(3), 726–730. https://doi.org/10.1006/bbrc.2000.2716
Esper, F., Ou, Z., & Huang, Y. T. (2010). Human coronaviruses are uncommon in patients with gastrointestinal illness. Journal of Clinical Virology, 48(2), 131–133. https://doi.org/10.1016/j.jcv.2010.03.007
Graham, K., Loeb, S., Wolfe, M., Catoe, D., Sinnott-Armstrong, N., Kim, S., Yamahara, K., Sassoubre, L., Mendoza, L., Roldan-Hernandez, L., Li, L., Wigginton, K., & Boehm, A. (2020). SARS-CoV-2 in wastewater settled solids is associated with COVID-19 cases in a large urban sewershed. MedRxiv, 2020.09.14.20194472. https://doi.org/10.1101/2020.09.14.20194472
Green, H., Wilder, M., Middleton, F. A., Collins, M., Fenty, A., Gentile, K., Kmush, B., Zeng, T., & Larsen, D. A. (2020). Quantification of SARS-CoV-2 and cross-assembly phage (crAssphage) from wastewater to monitor coronavirus transmission within communities. MedRxiv, 2020.05.21.20109181. https://doi.org/10.1101/2020.05.21.20109181
Hietala, S. K., & Crossley, B. M. (2006). Armored RNA as Virus Surrogate in a Real-Time Reverse Transcriptase PCR Assay Proficiency Panel. Journal of Clinical Microbiology, 44(1), 67–70. https://doi.org/10.1128/JCM.44.1.67-70.2006
Hou, Y., Zhang, H., Miranda, L., & Lin, S. (2010). Serious overestimation in quantitative PCR by circular (supercoiled) plasmid standard: Microalgal pcna as the model gene. PloS One, 5(3), e9545.
Hrudey, S. E., Ashbolt, N. J., Isaac-Renton, J. L., McKay, R. M., & Servos, M. R. (2020). Wastewater-Based Epidemiology for SARS-CoV-2. Royal Society of Canada, 23. https://rsc-src.ca/en/voices/epidemiology-for-sars-cov-2
Huggett, J., Dheda, K., Bustin, S., & Zumla, A. (2005). Real-time RT-PCR normalisation; strategies and considerations. Genes & Immunity, 6(4), 279–284. https://doi.org/10.1038/sj.gene.6364190
Jafferali, M. H., Khatami, K., Atasoy, M., Birgersson, M., Williams, C., & Cetecioglu, Z. (2020). Benchmarking virus concentration methods for quantification of SARS-CoV-2 in raw wastewater. Science of The Total Environment, 142939. https://doi.org/10.1016/j.scitotenv.2020.142939
23
Jennings, W. C., Gálvez-Arango, E., Prieto, A. L., & Boehm, A. B. (2020). CrAssphage for fecal source tracking in Chile: Covariation with norovirus, HF183, and bacterial indicators. Water Research X, 9, 100071. https://doi.org/10.1016/j.wroa.2020.100071
Kaplan, E. H., Wang, D., Wang, M., Malik, A. A., Zulli, A., & Peccia, J. H. (2020). Aligning SARS-CoV-2 Indicators via an Epidemic Model: Application to Hospital Admissions and RNA Detection in Sewage Sludge. MedRxiv, 2020.06.27.20141739. https://doi.org/10.1101/2020.06.27.20141739
Kitajima, M., Ahmed, W., Bibby, K., Carducci, A., Gerba, C. P., Hamilton, K. A., Haramoto, E., & Rose, J. B. (2020). SARS-CoV-2 in wastewater: State of the knowledge and research needs. Science of The Total Environment, 739, 139076. https://doi.org/10.1016/j.scitotenv.2020.139076
Kumar, M., Patel, A. K., Shah, A. V., Raval, J., Rajpara, N., Joshi, M., & Joshi, C. G. (2020). First proof of the capability of wastewater surveillance for COVID-19 in India through detection of genetic material of SARS-CoV-2. Science of The Total Environment, 746, 141326. https://doi.org/10.1016/j.scitotenv.2020.141326
Li, H., Liu, S.-M., Yu, X.-H., Tang, S.-L., & Tang, C.-K. (2020). Coronavirus disease 2019 (COVID-19): Current status and future perspectives. International Journal of Antimicrobial Agents, 55(5), 105951. https://doi.org/10.1016/j.ijantimicag.2020.105951
Lorenzo, M., & Picó, Y. (2019). Wastewater-based epidemiology: Current status and future prospects. Current Opinion in Environmental Science & Health, 9, 77–84. https://doi.org/10.1016/j.coesh.2019.05.007
Lu, D., Huang, Z., Luo, J., Zhang, X., & Sha, S. (2020). Primary concentration–The critical step in implementing the wastewater based epidemiology for the COVID-19 pandemic: A mini-review. Science of The Total Environment, 141245.
Medema, G., Been, F., Heijnen, L., & Petterson, S. (2020). Implementation of environmental surveillance for SARS-CoV-2 virus to support public health decisions: Opportunities and challenges. Current Opinion in Environmental Science & Health. https://doi.org/10.1016/j.coesh.2020.09.006
Medema, G., Heijnen, L., Elsinga, G., Italiaander, R., & Brouwer, A. (2020). Presence of SARS-Coronavirus-2 in sewage. MedRxiv, 2020.03.29.20045880. https://doi.org/10.1101/2020.03.29.20045880
Monteiro, L., Bonnemaison, D., Vekris, A., Petry, K. G., Bonnet, J., Vidal, R., Cabrita, J., & Mégraud, F. (1997). Complex polysaccharides as PCR inhibitors in feces: Helicobacter pylori model. Journal of Clinical Microbiology, 35(4), 995–998.
24
Nemudryi, A., Nemudraia, A., Surya, K., Wiegand, T., Buyukyoruk, M., Wilkinson, R., & Wiedenheft, B. (2020). Temporal detection and phylogenetic assessment of SARS-CoV-2 in municipal wastewater. MedRxiv, 2020.04.15.20066746. https://doi.org/10.1101/2020.04.15.20066746
Peccia, J., Zulli, A., Brackney, D. E., Grubaugh, N. D., Kaplan, E. H., Casanovas-Massana, A., Ko, A. I., Malik, A. A., Wang, D., Wang, M., Warren, J. L., Weinberger, D. M., & Omer, S. B. (2020). SARS-CoV-2 RNA concentrations in primary municipal sewage sludge as a leading indicator of COVID-19 outbreak dynamics. MedRxiv, 2020.05.19.20105999. https://doi.org/10.1101/2020.05.19.20105999
Randazzo, W., Cuevas-Ferrando, E., Sanjuán, R., Domingo-Calap, P., & Sánchez, G. (2020). Metropolitan Wastewater Analysis for COVID-19 Epidemiological Surveillance (SSRN Scholarly Paper ID 3586696). Social Science Research Network. https://doi.org/10.2139/ssrn.3586696
Rimoldi, S. G., Stefani, F., Gigantiello, A., Polesello, S., Comandatore, F., Mileto, D., Maresca, M., Longobardi, C., Mancon, A., Romeri, F., Pagani, C., Cappelli, F., Roscioli, C., Moja, L., Gismondo, M. R., & Salerno, F. (2020). Presence and infectivity of SARS-CoV-2 virus in wastewaters and rivers. Science of The Total Environment, 744, 140911. https://doi.org/10.1016/j.scitotenv.2020.140911
Schrader, C., Schielke, A., Ellerbroek, L., & Johne, R. (2012). PCR inhibitors – occurrence, properties and removal. Journal of Applied Microbiology, 113(5), 1014–1026. https://doi.org/10.1111/j.1365-2672.2012.05384.x
Scipioni, A., Bourgot, I., Mauroy, A., Ziant, D., Saegerman, C., Daube, G., & Thiry, E. (2008). Detection and quantification of human and bovine noroviruses by a TaqMan RT-PCR assay with a control for inhibition. Molecular and Cellular Probes, 22(4), 215–222. https://doi.org/10.1016/j.mcp.2008.02.003
Scipioni, A., Mauroy, A., Ziant, D., Saegerman, C., & Thiry, E. (2008). A SYBR Green RT-PCR assay in single tube to detect human and bovine noroviruses and control for inhibition. Virology Journal, 5(1), 94. https://doi.org/10.1186/1743-422X-5-94
Stachler, E., Kelty, C., Sivaganesan, M., Li, X., Bibby, K., & Shanks, O. C. (2017). Quantitative CrAssphage PCR Assays for Human Fecal Pollution Measurement. Environmental Science & Technology, 51(16), 9146–9154. https://doi.org/10.1021/acs.est.7b02703
Street, R., Malema, S., Mahlangeni, N., & Mathee, A. (2020). Wastewater surveillance for Covid-19: An African perspective. Science of The Total Environment, 743, 140719. https://doi.org/10.1016/j.scitotenv.2020.140719
25
Westhaus, S., Weber, F.-A., Schiwy, S., Linnemann, V., Brinkmann, M., Widera, M., Greve, C., Janke, A., Hollert, H., Wintgens, T., & Ciesek, S. (2020). Detection of SARS-CoV-2 in raw and treated wastewater in Germany – Suitability for COVID-19 surveillance and potential transmission risks. Science of The Total Environment, 751, 141750. https://doi.org/10.1016/j.scitotenv.2020.141750
Widjojoatmodjo, M. N., Fluit, A. C., Torensma, R., Verdonk, G. P., & Verhoef, J. (1992). The magnetic immuno polymerase chain reaction assay for direct detection of salmonellae in fecal samples. Journal of Clinical Microbiology, 30(12), 3195–3199.
World Health Organization. (2020, August 7). Status of environmental surveillance for SARS-CoV-2 virus. https://www.who.int/news-room/commentaries/detail/status-of-environmental-surveillance-for-sars-cov-2-virus
Wu, F., Xiao, A., Zhang, J., Gu, X., Lee, W. L., Kauffman, K., Hanage, W., Matus, M., Ghaeli, N., Endo, N., Duvallet, C., Moniz, K., Erickson, T., Chai, P., Thompson, J., & Alm, E. (2020). SARS-CoV-2 titers in wastewater are higher than expected from clinically confirmed cases. MedRxiv, 2020.04.05.20051540. https://doi.org/10.1101/2020.04.05.20051540
Wu, F., Xiao, A., Zhang, J., Moniz, K., Endo, N., Armas, F., Bonneau, R., Brown, M. A., Bushman, M., Chai, P. R., Duvallet, C., Erickson, T. B., Foppe, K., Ghaeli, N., Gu, X., Hanage, W. P., Huang, K. H., Lee, W. L., Matus, M., … Alm, E. J. (2020). SARS-CoV-2 titers in wastewater foreshadow dynamics and clinical presentation of new COVID-19 cases. MedRxiv. https://doi.org/10.1101/2020.06.15.20117747
Wurtzer, S., Marechal, V., Mouchel, J.-M., Maday, Y., Teyssou, R., Richard, E., Almayrac, J. L., & Moulin, L. (2020). Evaluation of lockdown impact on SARS-CoV-2 dynamics through viral genome quantification in Paris wastewaters [Preprint]. Epidemiology. https://doi.org/10.1101/2020.04.12.20062679
Canadian COVID-19 Wastewater Coalition Phase 1 Inter-Laboratory Study – Comparison of Approaches to Quantify SARS-CoV-2 RNA in Wastewater
These appendices accompany a report published by Canadian Water Network in November 2020. View the full report at cwn-rce.ca/covid-19-wastewater-coalition/phase-1-inter-laboratory-study.
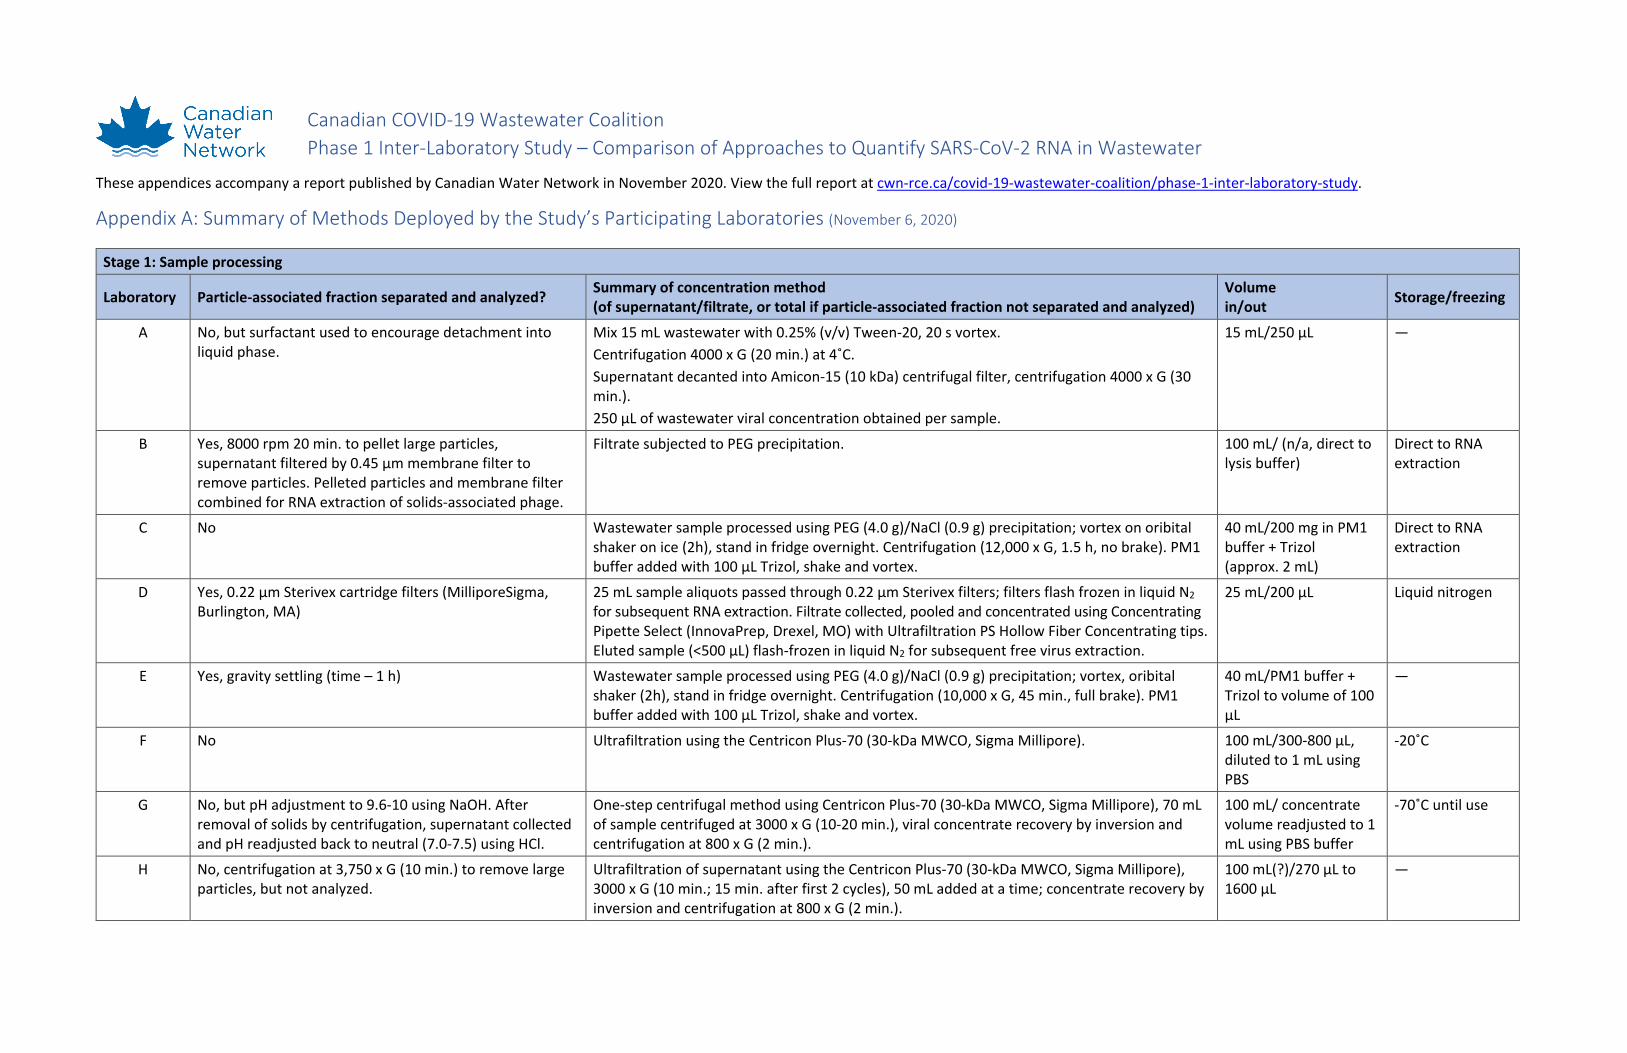
Appendix A: Summary of Methods Deployed by the Study’s Participating Laboratories (November 6, 2020)
Stage 1: Sample processing
Laboratory Particle-associated fraction separated and analyzed? Summary of concentration method (of supernatant/filtrate, or total if particle-associated fraction not separated and analyzed)
Volume in/out Storage/freezing
A No, but surfactant used to encourage detachment into liquid phase.
Mix 15 mL wastewater with 0.25% (v/v) Tween-20, 20 s vortex. Centrifugation 4000 x G (20 min.) at 4˚C. Supernatant decanted into Amicon-15 (10 kDa) centrifugal filter, centrifugation 4000 x G (30 min.). 250 µL of wastewater viral concentration obtained per sample.
15 mL/250 µL ―
B Yes, 8000 rpm 20 min. to pellet large particles, supernatant filtered by 0.45 µm membrane filter to remove particles. Pelleted particles and membrane filter combined for RNA extraction of solids-associated phage.
Filtrate subjected to PEG precipitation. 100 mL/ (n/a, direct to lysis buffer)
Direct to RNA extraction
C No Wastewater sample processed using PEG (4.0 g)/NaCl (0.9 g) precipitation; vortex on oribital shaker on ice (2h), stand in fridge overnight. Centrifugation (12,000 x G, 1.5 h, no brake). PM1 buffer added with 100 µL Trizol, shake and vortex.
40 mL/200 mg in PM1 buffer + Trizol (approx. 2 mL)
Direct to RNA extraction
D Yes, 0.22 µm Sterivex cartridge filters (MilliporeSigma, Burlington, MA)
25 mL sample aliquots passed through 0.22 µm Sterivex filters; filters flash frozen in liquid N2 for subsequent RNA extraction. Filtrate collected, pooled and concentrated using Concentrating Pipette Select (InnovaPrep, Drexel, MO) with Ultrafiltration PS Hollow Fiber Concentrating tips. Eluted sample (<500 µL) flash-frozen in liquid N2 for subsequent free virus extraction.
25 mL/200 µL Liquid nitrogen
E Yes, gravity settling (time – 1 h) Wastewater sample processed using PEG (4.0 g)/NaCl (0.9 g) precipitation; vortex, oribital shaker (2h), stand in fridge overnight. Centrifugation (10,000 x G, 45 min., full brake). PM1 buffer added with 100 µL Trizol, shake and vortex.
40 mL/PM1 buffer + Trizol to volume of 100 µL
―
F No Ultrafiltration using the Centricon Plus-70 (30-kDa MWCO, Sigma Millipore). 100 mL/300-800 µL, diluted to 1 mL using PBS
-20˚C
G No, but pH adjustment to 9.6-10 using NaOH. After removal of solids by centrifugation, supernatant collected and pH readjusted back to neutral (7.0-7.5) using HCl.
One-step centrifugal method using Centricon Plus-70 (30-kDa MWCO, Sigma Millipore), 70 mL of sample centrifuged at 3000 x G (10-20 min.), viral concentrate recovery by inversion and centrifugation at 800 x G (2 min.).
100 mL/ concentrate volume readjusted to 1 mL using PBS buffer
-70˚C until use
H No, centrifugation at 3,750 x G (10 min.) to remove large particles, but not analyzed.
Ultrafiltration of supernatant using the Centricon Plus-70 (30-kDa MWCO, Sigma Millipore), 3000 x G (10 min.; 15 min. after first 2 cycles), 50 mL added at a time; concentrate recovery by inversion and centrifugation at 800 x G (2 min.).
100 mL(?)/270 µL to 1600 µL
―
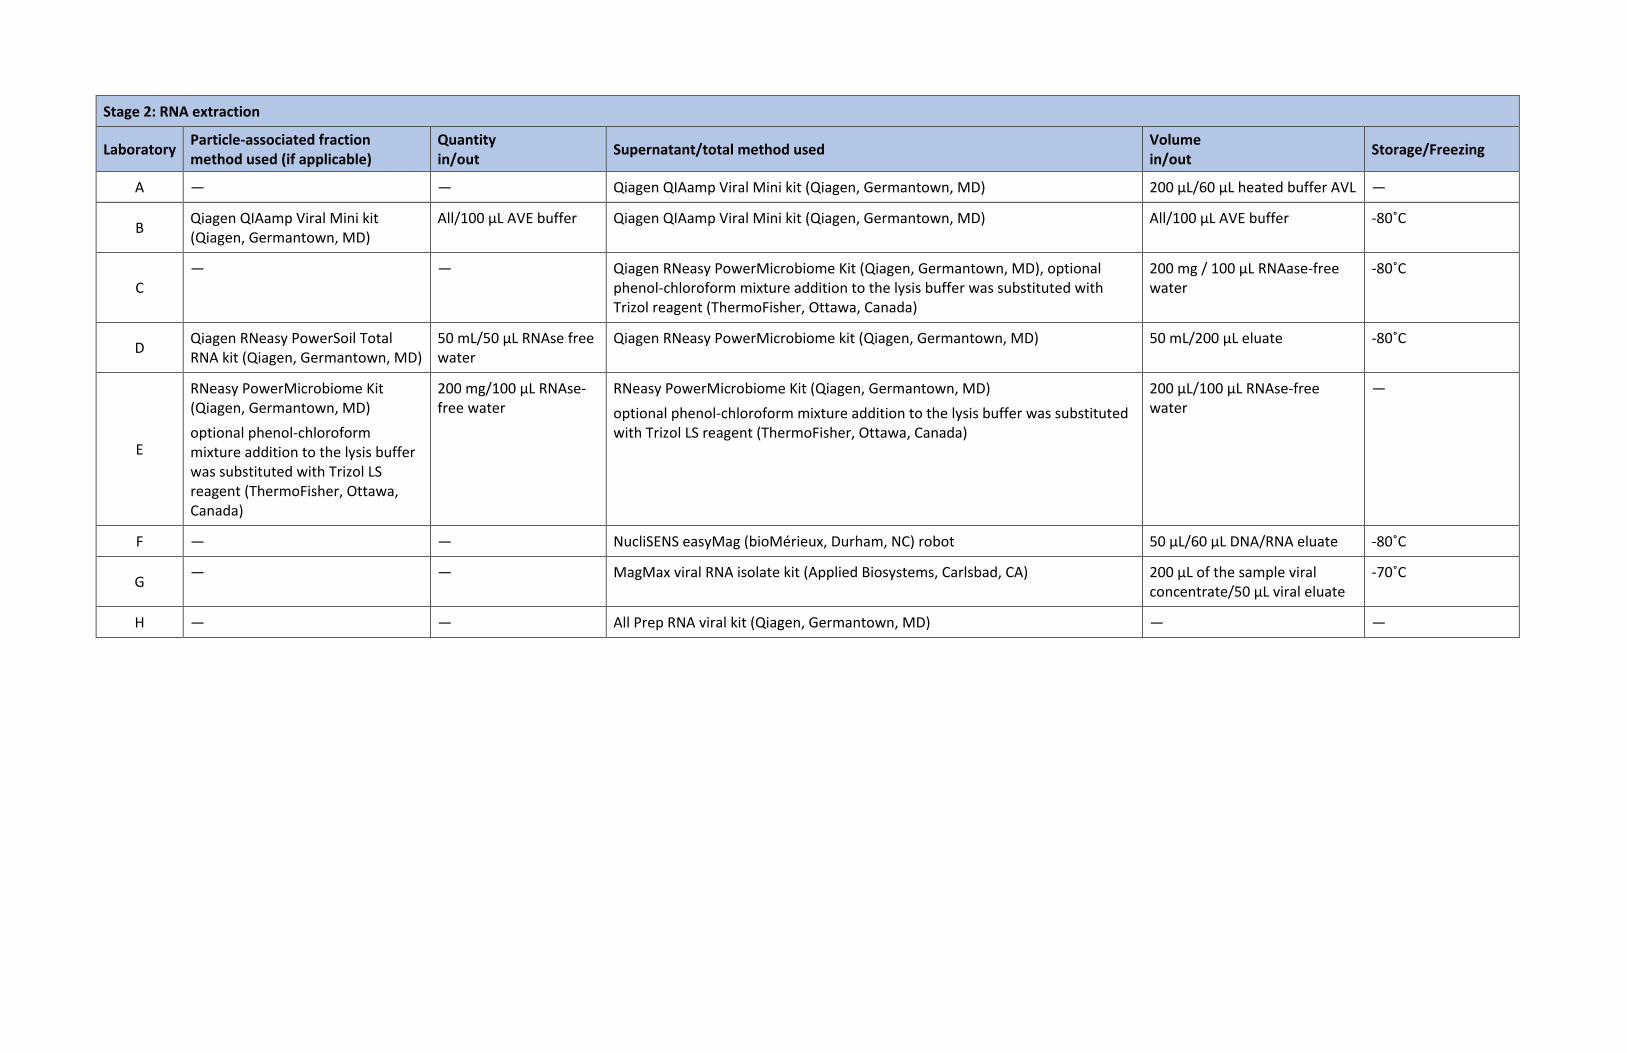
Stage 2: RNA extraction
Laboratory Particle-associated fraction method used (if applicable)
Quantity in/out Supernatant/total method used Volume
in/out Storage/Freezing
A ― ― Qiagen QIAamp Viral Mini kit (Qiagen, Germantown, MD) 200 µL/60 µL heated buffer AVL ―
B Qiagen QIAamp Viral Mini kit (Qiagen, Germantown, MD)
All/100 µL AVE buffer Qiagen QIAamp Viral Mini kit (Qiagen, Germantown, MD) All/100 µL AVE buffer -80˚C
C ― ― Qiagen RNeasy PowerMicrobiome Kit (Qiagen, Germantown, MD), optional
phenol-chloroform mixture addition to the lysis buffer was substituted with Trizol reagent (ThermoFisher, Ottawa, Canada)
200 mg / 100 µL RNAase-free water
-80˚C
D Qiagen RNeasy PowerSoil Total RNA kit (Qiagen, Germantown, MD)
50 mL/50 µL RNAse free water
Qiagen RNeasy PowerMicrobiome kit (Qiagen, Germantown, MD) 50 mL/200 µL eluate -80˚C
E
RNeasy PowerMicrobiome Kit (Qiagen, Germantown, MD) optional phenol-chloroform mixture addition to the lysis buffer was substituted with Trizol LS reagent (ThermoFisher, Ottawa, Canada)
200 mg/100 µL RNAse-free water
RNeasy PowerMicrobiome Kit (Qiagen, Germantown, MD) optional phenol-chloroform mixture addition to the lysis buffer was substituted with Trizol LS reagent (ThermoFisher, Ottawa, Canada)
200 µL/100 µL RNAse-free water
―
F ― ― NucliSENS easyMag (bioMérieux, Durham, NC) robot 50 µL/60 µL DNA/RNA eluate -80˚C
G ― ― MagMax viral RNA isolate kit (Applied Biosystems, Carlsbad, CA) 200 µL of the sample viral concentrate/50 µL viral eluate
-70˚C
H ― ― All Prep RNA viral kit (Qiagen, Germantown, MD) ― ―
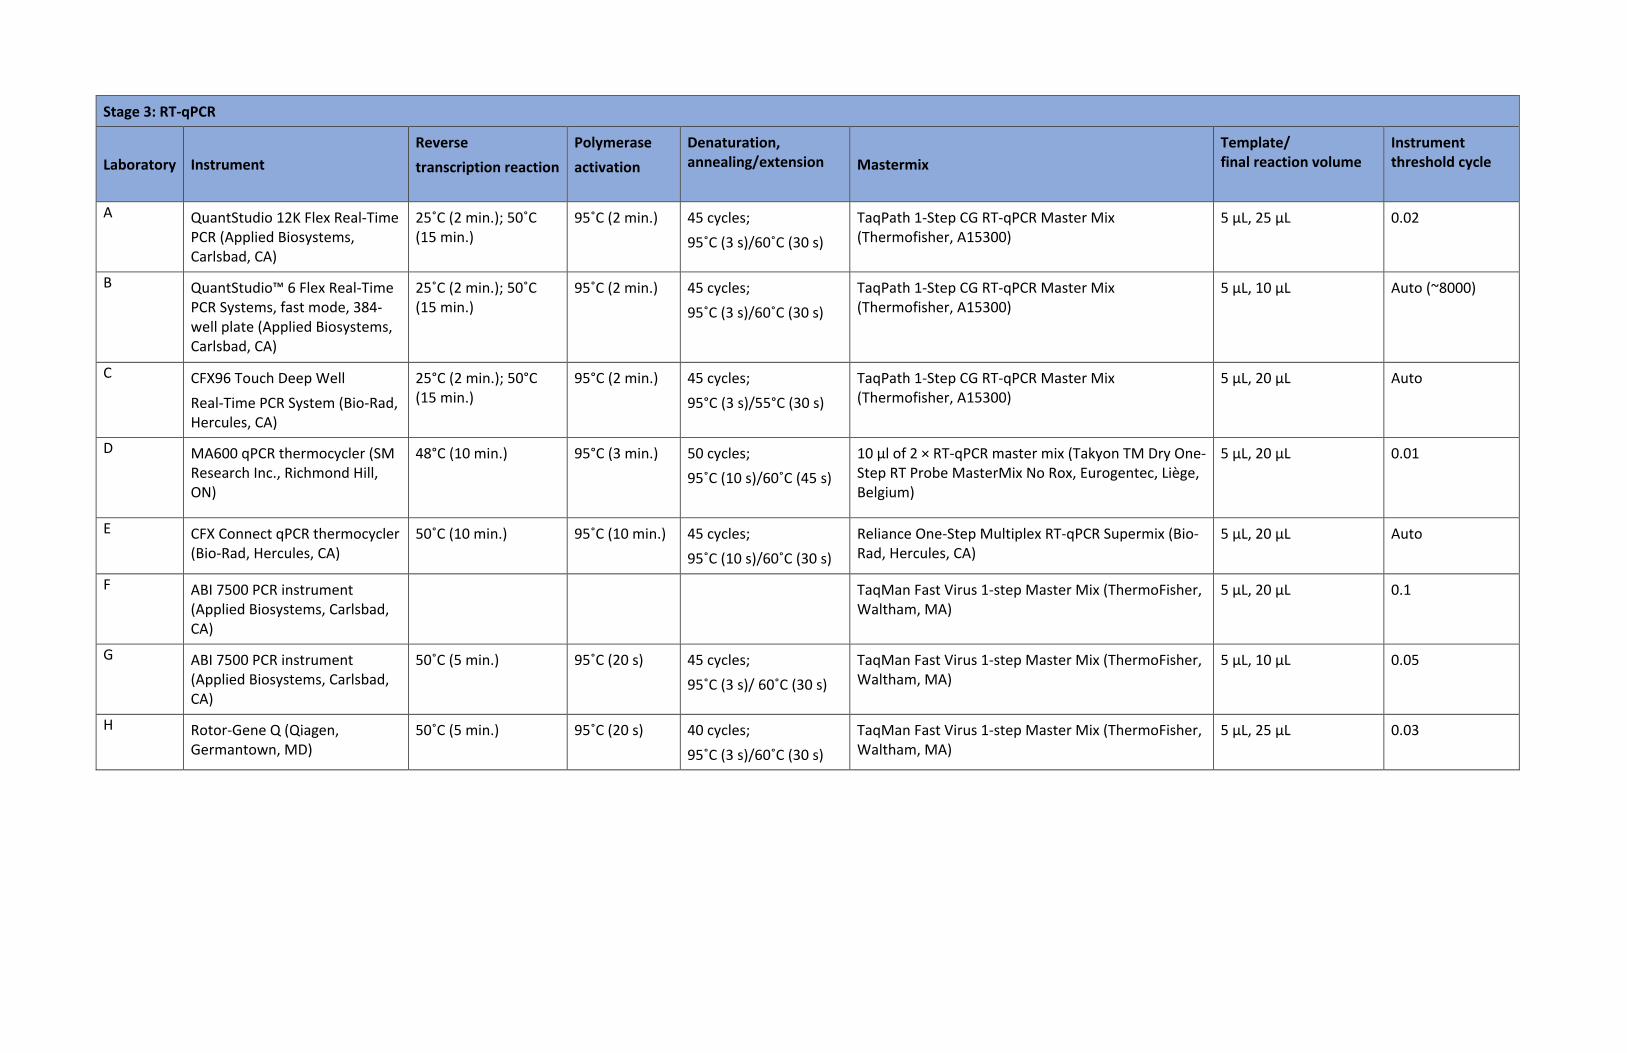
Stage 3: RT-qPCR
Laboratory Instrument Reverse transcription reaction
Polymerase activation
Denaturation, annealing/extension Mastermix
Template/ final reaction volume
Instrument threshold cycle
A QuantStudio 12K Flex Real-Time PCR (Applied Biosystems, Carlsbad, CA)
25˚C (2 min.); 50˚C (15 min.)
95˚C (2 min.) 45 cycles; 95˚C (3 s)/60˚C (30 s)
TaqPath 1-Step CG RT-qPCR Master Mix (Thermofisher, A15300)
5 µL, 25 µL 0.02
B QuantStudio™ 6 Flex Real-Time PCR Systems, fast mode, 384-well plate (Applied Biosystems, Carlsbad, CA)
25˚C (2 min.); 50˚C (15 min.)
95˚C (2 min.) 45 cycles; 95˚C (3 s)/60˚C (30 s)
TaqPath 1-Step CG RT-qPCR Master Mix (Thermofisher, A15300)
5 µL, 10 µL Auto (~8000)
C CFX96 Touch Deep Well Real-Time PCR System (Bio-Rad, Hercules, CA)
25°C (2 min.); 50°C (15 min.)
95°C (2 min.) 45 cycles; 95°C (3 s)/55°C (30 s)
TaqPath 1-Step CG RT-qPCR Master Mix (Thermofisher, A15300)
5 µL, 20 µL Auto
D MA600 qPCR thermocycler (SM Research Inc., Richmond Hill, ON)
48°C (10 min.) 95°C (3 min.) 50 cycles; 95˚C (10 s)/60˚C (45 s)
10 µl of 2 × RT-qPCR master mix (Takyon TM Dry One-Step RT Probe MasterMix No Rox, Eurogentec, Liège, Belgium)
5 µL, 20 µL 0.01
E CFX Connect qPCR thermocycler (Bio-Rad, Hercules, CA)
50˚C (10 min.) 95˚C (10 min.) 45 cycles; 95˚C (10 s)/60˚C (30 s)
Reliance One-Step Multiplex RT-qPCR Supermix (Bio-Rad, Hercules, CA)
5 µL, 20 µL Auto
F ABI 7500 PCR instrument (Applied Biosystems, Carlsbad, CA)
TaqMan Fast Virus 1-step Master Mix (ThermoFisher, Waltham, MA)
5 µL, 20 µL 0.1
G ABI 7500 PCR instrument (Applied Biosystems, Carlsbad, CA)
50˚C (5 min.) 95˚C (20 s) 45 cycles; 95˚C (3 s)/ 60˚C (30 s)
TaqMan Fast Virus 1-step Master Mix (ThermoFisher, Waltham, MA)
5 µL, 10 µL 0.05
H Rotor-Gene Q (Qiagen, Germantown, MD)
50˚C (5 min.) 95˚C (20 s) 40 cycles; 95˚C (3 s)/60˚C (30 s)
TaqMan Fast Virus 1-step Master Mix (ThermoFisher, Waltham, MA)
5 µL, 25 µL 0.03
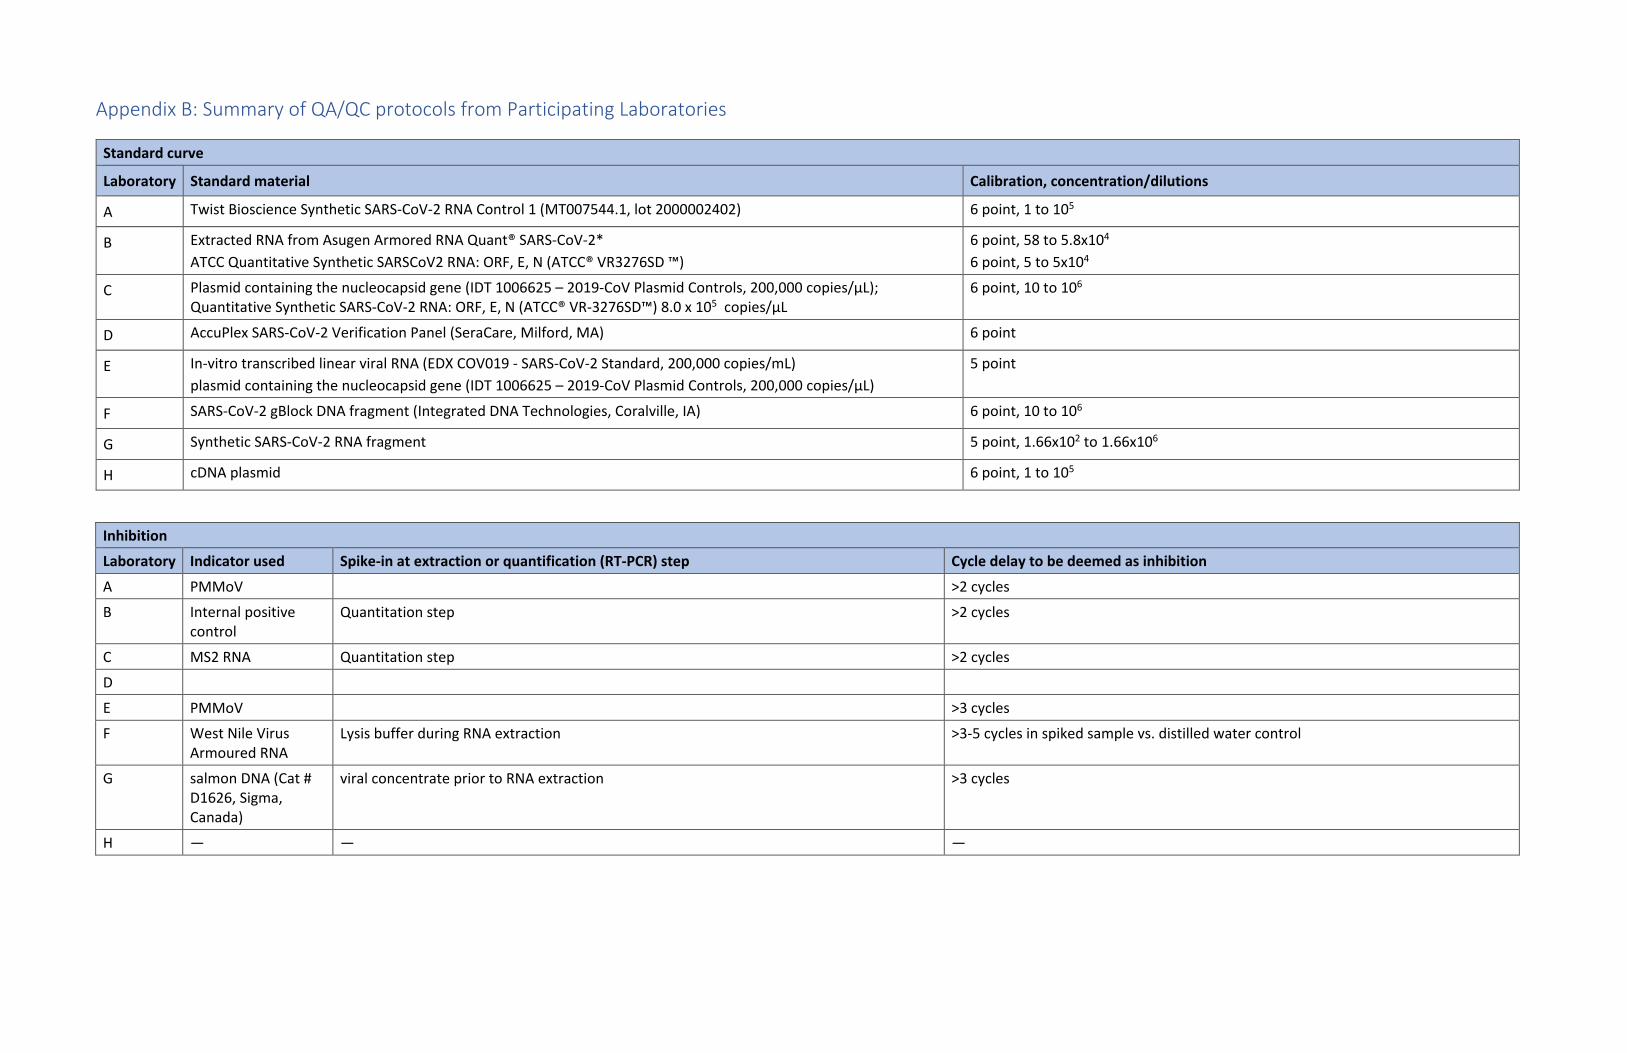
Appendix B: Summary of QA/QC protocols from Participating Laboratories
Standard curve
Laboratory Standard material Calibration, concentration/dilutions
A Twist Bioscience Synthetic SARS-CoV-2 RNA Control 1 (MT007544.1, lot 2000002402) 6 point, 1 to 105
B Extracted RNA from Asugen Armored RNA Quant® SARS-CoV-2* ATCC Quantitative Synthetic SARSCoV2 RNA: ORF, E, N (ATCC® VR3276SD ™)
6 point, 58 to 5.8x10⁴
6 point, 5 to 5x10⁴
C Plasmid containing the nucleocapsid gene (IDT 1006625 – 2019-CoV Plasmid Controls, 200,000 copies/µL); Quantitative Synthetic SARS-CoV-2 RNA: ORF, E, N (ATCC® VR-3276SD™) 8.0 x 10⁵ copies/µL
6 point, 10 to 106
D AccuPlex SARS-CoV-2 Verification Panel (SeraCare, Milford, MA) 6 point
E In-vitro transcribed linear viral RNA (EDX COV019 - SARS-CoV-2 Standard, 200,000 copies/mL) plasmid containing the nucleocapsid gene (IDT 1006625 – 2019-CoV Plasmid Controls, 200,000 copies/µL)
5 point
F SARS-CoV-2 gBlock DNA fragment (Integrated DNA Technologies, Coralville, IA) 6 point, 10 to 106
G Synthetic SARS-CoV-2 RNA fragment 5 point, 1.66x10² to 1.66x10⁶
H cDNA plasmid 6 point, 1 to 105
Inhibition
Laboratory Indicator used Spike-in at extraction or quantification (RT-PCR) step Cycle delay to be deemed as inhibition
A PMMoV >2 cycles
B Internal positive control
Quantitation step >2 cycles
C MS2 RNA Quantitation step >2 cycles
D
E PMMoV >3 cycles
F West Nile Virus Armoured RNA
Lysis buffer during RNA extraction >3-5 cycles in spiked sample vs. distilled water control
G salmon DNA (Cat # D1626, Sigma, Canada)
viral concentrate prior to RNA extraction >3 cycles
H ― ― ―
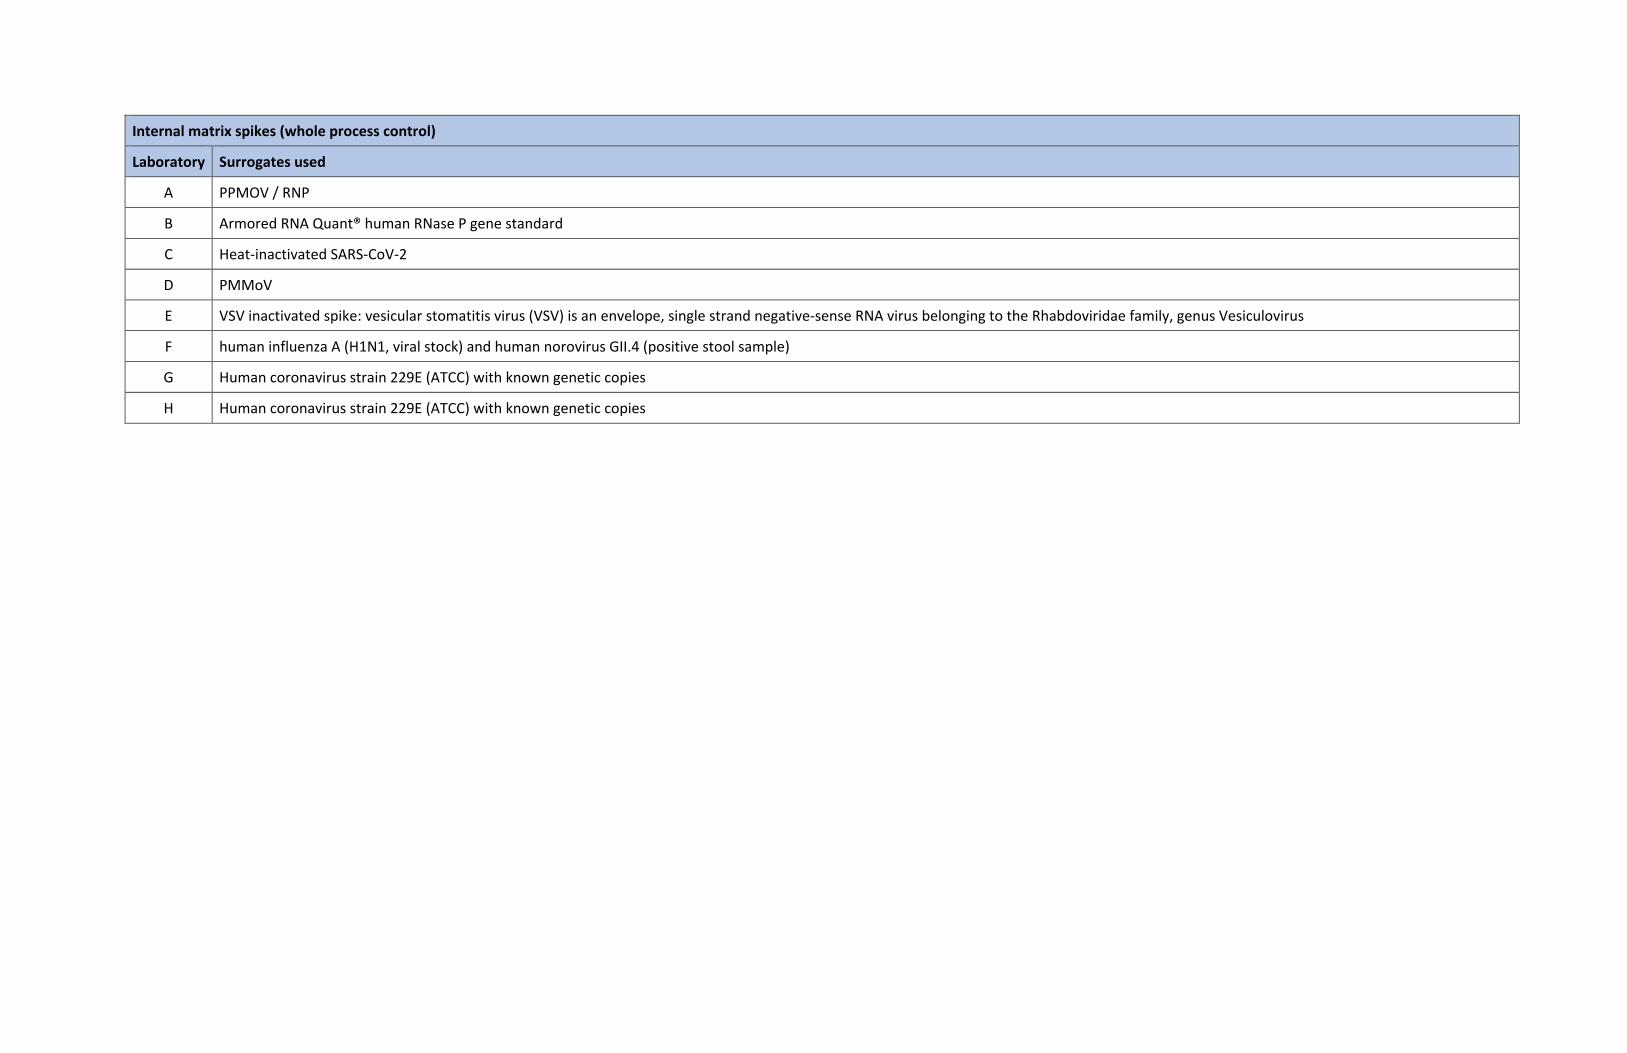
Internal matrix spikes (whole process control)
Laboratory Surrogates used
A PPMOV / RNP
B Armored RNA Quant® human RNase P gene standard
C Heat-inactivated SARS-CoV-2
D PMMoV
E VSV inactivated spike: vesicular stomatitis virus (VSV) is an envelope, single strand negative-sense RNA virus belonging to the Rhabdoviridae family, genus Vesiculovirus
F human influenza A (H1N1, viral stock) and human norovirus GII.4 (positive stool sample)
G Human coronavirus strain 229E (ATCC) with known genetic copies
H Human coronavirus strain 229E (ATCC) with known genetic copies