Embed Size (px)
Citation preview
Report of “Household survey for Assessment of
Toilet Coverage under Swachh Bharat Mission –
Gramin”
Submitted to
Ministry of Drinking Water and Sanitation
By
Quality Council of India
2nd Floor, Institution of Engineers Building, 2-Bahadur Shah Zafar Marg, New Delhi
www.qcin.org
.

Swachh Bharat Mission – Gramin|2017
2
Table of Contents
1. INTRODUCTION ................................................................................................................................ 4
2. METHODOLOGY ............................................................................................................................... 6
2.1 SAMPLING METHODOLOGY ................................................................................................................................. 6 2.2 SURVEY DESIGN ................................................................................................................................................ 7 2.3 SURVEY DESIGN – NAMAMI GANGE ...................................................................................................................... 8 2.4 DATA SOURCE AND COLLECTION ........................................................................................................................... 8 2.5 DATA MONITORING AND CONTROL ........................................................................................................................ 9 2.6 QUALITY CHECK FRAMEWORK .............................................................................................................................. 9
3. KEY FINDINGS ................................................................................................................................... 9
3.1 HOUSEHOLD ..................................................................................................................................................... 9 3.2 DIRECT OBSERVATION ...................................................................................................................................... 21 3.3 NAMAMI GANGE ............................................................................................................................................. 26
4. CONCLUSION ................................................................................................................................. 33

Swachh Bharat Mission – Gramin|2017
3
Foreword
The launch of Swachh Bharat Mission on 2nd October, 2014 is a quantum leap for India on the
cleanliness and sanitation front. The mission shifts its focus from Outputs (i.e. toilet
construction), as in earlier initiatives, to Outcomes (i.e. Open Defecation Free India and
behavioural change). Swachh Bharat Mission (SBM) has become a mass movement but we
are working that it scales new heights.
The Ministry of Drinking Water and Sanitation is committed to make each and every village of
India clean and open defecation free. Since its launch, more than four crore individual
household toilets have been built and 2.13 lakh villages and 151 districts have become open
defecation free (ODF).
A continuous monitoring and evaluation strategy is followed by the Ministry of Drinking
Water and Sanitation to monitor the current status of the implementation of the mission.
Such exercises provide a reality check and guide with the necessary course correction
measures in order to achieve the goal. As the Swachh Bharat Mission completes 3 years, a
household survey was carried out by Quality Council of India (QCI) in villages across India to
assess sanitation coverage and cleanliness and I feel happy that the results have been
encouraging.
It gives me extreme pleasure to present this report on completion of 3 years of Swachh
Bharat Mission. The report aims to assess the current status of rural sanitation coverage and
usage of toilets at a pan India level as well as at state level. It also provides an independent
evaluation of the progress made so far under Swachh Bharat Mission (Gramin).
I place my sincere thanks to all the field staff and management of QCI. I also like to place my
thanks to Shri Hiranya Borah, Deputy Director General and his team for guiding the QCI team
all along for conducting the survey and preparing the report.
Parameswaran Iyer
Secretary- Drinking Water & Sanitation
Swachh Bharat Mission – Gramin|2017
4
1. Introduction “An ideal village will be so constructed as to lend itself to perfect sanitation…The very first
problem the village worker will solve is its sanitation.”
- Mahatma Gandhi wrote in ‘Harijan’
(1937)
Mahatma Gandhi gave great emphasis on cleanliness, personal hygiene and sanitation. They
are the basic determinants of a healthy and quality life. Perfect sanitation formed the core of
Mahatma Gandhi’s conception of an “Ideal Village”.
The term ‘Sanitation’ includes access to toilets for defecation, solid and liquid waste
management, environmental cleanliness and personal hygiene. Lack of sanitation and
personal hygiene has a direct impact on public health as it leads to prevalence of
communicable and non-communicable diseases, high maternal and infant mortality rate,
under-nutrition in children, thus impacting the economic productivity of the country. Lack of
adequate sanitation violates the privacy of the people, especially women and girls, by forcing
them into the indignity of open defecation. Inefficient solid & liquid waste management leads
to disastrous impact on environment, especially pollution of rivers and other water bodies.
Hence sanitation, personal hygiene and environmental cleanliness are pre-requisites for
development of a country.
The first program with focus on cleanliness and hygiene, in India, was Central Rural Sanitation
Program (CRSP) started in 1986. It aimed to construct individual sanitary latrines and to
convert dry latrines to low cost sanitary latrines for Below Poverty Line (BPL) population. It
was not able to achieve its motive of improving access to sanitation and was followed by the
launch of Total Sanitation campaign (TSC) in 1999. This programme followed the principle of
community led total sanitation and shifted its focus from toilet infrastructure creation as in
CRSP to emphasis on behaviour change. In June 2003, Government of India started an
innovative scheme called Nirmal Gram Puraskar (NGP) to give a boost to TSC. Nirmal Gram
Puraskar incentivises those gram panchayats, blocks and districts which have attained 100%
sanitation coverage in their respective geographical areas. The TSC was renamed as Nirmal
Bharat Abhiyan (NBA) in 2012 with the objective to accelerate sanitation coverage and thus
bring about an improvement in the general quality of life in rural areas of India.

Swachh Bharat Mission – Gramin|2017
5
Swachh Bharat Mission (SBM) was launched by Honourable Prime Minister of India on 2nd
October, 2014, to expedite the efforts towards achieving universal cleanliness. The mission
set out clear guidelines to fulfil the vision and mission of “Clean India” across the country by
2nd October, 2019 i.e. the 150th birth anniversary of Father of the Nation, Mahatma Gandhi.
Under its umbrella, the Swachh Bharat Mission- Gramin (SBM-G) aspires to bring an
improvement in the general quality of life in rural areas, by promoting cleanliness, hygiene
and eliminating open defecation. It also aims to encourage cost effective and appropriate
technologies for ecologically safe and sustainable sanitation. The main components and
activities for implementation of SBM-G are as follows:
Construction of Individual Household Latrines (IHHL)
Solid and Liquid Waste Management
Information, Education and Communication (IEC) activities
Capacity building of the stakeholders
Micro-financing of construction of toilets
Community Sanitary Complex
The first 3 years of the SBM-G have shown good progress as reflected in the IMIS data of the
Ministry of Drinking Water and Sanitation (MoDWS). Based on the inputs received by the
states and the UTs, the rural sanitation coverage has increased from 38.70 % at the start of
SBM in 2014 to 63.73 % as on 01/06/2017.
With the mission gaining momentum, the pace of toilet construction and ODF declaration
across the country has increased tremendously. Hence, a rapid central verification of the
progress made by the states has become vital to identify any gaps that may exist and make
appropriate course corrections. Also, the Swachh Bharat Mission – Gramin guidelines
elucidate that periodical evaluation studies need to be conducted at central and state level
by reputed institutes and organisations.
For this purpose, the Ministry of Drinking Water and Sanitation (MoDWS) engaged Quality
Council of India (QCI) to conduct a survey on progress of Swachh Bharat Mission- Gramin.

Swachh Bharat Mission – Gramin|2017
6
Consequently, a survey was conducted in 4626 villages from May to June, 2017, spread out
across all states of India. In addition, 200 Namami Gange villages were also assessed to check
the actual coverage of rural sanitation. The survey was aimed at providing a third-party
evaluation for the implementation of the SBM-G and also validate or repudiate the data
received by the Ministry from various other surveys and sources.
2. Methodology The methodology of the survey was developed by Ministry of Drinking Water and Sanitation
(MoDWS) in consultation with QCI.
2.1 Sampling Methodology Allocation of villages within the State
4626 villages (Primary Sample Unit) across the country were decided to be surveyed.
Allocation of these 4626 villages among the States and Union Territories has been done
following the Probability Proportional to Size (PPS) sampling technique, where Size is the
rural population of the State.
In case of small States, if the number of allocation of villages came out to be less than 20,
then allocation for that State is 20 villages.
Selection of villages within the State
Simple Random Sampling Without Replacement (SRSWR) method has been applied for
selection of villages within the State/UTs.
Selection of households within the village
- Simple systematic random sampling procedure has been adopted for selection of
household within the village if number of households within the village is more than 30.
30 households were selected in a village (at least 20 households in plain area and 15
households in hilly area) using systematic random sampling. First household was selected
on the random basis and rest of the household were selected as (R+I) where R is random
start and I was calculated as number of households divided by thirty excluding the
decimal part.
If the number of households in the village was less than 30 but more than 20 and the
village was in the plain area, then the village was surveyed by surveying all the
households in the village.

Swachh Bharat Mission – Gramin|2017
7
If the number of households in the village was less than 20 and the village is in the plain
area, then the nearest village with population more than 30 households was to be
surveyed by following Systematic sampling method as explained above.
If the number of households in the village was less than 30 but more than 15 and the
village was in the hill area, the village was surveyed by surveying all the households in the
village.
If the number of households in the village was less than 15 and the village was in the hill
area, then the nearest village with population more than 20 households was to be
surveyed by following Systematic sampling method as explained above.
Also, a rapid assessment of the villages under Namami Gange programme was to be done to
assess their sanitation coverage. For this purpose, 200 villages were purposively selected to
assess the implementation of the scheme in these villages and thus identify the course
correction measures.
2.2 Survey Design The survey at village level is composed of two components:
Household Survey: The objective of the household survey is to collect information
regarding Access to toilet, Usage of the toilet and Solid and Liquid Waste
Management at the household level. Additional information like demographic details,
type of toilet pan, support from the government would also be obtained through the
questionnaire.
Direct Observation: The objective of Direct Observation is to collect information
regarding access to toilet and the presence or absence of litter, to assess cleanliness
at the following places:
- School
- Anganwadi
- Public Health Centre
In addition, to identify the practice of dumping of litter on the outskirts of the village
by the inhabitants, Entry point in each village is also to be surveyed.

Swachh Bharat Mission – Gramin|2017
8
The questionnaire for the survey is developed by the Ministry of Drinking Water and
Sanitation in consultation with QCI.
2.3 Survey Design – Namami Gange The survey of Namami Gange villages is composed of three components:
Household Survey: The objective of the household survey is to collect information
regarding Access to toilet, Usage of the toilet, Solid and Liquid Waste Management at
the household level and Information regarding the awareness of people with respect
to sanitation and hygiene. Additional information like demographic details, type of
toilet pan, support from the government is also to be obtained through the
questionnaire.
Village Head Interview: The objective of the Village Head Interview is to seek
information about the access and usage of toilet by the households of the village from
the village head. The information so provided is to be audited by direct observation of
the assessor and feedback of the households using mobile application.
Direct Observation: The objective of the Direct Observation is to collect information
regarding access to functional and gender friendly toilets at the following places
- School
- Anganwadi
In addition, Direct Observation also seeks information regarding presence or absence
of open defecation at the following places
- Village Entry.
- Village Exit
- Open Fields
2.4 Data Source and Collection The primary source of data for the State level survey and Namami Gange survey is the
feedback from the respondents of the households in each village. Independent observation
of the School, Anganwadi, PHC and Village entry, was also carried out by the assessors. For
Namami Gange villages, the additional data sources include the feedback from the village
head and independent observation of the open defecation sites (Village Entry & Exit, Open
Fields) in each of the village.

Swachh Bharat Mission – Gramin|2017
9
A special mobile based application was developed for collection of data. The authenticity of
data was ensured through pictures and geo-tagging of each survey form.
2.5 Data monitoring and control A team of 300 assessors was deployed on the field to ensure quality and consistency of the
survey across the country. The assessors were main the point of contact with the households
and the village institutions. Therefore, first and foremost task done for the survey was
familiarising the assessors with the concepts and intricacies of the work of data collection. A
detailed training on concepts related to rural sanitation and questionnaire of the survey was
conducted at 6 locations viz. Delhi, Mumbai, Chennai, Hyderabad, Kolkata and Guwahati.
A 24X7 control room was setup at QCI to monitor daily progress and ensure quality &
consistency of the survey. The control room coordinated with district coordinators and block
authorities for smooth conduct of the survey. Survey results were monitored on a real-time
basis and the queries of the assessors were resolved promptly by the team.
2.6 Quality Check framework
A multi-layer Quality Check framework was followed to ensure the quality and consistency of
the survey data. The quality of data received was thoroughly checked on a real-time basis. A
Quick Response Team (QRT) was formed by QCI to conduct surprise checks. After all these
quality checks, a final set of clean data was extracted to do the analysis.
Key Findings
3.1 Household
3.1.1 Access and Usage Access of households to toilet is one of the most important parameter to judge the success of
Swachh Bharat Mission (Gramin) as it is necessary to eliminate open defecation and promote
cleanliness. Access to toilet includes access to Own toilet, Shared toilet or Public toilet. Of the
4626 villages surveyed, it was observed that overall toilet coverage is 62.45%.

Swachh Bharat Mission – Gramin|2017
10
FIGURE 1: ACCESS TO TOILET
Access to toilet is necessary but not sufficient in ensuring increased sanitation coverage. It is
necessary to ensure that access to toilet is followed by usage of those toilets, in order to
prevent open defecation and thus ensuring environmental cleanliness. Such behavioural
change towards usage of toilets and not going in open to defecate is one of the major
parameter to measure success of Swachh Bharat Mission- Gramin. It was observed from the
survey results that, of the households having access to a toilet, 91.29% households use it.
The table below details state level findings of the survey regarding percentage of the
households having Access to a toilet (Own toilet, Shared toilet and Public toilet) and
percentage of households actually using the toilets.
TABLE 1: STATE WISE ACCESS AND USAGE OF TOILET
State Name Access to toilet Usage of toilet
A & N Islands 58% 97%
Andhra Pradesh 57% 93%
Arunachal Pradesh 72% 98%
Assam 67% 92%
Bihar 30% 87%
Chhattisgarh 87% 87%
D & N Haveli 49% 69%
Goa 82% 96%
Gujarat 85% 91%
Haryana 99% 100%
Himachal Pradesh 90% 100%
Swachh Bharat Mission – Gramin|2017
11
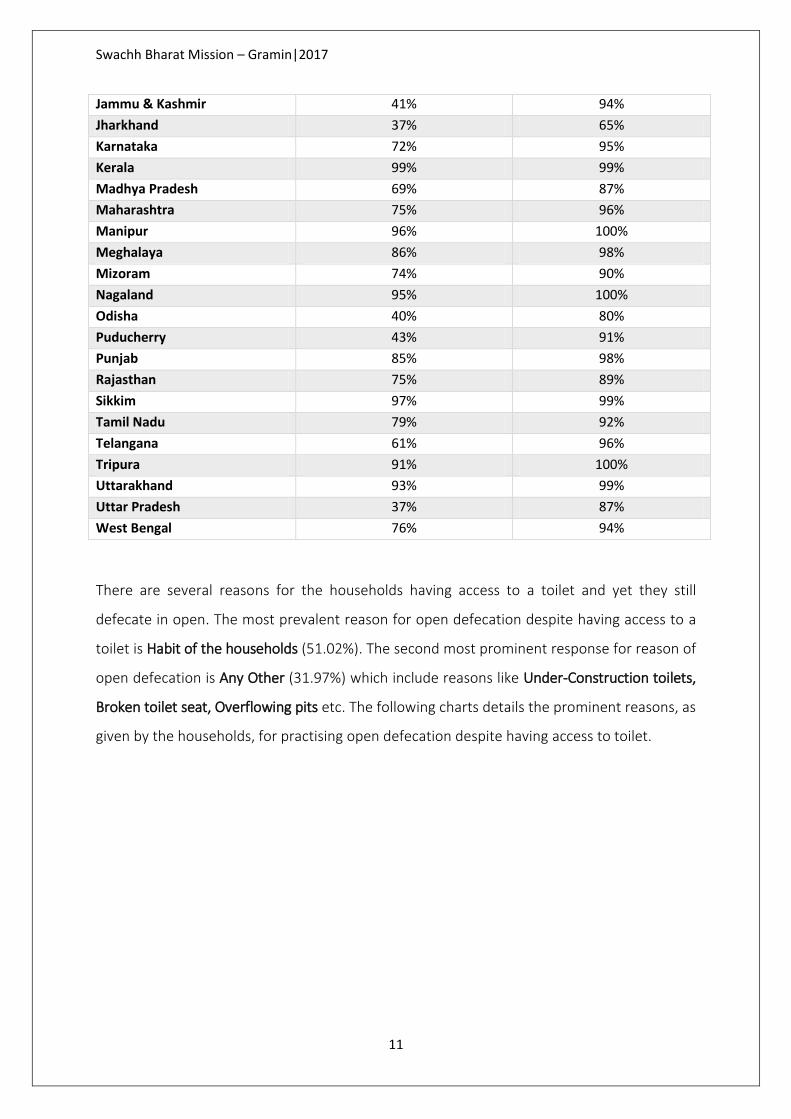
Jammu & Kashmir 41% 94%
Jharkhand 37% 65%
Karnataka 72% 95%
Kerala 99% 99%
Madhya Pradesh 69% 87%
Maharashtra 75% 96%
Manipur 96% 100%
Meghalaya 86% 98%
Mizoram 74% 90%
Nagaland 95% 100%
Odisha 40% 80%
Puducherry 43% 91%
Punjab 85% 98%
Rajasthan 75% 89%
Sikkim 97% 99%
Tamil Nadu 79% 92%
Telangana 61% 96%
Tripura 91% 100%
Uttarakhand 93% 99%
Uttar Pradesh 37% 87%
West Bengal 76% 94%
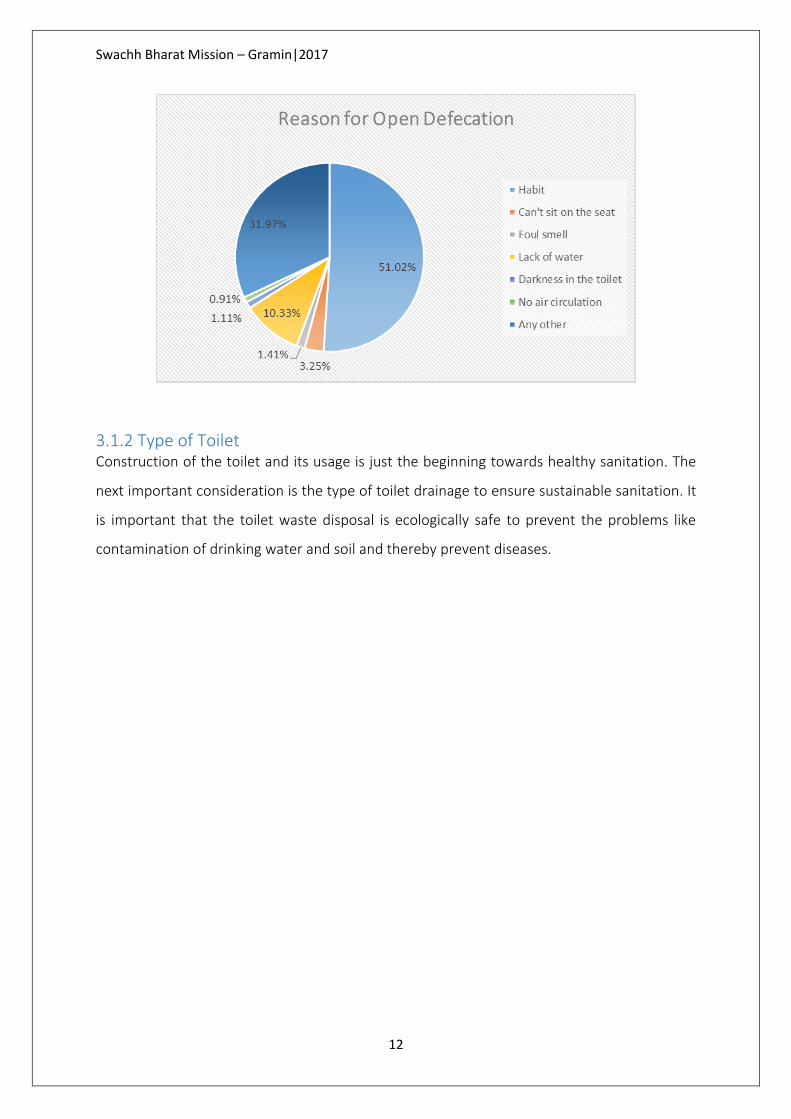
There are several reasons for the households having access to a toilet and yet they still
defecate in open. The most prevalent reason for open defecation despite having access to a
toilet is Habit of the households (51.02%). The second most prominent response for reason of
open defecation is Any Other (31.97%) which include reasons like Under-Construction toilets,
Broken toilet seat, Overflowing pits etc. The following charts details the prominent reasons, as
given by the households, for practising open defecation despite having access to toilet.
Swachh Bharat Mission – Gramin|2017
12
3.1.2 Type of Toilet Construction of the toilet and its usage is just the beginning towards healthy sanitation. The
next important consideration is the type of toilet drainage to ensure sustainable sanitation. It
is important that the toilet waste disposal is ecologically safe to prevent the problems like
contamination of drinking water and soil and thereby prevent diseases.

Swachh Bharat Mission – Gramin|2017
13
FIGURE 2: TYPE OF TOILET

Swachh Bharat Mission – Gramin|2017
14
The following table details the type of toilet for all the states. The toilet waste disposal arrangements include Single pit, Double pit, Septic
tank, Ecosan, Flushes to closed drain, Flushes to an open area, Flushes to an open drain and Unlined hole in the ground.
TABLE 2: STATE WISE TOILET WASTE DISPOSAL
State Double Pit Single Pit Septic Tank Flushes to a closed drain Ecosan
Flushes to an open area
Flushes to an open Drain
Unlined hole in the ground
A & N Islands 0.62% 19.44% 77.47% 0.00% 0.00% 0.93% 0.62% 0.93%
Andhra Pradesh 16.07% 35.54% 48.29% 0.00% 0.00% 0.02% 0.05% 0.02%
Arunachal Pradesh 5.51% 52.07% 14.60% 0.28% 0.00% 1.38% 4.13% 22.04%
Assam 27.72% 42.64% 8.05% 3.77% 0.00% 2.26% 1.52% 14.05%
Bihar 13.44% 32.56% 52.90% 0.05% 0.00% 0.47% 0.16% 0.42%
Chhattisgarh 53.67% 19.53% 26.74% 0.00% 0.00% 0.00% 0.00% 0.06%
D & N Haveli 65.46% 6.58% 27.63% 0.00% 0.00% 0.00% 0.33% 0.00%
Goa 14.97% 30.77% 48.86% 0.00% 0.00% 4.16% 1.25% 0.00%
Gujarat 41.29% 32.05% 26.13% 0.47% 0.00% 0.06% 0.00% 0.00%
Haryana 7.63% 55.69% 35.48% 0.00% 0.00% 0.08% 0.00% 1.12%
Himachal Pradesh 3.22% 59.80% 35.58% 0.00% 0.00% 0.10% 0.00% 1.31%
Jammu & Kashmir 11.28% 80.54% 0.00% 0.00% 0.00% 1.95% 0.19% 6.03%
JHARKHAND 73.75% 9.24% 14.89% 0.00% 0.00% 0.78% 0.28% 1.06%
Karnataka 0.61% 92.02% 6.77% 0.34% 0.00% 0.11% 0.13% 0.02%
Kerala 7.36% 43.03% 49.52% 0.03% 0.00% 0.06% 0.00% 0.00%
Madhya Pradesh 19.50% 53.17% 27.00% 0.03% 0.00% 0.02% 0.00% 0.28%
Maharashtra 25.25% 33.37% 41.05% 0.04% 0.00% 0.09% 0.05% 0.16%
Manipur 17.95% 26.92% 19.78% 0.18% 0.00% 5.68% 1.65% 27.84%
Meghalaya 7.39% 72.18% 14.98% 0.00% 0.00% 0.58% 0.19% 4.67%
Mizoram 0.72% 56.97% 9.62% 0.24% 0.00% 0.24% 0.00% 32.21%
Nagaland 0.18% 52.54% 5.60% 24.34% 0.00% 1.05% 2.10% 14.19%

Swachh Bharat Mission – Gramin|2017
15
Odisha 1.50% 77.04% 14.21% 5.07% 0.00% 0.56% 0.23% 1.39%
Puducherry 1.18% 73.23% 25.20% 0.00% 0.00% 0.39% 0.00% 0.00%
Punjab 11.90% 20.00% 62.83% 0.00% 0.00% 0.00% 0.12% 5.14%
RAJASTHAN 2.31% 53.71% 37.20% 0.10% 0.00% 0.05% 0.05% 6.57%
Sikkim 0.17% 0.33% 98.66% 0.00% 0.00% 0.00% 0.00% 0.83%
Tamil Nadu 21.36% 21.47% 56.72% 0.15% 0.00% 0.11% 0.00% 0.19%
Telangana 47.21% 42.00% 10.71% 0.00% 0.00% 0.04% 0.04% 0.00%
Tripura 20.65% 55.48% 7.96% 0.00% 0.00% 0.00% 0.00% 15.91%
UTTAR PRADESH 29.33% 32.75% 37.02% 0.00% 0.00% 0.37% 0.24% 0.28%
Uttarakhand 36.62% 30.90% 32.47% 0.00% 0.00% 0.00% 0.00% 0.00%
West Bengal 52.67% 33.42% 9.11% 0.01% 0.07% 0.23% 0.08% 4.41%

Swachh Bharat Mission – Gramin|2017
16
3.1.3 Toilet Pan The type of toilet pan is also a consideration to ensure sustainability and affordability of the
toilet. The rural pan has a steep slope and hence uses less amount of water to flush the
excreta. It is advisable to use rural toilet pan in the areas which face problems of water
scarcity. Urban pan on the other hand has less steep slope and hence consumes relatively
more water while flushing the excreta. In rural India, it is observed that 21% of all surveyed toilets
have rural pan while 73% of the surveyed toilets have urban pan.
FIGURE 3: TYPE OF TOILET PAN
The table below details the state wise distribution of type of pan installed in the toilets.
TABLE 3: STATE WISE TOILET PAN
State Rural (Steep
slope) Urban (Less steep slope)
Western toilet No pan
A & N Islands 34% 60% 3% 3%
Andhra Pradesh 5% 83% 12% 0%
Arunachal Pradesh 33% 46% 0% 21%
Assam 54% 23% 0% 23%
Bihar 17% 82% 0% 1%
Chhattisgarh 49% 50% 0% 1%
D & N Haveli 2% 90% 3% 5%
Goa 23% 40% 34% 3%
Gujarat 5% 90% 4% 1%
Haryana 5% 84% 10% 1%

Swachh Bharat Mission – Gramin|2017
17
Himachal Pradesh 6% 78% 15% 1%
Jammu & Kashmir 2% 91% 1% 6%
Jharkhand 74% 26% 0% 0%
Karnataka 7% 91% 2% 0%
Kerala 23% 60% 17% 0%
Madhya Pradesh 19% 80% 0% 1%
Maharashtra 14% 85% 1% 0%
Manipur 45% 51% 0% 4%
Meghalaya 59% 19% 0% 22%
Mizoram 35% 38% 0% 26%
Nagaland 49% 23% 0% 27%
Odisha 26% 72% 1% 2%
Puducherry 2% 88% 10% 0%
Punjab 4% 77% 15% 5%
Rajasthan 5% 88% 3% 4%
Sikkim 17% 78% 2% 3%
Tamil Nadu 10% 83% 6% 1%
Telangana 8% 89% 3% 0%
Tripura 29% 46% 1% 24%
Uttar Pradesh 28% 71% 1% 0%
Uttarakhand 12% 86% 2% 0%
West Bengal 48% 50% 1% 1%
3.1.4 Government Support It is very well known that Access and Usage of toilet is critical in ensuring sustainable
sanitation. But one of the major constraint in achieving this objective is the poor economic
condition of the rural households. Hence the support of the government for construction of
toilets plays a major role in making Swachh Bharat Mission (Gramin) a success. During the
survey, it was found that 52% of the households with access to toilet received some form of
support from the government which includes Money, Material or Labour.
The following table represents the state wise information on any form of support received by
the households from the government.
TABLE 4: STATE WISE INFORMATION ON SUPPORT
State Support No Support
A & N Islands 31% 69%
Andhra Pradesh 55% 45%
Arunachal Pradesh 45% 55%

Swachh Bharat Mission – Gramin|2017
18
Assam 39% 61%
Bihar 13% 87%
Chhattisgarh 79% 21%
D & N Haveli 84% 16%
Goa 27% 73%
Gujarat 52% 48%
Haryana 5% 95%
Himachal Pradesh 10% 90%
Jammu & Kashmir 30% 70%
Jharkhand 84% 16%
Karnataka 82% 18%
Kerala 39% 61%
Madhya Pradesh 82% 18%
Maharashtra 54% 46%
Manipur 28% 72%
Meghalaya 47% 53%
Mizoram 50% 50%
Nagaland 23% 77%
Odisha 78% 22%
Puducherry 19% 81%
Punjab 16% 84%
Rajasthan 46% 54%
Sikkim 25% 75%
Tamil Nadu 61% 39%
Telangana 59% 41%
Tripura 26% 74%
Uttar Pradesh 53% 47%
Uttarakhand 45% 55%
West Bengal 50% 50%
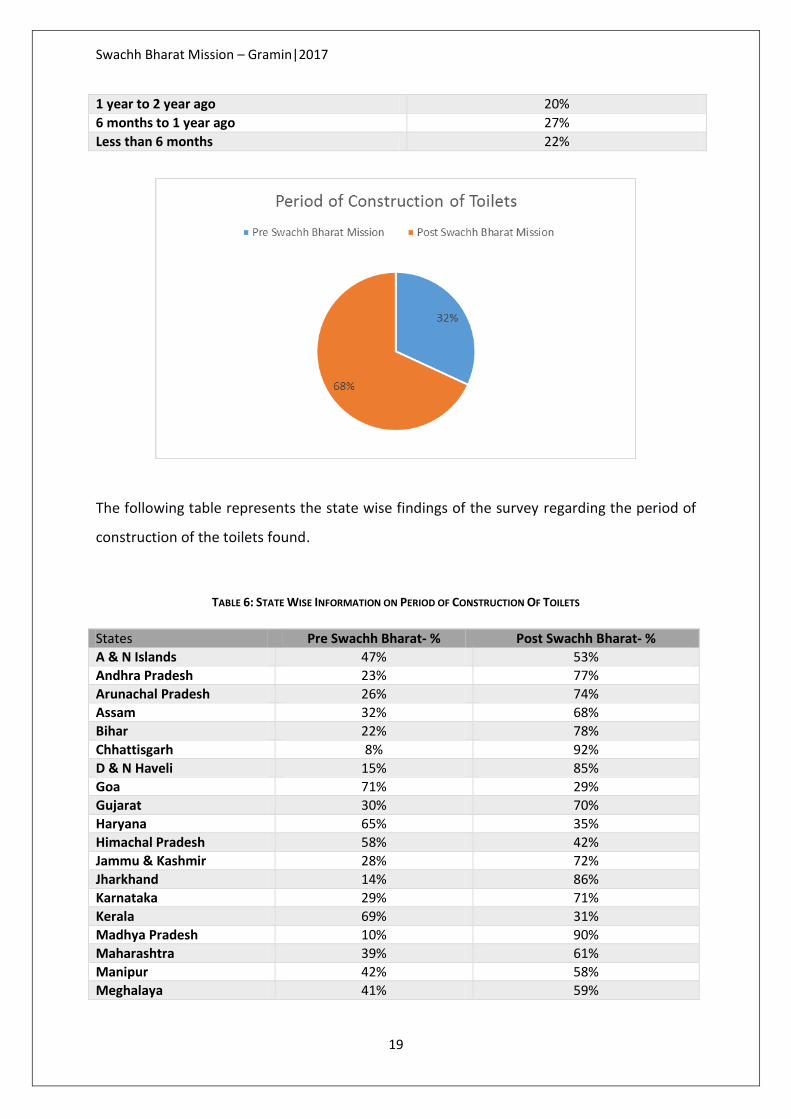
3.1.5 Period of Construction of Toilets One of the main components of Swachh Bharat Mission Gramin is construction of Individual
Household Latrines (IHHL). Swachh Bharat Mission is approaching completion of 3 years
since its launch in 2014. The survey also enquired about the period of construction of the
toilets found in the households. It was observed that 68% of the toilets found are
constructed in the past 3 years and 32% of the toilets are 3 or more than 3 years old.
The findings of the survey regarding period of construction of the toilets are detailed in the
table below:
TABLE 5: INFORMATION ON PERIOD OF CONSTRUCTION OF TOILETS
Period of Construction Percentage
More than 3 year ago 37%
2 year to 3 year ago 12%
Swachh Bharat Mission – Gramin|2017
19
1 year to 2 year ago 20%
6 months to 1 year ago 27%
Less than 6 months 22%
The following table represents the state wise findings of the survey regarding the period of
construction of the toilets found.
TABLE 6: STATE WISE INFORMATION ON PERIOD OF CONSTRUCTION OF TOILETS
States Pre Swachh Bharat- % Post Swachh Bharat- %
A & N Islands 47% 53%
Andhra Pradesh 23% 77%
Arunachal Pradesh 26% 74%
Assam 32% 68%
Bihar 22% 78%
Chhattisgarh 8% 92%
D & N Haveli 15% 85%
Goa 71% 29%
Gujarat 30% 70%
Haryana 65% 35%
Himachal Pradesh 58% 42%
Jammu & Kashmir 28% 72%
Jharkhand 14% 86%
Karnataka 29% 71%
Kerala 69% 31%
Madhya Pradesh 10% 90%
Maharashtra 39% 61%
Manipur 42% 58%
Meghalaya 41% 59%

Swachh Bharat Mission – Gramin|2017
20
Mizoram 48% 52%
Nagaland 72% 28%
Odisha 8% 92%
Puducherry 61% 39%
Punjab 72% 28%
Rajasthan 16% 84%
Sikkim 74% 26%
Tamil Nadu 25% 75%
Telangana 25% 75%
Tripura 42% 58%
Uttar Pradesh 40% 60%
Uttarakhand 41% 59%
West Bengal 33% 67%
3.1.6 Presence of Litter and Stagnant Waste Water The Solid and Liquid Waste Management is another very important component of Swachh
Bharat Mission-Gramin. The presence of Litter and Stagnant waste water around the
household premises is an indicator towards a deficient solid and liquid waste management
practices. During the study, it was observed that 89% of the households had no litter around
their premises and 93% of the households had no stagnant waste water around their
premises.
The table below represents the state wise findings of the study regarding the presence of
litter and stagnant waste water around the household premises.
States No Litter No Stagnant Waste Water
A & N Islands 86% 94%
Andhra Pradesh 85% 93%
Arunachal Pradesh 87% 85%
Assam 91% 93%
Bihar 79% 79%
Chhattisgarh 96% 97%
D & N Haveli 80% 99%
Goa 90% 98%
Gujarat 91% 96%
Haryana 97% 92%
Himachal Pradesh 90% 98%
Jammu & Kashmir 90% 96%
Jharkhand 89% 98%
Karnataka 92% 93%
Kerala 89% 98%
Madhya Pradesh 92% 95%
Maharashtra 90% 94%
Manipur 74% 79%
Meghalaya 84% 93%

Swachh Bharat Mission – Gramin|2017
21
Mizoram 76% 94%
Nagaland 97% 99%
Odisha 78% 86%
Puducherry 82% 95%
Punjab 93% 81%
Rajasthan 98% 99%
Sikkim 90% 98%
Tamil Nadu 84% 97%
Telangana 94% 96%
Tripura 75% 96%
Uttar Pradesh 91% 93%
Uttarakhand 98% 99%
West Bengal 89% 96%
3.2 Direct Observation Direct observation component of the survey involves assessing the sanitation coverage in the
following places:
School
Anganwadi
Public Health Centre
3.2.1 School
Sanitation and hygiene in schools is of paramount importance as they create an enabling
environment for imparting quality education. It secures children’s dignity, safety, health and
attendance in classes.
During the survey, 4370 schools were visited and it was found 4012 that is 92% of schools
had access to toilet. Also 81% of the Schools had litter free surrounding.

Swachh Bharat Mission – Gramin|2017
22
FIGURE 4: ACCESS TO TOILET -SCHOOL
The following table represents the number of schools visited in each state during the survey
and percentage of those schools with access to toilet. The table also represents the
percentage of Schools with litter free surrounding.
TABLE 7: STATE WISE NUMBER OF SCHOOLS VISITED AND ACCESS TO TOILET
State Number of Schools visited during the
survey
Percentage of schools with access to toilet
Percentage of Schools with Litter free surroundings
A & N Islands 20 95% 100%
Andhra Pradesh 241 75% 66%
Arunachal Pradesh 19 68% 71%
Assam 140 71% 88%
Bihar 426 87% 65%
Chhattisgarh 113 96% 94%
D & N Haveli 20 85% 85%
Goa 16 81% 81%
Gujarat 181 97% 84%
Haryana 79 96% 92%
Himachal Pradesh 25 96% 72%
Jammu & Kashmir 37 86% 76%
Jharkhand 113 94% 85%
Karnataka 203 90% 87%
Kerala 104 93% 86%
Madhya Pradesh 292 82% 87%
Maharashtra 352 91% 73%
Manipur 13 85% 54%
Meghalaya 17 94% 71%
Mizoram 20 75% 55%
Nagaland 20 95% 100%

Swachh Bharat Mission – Gramin|2017
23
Odisha 197 82% 80%
Puducherry 14 100% 64%
Punjab 85 98% 88%
Rajasthan 251 97% 94%
Sikkim 19 95% 94%
Tamil Nadu 247 89% 71%
Telangana 140 92% 89%
Tripura 20 95% 70%
Uttar Pradesh 601 97% 80%
Uttarakhand 35 86% 84%
West Bengal 324 99% 83%
3.2.2 Anganwadi
During the survey, 4286 Anganwadis were visited and it was found 2765 i.e. 65% of
Anganwadis had access to toilet. Also 86% of the Anganwadis had litter free surrounding.
FIGURE 5: ACCESS TO TOILET-ANGANWADI
The following table represents the Number of Anganwadis visited during the survey, in each
state and Percentage of those Anganwadis with access to toilet. The table also represents
the percentage of Anganwadis with litter free surrounding.
TABLE 8: STATE WISE NUMBER OF ANGANWADIS VISITED AND ACCESS TO TOILET
State Number of Anganwadis visited during the
survey
Percentage of Anganwadis with
access to toilet
Percentage of Anganwadis with
Litter free surroundings
A & N Islands 20 50% 80%
Andhra Pradesh 226 54% 71%

Swachh Bharat Mission – Gramin|2017
24
Arunachal Pradesh 18 33% 72%
Assam 136 60% 93%
Bihar 416 33% 75%
Chhattisgarh 116 87% 96%
D & N Haveli 20 55% 95%
Goa 17 59% 76%
Gujarat 176 83% 86%
Haryana 81 95% 100%
Himachal Pradesh 34 71% 82%
Jammu & Kashmir 41 34% 88%
Jharkhand 94 51% 82%
Karnataka 205 69% 85%
Kerala 111 100% 87%
Madhya Pradesh 286 61% 90%
Maharashtra 350 79% 97%
Manipur 17 41% 82%
Meghalaya 19 79% 79%
Mizoram 19 58% 74%
Nagaland 20 40% 100%
Odisha 194 43% 93%
Puducherry 18 56% 61%
Punjab 89 58% 82%
Rajasthan 234 68% 96%
Sikkim 20 70% 95%
Tamil Nadu 252 77% 67%
Telangana 139 50% 84%
Tripura 20 75% 75%
Uttar Pradesh 532 73% 97%
Uttarakhand 35 60% 87%
West Bengal 334 69% 93%
3.2.3 Public Health Centre
During the survey, 1670 Public Health Centres were visited and it was found 1273 i.e. 76% of
Public Health Centres had access to toilet. Also 83% of the Public Health Centres had litter
free surrounding.

Swachh Bharat Mission – Gramin|2017
25
FIGURE 6: ACCESS TO TOILET-PUBLIC HEALTH CENTRE
The following table represents the Number of Public Health Centres visited during the survey,
in each state and percentage of those Public Health Centres with access to toilet. The table
also represents the percentage of Public Health Centres with litter free surrounding.
TABLE 9: STATE WISE NUMBER OF PUBLIC HEALTH CENTRES VISITED AND ACCESS TO TOILET
State Number of Public Health Centres visited
during the survey
Percentage of Public Health Centre with
access to toilet
Percentage of Public Health
Centres with Litter free surroundings
A & N Islands 12 83% 92%
Andhra Pradesh 51 57% 78%
Arunachal Pradesh 3 33% 33%
Assam 29 76% 93%
Bihar 68 38% 72%
Chhattisgarh 29 83% 90%
D & N Haveli 17 76% 94%
Goa 15 67% 87%
Gujarat 49 84% 69%
Haryana 81 95% 96%
Himachal Pradesh 6 83% 100%
Jammu & Kashmir 18 39% 89%
Jharkhand 18 72% 89%
Karnataka 45 93% 87%
Kerala 103 95% 84%
Madhya Pradesh 59 71% 81%
Maharashtra 342 79% 71%
Manipur 2 0% 50%

Swachh Bharat Mission – Gramin|2017
26
Meghalaya 2 100% 100%
Mizoram 9 67% 89%
Nagaland 11 45% 100%
Odisha 34 65% 74%
Puducherry 4 75% 75%
Punjab 28 75% 89%
Rajasthan 101 80% 94%
Sikkim 8 100% 100%
Tamil Nadu 223 83% 65%
Telangana 40 35% 73%
Tripura 18 100% 78%
Uttar Pradesh 132 67% 90%
Uttarakhand 29 55% 75%
West Bengal 84 89% 86%
3.3 Namami Gange A survey was conducted in 200 purposively selected Namami Gange villages which included
74 villages in Bihar and 126 villages in Uttar Pradesh.
The survey at village level has following major elements:
Household Survey
Direct Observation: School and Anganwadi
Village Head Interview
3.3.1 Household Survey 3.3.1.1 Access and Usage
From the 200 Namami Gange villages surveyed, it was observed that overall access to toilet is
92% and usage of toilet is 93%.
The following table represents the state wise findings of the Namami Gange villages
regarding Access to toilet and their Usage.
TABLE 10: NAMAMI GANGE-ACCESS TO TOILET AND USAGE OF TOILET
State Access to toilet Usage of toilet
Bihar 86% 96%
Uttar Pradesh 96% 92%

Swachh Bharat Mission – Gramin|2017
27
FIGURE 7: ACCESS TO TOILET- NAMAMI GANGE
3.3.1.2 Type of Toilet Waste Disposal
The table below details the percentage of type of toilet in the 200 Namami Gange villages.
The table represents the state wise findings regarding the type of toilet installed.
TABLE 11: TYPE OF TOILET WASTE DISPOSAL
Toilet Waste Disposal Overall Bihar Uttar Pradesh
Single pit 42% 24% 51%
Double pit 31% 19% 38%
Septic tank 27% 57% 11%
Ecosan 0% 0% 0%
Flushes to a closed drain 0% 0% 0%
Flushes to an open area 0% 0% 0%
Flushes to open drain 0% 0% 0%
Unlined hole in the ground 0% 0% 0%
3.3.1.3 Toilet Pan
In the 200 Namami Gange villages, it was observed that 74.9% of all surveyed toilets have
urban pan while 24.4% of the surveyed toilets have rural pan. The table also details the state

Swachh Bharat Mission – Gramin|2017
28
wise findings of the survey regarding the type of pan installed in the toilets in Namami Gnage
villages.
TABLE 12: TYPE OF TOILET PAN
Type of Toilet Pan Overall Bihar Utt ar Pradesh
Urban (less steep slope) 74.90% 83% 71%
Rural (steep slope) 24.40% 16% 29%
Western toilet 0.40% 1% 0%
No pan 0.30% 0% 0%
3.3.1.4 Government Support
Government support for construction of toilets can be in the form of Money, Material or
Labour. The following table represents the overall and state wise information on any form of
support received by the households from the government.
TABLE 13: INFORMATION ON SUPPORT
Type of support Overall Bihar Uttar Pradesh
Support 74% 33% 96%
No support 26% 67% 4%
3.3.1.5 Period of construction
The findings of the survey regarding period of construction of the toilets in the 200 Namami
Gange villages are detailed in the table below:
TABLE 14: INFORMATION ON PERIOD OF CONSTRUCTION OF TOILETS
Period of Construction Overall Bihar Uttar Pradesh
Less than 6 months 39% 36% 41%
One year ago 45% 37% 50%
Two years ago 8% 15% 5%
Three or more years ago 8% 12% 4%
3.3.2 Direct Observation 3.3.2.1 School

Swachh Bharat Mission – Gramin|2017
29
It is observed that 76% schools have functional toilets out of which 84% have separate toilets
for boys and girls.
3.3.2.2 Anganwadi
Out of the total 200 Namami Gange villages surveyed, only 46% Anganwadis have functional
toilets.
3.3.3 Village Head Interview Village head interview was conducted in all the 200 villages surveyed under Namami Gange.
Below are the findings for overall 200 villages and also the state wise findings of total 74
villages surveyed in Bihar and 126 villages surveyed in Uttar Pradesh.
3.3.3.1 Collection of solid waste
The table below represents percentage of villages in which solid waste is collected in certain
proportion of households. In 11% of the 200 Namami Gange villages surveyed, solid waste
was collected from 100% of the households. The figure is 11% for villages in Bihar and 10%
for villages in Uttar Pradesh. Similarly, in 38% of the total villages solid waste is collected from
none of the households.
TABLE 15: COLLECTION OF SOLID WASTE FROM HOUSEHOLDS
Percentage of households Overall Bihar Uttar Pradesh 100% households 11% 11% 10%
80% to 100% household 20% 15% 22%
50% to 80% household 20% 27% 16%
Less than 50% household 12% 12% 12%
None 38% 35% 40%
3.3.3.2 Status of solid waste management
The table below represents the satisfaction level of the status of solid waste management in
the village. 30% of the village heads were satisfied with the management of solid waste in
their village. 33% of the villages surveyed in Bihar of Namami Gange were satisfied with the
solid waste management while 28% were satisfied in Uttar Pradesh.

Swachh Bharat Mission – Gramin|2017
30
TABLE 16: STATUS ON SOLID WASTE MANAGEMENT
Status of Solid Waste Management Overall Bihar Uttar Pradesh
Satisfactory 30% 33% 28%
Moderately Satisfactory 59% 56% 61%
Unsatisfactory 11% 10% 12%
3.3.3.3 Treatment of solid waste
The table below depicts the treatment of solid waste in the villages. 40% of the solid waste in
these 200 villages is dumped in open areas whereas only 7% of the villages have a waste
treatment plant inside the village itself.
TABLE 17: TREATMENT OF SOLID WASTE
Treatment of solid waste Overall Bihar Uttar Pradesh
Dumped in closed pits 12% 13% 11%
Dumped in Open areas 41% 28% 49%
Collected and Burnt in open 16% 21% 13%
Given to animals 20% 30% 13%
Waste Treatment Plant inside the village 7% 6% 7%
Transferred to landfills 4% 1% 7%
3.3.3.4 Status of liquid waste management
The table below represents the satisfaction level of the status of liquid waste management in
the village. Out of the 200 Namani Gange villages surveyed 25% of the village heads were
satisfied with the management of liquid waste in their village, 63% were moderately satisfied
while 12% were not satisfied.
TABLE 18: STATUS OF LIQUID WASTE MANAGEMENT
Status of Liquid Waste disposal Overall Bihar Uttar Pradesh
Satisfactory 25% 30% 22%
Moderately Satisfactory 63% 51% 70%
Unsatisfactory 12% 19% 8%

Swachh Bharat Mission – Gramin|2017
31
3.3.3.5 Type of drains
The table below represents the type of drains present for the disposal of waste water in the
village. 8% of the total villages had closed drains for waste water disposal whereas in 20% of
the villages drains were not present and waste water was being disposed in open areas.
TABLE 19: DATA ON TYPE OF DRAINS
Type of drains Overall Bihar Uttar Pradesh
Closed drains 8% 7% 9%
Some closed some open drains 20% 9% 25%
Open drains 52% 43% 59%
No drains. Disposed in Open areas 20% 41% 7%
3.3.3.6 Connection of drains to river or its tributary
The table below represents the percentage of villages where the drains flow into river or its
tributary. Out of the villages in which drains were present whether open or closed, in 12% of
the villages these drains were connected to either to the river or its tributary.
TABLE 20: CONNECTION OF DRAINS TO RIVER OR ITS TRIBUTARY
Connection of drains to river or its tributary Overall Bihar Uttar Pradesh
No 88% 84% 89%
Yes 12% 16% 11%
3.3.3.7 Treatment of waste water
The table below depicts treatment of waste before it flows from the drain to the river or its
tributary. Out of the villages where waste water from the drains flows into the river or its
tributary in 85% of the villages, it is transferred into the river/tributary untreated.
TABLE 21: TREATMENT OF WASTE WATER
Treatment of waste water Overall Bihar Uttar Pradesh
Transferred to the river untreated 85% 100% 77%
Transferred to the river after treatment 15% 0% 23%

Swachh Bharat Mission – Gramin|2017
32
3.3.3.8 Disposal of waste water
The table below depicts disposal of waste water. In 83% of the total villages the waste water
is disposed in open areas whereas in only 9% of the villages it is treated in a sewage
treatment plant either present in their own village or transferred to the nearest sewage
treatment facility.
TABLE 22: DISPOSAL OF WASTE WATER
Disposal of waste water Overall Bihar Uttar Pradesh
Dumped in Open areas 83% 78% 86%
Drains into river or its tributary 8% 14% 5%
Sewage treatment plant at village level 6% 3% 8%
Transferred to the nearest sewage facility 3% 5% 2%
3.3.3.9 Disposal of toilet water or excreta in Ganga or its tributary
The table below depicts that in 85% of the surveyed villages toilet water or excreta doesn’t
go into the Ganga or its tributary.
TABLE 23: DISPOSAL OF TOILET WATER OR EXCRETA IN GANGA OR ITS TRIBUTARY
Toilet water or excreta directly go to the nearest river (Ganga or its tributary)
Overall Bihar Uttar Pradesh
No 85% 80% 88%
Yes 15% 20% 12%
Swachh Bharat Mission – Gramin|2017
33
4. Conclusion The launch of Swachh Bharat Mission on 2nd October, 2014 has set an ambitious target of
making India Clean and Open Defecation Free. The Swachh Bharat Mission (Gramin) has a
special focus on construction of toilets and behaviour change to achieve the goal of making
rural India Open Defecation Free (ODF). As the mission completes three years in October
2017, it is essential to evaluate the progress it has made so far and hence adjust the mission’s
trajectory for better outcomes.
The household survey conducted by QCI provides a reality check for the states and India as a
whole with respect to progress made on Swachh Bharat Mission front. There has been a
tremendous increase in percentage of households having Access to toilets. The high usage
percentage of toilet indicates a paradigm shift in attitude of rural households towards open
defecation. Despite the good progress so far, there is a long road ahead to achieve the goals
of Swachh Bharat Mission. Still, more than one third of the rural households are yet to have
access to safe and sanitary toilet. Given the population of India, it is a humungous task.
It is hoped that this assessment instils a sense of accomplishment in states as well as other
stakeholders and motivates them to accelerate their efforts for timely fruition of Swachh
Bharat Mission Gramin.
*******************************************