Embed Size (px)
Citation preview
2012 HOUSEHOLD FINANCIAL
PLANNING SURVEY
A Summary of Key Findings
July 23, 2012
Prepared for:
Certified Financial Planner Board of Standards, Inc. and the Consumer Federation of America
Prepared by:
Princeton Survey Research Associates International
2
Contents
EXECUTIVE SUMMARY .................................................................................................................................. 3
Key Findings .............................................................................................................................................. 3
A Much Tougher Economic Landscape for American Families ............................................................. 3
Most People Find Managing Finances Daunting................................................................................... 4
Fewer Having Savings for Emergencies and Child’s College ................................................................. 5
Majority Have a Plan for Spending Goal, but Few have a Financial Plan ............................................. 5
Planners More Confident About Handling their Finances, Feel Better about their Progress............... 6
Planning Benefits All Income Levels, not just the Wealthy .................................................................. 7
About the Survey ...................................................................................................................................... 7
SECTION 1: CURRENT ECONOMIC LANDSCAPE ............................................................................................ 8
SECTION 2: SAVING AND PLANNING TO MEET FINANCIAL GOALS ............................................................... 9
Saving and Planning for Emergencies ..................................................................................................... 13
Saving and Planning for Retirement ....................................................................................................... 14
Pre‐retirement .................................................................................................................................... 14
During Retirement .............................................................................................................................. 16
Saving to Send a Child to College ............................................................................................................ 16
Saving and Planning for Other Financial Goals ....................................................................................... 16
SECTION 3: CREDIT CARD DEBT................................................................................................................... 18
SECTION 4: THE IMPORTANCE OF FINANCIAL PLANNING .......................................................................... 20
Emergency and Retirement Planning ..................................................................................................... 20
Comprehensive Financial Planning ......................................................................................................... 22
APPENDIX .................................................................................................................................................... 26
SAVERS ANALYSIS ................................................................................................................................ 26
METHODOLOGY ...................................................................................................................................... 30
Design and Data Collection Procedures .............................................................................................. 30
Weighting and Analysis ....................................................................................................................... 32
TOPLINE................................................................................................................................................... 38
3
EXECUTIVE SUMMARY
Key Findings
Still feeling the effects of the Great Recession, many American families today struggle just to make ends
meet. The CFP Board/Consumer Federation of America Household Financial Planning survey finds
people today facing tougher choices about how to allocate more limited financial resources. Saving
enough money for future goals like retirement and kids’ college – while also maintaining an adequate
emergency fund and staying out of serious debt – has always been a challenge. This was true even in
the more favorable economic climate of 1997, when Princeton Survey Research Associates International
first surveyed household decision‐makers about these topics. In 2012, with high unemployment,
stagnant incomes and reduced net worth, those challenges are even greater.
While the economic climate has changed, financial planning remains a critical factor in separating those
who are on track to meet their financial goals from those who are falling behind. The new survey finds
people who plan feel more confident about their financial decision‐making, manage to save more
money, and feel better about their progress to date in saving for financial goals. Planners score higher
in financial preparedness than non‐planners across income groups. The benefits are not limited to those
who are better off.
Too few American families are taking advantage of this valuable tool to help protect their families from
the vagaries of an uncertain economic environment. The percentage of American families who have
made a comprehensive financial plan – either on their own or with professional help – has not changed
significantly from 15 years ago. Overall, only about a third (31%) of decision‐makers today report having
ever put together such a plan. And just 35 percent of decision‐makers report having a plan in place to
save for emergencies, down from 39 percent in 1997.
A Much Tougher Economic Landscape for American Families Recent reports from the Federal Reserve show the devastating effects of financial crisis on the middle
class. The median family, richer than half of all American families and poorer than the other half, had a
net worth of $77,300 in 2010 compared with $126,400 in 2007 according to the Fed. This means the
average family has no more wealth today than it did in the early 1990s, wiping out nearly two decades
of economic gains.1 Our new survey documents the economic pain people are feeling. In 2012,
households where people live from paycheck to paycheck outnumber those where people feel
1 “Family Net Worth Drops to Level of Early 90’s, Fed Says,” by Binyamin Applebaum, The New York Times, June 11, 2012.
4
financially comfortable (38% vs. 30%). Fifteen years ago, when economic conditions were much more
positive, these numbers were reversed – fewer people described themselves as financially struggling
than said they were living the good life (31% vs. 38%). For most Americans, their home has been their
biggest financial asset, but the crash of housing prices has been the single biggest factor that has
reduced people’s wealth. Today, one‐quarter (23%) of those with a mortgage say it is underwater, i.e.,
the money required to pay it off is greater than what the property could sell for on the open market.
Looking ahead, 20 percent of non‐retired home owners think they will still be making mortgage
payments when they retire, up from 14 percent in 1997.
Speaking of retirement, people’s expectations for how early they will be able to retire have been scaled
back considerably. Fifteen years ago, half (50%) of non‐retirees told us that they expected to retire
before they turned 65. Now, only a third (34%) believes they will be able to retire this early. More than
a quarter (27%) think they will not be able to retire before age 70, if ever. This compares with 15 percent
in 1997. In fact, 13 percent of those not yet retired today volunteer that they won’t ever be able to stop
working, compared with 4 percent who were this pessimistic about their retirement prospects 15 years
ago.
Most People Find Managing Finances Daunting As the economic environment has changed for the worse, people’s comfort level with financial matters
has not improved. Advances in technology have made accessing and analyzing financial information
much easier, but lack of understanding about savings and investments options and how to best manage
household finances remains a serious obstacle to Americans’ financial preparedness.
• 55% say “it’s hard for me to know who to trust for financial advice.”
• 52% say “to me investing seems complicated.”
• 55% say “I’m worried about losing my money if I invest it,” a significant increase from 1997
(45%) reflecting growing uncertainty in response to the stock market turbulence of recent years.
In addition to these barriers to sound money management, half of household decision‐makers believe
they “just don’t earn enough money to save regularly.” Majorities of those in the under $25,000 (61%)
and $25,000‐$49,999 (64%) income brackets feel discouraged from saving for this reason. Even in the
$50,000‐$99,999 category, half (50%) feel their income level is a barrier to saving regularly. And one‐
quarter (26%) in the $100,000 or more category are inclined to believe that their income is insufficient
to allow them to save on a regular basis.
5
Fewer Having Savings for Emergencies and Child’s College Feeling more financial pressure today than in 1997, American families today are less likely to be saving
for their financial goals and taking steps to keep their family financially prepared. Like its predecessor,
the new survey asked decision‐makers about their saving and investments in six specific categories.
Fewer people today report having saved toward one or more of their goals than did so fifteen years ago
(80% vs. 84%). With less money to go around, fewer Americans have started saving in some important
areas:
• Fewer people report saving for emergencies, leaving their family more vulnerable to the
upheaval caused by a job loss or major unexpected expenses (63% vs. 68%).
• Fewer of those in families with a college‐bound child have started to save for college education
(48% vs. 56%), even though costs of a college education are rising at a rapid pace.
People today may be more inclined to put their economic security at risk to “keep up with the Joneses.”
The only area where families are more prone to save is toward a major purchase, like a new car,
vacation, or home improvement project.
The proportion of Americans not yet retired who have at least some savings for retirement has held
steady. However, after the hit many families took after the financial meltdown four years ago, more
non‐retirees feel they are behind where they should be in saving for their retirement (51% vs. 38% in
1997).
Majority Have a Plan for Spending Goal, but few have a Financial Plan Most American families do some kind of financial planning to help accomplish their savings goals, but
relatively few have ever put together the kind of detailed financial plan that money management
experts recommend. When asked if they were implementing a plan to meet savings goals in six specific
areas, about two‐thirds (65%) of decision‐makers say they follow a plan for at least one of their savings
goals. This compares with only 31 percent who say they have ever prepared a comprehensive financial
plan – or used a professional to prepare one – that includes things like savings and investments,
retirement planning, and insurance needs.
Planning is most often reported for saving for one’s retirement. As many as half (49%) of non‐retirees
say they have begun saving for retirement and follow a plan or schedule for how often, how much, and
where they are saving or investing for this purpose. Since the 1990s, trends in workplace retirement
benefits have shifted away from pensions and other vehicles where the employer makes all decisions
toward 401‐k and similar retirement plans where employees make direct contributions and decisions
themselves. The survey found a significant increase in how many of those enrolled in 401‐k or similar
6
plans make annual contributions (77% vs. 66%). Despite this positive trend, the number of non‐retirees
who say they have a plan in place to invest for retirement is essentially unchanged (49% vs. 51% in
1997).
As might be expected, those with higher incomes are more likely to plan. Over half (55%) of those with
household incomes of $100,000 or more have a comprehensive plan, compared with roughly a third
(35%) of in the $50,000‐$99,999 bracket, and a quarter (25%) of those in the $25,000‐$49,999 bracket.
Such plans are a rarity among those with incomes lower than $25,000 (10%).
Planners More Confident About Handling their Finances, Feel Better about their Progress Families with greater financial resources are much more likely to be saving for their current and future
financial goals. The new survey shows that as family income level rises, so does the percentage of
decision‐makers who say they have at least some savings for their various goals. For example, among
those with incomes under $25,000 only about three in 10 (31%) have anything saved for emergencies,
compared with nine in 10 of those with incomes of $100,000 or more. Similar relationships between
income levels and savings rates were observed in 1997. But while income level matters, financial
planning is another key factor distinguishing those who are better prepared financially from those who
are less well prepared. Those with a comprehensive financial plan show themselves to have the
following advantages over non‐planners.
By a margin of 52 percent to 30 percent, planners are more likely to feel “very confident” about
managing money, savings and investments. In all four income categories used for analysis, planners are
found to be significantly more confident than those without a comprehensive financial plan. Planners
are also more likely to feel they are on pace in meeting all their specific financial goals, such as saving for
retirement, emergencies, and college (50% vs. 32%). In all except the lowest income categories – where
few have a comprehensive plan – planners are significantly more likely to feel good about their progress
toward meeting key goals.
Planners are also more likely than non‐planners to describe themselves as “living comfortably” (48% vs.
22%). The benefits here are most evident in the two highest income categories. Those with a
household income of $100,000 or more and a comprehensive plan are most likely to feel they are living
the good life. But it is noteworthy that as many planners in the $50,000‐$99,999 income bracket say
they live comfortably as those earning $100,000 or more but do not have a comprehensive financial plan
(50% vs. 46%).
7
Planning Benefits all Income Levels, not just the Wealthy The benefits of a comprehensive financial plan are further demonstrated by the smart saving and money
management practices associated with it. For those at higher income levels, planners put more of their
income into savings than non‐planners and report having built greater wealth. For example, planners
with incomes of $50,000‐$99,999 are more likely than non‐planners to say they save 10 percent of their
income or more (57% vs. 39%) and to have accumulated at least $100,000 in investments so far (37% vs.
19%). Similar differences are found between planners and non‐planners in the $100,000 or more
income bracket.
Financial planning is often seen as a tool for the more affluent, but the survey provides strong evidence
that those with modest incomes also benefit. Families with fewer financial resources are most vulnerable
to credit card debt spiraling out of control. Having a financial plan is associated with handling credit card
bills in a way that minimizes risk of credit card debt problems. Among those in the $25,000‐
$49,999 income category, 46 percent of those with a plan say they usually pay their credit card bill in full
each month, compared with 26 percent of non‐planners. The margin is 41 percent to 16 percent
between planners and non‐planners in the under $25,000 category.
About the Survey These are among the findings of a survey jointly sponsored by Certified Financial Planner Board of
Standards, Inc. and the Consumer Federation of America. The survey included telephone interviews with
a representative sample of 1,508 financial decision makers nationwide. The survey, conducted by
Princeton Survey Research Associates International, asked questions about the household’s financial
goals and liabilities, the household’s strategy for saving and investing, as well as specifics of how much
was being saved and invested. Six financial goals were investigated in depth: saving for emergencies, for
retirement, for a major purchase, for a child’s college education, for a down payment on a house, and to
help a parent or older relative with living or medical expenses. Interviews were conducted from May 7‐
20, 2012.
The margin of sampling error for results based on total sample at the 95 percent level of confidence is
plus or minus three percentage points. Question wording and the practical difficulties in conducting
surveys can also introduce error in survey estimates. A description of the survey methodology and a
questionnaire annotated with the survey results are included in the appendix that follows the detailed
findings.
8
SECTION 1: CURRENT ECONOMIC LANDSCAPE
The economic landscape has changed significantly in the 15 years since this survey was last conducted.
The CFP Board/Consumer Federation of America Household Financial Planning survey finds that decision
makers today are having a tougher time in today’s economy. The current survey measured many of the
same attitudes and behaviors as the initial survey did in 1997. For many their personal economic
conditions are not as positive as in 1997. Today, just 30 percent of financial decision makers2 say they live
comfortably, compared with 38 percent who reported doing so in 1997. Conversely, more decision
makers report that they have just enough to meet their basic living expenses or they don’t have enough
to meet these expenses (38%), compared with just 31 percent who reported similar conditions in 1997.
For many Americans, the idea of a home as a financial investment has faded. While the overall rate of
home ownership has remained the same, fewer decision makers who do not own a home report that
they plan to buy one (61% in 2012 v. 69% in 1997). Among those who already own a home fewer say
they are likely to have it paid off by the time they retire. In 1997, 82 percent reported they would have
their home paid for by the time they retire, compared to 76 percent in the current survey. For about
one‐quarter of decision makers, their investment in a home has lost money. Twenty‐three percent of
those with mortgages say that they owe more on their mortgage then they could sell the house for.
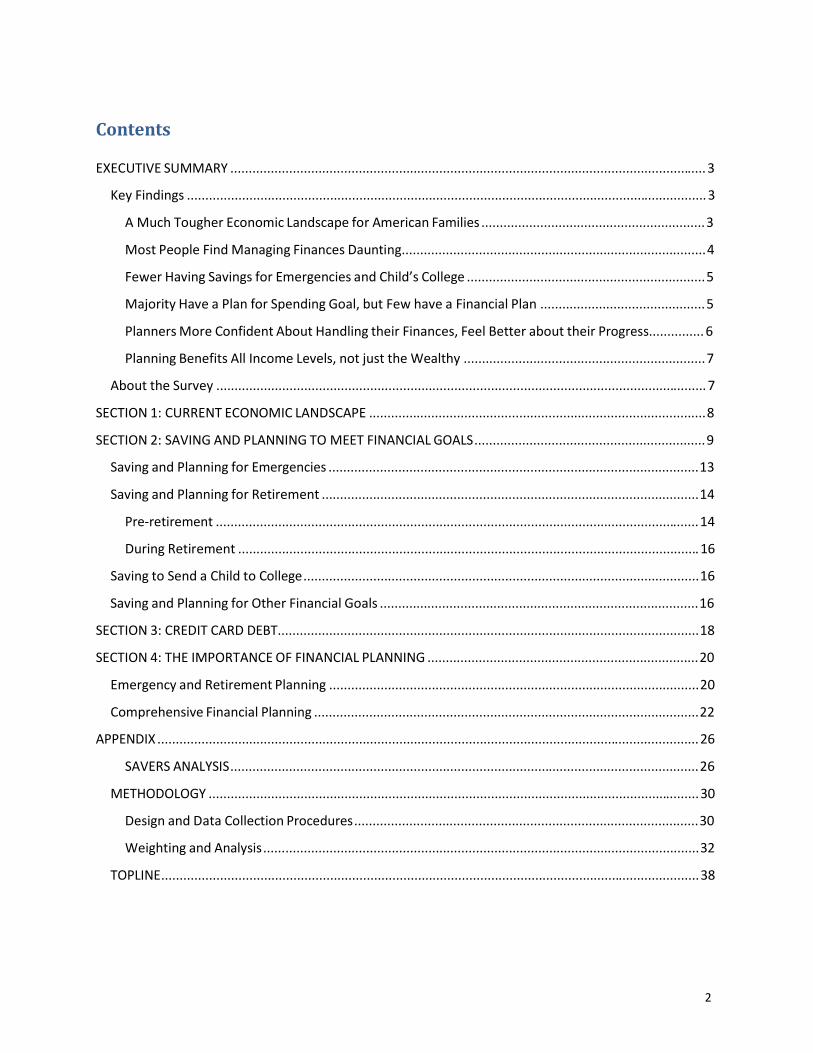
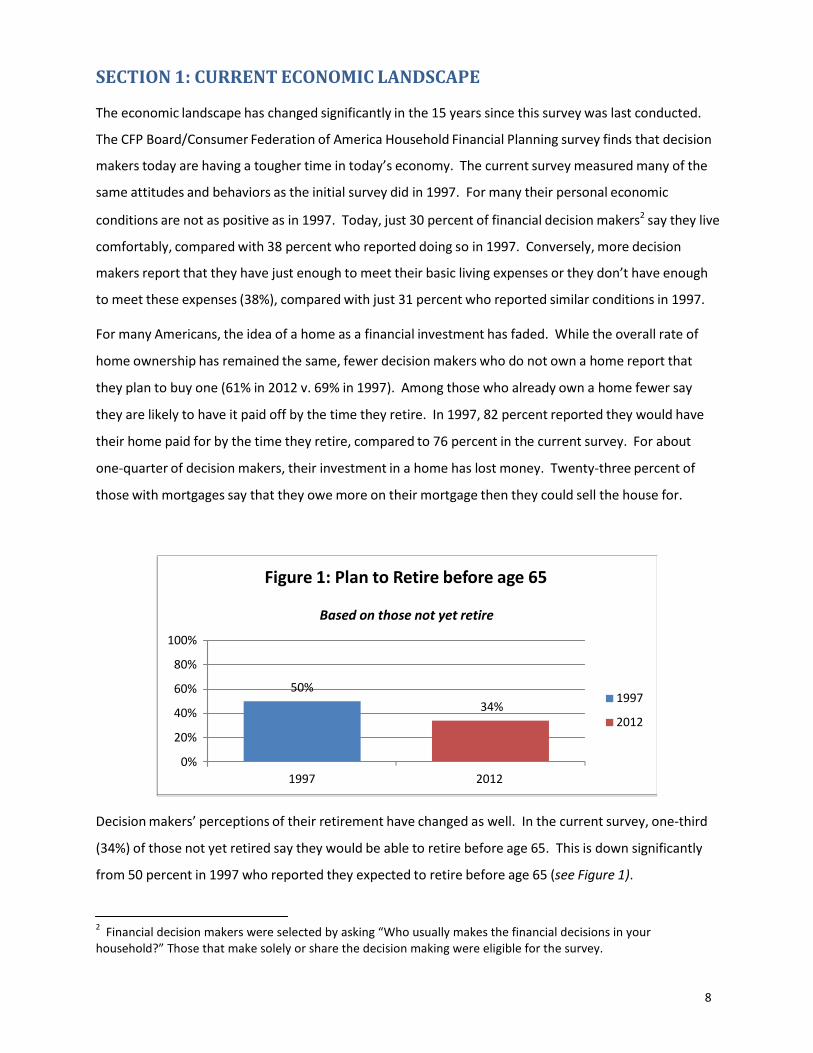
Figure 1: Plan to Retire before age 65
100%
80%
60%
40%
20%
0%
50%
Based on those not yet retire
34%
1997
2012
1997 2012
Decision makers’ perceptions of their retirement have changed as well. In the current survey, one‐third
(34%) of those not yet retired say they would be able to retire before age 65. This is down significantly
from 50 percent in 1997 who reported they expected to retire before age 65 (see Figure 1).
2 Financial decision makers were selected by asking “Who usually makes the financial decisions in your household?” Those that make solely or share the decision making were eligible for the survey.
9
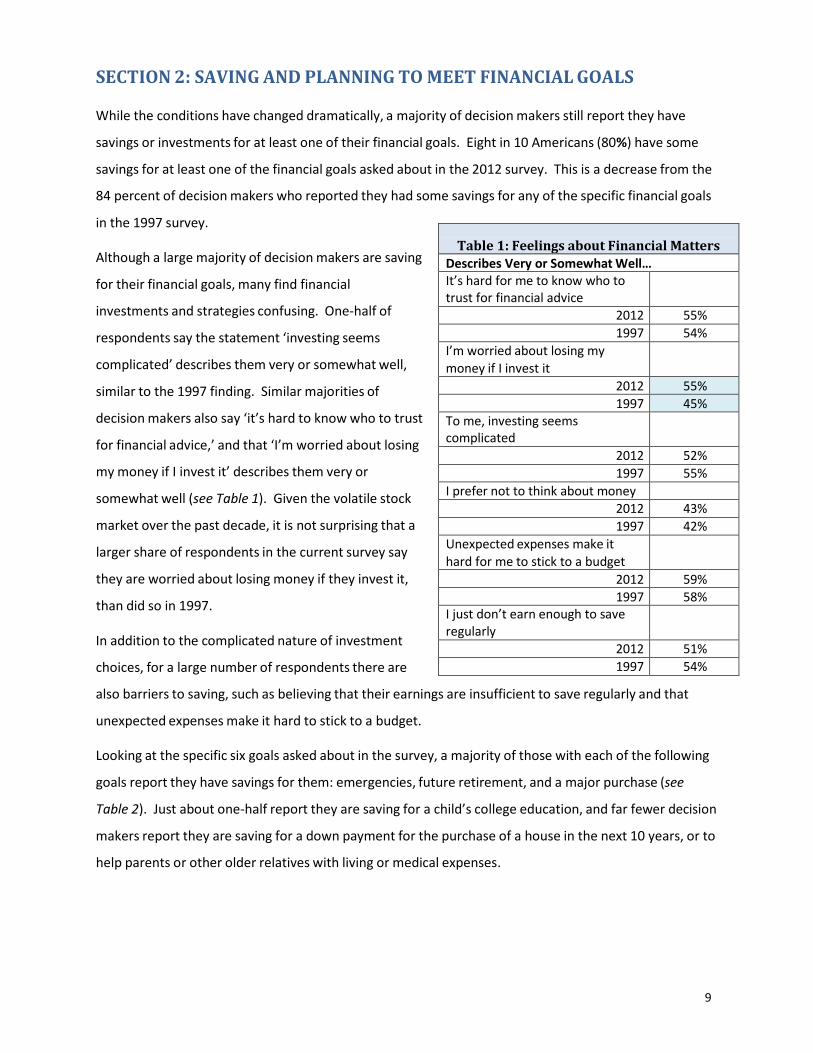
Table 1: Feelings about Financial Matters
Describes Very or Somewhat Well… It’s hard for me to know who to trust for financial advice
2012 55% 1997 54%
I’m worried about losing my money if I invest it
2012 55% 1997 45%
To me, investing seems complicated
2012 52% 1997 55%
I prefer not to think about money 2012 43% 1997 42%
Unexpected expenses make it hard for me to stick to a budget
2012 59% 1997 58%
I just don’t earn enough to save regularly
2012 51% 1997 54%
SECTION 2: SAVING AND PLANNING TO MEET FINANCIAL GOALS
While the conditions have changed dramatically, a majority of decision makers still report they have
savings or investments for at least one of their financial goals. Eight in 10 Americans (80%) have some
savings for at least one of the financial goals asked about in the 2012 survey. This is a decrease from the
84 percent of decision makers who reported they had some savings for any of the specific financial goals
in the 1997 survey.
Although a large majority of decision makers are saving
for their financial goals, many find financial
investments and strategies confusing. One‐half of
respondents say the statement ‘investing seems
complicated’ describes them very or somewhat well,
similar to the 1997 finding. Similar majorities of
decision makers also say ‘it’s hard to know who to trust
for financial advice,’ and that ‘I’m worried about losing
my money if I invest it’ describes them very or
somewhat well (see Table 1). Given the volatile stock
market over the past decade, it is not surprising that a
larger share of respondents in the current survey say
they are worried about losing money if they invest it,
than did so in 1997.
In addition to the complicated nature of investment
choices, for a large number of respondents there are
also barriers to saving, such as believing that their earnings are insufficient to save regularly and that
unexpected expenses make it hard to stick to a budget.
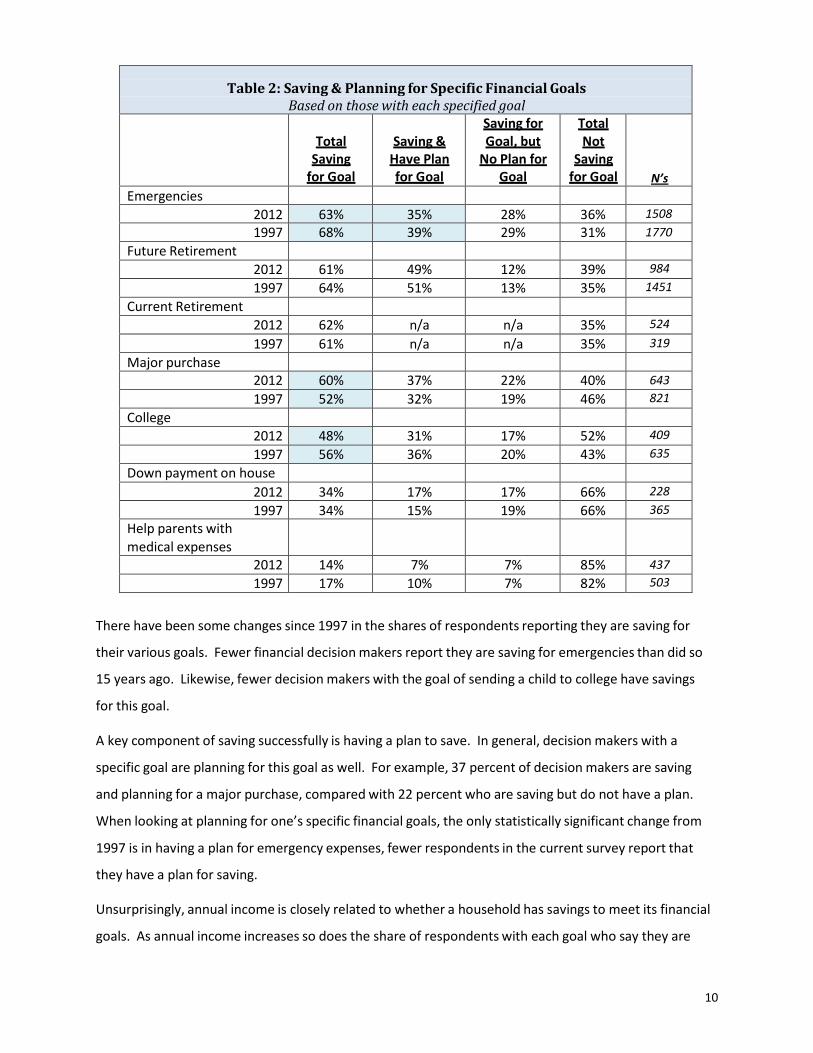
Looking at the specific six goals asked about in the survey, a majority of those with each of the following
goals report they have savings for them: emergencies, future retirement, and a major purchase (see
Table 2). Just about one‐half report they are saving for a child’s college education, and far fewer decision
makers report they are saving for a down payment for the purchase of a house in the next 10 years, or to
help parents or other older relatives with living or medical expenses.
10
Table 2: Saving & Planning for Specific Financial Goals
Based on those with each specified goal
Total Saving
for Goal
Saving &
Have Plan for Goal
Saving for Goal, but
No Plan for Goal
Total Not
Saving for Goal
N’s Emergencies
2012 63% 35% 28% 36% 1508 1997 68% 39% 29% 31% 1770
Future Retirement 2012 61% 49% 12% 39% 984 1997 64% 51% 13% 35% 1451
Current Retirement 2012 62% n/a n/a 35% 524 1997 61% n/a n/a 35% 319
Major purchase 2012 60% 37% 22% 40% 643 1997 52% 32% 19% 46% 821
College 2012 48% 31% 17% 52% 409 1997 56% 36% 20% 43% 635
Down payment on house 2012 34% 17% 17% 66% 228 1997 34% 15% 19% 66% 365
Help parents with medical expenses
2012 14% 7% 7% 85% 437 1997 17% 10% 7% 82% 503
There have been some changes since 1997 in the shares of respondents reporting they are saving for
their various goals. Fewer financial decision makers report they are saving for emergencies than did so
15 years ago. Likewise, fewer decision makers with the goal of sending a child to college have savings
for this goal.
A key component of saving successfully is having a plan to save. In general, decision makers with a
specific goal are planning for this goal as well. For example, 37 percent of decision makers are saving
and planning for a major purchase, compared with 22 percent who are saving but do not have a plan.
When looking at planning for one’s specific financial goals, the only statistically significant change from
1997 is in having a plan for emergency expenses, fewer respondents in the current survey report that
they have a plan for saving.
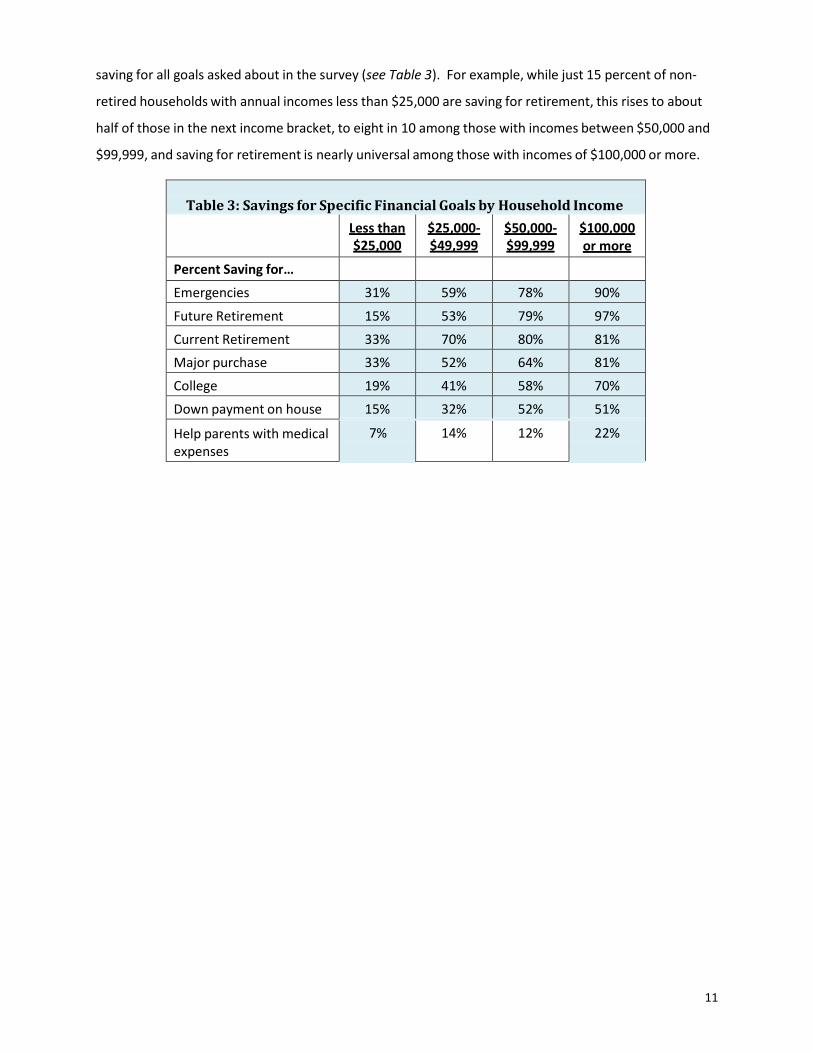
Unsurprisingly, annual income is closely related to whether a household has savings to meet its financial
goals. As annual income increases so does the share of respondents with each goal who say they are
11
saving for all goals asked about in the survey (see Table 3). For example, while just 15 percent of non‐
retired households with annual incomes less than $25,000 are saving for retirement, this rises to about
half of those in the next income bracket, to eight in 10 among those with incomes between $50,000 and
$99,999, and saving for retirement is nearly universal among those with incomes of $100,000 or more.
Table 3: Savings for Specific Financial Goals by Household Income
Less than $25,000
$25,000‐ $49,999
$50,000‐ $99,999
$100,000 or more
Percent Saving for…
Emergencies 31% 59% 78% 90%
Future Retirement 15% 53% 79% 97%
Current Retirement 33% 70% 80% 81% Major purchase 33% 52% 64% 81%
College 19% 41% 58% 70%
Down payment on house 15% 32% 52% 51%
Help parents with medical expenses
7% 14% 12% 22%
12
Table 4: Feeling of Progress towards Saving
for Specific Financial Goals Based on those with each specified goal
Feel Behind/Should Have Started
Ahead/About Right/Ok to Start Later
N’s Emergencies
2012 41% 54% 1508 1997 39% 57% 1770
Future Retirement
2012 51% 45% 984 1997 38% 60% 1451
Major purchase 2012 38% 58% 643 1997 36% 60% 821
College 2012 52% 42% 409 1997 45% 52% 635
Down payment on house
2012 48% 49% 228 1997 46% 51% 365
Help parents with medical expenses
2012 41% 46% 437 1997 32% 58% 503
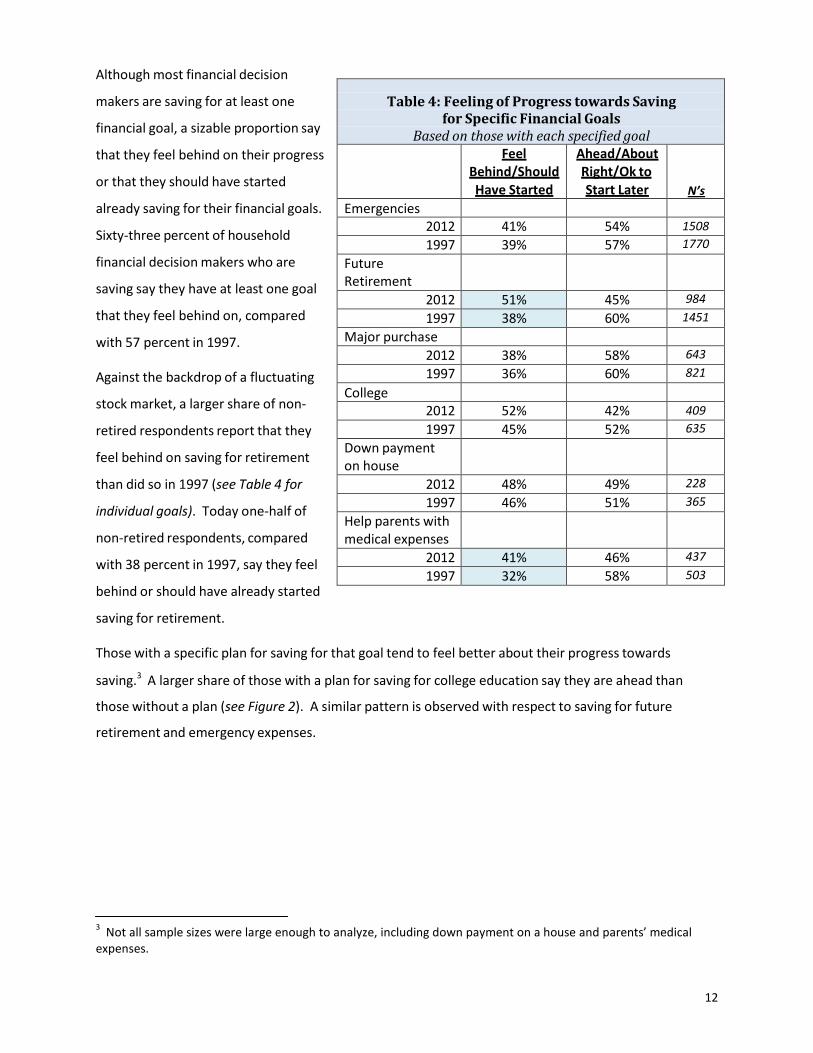
Although most financial decision
makers are saving for at least one
financial goal, a sizable proportion say
that they feel behind on their progress
or that they should have started
already saving for their financial goals.
Sixty‐three percent of household
financial decision makers who are
saving say they have at least one goal
that they feel behind on, compared
with 57 percent in 1997.
Against the backdrop of a fluctuating
stock market, a larger share of non‐
retired respondents report that they
feel behind on saving for retirement
than did so in 1997 (see Table 4 for
individual goals). Today one‐half of
non‐retired respondents, compared
with 38 percent in 1997, say they feel
behind or should have already started
saving for retirement.
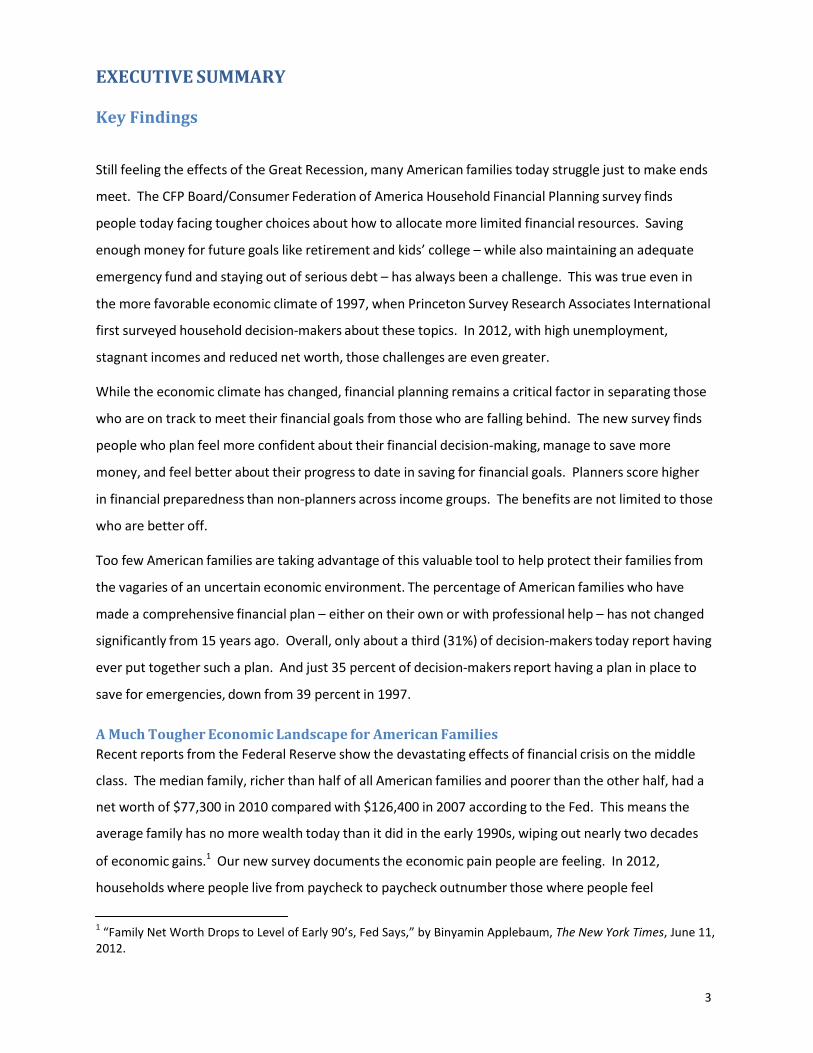
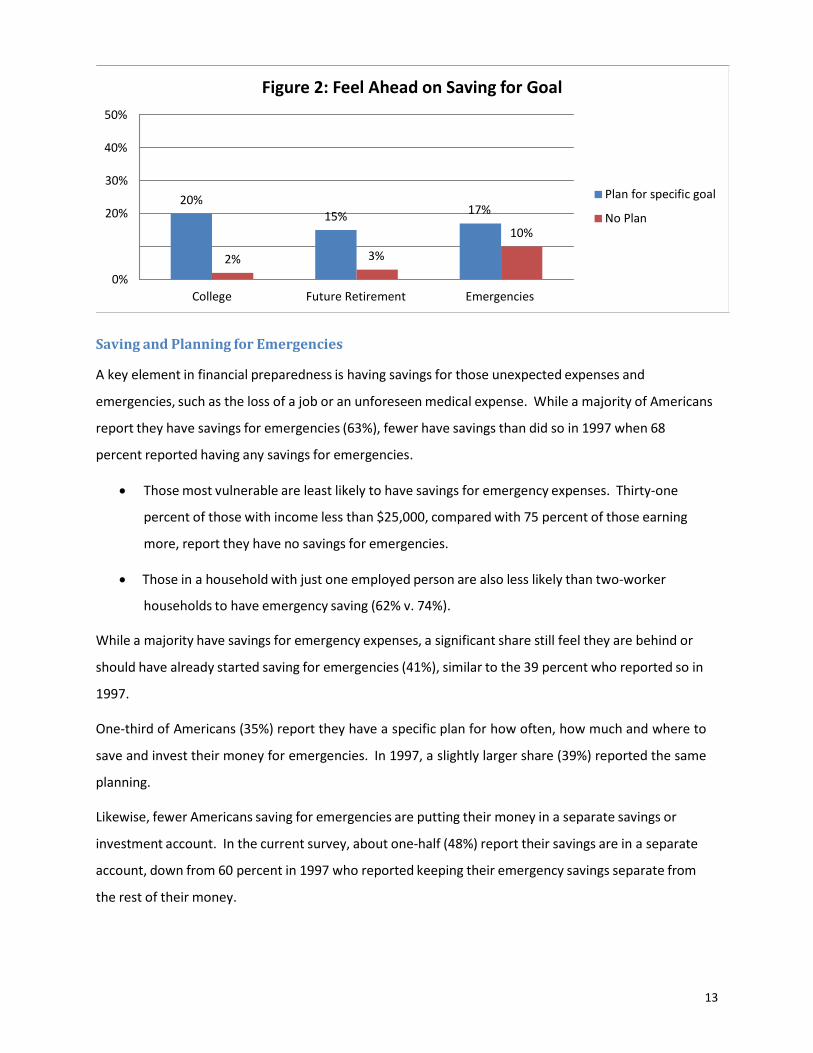
Those with a specific plan for saving for that goal tend to feel better about their progress towards
saving.3 A larger share of those with a plan for saving for college education say they are ahead than
those without a plan (see Figure 2). A similar pattern is observed with respect to saving for future
retirement and emergency expenses.
3 Not all sample sizes were large enough to analyze, including down payment on a house and parents’ medical expenses.
13
50%
Figure 2: Feel Ahead on Saving for Goal
40%
30%
20%
0%
20%
15% 17% 2% 3%
10%
Plan for specific goal
No Plan
College Future Retirement Emergencies
Saving and Planning for Emergencies
A key element in financial preparedness is having savings for those unexpected expenses and
emergencies, such as the loss of a job or an unforeseen medical expense. While a majority of Americans
report they have savings for emergencies (63%), fewer have savings than did so in 1997 when 68
percent reported having any savings for emergencies.
• Those most vulnerable are least likely to have savings for emergency expenses. Thirty‐one
percent of those with income less than $25,000, compared with 75 percent of those earning
more, report they have no savings for emergencies.
• Those in a household with just one employed person are also less likely than two‐worker
households to have emergency saving (62% v. 74%).
While a majority have savings for emergency expenses, a significant share still feel they are behind or
should have already started saving for emergencies (41%), similar to the 39 percent who reported so in
1997.
One‐third of Americans (35%) report they have a specific plan for how often, how much and where to
save and invest their money for emergencies. In 1997, a slightly larger share (39%) reported the same
planning.
Likewise, fewer Americans saving for emergencies are putting their money in a separate savings or
investment account. In the current survey, about one‐half (48%) report their savings are in a separate
account, down from 60 percent in 1997 who reported keeping their emergency savings separate from
the rest of their money.
14
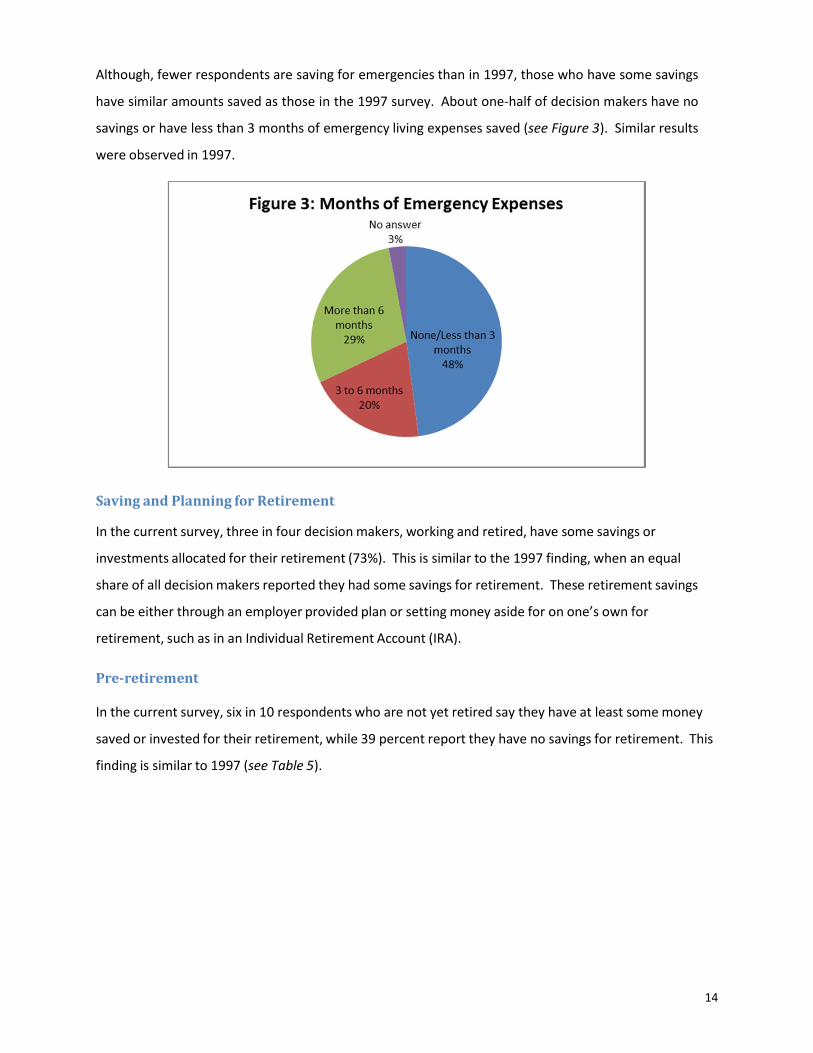
Although, fewer respondents are saving for emergencies than in 1997, those who have some savings
have similar amounts saved as those in the 1997 survey. About one‐half of decision makers have no
savings or have less than 3 months of emergency living expenses saved (see Figure 3). Similar results
were observed in 1997.
Saving and Planning for Retirement
In the current survey, three in four decision makers, working and retired, have some savings or
investments allocated for their retirement (73%). This is similar to the 1997 finding, when an equal
share of all decision makers reported they had some savings for retirement. These retirement savings
can be either through an employer provided plan or setting money aside for on one’s own for
retirement, such as in an Individual Retirement Account (IRA).
Pre‐retirement
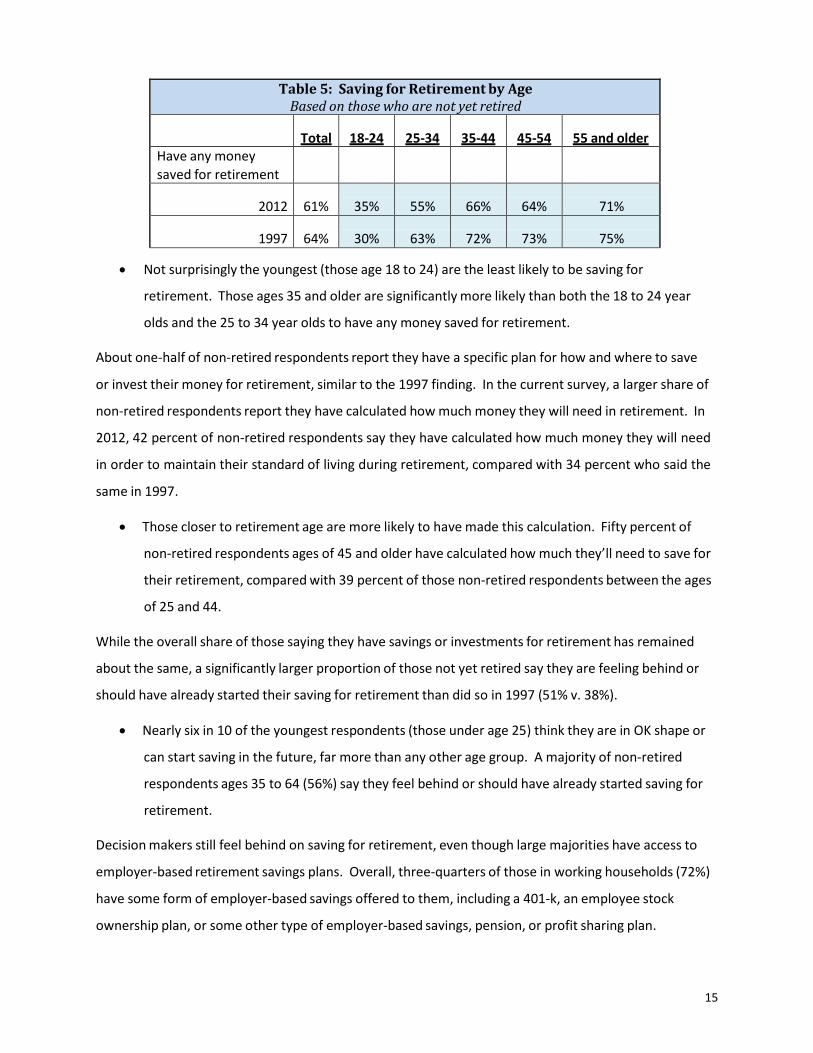
In the current survey, six in 10 respondents who are not yet retired say they have at least some money
saved or invested for their retirement, while 39 percent report they have no savings for retirement. This
finding is similar to 1997 (see Table 5).
15
Table 5: Saving for Retirement by Age Based on those who are not yet retired
Total
18‐24
25‐34
35‐44
45‐54
55 and older
Have any money saved for retirement
2012
61%
35%
55%
66%
64%
71%
1997
64%
30%
63%
72%
73%
75%
• Not surprisingly the youngest (those age 18 to 24) are the least likely to be saving for
retirement. Those ages 35 and older are significantly more likely than both the 18 to 24 year
olds and the 25 to 34 year olds to have any money saved for retirement.
About one‐half of non‐retired respondents report they have a specific plan for how and where to save
or invest their money for retirement, similar to the 1997 finding. In the current survey, a larger share of
non‐retired respondents report they have calculated how much money they will need in retirement. In
2012, 42 percent of non‐retired respondents say they have calculated how much money they will need
in order to maintain their standard of living during retirement, compared with 34 percent who said the
same in 1997.
• Those closer to retirement age are more likely to have made this calculation. Fifty percent of
non‐retired respondents ages of 45 and older have calculated how much they’ll need to save for
their retirement, compared with 39 percent of those non‐retired respondents between the ages
of 25 and 44.
While the overall share of those saying they have savings or investments for retirement has remained
about the same, a significantly larger proportion of those not yet retired say they are feeling behind or
should have already started their saving for retirement than did so in 1997 (51% v. 38%).
• Nearly six in 10 of the youngest respondents (those under age 25) think they are in OK shape or
can start saving in the future, far more than any other age group. A majority of non‐retired
respondents ages 35 to 64 (56%) say they feel behind or should have already started saving for
retirement.
Decision makers still feel behind on saving for retirement, even though large majorities have access to
employer‐based retirement savings plans. Overall, three‐quarters of those in working households (72%)
have some form of employer‐based savings offered to them, including a 401‐k, an employee stock
ownership plan, or some other type of employer‐based savings, pension, or profit sharing plan.
16
Specifically, a larger share of decision makers in working households have access to a 401‐k or other
retirement plan at work where they can make direct contributions than did so in 1997 (67% vs. 55%).
Among financial decision makers with access to a 401‐k or other retirement plan where they can make
contributions themselves, 77 percent report they do so every year, a significant increase from 1997
when 66 percent reported contributing every year.
For non‐retired decision makers, the main vehicle for saving for retirement is through the employer, far
fewer are saving on their own. Three in 10 non retired respondents (31%) report setting money aside for
retirement in accounts or investments on their own, and 22 percent report contributing to an IRA on a
yearly basis.
A large majority of those who are not retired with money saved for retirement use separate accounts
(77%), rather than using one account for both retirement savings and funds intended for other purposes
(20%).
During Retirement Three in five retired respondents (62%) have some money saved or invested to pay for expenses during
their retirement. In 1997, a similar share reported having money saved for retirement (61%). Roughly,
one half of those who are retired and have retirement savings have calculated how much they can
afford to withdraw annually and still have enough savings to last the rest of their lifetime (53%). In
1997, a statistically similar share of retired respondents reported making this calculation (46%).
Saving to Send a Child to College
The cost of a college education has been rising well ahead of inflation over the past few decades, making
it a greater economic burden for families. In the current survey, fewer respondents with the goal of
sending a child to college report they have any savings for this goal. In 2012, 48 percent report they had
any amount of money saved or invested, compared with 56 percent in 1997. One‐half of decision
makers with the goal of sending a child to college say they feel behind in saving or feel they should have
already started, similar to the result in 1997.
Thirty‐one percent of respondents with the goal of saving for a child’s college education have a plan for
saving, statistically similar to the 36 percent who reported the same in 1997.
Saving and Planning for Other Financial Goals
Other financial goals were asked about in the survey, including saving for a major purchase in the next
few years, a down payment on a home, and parents’ or older relatives’ living or medical expenses. A
larger share of respondents with the goal of making a major purchase in the next few years, such as a
17
car or home improvement project, have at least some money saved for this goal than did so in 1997
(60% v. 52%). About one in three respondents has a plan to save for major expenses, similar to 1997.
While a majority with the goal of making a major purchase are saving, a sizable proportion say they feel
they are behind in saving or should have already started saving. Thirty‐eight percent say they feel
behind in saving for a major purchase, a similar finding to 1997. Four in 10 are keeping these savings in a
separate account, while the majority (55%) keeps this earmarked money mixed with money for other
purposes.
One‐third of those with the goal of buying a house in next 10 years have some savings for the down
payment (34%). This finding is similar to 1997. About half of these respondents hoping to buy a home
have a plan for saving while the rest do not.
Potential home buyers are equally divided on whether they feel behind or should have already started
saving (48%) or whether they are on track with their savings or believe it is okay to start saving in the
future (49%). Similarly, they are divided on keeping the money in a separate account (46%) or in a
multi‐purpose account (51%).
As was observed in the 1997 survey, few respondents are saving for a parent’s or older relative’s
medical expenses (14% in 2012 and 17% in 1997). The share of those with a plan for this goal is
unchanged as well since 1997.
Given rising medical expenses, it is not surprising that a larger share of respondents with the goal of
helping a parent with medical expenses report they feel behind in saving than did so in 1997 (41% v.
32%). Respondents who are saving for this goal are as likely to keep the money in a separate account
(53%) as a mixed account (44%), statistically similar to 1997.
18
SECTION 3: CREDIT CARD DEBT
Similar to saving for emergencies and retirement, reducing debt is a major financial goal for significant
proportion of decision makers. One‐half of household financial decision makers in the survey report
some sort of household debt – including credit cards and college loans for either their own college
education or their child’s.
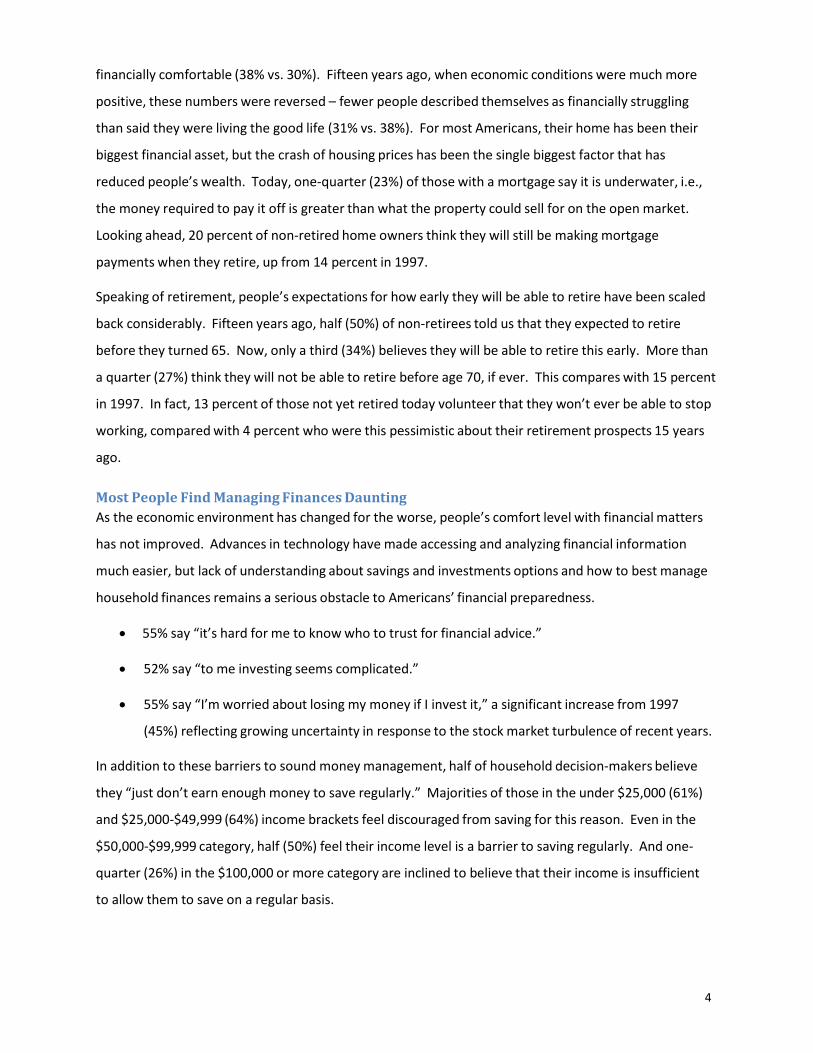
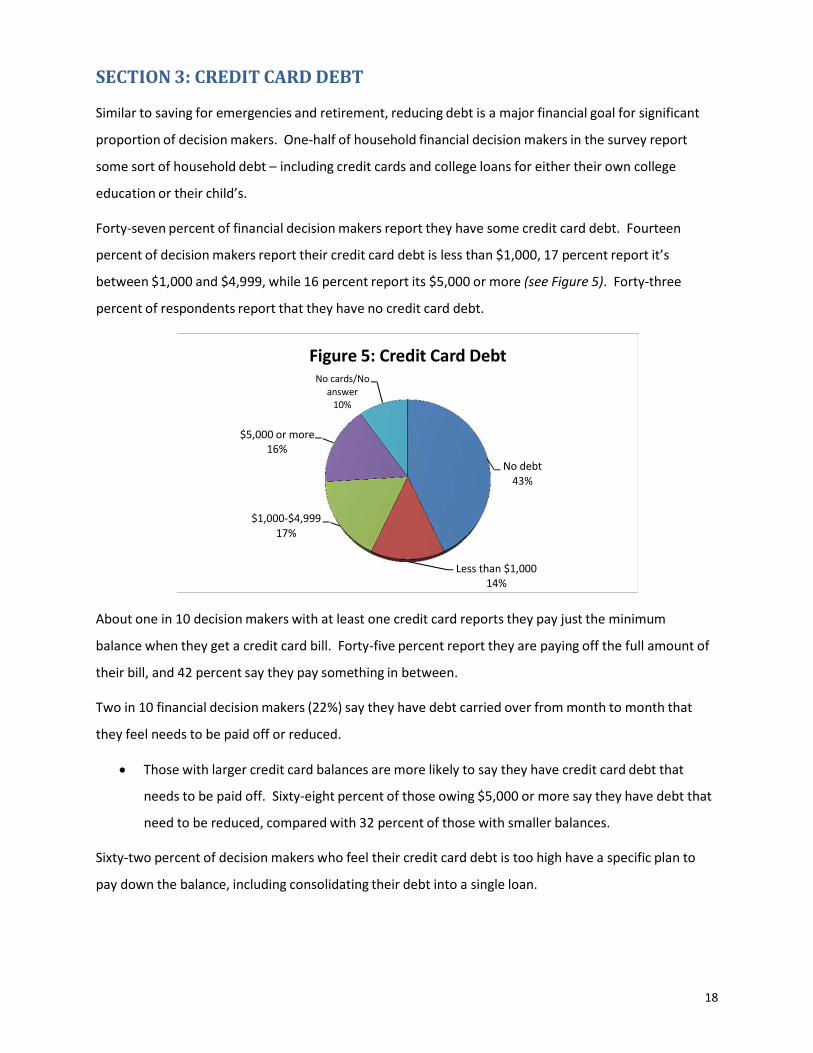
Forty‐seven percent of financial decision makers report they have some credit card debt. Fourteen
percent of decision makers report their credit card debt is less than $1,000, 17 percent report it’s
between $1,000 and $4,999, while 16 percent report its $5,000 or more (see Figure 5). Forty‐three
percent of respondents report that they have no credit card debt.
Figure 5: Credit Card Debt No cards/No
answer 10%
$5,000 or more
16%
No debt
43%
$1,000‐$4,999 17%
Less than $1,000
14%
About one in 10 decision makers with at least one credit card reports they pay just the minimum
balance when they get a credit card bill. Forty‐five percent report they are paying off the full amount of
their bill, and 42 percent say they pay something in between.
Two in 10 financial decision makers (22%) say they have debt carried over from month to month that
they feel needs to be paid off or reduced.
• Those with larger credit card balances are more likely to say they have credit card debt that
needs to be paid off. Sixty‐eight percent of those owing $5,000 or more say they have debt that
need to be reduced, compared with 32 percent of those with smaller balances.
Sixty‐two percent of decision makers who feel their credit card debt is too high have a specific plan to
pay down the balance, including consolidating their debt into a single loan.
19
• Sixty‐four percent of those who wish to reduce their credit card debt and have balances of
$1,000 or more say they have a plan for reducing this debt, compared with just 47 percent of
those with smaller credit card balances.
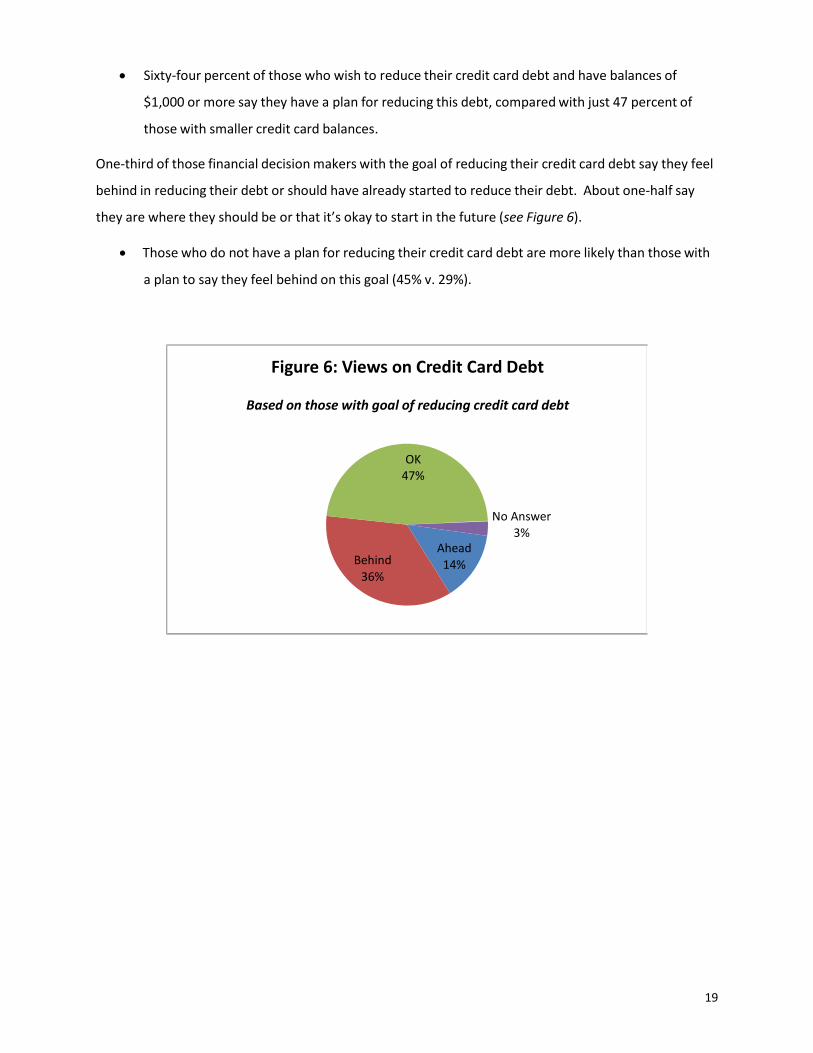
One‐third of those financial decision makers with the goal of reducing their credit card debt say they feel
behind in reducing their debt or should have already started to reduce their debt. About one‐half say
they are where they should be or that it’s okay to start in the future (see Figure 6).
• Those who do not have a plan for reducing their credit card debt are more likely than those with
a plan to say they feel behind on this goal (45% v. 29%).
Figure 6: Views on Credit Card Debt
Based on those with goal of reducing credit card debt
OK 47%
Behind 36%
Ahead 14%
No Answer 3%
20
SECTION 4: THE IMPORTANCE OF FINANCIAL PLANNING
Emergency and Retirement Planning
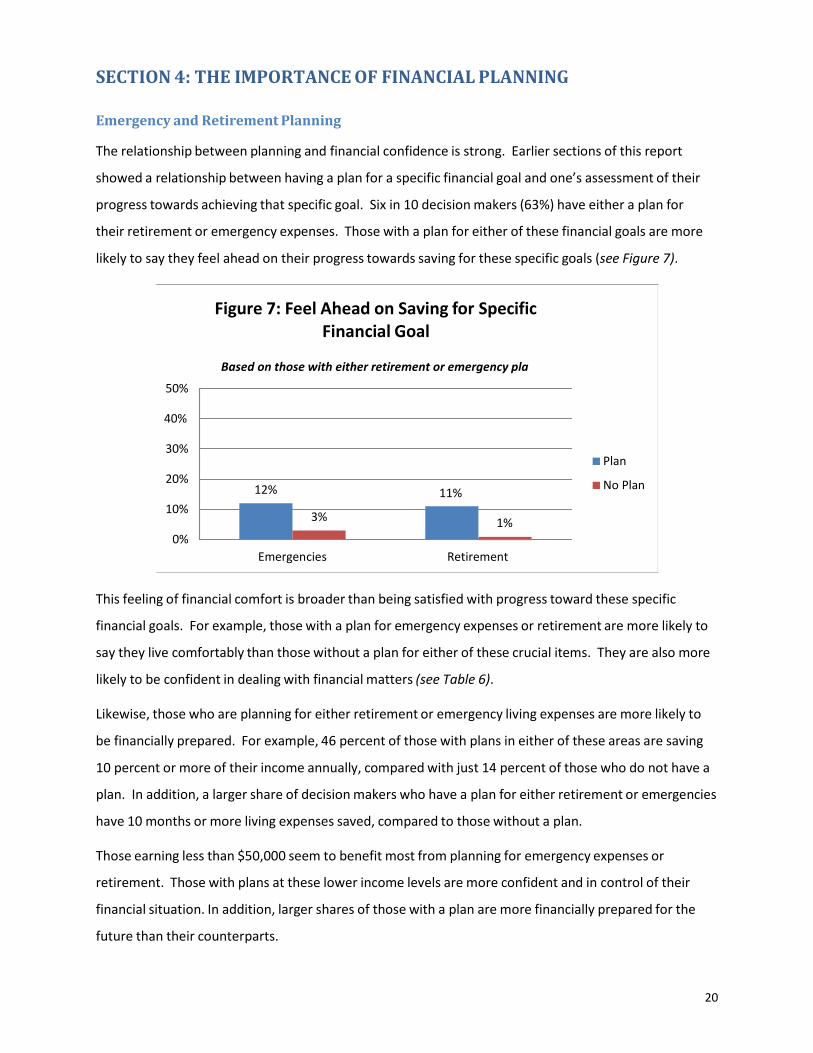
The relationship between planning and financial confidence is strong. Earlier sections of this report
showed a relationship between having a plan for a specific financial goal and one’s assessment of their
progress towards achieving that specific goal. Six in 10 decision makers (63%) have either a plan for
their retirement or emergency expenses. Those with a plan for either of these financial goals are more
likely to say they feel ahead on their progress towards saving for these specific goals (see Figure 7).
Figure 7: Feel Ahead on Saving for Specific Financial Goal
50%
Based on those with either retirement or emergency pla
40%
30%
20%
10%
0%
12% 11%
3% 1%
Emergencies Retirement
Plan
No Plan
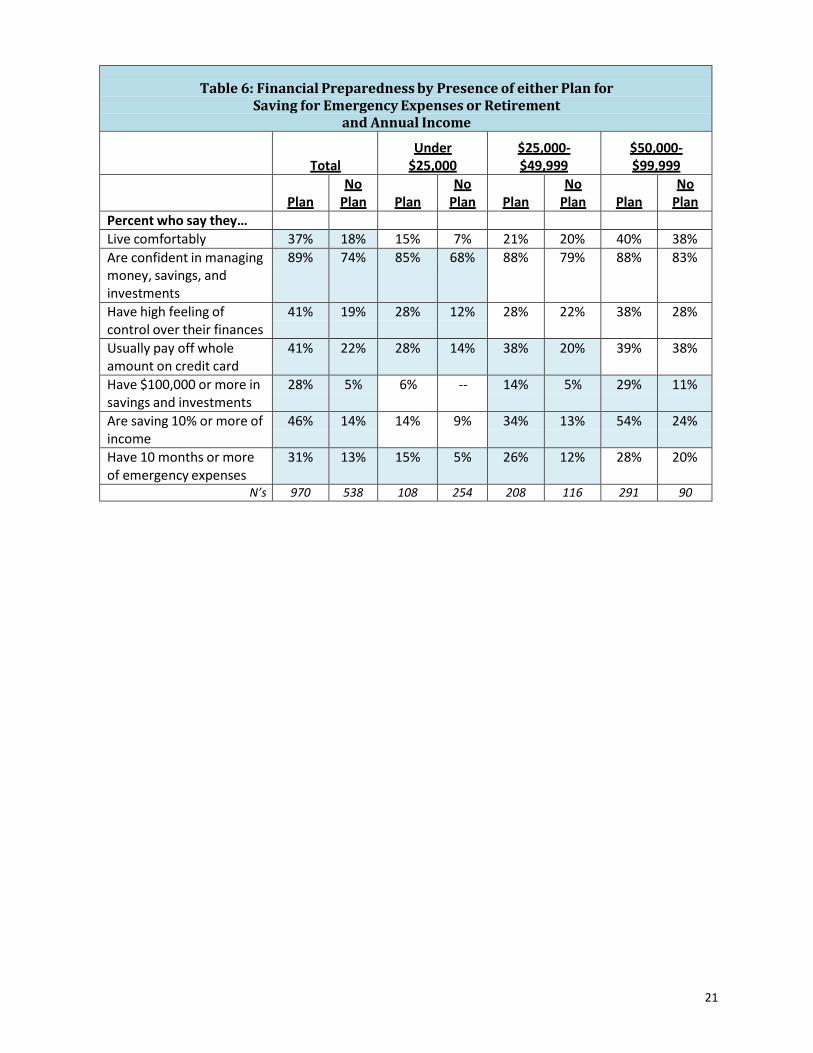
This feeling of financial comfort is broader than being satisfied with progress toward these specific
financial goals. For example, those with a plan for emergency expenses or retirement are more likely to
say they live comfortably than those without a plan for either of these crucial items. They are also more
likely to be confident in dealing with financial matters (see Table 6).
Likewise, those who are planning for either retirement or emergency living expenses are more likely to
be financially prepared. For example, 46 percent of those with plans in either of these areas are saving
10 percent or more of their income annually, compared with just 14 percent of those who do not have a
plan. In addition, a larger share of decision makers who have a plan for either retirement or emergencies
have 10 months or more living expenses saved, compared to those without a plan.
Those earning less than $50,000 seem to benefit most from planning for emergency expenses or
retirement. Those with plans at these lower income levels are more confident and in control of their
financial situation. In addition, larger shares of those with a plan are more financially prepared for the
future than their counterparts.
21
Table 6: Financial Preparedness by Presence of either Plan for
Saving for Emergency Expenses or Retirement and Annual Income
Total
Under $25,000
$25,000‐ $49,999
$50,000‐ $99,999
Plan
No Plan
Plan
No Plan
Plan
No Plan
Plan
No Plan
Percent who say they… Live comfortably 37% 18% 15% 7% 21% 20% 40% 38% Are confident in managing money, savings, and investments
89% 74% 85% 68% 88% 79% 88% 83%
Have high feeling of control over their finances
41% 19% 28% 12% 28% 22% 38% 28%
Usually pay off whole amount on credit card
41% 22% 28% 14% 38% 20% 39% 38%
Have $100,000 or more in savings and investments
28% 5% 6% ‐‐ 14% 5% 29% 11%
Are saving 10% or more of income
46% 14% 14% 9% 34% 13% 54% 24%
Have 10 months or more of emergency expenses
31% 13% 15% 5% 26% 12% 28% 20%
N’s 970 538 108 254 208 116 291 90
22
Comprehensive Financial Planning
As in 1997, the current survey clearly shows the benefits of having a comprehensive financial plan for all
decision makers, a plan that includes savings and investments, planning for retirement and insurance
needs4. The current survey findings demonstrate that decision makers with a comprehensive financial
plan are more financially confident and comfortable than those without a plan. In addition, the current
research shows they have more positive financial outcomes.
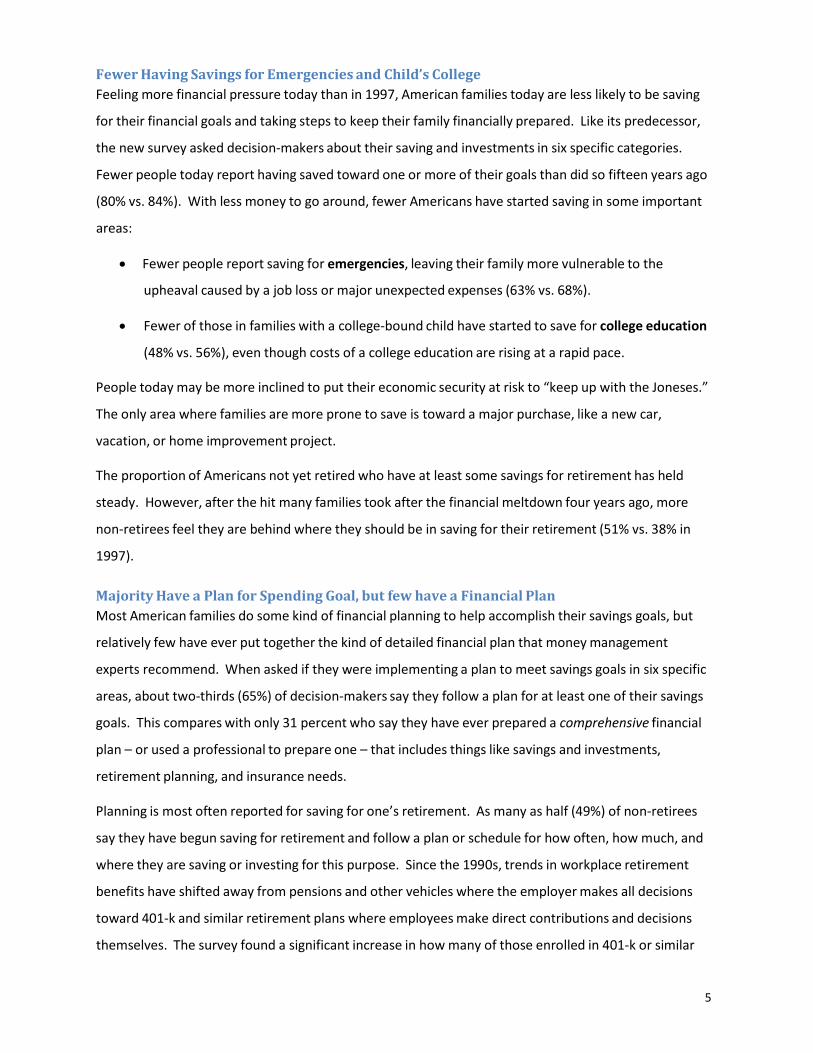
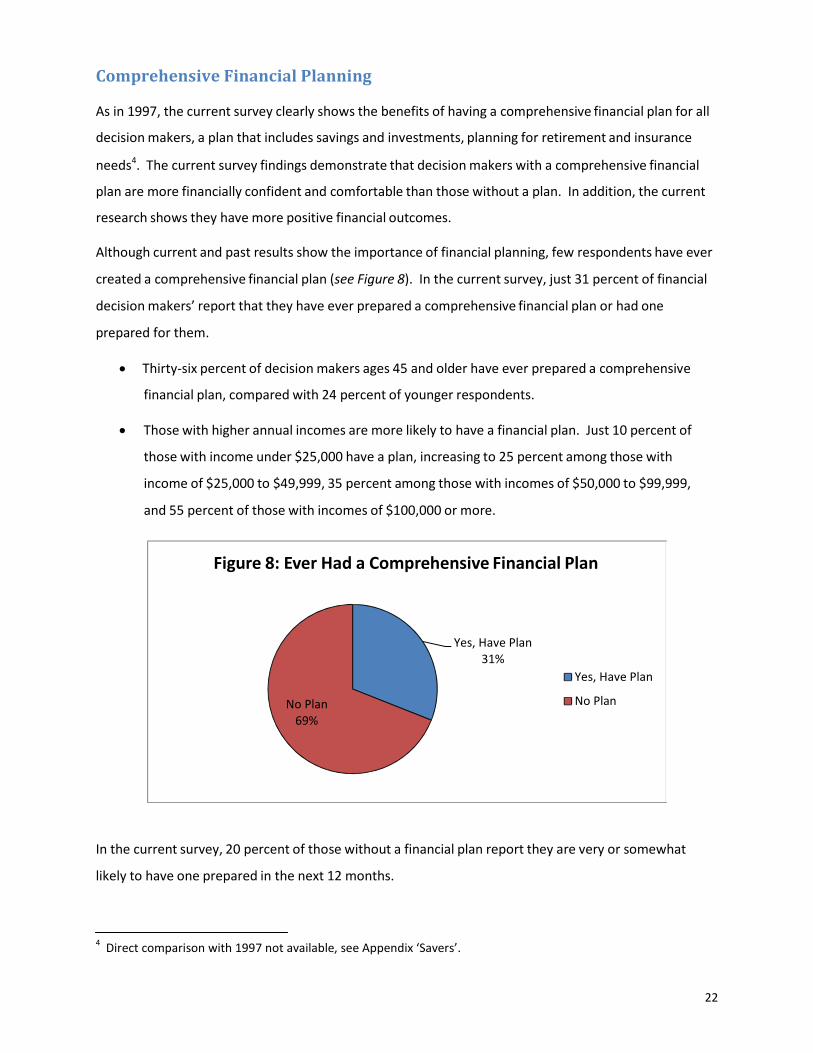
Although current and past results show the importance of financial planning, few respondents have ever
created a comprehensive financial plan (see Figure 8). In the current survey, just 31 percent of financial
decision makers’ report that they have ever prepared a comprehensive financial plan or had one
prepared for them.
• Thirty‐six percent of decision makers ages 45 and older have ever prepared a comprehensive
financial plan, compared with 24 percent of younger respondents.
• Those with higher annual incomes are more likely to have a financial plan. Just 10 percent of
those with income under $25,000 have a plan, increasing to 25 percent among those with
income of $25,000 to $49,999, 35 percent among those with incomes of $50,000 to $99,999,
and 55 percent of those with incomes of $100,000 or more.
Figure 8: Ever Had a Comprehensive Financial Plan
No Plan 69%
Yes, Have Plan 31%
Yes, Have Plan
No Plan
In the current survey, 20 percent of those without a financial plan report they are very or somewhat
likely to have one prepared in the next 12 months.
4 Direct comparison with 1997 not available, see Appendix ‘Savers’.
23
• Those with incomes of $50,000 are more likely than those with lower annual incomes to say
they are likely to develop a financial plan in the next 12 months (27% v. 17%).
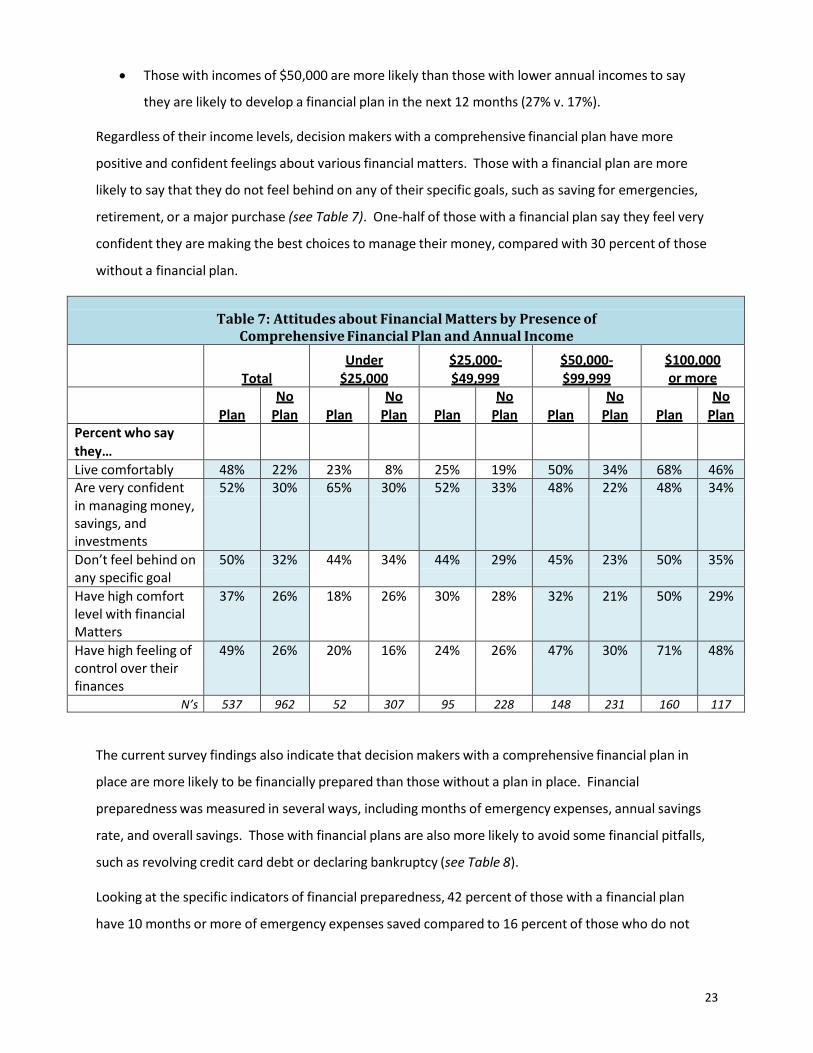
Regardless of their income levels, decision makers with a comprehensive financial plan have more
positive and confident feelings about various financial matters. Those with a financial plan are more
likely to say that they do not feel behind on any of their specific goals, such as saving for emergencies,
retirement, or a major purchase (see Table 7). One‐half of those with a financial plan say they feel very
confident they are making the best choices to manage their money, compared with 30 percent of those
without a financial plan.
Table 7: Attitudes about Financial Matters by Presence of
Comprehensive Financial Plan and Annual Income
Total
Under $25,000
$25,000‐ $49,999
$50,000‐ $99,999
$100,000 or more
Plan
No Plan
Plan
No Plan
Plan
No Plan
Plan
No Plan
Plan
No Plan
Percent who say they…
Live comfortably 48% 22% 23% 8% 25% 19% 50% 34% 68% 46% Are very confident in managing money, savings, and investments
52% 30% 65% 30% 52% 33% 48% 22% 48% 34%
Don’t feel behind on any specific goal
50% 32% 44% 34% 44% 29% 45% 23% 50% 35%
Have high comfort level with financial Matters
37% 26% 18% 26% 30% 28% 32% 21% 50% 29%
Have high feeling of control over their finances
49% 26% 20% 16% 24% 26% 47% 30% 71% 48%
N’s 537 962 52 307 95 228 148 231 160 117
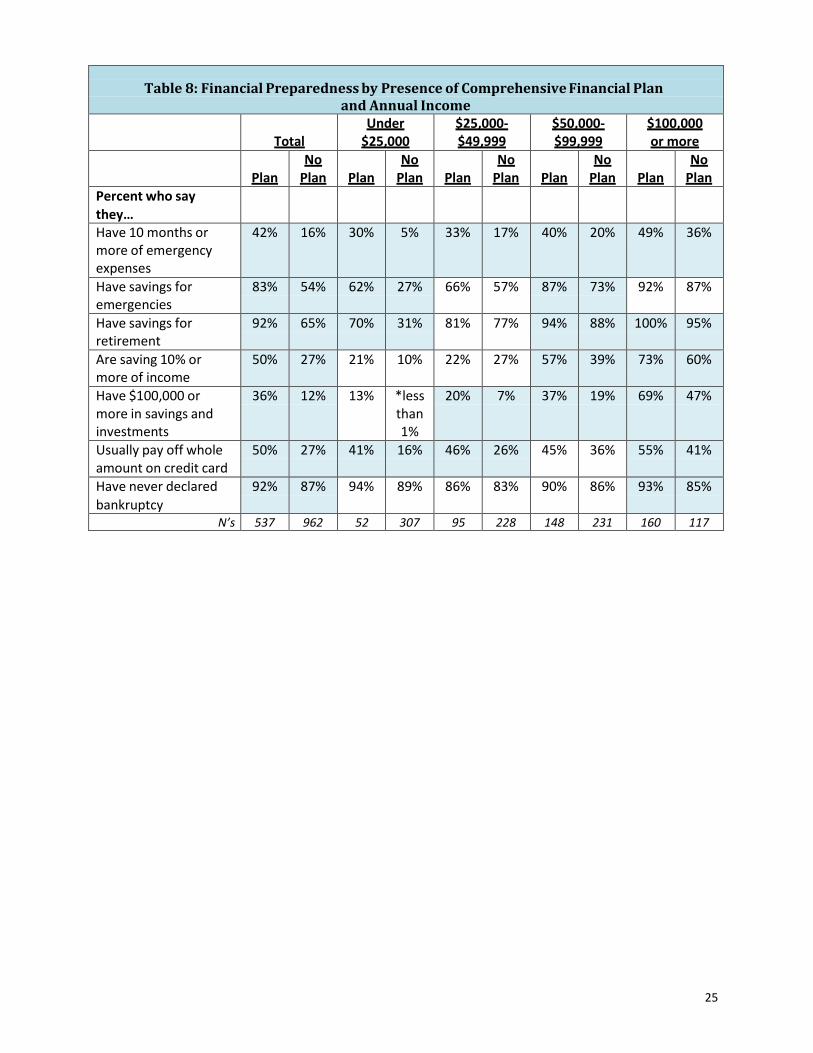
The current survey findings also indicate that decision makers with a comprehensive financial plan in
place are more likely to be financially prepared than those without a plan in place. Financial
preparedness was measured in several ways, including months of emergency expenses, annual savings
rate, and overall savings. Those with financial plans are also more likely to avoid some financial pitfalls,
such as revolving credit card debt or declaring bankruptcy (see Table 8).
Looking at the specific indicators of financial preparedness, 42 percent of those with a financial plan
have 10 months or more of emergency expenses saved compared to 16 percent of those who do not
24
have a plan. One‐half of those with a financial plan are saving at least 10 percent of their income every
year compared to one‐quarter of those without a financial plan. Those with a financial plan are also more
likely have accumulated a significant amount in savings. Thirty‐six percent of those with a financial plan
have $100,000 or more in savings, compared with just 12 percent of those without a plan.
In general, this pattern of difference is observed across all income levels. Those with a plan are more
likely to be financially prepared than those without a plan.5 Across all income categories those with a
financial plan are more likely to have 10 months or more saved in emergency expenses. Likewise, this
pattern is observed when looking at total savings. Even for those with annual incomes between $25,000
and $49,999, planning is powerful. Twenty percent of those in this income bracket have accumulated
$100,000 or more compared with just seven percent of those without a plan.
There also indications that those who have a financial plan are more likely to avoid some financial
dangers, such as credit card debt and bankruptcy. One‐half of those with a financial plan say they
usually pay off the full amount when they get a credit card bill, compared to roughly one‐quarter of
those without a financial plan. There are significant differences across most income groups on this
measure, the exception being those earning $50,000 to $99,999 annually.
5 Significant differences do not appear across all income categories on every measure.
25
Table 8: Financial Preparedness by Presence of Comprehensive Financial Plan
and Annual Income
Total Under
$25,000 $25,000‐ $49,999
$50,000‐ $99,999
$100,000 or more
Plan
No Plan
Plan
No Plan
Plan
No Plan
Plan
No Plan
Plan
No Plan
Percent who say they…
Have 10 months or more of emergency expenses
42% 16% 30% 5% 33% 17% 40% 20% 49% 36%
Have savings for emergencies
83% 54% 62% 27% 66% 57% 87% 73% 92% 87%
Have savings for retirement
92% 65% 70% 31% 81% 77% 94% 88% 100% 95%
Are saving 10% or more of income
50% 27% 21% 10% 22% 27% 57% 39% 73% 60%
Have $100,000 or more in savings and investments
36% 12% 13% *less than 1%
20% 7% 37% 19% 69% 47%
Usually pay off whole amount on credit card
50% 27% 41% 16% 46% 26% 45% 36% 55% 41%
Have never declared bankruptcy
92% 87% 94% 89% 86% 83% 90% 86% 93% 85%
N’s 537 962 52 307 95 228 148 231 160 117
26
APPENDIX
SAVERS ANALYSIS
In 1997, only those decision makers who reported they had some savings for any of the specific financial
goals were asked whether or not they had a comprehensive financial plan. This appendix reports results
on this ‘Savers’ base from 1997, and compares to the 2012 based on the same ‘Savers’ definition.
As in 1997, the current survey clearly shows that people at all income levels benefit from having a
financial plan. The survey demonstrates that decision makers who are saving for any financial goal
(‘Savers’) and who have a financial plan feel and behave differently than those without a plan.6 In
addition, the current research shows they have more positive financial outcomes.
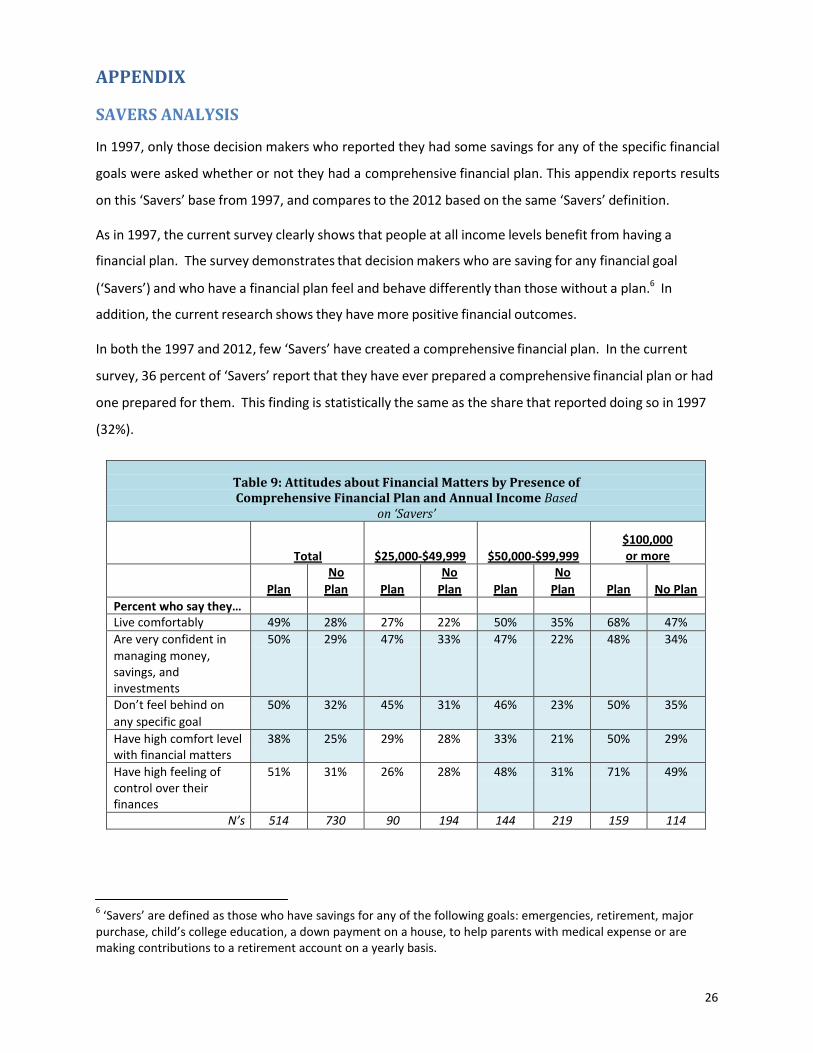
In both the 1997 and 2012, few ‘Savers’ have created a comprehensive financial plan. In the current
survey, 36 percent of ‘Savers’ report that they have ever prepared a comprehensive financial plan or had
one prepared for them. This finding is statistically the same as the share that reported doing so in 1997
(32%).
Table 9: Attitudes about Financial Matters by Presence of Comprehensive Financial Plan and Annual Income Based
on ‘Savers’
Total
$25,000‐$49,999
$50,000‐$99,999
$100,000 or more
Plan
No Plan
Plan
No Plan
Plan
No Plan
Plan
No Plan
Percent who say they… Live comfortably 49% 28% 27% 22% 50% 35% 68% 47% Are very confident in managing money, savings, and investments
50% 29% 47% 33% 47% 22% 48% 34%
Don’t feel behind on any specific goal
50% 32% 45% 31% 46% 23% 50% 35%
Have high comfort level with financial matters
38% 25% 29% 28% 33% 21% 50% 29%
Have high feeling of control over their finances
51% 31% 26% 28% 48% 31% 71% 49%
N’s 514 730 90 194 144 219 159 114
6 ‘Savers’ are defined as those who have savings for any of the following goals: emergencies, retirement, major purchase, child’s college education, a down payment on a house, to help parents with medical expense or are making contributions to a retirement account on a yearly basis.
27
Table 10: Saving for a Specific Goal by Presence of a Comprehensive Financial Plan
Based on ‘Savers’ Plan No Plan
Percent saving for…
Emergencies
2012 87% 74%
1997 87% 77% Future Retirement
2012 87% 68%
1997 89% 69% Major purchase
2012 77% 60%
1997 68% 51% College
2012 70% 52%
1997 77% 52% Down payment on house
2012 54% 36%
1997 56% 36% Help parents with medical expenses
2012 25% 13%
1997 27% 16%
One‐half of ‘Savers’ with a comprehensive financial plan say they feel very confident they are making
the best choices to manage their money, compared with 29 percent of those without a financial plan
(see Table 9). The gap between very confident decision makers who follow a financial plan and those
without a plan remains quite sizeable across all income levels. This pattern was also observed in 1997.7
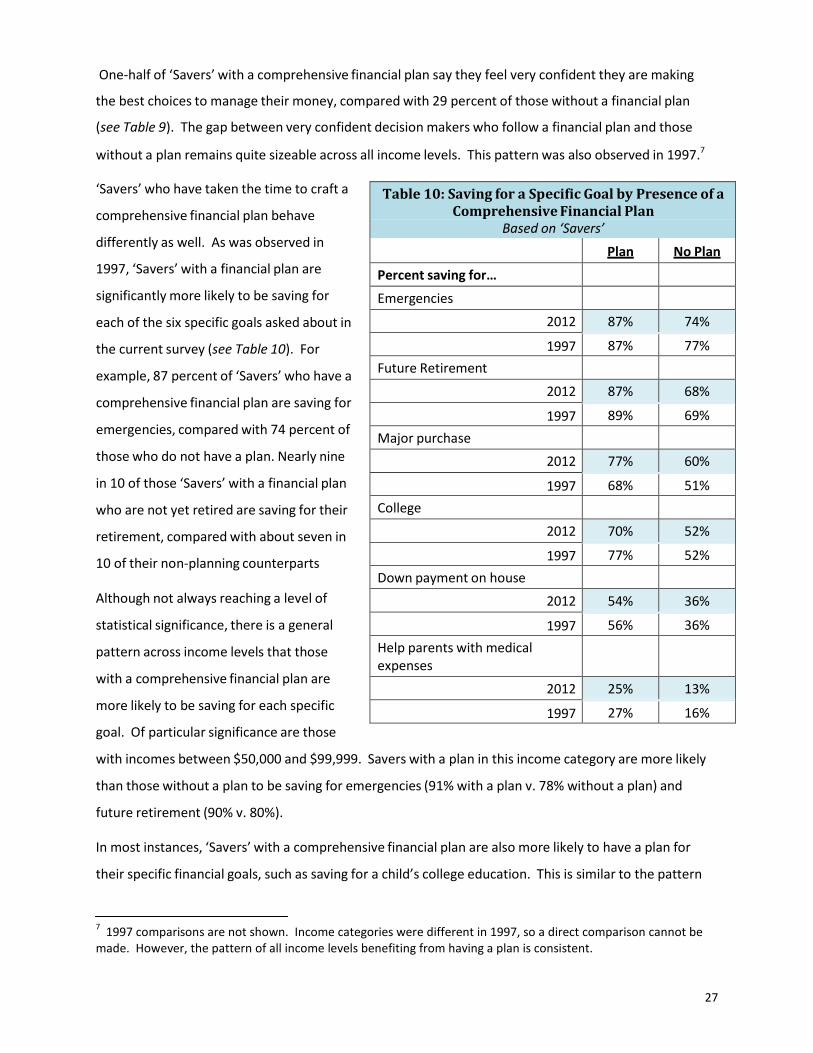
‘Savers’ who have taken the time to craft a
comprehensive financial plan behave
differently as well. As was observed in
1997, ‘Savers’ with a financial plan are
significantly more likely to be saving for
each of the six specific goals asked about in
the current survey (see Table 10). For
example, 87 percent of ‘Savers’ who have a
comprehensive financial plan are saving for
emergencies, compared with 74 percent of
those who do not have a plan. Nearly nine
in 10 of those ‘Savers’ with a financial plan
who are not yet retired are saving for their
retirement, compared with about seven in
10 of their non‐planning counterparts
Although not always reaching a level of
statistical significance, there is a general
pattern across income levels that those
with a comprehensive financial plan are
more likely to be saving for each specific
goal. Of particular significance are those
with incomes between $50,000 and $99,999. Savers with a plan in this income category are more likely
than those without a plan to be saving for emergencies (91% with a plan v. 78% without a plan) and
future retirement (90% v. 80%).
In most instances, ‘Savers’ with a comprehensive financial plan are also more likely to have a plan for
their specific financial goals, such as saving for a child’s college education. This is similar to the pattern
7 1997 comparisons are not shown. Income categories were different in 1997, so a direct comparison cannot be made. However, the pattern of all income levels benefiting from having a plan is consistent.
28
observed in 1997. The one exception to this is saving and planning for living or medical expenses for a
parent or older relative.
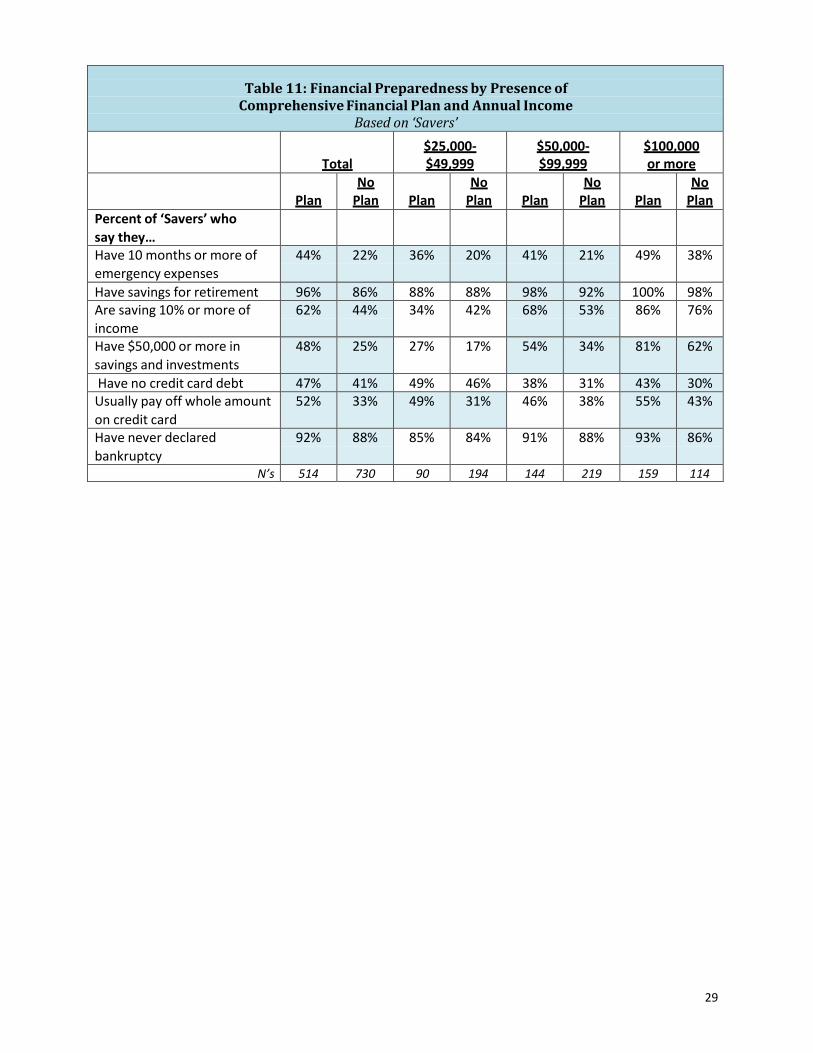
The current survey findings also indicate that ‘Savers’ with a comprehensive financial plan in place are
more likely to be financially prepared than those without a plan in place are. Financial preparedness
was measured in several ways, including number of months of emergency expenses, overall savings, and
the presence of adequate life and property insurance. These ‘Savers’ who have financial plans are also
more likely to avoid some financial pitfalls, such as having credit card debt, or declaring bankruptcy (see
Table 11).
Looking at the specific indicators of financial preparedness, 44 percent of ‘Savers’ with a financial plan
have 10 months or more of emergency expenses in place compared to just 22 percent of ‘Savers’ who
do not have a plan. This finding is similar to 1997, in that survey 43 percent of ‘Savers’ with a plan had
10 months or more saved, compared with 25 percent of ‘Savers’ without a plan.
Similarly, those with a plan are doing better at saving a larger percentage of their annual income. Sixty‐
two percent of ‘Savers’ in the current survey with a financial plan are saving at least 10 percent of their
income every year compared to 44 percent of ‘Savers’ without a financial plan.
In general, this pattern of difference is observed across all income levels. Those who plan are more
likely to be financially prepared than those without a plan.8 For example, looking at ‘Savers’ with annual
incomes between $50,000 and $99,999, 54 percent of those with a plan have at least $50,000 in savings,
compared with 34 percent of their non‐planning counterparts. Likewise, this pattern is observed in the
highest income category, those earning $100,000 or more, 81 percent with a financial plan have $50,000
or more in savings, compared with 62 percent of those without a plan.
There also indications that those ‘Savers’ who also have a financial plan are more likely to avoid some
financial dangers, such as credit card debt and bankruptcy. One‐half of ‘Savers’ with a financial plan
(52%) say they usually pay off the full amount on their credit cards, compared with one‐third of ‘Savers’
without a financial plan.
8 Significant differences do not appear across all income categories.
29
Table 11: Financial Preparedness by Presence of
Comprehensive Financial Plan and Annual Income Based on ‘Savers’
Total $25,000‐ $49,999
$50,000‐ $99,999
$100,000 or more
Plan
No Plan
Plan
No Plan
Plan
No Plan
Plan
No Plan
Percent of ‘Savers’ who say they…
Have 10 months or more of emergency expenses
44% 22% 36% 20% 41% 21% 49% 38%
Have savings for retirement 96% 86% 88% 88% 98% 92% 100% 98% Are saving 10% or more of income
62% 44% 34% 42% 68% 53% 86% 76%
Have $50,000 or more in savings and investments
48% 25% 27% 17% 54% 34% 81% 62%
Have no credit card debt 47% 41% 49% 46% 38% 31% 43% 30% Usually pay off whole amount on credit card
52% 33% 49% 31% 46% 38% 55% 43%
Have never declared bankruptcy
92% 88% 85% 84% 91% 88% 93% 86%
N’s 514 730 90 194 144 219 159 114
30
METHODOLOGY
The 2012 Household Planning Survey – sponsored by CFP Board and the Consumer Federation of America
– obtained telephone interviews with a nationally representative sample of 1,508 financial decision
makers living in the continental United States. Interviews were conducted via landline (nLL=906) and cell
phone (nC=602, including 309 without a landline phone). The survey was conducted by
Princeton Survey Research Associates International. The interviews were administered in English and
Spanish by Princeton Data Source from May 7 to May 20, 2012. Statistical results are weighted to
correct known demographic discrepancies. The margin of sampling error for the complete set of
weighted data is ±2.9 percentage points.
Details on the design, execution and analysis of the survey are discussed below.
Design and Data Collection Procedures
Sample Design A combination of landline and cellular random digit dial (RDD) samples was used to represent all adults
in the continental United States who have access to either a landline or cellular telephone. Both samples
were provided by Survey Sampling International, LLC (SSI) according to PSRAI specifications.
Numbers for the landline sample were selected with probabilities in proportion to their share of listed
telephone households from active blocks (area code + exchange + two‐digit block number) that
contained three or more residential directory listings. The cellular sample was not list‐assisted, but was
drawn through a systematic sampling from dedicated wireless 100‐blocks and shared service 100‐blocks
with no directory‐listed landline numbers.
31
Interviews were conducted from May 7 to May 20, 2012. As many as five attempts were made to
contact every sampled telephone number. Sample was released for interviewing in replicates, which are
representative subsamples of the larger sample. Using replicates to control the release of sample ensures
that complete call procedures are followed for the entire sample. Calls were staggered over times of day
and days of the week to maximize the chance of making contact with potential respondents.
Interviewing was spread as evenly as possible across the days in field. Each telephone number was called
at least one time during the day in an attempt to complete an interview.
For the landline sample, interviewers asked to speak with the youngest adult male or female currently at
home based on a random rotation. If no male/female was available, interviewers asked to speak with
the youngest adult of the other gender. This systematic respondent selection technique has been shown
to produce samples that closely mirror the population in terms of age and gender when combined with
cell interviewing.
For the cellular sample, interviews were conducted with the person who answered the phone.
Interviewers verified that the person was an adult and in a safe place before administering the survey.
Cellular respondents were offered a post‐paid cash reimbursement for their participation.
Once a potential respondent was on the phone interviewers then identified those who make the
financial decisions in the household. A total of 1,678 contacts were made yielding 1,508 decision
makers. Respondents who were not decision makers were asked certain demographic questions
necessary for weighting the data. After the weighting, these cases were dropped.
32
Weighting and Analysis
Weighting is generally used in survey analysis to compensate for sample designs and patterns of non‐
response that might bias results. The weighting ensures that the demographic profile of the sample
matches the profile of the target population. Since no reliable parameters exist for the population of
financial decision makers, the full set of data ‐ completes plus screen‐outs ‐ was weighted to match
national adult parameters. The screen‐out cases were dropped after the weighting.
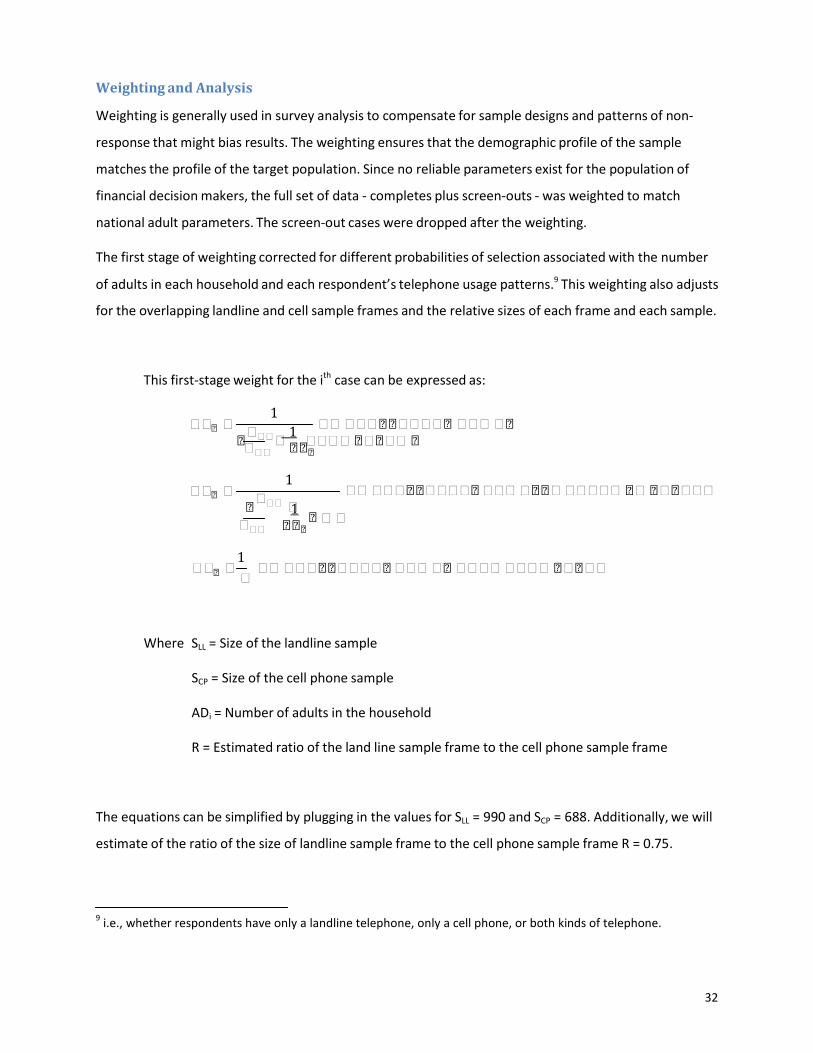
The first stage of weighting corrected for different probabilities of selection associated with the number
of adults in each household and each respondent’s telephone usage patterns.9 This weighting also adjusts
for the overlapping landline and cell sample frames and the relative sizes of each frame and each sample.
This first‐stage weight for the ith case can be expressed as:
�� � 1
��� 1 �� ������� ��� �
���� ��� ��� �
�� � 1
��� � 1
�� ������� ��� �� ����� � ����
��� � �
1 �� �
� �� ������� ��� � ���� ���� ���
Where SLL = Size of the landline sample
SCP = Size of the cell phone sample
ADi = Number of adults in the household
R = Estimated ratio of the land line sample frame to the cell phone sample frame
The equations can be simplified by plugging in the values for SLL = 990 and SCP = 688. Additionally, we will
estimate of the ratio of the size of landline sample frame to the cell phone sample frame R = 0.75.
9 i.e., whether respondents have only a landline telephone, only a cell phone, or both kinds of telephone.
33
The second stage of weighting balances sample demographics to population parameters. The sample is
balanced to match national population parameters for sex, age, education, race, Hispanic origin, region
(U.S. Census definitions), population density, number of adults in the household, and telephone usage.
The Hispanic origin was split out based on nativity; U.S born and non‐U.S. born. The basic weighting
parameters came from a special analysis of the Census Bureau’s 2011 Annual Social and Economic
Supplement (ASEC) that included all households in the United States. The population density parameter
was derived from Census 2000 data. The cell phone usage parameter came from an analysis of the
January‐June 2011 National Health Interview Survey.10
Weighting was accomplished using Sample Balancing, a special iterative sample weighting program that
simultaneously balances the distributions of all variables using a statistical technique called the Deming
Algorithm. Weights were trimmed to prevent individual interviews from having too much influence on
the final results. The use of these weights in statistical analysis ensures that the demographic
characteristics of the sample closely approximate the demographic characteristics of the national
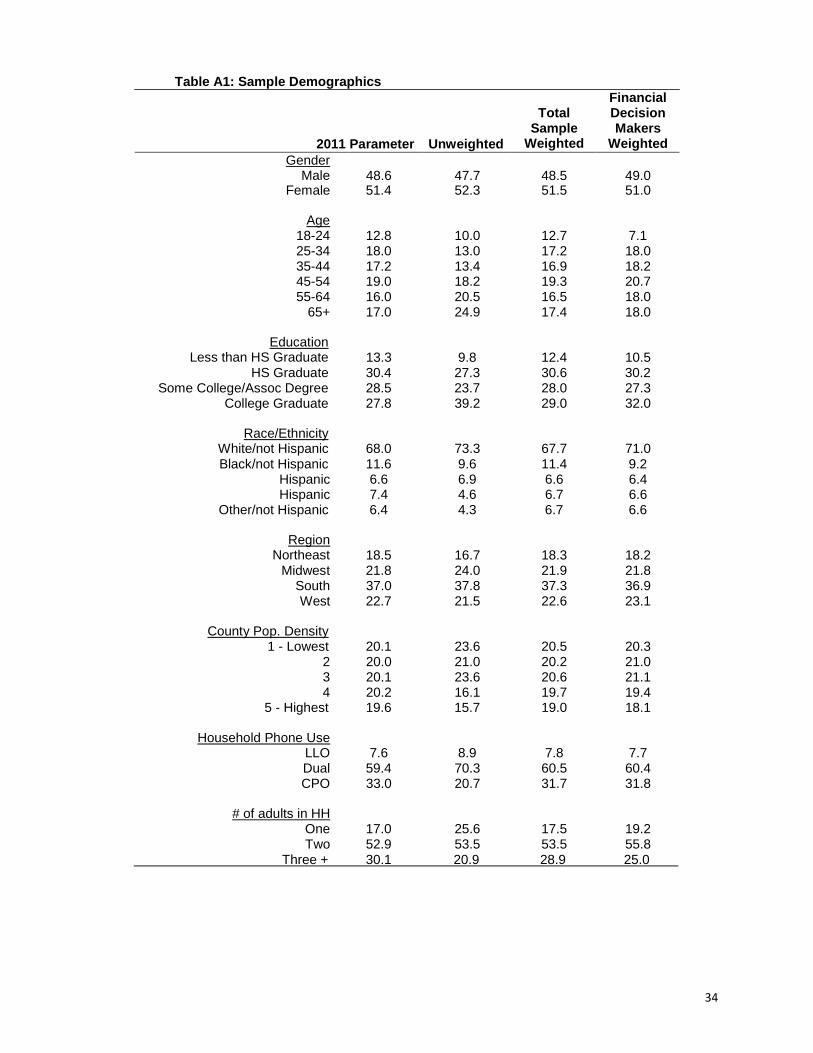
population. Table A1 compares weighted and unweighted sample distributions to population
parameters. It also shows the final weighted demographics of financial decision makers once the
screen‐outs were dropped.
10 Blumberg SJ, Luke JV. Wireless substitution: Early release of estimates from the National Health Interview Survey, January‐June, 2011. National Center for Health Statistics. Dec 2011.
34
Table A1: Sample Demographics
2011 Parameter Unweighted
Total Sample
Weighted
Financial Decision Makers
Weighted
Gender Male
48.6
47.7
48.5
49.0
Female 51.4 52.3 51.5 51.0
Age 18-24
12.8
10.0
12.7
7.1 25-34 18.0 13.0 17.2 18.0 35-44 17.2 13.4 16.9 18.2 45-54 19.0 18.2 19.3 20.7 55-64 16.0 20.5 16.5 18.0
65+ 17.0 24.9 17.4 18.0
Education Less than HS Graduate
13.3
9.8
12.4
10.5 HS Graduate 30.4 27.3 30.6 30.2
Some College/Assoc Degree 28.5 23.7 28.0 27.3 College Graduate 27.8 39.2 29.0 32.0
Race/Ethnicity White/not Hispanic
68.0
73.3
67.7
71.0 Black/not Hispanic 11.6 9.6 11.4 9.2
Hispanic 6.6 6.9 6.6 6.4 Hispanic 7.4 4.6 6.7 6.6
Other/not Hispanic 6.4 4.3 6.7 6.6
Region Northeast
18.5
16.7
18.3
18.2 Midwest 21.8 24.0 21.9 21.8
South 37.0 37.8 37.3 36.9 West 22.7 21.5 22.6 23.1
County Pop. Density 1 - Lowest
20.1
23.6
20.5
20.3 2 20.0 21.0 20.2 21.0 3 20.1 23.6 20.6 21.1 4 20.2 16.1 19.7 19.4
5 - Highest 19.6 15.7 19.0 18.1
Household Phone Use LLO
7.6
8.9
7.8
7.7 Dual 59.4 70.3 60.5 60.4 CPO 33.0 20.7 31.7 31.8
# of adults in HH One
17.0
25.6
17.5
19.2 Two 52.9 53.5 53.5 55.8
Three + 30.1 20.9 28.9 25.0
35
i
=
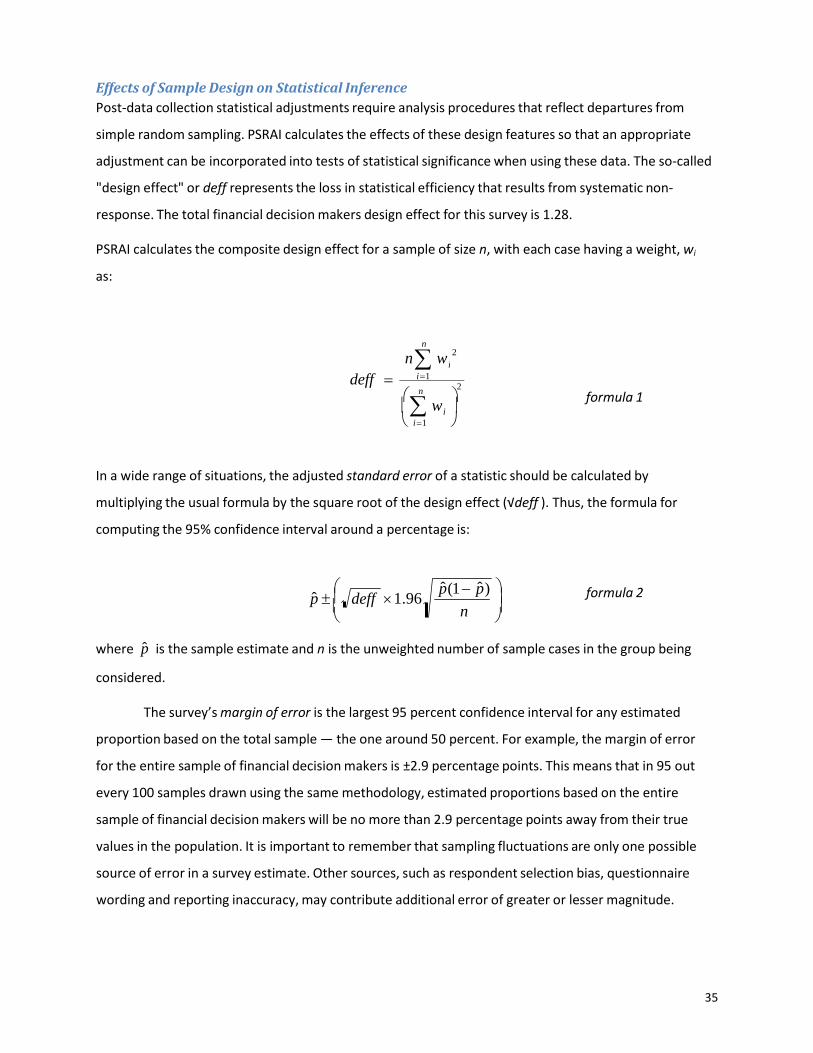
Effects of Sample Design on Statistical Inference Post‐data collection statistical adjustments require analysis procedures that reflect departures from
simple random sampling. PSRAI calculates the effects of these design features so that an appropriate
adjustment can be incorporated into tests of statistical significance when using these data. The so‐called
"design effect" or deff represents the loss in statistical efficiency that results from systematic non‐
response. The total financial decision makers design effect for this survey is 1.28.
PSRAI calculates the composite design effect for a sample of size n, with each case having a weight, wi
as:
deff
n
n ∑ w 2
i =1 2
n formula 1 ∑ wi i =1
In a wide range of situations, the adjusted standard error of a statistic should be calculated by
multiplying the usual formula by the square root of the design effect (√deff ). Thus, the formula for
computing the 95% confidence interval around a percentage is:
p̂ ±
deff
× 1.96 p̂ (1 − p̂ )
formula 2
n
where p̂ is the sample estimate and n is the unweighted number of sample cases in the group being
considered.
The survey’s margin of error is the largest 95 percent confidence interval for any estimated
proportion based on the total sample — the one around 50 percent. For example, the margin of error
for the entire sample of financial decision makers is ±2.9 percentage points. This means that in 95 out
every 100 samples drawn using the same methodology, estimated proportions based on the entire
sample of financial decision makers will be no more than 2.9 percentage points away from their true
values in the population. It is important to remember that sampling fluctuations are only one possible
source of error in a survey estimate. Other sources, such as respondent selection bias, questionnaire
wording and reporting inaccuracy, may contribute additional error of greater or lesser magnitude.
36
Response Rate
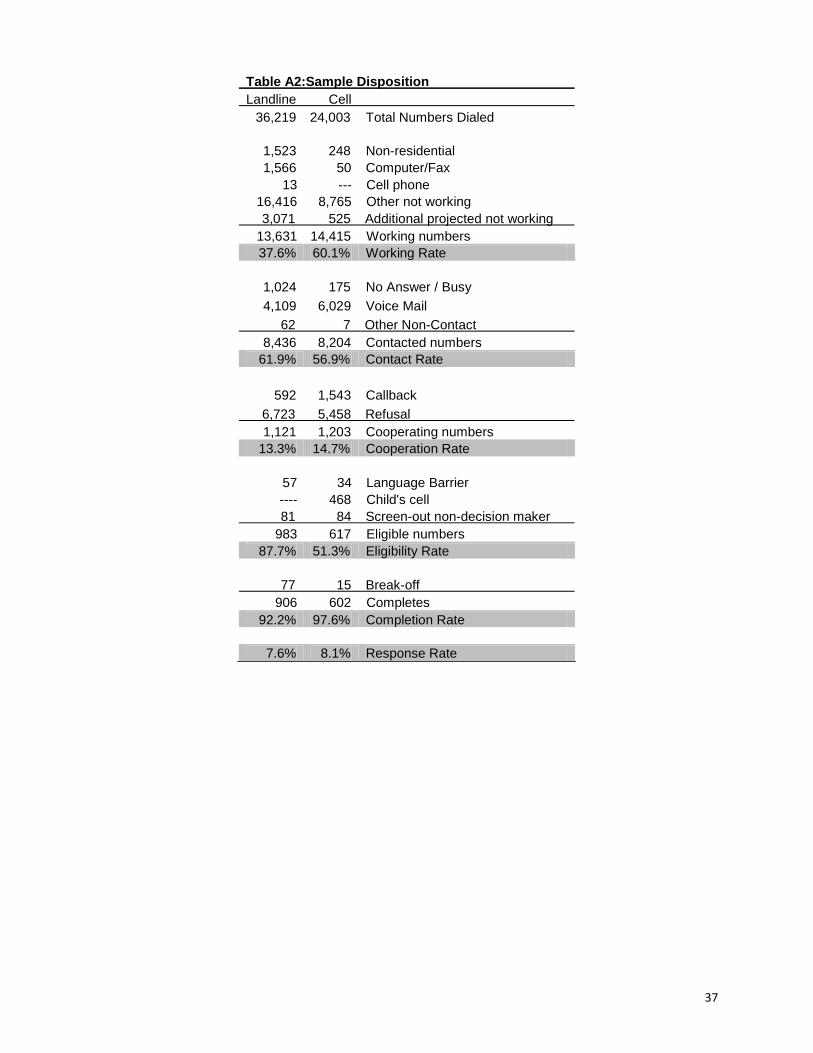
Table A2 reports the disposition of all sampled telephone numbers ever dialed from the original
telephone number samples. The response rate estimates the fraction of all eligible sample that was
ultimately interviewed. At PSRAI it is calculated by taking the product of three component rates:11
• Contact rate – the proportion of working numbers where a request for interview was
made12
• Cooperation rate – the proportion of contacted numbers where a consent for interview
was at least initially obtained, versus those refused
• Completion rate – the proportion of initially cooperating and eligible interviews that
were completed
Thus the response rate for the landline samples was eight percent. The response rate for the cellular
samples was eight percent.
11 PSRAI’s disposition codes and reporting are consistent with the American Association for Public Opinion Research standards. 12 PSRAI assumes that 75 percent of cases that result in a constant disposition of “No answer” or “Busy” are actually not working numbers.
37
Table A2:Sample Disposition Landline Cell
36,219 24,003 Total Numbers Dialed
1,523 248 Non-residential 1,566 50 Computer/Fax
13 --- Cell phone 16,416 8,765 Other not working
3,071 525 Additional projected not working 13,631 14,415 Working numbers 37.6% 60.1% Working Rate
1,024 175 No Answer / Busy 4,109 6,029 Voice Mail
62 7 Other Non-Contact 8,436 8,204 Contacted numbers
61.9% 56.9% Contact Rate
592 1,543 Callback
6,723 5,458 Refusal 1,121 1,203 Cooperating numbers
13.3% 14.7% Cooperation Rate
57 34 Language Barrier ---- 468 Child's cell
81 84 Screen-out non-decision maker 983 617 Eligible numbers
87.7% 51.3% Eligibility Rate
77 15 Break-off 906 602 Completes
92.2% 97.6% Completion Rate
7.6% 8.1% Response Rate
38
TOPLINE
2012 HOUSEHOLD FINANCIAL PLANNING SURVEY
Princeton Survey Research Associates International for CFP Board and tConsumer Federation of America
Final Topline June 11, 2012
N=1,508 Household Financial Decision‐Makers, age 18 or older (margin of error: +/‐ 3 percentage points)
Dates of interviewing: May 7‐20, 2012
Notes: Percentage totals may not equal 100% due to rounding * = less than .5% reporting
LANDLINE INTRO:
Hello, my name is and I'm calling for Princeton Survey Research. We’re conducting a national OPINION study offering you the opportunity to share your thoughts about some important issues facing Americans today. RANDOMIZE RESPONDENT SELECTION ‐ DO NOT RANDOMIZE BY FORM: “May I please speak with the ADULT MALE, age 18 or older, who had the most recent birthday and is now at home?” AND “May I please speak with the ADULT FEMALE, age 18 or older, who had the most recent birthday and is now at home?” IF NO MALE/FEMALE ASK: May I please speak with the ADULT FEMALE/MALE, age 18 or older, who had the most recent birthday and is now at home? [WHEN ELIGIBLE RESPONDENT IS ON THE LINE, GO TO SEX/FDM SCREENER QUESTION]
CELL PHONE INTRO: Hello, I am calling for Princeton Survey Research. We are conducting a national OPINION study offering you the opportunity to share your thoughts about some important issues facing American families. I know I am calling you on your cell phone. If you’d like to be reimbursed for your cell phone minutes, we will pay all eligible respondents $5 for participating in this survey. This is not a sales call. (IF R SAYS DRIVING/UNABLE TO TAKE CALL: Thank you. We will try you another time...)
39
CELL PHONE SCREENING INTERVIEW: S1. Are you under 18 years old, OR are you 18 or older?
IF under 18, THANK AND TERMINATE: This study is limited to adults age 18 and over. I won’t take any more of your time...
READ TO ALL CELL PHONE ‐ INTRODUCTION TO MAIN INTERVIEW: If you are now driving a car or doing any activity requiring your full attention, I need to call you back later... [GO TO SEX IN FINANCIAL DECISION MAKER SCREENING QUESTION]
INTERVIEWER: If R says it is not a good time, try to arrange a time to call back.
QA. Here’s my first question… Overall, are you satisfied or dissatisfied with the way things are going in your life today?
75 Satisfied 22 Dissatisfied
3 (DO NOT READ) Don’t know/Refused
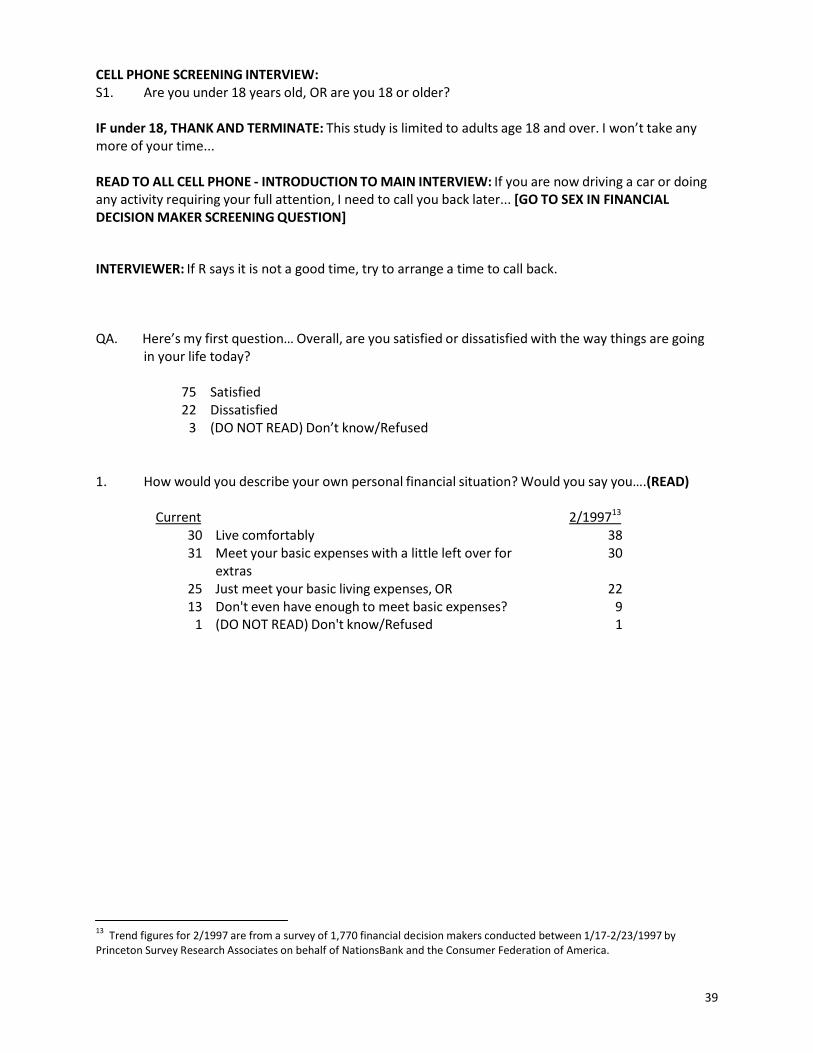
1. How would you describe your own personal financial situation? Would you say you….(READ)
Current 2/199713
30 Live comfortably 38 31 Meet your basic expenses with a little left over for 30
extras 25 Just meet your basic living expenses, OR 22 13 Don't even have enough to meet basic expenses? 9
1 (DO NOT READ) Don't know/Refused 1
13 Trend figures for 2/1997 are from a survey of 1,770 financial decision makers conducted between 1/17‐2/23/1997 by Princeton Survey Research Associates on behalf of NationsBank and the Consumer Federation of America.
40
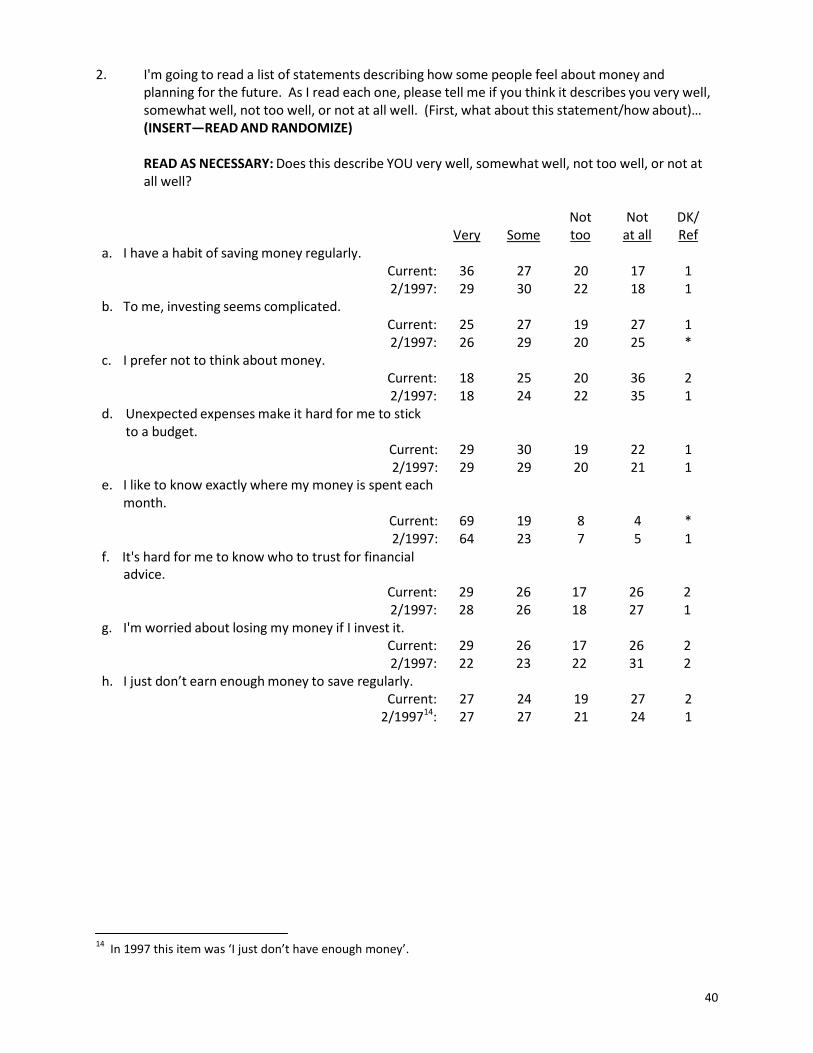
2. I'm going to read a list of statements describing how some people feel about money and planning for the future. As I read each one, please tell me if you think it describes you very well, somewhat well, not too well, or not at all well. (First, what about this statement/how about)… (INSERT—READ AND RANDOMIZE)
READ AS NECESSARY: Does this describe YOU very well, somewhat well, not too well, or not at all well?
Very
Some Not too
Not at all
DK/ Ref
a. I have a habit of saving money regularly. Current: 36 27 20 17 1 2/1997: 29 30 22 18 1 b. To me, investing seems complicated. Current: 25 27 19 27 1 2/1997: 26 29 20 25 * c. I prefer not to think about money. Current: 18 25 20 36 2 2/1997: 18 24 22 35 1 d. Unexpected expenses make it hard for me to stick to a budget. Current: 29 30 19 22 1 2/1997: 29 29 20 21 1 e. I like to know exactly where my money is spent each month.
Current: 69 19 8 4 * 2/1997: 64 23 7 5 1
f. It's hard for me to know who to trust for financial advice.
Current: 29 26 17 26 2 2/1997: 28 26 18 27 1
g. I'm worried about losing my money if I invest it. Current: 29 26 17 26 2 2/1997: 22 23 22 31 2
h. I just don’t earn enough money to save regularly. Current: 27 24 19 27 2
2/199714: 27 27 21 24 1
14 In 1997 this item was ‘I just don’t have enough money’.
41
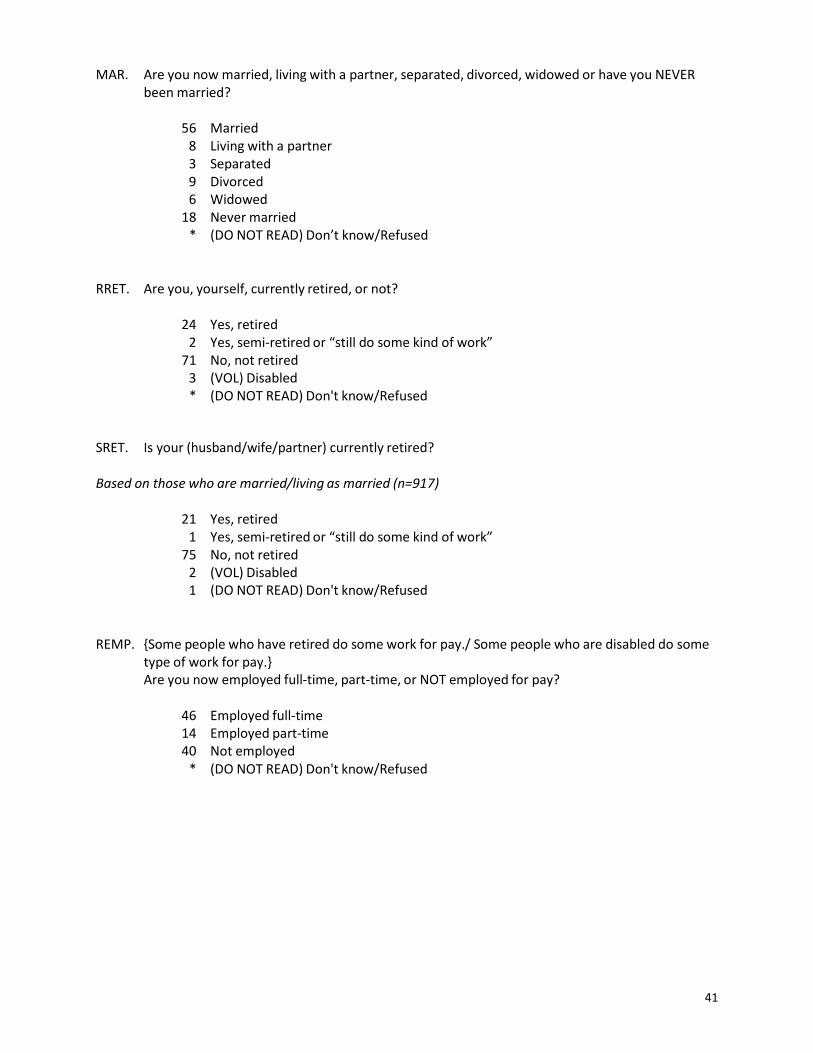
MAR. Are you now married, living with a partner, separated, divorced, widowed or have you NEVER been married?
56 Married
8 Living with a partner 3 Separated 9 Divorced 6 Widowed
18 Never married * (DO NOT READ) Don’t know/Refused
RRET. Are you, yourself, currently retired, or not?
24 Yes, retired 2 Yes, semi‐retired or “still do some kind of work”
71 No, not retired 3 (VOL) Disabled * (DO NOT READ) Don't know/Refused
SRET. Is your (husband/wife/partner) currently retired?
Based on those who are married/living as married (n=917)
21 Yes, retired 1 Yes, semi‐retired or “still do some kind of work”
75 No, not retired 2 (VOL) Disabled 1 (DO NOT READ) Don't know/Refused
REMP. {Some people who have retired do some work for pay./ Some people who are disabled do some type of work for pay.} Are you now employed full‐time, part‐time, or NOT employed for pay?
46 Employed full‐time 14 Employed part‐time 40 Not employed
* (DO NOT READ) Don't know/Refused
42
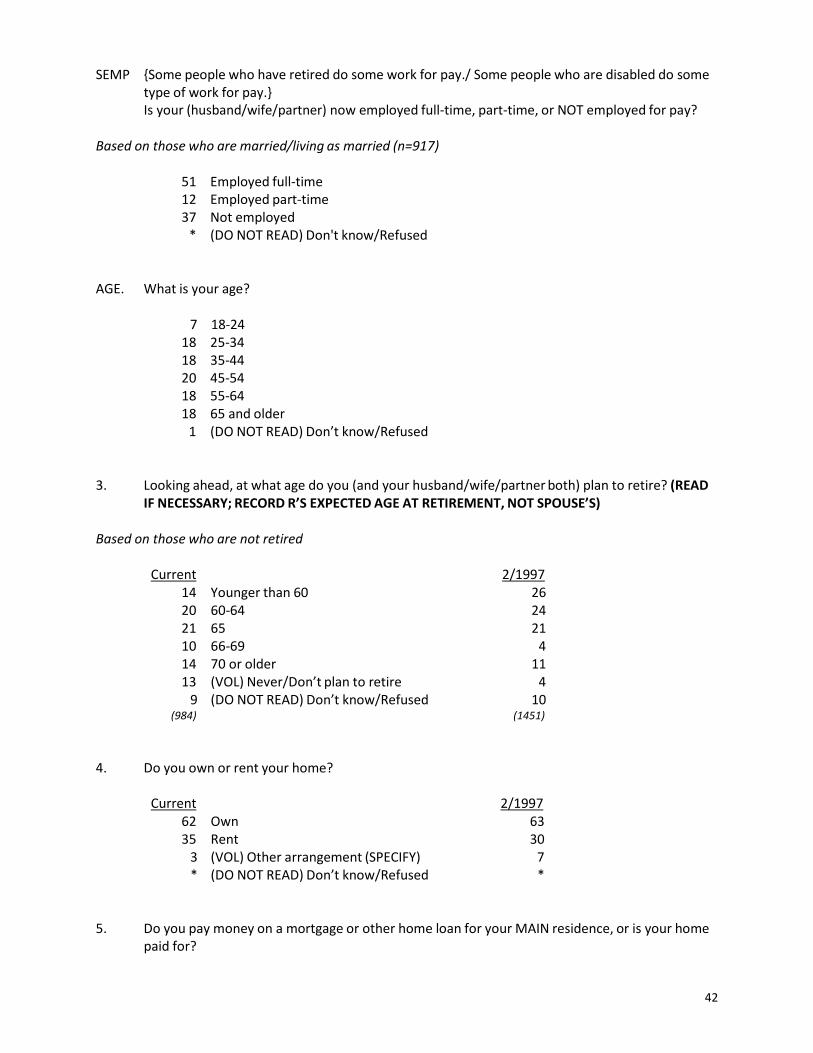
SEMP {Some people who have retired do some work for pay./ Some people who are disabled do some type of work for pay.} Is your (husband/wife/partner) now employed full‐time, part‐time, or NOT employed for pay?
Based on those who are married/living as married (n=917)
51 Employed full‐time 12 Employed part‐time 37 Not employed
* (DO NOT READ) Don't know/Refused
AGE. What is your age?
7 18‐24 18 25‐34 18 35‐44 20 45‐54 18 55‐64 18 65 and older
1 (DO NOT READ) Don’t know/Refused
3. Looking ahead, at what age do you (and your husband/wife/partner both) plan to retire? (READ IF NECESSARY; RECORD R’S EXPECTED AGE AT RETIREMENT, NOT SPOUSE’S)
Based on those who are not retired
Current 2/1997
14 Younger than 60 26 20 60‐64 24 21 65 21 10 66‐69 4 14 70 or older 11 13 (VOL) Never/Don’t plan to retire 4
9 (DO NOT READ) Don’t know/Refused 10 (984) (1451)
4. Do you own or rent your home?
Current 2/1997 62 Own 63 35 Rent 30
3 (VOL) Other arrangement (SPECIFY) 7 * (DO NOT READ) Don’t know/Refused *
5. Do you pay money on a mortgage or other home loan for your MAIN residence, or is your home paid for?
43
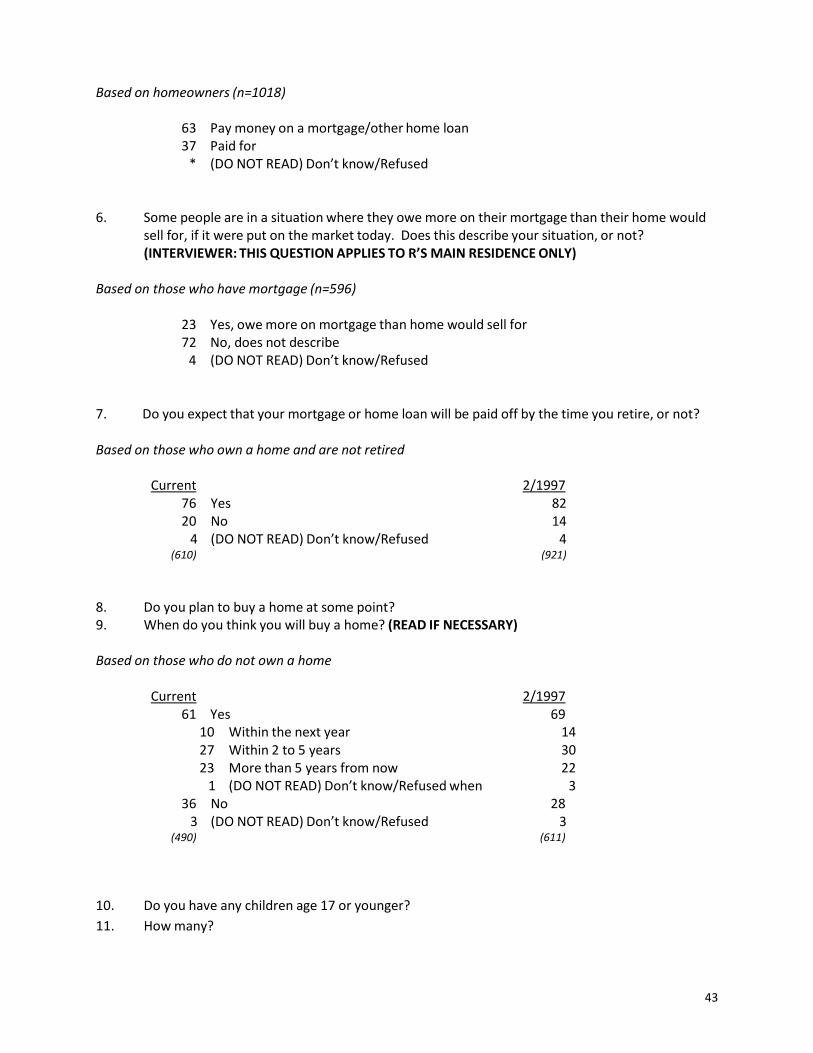
Based on homeowners (n=1018)
63 Pay money on a mortgage/other home loan 37 Paid for
* (DO NOT READ) Don’t know/Refused
6. Some people are in a situation where they owe more on their mortgage than their home would sell for, if it were put on the market today. Does this describe your situation, or not? (INTERVIEWER: THIS QUESTION APPLIES TO R’S MAIN RESIDENCE ONLY)
Based on those who have mortgage (n=596)
23 Yes, owe more on mortgage than home would sell for 72 No, does not describe
4 (DO NOT READ) Don’t know/Refused
7. Do you expect that your mortgage or home loan will be paid off by the time you retire, or not?
Based on those who own a home and are not retired
Current 2/1997 76 Yes 82 20 No 14
4 (DO NOT READ) Don’t know/Refused 4 (610) (921)
8. Do you plan to buy a home at some point? 9. When do you think you will buy a home? (READ IF NECESSARY)
Based on those who do not own a home
Current 2/1997
61 Yes 69 10 Within the next year 14 27 Within 2 to 5 years 30 23 More than 5 years from now 22
1 (DO NOT READ) Don’t know/Refused when 3 36 No 28
3 (DO NOT READ) Don’t know/Refused 3 (490) (611)
10. Do you have any children age 17 or younger? 11. How many?
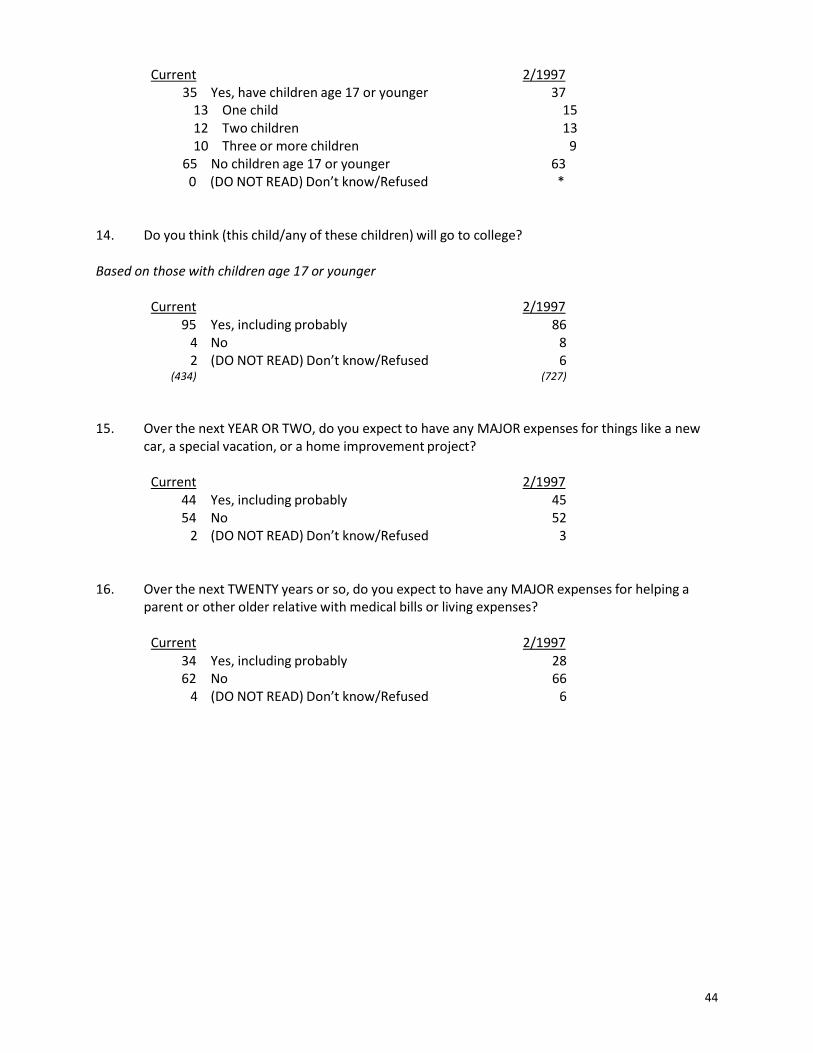
44
Current 2/1997 35 Yes, have children age 17 or younger 37
13 One child 15 12 Two children 13 10 Three or more children 9
65 No children age 17 or younger 63 0 (DO NOT READ) Don’t know/Refused *
14. Do you think (this child/any of these children) will go to college?
Based on those with children age 17 or younger
Current 2/1997 95 Yes, including probably 86
4 No 8 2 (DO NOT READ) Don’t know/Refused 6
(434) (727)
15. Over the next YEAR OR TWO, do you expect to have any MAJOR expenses for things like a new car, a special vacation, or a home improvement project?
Current 2/1997
44 Yes, including probably 45 54 No 52
2 (DO NOT READ) Don’t know/Refused 3
16. Over the next TWENTY years or so, do you expect to have any MAJOR expenses for helping a parent or other older relative with medical bills or living expenses?
Current 2/1997
34 Yes, including probably 28 62 No 66
4 (DO NOT READ) Don’t know/Refused 6
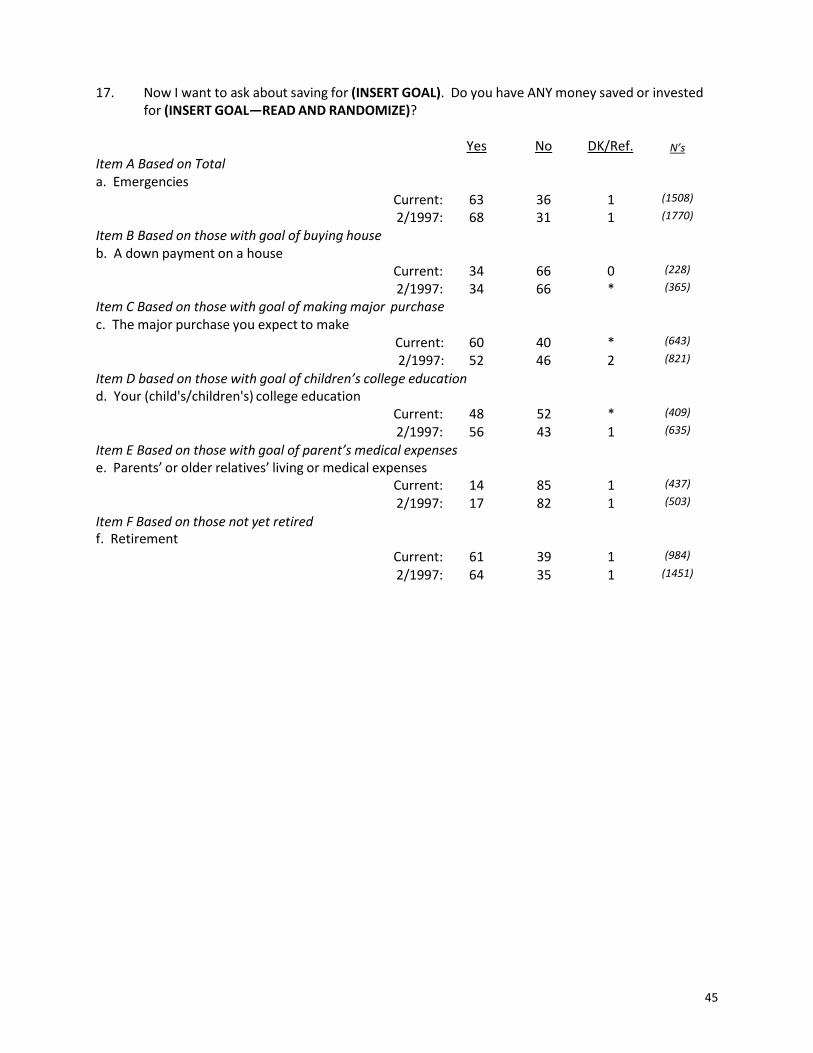
45
17. Now I want to ask about saving for (INSERT GOAL). Do you have ANY money saved or invested for (INSERT GOAL—READ AND RANDOMIZE)?
Item A Based on Total a. Emergencies
Yes No DK/Ref.
N’s
Current: 63 36 1 (1508)
2/1997: 68 31 1 (1770)
Item B Based on those with goal of buying house b. A down payment on a house
Current:
34
66
0
(228)
2/1997: 34 66 * (365)
Item C Based on those with goal of making major purchase c. The major purchase you expect to make
Current: 60 40 * (643)
2/1997: 52 46 2 (821)
Item D based on those with goal of children’s college education d. Your (child's/children's) college education
Current: 48 52 * (409)
2/1997: 56 43 1 (635)
Item E Based on those with goal of parent’s medical expenses e. Parents’ or older relatives’ living or medical expenses
Current: 14 85 1 (437)
2/1997: 17 82 1 (503)
Item F Based on those not yet retired f. Retirement
Current: 61 39 1 (984)
2/1997: 64 35 1 (1451)
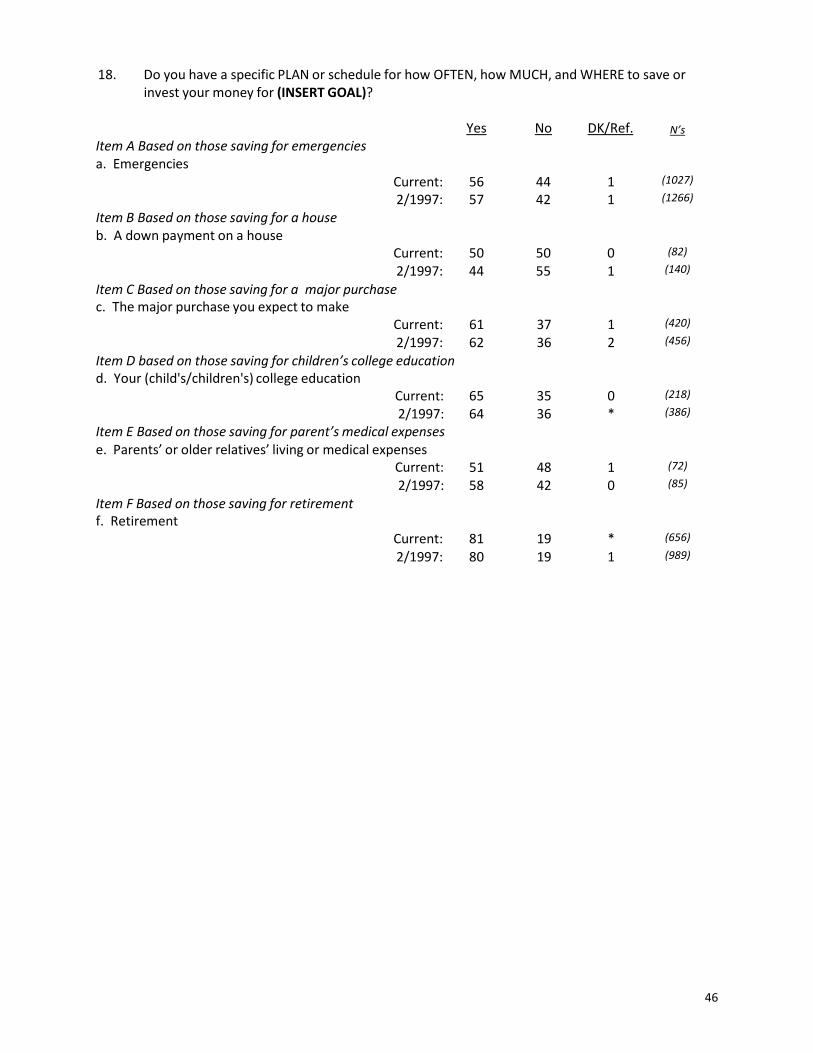
46
18. Do you have a specific PLAN or schedule for how OFTEN, how MUCH, and WHERE to save or invest your money for (INSERT GOAL)?
Item A Based on those saving for emergencies a. Emergencies
Yes No DK/Ref.
N’s
Current: 56 44 1 (1027)
2/1997: 57 42 1 (1266)
Item B Based on those saving for a house b. A down payment on a house
Current:
50
50
0
(82)
2/1997: 44 55 1 (140)
Item C Based on those saving for a major purchase c. The major purchase you expect to make
Current: 61 37 1 (420)
2/1997: 62 36 2 (456)
Item D based on those saving for children’s college education d. Your (child's/children's) college education
Current: 65 35 0 (218)
2/1997: 64 36 * (386)
Item E Based on those saving for parent’s medical expenses e. Parents’ or older relatives’ living or medical expenses
Current:
51
48
1
(72)
2/1997: 58 42 0 (85)
Item F Based on those saving for retirement f. Retirement
Current: 81 19 * (656)
2/1997: 80 19 1 (989)
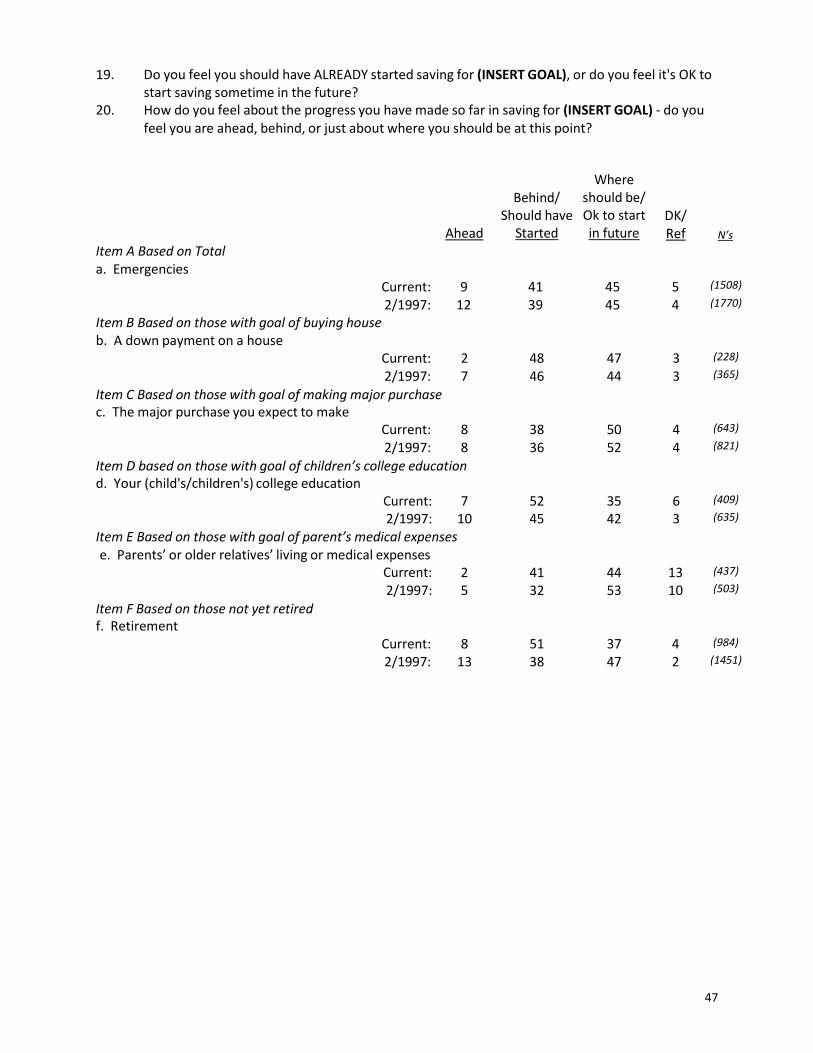
47
19. Do you feel you should have ALREADY started saving for (INSERT GOAL), or do you feel it's OK to start saving sometime in the future?
20. How do you feel about the progress you have made so far in saving for (INSERT GOAL) ‐ do you feel you are ahead, behind, or just about where you should be at this point?
Item A Based on Total a. Emergencies
Ahead
Behind/
Should have Started
Where should be/ Ok to start in future
DK/ Ref N’s
Current: 9 41 45 5 (1508) 2/1997: 12 39 45 4 (1770)
Item B Based on those with goal of buying house b. A down payment on a house
Current: 2 48 47 3 (228)
2/1997: 7 46 44 3 (365)
Item C Based on those with goal of making major purchase c. The major purchase you expect to make
Current: 8 38 50 4 (643)
2/1997: 8 36 52 4 (821)
Item D based on those with goal of children’s college education d. Your (child's/children's) college education
Current: 7 52 35 6 (409)
2/1997: 10 45 42 3 (635)
Item E Based on those with goal of parent’s medical expenses e. Parents’ or older relatives’ living or medical expenses
Current:
2
41
44
13
(437)
2/1997: 5 32 53 10 (503)
Item F Based on those not yet retired f. Retirement
Current: 8 51 37 4 (984)
2/1997: 13 38 47 2 (1451)
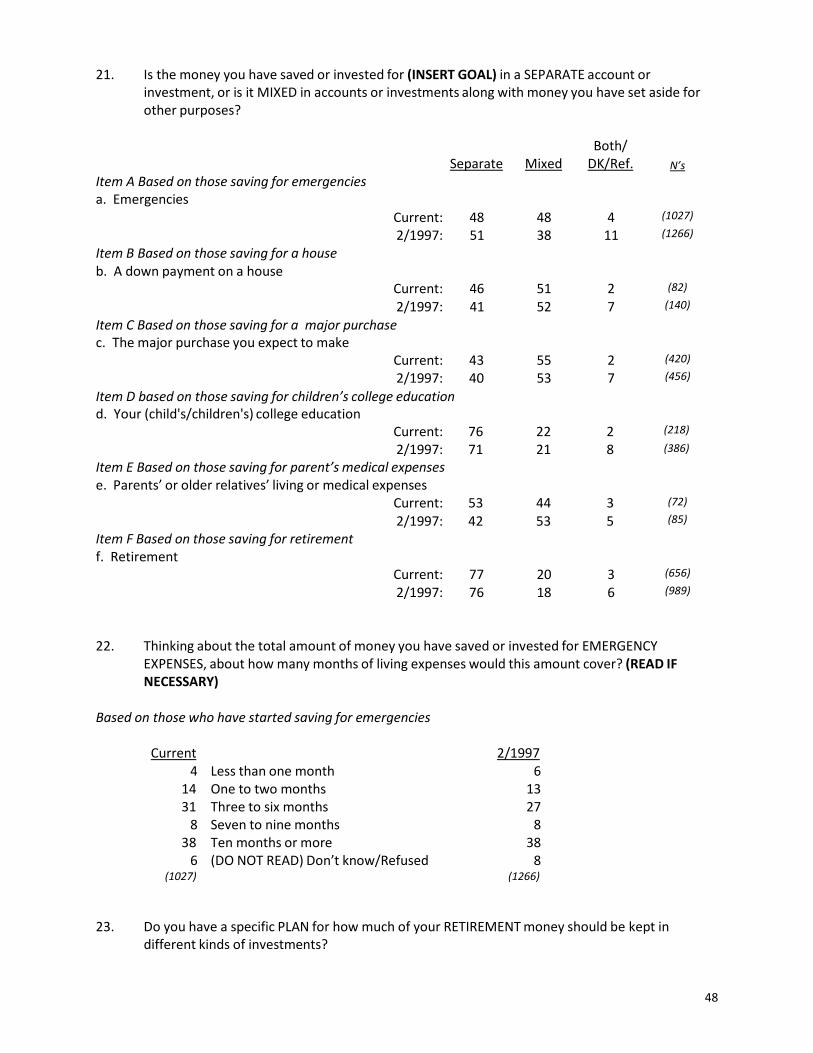
48
21. Is the money you have saved or invested for (INSERT GOAL) in a SEPARATE account or investment, or is it MIXED in accounts or investments along with money you have set aside for other purposes?
Item A Based on those saving for emergencies a. Emergencies
Separate
Mixed Both/
DK/Ref.
N’s
Current: 48 48 4 (1027)
2/1997: 51 38 11 (1266)
Item B Based on those saving for a house b. A down payment on a house
Current:
46
51
2
(82)
2/1997: 41 52 7 (140)
Item C Based on those saving for a major purchase c. The major purchase you expect to make
Current: 43 55 2 (420)
2/1997: 40 53 7 (456)
Item D based on those saving for children’s college education d. Your (child's/children's) college education
Current: 76 22 2 (218) 2/1997: 71 21 8 (386)
Item E Based on those saving for parent’s medical expenses e. Parents’ or older relatives’ living or medical expenses
Current: 53 44 3 (72) 2/1997: 42 53 5 (85)
Item F Based on those saving for retirement f. Retirement
Current: 77 20 3 (656)
2/1997: 76 18 6 (989)
22. Thinking about the total amount of money you have saved or invested for EMERGENCY EXPENSES, about how many months of living expenses would this amount cover? (READ IF NECESSARY)
Based on those who have started saving for emergencies
Current 2/1997
4 Less than one month 6 14 One to two months 13 31 Three to six months 27
8 Seven to nine months 8 38 Ten months or more 38
6 (DO NOT READ) Don’t know/Refused 8 (1027) (1266)
23. Do you have a specific PLAN for how much of your RETIREMENT money should be kept in different kinds of investments?
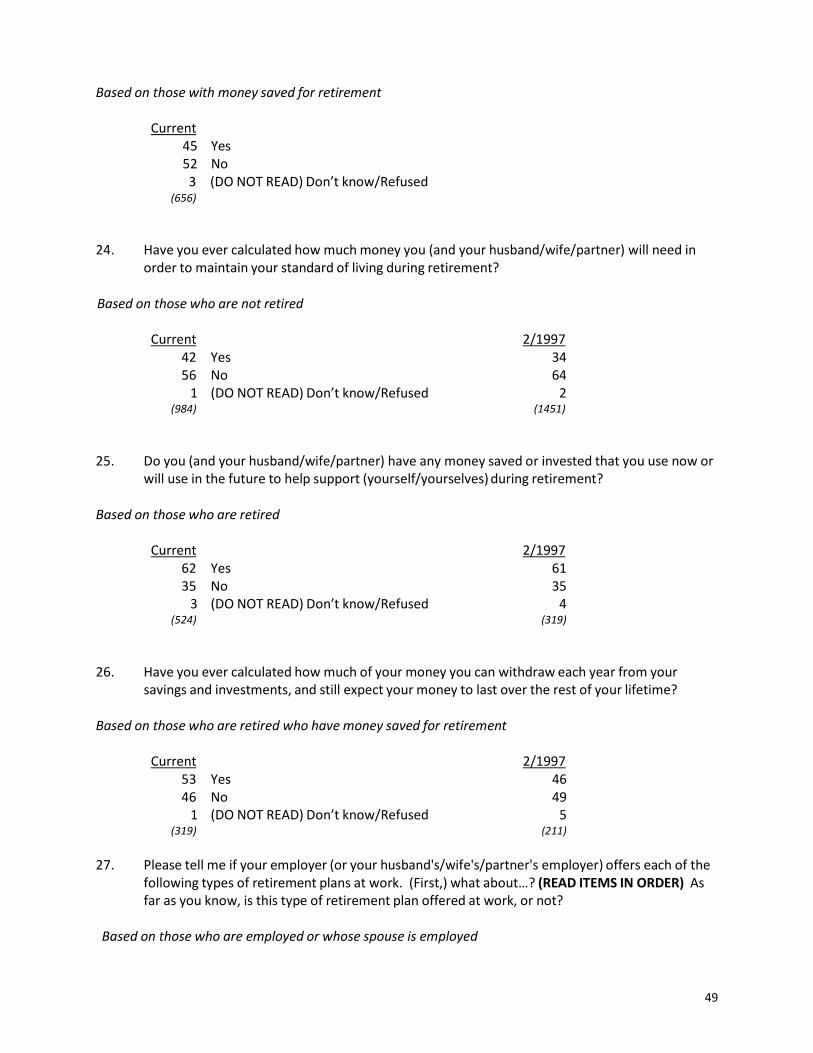
49
Based on those with money saved for retirement
Current 45 Yes 52 No 3 (DO NOT READ) Don’t know/Refused
(656)
24. Have you ever calculated how much money you (and your husband/wife/partner) will need in order to maintain your standard of living during retirement?
Based on those who are not retired
Current 2/1997
42 Yes 34 56 No 64
1 (DO NOT READ) Don’t know/Refused 2 (984) (1451)
25. Do you (and your husband/wife/partner) have any money saved or invested that you use now or will use in the future to help support (yourself/yourselves) during retirement?
Based on those who are retired
Current 2/1997
62 Yes 61 35 No 35
3 (DO NOT READ) Don’t know/Refused 4 (524) (319)
26. Have you ever calculated how much of your money you can withdraw each year from your savings and investments, and still expect your money to last over the rest of your lifetime?
Based on those who are retired who have money saved for retirement
Current 2/1997
53 Yes 46 46 No 49
1 (DO NOT READ) Don’t know/Refused 5 (319) (211)
27. Please tell me if your employer (or your husband's/wife's/partner's employer) offers each of the following types of retirement plans at work. (First,) what about…? (READ ITEMS IN ORDER) As far as you know, is this type of retirement plan offered at work, or not?
Based on those who are employed or whose spouse is employed

50
a.
A 401‐k or other retirement plan at work where
Yes No DK/Ref. N’s
YOU can make direct contributions yourself 15
Current: 67 30 3 (985)
2/1997: 55 38 7 (1383)
b. A retirement savings, pension, or profit‐sharing plan where the COMPANY or EMPLOYER makes
ALL the contributions 16
Current: 30 62 8 (985)
2/1997: 33 61 6 (1383)
c. An ESOP or employee stock ownership plan? Current: 15 79 7 (985)
2/1997: 20 74 6 (1383)
28. As I name some ways to save for retirement, please tell me whether each is something you (or your husband/wife/partner) do EVERY year, SOME years, or not at all. What about…? (READ IN ORDER) READ IF NECESSARY: Is this something you (or your husband/wife/partner) do every year, some years, or not at all?
Item A Based on those respondent or spouse are not retired a. Contribute money to an I‐R‐A account
Every Year
Some Years
Not at all
DK/ Ref N’s
Current: 22 10 66 2 (1055)
2/1997: 19 13 66 2 (1451)
Item B Based on those who have 401‐k where they can make contribution
b. Contribute to a 401‐k or other retirement plan through work 17
Current: 77 6 13 2 (677) 2/1997: 66 6 27 1 (960)
Item C Based on those respondent or spouse are not retired c. Set aside money for retirement in accounts or
investments of your own Current: 31 13 55 1 (1055)
2/1997: 31 13 54 2 (1451)
29. Do you (or your husband/wife/partner) have options for how the money in your retirement plan at work is invested, or does the company or employer make all those decisions? 18
Based on those with employer funded plan or can directly contribute
15 In 1997 this item was ‘A 401‐k plan?’ 16 In 1997 this item was ‘A pension or profit‐sharing plan where your EMPLOYER makes ALL the contributions?’ 17 In 1997 this item was ‘Contribute to a 401‐k plan or other employer pension plan?’ 18 In 1997, question wording was ‘Who makes the decisions about how the money in the employer pension plan is invested – you (or your husband/wife/partner) or the employer?’
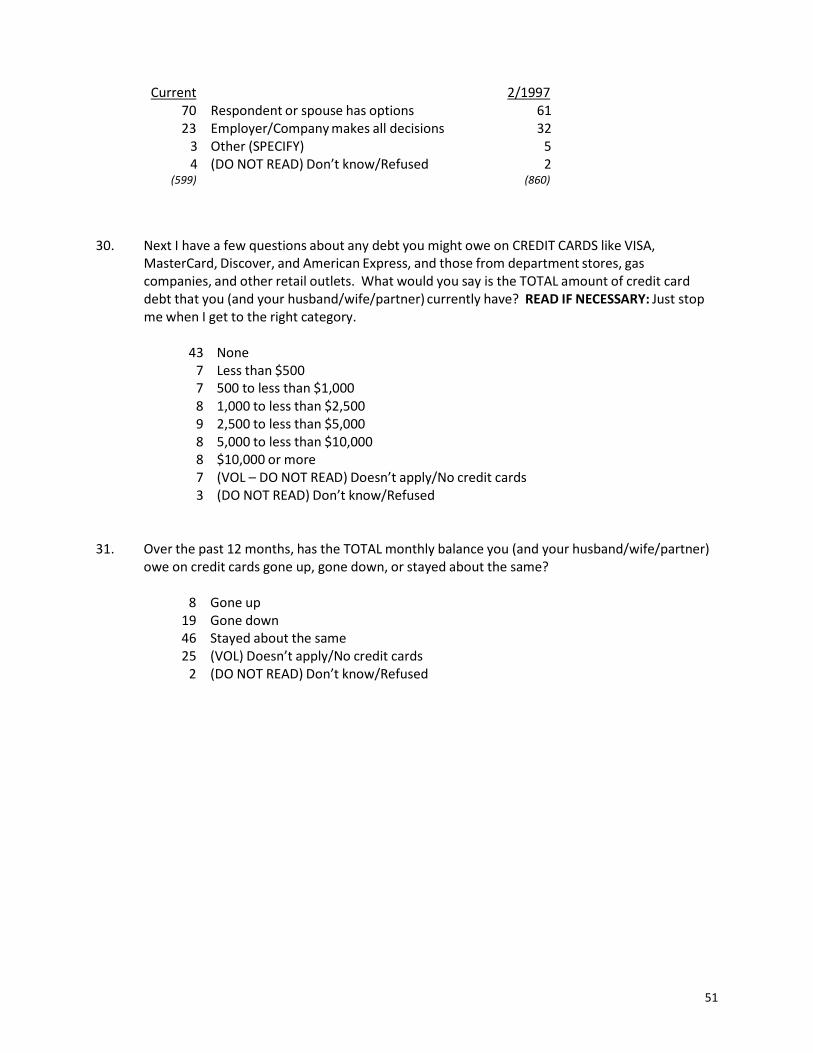
51
Current 2/1997 70 Respondent or spouse has options 61 23 Employer/Company makes all decisions 32
3 Other (SPECIFY) 5 4 (DO NOT READ) Don’t know/Refused 2
(599) (860)
30. Next I have a few questions about any debt you might owe on CREDIT CARDS like VISA, MasterCard, Discover, and American Express, and those from department stores, gas companies, and other retail outlets. What would you say is the TOTAL amount of credit card debt that you (and your husband/wife/partner) currently have? READ IF NECESSARY: Just stop me when I get to the right category.
43 None
7 Less than $500 7 500 to less than $1,000 8 1,000 to less than $2,500 9 2,500 to less than $5,000 8 5,000 to less than $10,000 8 $10,000 or more 7 (VOL – DO NOT READ) Doesn’t apply/No credit cards 3 (DO NOT READ) Don’t know/Refused
31. Over the past 12 months, has the TOTAL monthly balance you (and your husband/wife/partner) owe on credit cards gone up, gone down, or stayed about the same?
8 Gone up
19 Gone down 46 Stayed about the same 25 (VOL) Doesn’t apply/No credit cards
2 (DO NOT READ) Don’t know/Refused
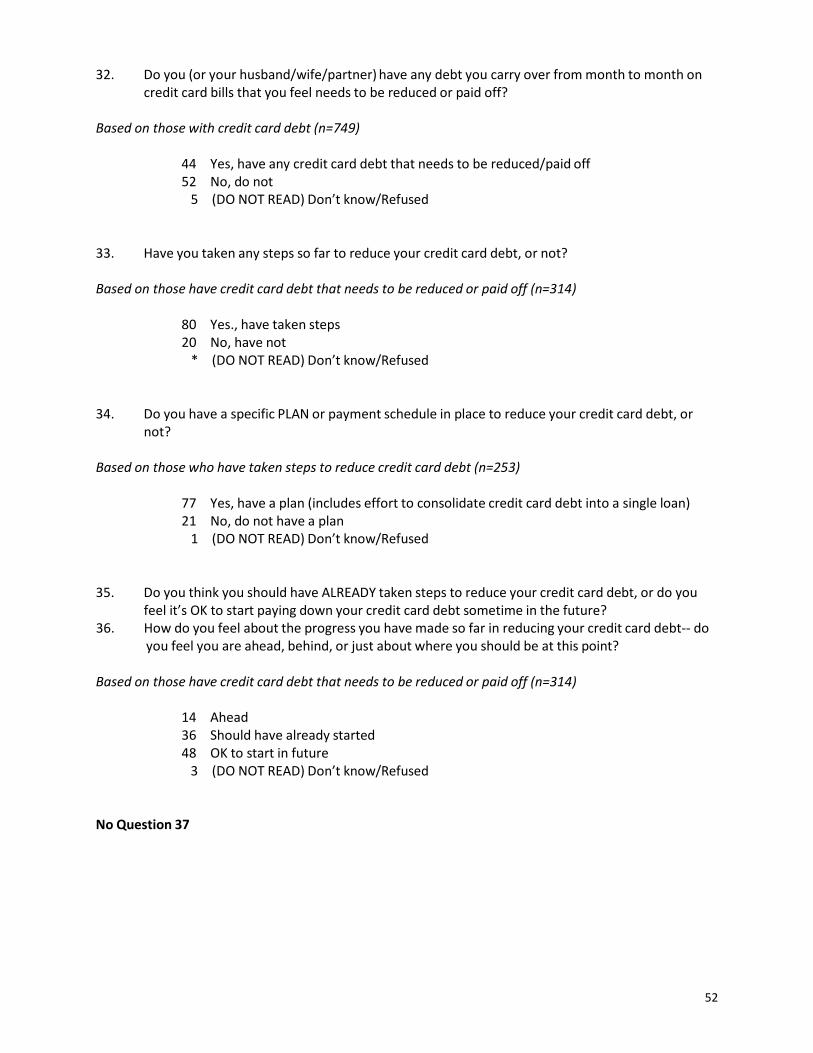
52
32. Do you (or your husband/wife/partner) have any debt you carry over from month to month on credit card bills that you feel needs to be reduced or paid off?
Based on those with credit card debt (n=749)
44 Yes, have any credit card debt that needs to be reduced/paid off 52 No, do not
5 (DO NOT READ) Don’t know/Refused
33. Have you taken any steps so far to reduce your credit card debt, or not?
Based on those have credit card debt that needs to be reduced or paid off (n=314)
80 Yes., have taken steps 20 No, have not
* (DO NOT READ) Don’t know/Refused
34. Do you have a specific PLAN or payment schedule in place to reduce your credit card debt, or not?
Based on those who have taken steps to reduce credit card debt (n=253)
77 Yes, have a plan (includes effort to consolidate credit card debt into a single loan) 21 No, do not have a plan
1 (DO NOT READ) Don’t know/Refused
35. Do you think you should have ALREADY taken steps to reduce your credit card debt, or do you feel it’s OK to start paying down your credit card debt sometime in the future?
36. How do you feel about the progress you have made so far in reducing your credit card debt‐‐ do you feel you are ahead, behind, or just about where you should be at this point?
Based on those have credit card debt that needs to be reduced or paid off (n=314)
14 Ahead 36 Should have already started 48 OK to start in future
3 (DO NOT READ) Don’t know/Refused
No Question 37
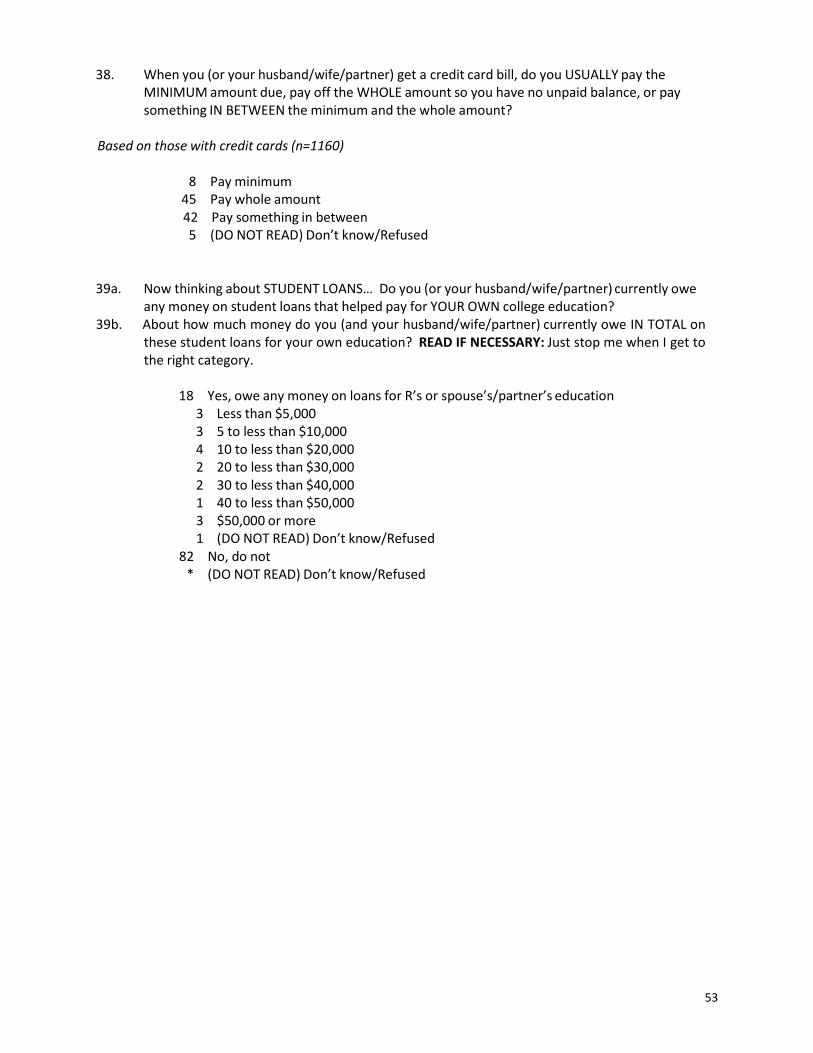
53
38. When you (or your husband/wife/partner) get a credit card bill, do you USUALLY pay the MINIMUM amount due, pay off the WHOLE amount so you have no unpaid balance, or pay something IN BETWEEN the minimum and the whole amount?
Based on those with credit cards (n=1160)
8 Pay minimum
45 Pay whole amount 42 Pay something in between 5 (DO NOT READ) Don’t know/Refused
39a. Now thinking about STUDENT LOANS… Do you (or your husband/wife/partner) currently owe any money on student loans that helped pay for YOUR OWN college education?
39b. About how much money do you (and your husband/wife/partner) currently owe IN TOTAL on these student loans for your own education? READ IF NECESSARY: Just stop me when I get to the right category.
18 Yes, owe any money on loans for R’s or spouse’s/partner’s education
3 Less than $5,000 3 5 to less than $10,000 4 10 to less than $20,000 2 20 to less than $30,000 2 30 to less than $40,000 1 40 to less than $50,000 3 $50,000 or more 1 (DO NOT READ) Don’t know/Refused
82 No, do not * (DO NOT READ) Don’t know/Refused
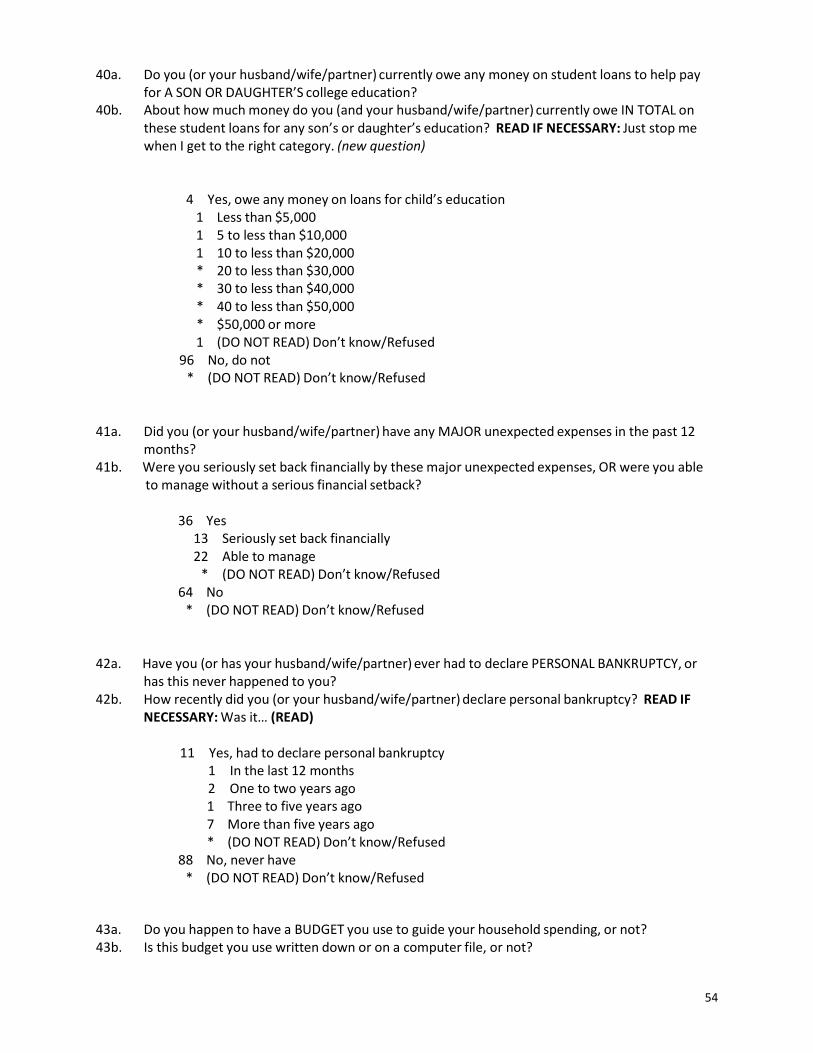
54
40a. Do you (or your husband/wife/partner) currently owe any money on student loans to help pay for A SON OR DAUGHTER’S college education?
40b. About how much money do you (and your husband/wife/partner) currently owe IN TOTAL on these student loans for any son’s or daughter’s education? READ IF NECESSARY: Just stop me when I get to the right category. (new question)
4 Yes, owe any money on loans for child’s education 1 Less than $5,000 1 5 to less than $10,000 1 10 to less than $20,000 * 20 to less than $30,000 * 30 to less than $40,000 * 40 to less than $50,000 * $50,000 or more 1 (DO NOT READ) Don’t know/Refused
96 No, do not * (DO NOT READ) Don’t know/Refused
41a. Did you (or your husband/wife/partner) have any MAJOR unexpected expenses in the past 12 months?
41b. Were you seriously set back financially by these major unexpected expenses, OR were you able to manage without a serious financial setback?
36 Yes
13 Seriously set back financially 22 Able to manage
* (DO NOT READ) Don’t know/Refused 64 No
* (DO NOT READ) Don’t know/Refused
42a. Have you (or has your husband/wife/partner) ever had to declare PERSONAL BANKRUPTCY, or has this never happened to you?
42b. How recently did you (or your husband/wife/partner) declare personal bankruptcy? READ IF NECESSARY: Was it… (READ)
11 Yes, had to declare personal bankruptcy
1 In the last 12 months 2 One to two years ago 1 Three to five years ago 7 More than five years ago * (DO NOT READ) Don’t know/Refused
88 No, never have * (DO NOT READ) Don’t know/Refused
43a. Do you happen to have a BUDGET you use to guide your household spending, or not? 43b. Is this budget you use written down or on a computer file, or not?
55
59 Yes, have a budget 36 Yes, written down or on computer file 23 Not written down
* (DO NOT READ) Don’t know/Refused 40 No
* (DO NOT READ) Don’t know/Refused
44. Whether you have a household budget or not, do you have a reasonably good idea of how much money you (and your husband/wife/partner) can spend each month without going into debt or having to withdraw money from savings?
85 Yes, have a good idea 12 No, do not
2 (DO NOT READ) Don’t know/Refused
45. About what percent of your income are you (and your husband/wife/partner) able to put into savings or investments each year? Please make sure to count any money added each year to an I‐R‐A, 401‐k or other retirement account by you or an employer. READ IF NECESSARY: Just stop me when I get to the right category. Would you say… (READ)
26 None 10 1 to 2 percent of your income 13 3 to 5 percent
7 6 to 9 percent 19 10 to 15 percent
6 16 to 20 percent, OR 9 More than 20 percent or your income?
10 (DO NOT READ) Don’t know/Refused
46. Considering your current income and the money you need to cover regular bills and other financial obligations, in general, do you think you (and your husband/wife/partner) spend too much money, are too conservative and could easily afford to spend more, or that you are spending about the right amount?
18 Spend too much
8 Too conservative/Could easily afford to spend more 71 About the right amount
3 (DO NOT READ) Don’t know/Refused
56
47. How confident are you that you are making the best choices for how to manage your money, savings and investments‐‐ very confident, somewhat confident, not too confident, or not confident at all?
Total Current
Savers 2/199719
36 Very confident 36 35 47 Somewhat confident 50 49 10 Not too confident 9 10
5 Not confident at all 3 4 2 (DO NOT READ) Don’t know/Refused 1 2
(1244) (1533)
48. Have you (or your husband/wife/partner) ever prepared a comprehensive financial plan for yourself or had a professional prepare one for you? By financial plan, I mean a document that includes savings and investments, planning for retirement, and insurance needs, not just a simple household budget.
Total Current
Savers 2/1997 31 Yes, have a plan 36 32 69 No, have not 63 67
1 (DO NOT READ) Don’t know/Refused 1 1 (1244) (1533)
49. How likely is it that you (or your husband/wife/partner) will prepare a comprehensive financial plan yourself or have one prepared for you IN THE NEXT 12 MONTHS? Would you say it is READ:
Based on those who have never had a financial plan (n=971)
6 Very likely
14 Somewhat likely 24 Not too likely, OR 55 Not at all likely?
* (DO NOT READ) Don’t know/Refused
19 2012 based on ‘Savers’ defined as those who have any money saved for any of the six goals asked about in survey (n=1244). 1997 trend figures are based on ‘Savers’ only (n=1533)
57
58. Thinking about the amount of LIFE INSURANCE you now have to protect you and other family members if a family member were to die – would you say you have enough, some, or none?
49 Enough 18 Some 30 None
1 (VOL) Doesn’t apply 2 (DO NOT READ) Don’t know/Refused
59. And what about the amount of insurance you now have on your HOME OR PROPERTY to protect against loss in the event of fire, flood, or other disaster – would you say you have enough, some or none?
66 Enough 10 Some 20 None
1 (VOL) Doesn’t apply 2 (DO NOT READ) Don’t know/Refused
READ TO ALL FINANCIAL DECISION MAKERS: I'd like to ask you some final questions for statistical purposes only. Remember, all of the information you give us is completely confidential.
60. Please tell me which of the following types of accounts and investments you (and your
husband/wife/ partner) now have. First, do you have… (READ IN ORDER)
Yes No DK/Ref. a. A checking account 87 11 2 b. A saving account 72 26 2 c. A mutual fund account 31 65 4 d. Stocks in individual companies 31 65 3 e. An I‐R‐A, 401‐k, pension or other retirement account 60 39 2 f. Any other type of account or investment 15 79 6
58
61. Altogether about how much do you (and your husband/wife/partner) have in ALL the different accounts and investments I just mentioned? Just stop me when I get to the right category (READ).
29 Less than $5,000
8 $5,000 to under $10,000 9 $10,000 to under $20,000 5 $20,000 to under $30,000 5 $30,000 to under $50,000 7 $50,000 to under $100,000 7 $100,000 to under $200,000 4 $200,000 to under $300,000 3 $300,000 to under $500,000 3 $500,000 to under a million dollars 2 A million dollars or more
18 (DO NOT READ) Don't know/Refused
62. About what would you say is the value of the equity in your home? This is the difference between what you could sell it for and what you owe on your mortgage. Just stop me when I get to the right category.
Based on those with a mortgage (n=596)
23 Underwater
5 Less than $5,000 3 $5,000 to under $10,000 5 $10,000 to under $20,000 5 $20,000 to under $30,000
10 $30,000 to under $50,000 16 $50,000 to under $100,000 11 $100,000 to under $200,000
6 $200,000 to under $300,000 2 $300,000 to under $500,000 2 $500,000 to under a million dollars 1 A million dollars or more
12 Don't know/Refused
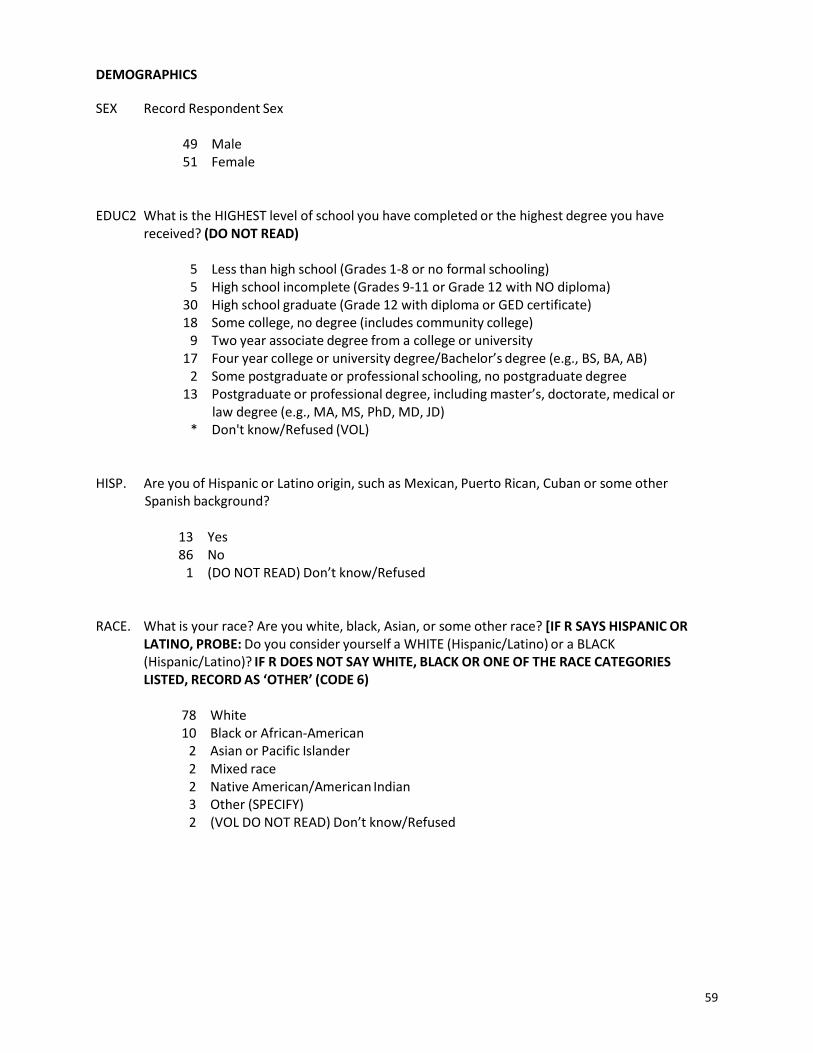
59
DEMOGRAPHICS
SEX Record Respondent Sex
49 Male 51 Female
EDUC2 What is the HIGHEST level of school you have completed or the highest degree you have received? (DO NOT READ)
5 Less than high school (Grades 1‐8 or no formal schooling) 5 High school incomplete (Grades 9‐11 or Grade 12 with NO diploma)
30 High school graduate (Grade 12 with diploma or GED certificate) 18 Some college, no degree (includes community college)
9 Two year associate degree from a college or university 17 Four year college or university degree/Bachelor’s degree (e.g., BS, BA, AB)
2 Some postgraduate or professional schooling, no postgraduate degree 13 Postgraduate or professional degree, including master’s, doctorate, medical or
law degree (e.g., MA, MS, PhD, MD, JD) * Don't know/Refused (VOL)
HISP. Are you of Hispanic or Latino origin, such as Mexican, Puerto Rican, Cuban or some other Spanish background?
13 Yes 86 No
1 (DO NOT READ) Don’t know/Refused
RACE. What is your race? Are you white, black, Asian, or some other race? [IF R SAYS HISPANIC OR LATINO, PROBE: Do you consider yourself a WHITE (Hispanic/Latino) or a BLACK (Hispanic/Latino)? IF R DOES NOT SAY WHITE, BLACK OR ONE OF THE RACE CATEGORIES LISTED, RECORD AS ‘OTHER’ (CODE 6)
78 White 10 Black or African‐American
2 Asian or Pacific Islander 2 Mixed race 2 Native American/American Indian 3 Other (SPECIFY) 2 (VOL DO NOT READ) Don’t know/Refused
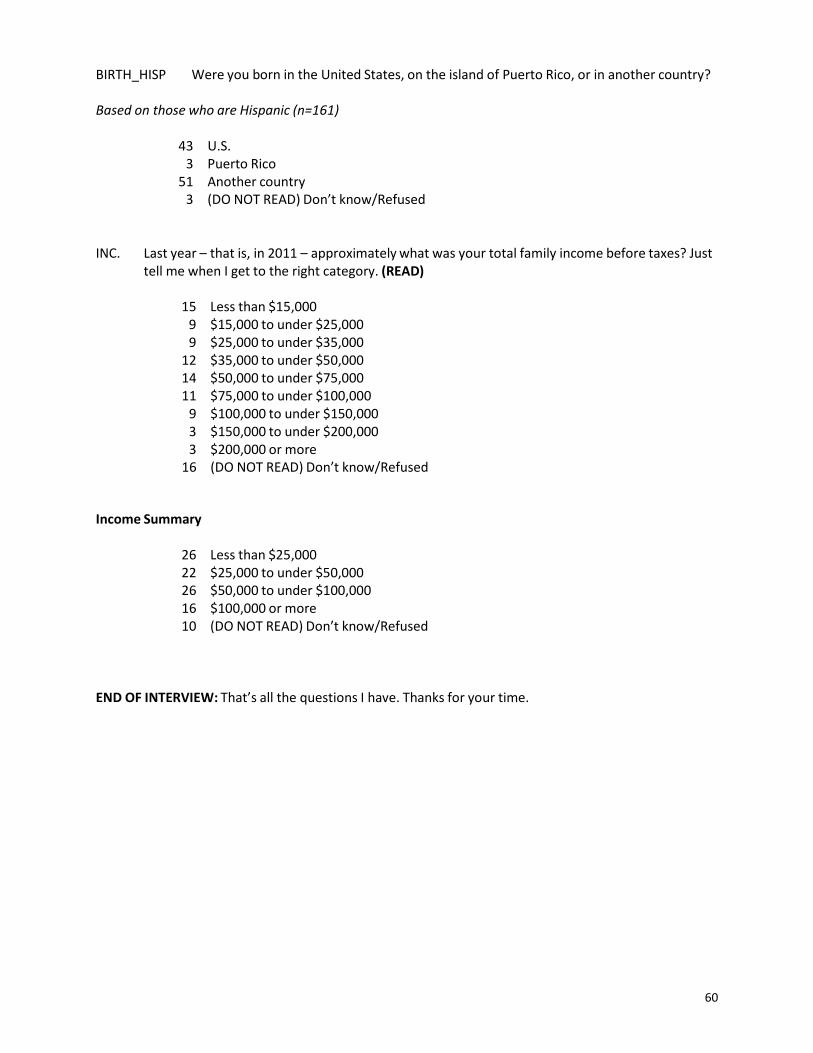
60
BIRTH_HISP Were you born in the United States, on the island of Puerto Rico, or in another country?
Based on those who are Hispanic (n=161)
43 U.S. 3 Puerto Rico
51 Another country 3 (DO NOT READ) Don’t know/Refused
INC. Last year – that is, in 2011 – approximately what was your total family income before taxes? Just tell me when I get to the right category. (READ)
15 Less than $15,000
9 $15,000 to under $25,000 9 $25,000 to under $35,000
12 $35,000 to under $50,000 14 $50,000 to under $75,000 11 $75,000 to under $100,000
9 $100,000 to under $150,000 3 $150,000 to under $200,000 3 $200,000 or more
16 (DO NOT READ) Don’t know/Refused
Income Summary
26 Less than $25,000 22 $25,000 to under $50,000 26 $50,000 to under $100,000 16 $100,000 or more 10 (DO NOT READ) Don’t know/Refused
END OF INTERVIEW: That’s all the questions I have. Thanks for your time.