Embed Size (px)
Citation preview
1
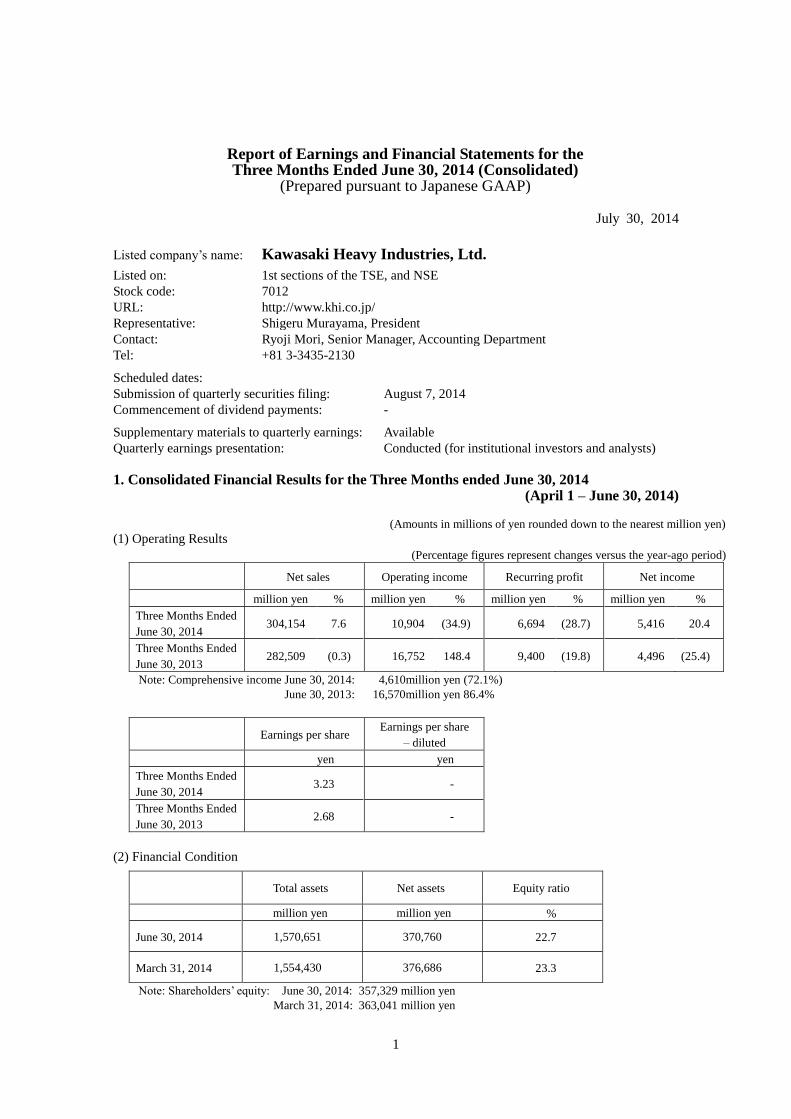
Report of Earnings and Financial Statements for the Three Months Ended June 30, 2014 (Consolidated)
(Prepared pursuant to Japanese GAAP)
July 30, 2014
Listed company’s name: Kawasaki Heavy Industries, Ltd.
Listed on: 1st sections of the TSE, and NSE
Stock code: 7012
URL: http://www.khi.co.jp/
Representative: Shigeru Murayama, President
Contact: Ryoji Mori, Senior Manager, Accounting Department
Tel: +81 3-3435-2130 Scheduled dates:
Submission of quarterly securities filing: August 7, 2014
Commencement of dividend payments: - Supplementary materials to quarterly earnings: Available
Quarterly earnings presentation: Conducted (for institutional investors and analysts)
1. Consolidated Financial Results for the Three Months ended June 30, 2014
(April 1 – June 30, 2014)
(Amounts in millions of yen rounded down to the nearest million yen)
(1) Operating Results
(Percentage figures represent changes versus the year-ago period)
Net sales Operating income Recurring profit Net income
million yen % million yen % million yen % million yen %
Three Months Ended
June 30, 2014 304,154 7.6 10,904 (34.9) 6,694 (28.7) 5,416 20.4
Three Months Ended
June 30, 2013 282,509 (0.3) 16,752 148.4 9,400 (19.8) 4,496 (25.4)
Note: Comprehensive income June 30, 2014: 4,610million yen (72.1%)
June 30, 2013: 16,570million yen 86.4%
Earnings per share Earnings per share
– diluted
yen yen
Three Months Ended
June 30, 2014 3.23 -
Three Months Ended
June 30, 2013 2.68 -
(2) Financial Condition
Total assets Net assets Equity ratio
million yen million yen %
June 30, 2014 1,570,651 370,760 22.7
March 31, 2014 1,554,430 376,686 23.3
Note: Shareholders’ equity: June 30, 2014: 357,329 million yen
March 31, 2014: 363,041 million yen

2
2. Dividends
Record date or term
Dividend per share
End of first
quarter
End of second
quarter
End of third
quarter
End of financial
year Full year
yen yen yen yen yen
Year ended
March 31, 2013 - 0.00 - 6.00 6.00
Year ending
March 31, 2014 -
Year ending March
31, 2015 (forecast) 3.00 - 4.00 7.00
Note: Revisions to the most recently announced dividend forecast: None
3. Forecast of Consolidated Earnings for the Year Ending March 31, 2015 (April 1, 2014 – March 31, 2015)
(Percentage figures represent changes versus the year-ago period)
Net sales Operating income Recurring profit Net income Earnings per
share
million yen % million yen % million yen % million yen % yen
For six months
ending
September 30,
2014
650,000 9.2 22,000 (18.0) 17,000 (25.4) 12,500 (3.8) 7.47
Full year 1,490,000 7.5 73,000 0.8 66,000 8.9 42,500 10.0 25.42
Note: Revision to the most recently announced earnings forecast: Yes
Notes
1) Changes affecting the status of material subsidiaries (scope of consolidation): None
2) Accounting procedures specific to preparation of quarterly consolidated financial statements: Yes
*For further details, see “Accounting procedures specific to preparation of quarterly consolidated
financial statements” on page 10 in the Accompanying Materials.
3) Changes in accounting policies, changes in accounting estimates, and correction of errors
(1) Changes in accounting policies in accord with revisions to accounting standards: None
(2) Changes in accounting policies other than (1): None
(3) Changes in accounting estimates: None
(4) Correction of errors: None
4) Number of shares issued and outstanding (common stock)
(1) Number of shares issued as of period-end (including treasury stock)
June 30, 2014: 1,671,892,659 shares
March 31, 2014: 1,671,892,659 shares
(2) Number of shares held in treasury as of period-end
June 30, 2014: 146,851 shares
March 31, 2014: 141,710 shares
(3) Average number of shares during respective periods
Three months ended June 30, 2014: 1,671,747,545 shares
Three months ended June 30, 2013: 1,671,787,906 shares
3
Quarterly review status
This report is exempt from the quarterly review of accounts conducted in accord with Japan’s Financial
Instruments and Exchange Act. As of this report’s publication, the quarterly review of the quarterly
financial results had not been completed.
* Appropriate Use of Financial Forecasts and Other Important Matters
Forward-Looking Statements
These materials contain various forward-looking statements and other forecasts regarding performance
and other matters. Such statements are based on information available at the time of their preparation, and
do not mean that the Company promises to achieve these figures. Actual results may differ from those
expressed or implied by forward-looking statements due to a range of factors. For assumptions underlying
earnings forecasts and other information regarding the use of such forecasts, refer to “Consolidated
earnings outlook” on page 9 in the Accompanying Materials.
How to Obtain Supplementary Briefing Material on Quarterly Financial Results and Details of the
Quarterly Financial Results Briefing
The Company plans to conduct a briefing for institutional investors and analysts by conference call on
Wednesday July 30, 2014, and to post the briefing material on quarterly financial results to be used for the
briefing on TDnet and the Company’s website simultaneously with the announcement of financial results.

4
Accompanying Materials – Contents
1. Qualitative Information and Financial Statements 5
(1) Consolidated operating results 5
(2) Consolidated financial position 8
(3) Consolidated earnings outlook 9
2. Summary Information (Notes) 10
(1) Changes affecting the status of material subsidiaries (scope of consolidation) 10
(2) Accounting procedures specific to preparation of quarterly consolidated financial statements 10
3. Consolidated Financial Statements 11
(1) Consolidated balance sheets 11
(2) Consolidated statements of income and comprehensive income 13
(Consolidated statements of income for the three months ended June 30, 2014) 13
(Consolidated statements of comprehensive income for the three months ended June 30, 2014) 13
(3) Notes on financial statements
(Notes on the going-concern assumption)
14
14
(Notes on significant changes in the amount of shareholders’ equity) 14
(Segment information and others) 14
4. Supplementary Information 15
(1) Consolidated cash flow statements (condensed) 15
(2) Orders and sales (consolidated) 16
(3) Net sales by geographic area (consolidated) 17
(4) Supplementary information on earnings forecasts for the fiscal year ending March 31,
2015
18
5
1. Qualitative Information and Financial Statements
(1) Consolidated operating results
In the first quarter of the fiscal year ending March 31, 2015, the global economy recovered
modestly on the whole, as emerging market economies were supported by sound recoveries,
centered on developed economies, including the turnaround in the US economy and the pickup in the
European economy. Going forward, the global economy is expected to continue on a moderate
growth track, despite the ongoing concerns about downward economic risk due to factors such as the
impact of the tapering of monetary easing in the US, the future of China’s economy, as well as
geopolitical risks.
The Japanese economy continued on a recovery track supported by various fiscal and monetary
policies, despite some weakness in personal consumption due to the recoil drop in spending in the
wake of the surge in demand in advance of the consumption tax hike. While a close eye needs to be
kept on various economic risks going forward, the economy is expected to maintain a modest
recovery trend, underpinned by a pickup in personal consumption with the clear improvement in the
employment and income environment, firm domestic demand, as well as growth in overseas
economies.
Amid such an economic environment, the Group achieved an overall increase in orders received
in the first quarter, driven by segments including Rolling Stock and Plant & Infrastructure, despite a
decrease in orders in several segments including Ship & Offshore Structure. First quarter sales also
increased on the whole, as higher sales in segments such as Aerospace and Gas Turbine &
Machinery offset the decline in sales in segments including Ship & Offshore Structure and
Motorcycle & Engine. Operating income decreased overall, as increases in segments such as
Precision Machinery and Gas Turbine & Machinery were negated by declines in performance or
profit declines in several segments, including Ship & Offshore Structure, Motorcycle & Engine, and
Rolling Stock.
The Group’s first quarter consolidated orders received increased ¥50.7 billion year on year to
¥333.8 billion. Consolidated net sales totaled ¥304.1 billion, a ¥21.6 billion year-on-year increase,
but consolidated operating income decreased ¥5.8 billion year on year to ¥10.9 billion, as the impact
of the reversal of reserves for losses on construction contracts was considerable in the same quarter
of the previous fiscal year. Despite the contraction in the foreign exchange losses, consolidated
recurring profit declined ¥2.7 billion year on year to ¥6.6 billion, largely the result of the decline in
consolidated operating income. Consolidated net income increased ¥0.9 billion year on year to ¥5.4
billion, attributable to the decline in tax expense.

6
First-quarter consolidated operating performance is summarized by segment below.
Segment Information
Segment net sales, operating income, and orders received (billions of yen)
Three months ended June 30 Orders received
2014 (A) 2013 (B) Change (A – B) Three months ended
June 30
Net
sales
Operating
income
Net
sales
Operating
income
Net
sales
Operating
income
2014
(A)
2013
(B)
Change
(A – B)
Ship & Offshore
Structure 18.3 (0.4) 21.0 3.3 (2.7) (3.7) 14.5 27.1 (12.5)
Rolling Stock 30.4 0.0 30.5 1.9 (0.0) (1.8) 67.4 35.0 32.3
Aerospace 65.4 6.2 55.6 7.5 9.7 (1.2) 41.9 41.5 0.4
Gas Turbine &
Machinery 42.7 2.0 36.4 0.8 6.3 1.2 43.2 35.6 7.5
Plant &
Infrastructure 21.0 (0.4) 16.7 (0.6) 4.3 0.1 35.2 16.6 18.6
Motorcycle &
Engine 64.8 0.2 67.4 2.4 (2.6) (2.2) 64.8 67.4 (2.6)
Precision
Machinery 30.6 2.8 25.1 1.5 5.5 1.2 31.7 29.8 1.8
Other 30.5 0.5 29.4 0.3 1.0 0.2 34.7 29.6 5.0
Adjustments - (0.3) - (0.7) - 0.4 - - -
Total 304.1 10.9 282.5 16.7 21.6 (5.8) 333.8 283.1 50.7
Notes: 1. Net sales include only sales to external customers.
2.The Motorcycle & Engine segment’s orders received are equal to its net sales as production is based mainly
on estimated demand.
Ship & Offshore Structure
Consolidated orders received declined ¥12.5 billion year on year to ¥14.5 billion, as despite
booking an order for an LPG carrier, the segment had booked orders for two LNG carriers in the
year-earlier period, resulting in a year-on-year decline.
Consolidated net sales decreased ¥2.7 billion year on year to ¥18.3 billion, as growth in the
amount of construction of LNG carriers was overshadowed by a decline in the amount of
construction of other vessels, most notably bulk carriers.
As a result of the decline in sales, the segment posted a consolidated operating loss of ¥0.4 billion,
a ¥3.7 billion deterioration year on year, largely due to the fact that a reversal of reserves for losses
on construction contracts had been posted in the same quarter of the previous fiscal year.
7
Rolling Stock
Consolidated orders received grew ¥32.3 billion to ¥67.4 billion, largely as a result of an order
from the Singapore Land Transport Authority for subway train cars for new lines.
Consolidated net sales were roughly flat year on year at ¥30.4 billion, due to a continued high
level of sales to overseas customers and other factors.
Consolidated operating income decreased ¥1.8 billion year on year to ¥0.0 billion, attributable to a
decline in profit margin and other factors.
Aerospace
Consolidated orders received grew ¥0.4 billion year on year to ¥41.9 billion, as despite the decline
in orders from Japan’s Ministry of Defense, there was an increase in orders for component parts for
the Boeing 787.
Consolidated net sales increased ¥9.7 billion year on year to ¥65.4 billion, largely as a result of
growth in Boeing 787 component parts sales coupled with sales to Japan’s Ministry of Defense on
par with the year-earlier period .
Despite the increase in sales, consolidated operating income declined ¥1.2 billion year on year to
¥6.2 billion as a result of the reversal of reserves for losses on construction contracts posted in the
year-earlier period.
Gas Turbine & Machinery
Consolidated orders received increased ¥7.5 billion year on year to ¥43.2 billion, attributable to
growth in orders for aircraft engine components and other products.
Consolidated net sales grew ¥6.3 billion year on year to ¥42.7 billion, due to an increase in sales
of aircraft engine components, hydropower systems, and other products.
Consolidated operating income rose ¥1.2 billion year on year to ¥2.0 billion in response to the
increase in sales, among other factors.
Plant & Infrastructure
Consolidated orders received totaled ¥35.2 billion, an ¥18.6 billion increase year on year, due to
an increase in orders for earth-moving machinery and environmental infrastructure projects.
Consolidated net sales grew ¥4.3 billion year on year to ¥21.0 billion, mainly attributable to the
increase in sales of LNG storage tanks and environmental infrastructure contracts.
Despite the increase in sales, a consolidated operating loss of ¥0.4 billion was posted, similar to
the consolidated operating loss in the year-earlier period.

8
Motorcycle & Engine
Consolidated net sales decreased ¥2.6 billion year on year to ¥64.8 billion, as the decline in
motorcycle sales in the US and Thailand negated the increase in motorcycle sales to Indonesia and
countries in Europe.
Consolidated operating income totaled ¥0.2 billion, a ¥2.2 billion year-on-year decline, largely
attributable to the drop in sales.
Precision Machinery
Consolidated orders received grew ¥1.8 billion year on year to ¥31.7 billion. The increase was the
result of a growth in orders of hydraulic components for the construction machinery market in Japan,
among other factors.
Consolidated net sales grew ¥5.5 billion year on year to ¥30.6 billion, largely due to the increase
in sales of hydraulic components for the construction machinery market in Japan, as well as the
increase in sales of industrial robots for the automotive industry.
Consolidated operating income was up ¥1.2 billion year on year to ¥2.8 billion, largely in
response to the growth in sales.
Other Operations
Consolidated net sales increased ¥1.0 billion yen year on year to ¥30.5 billion. Consolidated
operating income increased ¥0.2 billion year on year to ¥0.5 billion.
(2) Consolidated financial position
At June 30, 2014, consolidated assets totaled ¥1,570.6 billion, a ¥16.2 billion increase from March
31, 2014. The increase was chiefly attributable to inventory growth stemming from progress toward
completion of construction jobs and capital expenditure that added to property, plant and equipment,
which offset the decline in trade receivables. Consolidated liabilities at June 30, 2014, were ¥1,199.8
billion, a ¥22.1 billion increase from March 31, 2014. The rise was largely attributable to the
increase in commercial paper and other interest-bearing debt, which offset the decline in trade
payables. Interest-bearing debt ended the first quarter at ¥501.7 billion, a ¥57.1 billion increase from
March 31, 2014. Consolidated net assets at June 30, 2014, totaled ¥370.7 billion, a ¥5.9 billion
decline from March 31, 2014, largely attributable to dividend payments.

9
(3) Consolidated earnings outlook
The Company has raised its consolidated recurring profit forecast for the first half of the fiscal
year ending March 31, 2015, to ¥17.0 billion, a ¥3.0 billion increase from the initial forecast
announced on April 25, 2014. This upward revision is based on the fact that investment gains on
equity method are expected to improve due to the larger-than-expected concentration of relatively
high-profit projects in the first half of the fiscal year. On the net income, the Company raised its
initial first-half forecast by ¥4.0 billion to ¥12.5 billion, reflecting the improvement in recurring
profit and the revision of tax effects.
The Company has left its full-year recurring profit forecast unchanged from its initial forecast,
given the limited change in full-year gains or losses on equity method. Meanwhile, the full-year net
income forecast was raised by ¥1.5 billion to ¥42.5 billion, in light of the revision of tax effects.
The Company’s earnings forecasts assume exchange rates of ¥100 to the US dollar and ¥135 to
the euro.
10
2. Summary Information (Notes)
(1) Changes affecting the status of material subsidiaries (scope of consolidation)
Not applicable
(2) Accounting procedures specific to preparation of quarterly consolidated financial statements
The Company calculates tax expense by rationally estimating its effective tax rate after
application of deferred-tax accounting to pretax net income for the fiscal year, which includes
the first quarter under review, and multiplying quarterly pretax net income by said estimated
effective tax rate. If unable to use the estimated effective tax rate, the Company calculates tax
expense by multiplying the statutory effective tax rate by quarterly pretax net income adjusted
to reflect material differences other than temporary differences.
Income taxes are reported inclusive of income tax adjustments.
11
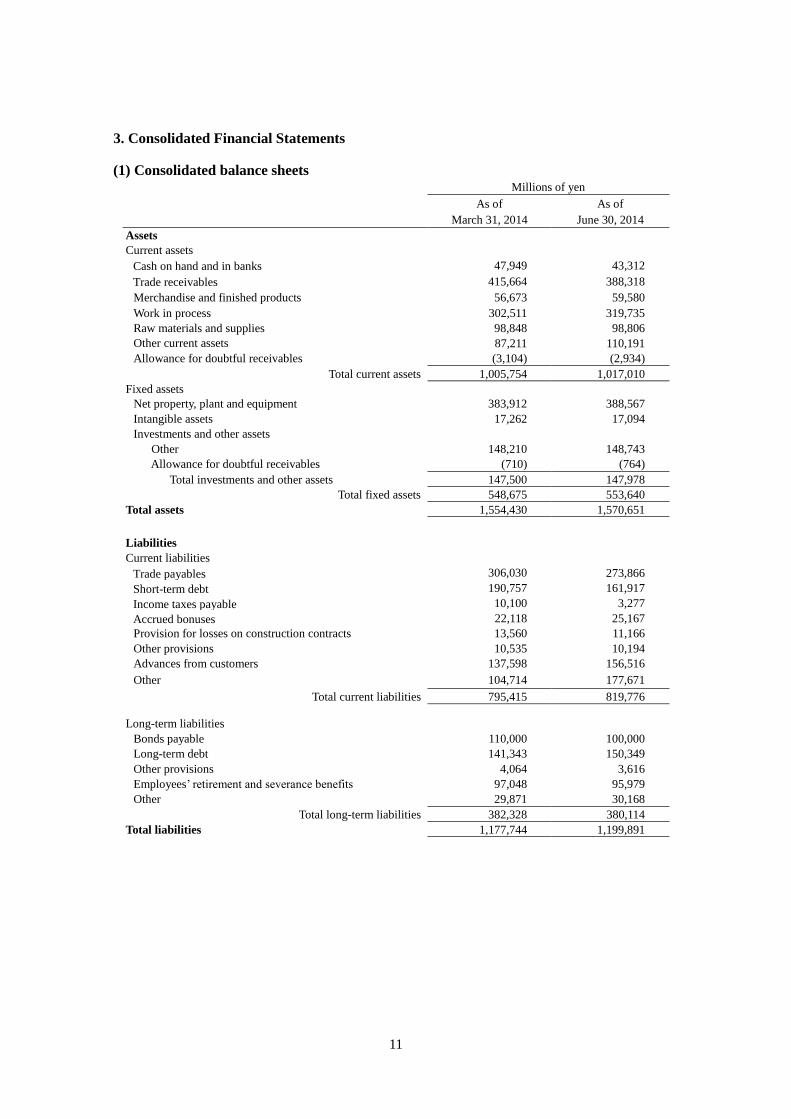
3. Consolidated Financial Statements
(1) Consolidated balance sheets Millions of yen
As of
March 31, 2014
As of
June 30, 2014
Assets
Current assets Cash on hand and in banks 47,949 43,312
Trade receivables 415,664 388,318
Merchandise and finished products 56,673 59,580
Work in process 302,511 319,735
Raw materials and supplies 98,848 98,806
Other current assets
87,211 110,191
Allowance for doubtful receivables (3,104) (2,934)
Total current assets 1,005,754 1,017,010
Fixed assets
Net property, plant and equipment 383,912 388,567
Intangible assets 17,262 17,094
Investments and other assets
Other 148,210 148,743
Allowance for doubtful receivables (710) (764)
Total investments and other assets 147,500 147,978
Total fixed assets 548,675 553,640
Total assets 1,554,430 1,570,651
Liabilities
Current liabilities
Trade payables 306,030
3,756
20,060
18,719
310,775
273,866
Short-term debt 190,757 161,917
Income taxes payable 10,100 3,277
Accrued bonuses 22,118 25,167
Provision for losses on construction contracts 13,560 11,166
Other provisions 10,535 10,194
Advances from customers 137,598 156,516
Other 104,714 177,671
Total current liabilities 795,415 819,776
Long-term liabilities
Bonds payable 110,000 100,000
Long-term debt 141,343 150,349
Other provisions 4,064 3,616
Employees’ retirement and severance benefits 97,048 95,979
Other 29,871 30,168
Total long-term liabilities 382,328 380,114
Total liabilities 1,177,744 1,199,891

12
Net assets
Shareholders’ equity
Common stock 104,484 104,484
Capital surplus 54,393 54,393
Retained earnings 217,449 212,824
Treasury stock (43) (45)
Total shareholders’ equity 376,284 371,657
Accumulated other comprehensive income
Net unrealized gains (losses) on securities, net of tax 2,652 2,755
Deferred gains (losses) on hedges (3,803) (629)
Foreign currency translation adjustment
6,416 1,463
Remeasurements of defined benefit plans (18,509) (17,915)
Total accumulated other comprehensive income (13,243) (14,327)
Minority interests 13,645 13,430
Total net assets 376,686 370,760
Total net assets and liabilities 1,554,430 1,570,651

13
(2) Consolidated statements of income and comprehensive income
Consolidated statements of income Millions of yen
Three months ended
June 30, 2013 Three months ended
June 30, 2014
Net sales 282,509 304,154
Cost of sales 226,809 253,169
Gross profit 55,699 50,984
Selling, general and administrative expenses
Salaries and benefits 10,840 11,340
R&D expenses 8,076 8,014
Provision for doubtful accounts 281 -
Other 19,750 20,725
Total selling, general and administrative expenses 38,947 40,080
Operating income (loss) 16,752 10,904
Non-operating income
Interest income 252 116
Dividend income 216 130
Equity in income of non-consolidated subsidiaries and affiliates 1,523 2,465
Other 627 1,012
Total non-operating income 2,619 3,724
Non-operating expenses
Interest expense 1,030 990
Foreign exchange losses 7,993 5,873
Other 947 1,069
Total non-operating expenses 9,971 7,933
Recurring profit (loss) 9,400 6,694
Income (loss) before income taxes and minority interests 9,400 6,694
Income taxes 4,588 619
Income before minority interests 4,812 6,075
Minority interests in net income of consolidated subsidiaries 315 658
Net income (loss) 4,496 5,416
Consolidated statements of comprehensive income Millions of yen
Three months ended
June 30, 2013 Three months ended
June 30, 2014
Income before minority interests 4,812 6,075
Other comprehensive income
Net unrealized gains (losses) on securities 388 113
Deferred gains (losses) on hedges (182) 3,209
Foreign currency translation adjustment 6,630 (2,169)
Remeasurements of defined benefit plans 245 409
Share of other comprehensive income of associates accounted for using equity method
4,675 (3,027)
Total other comprehensive income 11,758 (1,464)
Comprehensive Income attributable to: 16,570 4,610
Owners of the parent company 15,736 4,332
Minority interests 834 278
14
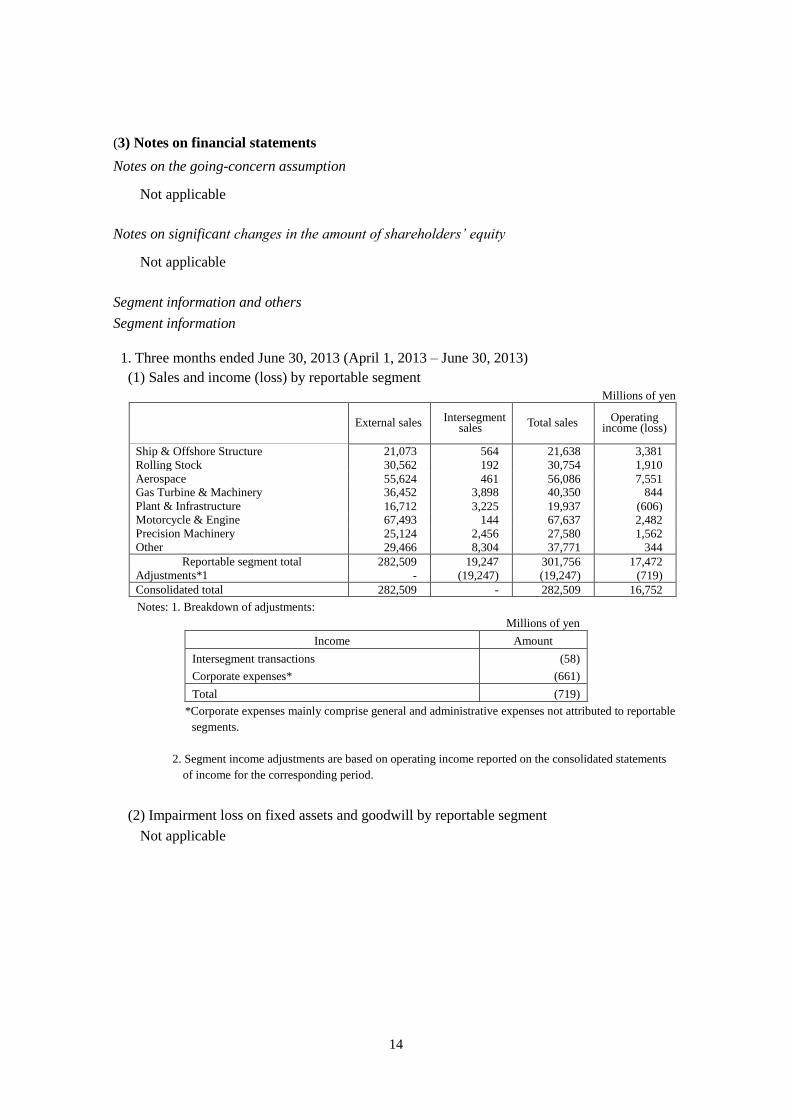
(3) Notes on financial statements
Notes on the going-concern assumption
Not applicable
Notes on significant changes in the amount of shareholders’ equity
Not applicable
Segment information and others
Segment information
1. Three months ended June 30, 2013 (April 1, 2013 – June 30, 2013)
(1) Sales and income (loss) by reportable segment
Millions of yen
External sales Intersegment sales Total sales Operating
income (loss)
Ship & Offshore Structure 21,073 564 21,638 3,381
Rolling Stock 30,562 192 30,754 1,910
Aerospace 55,624 461 56,086 7,551 Gas Turbine & Machinery 36,452 3,898 40,350 844
Plant & Infrastructure 16,712 3,225 19,937 (606) Motorcycle & Engine 67,493 144 67,637 2,482 Precision Machinery 25,124 2,456 27,580 1,562 Other 29,466 8,304 37,771 344
Reportable segment total 282,509 19,247 301,756 17,472 Adjustments*1 - (19,247) (19,247) (719)
Consolidated total 282,509 - 282,509 16,752
Notes: 1. Breakdown of adjustments:
Millions of yen
Income Amount
Intersegment transactions (58)
Corporate expenses* (661)
Total (719)
*Corporate expenses mainly comprise general and administrative expenses not attributed to reportable
segments.
2. Segment income adjustments are based on operating income reported on the consolidated statements
of income for the corresponding period.
(2) Impairment loss on fixed assets and goodwill by reportable segment
Not applicable
15
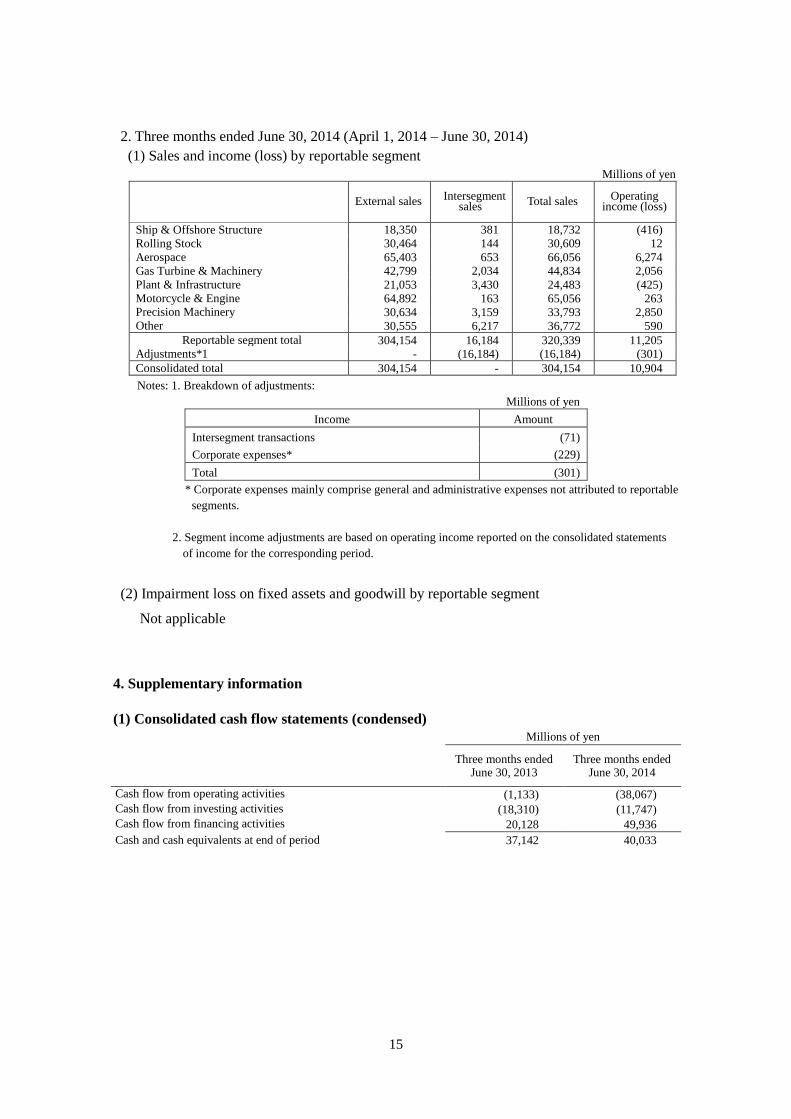
2. Three months ended June 30, 2014 (April 1, 2014 – June 30, 2014)
(1) Sales and income (loss) by reportable segment
Millions of yen
External sales Intersegment sales Total sales Operating
income (loss)
Ship & Offshore Structure 18,350 381 18,732 (416)
Rolling Stock 30,464 144 30,609 12
Aerospace 65,403 653 66,056 6,274 Gas Turbine & Machinery 42,799 2,034 44,834 2,056
Plant & Infrastructure 21,053 3,430 24,483 (425) Motorcycle & Engine 64,892 163 65,056 263 Precision Machinery 30,634 3,159 33,793 2,850 Other 30,555 6,217 36,772 590
Reportable segment total 304,154 16,184 320,339 11,205 Adjustments*1 - (16,184) (16,184) (301)
Consolidated total 304,154 - 304,154 10,904
Notes: 1. Breakdown of adjustments:
Millions of yen
Income Amount
Intersegment transactions (71)
Corporate expenses* (229)
Total (301)
* Corporate expenses mainly comprise general and administrative expenses not attributed to reportable
segments.
2. Segment income adjustments are based on operating income reported on the consolidated statements
of income for the corresponding period.
(2) Impairment loss on fixed assets and goodwill by reportable segment
Not applicable
4. Supplementary information
(1) Consolidated cash flow statements (condensed)
Millions of yen
Three months ended
June 30, 2013 Three months ended
June 30, 2014
Cash flow from operating activities (1,133) (38,067)
Cash flow from investing activities (18,310) (11,747)
Cash flow from financing activities 20,128 49,936
Cash and cash equivalents at end of period 37,142 40,033
16
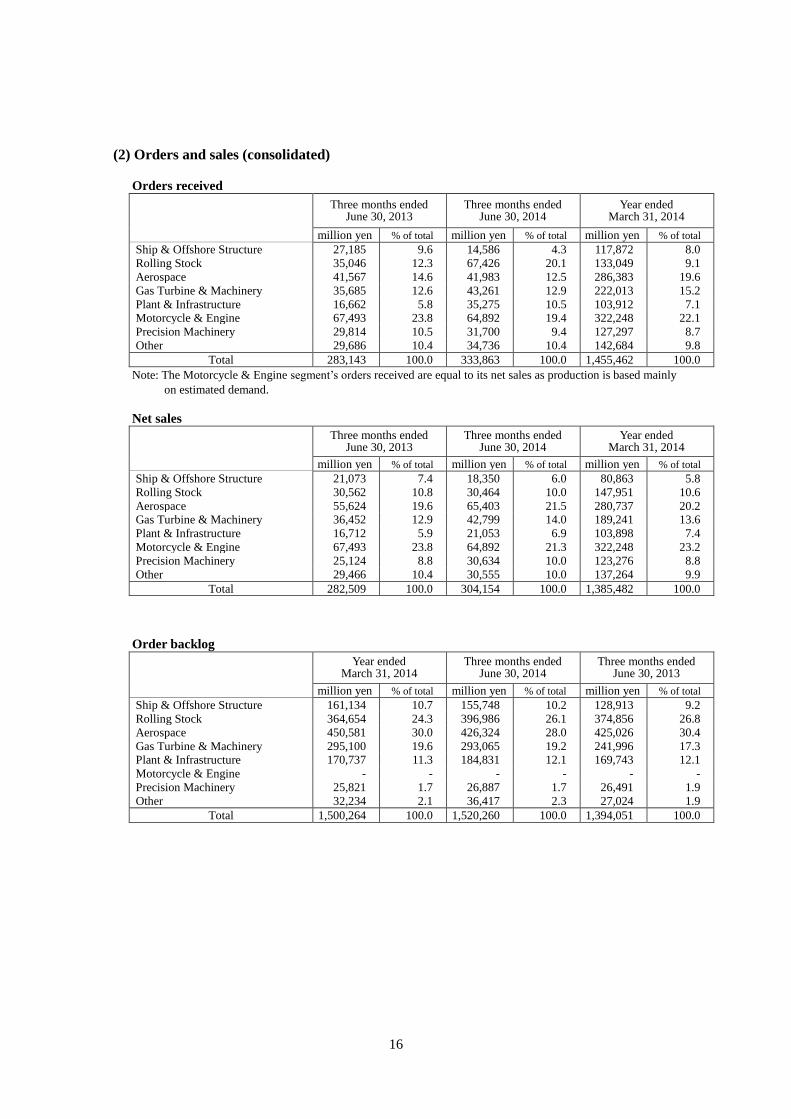
(2) Orders and sales (consolidated)
Orders received
Three months ended June 30, 2013
Three months ended June 30, 2014
Year ended March 31, 2014
million yen % of total million yen % of total million yen % of total
Ship & Offshore Structure 27,185 9.6 14,586 4.3 117,872 8.0
Rolling Stock 35,046 12.3 67,426 20.1 133,049 9.1
Aerospace 41,567 14.6 41,983 12.5 286,383 19.6
Gas Turbine & Machinery 35,685 12.6 43,261 12.9 222,013 15.2
Plant & Infrastructure 16,662 5.8 35,275 10.5 103,912 7.1 Motorcycle & Engine 67,493 23.8 64,892 19.4 322,248 22.1
Precision Machinery 29,814 10.5 31,700 9.4 127,297 8.7
Other 29,686 10.4 34,736 10.4 142,684 9.8
Total 283,143 100.0 333,863 100.0 1,455,462 100.0
Note: The Motorcycle & Engine segment’s orders received are equal to its net sales as production is based mainly
on estimated demand.
Net sales
Three months ended June 30, 2013
Three months ended June 30, 2014
Year ended March 31, 2014
million yen % of total million yen % of total million yen % of total
Ship & Offshore Structure 21,073 7.4 18,350 6.0 80,863 5.8
Rolling Stock 30,562 10.8 30,464 10.0 147,951 10.6
Aerospace 55,624 19.6 65,403 21.5 280,737 20.2 Gas Turbine & Machinery 36,452 12.9 42,799 14.0 189,241 13.6
Plant & Infrastructure 16,712 5.9 21,053 6.9 103,898 7.4
Motorcycle & Engine 67,493 23.8 64,892 21.3 322,248 23.2
Precision Machinery 25,124 8.8 30,634 10.0 123,276 8.8
Other 29,466 10.4 30,555 10.0 137,264 9.9
Total 282,509 100.0 304,154 100.0 1,385,482 100.0
Order backlog
Year ended March 31, 2014
Three months ended June 30, 2014
Three months ended June 30, 2013
million yen % of total million yen % of total million yen % of total
Ship & Offshore Structure 161,134 10.7 155,748 10.2 128,913 9.2
Rolling Stock 364,654 24.3 396,986 26.1 374,856 26.8
Aerospace 450,581 30.0 426,324 28.0 425,026 30.4
Gas Turbine & Machinery 295,100 19.6 293,065 19.2 241,996 17.3 Plant & Infrastructure 170,737 11.3 184,831 12.1 169,743 12.1
Motorcycle & Engine - - - - - -
Precision Machinery 25,821 1.7 26,887 1.7 26,491 1.9
Other 32,234 2.1 36,417 2.3 27,024 1.9
Total 1,500,264 100.0 1,520,260 100.0 1,394,051 100.0
17
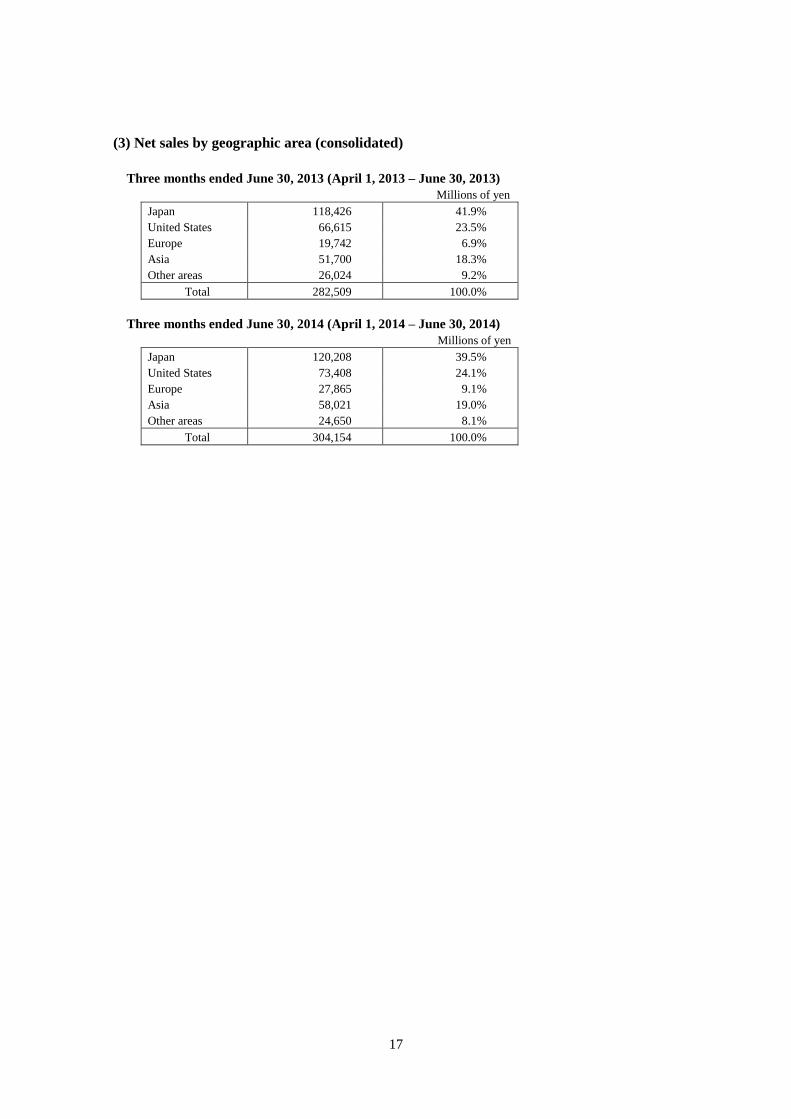
(3) Net sales by geographic area (consolidated)
Three months ended June 30, 2013 (April 1, 2013 – June 30, 2013)
Millions of yen
Japan 118,426 41.9%
United States 66,615 23.5%
Europe 19,742 6.9%
Asia 51,700 18.3%
Other areas 26,024 9.2%
Total 282,509 100.0%
Three months ended June 30, 2014 (April 1, 2014 – June 30, 2014)
Millions of yen
Japan 120,208 39.5%
United States 73,408 24.1%
Europe 27,865 9.1%
Asia 58,021 19.0%
Other areas 24,650 8.1%
Total 304,154 100.0%

18
(4) Supplementary information on earnings forecasts for the fiscal year ending March 31, 2015
1. Consolidated earnings outlook
(Billions of yen)
Outlook for the year ending March 31, 2015 (fiscal 2014) Fiscal 2013 (ended
March 31, 2014)
(actual) Revised forecast
(A)
Forecast issued
April 25, 2014 (B)
Change
(A – B)
Net sales 1,490.0 1,490.0 - 1,385.4
Operating income 73.0 73.0 - 72.3
Recurring profit 66.0 66.0 - 60.6
Net income 42.5 41.0 1.5 38.6
Orders received 1,590.0 1,580.0 10.0 1,455.4
Before-tax ROIC (%) 8.6% 8.6% - 8.1%
Notes: 1. Outlook’s assumed foreign exchange rates: ¥100 = US$1, ¥135 = 1 euro
2. Before-tax ROIC = (income before income taxes + interest expense) / invested capital.
2. Outlook by reportable segment
(a) Net sales and operating income (loss)
(Billions of yen)
Outlook for the year ending March 31, 2015 (fiscal 2014) Fiscal 2013 (ended
March 31, 2014)
(actual)
Revised forecast
(A)
Forecast issued
April 25, 2014 (B)
Change
(A – B)
Net sales
Operating
income
(loss)
Net sales
Operating
income
(loss)
Net sales
Operating
income
(loss)
Net sales
Operating
income
(loss)
Ship & Offshore Structure 85.0 0.0 85.0 0.0 - - 80.8 (2.0)
Rolling Stock 135.0 6.0 135.0 6.0 - - 147.9 7.5
Aerospace 320.0 27.0 320.0 27.0 - - 280.7 26.2
Gas Turbine & Machinery 230.0 9.0 230.0 9.0 - - 189.2 10.4
Plant & Infrastructure Engineering
120.0 6.0 120.0 6.0 - - 103.8 6.3
Motorcycle & Engine 320.0 16.0 320.0 16.0 - - 322.2 16.1
Precision Machinery 140.0 12.0 140.0 12.0 - - 123.2 10.4
Other 140.0 4.0 140.0 4.0 - - 137.2 4.4
Adjustments (7.0) (7.0) - (7.2)
Total 1,490.0 73.0 1,490.0 73.0 - - 1,385.4 72.3
(b) Orders received
(Billions of yen)
Outlook for the year ending March 31, 2015 (fiscal 2014) Fiscal 2013 (ended
March 31, 2014)
(actual)
Revised outlook
(A)
Forecast issued
April 25, 2014 (B)
Change
(A – B)
Ship & Offshore Structure 150.0 150.0 - 117.8
Rolling Stock 180.0 180.0 - 133.0
Aerospace 300.0 290.0 10.0 286.3
Gas Turbine & Machinery 230.0 230.0 - 222.0
Plant & Infrastructure 130.0 130.0 - 103.9
Motorcycle & Engine 320.0 320.0 - 322.2
Precision Machinery 140.0 140.0 - 127.2
Other 140.0 140.0 - 142.6
Total 1,590.0 1,580.0 10.0 1,455.4

19
(c) Before-tax ROIC
(%)
Outlook for the year ending March 31, 2015 (fiscal 2014) Fiscal 2013 (ended
March 31, 2014)
(actual)
Revised outlook
(A)
Forecast issued
April 25, 2014 (B)
Change
(A – B)
Ship & Offshore Structure 0.2 0.2 - 3.4
Rolling Stock 7.9 7.9 - 10.2
Aerospace 17.7 17.7 - 19.6
Gas Turbine & Machinery 5.1 5.1 - 4.6
Plant & Infrastructure 13.5 13.5 - 14.9
Motorcycle & Engine 9.2 9.2 - 1.4
Precision Machinery 16.8 16.8 - 17.5
Total 8.6 8.6 - 8.1