Embed Size (px)
Citation preview
UNITED STATESSECURITIES AND EXCHANGE COMMISSION
Washington, D.C. 20549
FORM 10-Q(Mark one)
x QUARTERLY REPORT PURSUANT TO SECTION 13 OR 15(d) OF THE SECURITIES EXCHANGE ACT OF1934
For the quarterly period ended March 31, 2018
OR
☐ TRANSITION REPORT PURSUANT TO SECTION 13 OR 15(d) OF THE SECURITIES EXCHANGE ACTOF 1934
For the transition period from to
Commission File Number 1-7724
(Exact name of registrant as specified in its charter)
Delaware 39-0622040(State of incorporation) (I.R.S. Employer Identification No.)
2801 80th Street, Kenosha, Wisconsin 53143(Address of principal executive offices) (Zip code)
(262) 656-5200(Registrant’s telephone number, including area code)
Indicate by check mark whether the registrant (1) has filed all reports required to be filed by Section 13 or 15(d) of the SecuritiesExchange Act of 1934 during the preceding 12 months (or for such shorter period that the registrant was required to file suchreports), and (2) has been subject to such filing requirements for the past 90 days. Yes ☒ No ☐
Indicate by check mark whether the registrant has submitted electronically and posted on its corporate Web site, if any, everyInteractive Data File required to be submitted and posted pursuant to Rule 405 of Regulation S-T (§232.405 of this chapter) duringthe preceding 12 months (or for such shorter period that the registrant was required to submit and post such files). Yes ☒ No ☐
Indicate by check mark whether the registrant is a large accelerated filer, an accelerated filer, a non-accelerated filer, smallerreporting company, or an emerging growth company. See the definitions of “large accelerated filer,” “accelerated filer,” “smallerreporting company,” and “emerging growth company” in Rule 12b-2 of the Exchange Act.
Large accelerated filer ☒ Accelerated filer ☐ Non-accelerated filer ☐ Smaller reporting company ☐Emerging growth company ☐
If an emerging growth company, indicate by check mark if the registrant has elected not to use the extended transition period forcomplying with any new or revised financial accounting standards provided pursuant to Section 13(a) of the Exchange Act. ☐
Indicate by check mark whether the registrant is a shell company (as defined in Rule 12b-2 of the Exchange Act). Yes ☐ No ☒
Indicate the number of shares outstanding of each of the registrant’s classes of common stock, as of the latest practicable date:
Class Outstanding at April 13, 2018Common Stock, $1.00 par value 56,595,222 shares
Table of Contents
TABLE OF CONTENTS
PagePart I: Financial Information
Item 1. Financial Statements
Condensed Consolidated Statements of Earnings (unaudited) – Three Months Ended March 31, 2018, andApril 1, 2017 3
Condensed Consolidated Statements of Comprehensive Income (unaudited) – Three Months Ended March31, 2018, and April 1, 2017 4
Condensed Consolidated Balance Sheets (unaudited) – March 31, 2018, and December 30, 2017 5
Condensed Consolidated Statements of Equity (unaudited) – Three Months Ended March 31, 2018, andApril 1, 2017 7
Condensed Consolidated Statements of Cash Flows (unaudited) – Three Months Ended March 31, 2018,and April 1, 2017 8
Notes to Condensed Consolidated Financial Statements (unaudited) 9
Item 2. Management’s Discussion and Analysis of Financial Condition and Results of Operations 34
Item 3. Quantitative and Qualitative Disclosures About Market Risk 49
Item 4. Controls and Procedures 50
Part II: Other Information
Item 2. Unregistered Sales of Equity Securities and Use of Proceeds 51
Item 6. Exhibits 52
Signatures 53
Table of Contents
2
PART I. FINANCIAL INFORMATION
Item 1: Financial Statements
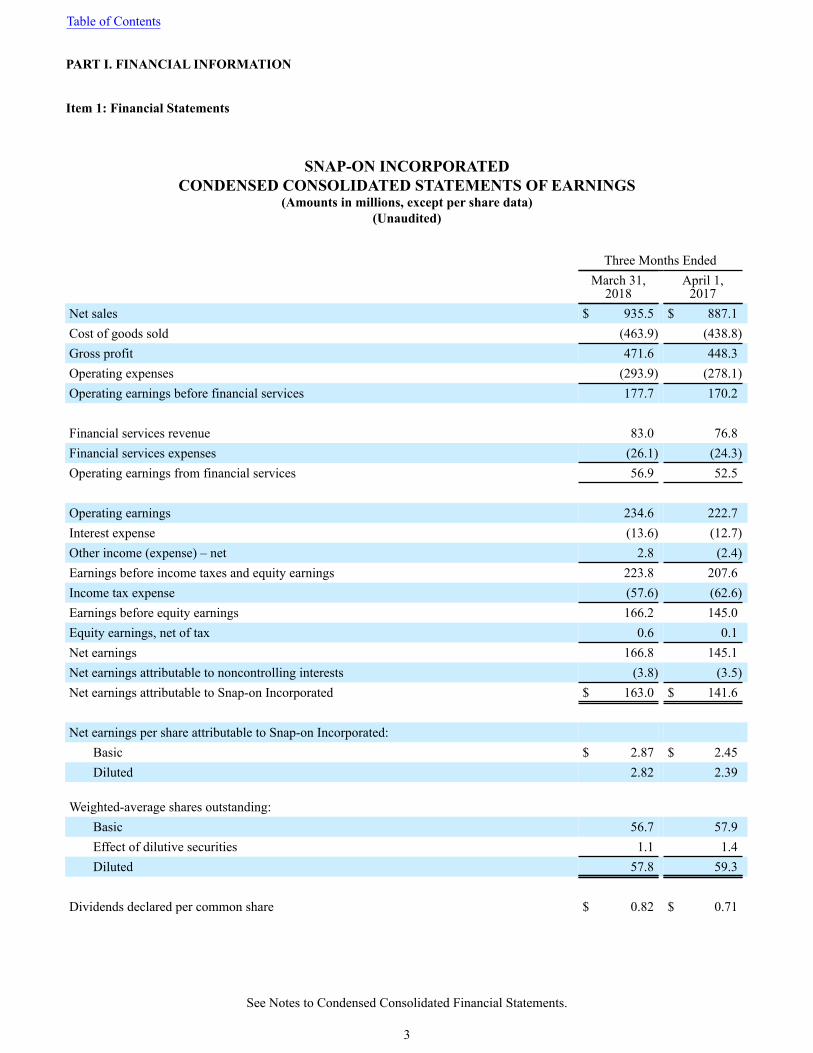
SNAP-ON INCORPORATEDCONDENSED CONSOLIDATED STATEMENTS OF EARNINGS
(Amounts in millions, except per share data)(Unaudited)
Three Months EndedMarch 31,
2018April 1,
2017Net sales $ 935.5 $ 887.1Cost of goods sold (463.9) (438.8)Gross profit 471.6 448.3Operating expenses (293.9) (278.1)Operating earnings before financial services 177.7 170.2
Financial services revenue 83.0 76.8Financial services expenses (26.1) (24.3)Operating earnings from financial services 56.9 52.5
Operating earnings 234.6 222.7Interest expense (13.6) (12.7)Other income (expense) – net 2.8 (2.4)Earnings before income taxes and equity earnings 223.8 207.6Income tax expense (57.6) (62.6)Earnings before equity earnings 166.2 145.0Equity earnings, net of tax 0.6 0.1Net earnings 166.8 145.1Net earnings attributable to noncontrolling interests (3.8) (3.5)Net earnings attributable to Snap-on Incorporated $ 163.0 $ 141.6
Net earnings per share attributable to Snap-on Incorporated:Basic $ 2.87 $ 2.45Diluted 2.82 2.39
Weighted-average shares outstanding:Basic 56.7 57.9Effect of dilutive securities 1.1 1.4Diluted 57.8 59.3
Dividends declared per common share $ 0.82 $ 0.71
Table of Contents
See Notes to Condensed Consolidated Financial Statements.
3
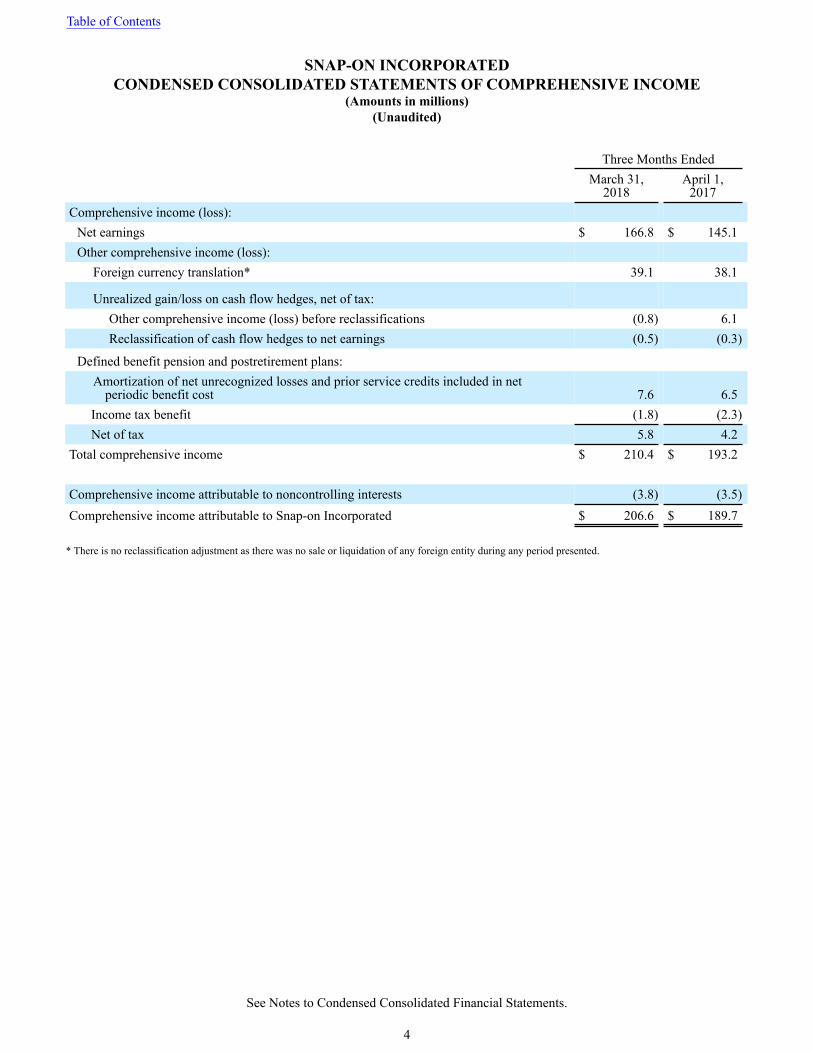
SNAP-ON INCORPORATEDCONDENSED CONSOLIDATED STATEMENTS OF COMPREHENSIVE INCOME
(Amounts in millions)(Unaudited)
Three Months EndedMarch 31,
2018April 1,
2017Comprehensive income (loss):
Net earnings $ 166.8 $ 145.1Other comprehensive income (loss):
Foreign currency translation* 39.1 38.1
Unrealized gain/loss on cash flow hedges, net of tax:Other comprehensive income (loss) before reclassifications (0.8) 6.1Reclassification of cash flow hedges to net earnings (0.5) (0.3)
Defined benefit pension and postretirement plans:Amortization of net unrecognized losses and prior service credits included in net
periodic benefit cost 7.6 6.5Income tax benefit (1.8) (2.3)Net of tax 5.8 4.2
Total comprehensive income $ 210.4 $ 193.2
Comprehensive income attributable to noncontrolling interests (3.8) (3.5)Comprehensive income attributable to Snap-on Incorporated $ 206.6 $ 189.7
* There is no reclassification adjustment as there was no sale or liquidation of any foreign entity during any period presented.
Table of Contents
See Notes to Condensed Consolidated Financial Statements.
4
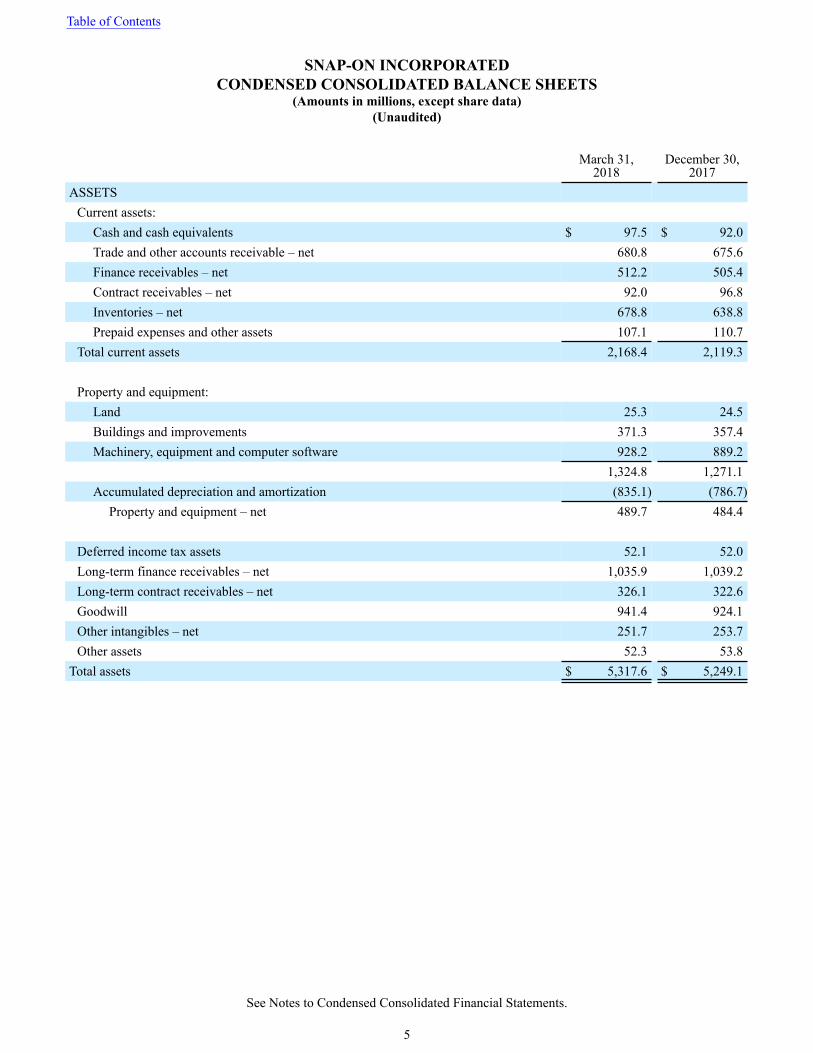
SNAP-ON INCORPORATEDCONDENSED CONSOLIDATED BALANCE SHEETS
(Amounts in millions, except share data)(Unaudited)
March 31,2018
December 30,2017
ASSETSCurrent assets:
Cash and cash equivalents $ 97.5 $ 92.0Trade and other accounts receivable – net 680.8 675.6Finance receivables – net 512.2 505.4Contract receivables – net 92.0 96.8Inventories – net 678.8 638.8Prepaid expenses and other assets 107.1 110.7
Total current assets 2,168.4 2,119.3
Property and equipment:Land 25.3 24.5Buildings and improvements 371.3 357.4Machinery, equipment and computer software 928.2 889.2
1,324.8 1,271.1Accumulated depreciation and amortization (835.1) (786.7)
Property and equipment – net 489.7 484.4
Deferred income tax assets 52.1 52.0Long-term finance receivables – net 1,035.9 1,039.2Long-term contract receivables – net 326.1 322.6Goodwill 941.4 924.1Other intangibles – net 251.7 253.7Other assets 52.3 53.8
Total assets $ 5,317.6 $ 5,249.1
Table of Contents
See Notes to Condensed Consolidated Financial Statements.
5
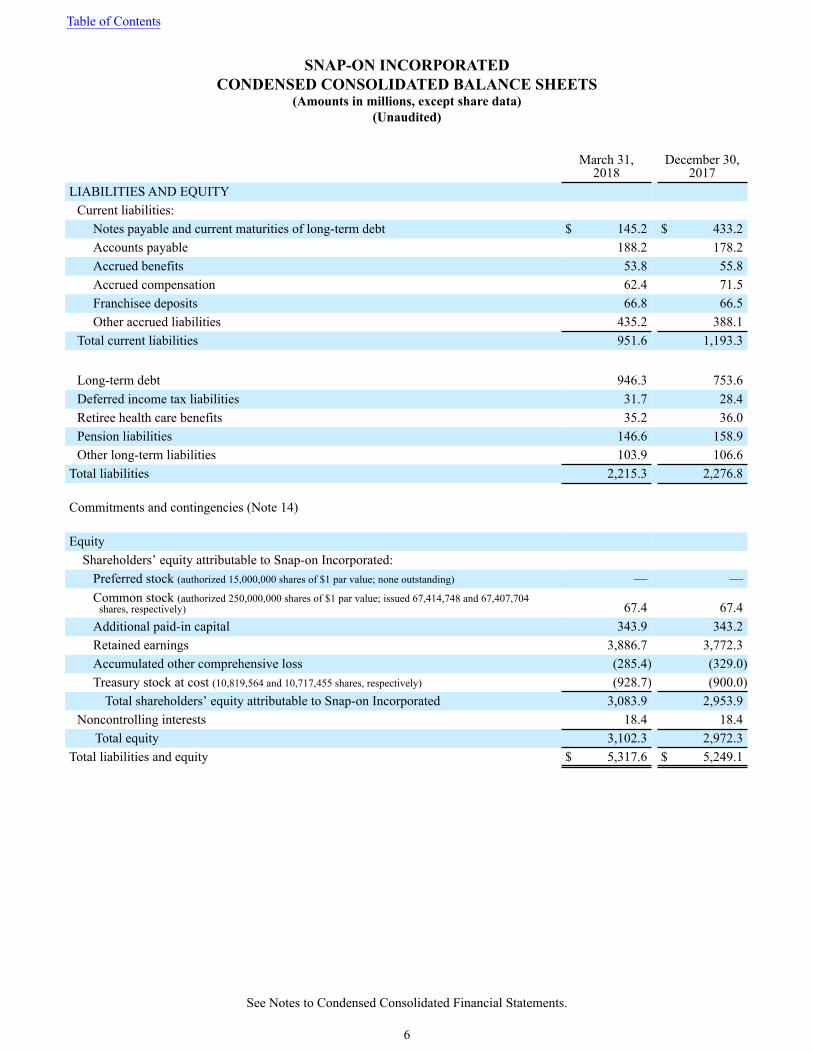
SNAP-ON INCORPORATEDCONDENSED CONSOLIDATED BALANCE SHEETS
(Amounts in millions, except share data)(Unaudited)
March 31,2018
December 30,2017
LIABILITIES AND EQUITYCurrent liabilities:
Notes payable and current maturities of long-term debt $ 145.2 $ 433.2Accounts payable 188.2 178.2Accrued benefits 53.8 55.8Accrued compensation 62.4 71.5Franchisee deposits 66.8 66.5Other accrued liabilities 435.2 388.1
Total current liabilities 951.6 1,193.3
Long-term debt 946.3 753.6Deferred income tax liabilities 31.7 28.4Retiree health care benefits 35.2 36.0Pension liabilities 146.6 158.9Other long-term liabilities 103.9 106.6
Total liabilities 2,215.3 2,276.8
Commitments and contingencies (Note 14)
EquityShareholders’ equity attributable to Snap-on Incorporated:
Preferred stock (authorized 15,000,000 shares of $1 par value; none outstanding) — —Common stock (authorized 250,000,000 shares of $1 par value; issued 67,414,748 and 67,407,704
shares, respectively) 67.4 67.4Additional paid-in capital 343.9 343.2Retained earnings 3,886.7 3,772.3Accumulated other comprehensive loss (285.4) (329.0)Treasury stock at cost (10,819,564 and 10,717,455 shares, respectively) (928.7) (900.0)
Total shareholders’ equity attributable to Snap-on Incorporated 3,083.9 2,953.9Noncontrolling interests 18.4 18.4
Total equity 3,102.3 2,972.3Total liabilities and equity $ 5,317.6 $ 5,249.1
Table of Contents
See Notes to Condensed Consolidated Financial Statements.
6
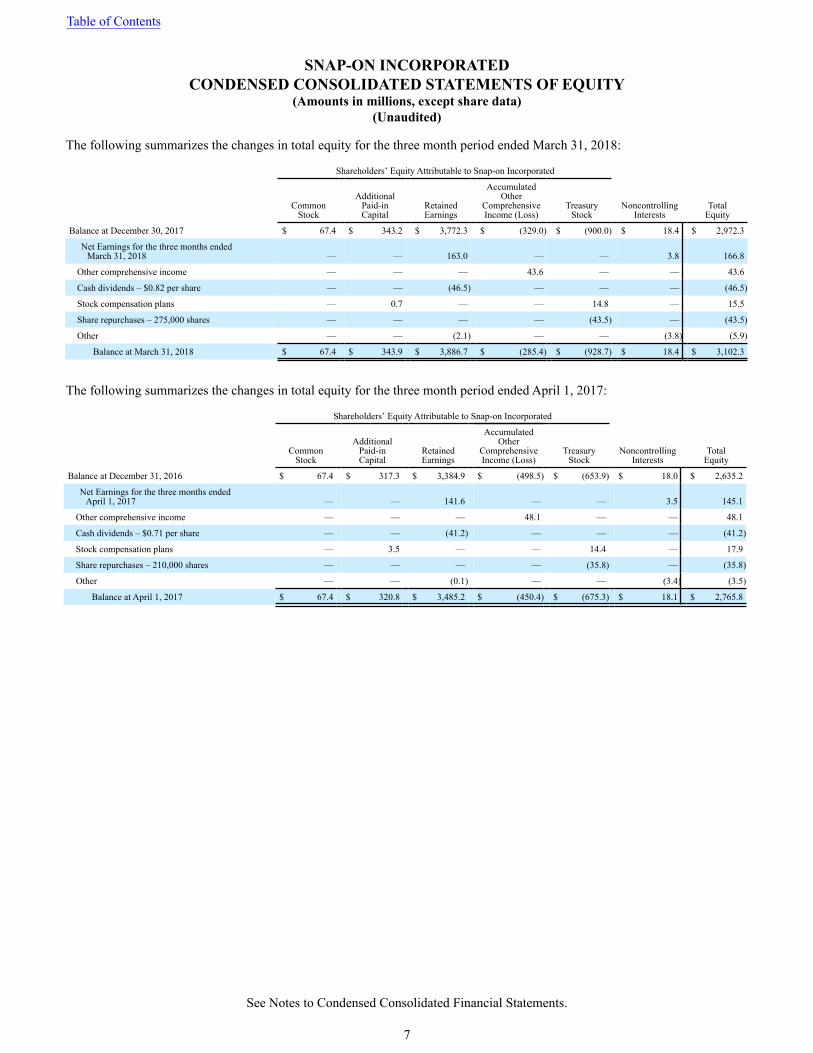
SNAP-ON INCORPORATEDCONDENSED CONSOLIDATED STATEMENTS OF EQUITY
(Amounts in millions, except share data)(Unaudited)
The following summarizes the changes in total equity for the three month period ended March 31, 2018:
Shareholders’ Equity Attributable to Snap-on Incorporated
CommonStock
AdditionalPaid-inCapital
RetainedEarnings
AccumulatedOther
ComprehensiveIncome (Loss)
TreasuryStock
NoncontrollingInterests
TotalEquity
Balance at December 30, 2017 $ 67.4 $ 343.2 $ 3,772.3 $ (329.0) $ (900.0) $ 18.4 $ 2,972.3
Net Earnings for the three months endedMarch 31, 2018 — — 163.0 — — 3.8 166.8
Other comprehensive income — — — 43.6 — — 43.6
Cash dividends – $0.82 per share — — (46.5) — — — (46.5)
Stock compensation plans — 0.7 — — 14.8 — 15.5
Share repurchases – 275,000 shares — — — — (43.5) — (43.5)
Other — — (2.1) — — (3.8) (5.9)
Balance at March 31, 2018 $ 67.4 $ 343.9 $ 3,886.7 $ (285.4) $ (928.7) $ 18.4 $ 3,102.3
The following summarizes the changes in total equity for the three month period ended April 1, 2017:
Shareholders’ Equity Attributable to Snap-on Incorporated
CommonStock
AdditionalPaid-inCapital
RetainedEarnings
AccumulatedOther
ComprehensiveIncome (Loss)
TreasuryStock
NoncontrollingInterests
TotalEquity
Balance at December 31, 2016 $ 67.4 $ 317.3 $ 3,384.9 $ (498.5) $ (653.9) $ 18.0 $ 2,635.2
Net Earnings for the three months endedApril 1, 2017 — — 141.6 — — 3.5 145.1
Other comprehensive income — — — 48.1 — — 48.1
Cash dividends – $0.71 per share — — (41.2) — — — (41.2)
Stock compensation plans — 3.5 — — 14.4 — 17.9
Share repurchases – 210,000 shares — — — — (35.8) — (35.8)
Other — — (0.1) — — (3.4) (3.5)
Balance at April 1, 2017 $ 67.4 $ 320.8 $ 3,485.2 $ (450.4) $ (675.3) $ 18.1 $ 2,765.8
Table of Contents
See Notes to Condensed Consolidated Financial Statements.
7
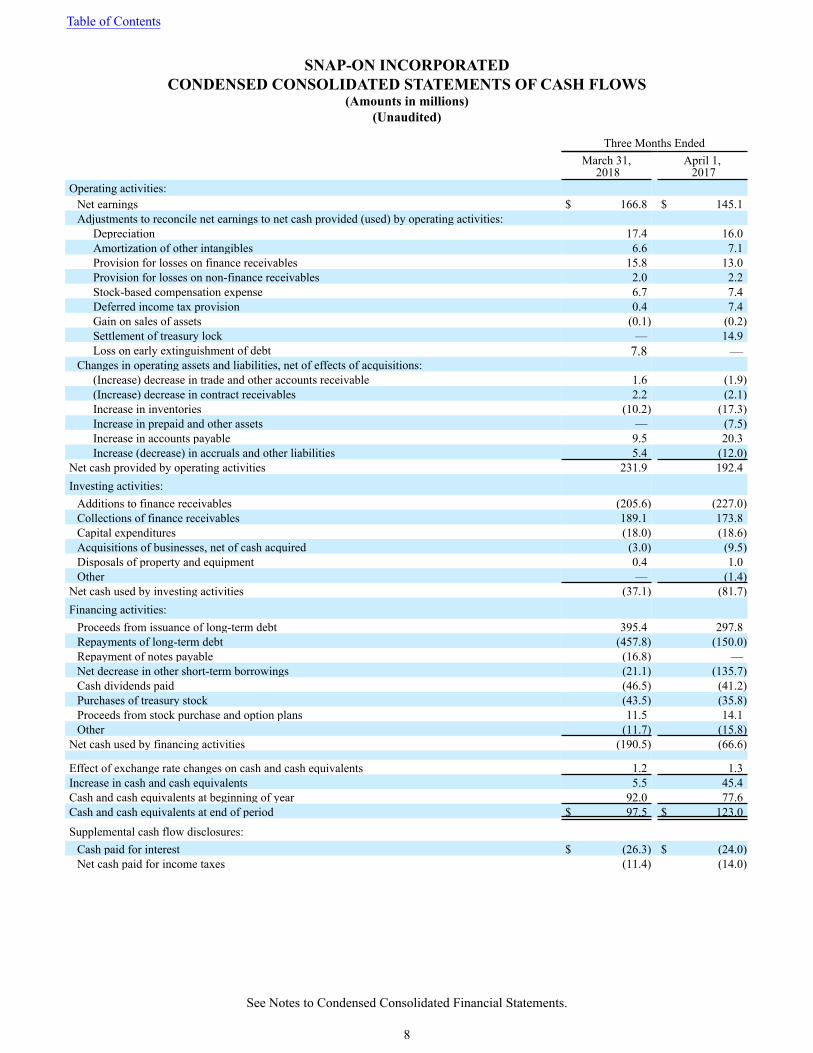
SNAP-ON INCORPORATEDCONDENSED CONSOLIDATED STATEMENTS OF CASH FLOWS
(Amounts in millions)(Unaudited)
Three Months EndedMarch 31,
2018April 1, 2017
Operating activities:Net earnings $ 166.8 $ 145.1Adjustments to reconcile net earnings to net cash provided (used) by operating activities:
Depreciation 17.4 16.0Amortization of other intangibles 6.6 7.1Provision for losses on finance receivables 15.8 13.0Provision for losses on non-finance receivables 2.0 2.2Stock-based compensation expense 6.7 7.4Deferred income tax provision 0.4 7.4Gain on sales of assets (0.1) (0.2)Settlement of treasury lock — 14.9Loss on early extinguishment of debt 7.8 —
Changes in operating assets and liabilities, net of effects of acquisitions:(Increase) decrease in trade and other accounts receivable 1.6 (1.9)(Increase) decrease in contract receivables 2.2 (2.1)Increase in inventories (10.2) (17.3)Increase in prepaid and other assets — (7.5)Increase in accounts payable 9.5 20.3Increase (decrease) in accruals and other liabilities 5.4 (12.0)
Net cash provided by operating activities 231.9 192.4Investing activities:
Additions to finance receivables (205.6) (227.0)Collections of finance receivables 189.1 173.8Capital expenditures (18.0) (18.6)Acquisitions of businesses, net of cash acquired (3.0) (9.5)Disposals of property and equipment 0.4 1.0Other — (1.4)
Net cash used by investing activities (37.1) (81.7)Financing activities:
Proceeds from issuance of long-term debt 395.4 297.8Repayments of long-term debt (457.8) (150.0)Repayment of notes payable (16.8) —Net decrease in other short-term borrowings (21.1) (135.7)Cash dividends paid (46.5) (41.2)Purchases of treasury stock (43.5) (35.8)Proceeds from stock purchase and option plans 11.5 14.1Other (11.7) (15.8)
Net cash used by financing activities (190.5) (66.6)
Effect of exchange rate changes on cash and cash equivalents 1.2 1.3Increase in cash and cash equivalents 5.5 45.4Cash and cash equivalents at beginning of year 92.0 77.6Cash and cash equivalents at end of period $ 97.5 $ 123.0
Supplemental cash flow disclosures:Cash paid for interest $ (26.3) $ (24.0)Net cash paid for income taxes (11.4) (14.0)
Table of Contents
See Notes to Condensed Consolidated Financial Statements.
8
Note 1: Summary of Accounting Policies
Principles of consolidation and presentation
The Condensed Consolidated Financial Statements include the accounts of Snap-on Incorporated and its wholly-owned andmajority-owned subsidiaries (collectively, “Snap-on” or the "company”). These financial statements should be read in conjunctionwith, and have been prepared in conformity with, the accounting principles reflected in the consolidated financial statements andrelated notes included in Snap-on’s 2017 Annual Report on Form 10-K for the fiscal year ended December 30, 2017 (“2017 yearend”). The company’s 2018 fiscal first quarter ended on March 31, 2018; the 2017 fiscal first quarter ended on April 1, 2017. Thecompany’s 2018 and 2017 fiscal first quarters each contained 13 weeks of operating results.
Certain prior year amounts have been reclassified on the Condensed Consolidated Statements of Earnings to conform to the 2018presentation following the retrospective adoption of ASU No. 2017-07, Compensation - Retirement Benefits (Topic 715) - Improvingthe Presentation of Net Periodic Pension Cost and Net Periodic Postretirement Benefit Cost. “Cost of goods sold” of $0.3 millionand “Operating expenses” of $0.4 million in the first quarter of 2017 were reclassified to “Other income (expense) - net”. As aresult, previously reported “Cost of goods sold” of $439.1 million is now $438.8 million, “Operating expenses” of $278.5 millionis now $278.1 million and “Other income (expense) - net” of $1.7 million of expense is now $2.4 million of expense. Additionally,prior year "Operating earnings" for certain reportable business segments have been restated to reflect these reclassifications. SeeNote 17 for information on Snap-on’s reportable business segments.
In the opinion of management, all adjustments (consisting of normal recurring adjustments) necessary for the fair presentation ofthe Condensed Consolidated Financial Statements for the three month periods ended March 31, 2018, and April 1, 2017, havebeen made. Interim results of operations are not necessarily indicative of the results to be expected for the full fiscal year.
Use of Estimates
The preparation of financial statements in conformity with GAAP requires management to make estimates and assumptions thataffect the reported amounts of assets and liabilities, the disclosure of contingent assets and liabilities at the date of the financialstatements, and the reported amounts of revenues and expenses during the reporting period. Actual results could differ from thoseestimates.
Financial Instruments
The fair value of the company’s derivative financial instruments is generally determined using quoted prices in active markets forsimilar assets and liabilities. The carrying value of the company’s non-derivative financial instruments either approximates fairvalue, due to their short-term nature, or the amount disclosed for fair value is based upon a discounted cash flow analysis or quotedmarket values. See Note 9 for further information on financial instruments.
New Accounting Standards
The following new accounting pronouncements were adopted in fiscal year 2018:
In March 2017, the Financial Accounting Standards Board (the "FASB") issued ASU No. 2017-07, Compensation – RetirementBenefits (Topic 715) – Improving the Presentation of Net Periodic Pension Cost and Net Periodic Postretirement Benefit Cost,which provides additional guidance on the presentation of net periodic pension and postretirement benefit costs in the incomestatement and on the components eligible for capitalization. The amendments in this ASU require that an employer report theservice cost component of the net periodic benefit costs in the same income statement line item as other compensation costs arisingfrom services rendered by employees during the period. The non-service-cost components of net periodic benefit costs are to bepresented in the income statement separately from the service cost components and outside a subtotal of income from operations.The ASU also allows for the capitalization of the service cost components, when applicable (i.e., as a cost of internally manufacturedinventory or a self-constructed asset).
Snap-on adopted this ASU at the beginning of its 2018 fiscal year, with the changes related to the presentation in the statementsof earnings of the service cost and non-service-cost components of net periodic benefit costs applied retrospectively, using thepractical expedient permitting the use of the amounts disclosed in pension and other postretirement benefit plan notes as theestimation basis for the presentation of the prior comparative periods. For fiscal 2018 and all comparative periods, the non-service-
Table of ContentsSNAP-ON INCORPORATED
NOTES TO CONDENSED CONSOLIDATED FINANCIAL STATEMENTS(Unaudited)
9
cost components of net periodic benefit costs are included in “Other income (expense) - net” on the accompanying condensedconsolidated statements of earnings. Beginning in fiscal 2018, changes related to the capitalization in assets of the service costcomponent of net periodic benefit costs were applied prospectively. The adoption of this ASU did not have a significant impacton the company’s Condensed Consolidated Statements of Earnings.
In October 2016, the FASB issued ASU No. 2016-16, Income Taxes (Topic 740) – Intra-Entity Transfers of Assets Other ThanInventory. The ASU eliminates the requirement to defer the recognition of current and deferred income taxes for an intra-entityasset transfer until the asset has been sold to an outside party. Under the new guidance, an entity should recognize the income taxconsequences of an intra-entity transfer of an asset other than inventory when the transfer occurs. The ASU is effective for fiscalyears beginning after December 15, 2017, including interim periods within those fiscal years. The amendments in this ASU wereto be applied on a modified retrospective basis through a cumulative-effect adjustment directly to retained earnings at the time ofadoption. The adoption of this ASU did not have an impact on the company's consolidated financial statements.
In August 2016, the FASB issued ASU No. 2016-15, Statement of Cash Flows (Topic 230), which adds and/or clarifies guidanceon the classification of certain cash receipts and payments in the statement of cash flows. The new guidance is intended to reducediversity in practice in how certain transactions are classified in the statement of cash flows. This ASU is effective for fiscal yearsbeginning after December 15, 2017, including interim periods within those fiscal years. The adoption of the ASU did not have asignificant impact to the designations of operating, investing and financing activities on the company's Condensed ConsolidatedStatements of Cash Flows.
On December 31, 2017, the beginning of Snap-on’s 2018 fiscal year, Snap-on adopted ASU No. 2014-09, Revenue from Contractswith Customers (Topic 606), which outlines a single comprehensive model for entities to use in accounting for revenue arisingfrom contracts with customers and supersedes most current revenue recognition guidance, including industry-specific guidance.Topic 606 is based on the principle that an entity should recognize revenue to depict the transfer of goods or services to customersin an amount that reflects the consideration to which the entity expects to be entitled in exchange for those goods or services. Topic606 also requires additional disclosure about the nature, amount, timing and uncertainty of revenue and cash flows arising fromcustomer contracts, including significant judgments and changes in judgments and assets recognized from costs incurred to fulfilla contract. Snap-on adopted Topic 606 using the modified retrospective approach applied to those contracts that were not completedas of December 31, 2017, which means Topic 606 has been applied to the fiscal 2018 financial statements and disclosures goingforward, but that prior period financial statements and disclosures reflect the prior revenue recognition standard. See Note 2 foradditional information on revenue recognition.
Snap-on’s revenues are primarily from the selling of products that are shipped and billed, services provided to customers and fromsubscriptions, including software subscriptions. Approximately 90% of net sales are earned at a point in time through ship-and-bill performance obligations. The remaining performance obligations that are recorded over time relate primarily to softwaresubscriptions and to a lesser extent extended warranty and other subscription agreements. Revenues are recognized when controlis transferred to customers, in an amount that reflects the consideration Snap-on expects to be entitled to in exchange for thosegoods and services. Revenue recognition is evaluated through the following five steps: (i) identification of the contract, or contracts,with a customer; (ii) identification of the performance obligations in the contract; (iii) determination of the transaction price; (iv)allocation of the transaction price to the performance obligations in the contract; and (v) recognition of revenue when or as aperformance obligation is satisfied.
Revenue related to software subscriptions, as well as extended warranty and other subscription agreements, is generally recognizedover time on a ratable basis over the contract term beginning on the date that our service is made available to the customer.
Contracts with customers may include multiple performance obligations related to sales of hardware, software and software-relatedservices. For these contracts, individual performance obligations are recorded separately if they are distinct. The transaction price,including any discounts, is allocated to each separate performance obligation based on its relative standalone selling price. Thestandalone selling prices are determined based on the prices charged to customers or by using an expected cost plus margin approach.The amount assigned to the products or services is recognized when the product is delivered and/or when the services are performed.In instances where the product and/or services are performed over an extended period, as is the case with subscription agreements,revenue is generally recognized over time on a ratable basis using a time-based output method applied over the contract termbeginning on the date that the service is made available to the customer. These contracts are generally for 12 months but can befor a term up to 60 months.
Table of ContentsSNAP-ON INCORPORATED
NOTES TO CONDENSED CONSOLIDATED FINANCIAL STATEMENTS (continued)(Unaudited)
10
Franchise fee revenue, including nominal, non-refundable initial fees, is recognized upon the granting of a franchise, which iswhen the company has performed substantially all initial services required by the franchise agreement. Franchise fee revenue alsoincludes ongoing monthly fees (primarily for sales and business training as well as marketing and product promotion programs)that are recognized as the fees are earned. Franchise fee revenue totaled $3.9 million for the three month period ended March 31,2018. The following new accounting pronouncements, and related impacts on adoption, are being evaluated by the company:
In February 2018, the FASB issued ASU No. 2018-02, Income Statement - Reporting Comprehensive Income - Reclassificationof Certain Tax Effects from Accumulated Other Comprehensive Income (Topic 220), which allows for a reclassification fromaccumulated other comprehensive income to retained earnings for stranded tax effects resulting from the Tax Cuts and Jobs Act(the "Tax Act"). ASU No. 2018-02 is effective for fiscal years beginning after December 15, 2018, including interim periodswithin those fiscal years; the ASU allows for early adoption in any interim period after issuance of the update. The company iscurrently assessing the impact this ASU will have on its consolidated financial statements.
In August 2017, the FASB issued ASU No. 2017-12, Derivatives and Hedging (Topic 815) – Targeted Improvements to Accountingfor Hedging Activities, which improves the financial reporting of hedging relationships to better portray the economic results ofan entity’s risk management activities in its financial statements. The amendments in this update also make certain targetedimprovements to simplify the application of the hedge accounting guidance in current GAAP. ASU No. 2017-12 is effective forfiscal years beginning after December 15, 2018, including interim periods within those fiscal years; the ASU allows for earlyadoption in any interim period after issuance of the update. The company is currently assessing the impact this ASU will have onits consolidated financial statements.
In June 2016, the FASB issued ASU No. 2016-13, Financial Instruments – Credit Losses (Topic 326), to require the measurementof expected credit losses for financial instruments held at the reporting date based on historical experience, current conditions andreasonable forecasts. The main objective of this ASU is to provide financial statement users with more decision-useful informationabout the expected credit losses on financial instruments and other commitments to extend credit held by a reporting entity at eachreporting date. ASU No. 2016-13 is effective for fiscal years beginning after December 15, 2019, including interim periods withinthose fiscal years; the ASU allows for early adoption as of the beginning of an interim or annual reporting period beginning afterDecember 15, 2018. The company is currently assessing the impact this ASU will have on its consolidated financial statements.
In February 2016, the FASB issued ASU No. 2016-02, Leases (Topic 842), to increase transparency and comparability amongorganizations by recognizing lease assets and lease liabilities on the balance sheet and disclosing key information about leasingarrangements. The ASU is intended to represent an improvement over previous GAAP, which did not require lease assets and leaseliabilities to be recognized for most leases. This ASU, which supersedes most current lease guidance, affects any entity that entersinto a lease (as that term is defined in the ASU), with some specified scope exemptions. ASU No. 2016-02 is effective for fiscalyears beginning after December 15, 2018, including interim periods within those fiscal years; the ASU allows for early adoptionas of the beginning of an interim or annual reporting period. The company is currently assessing the impact this ASU will haveon its consolidated financial statements.
Note 2: Revenue Recognition
Snap-on recognizes revenue from the sale of tools, diagnostic and equipment products and related services based on when controlof the product passes to the customer or the service is provided and is recognized at an amount that reflects the considerationexpected to be received in exchange for such goods or services.
Table of ContentsSNAP-ON INCORPORATED
NOTES TO CONDENSED CONSOLIDATED FINANCIAL STATEMENTS (continued)(Unaudited)
11
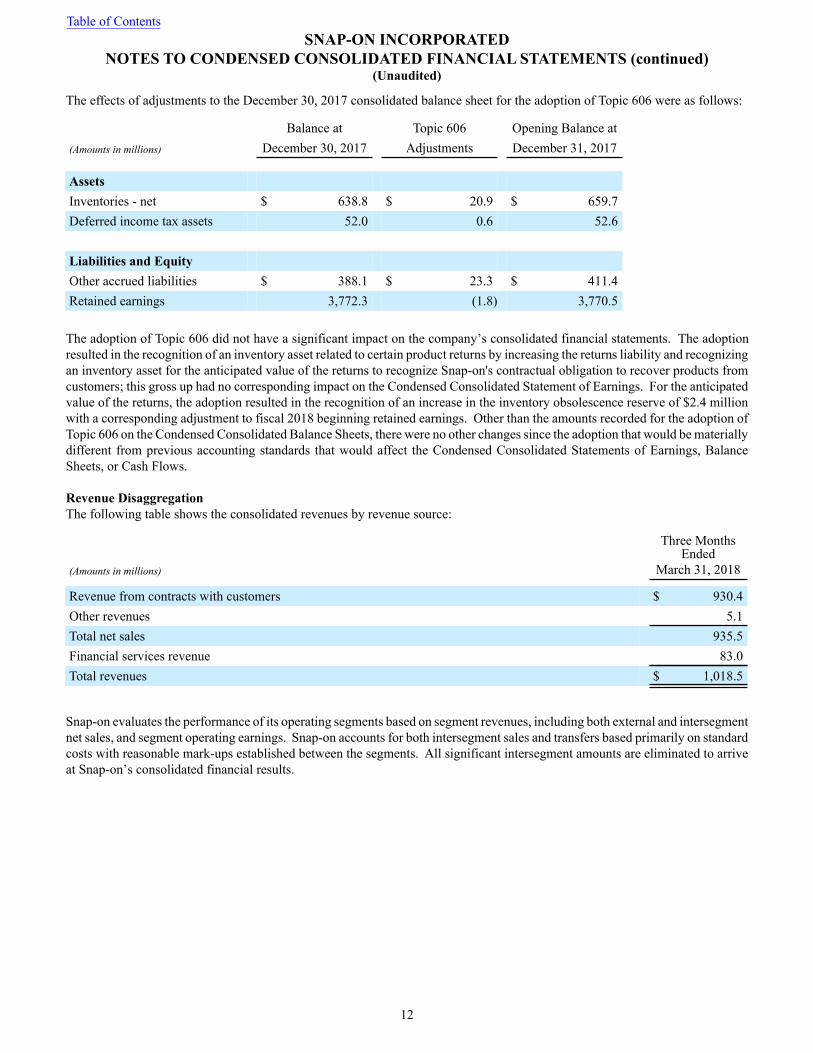
The effects of adjustments to the December 30, 2017 consolidated balance sheet for the adoption of Topic 606 were as follows:
Balance at Topic 606 Opening Balance at(Amounts in millions) December 30, 2017 Adjustments December 31, 2017
AssetsInventories - net $ 638.8 $ 20.9 $ 659.7Deferred income tax assets 52.0 0.6 52.6
Liabilities and EquityOther accrued liabilities $ 388.1 $ 23.3 $ 411.4Retained earnings 3,772.3 (1.8) 3,770.5
The adoption of Topic 606 did not have a significant impact on the company’s consolidated financial statements. The adoptionresulted in the recognition of an inventory asset related to certain product returns by increasing the returns liability and recognizingan inventory asset for the anticipated value of the returns to recognize Snap-on's contractual obligation to recover products fromcustomers; this gross up had no corresponding impact on the Condensed Consolidated Statement of Earnings. For the anticipatedvalue of the returns, the adoption resulted in the recognition of an increase in the inventory obsolescence reserve of $2.4 millionwith a corresponding adjustment to fiscal 2018 beginning retained earnings. Other than the amounts recorded for the adoption ofTopic 606 on the Condensed Consolidated Balance Sheets, there were no other changes since the adoption that would be materiallydifferent from previous accounting standards that would affect the Condensed Consolidated Statements of Earnings, BalanceSheets, or Cash Flows.
Revenue DisaggregationThe following table shows the consolidated revenues by revenue source:
Three MonthsEnded
(Amounts in millions) March 31, 2018
Revenue from contracts with customers $ 930.4Other revenues 5.1Total net sales 935.5Financial services revenue 83.0Total revenues $ 1,018.5
Snap-on evaluates the performance of its operating segments based on segment revenues, including both external and intersegmentnet sales, and segment operating earnings. Snap-on accounts for both intersegment sales and transfers based primarily on standardcosts with reasonable mark-ups established between the segments. All significant intersegment amounts are eliminated to arriveat Snap-on’s consolidated financial results.
Table of ContentsSNAP-ON INCORPORATED
NOTES TO CONDENSED CONSOLIDATED FINANCIAL STATEMENTS (continued)(Unaudited)
12
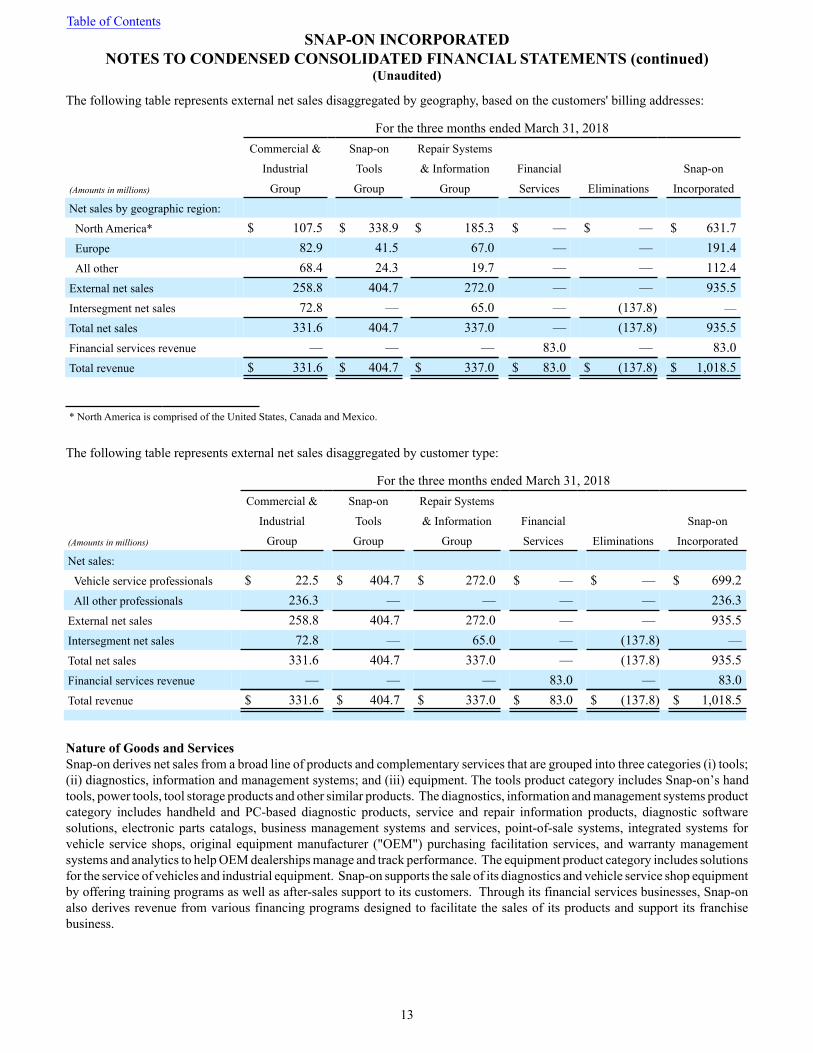
The following table represents external net sales disaggregated by geography, based on the customers' billing addresses:
For the three months ended March 31, 2018Commercial & Snap-on Repair Systems
Industrial Tools & Information Financial Snap-on
(Amounts in millions) Group Group Group Services Eliminations Incorporated
Net sales by geographic region:
North America* $ 107.5 $ 338.9 $ 185.3 $ — $ — $ 631.7Europe 82.9 41.5 67.0 — — 191.4All other 68.4 24.3 19.7 — — 112.4
External net sales 258.8 404.7 272.0 — — 935.5Intersegment net sales 72.8 — 65.0 — (137.8) —
Total net sales 331.6 404.7 337.0 — (137.8) 935.5Financial services revenue — — — 83.0 — 83.0Total revenue $ 331.6 $ 404.7 $ 337.0 $ 83.0 $ (137.8) $ 1,018.5
* North America is comprised of the United States, Canada and Mexico.
The following table represents external net sales disaggregated by customer type:
For the three months ended March 31, 2018Commercial & Snap-on Repair Systems
Industrial Tools & Information Financial Snap-on
(Amounts in millions) Group Group Group Services Eliminations Incorporated
Net sales:
Vehicle service professionals $ 22.5 $ 404.7 $ 272.0 $ — $ — $ 699.2All other professionals 236.3 — — — — 236.3
External net sales 258.8 404.7 272.0 — — 935.5Intersegment net sales 72.8 — 65.0 — (137.8) —Total net sales 331.6 404.7 337.0 — (137.8) 935.5Financial services revenue — — — 83.0 — 83.0Total revenue $ 331.6 $ 404.7 $ 337.0 $ 83.0 $ (137.8) $ 1,018.5
Nature of Goods and ServicesSnap-on derives net sales from a broad line of products and complementary services that are grouped into three categories (i) tools;(ii) diagnostics, information and management systems; and (iii) equipment. The tools product category includes Snap-on’s handtools, power tools, tool storage products and other similar products. The diagnostics, information and management systems productcategory includes handheld and PC-based diagnostic products, service and repair information products, diagnostic softwaresolutions, electronic parts catalogs, business management systems and services, point-of-sale systems, integrated systems forvehicle service shops, original equipment manufacturer ("OEM") purchasing facilitation services, and warranty managementsystems and analytics to help OEM dealerships manage and track performance. The equipment product category includes solutionsfor the service of vehicles and industrial equipment. Snap-on supports the sale of its diagnostics and vehicle service shop equipmentby offering training programs as well as after-sales support to its customers. Through its financial services businesses, Snap-onalso derives revenue from various financing programs designed to facilitate the sales of its products and support its franchisebusiness.
Table of ContentsSNAP-ON INCORPORATED
NOTES TO CONDENSED CONSOLIDATED FINANCIAL STATEMENTS (continued)(Unaudited)
13
Approximately 90% of Snap-on’s net sales are products sold at a point in time through ship-and-bill performance obligations thatalso includes service repair services. The remaining sales revenue is earned over time primarily on a subscription basis includingsoftware, extended warranty and other subscription service agreements.
Snap-on enters into contracts related to the selling of tools, diagnostic and repair information and equipment products and relatedservices. At contract inception, an assessment of the goods and services promised in the contracts with customers is performedand a performance obligation is identified for each distinct promise to transfer to the customer a good or service (or bundle ofgoods or services). To identify the performance obligations, Snap-on considers all of the goods or services promised in the contractregardless of whether they are explicitly stated or are implied by customary business practices. Contracts with customers arecomprised of customer purchase orders, invoices and written contracts.
When Performance Obligations Are SatisfiedFor performance obligations related to the majority of ship-and-bill products, including repair services contracts, control transfersat a point in time when title transfers upon shipment of the product to the customer, and for some sales, control transfers whentitle is transferred at time of receipt by customer. Once a product or repaired product has shipped or has been delivered, thecustomer is able to direct the use of, and obtain substantially all of the remaining benefits from, the asset. Snap-on considerscontrol to have transferred upon shipment or delivery because Snap-on has a present right to payment at that time, the customerhas legal title to the asset, Snap-on has transferred physical possession of the asset, and the customer has significant risk andrewards of ownership of the asset.
For performance obligations related to software subscriptions, extended warranties and other subscription agreements, Snap-ontransfers control and recognizes revenue over time on a ratable basis using a time-based output method. The performance obligationsare typically satisfied as services are rendered on a straight-line basis over the contract term, which is generally for 12 months butcan be for a term up to 60 months.
Significant Payment TermsFor ship-and-bill type contracts with customers, the contract states the final terms of the sale, including the description, quantity,and price of each product or service purchased. Payment terms are typically due upon delivery or up to 30 days after delivery butcan range up to 120 days after delivery.
For subscription contracts, payment terms are in advance or in arrears of services on a monthly, quarterly or annual basis over thecontract term, which is generally for 12 months but can be for a term up to 60 months depending on the product or service. Thecustomer typically agrees to a stated rate and price in the contract that does not vary over the contract term. In some cases, customersprepay for their licenses, or in other cases, pay on a monthly or quarterly basis. When the timing of the payment made by thecustomer precedes the delivery of the performance obligation, a contract liability is recognized.
Variable ConsiderationIn some cases, the nature of Snap-on’s contracts give rise to variable consideration, including rebates, credits, allowances forreturns or other similar items that generally decrease the transaction price. These variable amounts generally are credited to thecustomer, based on achieving certain levels of sales activity, product returns and making payments within specific terms.
In the normal course of business, Snap-on allows franchisees to return product per the provisions in the franchise agreement thatallow for the return of product in a saleable condition. For other customers, product returns are generally not accepted unless theitem is defective as manufactured. Where applicable, Snap-on establishes provisions for estimated sales returns. Estimated productreturns are recorded as a reduction in reported revenues at the time of sale based upon historical product return experience and isadjusted for known trends to arrive at the amount of consideration to which Snap-on expects to receive.
Variable consideration is estimated at the most likely amount that is expected to be earned. Estimated amounts are included in thetransaction price to the extent it is probable that a significant reversal of cumulative revenue recognized will not occur when theuncertainty associated with the variable consideration is resolved. Estimates of variable consideration and determination of whetherto include estimated amounts in the transaction price are based largely on an assessment of the anticipated performance and allinformation (historical, current and forecasted) that is reasonably available.
WarrantiesSnap-on allows customers to return product when the product is defective as manufactured. Where applicable, Snap-on establishesprovisions for estimated warranties. Estimated product warranties are provided for specific product lines and Snap-on accrues for
Table of ContentsSNAP-ON INCORPORATED
NOTES TO CONDENSED CONSOLIDATED FINANCIAL STATEMENTS (continued)(Unaudited)
14
estimated future warranty cost in the period in which the sale is recorded. The costs are included in “Cost of goods sold” on theaccompanying Condensed Consolidated Statements of Earnings. Snap-on calculates its accrual requirements based on historicwarranty loss experience that is periodically adjusted for recent actual experience, including the timing of claims during the warrantyperiod and actual costs incurred. Snap-on does not typically provide customers with the right to a refund.
Practical Expedients and ExemptionsSnap-on typically expenses incremental direct costs of obtaining a contract (sales commissions) when incurred because theamortization period is generally 12 months or less. Capitalized long-term contract costs are not significant. Contract costs areexpensed or amortized in “Operating expenses” on the accompanying Condensed Consolidated Statements of Earnings.
Snap-on elected to account for shipping and handling activities that occur after control of the related good transfers to the customeras fulfillment activities and are therefore recognized upon shipment of the goods.
Snap-on has applied the portfolio approach to its ship-and-bill contracts that have similar characteristics as it reasonably expectsthat the effects on the financial statements of applying this guidance to the portfolio of contracts would not differ materially fromapplying this guidance to the individual contracts within the portfolio.
Snap-on typically excludes from its transaction price any amounts collected from customers for sales (and similar) taxes.
For certain performance obligations related to software subscriptions, extended warranty and other subscription agreements thatare settled over time, Snap-on has elected not to disclose the value of unsatisfied performance obligations for: (i) contracts thathave an original expected length of one year or less; (ii) contracts where revenue is recognized as invoiced; and (iii) contracts withvariable consideration related to unsatisfied performance obligations. The remaining duration of these unsatisfied performanceobligations range from one month up to 60 months. Snap-on had approximately $216.0 million of long-term contracts that havefixed consideration that extends beyond one year as of March 31, 2018. Snap-on expects to recognize approximately 65% of thesecontracts as revenue by the end of fiscal 2019, an additional 25% by the end of fiscal 2021 and the balance thereafter.
Contract Liabilities (Deferred Revenues)Contract liabilities are recorded when cash payments are received in advance of Snap-on’s performance. The timing of paymentis typically on a monthly, quarterly or annual basis. The balance of total contract liabilities at March 31, 2018 was $56.1 millionand $49.4 million at the beginning of fiscal 2018. The current portion of contract liabilities and the non-current portion are includedin “Other accrued liabilities” and “Other long-term liabilities”, respectively, on the accompanying Condensed Consolidated BalanceSheets. During the three months ended March 31, 2018, Snap-on recognized revenue of $24.0 million that was included in thecontract liability balance at the beginning of the period, which was primarily from the amortization of software subscriptions,extended warranties and other subscription agreements. The increase in the total contract liabilities balance is primarily drivenby the timing of cash payments received or due in advance of satisfying Snap-on’s performance obligations and growth in certainsoftware subscriptions, partially offset by revenues recognized that were included in the contract liability balance at the beginningof the period.
Revenue Recognition Prior to 2018Revenue recognition for fiscal 2017, as presented, is based upon the accounting revenue recognition standard of Topic 605, RevenueRecognition. Snap-on recognized revenue from the sale of tools and diagnostic and equipment products when contract terms weremet, the price was fixed or determinable, collectability was reasonably assured and a product was shipped or risk of ownershiphad been transferred to and accepted by the customer. For sales contingent upon customer acceptance, revenue recognition wasdeferred until such obligations were fulfilled. Estimated product returns were recorded as a reduction in reported revenues at thetime of sale based upon historical product return experience and gross profit margin was adjusted for known trends. Provisionsfor customer volume rebates, discounts and allowances were also recorded as a reduction in reported revenues at the time of salebased on historical experience and known trends. Revenue related to extended warranty and subscription agreements was recognizedover the terms of the respective agreements.
Snap-on also recognized revenue related to multiple element arrangements, including sales of hardware, software and software-related services. When a sales arrangement contained multiple elements, such as hardware and software products and/or services,Snap‑on used the relative selling price method to allocate revenues between hardware and software elements. For software elementsthat were not essential to the hardware’s functionality and related software post-contract customer support, vendor specific objectiveevidence (“VSOE”) of fair value was used to further allocate revenue to each element based on its relative fair value and, whennecessary, the residual method was used to assign value to the delivered elements when VSOE only existed for the undelivered
Table of ContentsSNAP-ON INCORPORATED
NOTES TO CONDENSED CONSOLIDATED FINANCIAL STATEMENTS (continued)(Unaudited)
15
elements. The amount assigned to the products or services was recognized when the product was delivered and/or when the serviceswere performed. In instances where the product and/or services were performed over an extended period, as is the case withsubscription agreements or the providing of ongoing support, revenue was generally recognized on a straight-line basis over theterm of the agreement, which generally ranged from 12 months to 60 months.
Franchise fee revenue, including nominal, non-refundable initial fees, was recognized upon the granting of a franchise, which waswhen the company performed substantially all initial services required by the franchise agreement. Franchise fee revenue alsoincluded ongoing monthly fees (primarily for sales and business training as well as marketing and product promotion programs)that were recognized as the fees were earned. Franchise fee revenue totaled $3.5 million for the three month period ended April1, 2017.
Note 3: Acquisitions
On January 31, 2018, Snap-on acquired substantially all of the assets of George A. Sturdevant, Inc. (d/b/a Fastorq) for a cashpurchase price of $3.0 million. Fastorq, based in New Caney, Texas, designs, assembles and distributes hydraulic torque andhydraulic tensioning products for use in critical industries. As of the first quarter of 2018, the company has substantially completedthe purchase accounting valuations for the acquired net assets of Fastorq. The $2.6 million excess of the purchase price over thefair value of the net assets acquired was recorded in “Goodwill” on the accompanying Condensed Consolidated Balance Sheets.
On July 28, 2017, Snap-on acquired Torque Control Specialists Pty Ltd (“TCS”) for a cash purchase price of $3.6 million (or $3.5million, net of cash acquired). TCS distributes a full range of torque products, including wrenches, multipliers and calibrators foruse in critical industries. As of the first quarter of 2018, the company has substantially completed the purchase accounting valuationsfor the acquired net assets of TCS. The $2.3 million excess of purchase price over the fair value of the net assets acquired wasrecorded in “Goodwill” on the accompanying Condensed Consolidated Balance Sheets.
On May 4, 2017, Snap-on acquired Norbar Torque Tools Holdings Limited, along with its U.S. and Chinese joint ventures (“Norbar”)for a cash purchase price of $71.6 million (or $69.9 million, net of cash acquired). Norbar designs and manufactures a full rangeof torque products, including wrenches, multipliers and calibrators for use in critical industries. As of the first quarter of 2018,the company has substantially completed the purchase accounting valuations for the acquired net assets of Norbar, includingintangible assets. The $26.5 million excess of purchase price over the fair value of the net assets acquired was recorded in “Goodwill”on the accompanying Condensed Consolidated Balance Sheets.
On January 30, 2017, Snap-on acquired BTC Global Limited (“BTC”) for a cash purchase price of $9.2 million. BTC designs andimplements automotive vehicle inspection and management software for OEM franchise repair shops. In the second quarter of2017, the company completed the purchase accounting valuations for the acquired net assets of BTC, including intangible assets.The $5.9 million excess of purchase price over the fair value of the net assets acquired was recorded in “Goodwill” on theaccompanying Condensed Consolidated Balance Sheets.
For segment reporting purposes, the results of operations and assets of Fastorq, TCS and Norbar have been included in theCommercial & Industrial Group since the acquisition date and the results of operations and assets of BTC have been included inthe Repair Systems and Information Group since the acquisition date.
Pro forma financial information has not been presented for any of these acquisitions as the net effects, individually and collectively,were neither significant nor material to Snap-on’s results of operations or financial position. See Note 6 for further informationon goodwill and other intangible assets.
Note 4: Receivables
Trade and Other Accounts Receivable
Snap-on’s trade and other accounts receivable primarily arise from the sale of tools and diagnostic and equipment products to abroad range of industrial and commercial customers and to Snap-on’s independent franchise van channel on a non-extended-termbasis with payment terms generally ranging from 30 to 120 days.
Table of ContentsSNAP-ON INCORPORATED
NOTES TO CONDENSED CONSOLIDATED FINANCIAL STATEMENTS (continued)(Unaudited)
16
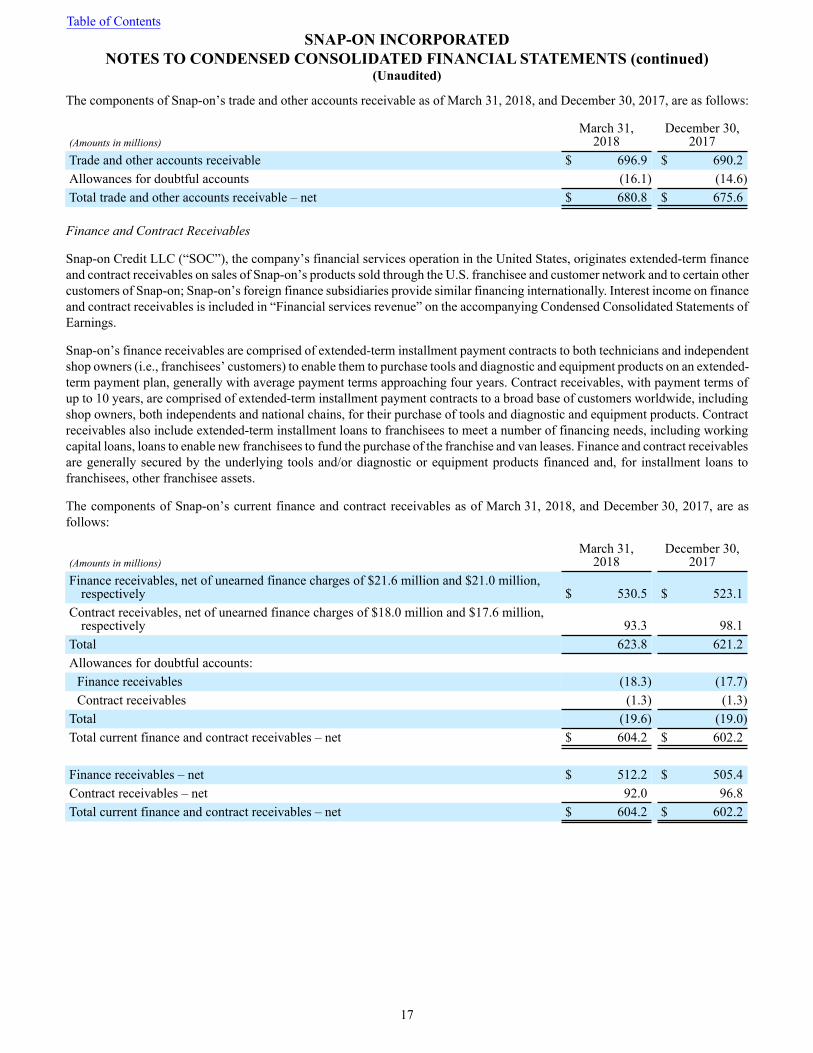
The components of Snap-on’s trade and other accounts receivable as of March 31, 2018, and December 30, 2017, are as follows:
(Amounts in millions)March 31,
2018December 30,
2017Trade and other accounts receivable $ 696.9 $ 690.2Allowances for doubtful accounts (16.1) (14.6)Total trade and other accounts receivable – net $ 680.8 $ 675.6
Finance and Contract Receivables
Snap-on Credit LLC (“SOC”), the company’s financial services operation in the United States, originates extended-term financeand contract receivables on sales of Snap-on’s products sold through the U.S. franchisee and customer network and to certain othercustomers of Snap-on; Snap-on’s foreign finance subsidiaries provide similar financing internationally. Interest income on financeand contract receivables is included in “Financial services revenue” on the accompanying Condensed Consolidated Statements ofEarnings.
Snap-on’s finance receivables are comprised of extended-term installment payment contracts to both technicians and independentshop owners (i.e., franchisees’ customers) to enable them to purchase tools and diagnostic and equipment products on an extended-term payment plan, generally with average payment terms approaching four years. Contract receivables, with payment terms ofup to 10 years, are comprised of extended-term installment payment contracts to a broad base of customers worldwide, includingshop owners, both independents and national chains, for their purchase of tools and diagnostic and equipment products. Contractreceivables also include extended-term installment loans to franchisees to meet a number of financing needs, including workingcapital loans, loans to enable new franchisees to fund the purchase of the franchise and van leases. Finance and contract receivablesare generally secured by the underlying tools and/or diagnostic or equipment products financed and, for installment loans tofranchisees, other franchisee assets.
The components of Snap-on’s current finance and contract receivables as of March 31, 2018, and December 30, 2017, are asfollows:
(Amounts in millions)March 31,
2018December 30,
2017Finance receivables, net of unearned finance charges of $21.6 million and $21.0 million,
respectively $ 530.5 $ 523.1Contract receivables, net of unearned finance charges of $18.0 million and $17.6 million,
respectively 93.3 98.1Total 623.8 621.2Allowances for doubtful accounts:
Finance receivables (18.3) (17.7)Contract receivables (1.3) (1.3)
Total (19.6) (19.0)Total current finance and contract receivables – net $ 604.2 $ 602.2
Finance receivables – net $ 512.2 $ 505.4Contract receivables – net 92.0 96.8Total current finance and contract receivables – net $ 604.2 $ 602.2
Table of ContentsSNAP-ON INCORPORATED
NOTES TO CONDENSED CONSOLIDATED FINANCIAL STATEMENTS (continued)(Unaudited)
17
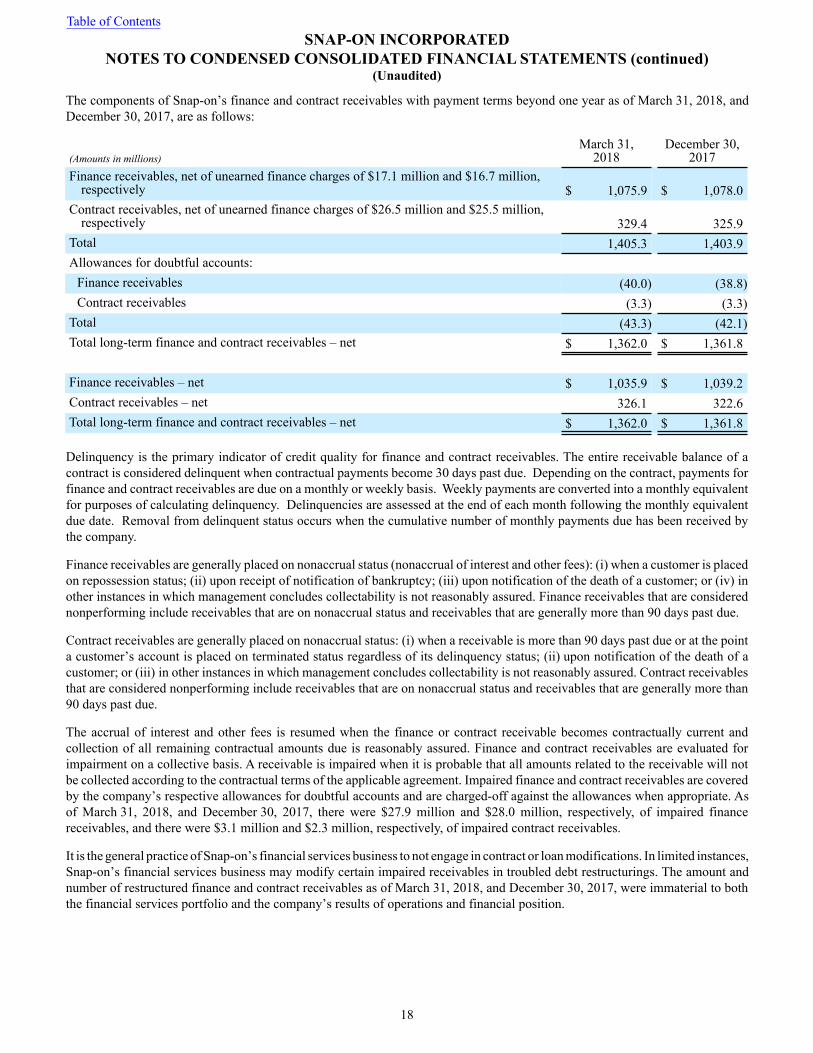
The components of Snap-on’s finance and contract receivables with payment terms beyond one year as of March 31, 2018, andDecember 30, 2017, are as follows:
(Amounts in millions)March 31,
2018December 30,
2017Finance receivables, net of unearned finance charges of $17.1 million and $16.7 million,
respectively $ 1,075.9 $ 1,078.0Contract receivables, net of unearned finance charges of $26.5 million and $25.5 million,
respectively 329.4 325.9Total 1,405.3 1,403.9Allowances for doubtful accounts:
Finance receivables (40.0) (38.8)Contract receivables (3.3) (3.3)
Total (43.3) (42.1)Total long-term finance and contract receivables – net $ 1,362.0 $ 1,361.8
Finance receivables – net $ 1,035.9 $ 1,039.2Contract receivables – net 326.1 322.6Total long-term finance and contract receivables – net $ 1,362.0 $ 1,361.8
Delinquency is the primary indicator of credit quality for finance and contract receivables. The entire receivable balance of acontract is considered delinquent when contractual payments become 30 days past due. Depending on the contract, payments forfinance and contract receivables are due on a monthly or weekly basis. Weekly payments are converted into a monthly equivalentfor purposes of calculating delinquency. Delinquencies are assessed at the end of each month following the monthly equivalentdue date. Removal from delinquent status occurs when the cumulative number of monthly payments due has been received bythe company.
Finance receivables are generally placed on nonaccrual status (nonaccrual of interest and other fees): (i) when a customer is placedon repossession status; (ii) upon receipt of notification of bankruptcy; (iii) upon notification of the death of a customer; or (iv) inother instances in which management concludes collectability is not reasonably assured. Finance receivables that are considerednonperforming include receivables that are on nonaccrual status and receivables that are generally more than 90 days past due.
Contract receivables are generally placed on nonaccrual status: (i) when a receivable is more than 90 days past due or at the pointa customer’s account is placed on terminated status regardless of its delinquency status; (ii) upon notification of the death of acustomer; or (iii) in other instances in which management concludes collectability is not reasonably assured. Contract receivablesthat are considered nonperforming include receivables that are on nonaccrual status and receivables that are generally more than90 days past due.
The accrual of interest and other fees is resumed when the finance or contract receivable becomes contractually current andcollection of all remaining contractual amounts due is reasonably assured. Finance and contract receivables are evaluated forimpairment on a collective basis. A receivable is impaired when it is probable that all amounts related to the receivable will notbe collected according to the contractual terms of the applicable agreement. Impaired finance and contract receivables are coveredby the company’s respective allowances for doubtful accounts and are charged-off against the allowances when appropriate. Asof March 31, 2018, and December 30, 2017, there were $27.9 million and $28.0 million, respectively, of impaired financereceivables, and there were $3.1 million and $2.3 million, respectively, of impaired contract receivables.
It is the general practice of Snap-on’s financial services business to not engage in contract or loan modifications. In limited instances,Snap-on’s financial services business may modify certain impaired receivables in troubled debt restructurings. The amount andnumber of restructured finance and contract receivables as of March 31, 2018, and December 30, 2017, were immaterial to boththe financial services portfolio and the company’s results of operations and financial position.
Table of ContentsSNAP-ON INCORPORATED
NOTES TO CONDENSED CONSOLIDATED FINANCIAL STATEMENTS (continued)(Unaudited)
18
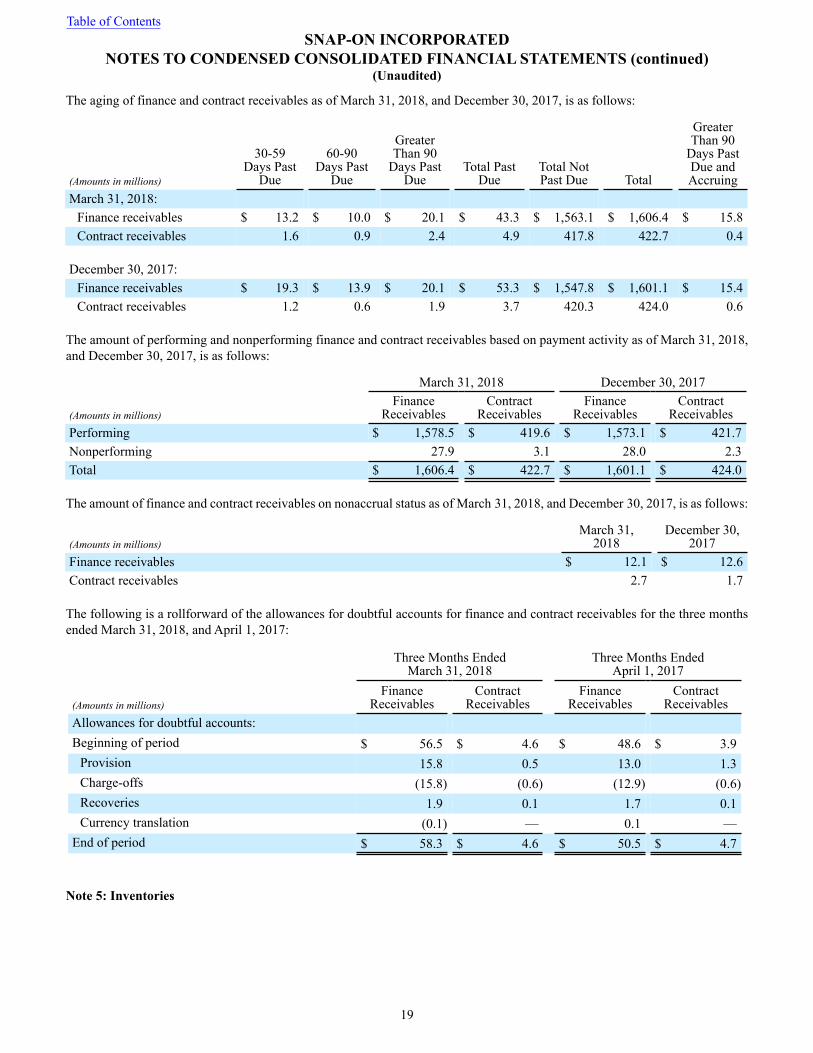
The aging of finance and contract receivables as of March 31, 2018, and December 30, 2017, is as follows:
(Amounts in millions)
30-59Days Past
Due
60-90Days Past
Due
GreaterThan 90
Days PastDue
Total PastDue
Total NotPast Due Total
GreaterThan 90
Days PastDue andAccruing
March 31, 2018:Finance receivables $ 13.2 $ 10.0 $ 20.1 $ 43.3 $ 1,563.1 $ 1,606.4 $ 15.8Contract receivables 1.6 0.9 2.4 4.9 417.8 422.7 0.4
December 30, 2017:Finance receivables $ 19.3 $ 13.9 $ 20.1 $ 53.3 $ 1,547.8 $ 1,601.1 $ 15.4Contract receivables 1.2 0.6 1.9 3.7 420.3 424.0 0.6
The amount of performing and nonperforming finance and contract receivables based on payment activity as of March 31, 2018,and December 30, 2017, is as follows:
March 31, 2018 December 30, 2017
(Amounts in millions)Finance
ReceivablesContract
ReceivablesFinance
ReceivablesContract
ReceivablesPerforming $ 1,578.5 $ 419.6 $ 1,573.1 $ 421.7Nonperforming 27.9 3.1 28.0 2.3Total $ 1,606.4 $ 422.7 $ 1,601.1 $ 424.0
The amount of finance and contract receivables on nonaccrual status as of March 31, 2018, and December 30, 2017, is as follows:
(Amounts in millions)March 31,
2018December 30,
2017Finance receivables $ 12.1 $ 12.6Contract receivables 2.7 1.7
The following is a rollforward of the allowances for doubtful accounts for finance and contract receivables for the three monthsended March 31, 2018, and April 1, 2017:
Three Months EndedMarch 31, 2018
Three Months EndedApril 1, 2017
(Amounts in millions)Finance
ReceivablesContract
ReceivablesFinance
ReceivablesContract
ReceivablesAllowances for doubtful accounts:Beginning of period $ 56.5 $ 4.6 $ 48.6 $ 3.9
Provision 15.8 0.5 13.0 1.3Charge-offs (15.8) (0.6) (12.9) (0.6)Recoveries 1.9 0.1 1.7 0.1Currency translation (0.1) — 0.1 —
End of period $ 58.3 $ 4.6 $ 50.5 $ 4.7
Note 5: Inventories
Table of ContentsSNAP-ON INCORPORATED
NOTES TO CONDENSED CONSOLIDATED FINANCIAL STATEMENTS (continued)(Unaudited)
19
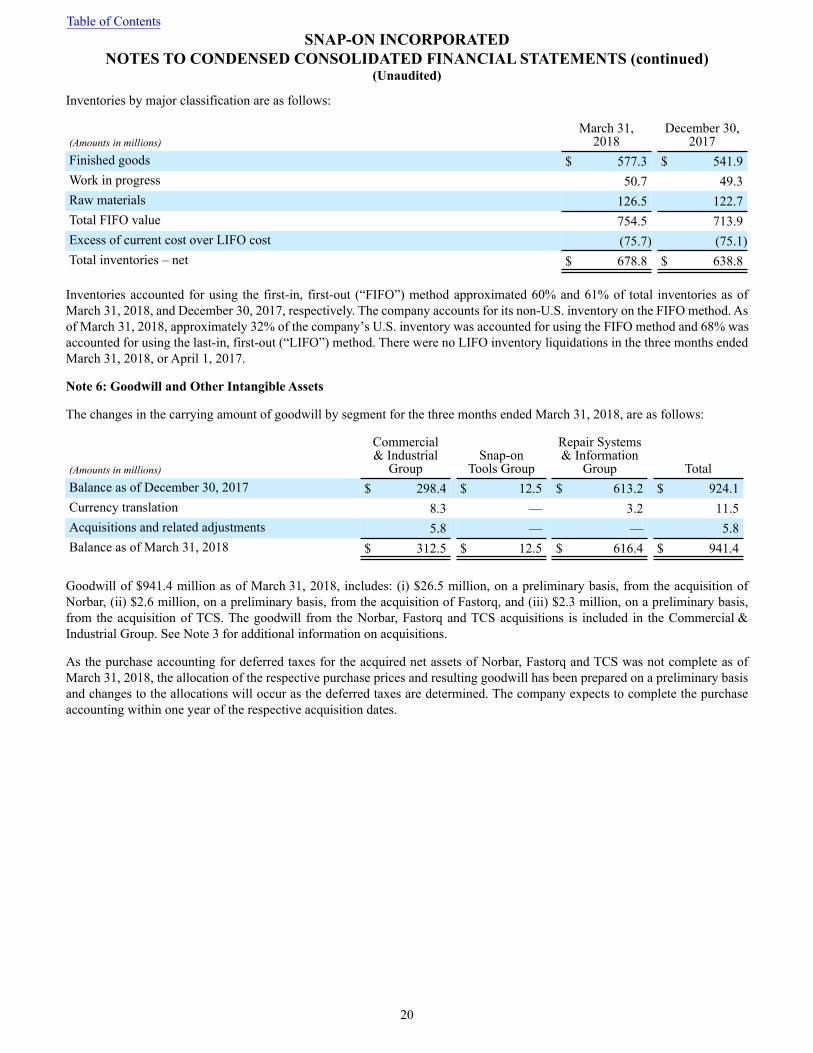
Inventories by major classification are as follows:
(Amounts in millions)March 31,
2018December 30,
2017Finished goods $ 577.3 $ 541.9Work in progress 50.7 49.3Raw materials 126.5 122.7Total FIFO value 754.5 713.9Excess of current cost over LIFO cost (75.7) (75.1)Total inventories – net $ 678.8 $ 638.8
Inventories accounted for using the first-in, first-out (“FIFO”) method approximated 60% and 61% of total inventories as ofMarch 31, 2018, and December 30, 2017, respectively. The company accounts for its non-U.S. inventory on the FIFO method. Asof March 31, 2018, approximately 32% of the company’s U.S. inventory was accounted for using the FIFO method and 68% wasaccounted for using the last-in, first-out (“LIFO”) method. There were no LIFO inventory liquidations in the three months endedMarch 31, 2018, or April 1, 2017.
Note 6: Goodwill and Other Intangible Assets
The changes in the carrying amount of goodwill by segment for the three months ended March 31, 2018, are as follows:
(Amounts in millions)
Commercial& Industrial
GroupSnap-on
Tools Group
Repair Systems& Information
Group TotalBalance as of December 30, 2017 $ 298.4 $ 12.5 $ 613.2 $ 924.1Currency translation 8.3 — 3.2 11.5Acquisitions and related adjustments 5.8 — — 5.8Balance as of March 31, 2018 $ 312.5 $ 12.5 $ 616.4 $ 941.4
Goodwill of $941.4 million as of March 31, 2018, includes: (i) $26.5 million, on a preliminary basis, from the acquisition ofNorbar, (ii) $2.6 million, on a preliminary basis, from the acquisition of Fastorq, and (iii) $2.3 million, on a preliminary basis,from the acquisition of TCS. The goodwill from the Norbar, Fastorq and TCS acquisitions is included in the Commercial &Industrial Group. See Note 3 for additional information on acquisitions.
As the purchase accounting for deferred taxes for the acquired net assets of Norbar, Fastorq and TCS was not complete as ofMarch 31, 2018, the allocation of the respective purchase prices and resulting goodwill has been prepared on a preliminary basisand changes to the allocations will occur as the deferred taxes are determined. The company expects to complete the purchaseaccounting within one year of the respective acquisition dates.
Table of ContentsSNAP-ON INCORPORATED
NOTES TO CONDENSED CONSOLIDATED FINANCIAL STATEMENTS (continued)(Unaudited)
20
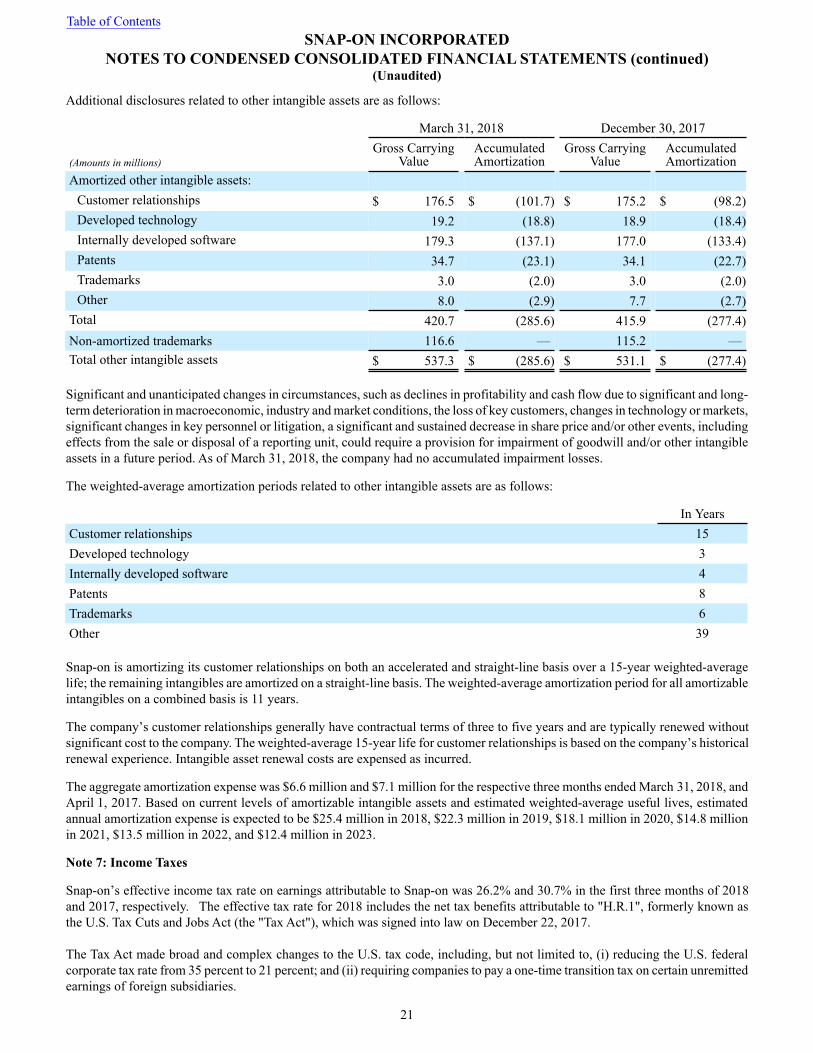
Additional disclosures related to other intangible assets are as follows:
March 31, 2018 December 30, 2017
(Amounts in millions)Gross Carrying
ValueAccumulatedAmortization
Gross CarryingValue
AccumulatedAmortization
Amortized other intangible assets:Customer relationships $ 176.5 $ (101.7) $ 175.2 $ (98.2)Developed technology 19.2 (18.8) 18.9 (18.4)Internally developed software 179.3 (137.1) 177.0 (133.4)Patents 34.7 (23.1) 34.1 (22.7)Trademarks 3.0 (2.0) 3.0 (2.0)Other 8.0 (2.9) 7.7 (2.7)
Total 420.7 (285.6) 415.9 (277.4)Non-amortized trademarks 116.6 — 115.2 —Total other intangible assets $ 537.3 $ (285.6) $ 531.1 $ (277.4)
Significant and unanticipated changes in circumstances, such as declines in profitability and cash flow due to significant and long-term deterioration in macroeconomic, industry and market conditions, the loss of key customers, changes in technology or markets,significant changes in key personnel or litigation, a significant and sustained decrease in share price and/or other events, includingeffects from the sale or disposal of a reporting unit, could require a provision for impairment of goodwill and/or other intangibleassets in a future period. As of March 31, 2018, the company had no accumulated impairment losses.
The weighted-average amortization periods related to other intangible assets are as follows:
In YearsCustomer relationships 15Developed technology 3Internally developed software 4Patents 8Trademarks 6Other 39
Snap-on is amortizing its customer relationships on both an accelerated and straight-line basis over a 15-year weighted-averagelife; the remaining intangibles are amortized on a straight-line basis. The weighted-average amortization period for all amortizableintangibles on a combined basis is 11 years.
The company’s customer relationships generally have contractual terms of three to five years and are typically renewed withoutsignificant cost to the company. The weighted-average 15-year life for customer relationships is based on the company’s historicalrenewal experience. Intangible asset renewal costs are expensed as incurred.
The aggregate amortization expense was $6.6 million and $7.1 million for the respective three months ended March 31, 2018, andApril 1, 2017. Based on current levels of amortizable intangible assets and estimated weighted-average useful lives, estimatedannual amortization expense is expected to be $25.4 million in 2018, $22.3 million in 2019, $18.1 million in 2020, $14.8 millionin 2021, $13.5 million in 2022, and $12.4 million in 2023.
Note 7: Income Taxes
Snap-on’s effective income tax rate on earnings attributable to Snap-on was 26.2% and 30.7% in the first three months of 2018and 2017, respectively. The effective tax rate for 2018 includes the net tax benefits attributable to "H.R.1", formerly known asthe U.S. Tax Cuts and Jobs Act (the "Tax Act"), which was signed into law on December 22, 2017.
The Tax Act made broad and complex changes to the U.S. tax code, including, but not limited to, (i) reducing the U.S. federalcorporate tax rate from 35 percent to 21 percent; and (ii) requiring companies to pay a one-time transition tax on certain unremittedearnings of foreign subsidiaries.
Table of ContentsSNAP-ON INCORPORATED
NOTES TO CONDENSED CONSOLIDATED FINANCIAL STATEMENTS (continued)(Unaudited)
21
The Tax Act also established new tax laws that affect 2018, including, but not limited to: (i) the reduction of the U.S. federalcorporate tax rate discussed above; (ii) a general elimination of U.S. federal income taxes on dividends from foreign subsidiaries;(iii) a new provision designed to tax global intangible low-taxed income (“GILTI”); (iv) the repeal of the domestic productionactivity deductions; (v) limitations on the deductibility of certain executive compensation; (vi) limitations on the use of foreigntax credits to reduce the U.S. income tax liability; and (vii) a new provision that allows a domestic corporation an immediatededuction for a portion of its foreign derived intangible income (“FDII”).
The Securities and Exchange Commission staff issued Staff Accounting Bulletin (“SAB”) 118, which provides guidance onaccounting for the tax effects of the Tax Act. SAB 118 provides a measurement period that should not extend beyond one yearfrom the Tax Act enactment date for companies to complete the related accounting under ASC 740, Accounting for Income Taxes.In accordance with SAB 118, a company must reflect the income tax effects of those aspects of the Tax Act for which the accountingunder ASC 740 is complete. To the extent that a company’s accounting for a certain income tax effect of the Tax Act is incomplete,but it is able to determine a reasonable estimate, it must record a provisional estimate in the financial statements. If a companycannot determine a provisional estimate to be included in the financial statements, it should continue to apply ASC 740 on thebasis of the provisions of the tax laws that were in effect immediately before the enactment of the Tax Act.
The company’s accounting for the certain elements of the Tax Act was incomplete as of the period ended December 30, 2017, andremains incomplete as of March 31, 2018. However, the company was able to make reasonable estimates of the effects and,therefore, recorded provisional estimates for these items. In connection with its initial analysis of the impact of the Tax Act, thecompany recorded a provisional discrete net tax expense of $7.0 million in the period ended December 30, 2017. This provisionalestimate consists of a net expense of $13.7 million for the one-time transition tax and a net benefit of $6.7 million related torevaluation of deferred tax assets and liabilities, caused by the new lower corporate tax rate. To determine the transition tax, thecompany must determine the amount of post-1986 accumulated earnings and profits of the relevant subsidiaries, as well as theamount of non-U.S. income taxes paid on such earnings. While the company was able to make a reasonable estimate of thetransition tax, it is continuing to gather additional information to more precisely compute the final amount. Likewise, while thecompany was able to make a reasonable estimate of the impact of the reduction to the corporate tax rate, its rate may be affectedby other analyses related to the Tax Act, including, but not limited to, the state tax effect of adjustments made to federal temporarydifferences. Due to the complexity of the new GILTI tax rules, the company is continuing to evaluate this provision of the Tax Actand the application of ASC 740. Under GAAP, the company is allowed to make an accounting policy choice to either (i) treattaxes due on future U.S. inclusions in taxable income related to GILTI as a current-period expense when incurred (the “period costmethod"); or (ii) factor in such amounts into a company’s measurement of its deferred taxes (the “deferred method”). The company’sselection of an accounting policy with respect to the new GILTI tax rules is dependent on additional analysis and potential futuremodifications to existing structures, which are not currently known. The company has not made a policy decision regardingwhether to record deferred taxes on GILTI. The company will continue to analyze the full effects of the Tax Act on its consolidatedfinancial statements.
During the first three months of 2018, the Internal Revenue Service issued new guidance affecting the computation of the company’s2017 federal income tax liability. As a result of this new guidance and additional analysis of the impacts of the Tax Act, thecompany revised its prior estimates and recorded $2.6 million of additional tax expense related to the Tax Act during the period.The ultimate impact of the Tax Act may differ from the current estimates, possibly materially, due to changes in interpretationsand assumptions the company has made, future guidance that may be issued and actions the company may take as a result of thelaw.
Snap-on and its subsidiaries file income tax returns in the United States and in various state, local and foreign jurisdictions. It isreasonably possible that certain unrecognized tax benefits may either be settled with taxing authorities or the statutes of limitationsfor such items may lapse within the next 12 months, causing Snap-on’s gross unrecognized tax benefits to decrease by a range ofzero to $0.7 million. Over the next 12 months, Snap-on anticipates taking certain tax positions on various tax returns for whichthe related tax benefit does not meet the recognition threshold. Accordingly, Snap-on’s gross unrecognized tax benefits may increaseby a range of zero to $1.5 million over the next 12 months for uncertain tax positions expected to be taken in future tax filings.
Table of ContentsSNAP-ON INCORPORATED
NOTES TO CONDENSED CONSOLIDATED FINANCIAL STATEMENTS (continued)(Unaudited)
22
Note 8: Short-term and Long-term Debt
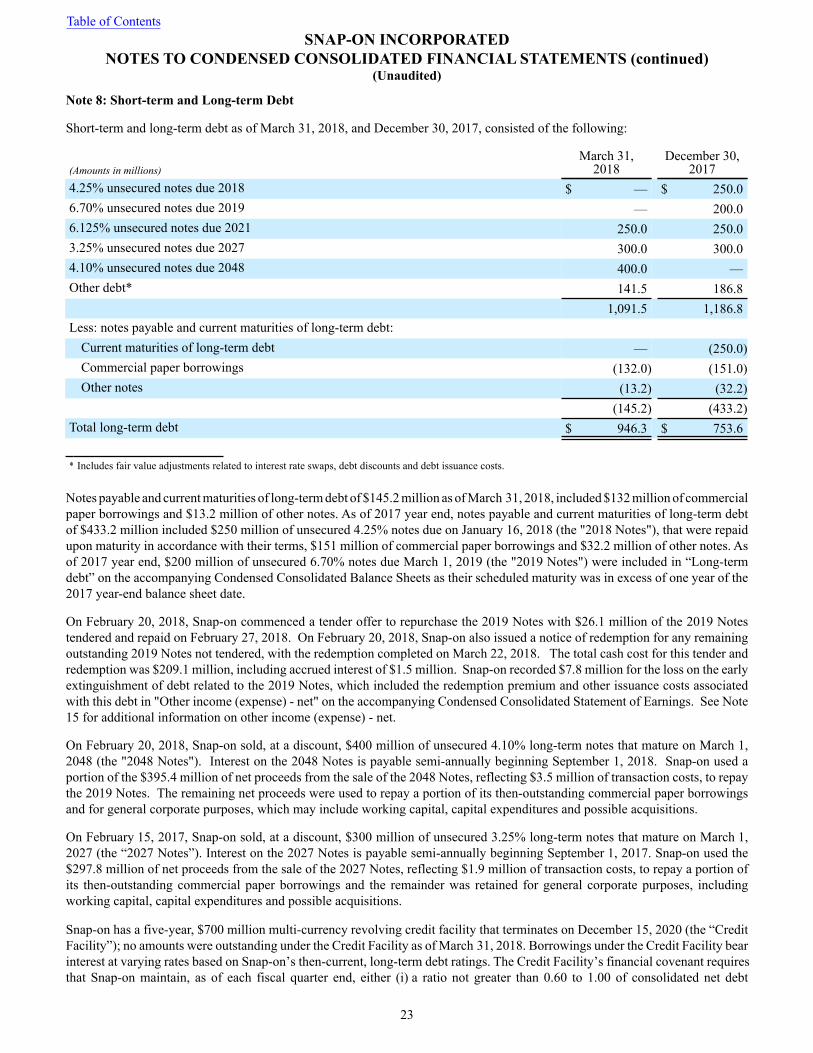
Short-term and long-term debt as of March 31, 2018, and December 30, 2017, consisted of the following:
(Amounts in millions)March 31,
2018December 30,
20174.25% unsecured notes due 2018 $ — $ 250.06.70% unsecured notes due 2019 — 200.06.125% unsecured notes due 2021 250.0 250.03.25% unsecured notes due 2027 300.0 300.04.10% unsecured notes due 2048 400.0 —Other debt* 141.5 186.8
1,091.5 1,186.8Less: notes payable and current maturities of long-term debt:
Current maturities of long-term debt — (250.0)Commercial paper borrowings (132.0) (151.0)Other notes (13.2) (32.2)
(145.2) (433.2)Total long-term debt $ 946.3 $ 753.6
* Includes fair value adjustments related to interest rate swaps, debt discounts and debt issuance costs.
Notes payable and current maturities of long-term debt of $145.2 million as of March 31, 2018, included $132 million of commercialpaper borrowings and $13.2 million of other notes. As of 2017 year end, notes payable and current maturities of long-term debtof $433.2 million included $250 million of unsecured 4.25% notes due on January 16, 2018 (the "2018 Notes"), that were repaidupon maturity in accordance with their terms, $151 million of commercial paper borrowings and $32.2 million of other notes. Asof 2017 year end, $200 million of unsecured 6.70% notes due March 1, 2019 (the "2019 Notes") were included in “Long-termdebt” on the accompanying Condensed Consolidated Balance Sheets as their scheduled maturity was in excess of one year of the2017 year-end balance sheet date.
On February 20, 2018, Snap-on commenced a tender offer to repurchase the 2019 Notes with $26.1 million of the 2019 Notestendered and repaid on February 27, 2018. On February 20, 2018, Snap-on also issued a notice of redemption for any remainingoutstanding 2019 Notes not tendered, with the redemption completed on March 22, 2018. The total cash cost for this tender andredemption was $209.1 million, including accrued interest of $1.5 million. Snap-on recorded $7.8 million for the loss on the earlyextinguishment of debt related to the 2019 Notes, which included the redemption premium and other issuance costs associatedwith this debt in "Other income (expense) - net" on the accompanying Condensed Consolidated Statement of Earnings. See Note15 for additional information on other income (expense) - net.
On February 20, 2018, Snap-on sold, at a discount, $400 million of unsecured 4.10% long-term notes that mature on March 1,2048 (the "2048 Notes"). Interest on the 2048 Notes is payable semi-annually beginning September 1, 2018. Snap-on used aportion of the $395.4 million of net proceeds from the sale of the 2048 Notes, reflecting $3.5 million of transaction costs, to repaythe 2019 Notes. The remaining net proceeds were used to repay a portion of its then-outstanding commercial paper borrowingsand for general corporate purposes, which may include working capital, capital expenditures and possible acquisitions.
On February 15, 2017, Snap-on sold, at a discount, $300 million of unsecured 3.25% long-term notes that mature on March 1,2027 (the “2027 Notes”). Interest on the 2027 Notes is payable semi-annually beginning September 1, 2017. Snap-on used the$297.8 million of net proceeds from the sale of the 2027 Notes, reflecting $1.9 million of transaction costs, to repay a portion ofits then-outstanding commercial paper borrowings and the remainder was retained for general corporate purposes, includingworking capital, capital expenditures and possible acquisitions. Snap-on has a five-year, $700 million multi-currency revolving credit facility that terminates on December 15, 2020 (the “CreditFacility”); no amounts were outstanding under the Credit Facility as of March 31, 2018. Borrowings under the Credit Facility bearinterest at varying rates based on Snap-on’s then-current, long-term debt ratings. The Credit Facility’s financial covenant requiresthat Snap-on maintain, as of each fiscal quarter end, either (i) a ratio not greater than 0.60 to 1.00 of consolidated net debt
Table of ContentsSNAP-ON INCORPORATED
NOTES TO CONDENSED CONSOLIDATED FINANCIAL STATEMENTS (continued)(Unaudited)
23
(consolidated debt net of certain cash adjustments) to the sum of such consolidated net debt plus total equity and less accumulatedother comprehensive income or loss (the “Debt Ratio”); or (ii) a ratio not greater than 3.50 to 1.00 of such consolidated net debtto earnings before interest, taxes, depreciation, amortization and certain other adjustments for the preceding four fiscal quartersthen ended (the “Debt to EBITDA Ratio”). Snap-on may, up to two times during any five-year period during the term of the CreditFacility (including any extensions thereof), increase the maximum Debt Ratio to 0.65 to 1.00 and/or increase the maximum Debtto EBITDA Ratio to 3.75 to 1.00 for four consecutive fiscal quarters in connection with certain material acquisitions (as definedin the related credit agreement). As of March 31, 2018, the company’s actual ratios of 0.24 and 1.04 respectively, were both withinthe permitted ranges set forth in this financial covenant. Snap-on generally issues commercial paper to fund its financing needson a short-term basis and uses the Credit Facility as back-up liquidity to support such commercial paper issuances.
Note 9: Financial Instruments
Derivatives: All derivative instruments are reported in the Condensed Consolidated Financial Statements at fair value. Changesin the fair value of derivatives are recorded each period in earnings or on the accompanying Condensed Consolidated BalanceSheets, depending on whether the derivative is designated and effective as part of a hedged transaction. Gains or losses on derivativeinstruments recorded in Accumulated other comprehensive income (loss) (“Accumulated OCI”) must be reclassified to earningsin the period in which earnings are affected by the underlying hedged item and the ineffective portion of all hedges must berecognized in earnings in the period that such portion is determined to be ineffective.
The criteria used to determine if hedge accounting treatment is appropriate are: (i) the designation of the hedge to an underlyingexposure; (ii) whether or not overall risk is being reduced; and (iii) if there is a correlation between the value of the derivativeinstrument and the underlying hedged item. On the date a derivative contract is entered into, Snap-on designates the derivative asa fair value hedge, a cash flow hedge, a hedge of a net investment in a foreign operation, or a natural hedging instrument whosechange in fair value is recognized as an economic hedge against changes in the value of the hedged item. Snap-on does not usederivative instruments for speculative or trading purposes.
The company is exposed to global market risks, including the effects of changes in foreign currency exchange rates, interest rates,and the company’s stock price, and therefore uses derivatives to manage financial exposures that occur in the normal course ofbusiness. The primary risks managed by using derivative instruments are foreign currency risk, interest rate risk and stock-baseddeferred compensation risk.
Foreign Currency Risk Management: Snap-on has significant international operations and is subject to certain risks inherent withforeign operations that include currency fluctuations. Foreign currency exchange risk exists to the extent that Snap-on has paymentobligations or receipts denominated in currencies other than the functional currency, including intercompany loans denominatedin foreign currencies. To manage these exposures, Snap-on identifies naturally offsetting positions and then purchases hedginginstruments to protect the residual net exposures. Snap-on manages most of these exposures on a consolidated basis, which allowsfor netting of certain exposures to take advantage of natural offsets. Foreign currency forward contracts (“foreign currencyforwards”) are used to hedge the net exposures. Gains or losses on net foreign currency hedges are intended to offset losses orgains on the underlying net exposures in an effort to reduce the earnings volatility resulting from fluctuating foreign currencyexchange rates. Snap-on’s foreign currency forwards are typically not designated as hedges. The fair value changes of thesecontracts are reported in earnings as foreign exchange gain or loss, which is included in “Other income (expense) – net” on theaccompanying Condensed Consolidated Statements of Earnings.
Interest Rate Risk Management: Snap-on aims to control funding costs by managing the exposure created by the differing maturitiesand interest rate structures of Snap-on’s borrowings through the use of interest rate swap agreements (“interest rate swaps”) andtreasury lock agreements (“treasury locks”).
Snap-on enters into interest rate swaps to manage risks associated with changing interest rates related to the company’s fixed rateborrowings. Interest rate swaps are accounted for as fair value hedges. The differentials paid or received on interest rate swaps arerecognized as adjustments to “Interest expense” on the accompanying Condensed Consolidated Statements of Earnings. Theeffective portion of the change in fair value of the derivative is recorded in “Long-term debt” on the accompanying CondensedConsolidated Balance Sheets, while any ineffective portion is recorded as an adjustment to “Interest expense” on the accompanyingCondensed Consolidated Statements of Earnings. The notional amount of interest rate swaps outstanding and designated as fairvalue hedges was $100 million as of both March 31, 2018, and December 30, 2017.
Snap-on entered into a $300 million treasury lock in the fourth quarter of 2017 to manage the potential change in interest rates inanticipation of the possible issuance of fixed rate debt in the first quarter of 2018. Treasury locks are accounted for as cash flow
Table of ContentsSNAP-ON INCORPORATED
NOTES TO CONDENSED CONSOLIDATED FINANCIAL STATEMENTS (continued)(Unaudited)
24
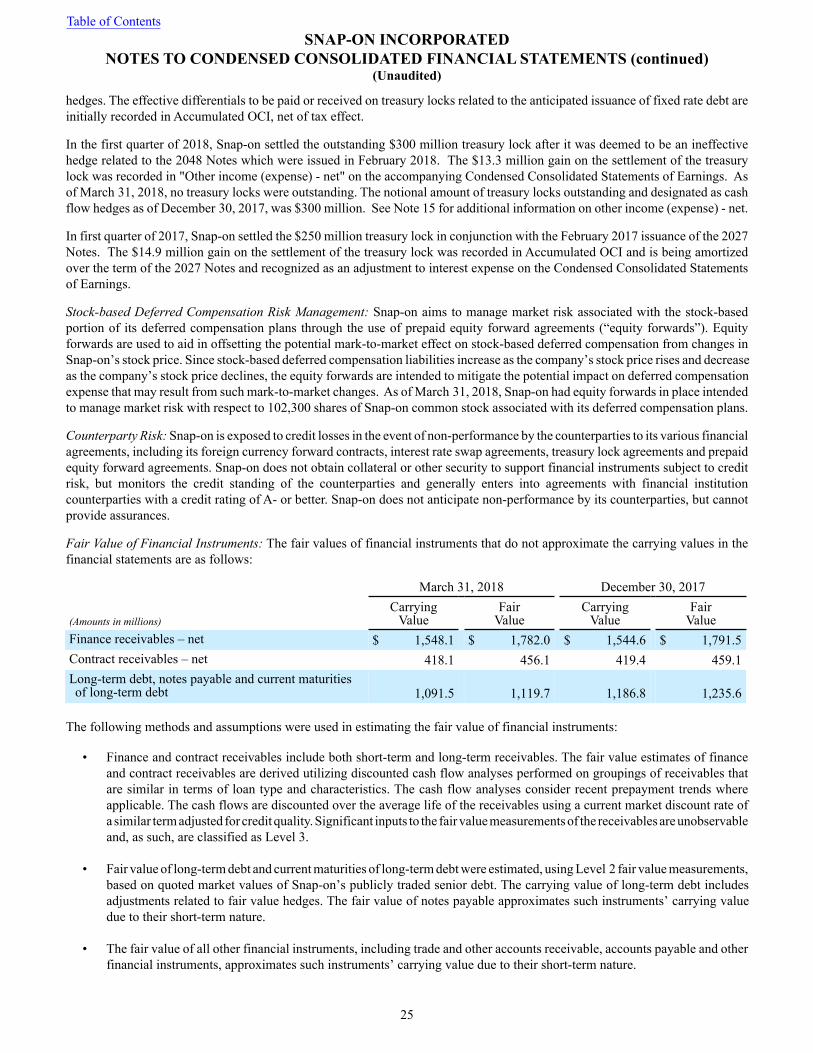
hedges. The effective differentials to be paid or received on treasury locks related to the anticipated issuance of fixed rate debt areinitially recorded in Accumulated OCI, net of tax effect.
In the first quarter of 2018, Snap-on settled the outstanding $300 million treasury lock after it was deemed to be an ineffectivehedge related to the 2048 Notes which were issued in February 2018. The $13.3 million gain on the settlement of the treasurylock was recorded in "Other income (expense) - net" on the accompanying Condensed Consolidated Statements of Earnings. Asof March 31, 2018, no treasury locks were outstanding. The notional amount of treasury locks outstanding and designated as cashflow hedges as of December 30, 2017, was $300 million. See Note 15 for additional information on other income (expense) - net.
In first quarter of 2017, Snap-on settled the $250 million treasury lock in conjunction with the February 2017 issuance of the 2027Notes. The $14.9 million gain on the settlement of the treasury lock was recorded in Accumulated OCI and is being amortizedover the term of the 2027 Notes and recognized as an adjustment to interest expense on the Condensed Consolidated Statementsof Earnings.
Stock-based Deferred Compensation Risk Management: Snap-on aims to manage market risk associated with the stock-basedportion of its deferred compensation plans through the use of prepaid equity forward agreements (“equity forwards”). Equityforwards are used to aid in offsetting the potential mark-to-market effect on stock-based deferred compensation from changes inSnap-on’s stock price. Since stock-based deferred compensation liabilities increase as the company’s stock price rises and decreaseas the company’s stock price declines, the equity forwards are intended to mitigate the potential impact on deferred compensationexpense that may result from such mark-to-market changes. As of March 31, 2018, Snap-on had equity forwards in place intendedto manage market risk with respect to 102,300 shares of Snap-on common stock associated with its deferred compensation plans.
Counterparty Risk: Snap-on is exposed to credit losses in the event of non-performance by the counterparties to its various financialagreements, including its foreign currency forward contracts, interest rate swap agreements, treasury lock agreements and prepaidequity forward agreements. Snap-on does not obtain collateral or other security to support financial instruments subject to creditrisk, but monitors the credit standing of the counterparties and generally enters into agreements with financial institutioncounterparties with a credit rating of A- or better. Snap-on does not anticipate non-performance by its counterparties, but cannotprovide assurances.
Fair Value of Financial Instruments: The fair values of financial instruments that do not approximate the carrying values in thefinancial statements are as follows:
March 31, 2018 December 30, 2017
(Amounts in millions)Carrying
ValueFair
ValueCarrying
ValueFair
ValueFinance receivables – net $ 1,548.1 $ 1,782.0 $ 1,544.6 $ 1,791.5Contract receivables – net 418.1 456.1 419.4 459.1Long-term debt, notes payable and current maturitiesof long-term debt 1,091.5 1,119.7 1,186.8 1,235.6
The following methods and assumptions were used in estimating the fair value of financial instruments:
• Finance and contract receivables include both short-term and long-term receivables. The fair value estimates of financeand contract receivables are derived utilizing discounted cash flow analyses performed on groupings of receivables thatare similar in terms of loan type and characteristics. The cash flow analyses consider recent prepayment trends whereapplicable. The cash flows are discounted over the average life of the receivables using a current market discount rate ofa similar term adjusted for credit quality. Significant inputs to the fair value measurements of the receivables are unobservableand, as such, are classified as Level 3.
• Fair value of long-term debt and current maturities of long-term debt were estimated, using Level 2 fair value measurements,based on quoted market values of Snap-on’s publicly traded senior debt. The carrying value of long-term debt includesadjustments related to fair value hedges. The fair value of notes payable approximates such instruments’ carrying valuedue to their short-term nature.
• The fair value of all other financial instruments, including trade and other accounts receivable, accounts payable and otherfinancial instruments, approximates such instruments’ carrying value due to their short-term nature.
Table of ContentsSNAP-ON INCORPORATED
NOTES TO CONDENSED CONSOLIDATED FINANCIAL STATEMENTS (continued)(Unaudited)
25
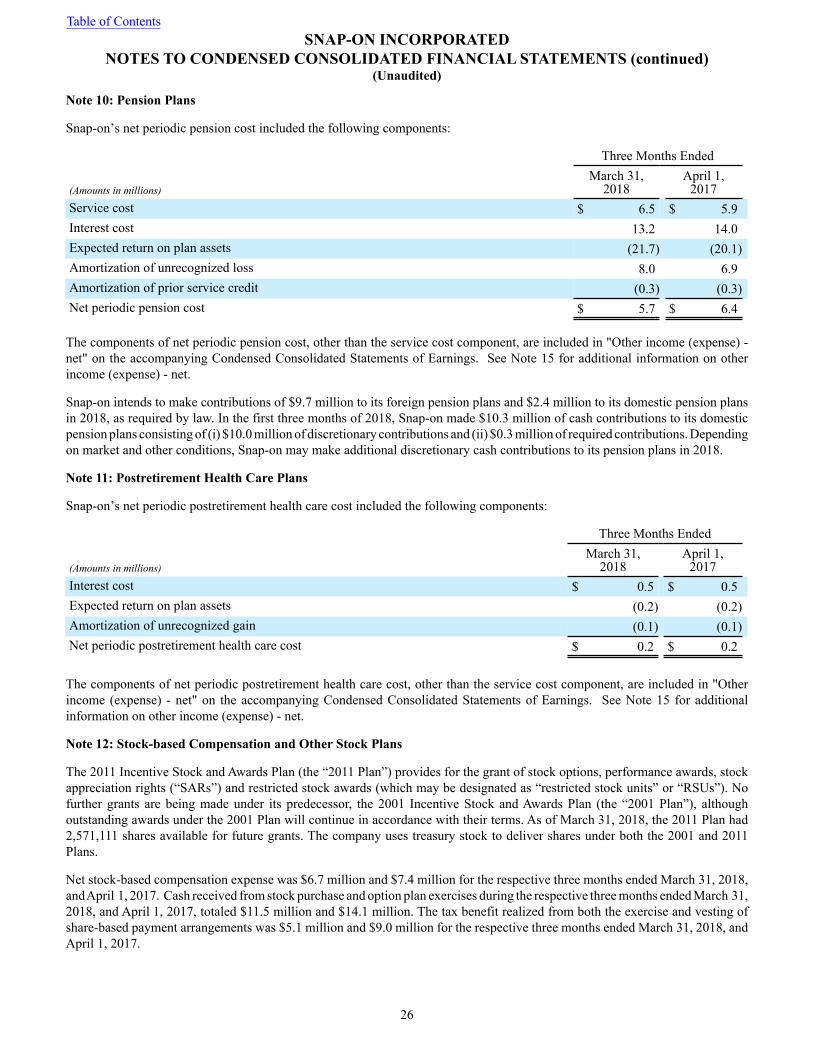
Note 10: Pension Plans
Snap-on’s net periodic pension cost included the following components:
Three Months Ended
(Amounts in millions)March 31,
2018April 1,
2017Service cost $ 6.5 $ 5.9Interest cost 13.2 14.0Expected return on plan assets (21.7) (20.1)Amortization of unrecognized loss 8.0 6.9Amortization of prior service credit (0.3) (0.3)Net periodic pension cost $ 5.7 $ 6.4
The components of net periodic pension cost, other than the service cost component, are included in "Other income (expense) -net" on the accompanying Condensed Consolidated Statements of Earnings. See Note 15 for additional information on otherincome (expense) - net.
Snap-on intends to make contributions of $9.7 million to its foreign pension plans and $2.4 million to its domestic pension plansin 2018, as required by law. In the first three months of 2018, Snap-on made $10.3 million of cash contributions to its domesticpension plans consisting of (i) $10.0 million of discretionary contributions and (ii) $0.3 million of required contributions. Dependingon market and other conditions, Snap-on may make additional discretionary cash contributions to its pension plans in 2018.
Note 11: Postretirement Health Care Plans
Snap-on’s net periodic postretirement health care cost included the following components:
Three Months Ended
(Amounts in millions)March 31,
2018April 1,
2017Interest cost $ 0.5 $ 0.5Expected return on plan assets (0.2) (0.2)Amortization of unrecognized gain (0.1) (0.1)Net periodic postretirement health care cost $ 0.2 $ 0.2
The components of net periodic postretirement health care cost, other than the service cost component, are included in "Otherincome (expense) - net" on the accompanying Condensed Consolidated Statements of Earnings. See Note 15 for additionalinformation on other income (expense) - net.
Note 12: Stock-based Compensation and Other Stock Plans
The 2011 Incentive Stock and Awards Plan (the “2011 Plan”) provides for the grant of stock options, performance awards, stockappreciation rights (“SARs”) and restricted stock awards (which may be designated as “restricted stock units” or “RSUs”). Nofurther grants are being made under its predecessor, the 2001 Incentive Stock and Awards Plan (the “2001 Plan”), althoughoutstanding awards under the 2001 Plan will continue in accordance with their terms. As of March 31, 2018, the 2011 Plan had2,571,111 shares available for future grants. The company uses treasury stock to deliver shares under both the 2001 and 2011Plans.
Net stock-based compensation expense was $6.7 million and $7.4 million for the respective three months ended March 31, 2018,and April 1, 2017. Cash received from stock purchase and option plan exercises during the respective three months ended March 31,2018, and April 1, 2017, totaled $11.5 million and $14.1 million. The tax benefit realized from both the exercise and vesting ofshare-based payment arrangements was $5.1 million and $9.0 million for the respective three months ended March 31, 2018, andApril 1, 2017.
Table of ContentsSNAP-ON INCORPORATED
NOTES TO CONDENSED CONSOLIDATED FINANCIAL STATEMENTS (continued)(Unaudited)
26
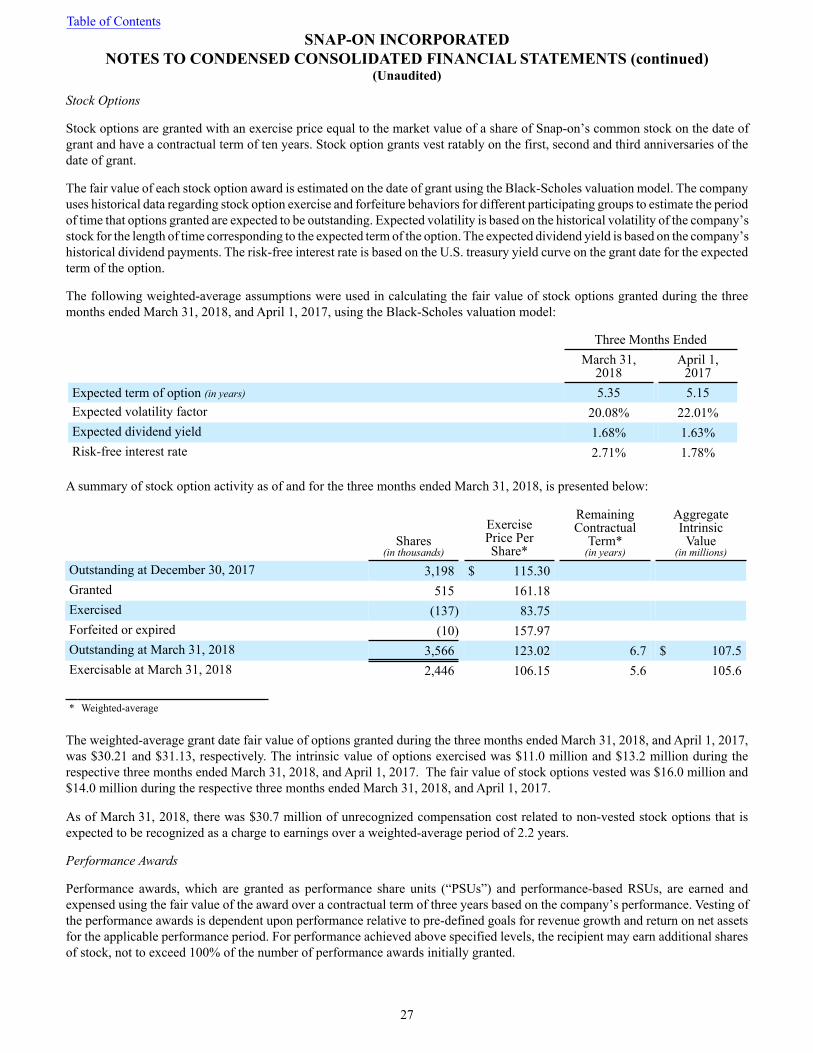
Stock Options
Stock options are granted with an exercise price equal to the market value of a share of Snap-on’s common stock on the date ofgrant and have a contractual term of ten years. Stock option grants vest ratably on the first, second and third anniversaries of thedate of grant.
The fair value of each stock option award is estimated on the date of grant using the Black-Scholes valuation model. The companyuses historical data regarding stock option exercise and forfeiture behaviors for different participating groups to estimate the periodof time that options granted are expected to be outstanding. Expected volatility is based on the historical volatility of the company’sstock for the length of time corresponding to the expected term of the option. The expected dividend yield is based on the company’shistorical dividend payments. The risk-free interest rate is based on the U.S. treasury yield curve on the grant date for the expectedterm of the option.
The following weighted-average assumptions were used in calculating the fair value of stock options granted during the threemonths ended March 31, 2018, and April 1, 2017, using the Black-Scholes valuation model:
Three Months EndedMarch 31,
2018April 1,
2017Expected term of option (in years) 5.35 5.15Expected volatility factor 20.08% 22.01%Expected dividend yield 1.68% 1.63%Risk-free interest rate 2.71% 1.78%
A summary of stock option activity as of and for the three months ended March 31, 2018, is presented below:
Shares(in thousands)
ExercisePrice PerShare*
RemainingContractual
Term*(in years)
AggregateIntrinsic
Value(in millions)
Outstanding at December 30, 2017 3,198 $ 115.30Granted 515 161.18Exercised (137) 83.75Forfeited or expired (10) 157.97Outstanding at March 31, 2018 3,566 123.02 6.7 $ 107.5Exercisable at March 31, 2018 2,446 106.15 5.6 105.6
* Weighted-average
The weighted-average grant date fair value of options granted during the three months ended March 31, 2018, and April 1, 2017,was $30.21 and $31.13, respectively. The intrinsic value of options exercised was $11.0 million and $13.2 million during therespective three months ended March 31, 2018, and April 1, 2017. The fair value of stock options vested was $16.0 million and$14.0 million during the respective three months ended March 31, 2018, and April 1, 2017. As of March 31, 2018, there was $30.7 million of unrecognized compensation cost related to non-vested stock options that isexpected to be recognized as a charge to earnings over a weighted-average period of 2.2 years.
Performance Awards
Performance awards, which are granted as performance share units (“PSUs”) and performance-based RSUs, are earned andexpensed using the fair value of the award over a contractual term of three years based on the company’s performance. Vesting ofthe performance awards is dependent upon performance relative to pre-defined goals for revenue growth and return on net assetsfor the applicable performance period. For performance achieved above specified levels, the recipient may earn additional sharesof stock, not to exceed 100% of the number of performance awards initially granted.
Table of ContentsSNAP-ON INCORPORATED
NOTES TO CONDENSED CONSOLIDATED FINANCIAL STATEMENTS (continued)(Unaudited)
27
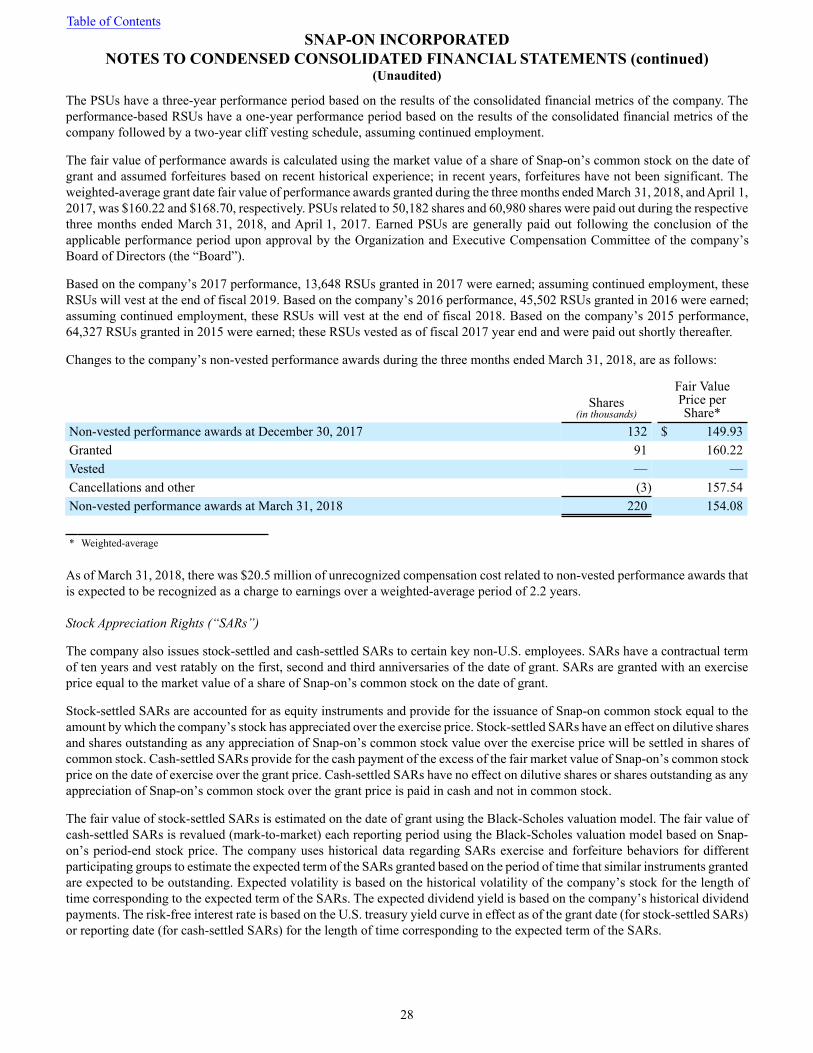
The PSUs have a three-year performance period based on the results of the consolidated financial metrics of the company. Theperformance-based RSUs have a one-year performance period based on the results of the consolidated financial metrics of thecompany followed by a two-year cliff vesting schedule, assuming continued employment.
The fair value of performance awards is calculated using the market value of a share of Snap-on’s common stock on the date ofgrant and assumed forfeitures based on recent historical experience; in recent years, forfeitures have not been significant. Theweighted-average grant date fair value of performance awards granted during the three months ended March 31, 2018, and April 1,2017, was $160.22 and $168.70, respectively. PSUs related to 50,182 shares and 60,980 shares were paid out during the respectivethree months ended March 31, 2018, and April 1, 2017. Earned PSUs are generally paid out following the conclusion of theapplicable performance period upon approval by the Organization and Executive Compensation Committee of the company’sBoard of Directors (the “Board”).
Based on the company’s 2017 performance, 13,648 RSUs granted in 2017 were earned; assuming continued employment, theseRSUs will vest at the end of fiscal 2019. Based on the company’s 2016 performance, 45,502 RSUs granted in 2016 were earned;assuming continued employment, these RSUs will vest at the end of fiscal 2018. Based on the company’s 2015 performance,64,327 RSUs granted in 2015 were earned; these RSUs vested as of fiscal 2017 year end and were paid out shortly thereafter.
Changes to the company’s non-vested performance awards during the three months ended March 31, 2018, are as follows:
Shares(in thousands)
Fair ValuePrice perShare*
Non-vested performance awards at December 30, 2017 132 $ 149.93Granted 91 160.22Vested — —Cancellations and other (3) 157.54Non-vested performance awards at March 31, 2018 220 154.08
* Weighted-average
As of March 31, 2018, there was $20.5 million of unrecognized compensation cost related to non-vested performance awards thatis expected to be recognized as a charge to earnings over a weighted-average period of 2.2 years.
Stock Appreciation Rights (“SARs”)
The company also issues stock-settled and cash-settled SARs to certain key non-U.S. employees. SARs have a contractual termof ten years and vest ratably on the first, second and third anniversaries of the date of grant. SARs are granted with an exerciseprice equal to the market value of a share of Snap-on’s common stock on the date of grant.
Stock-settled SARs are accounted for as equity instruments and provide for the issuance of Snap-on common stock equal to theamount by which the company’s stock has appreciated over the exercise price. Stock-settled SARs have an effect on dilutive sharesand shares outstanding as any appreciation of Snap-on’s common stock value over the exercise price will be settled in shares ofcommon stock. Cash-settled SARs provide for the cash payment of the excess of the fair market value of Snap-on’s common stockprice on the date of exercise over the grant price. Cash-settled SARs have no effect on dilutive shares or shares outstanding as anyappreciation of Snap-on’s common stock over the grant price is paid in cash and not in common stock.
The fair value of stock-settled SARs is estimated on the date of grant using the Black-Scholes valuation model. The fair value ofcash-settled SARs is revalued (mark-to-market) each reporting period using the Black-Scholes valuation model based on Snap-on’s period-end stock price. The company uses historical data regarding SARs exercise and forfeiture behaviors for differentparticipating groups to estimate the expected term of the SARs granted based on the period of time that similar instruments grantedare expected to be outstanding. Expected volatility is based on the historical volatility of the company’s stock for the length oftime corresponding to the expected term of the SARs. The expected dividend yield is based on the company’s historical dividendpayments. The risk-free interest rate is based on the U.S. treasury yield curve in effect as of the grant date (for stock-settled SARs)or reporting date (for cash-settled SARs) for the length of time corresponding to the expected term of the SARs.
Table of ContentsSNAP-ON INCORPORATED
NOTES TO CONDENSED CONSOLIDATED FINANCIAL STATEMENTS (continued)(Unaudited)
28
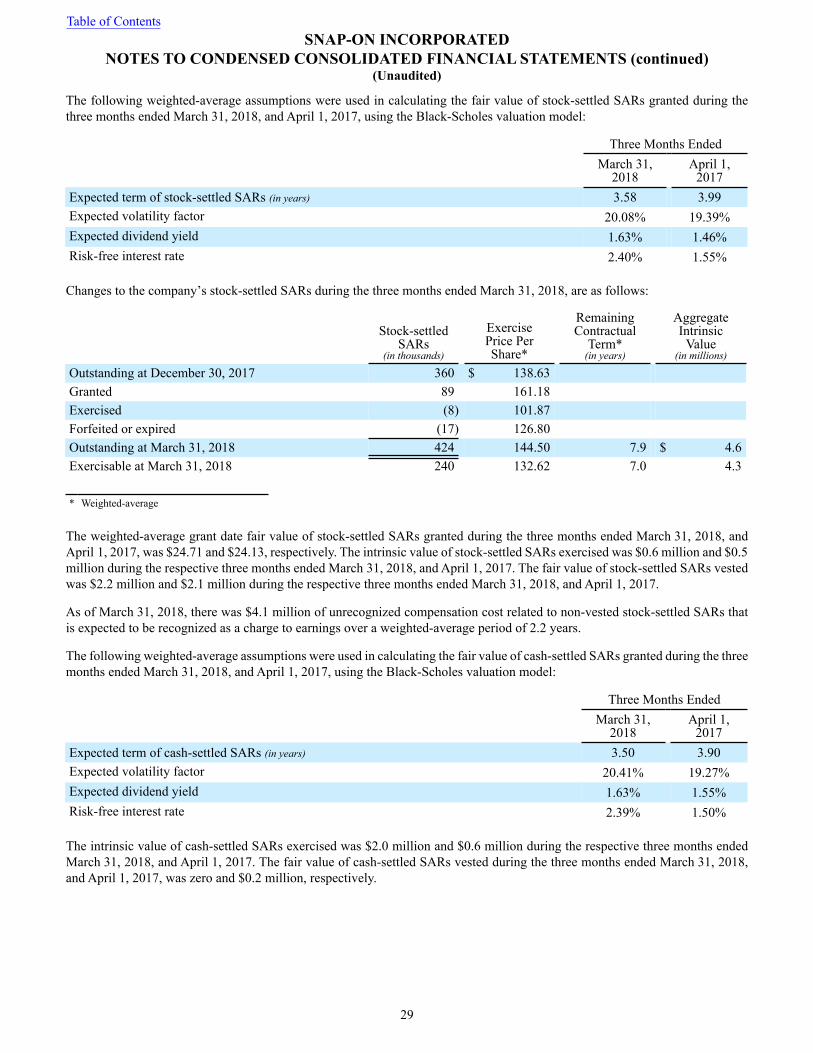
The following weighted-average assumptions were used in calculating the fair value of stock-settled SARs granted during thethree months ended March 31, 2018, and April 1, 2017, using the Black-Scholes valuation model:
Three Months EndedMarch 31,
2018April 1,
2017Expected term of stock-settled SARs (in years) 3.58 3.99Expected volatility factor 20.08% 19.39%Expected dividend yield 1.63% 1.46%Risk-free interest rate 2.40% 1.55%
Changes to the company’s stock-settled SARs during the three months ended March 31, 2018, are as follows:
Stock-settledSARs
(in thousands)
ExercisePrice PerShare*
RemainingContractual
Term*(in years)
AggregateIntrinsic
Value(in millions)
Outstanding at December 30, 2017 360 $ 138.63Granted 89 161.18Exercised (8) 101.87Forfeited or expired (17) 126.80Outstanding at March 31, 2018 424 144.50 7.9 $ 4.6Exercisable at March 31, 2018 240 132.62 7.0 4.3
* Weighted-average
The weighted-average grant date fair value of stock-settled SARs granted during the three months ended March 31, 2018, andApril 1, 2017, was $24.71 and $24.13, respectively. The intrinsic value of stock-settled SARs exercised was $0.6 million and $0.5million during the respective three months ended March 31, 2018, and April 1, 2017. The fair value of stock-settled SARs vestedwas $2.2 million and $2.1 million during the respective three months ended March 31, 2018, and April 1, 2017.
As of March 31, 2018, there was $4.1 million of unrecognized compensation cost related to non-vested stock-settled SARs thatis expected to be recognized as a charge to earnings over a weighted-average period of 2.2 years.
The following weighted-average assumptions were used in calculating the fair value of cash-settled SARs granted during the threemonths ended March 31, 2018, and April 1, 2017, using the Black-Scholes valuation model:
Three Months EndedMarch 31,
2018April 1,
2017Expected term of cash-settled SARs (in years) 3.50 3.90Expected volatility factor 20.41% 19.27%Expected dividend yield 1.63% 1.55%Risk-free interest rate 2.39% 1.50%
The intrinsic value of cash-settled SARs exercised was $2.0 million and $0.6 million during the respective three months endedMarch 31, 2018, and April 1, 2017. The fair value of cash-settled SARs vested during the three months ended March 31, 2018,and April 1, 2017, was zero and $0.2 million, respectively.
Table of ContentsSNAP-ON INCORPORATED
NOTES TO CONDENSED CONSOLIDATED FINANCIAL STATEMENTS (continued)(Unaudited)
29
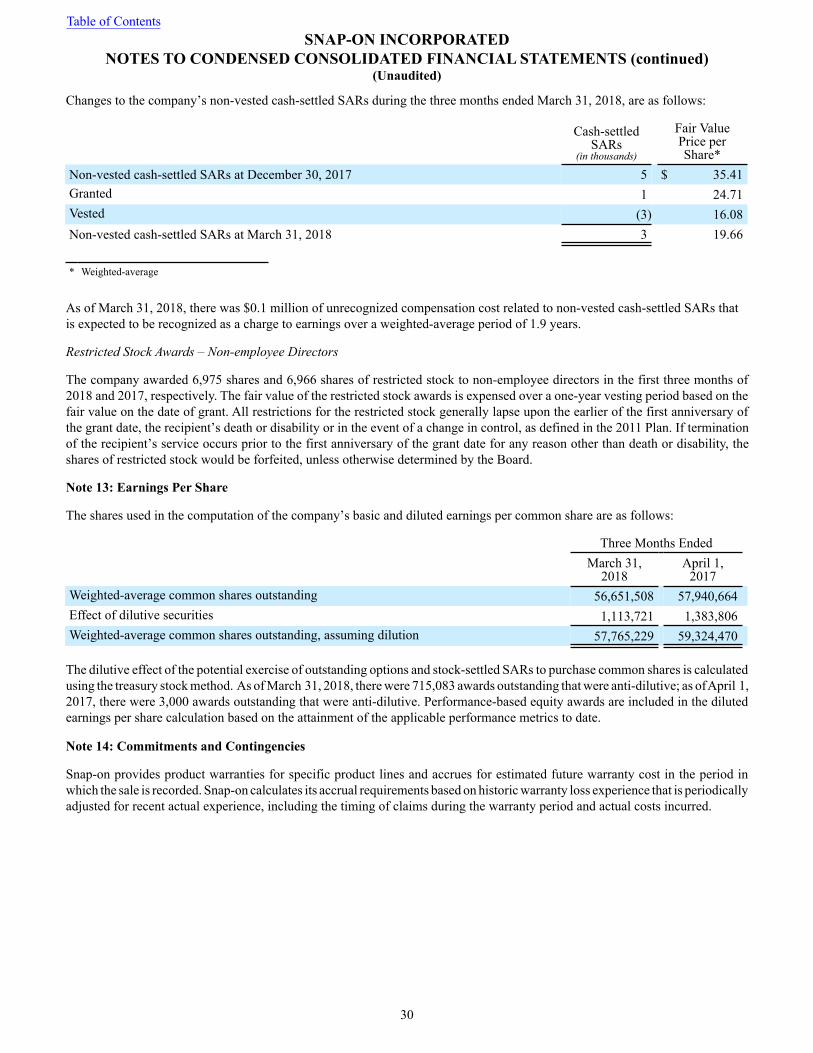
Changes to the company’s non-vested cash-settled SARs during the three months ended March 31, 2018, are as follows:
Cash-settledSARs
(in thousands)
Fair ValuePrice perShare*
Non-vested cash-settled SARs at December 30, 2017 5 $ 35.41Granted 1 24.71Vested (3) 16.08Non-vested cash-settled SARs at March 31, 2018 3 19.66
* Weighted-average
As of March 31, 2018, there was $0.1 million of unrecognized compensation cost related to non-vested cash-settled SARs thatis expected to be recognized as a charge to earnings over a weighted-average period of 1.9 years.
Restricted Stock Awards – Non-employee Directors
The company awarded 6,975 shares and 6,966 shares of restricted stock to non-employee directors in the first three months of2018 and 2017, respectively. The fair value of the restricted stock awards is expensed over a one-year vesting period based on thefair value on the date of grant. All restrictions for the restricted stock generally lapse upon the earlier of the first anniversary ofthe grant date, the recipient’s death or disability or in the event of a change in control, as defined in the 2011 Plan. If terminationof the recipient’s service occurs prior to the first anniversary of the grant date for any reason other than death or disability, theshares of restricted stock would be forfeited, unless otherwise determined by the Board.
Note 13: Earnings Per Share
The shares used in the computation of the company’s basic and diluted earnings per common share are as follows:
Three Months EndedMarch 31,
2018April 1,
2017Weighted-average common shares outstanding 56,651,508 57,940,664Effect of dilutive securities 1,113,721 1,383,806Weighted-average common shares outstanding, assuming dilution 57,765,229 59,324,470
The dilutive effect of the potential exercise of outstanding options and stock-settled SARs to purchase common shares is calculatedusing the treasury stock method. As of March 31, 2018, there were 715,083 awards outstanding that were anti-dilutive; as of April 1,2017, there were 3,000 awards outstanding that were anti-dilutive. Performance-based equity awards are included in the dilutedearnings per share calculation based on the attainment of the applicable performance metrics to date.
Note 14: Commitments and Contingencies
Snap-on provides product warranties for specific product lines and accrues for estimated future warranty cost in the period inwhich the sale is recorded. Snap-on calculates its accrual requirements based on historic warranty loss experience that is periodicallyadjusted for recent actual experience, including the timing of claims during the warranty period and actual costs incurred.
Table of ContentsSNAP-ON INCORPORATED
NOTES TO CONDENSED CONSOLIDATED FINANCIAL STATEMENTS (continued)(Unaudited)
30
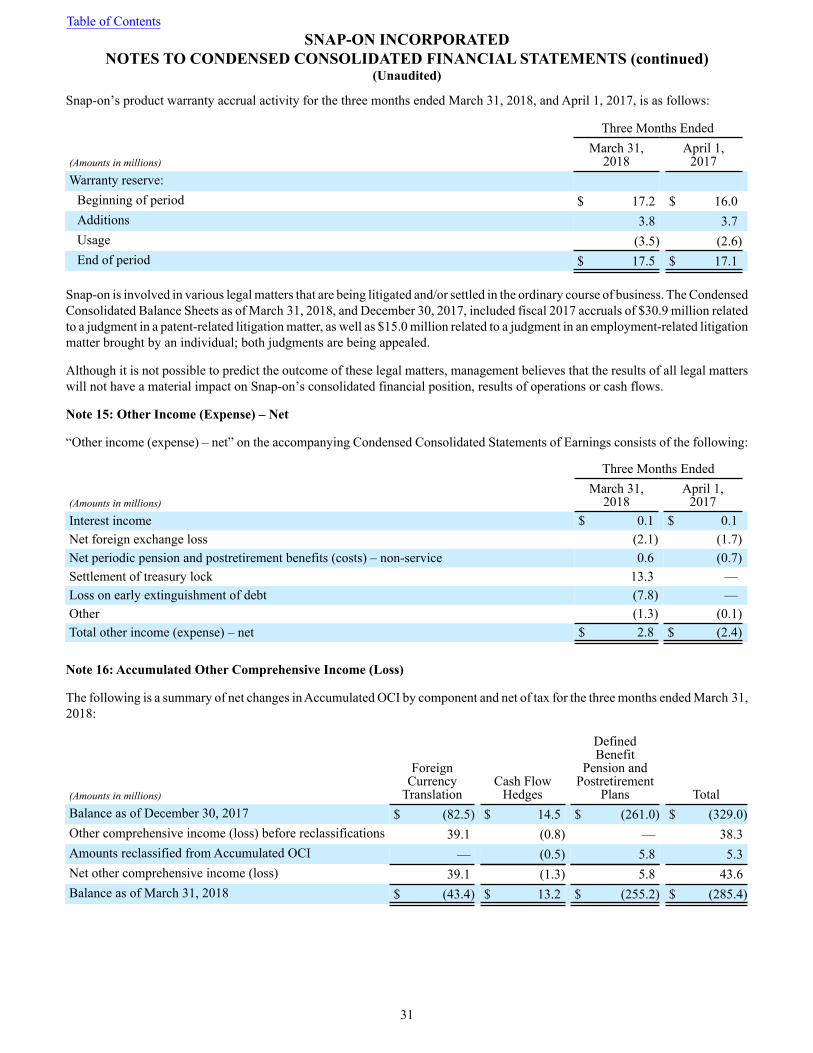
Snap‑on’s product warranty accrual activity for the three months ended March 31, 2018, and April 1, 2017, is as follows:
Three Months Ended
(Amounts in millions)March 31,
2018April 1,
2017Warranty reserve:
Beginning of period $ 17.2 $ 16.0Additions 3.8 3.7Usage (3.5) (2.6)End of period $ 17.5 $ 17.1
Snap-on is involved in various legal matters that are being litigated and/or settled in the ordinary course of business. The CondensedConsolidated Balance Sheets as of March 31, 2018, and December 30, 2017, included fiscal 2017 accruals of $30.9 million relatedto a judgment in a patent-related litigation matter, as well as $15.0 million related to a judgment in an employment-related litigationmatter brought by an individual; both judgments are being appealed.
Although it is not possible to predict the outcome of these legal matters, management believes that the results of all legal matterswill not have a material impact on Snap-on’s consolidated financial position, results of operations or cash flows.
Note 15: Other Income (Expense) – Net
“Other income (expense) – net” on the accompanying Condensed Consolidated Statements of Earnings consists of the following:
Three Months Ended
(Amounts in millions)March 31,
2018April 1,
2017Interest income $ 0.1 $ 0.1Net foreign exchange loss (2.1) (1.7)Net periodic pension and postretirement benefits (costs) – non-service 0.6 (0.7)Settlement of treasury lock 13.3 —Loss on early extinguishment of debt (7.8) —Other (1.3) (0.1)Total other income (expense) – net $ 2.8 $ (2.4)
Note 16: Accumulated Other Comprehensive Income (Loss)
The following is a summary of net changes in Accumulated OCI by component and net of tax for the three months ended March 31,2018:
(Amounts in millions)
ForeignCurrency
TranslationCash Flow
Hedges
DefinedBenefit
Pension andPostretirement
Plans TotalBalance as of December 30, 2017 $ (82.5) $ 14.5 $ (261.0) $ (329.0)Other comprehensive income (loss) before reclassifications 39.1 (0.8) — 38.3Amounts reclassified from Accumulated OCI — (0.5) 5.8 5.3Net other comprehensive income (loss) 39.1 (1.3) 5.8 43.6Balance as of March 31, 2018 $ (43.4) $ 13.2 $ (255.2) $ (285.4)
Table of ContentsSNAP-ON INCORPORATED
NOTES TO CONDENSED CONSOLIDATED FINANCIAL STATEMENTS (continued)(Unaudited)
31
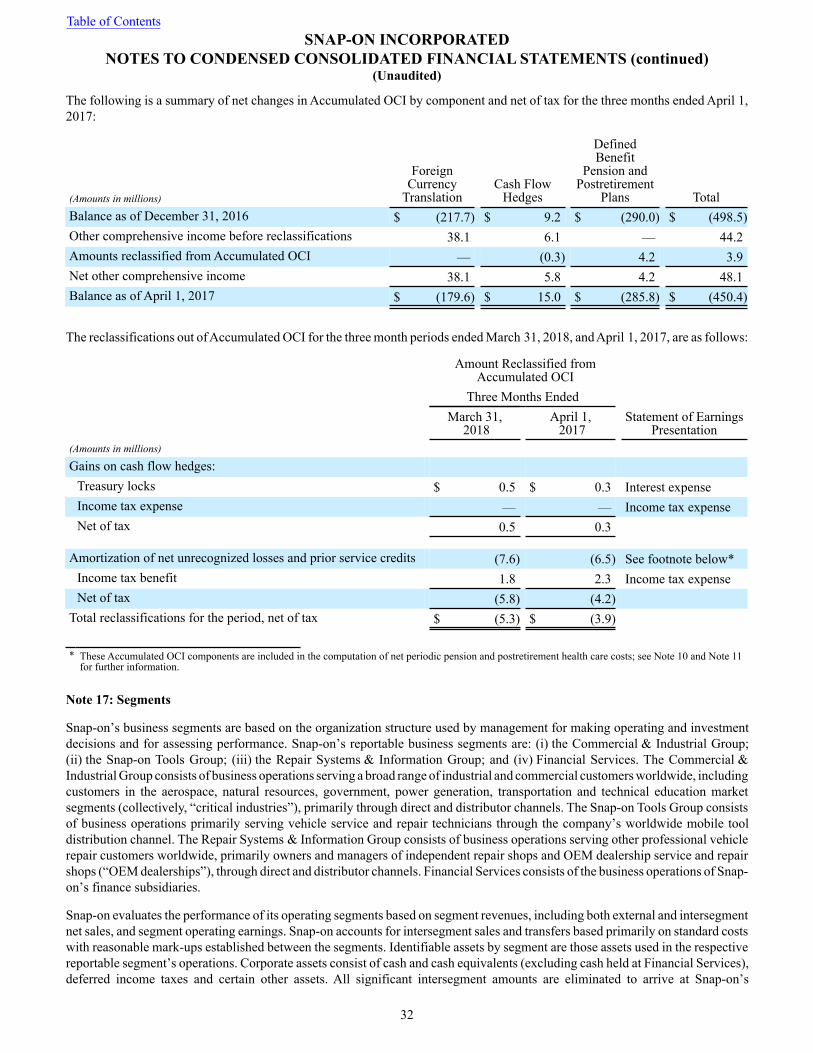
The following is a summary of net changes in Accumulated OCI by component and net of tax for the three months ended April 1,2017:
(Amounts in millions)
ForeignCurrency
TranslationCash Flow
Hedges
DefinedBenefit
Pension andPostretirement
Plans TotalBalance as of December 31, 2016 $ (217.7) $ 9.2 $ (290.0) $ (498.5)Other comprehensive income before reclassifications 38.1 6.1 — 44.2Amounts reclassified from Accumulated OCI — (0.3) 4.2 3.9Net other comprehensive income 38.1 5.8 4.2 48.1Balance as of April 1, 2017 $ (179.6) $ 15.0 $ (285.8) $ (450.4)
The reclassifications out of Accumulated OCI for the three month periods ended March 31, 2018, and April 1, 2017, are as follows:
Amount Reclassified fromAccumulated OCI
Three Months EndedMarch 31,
2018April 1, 2017
Statement of EarningsPresentation
(Amounts in millions)
Gains on cash flow hedges:Treasury locks $ 0.5 $ 0.3 Interest expenseIncome tax expense — — Income tax expenseNet of tax 0.5 0.3
Amortization of net unrecognized losses and prior service credits (7.6) (6.5) See footnote below*Income tax benefit 1.8 2.3 Income tax expenseNet of tax (5.8) (4.2)
Total reclassifications for the period, net of tax $ (5.3) $ (3.9)
* These Accumulated OCI components are included in the computation of net periodic pension and postretirement health care costs; see Note 10 and Note 11for further information.
Note 17: Segments
Snap-on’s business segments are based on the organization structure used by management for making operating and investmentdecisions and for assessing performance. Snap-on’s reportable business segments are: (i) the Commercial & Industrial Group;(ii) the Snap-on Tools Group; (iii) the Repair Systems & Information Group; and (iv) Financial Services. The Commercial &Industrial Group consists of business operations serving a broad range of industrial and commercial customers worldwide, includingcustomers in the aerospace, natural resources, government, power generation, transportation and technical education marketsegments (collectively, “critical industries”), primarily through direct and distributor channels. The Snap-on Tools Group consistsof business operations primarily serving vehicle service and repair technicians through the company’s worldwide mobile tooldistribution channel. The Repair Systems & Information Group consists of business operations serving other professional vehiclerepair customers worldwide, primarily owners and managers of independent repair shops and OEM dealership service and repairshops (“OEM dealerships”), through direct and distributor channels. Financial Services consists of the business operations of Snap-on’s finance subsidiaries.
Snap-on evaluates the performance of its operating segments based on segment revenues, including both external and intersegmentnet sales, and segment operating earnings. Snap-on accounts for intersegment sales and transfers based primarily on standard costswith reasonable mark-ups established between the segments. Identifiable assets by segment are those assets used in the respectivereportable segment’s operations. Corporate assets consist of cash and cash equivalents (excluding cash held at Financial Services),deferred income taxes and certain other assets. All significant intersegment amounts are eliminated to arrive at Snap-on’s
Table of ContentsSNAP-ON INCORPORATED
NOTES TO CONDENSED CONSOLIDATED FINANCIAL STATEMENTS (continued)(Unaudited)
32
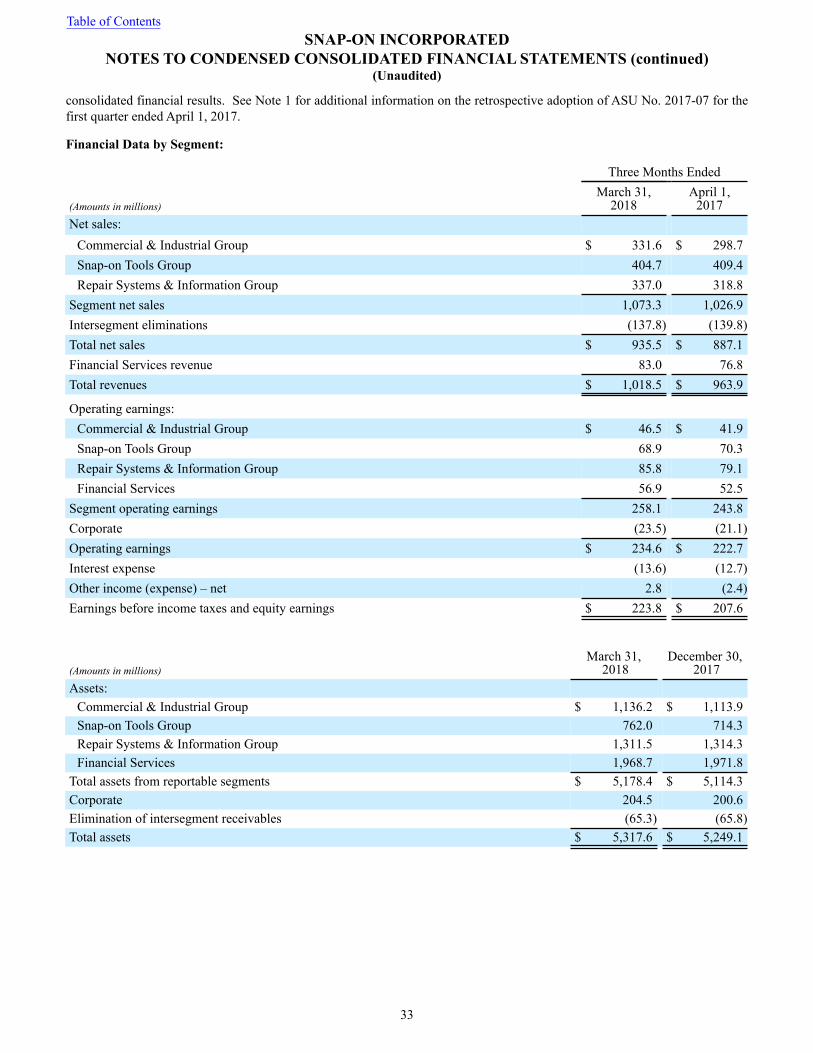
consolidated financial results. See Note 1 for additional information on the retrospective adoption of ASU No. 2017-07 for thefirst quarter ended April 1, 2017.
Financial Data by Segment:
Three Months Ended
(Amounts in millions)March 31,
2018April 1,
2017Net sales:
Commercial & Industrial Group $ 331.6 $ 298.7Snap-on Tools Group 404.7 409.4Repair Systems & Information Group 337.0 318.8
Segment net sales 1,073.3 1,026.9Intersegment eliminations (137.8) (139.8)Total net sales $ 935.5 $ 887.1Financial Services revenue 83.0 76.8Total revenues $ 1,018.5 $ 963.9
Operating earnings:Commercial & Industrial Group $ 46.5 $ 41.9Snap-on Tools Group 68.9 70.3Repair Systems & Information Group 85.8 79.1Financial Services 56.9 52.5
Segment operating earnings 258.1 243.8Corporate (23.5) (21.1)Operating earnings $ 234.6 $ 222.7Interest expense (13.6) (12.7)Other income (expense) – net 2.8 (2.4)Earnings before income taxes and equity earnings $ 223.8 $ 207.6
(Amounts in millions)March 31,
2018December 30,
2017Assets:
Commercial & Industrial Group $ 1,136.2 $ 1,113.9Snap-on Tools Group 762.0 714.3Repair Systems & Information Group 1,311.5 1,314.3Financial Services 1,968.7 1,971.8
Total assets from reportable segments $ 5,178.4 $ 5,114.3Corporate 204.5 200.6Elimination of intersegment receivables (65.3) (65.8)Total assets $ 5,317.6 $ 5,249.1
Table of ContentsSNAP-ON INCORPORATED
NOTES TO CONDENSED CONSOLIDATED FINANCIAL STATEMENTS (continued)(Unaudited)
33
Item 2: Management’s Discussion and Analysis of Financial Condition and Results of Operations
Caution Regarding Forward-Looking Statements:
Statements in this document that are not historical facts, including statements that (i) are in the future tense; (ii) include the words“expects,” “plans,” “targets,” “estimates,” “believes,” “anticipates,” or similar words that reference Snap-on Incorporated (“Snap-on” or “the company”) or its management; (iii) are specifically identified as forward-looking; or (iv) describe Snap-on’s ormanagement’s future outlook, plans, estimates, objectives or goals, are forward-looking statements within the meaning of thePrivate Securities Litigation Reform Act of 1995. Snap-on cautions the reader that any forward-looking statements included inthis document that are based upon assumptions and estimates were developed by management in good faith and are subject torisks, uncertainties or other factors that could cause (and in some cases have caused) actual results to differ materially from thosedescribed in any such statement. Accordingly, forward-looking statements should not be relied upon as a prediction of actual resultsor regarded as a representation by the company or its management that the projected results will be achieved. For those forward-looking statements, Snap-on cautions the reader that numerous important factors, such as those listed below, as well as those factorsdiscussed in its Annual Report on Form 10-K for the fiscal year ended December 30, 2017, which are incorporated herein byreference, could affect the company’s actual results and could cause its actual consolidated results to differ materially from thoseexpressed in any forward-looking statement made by, or on behalf of, Snap-on.
These risks and uncertainties include, without limitation, uncertainties related to estimates, statements, assumptions and projectionsgenerally, and the timing and progress with which Snap-on can attain value through its Snap-on Value Creation Processes, includingits ability to realize efficiencies and savings from its rapid continuous improvement and other cost reduction initiatives, improveworkforce productivity, achieve improvements in the company’s manufacturing footprint and greater efficiencies in its supplychain, and enhance machine maintenance, plant productivity and manufacturing line set-up and change-over practices, any or allof which could result in production inefficiencies, higher costs and/or lost revenues. These risks also include uncertainties relatedto Snap-on’s capability to implement future strategies with respect to its existing businesses, its ability to refine its brand andfranchise strategies, retain and attract franchisees, further enhance service and value to franchisees and thereby help improve theirsales and profitability, introduce successful new products, successfully pursue, complete and integrate acquisitions, as well as itsability to withstand disruption arising from natural disasters, planned facility closures or other labor interruptions, the effects ofexternal negative factors, including adverse developments in world financial markets, developments related to tariffs and othertrade issues or disputes, weakness in certain areas of the global economy (including as a result of the United Kingdom’s pendingexit from the European Union), and significant changes in the current competitive environment, inflation, interest rates and othermonetary and market fluctuations, changes in tax rates, laws and regulations, and the impact of energy and raw material supplyand pricing, including steel (as a result of recently-imposed U.S. tariffs on certain steel imports or otherwise) and gasoline, theamount, rate and growth of Snap-on’s general and administrative expenses, including health care and postretirement costs (resultingfrom, among other matters, U.S. health care legislation and its ongoing implementation or reform), continuing and potentiallyincreasing required contributions to pension and postretirement plans, the impacts of non-strategic business and/or product linerationalizations, and the effects on business as a result of new legislation, regulations or government-related developments orissues, risks associated with data security and technological systems and protections, potential reputational damages and costsrelated to litigation as well as an inability to assure that costs will be reduced or eliminated on appeal, and other world or localevents outside Snap-on’s control, including terrorist disruptions. Snap-on disclaims any responsibility to update any forward-looking statement provided in this document, except as required by law.
In addition, investors should be aware that generally accepted accounting principles in the United States of America (“GAAP”)prescribe when a company should reserve for particular risks, including litigation exposures. Accordingly, results for a givenreporting period could be significantly affected if and when a reserve is established for a major contingency. Reported results,therefore, may appear to be volatile in certain accounting periods.
Recent Acquisitions
On January 31, 2018, Snap-on acquired substantially all of the assets of George A. Sturdevant, Inc. (d/b/a Fastorq) for a cashpurchase price of $3.0 million. Fastorq, based in New Caney, Texas, designs, assembles and distributes hydraulic torque andhydraulic tensioning products for use in critical industries. The acquisition of the Fastorq product line complemented and increasedSnap-on's existing torque product offering and broadened its established capabilities in serving critical industries.
Table of ContentsSNAP-ON INCORPORATED
MANAGEMENT’S DISCUSSION AND ANALYSIS OF FINANCIAL CONDITION AND RESULTSOF OPERATIONS
34
On July 28, 2017, Snap-on acquired Torque Control Specialists Pty Ltd (“TCS”) for a cash purchase price of $3.6 million (or$3.5 million, net of cash acquired). TCS distributes a full range of torque products, including wrenches, multipliers and calibratorsfor use in critical industries.
On May 4, 2017, Snap-on acquired Norbar Torque Tools Holdings Limited, along with its U.S. and Chinese joint ventures (“Norbar”)for a cash purchase price of $71.6 million (or $69.9 million, net of cash acquired). Norbar designs and manufactures a full rangeof torque products, including wrenches, multipliers and calibrators for use in critical industries.
On January 30, 2017, Snap-on acquired BTC Global Limited (“BTC”) for a cash purchase price of $9.2 million. BTC designs andimplements automotive vehicle inspection and management software for original equipment manufacturer (“OEM”) franchiserepair shops.
For segment reporting purposes, the results of operations and assets of Fastorq, TCS and Norbar have been included in theCommercial & Industrial Group since the acquisition date and the results of operations and assets of BTC have been included inthe Repair Systems and Information Group since the acquisition date.
Pro forma financial information has not been presented for any of these acquisitions as the net effects, individually and collectively,were neither significant nor material to Snap-on’s results of operations or financial position.
Impact of the Tax Act
The effective tax rate for 2018 includes the net tax benefits attributable to the U.S. Tax Cuts and Jobs Act (the “Tax Act”), whichwas signed into law on December 22, 2017.
The Tax Act made broad and complex changes to the U.S. tax code, including, but not limited to, (i) reducing the future U.S.federal corporate tax rate from 35 percent to 21 percent; and (ii) requiring companies to pay a one-time transition tax on certainunremitted earnings of foreign subsidiaries.
The Tax Act also established new tax laws that affect 2018, including, but not limited to: (i) the reduction of the U.S. federalcorporate tax rate discussed above; (ii) a general elimination of U.S. federal income taxes on dividends from foreign subsidiaries;(iii) a new provision designed to tax global intangible low-taxed income (“GILTI”); (iv) the repeal of the domestic productionactivity deductions; (v) limitations on the deductibility of certain executive compensation; (vi) limitations on the use of foreigntax credits to reduce the U.S. income tax liability; and (vii) a new provision that allows a domestic corporation an immediatededuction for a portion of its foreign derived intangible income (“FDII”).
The Securities and Exchange Commission staff issued Staff Accounting Bulletin (“SAB”) 118, which provides guidance onaccounting for the tax effects of the Tax Act. SAB 118 provides a measurement period that should not extend beyond one yearfrom the Tax Act enactment date for companies to complete the related accounting under ASC 740, Accounting for Income Taxes.In accordance with SAB 118, a company must reflect the income tax effects of those aspects of the Tax Act for which the accountingunder ASC 740 is complete. To the extent that a company’s accounting for a certain income tax effect of the Tax Act is incomplete,but it is able to determine a reasonable estimate, it must record a provisional estimate in the financial statements. If a companycannot determine a provisional estimate to be included in the financial statements, it should continue to apply ASC 740 on thebasis of the provisions of the tax laws that were in effect immediately before the enactment of the Tax Act.
The company’s accounting for the certain elements of the Tax Act was incomplete as of the period ended December 30, 2017, andremains incomplete as of March 31, 2018. However, the company was able to make reasonable estimates of the effects and,therefore, recorded provisional estimates for these items. In connection with its initial analysis of the impact of the Tax Act, thecompany recorded a provisional discrete net tax expense of $7.0 million in the period ended December 30, 2017. This provisionalestimate consists of a net expense of $13.7 million for the one-time transition tax and a net benefit of $6.7 million related torevaluation of deferred tax assets and liabilities, caused by the new lower corporate tax rate. To determine the transition tax, thecompany must determine the amount of post-1986 accumulated earnings and profits of the relevant subsidiaries, as well as theamount of non-U.S. income taxes paid on such earnings. While the company was able to make a reasonable estimate of thetransition tax, it is continuing to gather additional information to more precisely compute the final amount. Likewise, while thecompany was able to make a reasonable estimate of the impact of the reduction to the corporate tax rate, its rate may be affectedby other analyses related to the Tax Act, including, but not limited to, the state tax effect of adjustments made to federal temporarydifferences. Due to the complexity of the new GILTI tax rules, the company is continuing to evaluate this provision of the Tax Act
Table of ContentsSNAP-ON INCORPORATED
MANAGEMENT’S DISCUSSION AND ANALYSIS OF FINANCIAL CONDITION AND RESULTSOF OPERATIONS
(continued)
35
and the application of ASC 740. Under GAAP, the company is allowed to make an accounting policy choice to either (i) treattaxes due on future U.S. inclusions in taxable income related to GILTI as a current-period expense when incurred (the “period costmethod"); or (ii) factor in such amounts into a company’s measurement of its deferred taxes (the “deferred method”). The company’sselection of an accounting policy with respect to the new GILTI tax rules is dependent on additional analysis and potential futuremodifications to existing structures, which are not currently known. The company has not made a policy decision regardingwhether to record deferred taxes on GILTI. The company will continue to analyze the full effects of the Tax Act on its consolidatedfinancial statements.
During the first three months of 2018, the Internal Revenue Service issued new guidance affecting the computation of the company’s2017 federal income tax liability. As a result of this new guidance and additional analysis of the impacts of the Tax Act, thecompany revised its prior estimates and recorded $2.6 million of additional tax expense related to the Tax Act during the period.The ultimate impact of the Tax Act may differ from the current estimates, possibly materially, due to changes in interpretationsand assumptions the company has made, future guidance that may be issued and actions the company may take as a result of thelaw. Impact of ASU No. 2017-07
At the beginning of fiscal 2018, Snap-on adopted ASU No. 2017-07, Compensation – Retirement Benefits (Topic 715) – Improvingthe Presentation of Net Periodic Pension Cost and Net Periodic Postretirement Benefit Cost. The ASU requires changes to beapplied retrospectively; as such, prior periods have been restated to reflect this adoption. See Note 1 to the Condensed ConsolidatedFinancial Statements for further information on the adoption of this ASU.
Table of ContentsSNAP-ON INCORPORATED
MANAGEMENT’S DISCUSSION AND ANALYSIS OF FINANCIAL CONDITION AND RESULTSOF OPERATIONS
36
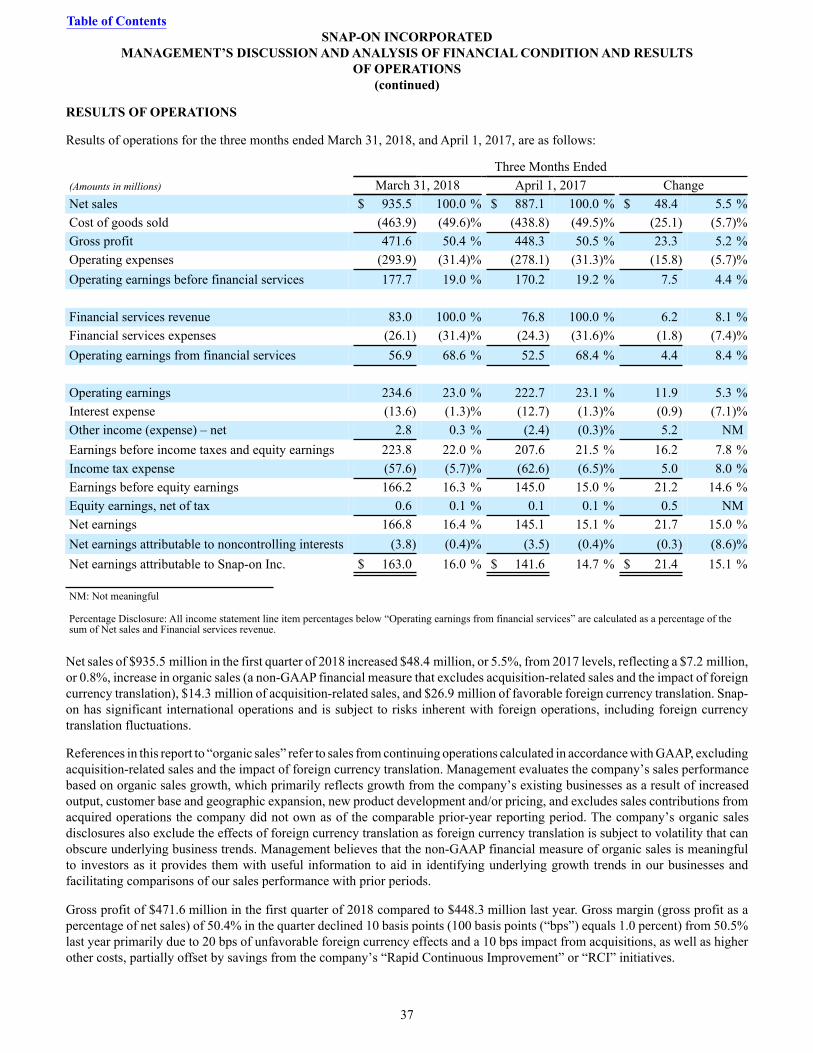
RESULTS OF OPERATIONS
Results of operations for the three months ended March 31, 2018, and April 1, 2017, are as follows:
Three Months Ended(Amounts in millions) March 31, 2018 April 1, 2017 ChangeNet sales $ 935.5 100.0 % $ 887.1 100.0 % $ 48.4 5.5 %Cost of goods sold (463.9) (49.6)% (438.8) (49.5)% (25.1) (5.7)%Gross profit 471.6 50.4 % 448.3 50.5 % 23.3 5.2 %Operating expenses (293.9) (31.4)% (278.1) (31.3)% (15.8) (5.7)%Operating earnings before financial services 177.7 19.0 % 170.2 19.2 % 7.5 4.4 %
Financial services revenue 83.0 100.0 % 76.8 100.0 % 6.2 8.1 %Financial services expenses (26.1) (31.4)% (24.3) (31.6)% (1.8) (7.4)%Operating earnings from financial services 56.9 68.6 % 52.5 68.4 % 4.4 8.4 %
Operating earnings 234.6 23.0 % 222.7 23.1 % 11.9 5.3 %Interest expense (13.6) (1.3)% (12.7) (1.3)% (0.9) (7.1)%Other income (expense) – net 2.8 0.3 % (2.4) (0.3)% 5.2 NMEarnings before income taxes and equity earnings 223.8 22.0 % 207.6 21.5 % 16.2 7.8 %Income tax expense (57.6) (5.7)% (62.6) (6.5)% 5.0 8.0 %Earnings before equity earnings 166.2 16.3 % 145.0 15.0 % 21.2 14.6 %Equity earnings, net of tax 0.6 0.1 % 0.1 0.1 % 0.5 NMNet earnings 166.8 16.4 % 145.1 15.1 % 21.7 15.0 %Net earnings attributable to noncontrolling interests (3.8) (0.4)% (3.5) (0.4)% (0.3) (8.6)%Net earnings attributable to Snap-on Inc. $ 163.0 16.0 % $ 141.6 14.7 % $ 21.4 15.1 %
NM: Not meaningful
Percentage Disclosure: All income statement line item percentages below “Operating earnings from financial services” are calculated as a percentage of thesum of Net sales and Financial services revenue.
Net sales of $935.5 million in the first quarter of 2018 increased $48.4 million, or 5.5%, from 2017 levels, reflecting a $7.2 million,or 0.8%, increase in organic sales (a non-GAAP financial measure that excludes acquisition-related sales and the impact of foreigncurrency translation), $14.3 million of acquisition-related sales, and $26.9 million of favorable foreign currency translation. Snap-on has significant international operations and is subject to risks inherent with foreign operations, including foreign currencytranslation fluctuations.
References in this report to “organic sales” refer to sales from continuing operations calculated in accordance with GAAP, excludingacquisition-related sales and the impact of foreign currency translation. Management evaluates the company’s sales performancebased on organic sales growth, which primarily reflects growth from the company’s existing businesses as a result of increasedoutput, customer base and geographic expansion, new product development and/or pricing, and excludes sales contributions fromacquired operations the company did not own as of the comparable prior-year reporting period. The company’s organic salesdisclosures also exclude the effects of foreign currency translation as foreign currency translation is subject to volatility that canobscure underlying business trends. Management believes that the non-GAAP financial measure of organic sales is meaningfulto investors as it provides them with useful information to aid in identifying underlying growth trends in our businesses andfacilitating comparisons of our sales performance with prior periods. Gross profit of $471.6 million in the first quarter of 2018 compared to $448.3 million last year. Gross margin (gross profit as apercentage of net sales) of 50.4% in the quarter declined 10 basis points (100 basis points (“bps”) equals 1.0 percent) from 50.5%last year primarily due to 20 bps of unfavorable foreign currency effects and a 10 bps impact from acquisitions, as well as higherother costs, partially offset by savings from the company’s “Rapid Continuous Improvement” or “RCI” initiatives.
Table of ContentsSNAP-ON INCORPORATED
MANAGEMENT’S DISCUSSION AND ANALYSIS OF FINANCIAL CONDITION AND RESULTSOF OPERATIONS
(continued)
37
Snap-on’s RCI initiatives employ a structured set of tools and processes across multiple businesses and geographies intended toeliminate waste and improve operations. Savings from Snap-on’s RCI initiatives reflect benefits from a wide variety of ongoingefficiency, productivity and process improvements, including savings generated from product design cost reductions, improvedmanufacturing line set-up and change-over practices, lower-cost sourcing initiatives and facility optimization. Unless individuallysignificant, it is not practicable to disclose each RCI activity that generated savings and/or segregate RCI savings embedded insales volume increases.
Operating expenses of $293.9 million in the first quarter of 2018 compared to $278.1 million last year. The operating expensemargin (operating expenses as a percentage of net sales) of 31.4% compared to 31.3% last year.
Operating earnings before financial services of $177.7 million in the first quarter of 2018, including $3.7 million of favorableforeign currency effects, increased $7.5 million, or 4.4%, as compared to $170.2 million last year. As a percentage of net sales,operating earnings before financial services of 19.0%, including 20 bps of unfavorable foreign currency effects, compared to 19.2%last year.
Financial services revenue of $83.0 million in the first quarter of 2018 compared to revenue of $76.8 million last year. Financialservices operating earnings of $56.9 million in the first quarter of 2018, including $0.5 million of favorable foreign currencyeffects, increased $4.4 million, or 8.4%, as compared to $52.5 million last year. The year-over-year increases in both revenue andoperating earnings primarily reflect continued growth of the company’s financial services portfolio.
Operating earnings of $234.6 million in the first quarter of 2018, including $4.2 million of favorable foreign currency effects,increased $11.9 million, or 5.3%, from $222.7 million last year. As a percentage of revenues (net sales plus financial servicesrevenue), operating earnings of 23.0% in the quarter, including 20 bps of unfavorable foreign currency effects, compared to 23.1%last year.
Interest expense was $13.6 million and $12.7 million in the respective first quarters of 2018 and 2017. See Note 8 to the CondensedConsolidated Financial Statements for information on Snap-on’s debt and credit facilities.
Other income (expense) – net was income of $2.8 million and expense of $2.4 million in the respective first quarters of 2018 and2017. Other income (expense) – net in fiscal 2018 includes a net gain of $5.5 million associated with a treasury lock settlementgain of $13.3 million related to the issuance of debt, partially offset by $7.8 million of expense related to the early extinguishmentof debt (collectively, the "net debt items"), net gains and losses associated with hedging and currency exchange rate transactions,non-service components of net periodic benefit costs, and interest income. See Note 15 to the Condensed Consolidated FinancialStatements for information on other income (expense) – net.
Snap-on’s 2018 first quarter effective income tax rate on earnings attributable to Snap-on was 26.2%, including 120 bps relatedto the implementation of tax legislation ("tax charge"), as compared to 30.7% in 2017. See Note 7 to the Condensed ConsolidatedFinancial Statements for information on income taxes.
Net earnings attributable to Snap-on of $163.0 million, or $2.82 per diluted share, in the first quarter of 2018, including $4.1million, or $0.07 per diluted share, for the after-tax net debt items, and $2.6 million, or $0.04 per diluted share for the tax charge,increased $21.4 million, or $0.43 per diluted share, from 2017 levels. Net earnings attributable to Snap-on in the first quarter of2017 were $141.6 million, or $2.39 per diluted share.
Segment Results
Snap-on’s business segments are based on the organization structure used by management for making operating and investmentdecisions and for assessing performance. Snap-on’s reportable business segments are: (i) the Commercial & Industrial Group;(ii) the Snap-on Tools Group; (iii) the Repair Systems & Information Group; and (iv) Financial Services. The Commercial &Industrial Group consists of business operations serving a broad range of industrial and commercial customers worldwide, includingcustomers in the aerospace, natural resources, government, power generation, transportation and technical education marketsegments (collectively, “critical industries”), primarily through direct and distributor channels. The Snap-on Tools Group consistsof business operations primarily serving vehicle service and repair technicians through the company’s worldwide mobile tooldistribution channel. The Repair Systems & Information Group consists of business operations serving other professional vehiclerepair customers worldwide, primarily owners and managers of independent repair shops and OEM dealership service and repairshops (“OEM dealerships”), through direct and distributor channels. Financial Services consists of the business operations of Snap-on’s finance subsidiaries.
Table of ContentsSNAP-ON INCORPORATED
MANAGEMENT’S DISCUSSION AND ANALYSIS OF FINANCIAL CONDITION AND RESULTSOF OPERATIONS
(continued)
38
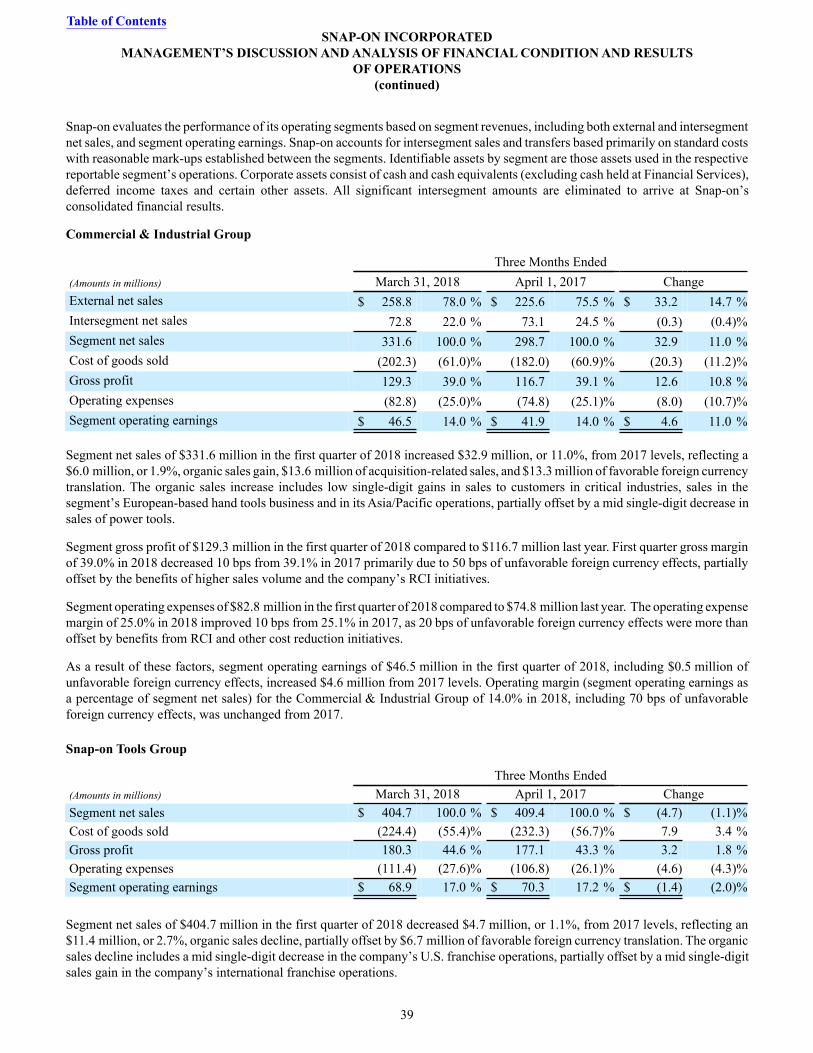
Snap-on evaluates the performance of its operating segments based on segment revenues, including both external and intersegmentnet sales, and segment operating earnings. Snap-on accounts for intersegment sales and transfers based primarily on standard costswith reasonable mark-ups established between the segments. Identifiable assets by segment are those assets used in the respectivereportable segment’s operations. Corporate assets consist of cash and cash equivalents (excluding cash held at Financial Services),deferred income taxes and certain other assets. All significant intersegment amounts are eliminated to arrive at Snap-on’sconsolidated financial results.
Commercial & Industrial Group
Three Months Ended(Amounts in millions) March 31, 2018 April 1, 2017 ChangeExternal net sales $ 258.8 78.0 % $ 225.6 75.5 % $ 33.2 14.7 %Intersegment net sales 72.8 22.0 % 73.1 24.5 % (0.3) (0.4)%Segment net sales 331.6 100.0 % 298.7 100.0 % 32.9 11.0 %Cost of goods sold (202.3) (61.0)% (182.0) (60.9)% (20.3) (11.2)%Gross profit 129.3 39.0 % 116.7 39.1 % 12.6 10.8 %Operating expenses (82.8) (25.0)% (74.8) (25.1)% (8.0) (10.7)%Segment operating earnings $ 46.5 14.0 % $ 41.9 14.0 % $ 4.6 11.0 %
Segment net sales of $331.6 million in the first quarter of 2018 increased $32.9 million, or 11.0%, from 2017 levels, reflecting a$6.0 million, or 1.9%, organic sales gain, $13.6 million of acquisition-related sales, and $13.3 million of favorable foreign currencytranslation. The organic sales increase includes low single-digit gains in sales to customers in critical industries, sales in thesegment’s European-based hand tools business and in its Asia/Pacific operations, partially offset by a mid single-digit decrease insales of power tools.
Segment gross profit of $129.3 million in the first quarter of 2018 compared to $116.7 million last year. First quarter gross marginof 39.0% in 2018 decreased 10 bps from 39.1% in 2017 primarily due to 50 bps of unfavorable foreign currency effects, partiallyoffset by the benefits of higher sales volume and the company’s RCI initiatives.
Segment operating expenses of $82.8 million in the first quarter of 2018 compared to $74.8 million last year. The operating expensemargin of 25.0% in 2018 improved 10 bps from 25.1% in 2017, as 20 bps of unfavorable foreign currency effects were more thanoffset by benefits from RCI and other cost reduction initiatives.
As a result of these factors, segment operating earnings of $46.5 million in the first quarter of 2018, including $0.5 million ofunfavorable foreign currency effects, increased $4.6 million from 2017 levels. Operating margin (segment operating earnings asa percentage of segment net sales) for the Commercial & Industrial Group of 14.0% in 2018, including 70 bps of unfavorableforeign currency effects, was unchanged from 2017.
Snap-on Tools Group
Three Months Ended(Amounts in millions) March 31, 2018 April 1, 2017 ChangeSegment net sales $ 404.7 100.0 % $ 409.4 100.0 % $ (4.7) (1.1)%Cost of goods sold (224.4) (55.4)% (232.3) (56.7)% 7.9 3.4 %Gross profit 180.3 44.6 % 177.1 43.3 % 3.2 1.8 %Operating expenses (111.4) (27.6)% (106.8) (26.1)% (4.6) (4.3)%Segment operating earnings $ 68.9 17.0 % $ 70.3 17.2 % $ (1.4) (2.0)%
Segment net sales of $404.7 million in the first quarter of 2018 decreased $4.7 million, or 1.1%, from 2017 levels, reflecting an$11.4 million, or 2.7%, organic sales decline, partially offset by $6.7 million of favorable foreign currency translation. The organicsales decline includes a mid single-digit decrease in the company’s U.S. franchise operations, partially offset by a mid single-digitsales gain in the company’s international franchise operations.
Table of ContentsSNAP-ON INCORPORATED
MANAGEMENT’S DISCUSSION AND ANALYSIS OF FINANCIAL CONDITION AND RESULTSOF OPERATIONS
(continued)
39
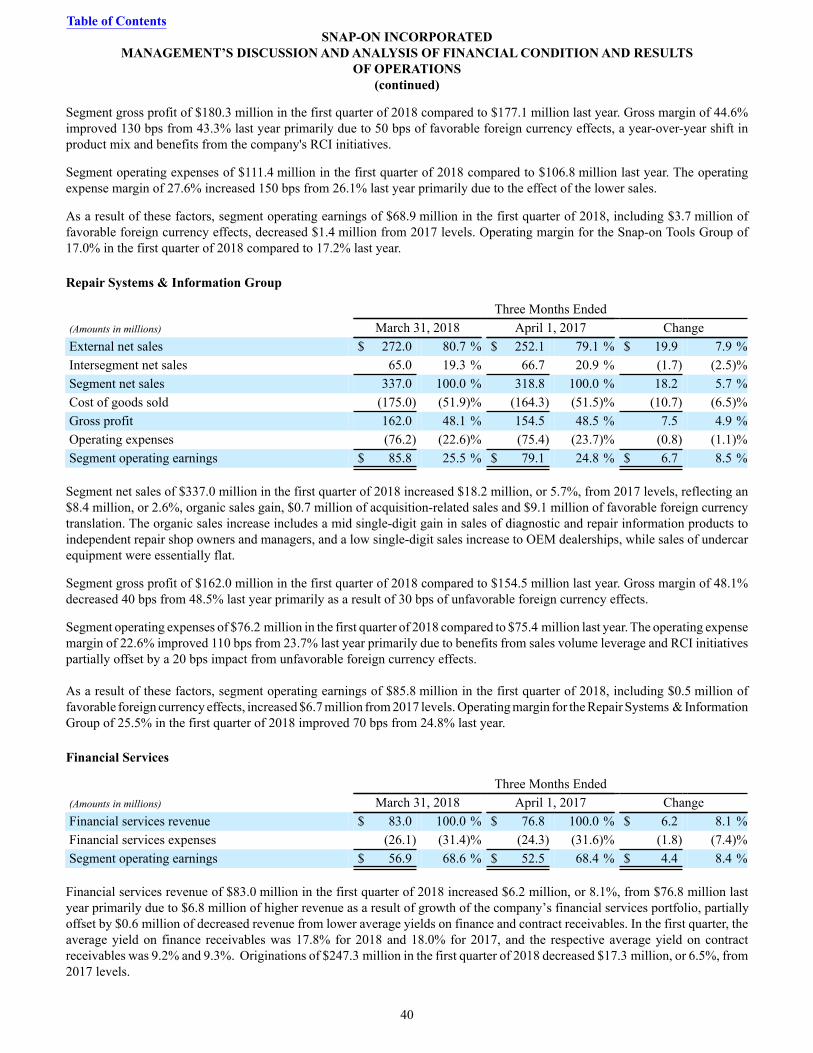
Segment gross profit of $180.3 million in the first quarter of 2018 compared to $177.1 million last year. Gross margin of 44.6%improved 130 bps from 43.3% last year primarily due to 50 bps of favorable foreign currency effects, a year-over-year shift inproduct mix and benefits from the company's RCI initiatives.
Segment operating expenses of $111.4 million in the first quarter of 2018 compared to $106.8 million last year. The operatingexpense margin of 27.6% increased 150 bps from 26.1% last year primarily due to the effect of the lower sales.
As a result of these factors, segment operating earnings of $68.9 million in the first quarter of 2018, including $3.7 million offavorable foreign currency effects, decreased $1.4 million from 2017 levels. Operating margin for the Snap-on Tools Group of17.0% in the first quarter of 2018 compared to 17.2% last year.
Repair Systems & Information Group
Three Months Ended(Amounts in millions) March 31, 2018 April 1, 2017 ChangeExternal net sales $ 272.0 80.7 % $ 252.1 79.1 % $ 19.9 7.9 %Intersegment net sales 65.0 19.3 % 66.7 20.9 % (1.7) (2.5)%Segment net sales 337.0 100.0 % 318.8 100.0 % 18.2 5.7 %Cost of goods sold (175.0) (51.9)% (164.3) (51.5)% (10.7) (6.5)%Gross profit 162.0 48.1 % 154.5 48.5 % 7.5 4.9 %Operating expenses (76.2) (22.6)% (75.4) (23.7)% (0.8) (1.1)%Segment operating earnings $ 85.8 25.5 % $ 79.1 24.8 % $ 6.7 8.5 %
Segment net sales of $337.0 million in the first quarter of 2018 increased $18.2 million, or 5.7%, from 2017 levels, reflecting an$8.4 million, or 2.6%, organic sales gain, $0.7 million of acquisition-related sales and $9.1 million of favorable foreign currencytranslation. The organic sales increase includes a mid single-digit gain in sales of diagnostic and repair information products toindependent repair shop owners and managers, and a low single-digit sales increase to OEM dealerships, while sales of undercarequipment were essentially flat.
Segment gross profit of $162.0 million in the first quarter of 2018 compared to $154.5 million last year. Gross margin of 48.1%decreased 40 bps from 48.5% last year primarily as a result of 30 bps of unfavorable foreign currency effects.
Segment operating expenses of $76.2 million in the first quarter of 2018 compared to $75.4 million last year. The operating expensemargin of 22.6% improved 110 bps from 23.7% last year primarily due to benefits from sales volume leverage and RCI initiativespartially offset by a 20 bps impact from unfavorable foreign currency effects.
As a result of these factors, segment operating earnings of $85.8 million in the first quarter of 2018, including $0.5 million offavorable foreign currency effects, increased $6.7 million from 2017 levels. Operating margin for the Repair Systems & InformationGroup of 25.5% in the first quarter of 2018 improved 70 bps from 24.8% last year.
Financial Services
Three Months Ended(Amounts in millions) March 31, 2018 April 1, 2017 ChangeFinancial services revenue $ 83.0 100.0 % $ 76.8 100.0 % $ 6.2 8.1 %Financial services expenses (26.1) (31.4)% (24.3) (31.6)% (1.8) (7.4)%Segment operating earnings $ 56.9 68.6 % $ 52.5 68.4 % $ 4.4 8.4 %
Financial services revenue of $83.0 million in the first quarter of 2018 increased $6.2 million, or 8.1%, from $76.8 million lastyear primarily due to $6.8 million of higher revenue as a result of growth of the company’s financial services portfolio, partiallyoffset by $0.6 million of decreased revenue from lower average yields on finance and contract receivables. In the first quarter, theaverage yield on finance receivables was 17.8% for 2018 and 18.0% for 2017, and the respective average yield on contractreceivables was 9.2% and 9.3%. Originations of $247.3 million in the first quarter of 2018 decreased $17.3 million, or 6.5%, from2017 levels.
Table of ContentsSNAP-ON INCORPORATED
MANAGEMENT’S DISCUSSION AND ANALYSIS OF FINANCIAL CONDITION AND RESULTSOF OPERATIONS
(continued)
40
Financial services expenses primarily include personnel-related and other general and administrative costs, as well as provisionsfor credit losses. These expenses are generally more dependent on changes in the size of the financial services portfolio than theyare on the revenue of the segment. Financial services expenses of $26.1 million in the first quarter of 2018 increased $1.8 millionfrom $24.3 million last year primarily due to changes in both the size of the portfolio and in the provisions for credit losses. As apercentage of the average financial services portfolio, financial services expenses were 1.3% in both of the first quarters of 2018and 2017.
Financial services operating earnings of $56.9 million in the first quarter of 2018, including $0.5 million of favorable foreigncurrency effects, increased $4.4 million, or 8.4%, from 2017 levels.
See Note 4 to the Condensed Consolidated Financial Statements for further information on financial services.
Corporate
Snap-on’s first quarter 2018 general corporate expenses of $23.5 million increased $2.4 million from $21.1 million last year.
Table of ContentsSNAP-ON INCORPORATED
MANAGEMENT’S DISCUSSION AND ANALYSIS OF FINANCIAL CONDITION AND RESULTSOF OPERATIONS
(continued)
41
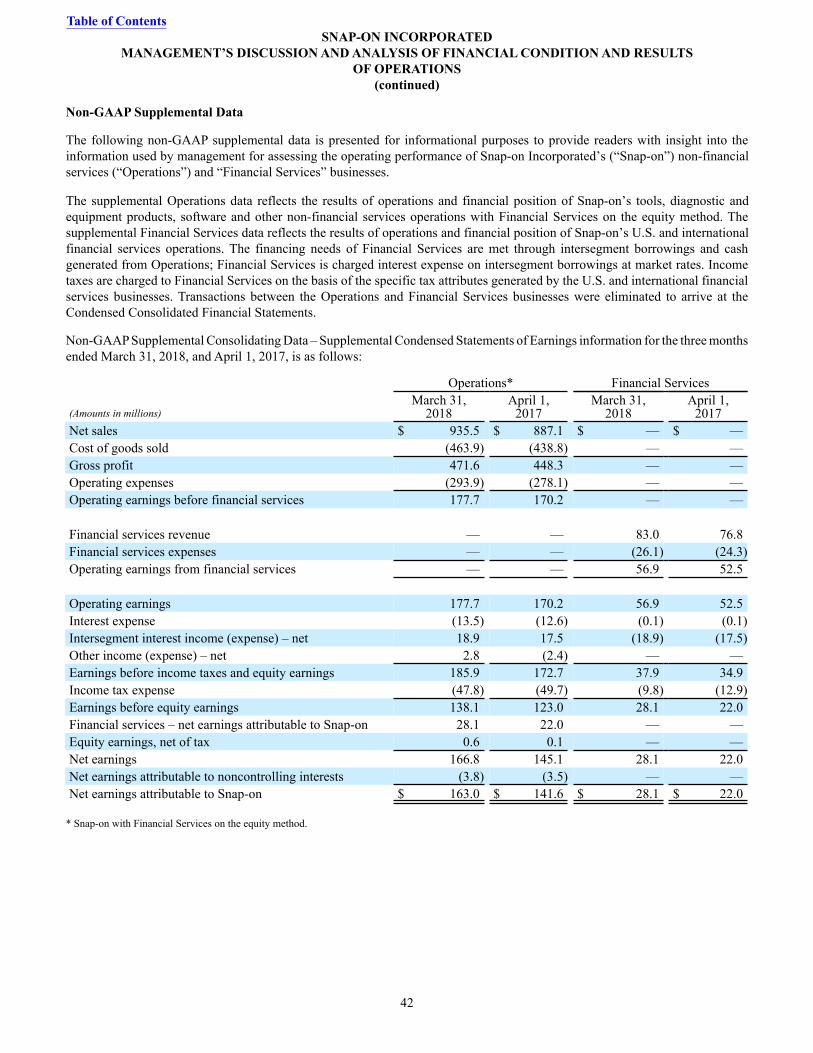
Non-GAAP Supplemental Data
The following non-GAAP supplemental data is presented for informational purposes to provide readers with insight into theinformation used by management for assessing the operating performance of Snap-on Incorporated’s (“Snap-on”) non-financialservices (“Operations”) and “Financial Services” businesses. The supplemental Operations data reflects the results of operations and financial position of Snap-on’s tools, diagnostic andequipment products, software and other non-financial services operations with Financial Services on the equity method. Thesupplemental Financial Services data reflects the results of operations and financial position of Snap-on’s U.S. and internationalfinancial services operations. The financing needs of Financial Services are met through intersegment borrowings and cashgenerated from Operations; Financial Services is charged interest expense on intersegment borrowings at market rates. Incometaxes are charged to Financial Services on the basis of the specific tax attributes generated by the U.S. and international financialservices businesses. Transactions between the Operations and Financial Services businesses were eliminated to arrive at theCondensed Consolidated Financial Statements.
Non-GAAP Supplemental Consolidating Data – Supplemental Condensed Statements of Earnings information for the three monthsended March 31, 2018, and April 1, 2017, is as follows:
Operations* Financial Services
(Amounts in millions)March 31,
2018April 1,
2017March 31,
2018April 1,
2017Net sales $ 935.5 $ 887.1 $ — $ —Cost of goods sold (463.9) (438.8) — —Gross profit 471.6 448.3 — —Operating expenses (293.9) (278.1) — —Operating earnings before financial services 177.7 170.2 — —
Financial services revenue — — 83.0 76.8Financial services expenses — — (26.1) (24.3)Operating earnings from financial services — — 56.9 52.5
Operating earnings 177.7 170.2 56.9 52.5Interest expense (13.5) (12.6) (0.1) (0.1)Intersegment interest income (expense) – net 18.9 17.5 (18.9) (17.5)Other income (expense) – net 2.8 (2.4) — —Earnings before income taxes and equity earnings 185.9 172.7 37.9 34.9Income tax expense (47.8) (49.7) (9.8) (12.9)Earnings before equity earnings 138.1 123.0 28.1 22.0Financial services – net earnings attributable to Snap-on 28.1 22.0 — —Equity earnings, net of tax 0.6 0.1 — —Net earnings 166.8 145.1 28.1 22.0Net earnings attributable to noncontrolling interests (3.8) (3.5) — —Net earnings attributable to Snap-on $ 163.0 $ 141.6 $ 28.1 $ 22.0
* Snap-on with Financial Services on the equity method.
Table of ContentsSNAP-ON INCORPORATED
MANAGEMENT’S DISCUSSION AND ANALYSIS OF FINANCIAL CONDITION AND RESULTSOF OPERATIONS
(continued)
42
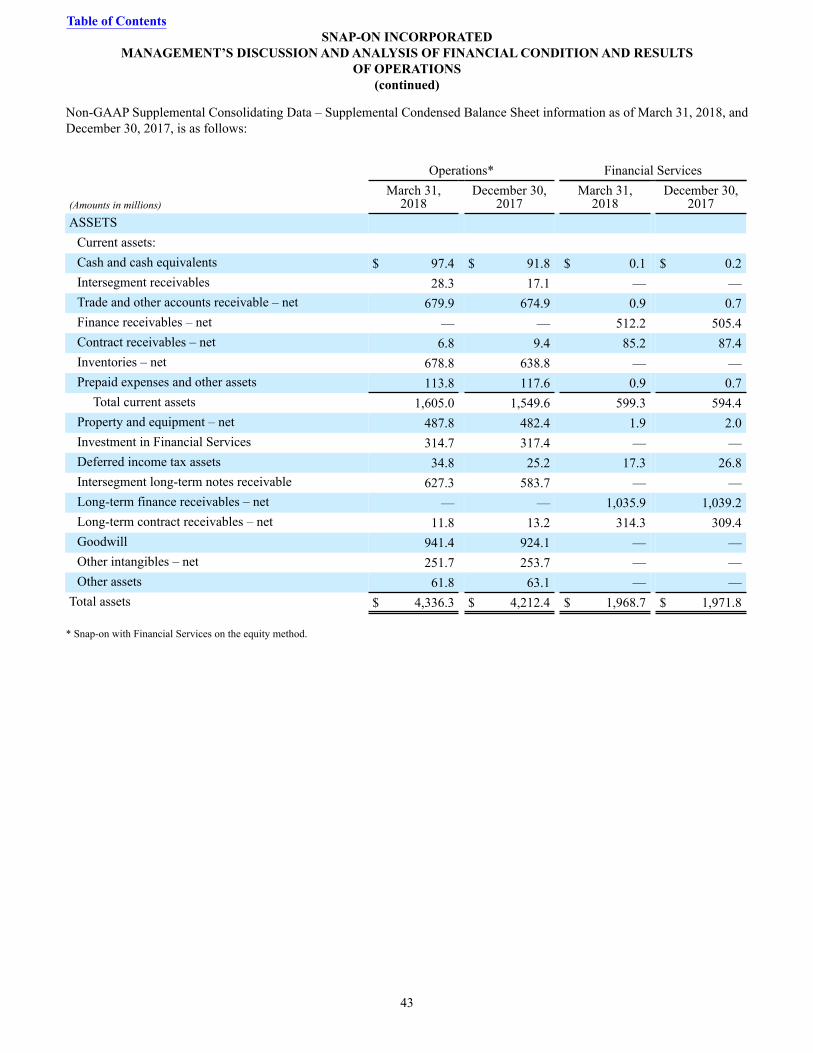
Non-GAAP Supplemental Consolidating Data – Supplemental Condensed Balance Sheet information as of March 31, 2018, andDecember 30, 2017, is as follows:
Operations* Financial Services
(Amounts in millions)March 31,
2018December 30,
2017March 31,
2018December 30,
2017ASSETS
Current assets:Cash and cash equivalents $ 97.4 $ 91.8 $ 0.1 $ 0.2Intersegment receivables 28.3 17.1 — —Trade and other accounts receivable – net 679.9 674.9 0.9 0.7Finance receivables – net — — 512.2 505.4Contract receivables – net 6.8 9.4 85.2 87.4Inventories – net 678.8 638.8 — —Prepaid expenses and other assets 113.8 117.6 0.9 0.7
Total current assets 1,605.0 1,549.6 599.3 594.4Property and equipment – net 487.8 482.4 1.9 2.0Investment in Financial Services 314.7 317.4 — —Deferred income tax assets 34.8 25.2 17.3 26.8Intersegment long-term notes receivable 627.3 583.7 — —Long-term finance receivables – net — — 1,035.9 1,039.2Long-term contract receivables – net 11.8 13.2 314.3 309.4Goodwill 941.4 924.1 — —Other intangibles – net 251.7 253.7 — —Other assets 61.8 63.1 — —
Total assets $ 4,336.3 $ 4,212.4 $ 1,968.7 $ 1,971.8
* Snap-on with Financial Services on the equity method.
Table of ContentsSNAP-ON INCORPORATED
MANAGEMENT’S DISCUSSION AND ANALYSIS OF FINANCIAL CONDITION AND RESULTSOF OPERATIONS
(continued)
43
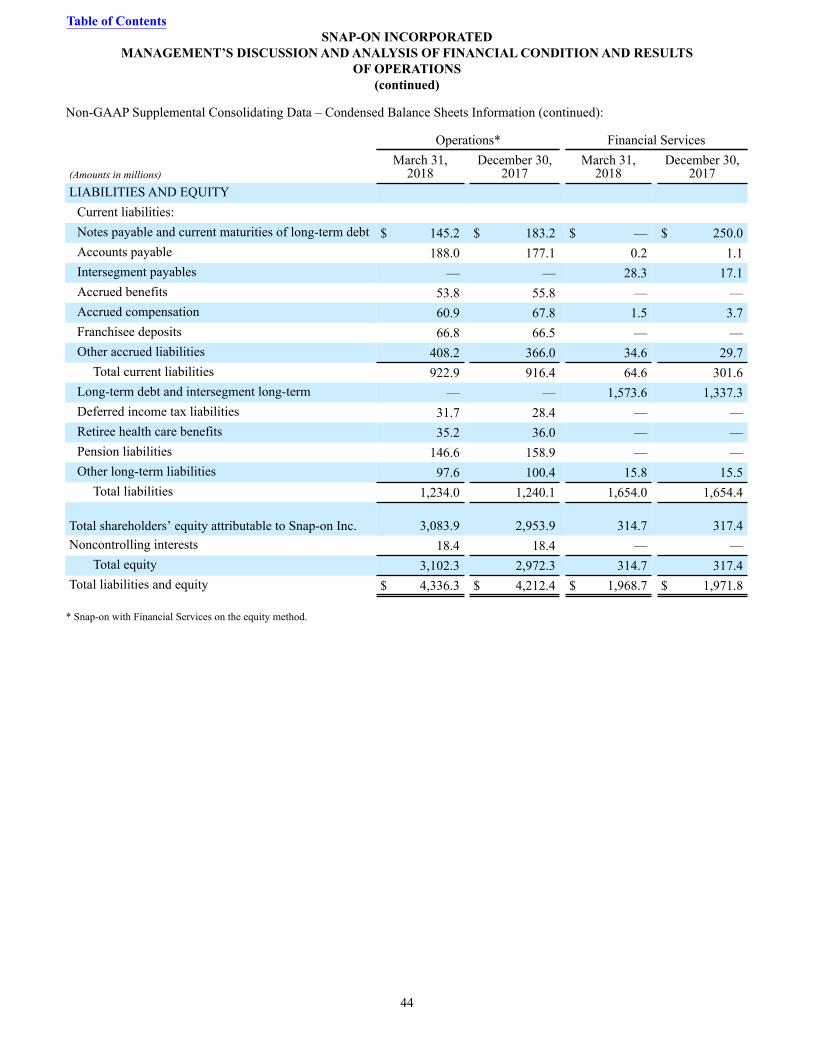
Non-GAAP Supplemental Consolidating Data – Condensed Balance Sheets Information (continued):
Operations* Financial Services
(Amounts in millions)March 31,
2018December 30,
2017March 31,
2018December 30,
2017LIABILITIES AND EQUITY
Current liabilities:Notes payable and current maturities of long-term debt $ 145.2 $ 183.2 $ — $ 250.0Accounts payable 188.0 177.1 0.2 1.1Intersegment payables — — 28.3 17.1Accrued benefits 53.8 55.8 — —Accrued compensation 60.9 67.8 1.5 3.7Franchisee deposits 66.8 66.5 — —Other accrued liabilities 408.2 366.0 34.6 29.7
Total current liabilities 922.9 916.4 64.6 301.6Long-term debt and intersegment long-term — — 1,573.6 1,337.3Deferred income tax liabilities 31.7 28.4 — —Retiree health care benefits 35.2 36.0 — —Pension liabilities 146.6 158.9 — —Other long-term liabilities 97.6 100.4 15.8 15.5
Total liabilities 1,234.0 1,240.1 1,654.0 1,654.4
Total shareholders’ equity attributable to Snap-on Inc. 3,083.9 2,953.9 314.7 317.4Noncontrolling interests 18.4 18.4 — —
Total equity 3,102.3 2,972.3 314.7 317.4Total liabilities and equity $ 4,336.3 $ 4,212.4 $ 1,968.7 $ 1,971.8
* Snap-on with Financial Services on the equity method.
Table of ContentsSNAP-ON INCORPORATED
MANAGEMENT’S DISCUSSION AND ANALYSIS OF FINANCIAL CONDITION AND RESULTSOF OPERATIONS
(continued)
44
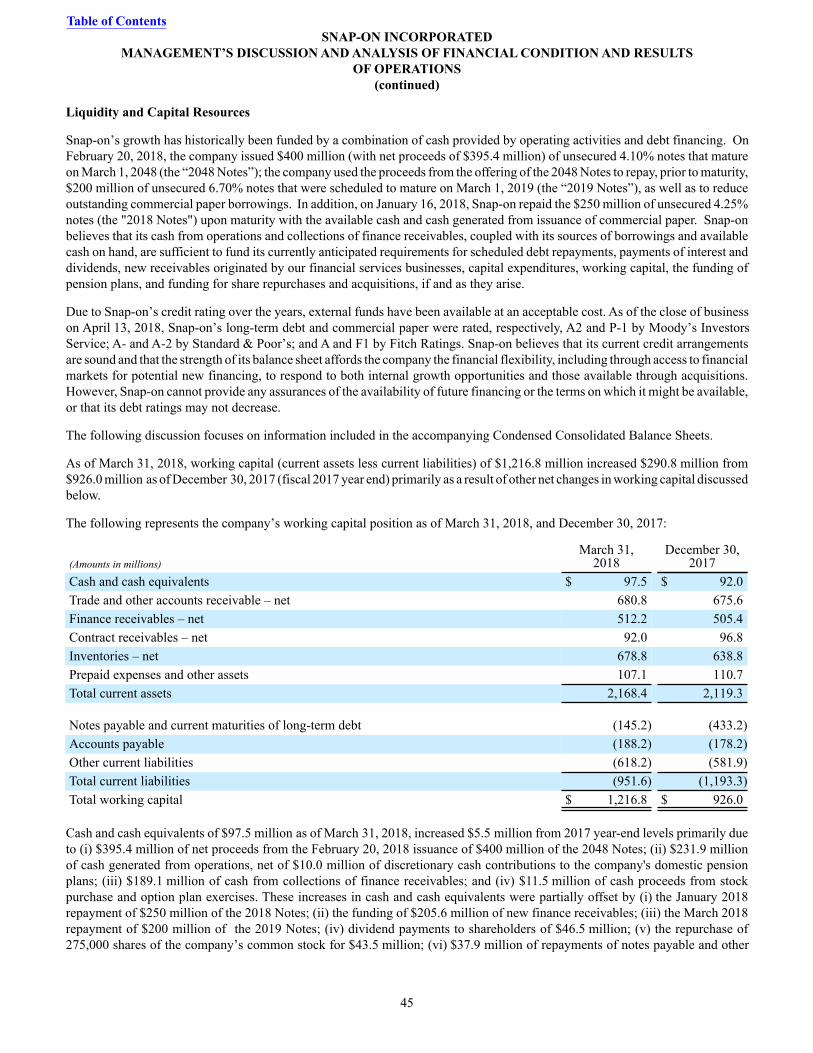
Liquidity and Capital Resources
Snap-on’s growth has historically been funded by a combination of cash provided by operating activities and debt financing. OnFebruary 20, 2018, the company issued $400 million (with net proceeds of $395.4 million) of unsecured 4.10% notes that matureon March 1, 2048 (the “2048 Notes”); the company used the proceeds from the offering of the 2048 Notes to repay, prior to maturity,$200 million of unsecured 6.70% notes that were scheduled to mature on March 1, 2019 (the “2019 Notes”), as well as to reduceoutstanding commercial paper borrowings. In addition, on January 16, 2018, Snap-on repaid the $250 million of unsecured 4.25%notes (the "2018 Notes") upon maturity with the available cash and cash generated from issuance of commercial paper. Snap-onbelieves that its cash from operations and collections of finance receivables, coupled with its sources of borrowings and availablecash on hand, are sufficient to fund its currently anticipated requirements for scheduled debt repayments, payments of interest anddividends, new receivables originated by our financial services businesses, capital expenditures, working capital, the funding ofpension plans, and funding for share repurchases and acquisitions, if and as they arise.
Due to Snap-on’s credit rating over the years, external funds have been available at an acceptable cost. As of the close of businesson April 13, 2018, Snap-on’s long-term debt and commercial paper were rated, respectively, A2 and P-1 by Moody’s InvestorsService; A- and A-2 by Standard & Poor’s; and A and F1 by Fitch Ratings. Snap-on believes that its current credit arrangementsare sound and that the strength of its balance sheet affords the company the financial flexibility, including through access to financialmarkets for potential new financing, to respond to both internal growth opportunities and those available through acquisitions.However, Snap-on cannot provide any assurances of the availability of future financing or the terms on which it might be available,or that its debt ratings may not decrease.
The following discussion focuses on information included in the accompanying Condensed Consolidated Balance Sheets.
As of March 31, 2018, working capital (current assets less current liabilities) of $1,216.8 million increased $290.8 million from$926.0 million as of December 30, 2017 (fiscal 2017 year end) primarily as a result of other net changes in working capital discussedbelow.
The following represents the company’s working capital position as of March 31, 2018, and December 30, 2017:
(Amounts in millions)March 31,
2018December 30,
2017Cash and cash equivalents $ 97.5 $ 92.0Trade and other accounts receivable – net 680.8 675.6Finance receivables – net 512.2 505.4Contract receivables – net 92.0 96.8Inventories – net 678.8 638.8Prepaid expenses and other assets 107.1 110.7Total current assets 2,168.4 2,119.3
Notes payable and current maturities of long-term debt (145.2) (433.2)Accounts payable (188.2) (178.2)Other current liabilities (618.2) (581.9)Total current liabilities (951.6) (1,193.3)Total working capital $ 1,216.8 $ 926.0
Cash and cash equivalents of $97.5 million as of March 31, 2018, increased $5.5 million from 2017 year-end levels primarily dueto (i) $395.4 million of net proceeds from the February 20, 2018 issuance of $400 million of the 2048 Notes; (ii) $231.9 millionof cash generated from operations, net of $10.0 million of discretionary cash contributions to the company's domestic pensionplans; (iii) $189.1 million of cash from collections of finance receivables; and (iv) $11.5 million of cash proceeds from stockpurchase and option plan exercises. These increases in cash and cash equivalents were partially offset by (i) the January 2018repayment of $250 million of the 2018 Notes; (ii) the funding of $205.6 million of new finance receivables; (iii) the March 2018repayment of $200 million of the 2019 Notes; (iv) dividend payments to shareholders of $46.5 million; (v) the repurchase of275,000 shares of the company’s common stock for $43.5 million; (vi) $37.9 million of repayments of notes payable and other
Table of ContentsSNAP-ON INCORPORATED
MANAGEMENT’S DISCUSSION AND ANALYSIS OF FINANCIAL CONDITION AND RESULTSOF OPERATIONS
(continued)
45
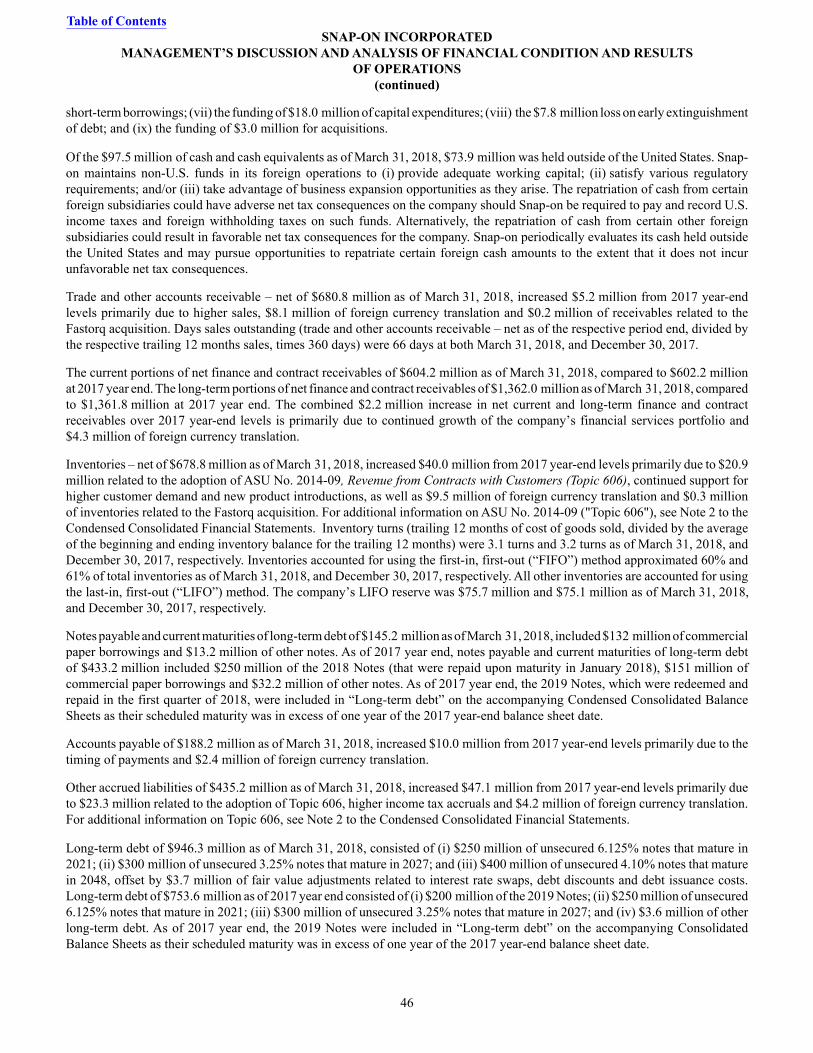
short-term borrowings; (vii) the funding of $18.0 million of capital expenditures; (viii) the $7.8 million loss on early extinguishmentof debt; and (ix) the funding of $3.0 million for acquisitions. Of the $97.5 million of cash and cash equivalents as of March 31, 2018, $73.9 million was held outside of the United States. Snap-on maintains non-U.S. funds in its foreign operations to (i) provide adequate working capital; (ii) satisfy various regulatoryrequirements; and/or (iii) take advantage of business expansion opportunities as they arise. The repatriation of cash from certainforeign subsidiaries could have adverse net tax consequences on the company should Snap-on be required to pay and record U.S.income taxes and foreign withholding taxes on such funds. Alternatively, the repatriation of cash from certain other foreignsubsidiaries could result in favorable net tax consequences for the company. Snap-on periodically evaluates its cash held outsidethe United States and may pursue opportunities to repatriate certain foreign cash amounts to the extent that it does not incurunfavorable net tax consequences.
Trade and other accounts receivable – net of $680.8 million as of March 31, 2018, increased $5.2 million from 2017 year-endlevels primarily due to higher sales, $8.1 million of foreign currency translation and $0.2 million of receivables related to theFastorq acquisition. Days sales outstanding (trade and other accounts receivable – net as of the respective period end, divided bythe respective trailing 12 months sales, times 360 days) were 66 days at both March 31, 2018, and December 30, 2017.
The current portions of net finance and contract receivables of $604.2 million as of March 31, 2018, compared to $602.2 millionat 2017 year end. The long-term portions of net finance and contract receivables of $1,362.0 million as of March 31, 2018, comparedto $1,361.8 million at 2017 year end. The combined $2.2 million increase in net current and long-term finance and contractreceivables over 2017 year-end levels is primarily due to continued growth of the company’s financial services portfolio and$4.3 million of foreign currency translation.
Inventories – net of $678.8 million as of March 31, 2018, increased $40.0 million from 2017 year-end levels primarily due to $20.9million related to the adoption of ASU No. 2014-09, Revenue from Contracts with Customers (Topic 606), continued support forhigher customer demand and new product introductions, as well as $9.5 million of foreign currency translation and $0.3 millionof inventories related to the Fastorq acquisition. For additional information on ASU No. 2014-09 ("Topic 606"), see Note 2 to theCondensed Consolidated Financial Statements. Inventory turns (trailing 12 months of cost of goods sold, divided by the averageof the beginning and ending inventory balance for the trailing 12 months) were 3.1 turns and 3.2 turns as of March 31, 2018, andDecember 30, 2017, respectively. Inventories accounted for using the first-in, first-out (“FIFO”) method approximated 60% and61% of total inventories as of March 31, 2018, and December 30, 2017, respectively. All other inventories are accounted for usingthe last-in, first-out (“LIFO”) method. The company’s LIFO reserve was $75.7 million and $75.1 million as of March 31, 2018,and December 30, 2017, respectively.
Notes payable and current maturities of long-term debt of $145.2 million as of March 31, 2018, included $132 million of commercialpaper borrowings and $13.2 million of other notes. As of 2017 year end, notes payable and current maturities of long-term debtof $433.2 million included $250 million of the 2018 Notes (that were repaid upon maturity in January 2018), $151 million ofcommercial paper borrowings and $32.2 million of other notes. As of 2017 year end, the 2019 Notes, which were redeemed andrepaid in the first quarter of 2018, were included in “Long-term debt” on the accompanying Condensed Consolidated BalanceSheets as their scheduled maturity was in excess of one year of the 2017 year-end balance sheet date.
Accounts payable of $188.2 million as of March 31, 2018, increased $10.0 million from 2017 year-end levels primarily due to thetiming of payments and $2.4 million of foreign currency translation.
Other accrued liabilities of $435.2 million as of March 31, 2018, increased $47.1 million from 2017 year-end levels primarily dueto $23.3 million related to the adoption of Topic 606, higher income tax accruals and $4.2 million of foreign currency translation.For additional information on Topic 606, see Note 2 to the Condensed Consolidated Financial Statements. Long-term debt of $946.3 million as of March 31, 2018, consisted of (i) $250 million of unsecured 6.125% notes that mature in2021; (ii) $300 million of unsecured 3.25% notes that mature in 2027; and (iii) $400 million of unsecured 4.10% notes that maturein 2048, offset by $3.7 million of fair value adjustments related to interest rate swaps, debt discounts and debt issuance costs.Long-term debt of $753.6 million as of 2017 year end consisted of (i) $200 million of the 2019 Notes; (ii) $250 million of unsecured6.125% notes that mature in 2021; (iii) $300 million of unsecured 3.25% notes that mature in 2027; and (iv) $3.6 million of otherlong-term debt. As of 2017 year end, the 2019 Notes were included in “Long-term debt” on the accompanying ConsolidatedBalance Sheets as their scheduled maturity was in excess of one year of the 2017 year-end balance sheet date.
Table of ContentsSNAP-ON INCORPORATED
MANAGEMENT’S DISCUSSION AND ANALYSIS OF FINANCIAL CONDITION AND RESULTSOF OPERATIONS
(continued)
46
Snap-on has a five-year, $700 million multi-currency revolving credit facility that terminates on December 15, 2020 (the “CreditFacility”); as of March 31, 2018, no amounts were outstanding under the Credit Facility. Borrowings under the Credit Facilitybear interest at varying rates based on Snap-on’s then-current, long-term debt ratings. The Credit Facility’s financial covenantrequires that Snap-on maintain, as of each fiscal quarter end, either (i) a ratio not greater than 0.60 to 1.00 of consolidated net debt(consolidated debt net of certain cash adjustments) to the sum of such consolidated net debt plus total equity and less accumulatedother comprehensive income or loss (the “Debt Ratio”); or (ii) a ratio not greater than 3.50 to 1.00 of such consolidated net debtto earnings before interest, taxes, depreciation, amortization and certain other adjustments for the preceding four fiscal quartersthen ended (the “Debt to EBITDA Ratio”). Snap-on may, up to two times during any five-year period during the term of the CreditFacility (including any extensions thereof), increase the maximum Debt Ratio to 0.65 to 1.00 and/or increase the maximum Debtto EBITDA Ratio to 3.75 to 1.00 for four consecutive fiscal quarters in connection with certain material acquisitions (as definedin the related credit agreement). As of March 31, 2018, the company’s actual ratios of 0.24 and 1.04, respectively, were both withinthe permitted ranges set forth in this financial covenant. Snap-on generally issues commercial paper to fund its financing needson a short-term basis and uses the Credit Facility as back-up liquidity to support such commercial paper issuances.
Snap-on’s Credit Facility and other debt agreements also contain certain usual and customary borrowing, affirmative, negativeand maintenance covenants. As of March 31, 2018, Snap-on was in compliance with all covenants of its Credit Facility and otherdebt agreements.
Snap-on believes it has sufficient available cash and access to both committed and uncommitted credit facilities to cover its expectedfunding needs on both a short-term and long-term basis. Snap-on manages its aggregate short-term borrowings so as not to exceedits availability under the revolving Credit Facility. Snap-on believes that it can access short-term debt markets, predominantlythrough commercial paper issuances and existing lines of credit, to fund its short-term requirements and to ensure near-termliquidity. Snap-on regularly monitors the credit and financial markets and may take advantage of what it believes are favorablemarket conditions to issue long-term debt to further improve its liquidity and capital resources. Near-term liquidity requirementsfor Snap-on include scheduled debt payments, payments of interest and dividends, funding to support new receivables originatedby our financial services businesses, capital expenditures, working capital, the funding of pension plans, and funding for sharerepurchases and acquisitions, if and as they arise. Snap-on intends to make contributions of $9.7 million to its foreign pensionplans and $2.4 million to its domestic pension plans in 2018, as required by law. In the first three months of 2018, Snap-on made$10.0 million of discretionary cash contributions to its domestic pension plans; depending on market and other conditions, Snap-on may make additional discretionary cash contributions to its pension plans in the balance of 2018.
Snap-on’s long-term financing strategy is to maintain continuous access to the debt markets to accommodate its liquidity needs,including the potential use of commercial paper, additional fixed-term debt and/or securitizations.
The following discussion focuses on information included in the accompanying Condensed Consolidated Statements of CashFlows.
Operating Activities
Net cash provided by operating activities was $231.9 million and $192.4 million in the first three months of 2018 and 2017,respectively. The $39.5 million year-over-year increase in net cash provided by operating activities primarily reflects an increaseof $29.0 million from net changes in operating assets and liabilities and $21.7 million of higher net earnings, partially offset by$14.9 million of cash proceeds from the settlement of a treasury lock in 2017.
Investing Activities
Net cash used by investing activities of $37.1 million in the first three months of 2018 included additions to finance receivablesof $205.6 million, partially offset by collections of $189.1 million. Net cash used by investing activities of $81.7 million in thefirst three months of 2017 included additions to finance receivables of $227.0 million, partially offset by collections of$173.8 million. Finance receivables are comprised of extended-term installment payment contracts to both technicians andindependent shop owners (i.e., franchisees’ customers) to enable them to purchase tools and diagnostic and equipment productson an extended-term payment plan, generally with average payment terms approaching four years.
Net cash used by investing activities in the first three months of 2018 also included $3.0 million for acquisitions. See Note 3 tothe Consolidated Financial Statements for information on acquisitions.
Table of ContentsSNAP-ON INCORPORATED
MANAGEMENT’S DISCUSSION AND ANALYSIS OF FINANCIAL CONDITION AND RESULTSOF OPERATIONS
(continued)
47
Capital expenditures were $18.0 million and $18.6 million in the first three months of 2018 and 2017, respectively. Capitalexpenditures in both years included continued investments related to the company’s execution of its strategic Value CreationProcesses around safety, quality, customer connection, innovation and RCI.
Financing Activities
Net cash used by financing activities of $190.5 million in the first three months of 2018 included repayments of long-term debtof $250 million of the 2018 Notes at maturity, $200 million of the 2019 Notes and a $7.8 million loss on early extinguishment ofdebt, as well as repayments of notes payable and other short-term borrowings of $37.9 million. These amounts were partially offsetby Snap-on’s sale, on February 20, 2018, of $400 million of the 2048 Notes at a discount, from which Snap-on received$395.4 million of net proceeds, reflecting $3.5 million of transaction costs. Net cash used by financing activities was $66.6 millionin the first three months of 2017.
Proceeds from stock purchase and option plan exercises totaled $11.5 million and $14.1 million in the respective first three monthsof 2018 and 2017. Snap-on has undertaken stock repurchases from time to time to offset dilution created by shares issued foremployee and franchisee stock purchase plans, stock options and other corporate purposes. In the first three months of 2018, Snap-on repurchased 275,000 shares of its common stock for $43.5 million under its previously announced share repurchase programs.In the first three months of 2017, Snap-on repurchased 210,000 shares of its common stock for $35.8 million under its previouslyannounced share repurchase programs. As of March 31, 2018, Snap-on had remaining availability to repurchase up to an additional$372.8 million in common stock pursuant to its Board of Directors’ (“Board”) authorizations. The purchase of Snap-on commonstock is at the company’s discretion, subject to prevailing financial and market conditions. Snap-on believes that its cash generatedfrom operations, available cash on hand, and funds available from its credit facilities, will be sufficient to fund the company’sadditional share repurchases, if any, in the balance of 2018.
Snap-on has paid consecutive quarterly cash dividends, without interruption or reduction, since 1939. Cash dividends totaled $46.5million and $41.2 million in the first three months of 2018 and 2017, respectively. On November 6, 2017, the Board increased thequarterly cash dividend by 15.5% to $0.82 per share ($3.28 per share annualized). Snap-on believes that its cash generated fromoperations, available cash on hand, and funds available from its credit facilities, will be sufficient to pay dividends in the balanceof 2018.
Off-Balance Sheet Arrangements
The company had no off-balance sheet arrangements as of March 31, 2018.
Critical Accounting Policies and Estimates
Snap-on’s disclosures of its critical accounting policies, which are contained in its Annual Report on Form 10-K for the fiscal yearended December 30, 2017, have not materially changed since that report was filed.
Outlook
Snap-on expects to make continued progress in 2018 along its defined runways for coherent growth, leveraging capabilities alreadydemonstrated in the automotive repair arena and developing and expanding its professional customer base, not only in automotiverepair, but in adjacent markets, additional geographies and other areas, including extending in critical industries, where the costand penalties for failure can be high. In pursuit of these initiatives, Snap-on expects that capital expenditures in 2018 will be in arange of $90 million to $100 million, of which $18.0 million was expended in the first three months. Snap-on also anticipates thatits full year 2018 effective income tax rate will be in the range of 24% to 25%. This compares to its 2017 full year rate of 31.1%.
Table of ContentsSNAP-ON INCORPORATED
MANAGEMENT’S DISCUSSION AND ANALYSIS OF FINANCIAL CONDITION AND RESULTSOF OPERATIONS
(continued)
48
Item 3: Quantitative and Qualitative Disclosures About Market Risk
Market, Credit and Economic Risks
Market risk is the potential economic loss that may result from adverse changes in the fair value of financial instruments. Snap-on is exposed to market risk from changes in interest rates and foreign currency exchange rates. Snap-on is also exposed to marketrisk associated with the stock-based portion of its deferred compensation plans. Snap-on monitors its exposure to these risks andattempts to manage the underlying economic exposures through the use of financial instruments such as foreign currency forwardcontracts, interest rate swap agreements, treasury lock agreements and prepaid equity forward agreements (“equity forwards”).Snap-on does not use derivative instruments for speculative or trading purposes. Snap-on’s broad-based business activities helpto reduce the impact that volatility in any particular area or related areas may have on its operating earnings as a whole. Snap-on’smanagement takes an active role in the risk management process and has developed policies and procedures that require specificadministrative and business functions to assist in the identification, assessment and control of various risks.
Foreign Currency Risk Management
Snap-on has significant international operations and is subject to certain risks inherent with foreign operations that include currencyfluctuations. Foreign currency exchange risk exists to the extent that Snap-on has payment obligations or receipts denominated incurrencies other than the functional currency, including intercompany loans denominated in foreign currencies. To manage theseexposures, Snap-on identifies naturally offsetting positions and then purchases hedging instruments to protect the residual netexposures. See Note 9 to the Condensed Consolidated Financial Statements for information on foreign currency risk management.
Interest Rate Risk Management
Snap-on aims to control funding costs by managing the exposure created by the differing maturities and interest rate structures ofSnap-on’s borrowings through the use of interest rate swap agreements. Treasury lock agreements are used from time to time tomanage the potential change in interest rates in anticipation of the possible issuance of fixed rate debt. See Note 9 to the CondensedConsolidated Financial Statements for information on interest rate risk management.
Snap-on utilizes a Value-at-Risk (“VAR”) model to determine the potential one-day loss in the fair value of its interest rate andforeign exchange-sensitive financial instruments from adverse changes in market factors. The VAR model estimates were madeassuming normal market conditions and a 95% confidence level. Snap-on’s computations are based on the inter-relationshipsamong movements in various currencies and interest rates (variance/co-variance technique). These inter-relationships weredetermined by observing interest rate and foreign currency market changes over the preceding quarter.
The estimated maximum potential one-day loss in fair value, calculated using the VAR model, as of March 31, 2018, was $8.0 millionon interest rate-sensitive financial instruments and $0.1 million on foreign currency-sensitive financial instruments. The VARmodel is a risk management tool and does not purport to represent actual losses in fair value that will be incurred by Snap-on, nordoes it consider the potential effect of favorable changes in market factors.
Stock-based Deferred Compensation Risk Management
Snap-on aims to manage market risk associated with the stock-based portion of its deferred compensation plans through the useof equity forwards. Equity forwards are used to aid in offsetting the potential mark-to-market effect on stock-based deferredcompensation from changes in Snap-on’s stock price. Since stock-based deferred compensation liabilities increase as the company’sstock price rises and decrease as the company’s stock price declines, the equity forwards are intended to mitigate the potentialimpact on compensation expense that may result from such mark-to-market changes. See Note 9 to the Condensed ConsolidatedFinancial Statements for additional information on stock-based deferred compensation risk management.
Credit Risk
Credit risk is the possibility of loss from a customer’s failure to make payments according to contract terms. Prior to extendingcredit, each customer is evaluated, taking into consideration various factors, including the customer’s financial condition, debt-servicing ability, past payment experience, credit bureau information, and other financial and qualitative factors that may affectthe customer’s ability to repay, as well as the value of the underlying collateral. Credit risk is also monitored regularly through theuse of internal proprietary custom scoring models to evaluate each transaction at the time of the application for credit and byperiodically updating those credit scores for ongoing monitoring purposes. Snap-on evaluates credit quality through the use of aninternal proprietary measuring system that provides a framework to analyze finance and contract receivables on the basis of riskfactors of the individual obligor as well as transaction specific risk. The finance and contract receivables are typically monitored
Table of Contents
49
through an asset quality review process that closely monitors past due accounts and initiates a progressive collection action processwhen appropriate.
Counterparty Risk
Snap-on is exposed to credit losses in the event of non-performance by the counterparties to its various financial agreements,including its foreign currency forward contracts, interest rate swap agreements, treasury lock agreements and prepaid equity forwardagreements. Snap-on does not obtain collateral or other security to support financial instruments subject to credit risk, but monitorsthe credit standing of the counterparties and generally enters into agreements with financial institution counterparties with a creditrating of A- or better. Snap-on does not anticipate non-performance by its counterparties, but cannot provide assurances.
Economic Risk
Economic risk is the possibility of loss resulting from economic instability in certain areas of the world. Snap-on continuallymonitors its exposure in these markets; for example, the company is monitoring the potential effects of the United Kingdom’spending exit from the European Union, although it is too soon to know what effects this might have on the world economy or thecompany. Inflation has not had a significant impact on the company.
As a result of the above market, credit and economic risks, net earnings and revenues in any particular period may not berepresentative of full-year results and may vary significantly from year to year.
Item 4: Controls and Procedures
Evaluation of Disclosure Controls and Procedures
Snap-on maintains a system of disclosure controls and procedures that is designed to provide reasonable assurance that materialinformation relating to the company and its consolidated subsidiaries is timely communicated to the officers who certify Snap-on’s financial reports and to other members of senior management and the Board, as appropriate.
In accordance with Rule 13a-15(b) of the Securities Exchange Act of 1934 (the “Exchange Act”), the company’s managementevaluated, with the participation of the Chief Executive Officer and Chief Financial Officer, the effectiveness of the design andoperation of the company’s disclosure controls and procedures (as defined in Rules 13a-15(e) and 15d-15(e) under the ExchangeAct) as of March 31, 2018. Based upon their evaluation of these disclosure controls and procedures, the Chief Executive Officerand Chief Financial Officer concluded that the disclosure controls and procedures were effective as of March 31, 2018, to ensurethat information required to be disclosed by the company in the reports it files or submits under the Exchange Act is recorded,processed, summarized and reported, within the time period specified in the Securities and Exchange Commission rules and forms,and to ensure that information required to be disclosed by the company in the reports it files or submits under the Exchange Actis accumulated and communicated to the company’s management, including its principal executive and principal financial officers,or persons performing similar functions, as appropriate, to allow timely decisions regarding required disclosure.
Changes in Internal Control
There has not been any change in the company’s internal control over financial reporting during the quarter ended March 31, 2018,that has materially affected, or is reasonably likely to materially affect, the company’s internal control over financial reporting (assuch term is defined in Exchange Act Rules 13a-15(f) and 15d-15(f)).
PART II. OTHER INFORMATION
Table of Contents
50
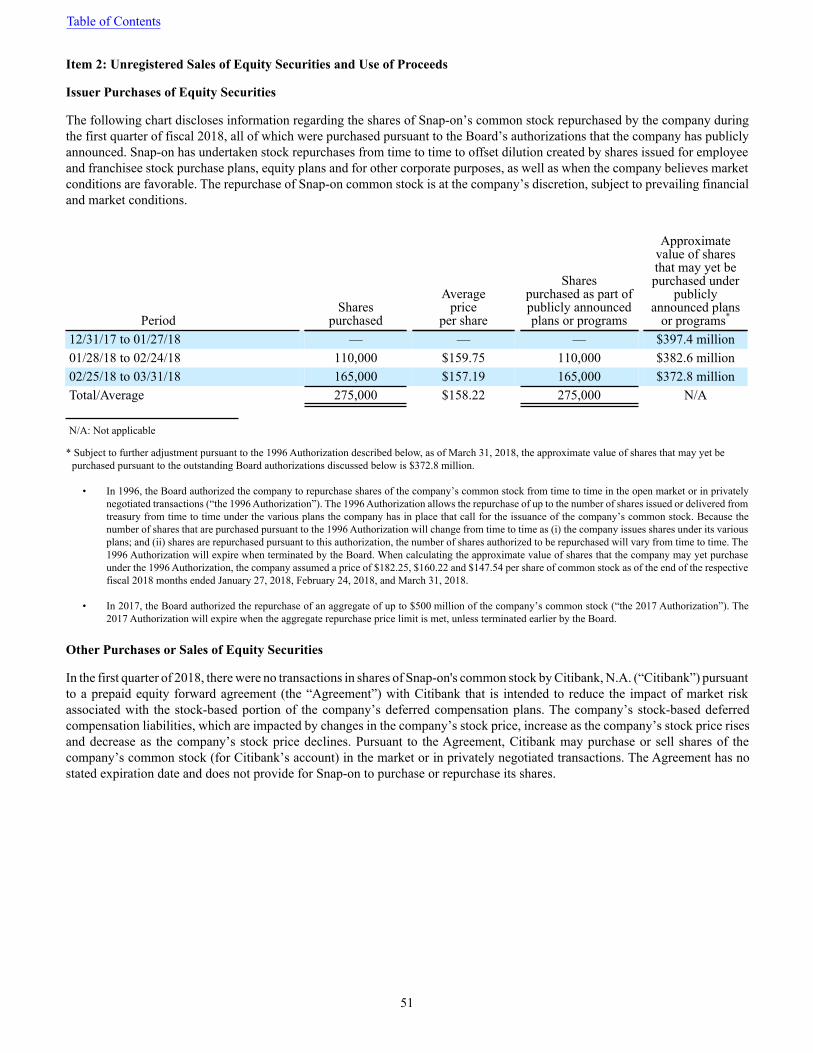
Item 2: Unregistered Sales of Equity Securities and Use of Proceeds
Issuer Purchases of Equity Securities
The following chart discloses information regarding the shares of Snap-on’s common stock repurchased by the company duringthe first quarter of fiscal 2018, all of which were purchased pursuant to the Board’s authorizations that the company has publiclyannounced. Snap-on has undertaken stock repurchases from time to time to offset dilution created by shares issued for employeeand franchisee stock purchase plans, equity plans and for other corporate purposes, as well as when the company believes marketconditions are favorable. The repurchase of Snap-on common stock is at the company’s discretion, subject to prevailing financialand market conditions.
PeriodShares
purchased
Averageprice
per share
Sharespurchased as part ofpublicly announcedplans or programs
Approximatevalue of sharesthat may yet bepurchased under
publiclyannounced plans
or programs*
12/31/17 to 01/27/18 — — — $397.4 million01/28/18 to 02/24/18 110,000 $159.75 110,000 $382.6 million02/25/18 to 03/31/18 165,000 $157.19 165,000 $372.8 millionTotal/Average 275,000 $158.22 275,000 N/A
N/A: Not applicable
* Subject to further adjustment pursuant to the 1996 Authorization described below, as of March 31, 2018, the approximate value of shares that may yet be purchased pursuant to the outstanding Board authorizations discussed below is $372.8 million.
• In 1996, the Board authorized the company to repurchase shares of the company’s common stock from time to time in the open market or in privatelynegotiated transactions (“the 1996 Authorization”). The 1996 Authorization allows the repurchase of up to the number of shares issued or delivered fromtreasury from time to time under the various plans the company has in place that call for the issuance of the company’s common stock. Because thenumber of shares that are purchased pursuant to the 1996 Authorization will change from time to time as (i) the company issues shares under its variousplans; and (ii) shares are repurchased pursuant to this authorization, the number of shares authorized to be repurchased will vary from time to time. The1996 Authorization will expire when terminated by the Board. When calculating the approximate value of shares that the company may yet purchaseunder the 1996 Authorization, the company assumed a price of $182.25, $160.22 and $147.54 per share of common stock as of the end of the respectivefiscal 2018 months ended January 27, 2018, February 24, 2018, and March 31, 2018.
• In 2017, the Board authorized the repurchase of an aggregate of up to $500 million of the company’s common stock (“the 2017 Authorization”). The2017 Authorization will expire when the aggregate repurchase price limit is met, unless terminated earlier by the Board.
Other Purchases or Sales of Equity Securities
In the first quarter of 2018, there were no transactions in shares of Snap-on's common stock by Citibank, N.A. (“Citibank”) pursuantto a prepaid equity forward agreement (the “Agreement”) with Citibank that is intended to reduce the impact of market riskassociated with the stock-based portion of the company’s deferred compensation plans. The company’s stock-based deferredcompensation liabilities, which are impacted by changes in the company’s stock price, increase as the company’s stock price risesand decrease as the company’s stock price declines. Pursuant to the Agreement, Citibank may purchase or sell shares of thecompany’s common stock (for Citibank’s account) in the market or in privately negotiated transactions. The Agreement has nostated expiration date and does not provide for Snap-on to purchase or repurchase its shares.
Table of Contents
51
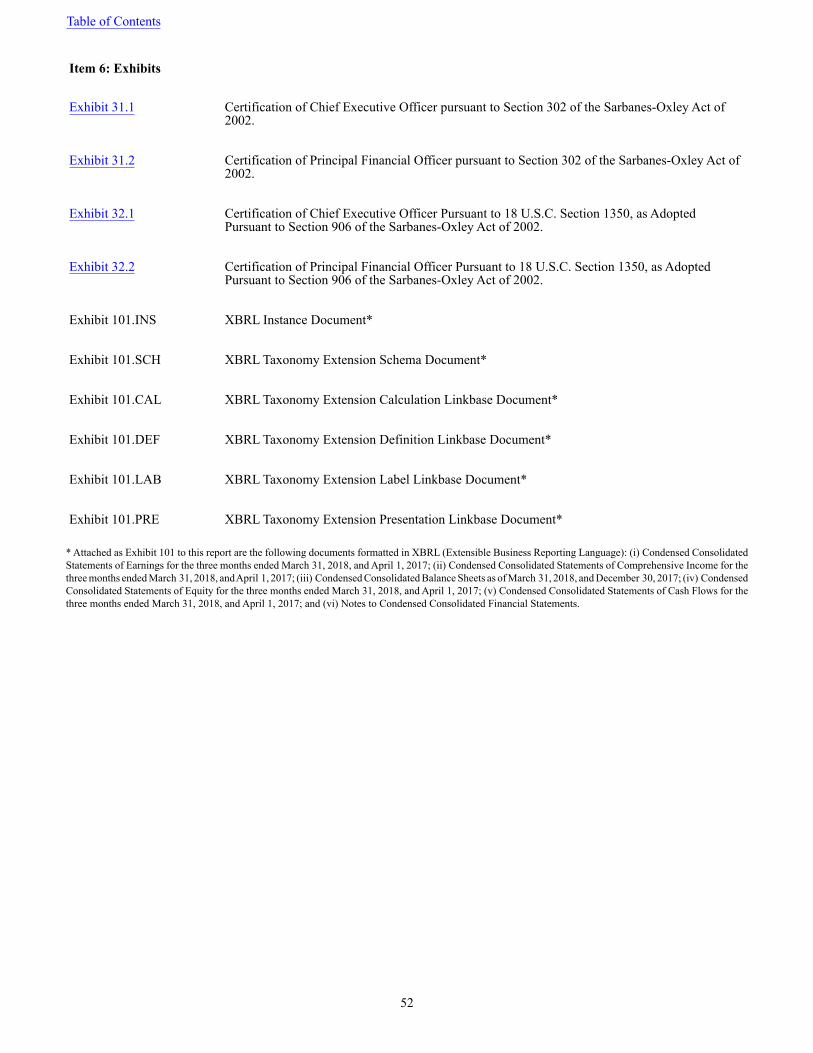
Item 6: Exhibits
Exhibit 31.1 Certification of Chief Executive Officer pursuant to Section 302 of the Sarbanes-Oxley Act of2002.
Exhibit 31.2 Certification of Principal Financial Officer pursuant to Section 302 of the Sarbanes-Oxley Act of2002.
Exhibit 32.1 Certification of Chief Executive Officer Pursuant to 18 U.S.C. Section 1350, as AdoptedPursuant to Section 906 of the Sarbanes-Oxley Act of 2002.
Exhibit 32.2 Certification of Principal Financial Officer Pursuant to 18 U.S.C. Section 1350, as AdoptedPursuant to Section 906 of the Sarbanes-Oxley Act of 2002.
Exhibit 101.INS XBRL Instance Document*
Exhibit 101.SCH XBRL Taxonomy Extension Schema Document*
Exhibit 101.CAL XBRL Taxonomy Extension Calculation Linkbase Document*
Exhibit 101.DEF XBRL Taxonomy Extension Definition Linkbase Document*
Exhibit 101.LAB XBRL Taxonomy Extension Label Linkbase Document*
Exhibit 101.PRE XBRL Taxonomy Extension Presentation Linkbase Document*
* Attached as Exhibit 101 to this report are the following documents formatted in XBRL (Extensible Business Reporting Language): (i) Condensed ConsolidatedStatements of Earnings for the three months ended March 31, 2018, and April 1, 2017; (ii) Condensed Consolidated Statements of Comprehensive Income for thethree months ended March 31, 2018, and April 1, 2017; (iii) Condensed Consolidated Balance Sheets as of March 31, 2018, and December 30, 2017; (iv) CondensedConsolidated Statements of Equity for the three months ended March 31, 2018, and April 1, 2017; (v) Condensed Consolidated Statements of Cash Flows for thethree months ended March 31, 2018, and April 1, 2017; and (vi) Notes to Condensed Consolidated Financial Statements.
Table of Contents
52
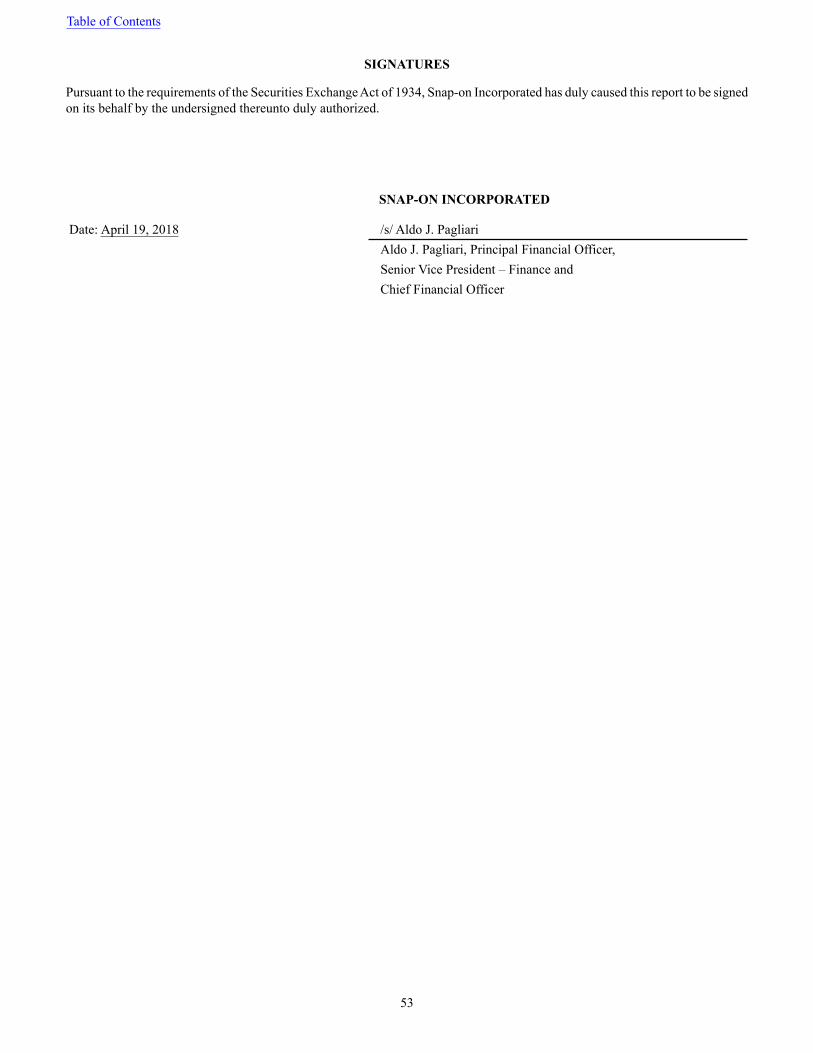
SIGNATURES
Pursuant to the requirements of the Securities Exchange Act of 1934, Snap-on Incorporated has duly caused this report to be signedon its behalf by the undersigned thereunto duly authorized.
SNAP-ON INCORPORATED
Date: April 19, 2018 /s/ Aldo J. PagliariAldo J. Pagliari, Principal Financial Officer,Senior Vice President – Finance andChief Financial Officer
Table of Contents
53

EXHIBIT 31.1
Certification of the Chief Executive Officer Pursuant toSection 302 of the Sarbanes-Oxley Act of 2002
I, Nicholas T. Pinchuk, certify that:
1. I have reviewed this quarterly report on Form 10-Q of Snap-on Incorporated;
2. Based on my knowledge, this report does not contain any untrue statement of a material fact or omit to state a material fact necessary to make the statements made, in light of the circumstances under which such statements were made, not misleading with respect to the period covered by this report;
3. Based on my knowledge, the financial statements, and other financial information included in this report, fairly present in all material respects the financial condition, results of operations and cash flows of the registrant as of, and for, the periods presented in this report;
4. The registrant’s other certifying officer and I are responsible for establishing and maintaining disclosure controls and procedures (as defined in Exchange Act Rules 13a-15(e) and 15d-15(e)) and internal control over financial reporting (as defined in Exchange Act Rules 13a-15(f) and 15d-15(f)) for the registrant and have:
a) Designed such disclosure controls and procedures, or caused such disclosure controls and procedures to be designed under our supervision, to ensure that material information relating to the registrant, including its consolidated subsidiaries, is made known to us by others within those entities, particularly during the period in which this report is being prepared;
b) Designed such internal control over financial reporting, or caused such internal control over financial reporting to be designed under our supervision, to provide reasonable assurance regarding the reliability of financial reporting and the preparation of financial statements for external purposes in accordance with generally accepted accounting principles;
c) Evaluated the effectiveness of the registrant’s disclosure controls and procedures and presented in this report our conclusions about the effectiveness of the disclosure controls and procedures, as of the end of the period covered by this report based on such evaluation; and
d) Disclosed in this report any change in the registrant’s internal control over financial reporting that occurred during the registrant’s most recent fiscal quarter (the registrant’s fourth fiscal quarter in the case of an annual report) that has materially affected, or is reasonably likely to materially affect, the registrant’s internal control over financial reporting; and
5. The registrant’s other certifying officer and I have disclosed, based on our most recent evaluation of internal control over financial reporting, to the registrant’s auditors and the audit committee of the registrant’s board of directors (or persons performing the equivalent functions):
a) All significant deficiencies and material weaknesses in the design or operation of internal control over financial reporting which are reasonably likely to adversely affect the registrant’s ability to record, process, summarize and report financial information; and
b) Any fraud, whether or not material, that involves management or other employees who have a significant role in the registrant’s internal control over financial reporting.
Date: April 19, 2018
/s/ Nicholas T. PinchukNicholas T. PinchukChief Executive Officer
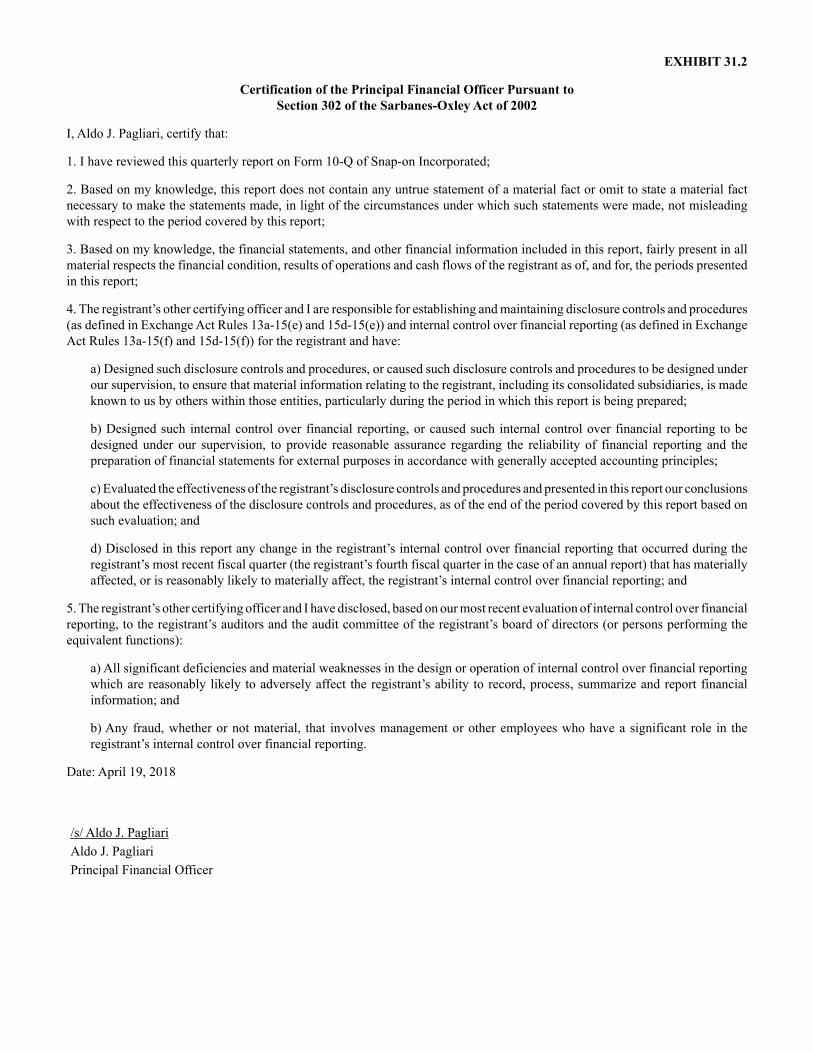
EXHIBIT 31.2
Certification of the Principal Financial Officer Pursuant toSection 302 of the Sarbanes-Oxley Act of 2002
I, Aldo J. Pagliari, certify that:
1. I have reviewed this quarterly report on Form 10-Q of Snap-on Incorporated;
2. Based on my knowledge, this report does not contain any untrue statement of a material fact or omit to state a material fact necessary to make the statements made, in light of the circumstances under which such statements were made, not misleading with respect to the period covered by this report;
3. Based on my knowledge, the financial statements, and other financial information included in this report, fairly present in all material respects the financial condition, results of operations and cash flows of the registrant as of, and for, the periods presented in this report;
4. The registrant’s other certifying officer and I are responsible for establishing and maintaining disclosure controls and procedures (as defined in Exchange Act Rules 13a-15(e) and 15d-15(e)) and internal control over financial reporting (as defined in Exchange Act Rules 13a-15(f) and 15d-15(f)) for the registrant and have:
a) Designed such disclosure controls and procedures, or caused such disclosure controls and procedures to be designed under our supervision, to ensure that material information relating to the registrant, including its consolidated subsidiaries, is made known to us by others within those entities, particularly during the period in which this report is being prepared;
b) Designed such internal control over financial reporting, or caused such internal control over financial reporting to be designed under our supervision, to provide reasonable assurance regarding the reliability of financial reporting and the preparation of financial statements for external purposes in accordance with generally accepted accounting principles;
c) Evaluated the effectiveness of the registrant’s disclosure controls and procedures and presented in this report our conclusions about the effectiveness of the disclosure controls and procedures, as of the end of the period covered by this report based on such evaluation; and
d) Disclosed in this report any change in the registrant’s internal control over financial reporting that occurred during the registrant’s most recent fiscal quarter (the registrant’s fourth fiscal quarter in the case of an annual report) that has materially affected, or is reasonably likely to materially affect, the registrant’s internal control over financial reporting; and
5. The registrant’s other certifying officer and I have disclosed, based on our most recent evaluation of internal control over financial reporting, to the registrant’s auditors and the audit committee of the registrant’s board of directors (or persons performing the equivalent functions):
a) All significant deficiencies and material weaknesses in the design or operation of internal control over financial reporting which are reasonably likely to adversely affect the registrant’s ability to record, process, summarize and report financial information; and
b) Any fraud, whether or not material, that involves management or other employees who have a significant role in the registrant’s internal control over financial reporting.
Date: April 19, 2018
/s/ Aldo J. PagliariAldo J. PagliariPrincipal Financial Officer

EXHIBIT 32.1
Certification of Chief Executive OfficerPursuant to 18 U.S.C. Section 1350,
As Adopted Pursuant toSection 906 of the Sarbanes-Oxley Act of 2002
In connection with the Quarterly Report of Snap-on Incorporated (the “Company”) on Form 10-Q for the period ended March 31, 2018, as filed with the Securities and Exchange Commission on the date hereof (the “Report”), Nicholas T. Pinchuk as Chief Executive Officer of the Company, hereby certifies, pursuant to 18 U.S.C. § 1350, as adopted pursuant to § 906 of the Sarbanes-Oxley Act of 2002, to the best of his knowledge, that:
(1) The Report fully complies with the requirements of section 13(a) or 15(d) of the Securities Exchange Act of 1934; and
(2) The information contained in the Report fairly presents, in all material respects, the financial condition and results of operations of the Company.
/s/ Nicholas T. PinchukNicholas T. PinchukChief Executive OfficerApril 19, 2018
EXHIBIT 32.2
Certification of Principal Financial OfficerPursuant to 18 U.S.C. Section 1350,
As Adopted Pursuant toSection 906 of the Sarbanes-Oxley Act of 2002
In connection with the Quarterly Report of Snap-on Incorporated (the “Company”) on Form 10-Q for the period ended March 31, 2018, as filed with the Securities and Exchange Commission on the date hereof (the “Report”), Aldo J. Pagliari as Principal Financial Officer of the Company, hereby certifies, pursuant to 18 U.S.C. § 1350, as adopted pursuant to § 906 of the Sarbanes-Oxley Act of 2002, to the best of his knowledge, that:
(1) The Report fully complies with the requirements of section 13(a) or 15(d) of the Securities Exchange Act of 1934; and
(2) The information contained in the Report fairly presents, in all material respects, the financial condition and results of operations of the Company.
/s/ Aldo J. PagliariAldo J. PagliariPrincipal Financial OfficerApril 19, 2018