Embed Size (px)
Citation preview

Report of CEBE 2008‐2010
1
Report of CEBE activities during 2008 ‐ 2010 CEBE ‐ Centre of Integrated Electronic Systems and Biomedical Engineering Tallinn University of Technology Partners: Department of Computer Engineering, Department of Electronics Technomedicum. Head: Prof. Raimund Ubar [email protected] Address: Raja 15, 12618 Tallinn, Estonia http://cebe.ttu.ee
Table of contents 1. Introduction 1 2. Statistical data about the research activities in CEBE 3 3. Overview of the cooperation projects 8 4. P1. Application Specific Processors for Signal Processing in Biomedicine 10 5. P2. Verification, test generation and fault diagnosis 12 6. P3. Total Peripheral Resistance 15 7. P4. Evaluation of mental disorders using EEG analyser 20 8. P5. Reliable and disturbance free monitoring of dialysis 23 9. P6. Testing of complex electronic systems 28 10. P7. Semiconductor devices 33
1. Introduction In the Faculty of Information Technology at Tallinn University of Technology a Centre of Integrated Electronic Systems and Biomedical Engineering (CEBE) was established in 2008 (cebe.ttu.ee). It is one of the seven Estonian centres of research excellence, and is supported by EU structural funds. It consists of the research teams of the Department of Computer Engineering, Department of Electronics and Technomedicum.
CEBE is an extension of the long term cooperation between the research teams. A new modern Embedded Systems and Components research environment was recently jointly established in the frame of the infrastructure development project SARS (EU23626). It consists of three baselabs: Communicative Electronics (SIE), Micro‐ and Nanoelectronic Components (MINAKO), and Synthesis and Analysis of Embedded Systems (ASSA) as a ground for research activities in CEBE. The partners of CEBE are also the founding members in the Competence Centre in Electronics, Info‐ and Communication Technologies (ELIKO, EU22640), which was established with the main goal to develop innovative technologies and

Report of CEBE 2008‐2010
2
products, based on intelligent embedded systems, through strategic co‐operation between the science and industry sectors.
The mission of CEBE is to carry out fundamental and strategic interdisciplinary R&D in the fields of electronic components, systems, computer and biomedical engineering by a collaborating consortium with applications in medicine, semiconductor and information technologies. New methods and tools are developed for design, verification, test and debugging of mission critical and dependable embedded systems, based on nanoelectronics and sensor networks. The cooperation network of the partners of CEBE with highlighted main research topics is depicted in Fig.1.
Bioengineering applications
health monitoring systems, body area sensor networks, implantable cardiac
pacemakers
Biosignal interpretation
methods
Signal processing
theory, methods and algorithms
System Design synthesis, simulation, verification, emulation
Hardware architectures, ASP, FPGA
ASIC, SOC, NOC
Mission critical embedded systems and sensorics
Patient centric healthcare
Data acquisition bioimpedance, biosignals,
brain electrical oscillations,
biooptical methods Test research test synthesis and analysis, debug and
fault diagnosis, fault‐tolerance, dependability
Fig.1. Cooperation network in CEBE
In a close cooperation between partners, new signal processing methods and new architectures for dependable signal processing are being developed to be applied for analysing different biosignals in order to improve the existing and to develop new non‐invasive methods within medical technology. The main research topics in biomedical engineering are: brain research, diagnostics of cardiovascular diseases, sudden cardiac death prediction, and bio‐optical monitoring. This research is coupled with applications in health monitoring systems, body area sensor networks and implantable cardiac pacemakers. An active scientific work is directed to understand and affect the processes in the brain, to monitor blood pressure and cardiovascular diseases, to study potentially dangerous myocardial arrhythmogenic behaviour, and to monitor end stage renal disease patient treatment quality. The EEG/ERP/EP analysis, linear (spectral, correlation, etc) and nonlinear (entropy, length distribution of low variability periods, etc) and ICA signal processing methods are utilised. Theoretical models are used for planning of experiments and interpretation of the results.
The described research and applications in bio‐ and medical technology are closely tied with research in electronics technology and computer hardware design and test where new methods for signal and data acquisition, signal processing algorithms, reconfigurable processor architectures, and applications of impedance spectroscopy are being developed. New reduced complexity methods for processing of

Report of CEBE 2008‐2010
3
sensor signals using non uniform synchronous sampling in time and space domains allows to minimize computational power, energy consumption and electronic circuitry.
The research objectives are also metal‐semiconductor and metal‐biomaterial interfaces for developing of structures for semiconductor devices and electrodes for lab‐on‐chip devices. The results are implemented in power conversion devices, microfluidic laboratories and bioreactors.
Reliability of biotechnology is crucial, because the biomedical devices must operate without human supervision and control (indoor and outdoor environments, on the skin and under the skin) during several years without interrupting. Test, diagnosis, Built‐in Self‐Test (BIST), error handling and repair for digital systems are the key functions to be developed, far beyond the capabilities of today’s solutions. The roadmap ITRS reflects these tendencies and labels built‐in test and repair for logic a must in coming years, with no solutions known yet. The long‐term answer to these problems will be crucial to the competitiveness of European industries at‐large. ITRS estimates that 70% of the design cycle is spent on test and verification and predicts that this share will increase. Enhancing productivity and reliability of the system verification flow is thus a key competitive aspect, both in terms of time‐ to‐market and end‐product quality. New high‐level and hierarchical approaches for verification and test are needed to cope with growing complexity and high quality requirements of modern ES.
The main objectives of the research in CEBE in design and test of embedded digital systems include modeling and synthesis, verification and debug, test generation and fault simulation, self‐test, diagnosis, and fault tolerance. The primary objective is to find suitable integrated methodologies to cope with the complexity of systems, to reduce time‐to‐market and to ensure high quality and reliability of embedded systems by developing new methods for design and test. It includes design methods of heterogeneous electronic systems, improved efficiency of simulation and verification, diagnostic modeling and test generation based on the recent results in the decision diagrams theory, hierarchical functional test generation for new emerging systems architectures including those developed in CEBE. Prototype tools will be created to prove the correctness of concepts and hypotheses and to evaluate new solutions.
CEBE includes ca 80 researchers, of what ca 40 are senior staff members and the rest are PhD students. CEBE has an international advisory board consisting of 9 world famous scientists in the fields from Germany, France, UK, Finland and Hungary. During the last 5 years scientists of CEBE have been involved in 14 projects within EU FP5‐FP7 and other international programs, which has led to a widespread cooperation with leading research teams of EU and worldwide.
2. Statistics about CEBE Participants
Three coordinating structural institutions and research teams: • Department of computer engineering (ATI)
o Design team o Test team o Verification team
• Department of electronics (ELIN) o Embedded electronics I (signal processing team EMBEL ‐ I) o Embedded electronics II (semiconductor research team EMBEL ‐ II)
• Technomedicum (TM) o Biofluids optics team

Report of CEBE 2008‐2010
4
o Brain research team o Cardiology team
The number of researchers – ATI (17), ELIN (12), TM (16), Total ‐ 35 The number of PhD students – ATI (23), ELIN (18), TM (13), Total – 54 New international projects
2008 1. Intelligent Battery Management with National Semiconductor Corporation, USA (2008‐2009) 2. European Network ETN TRICE 3. European Network Enhancing Lifelong Learning for the Electrical and Information Engineering
Community – ELLEIEC 4. Baltic Research Network in Switching Theory with TU Tampere (Finland) and KTH (Sweden) 5. Experimental research for adaptive failure diagnosis based on structural multi‐core emulation test ‐
ERADOS. Partners: TU Ilmenau, Goepel Electronic (Germany). 2009 6. EU FP7 REGPOT project: Centre of Research Excellence in Dependable Embedded Systems – CREDES.
Coordinator: TU Tallinn (2009‐2012) 7. EU Tempus project : Curricula Reformation and Harmonisation in Biomedical Engineering (2009‐
2012) 2010 8. EU FP7 STREP project: DIAMOND ‐ Diagnosis, Error Modelling and Correction for Reliable Systems
Design, Coordinator: TU Tallinn (2010‐2012) 9. EUREKA‐EUROSTAR project: COMBOARD ‐ FPGA‐Based Test Acceleration Methodology for Complex
Electronic Boards. 10. Joint project with Helsinki‐Turku‐Tampere sleep research centre 11. Intelligent Battery Management with National Semiconductor Corporation (2010)
New national grants and projects:
1. ELIKO Project: Test, verification and diagnosis of distributed and embedded systems (2009 – 2013). 2. Funding for development of international “Communicative electronics” MSc curricula (Archimedes
Foundation, 2009‐2011). 3. Funding for development a joint international MSc curriculum of Tallinn University of Technology
and Tartu University: “Biomedical Engineering and Medical Physics" (Archimedes Foundation, 2009‐2012).
4. Funding for development of international “Computer and Systems” MSc curricula (Archimedes Foundation, 2010‐2013).
5. Enterprise Estonia funded preliminary research ‐ Development of high‐level design error diagnosis method for integrated circuits ‐ DIAGNOSIS. (2009).
6. Enterprise Estonia funded preliminary research ‐ Development of test technologies for manufacturing faults in complex printed circuit boards. (2009).
7. Estonian Science Foundation grant ESF 7483. Self‐Diagnosing Digital Systems (2008‐2011). 8. Estonian Science Foundation grant ESF 7894. System Test Methods for Complex Electronic Boards
(2009‐2012). 9. Estonian Science Foundation grant ESF 8478. Hardware functional verification and debug (2010 ‐
2013).

Report of CEBE 2008‐2010
5
10. New professorship in Embedded Systems (funding from the Archimedes Foundation, 2010‐2015). 11. Funding for establishment of the Chair of Embedded Systems (Estonian IT Foundation, 2010‐2013). Cooperation partners in joint and bilateral projects:
1. Ericsson AB, St.Jude Medical AB, Linköping University, Swedish University of Agricultural Sciences, Karolinska Institute, University Hospital of Linköping (Sweden)
2. TU Tampere (Finland) 3. Polish Academy of Sciences, Medical Research Center, TU Warsaw (Poland) 4. IBM Germany, Göpel Electronic GmbH, Institut für Bioprozess‐ und Analysenmesstechnik,
Brandenburg TU Cottbus, Heidelberg University, Bundeswehr University München, TU Ilmenau, TU Darmstadt, University of Bremen, TU Dresden, (Germany)
5. Hemotech SAS Paris, Aerielogic SARL (France) 6. Transeda Systems Ltd , U Southampton, U York (UK) 7. Technical University of Graz (Austria) 8. University of Verona (Italy) 9. Aveiro University, University of Porto (Portugal) 10. University Gent Hospital (Belgium) 11. IBM Haifa Res. Lab (Israel) 12. Russian Center of Cardiology in Moscow, Russian Academy of Science (RAS), A.F. Ioffe named
Technical Institute of Physics ‐ FTI (Russia) 13. Nara Institute of Science and Technology (Japan) 14. Saint Joseph College W. Hartford CT, NSC, Florida University (USA) 15. TU Budapest (Hungary)
National industrial and medical partners:
1. ELIKO TAK OÜ 2. Ericsson Eesti AS 3. Elcoteq Tallinn 4. Testonica Lab OÜ 5. Clifton Ltd 6. East‐Tallinn Central Hospital 7. North‐Estonia Medical Centre 8. Smartimplant OÜ 9. Ldiamon AS 10. OÜ Quattromed HTI
Patent Applications:
1. US provisional application US61/103061. Wideband impedance analyzer. Inventors: M. Min, T. Paavle, R. Land, P. Annus, T. Parve. Filed: 06.10.2008.
2. US provisional application US61/052467. Method and device using shortened square wave waveforms in synchronous signal processing. Inventors: P. Annus, M. Min, J. Ojarand. Filed: 12.05.2008.
3. Publication of Int. Patent Application WO2008125125. Data acquisition from non‐uniform arrays based on sine‐wave crossings. Authors: I.Bilinskis, M. Min, A. Ribakovs. Published: 23.10.2008.

Report of CEBE 2008‐2010
6
4. Publication of Int. Patent Application WO2008125124. Non‐uniform sampling and demodulation for wideband multi‐frequency bioimpedance measurements. Authors: I.Bilinskis, M. Min, J. Artjuhs, P. Annus, R. Land, O. Märtens. Published 23.10.2008.
5. US2009/0054801. Method and device for determining depressive disorders by measuring bioelectromagnetic signals of the brain. Inventors: H. Hinrikus M. Bachmann, J. Lass, A. Suhhova, V. Tuulik, K. Aadamsoo, Ü. Võhma. Publ. Feb. 26, 2009.
6. PCT/EE2008000026. Optical method and device for measuring concentrations of substances in biological fluids. Inventors: I. Fridolin, J. Jerotskaja, K. Lauri ja M. Luman. Filed: 4.12.2008
7. US Patent Application US12/524191. Method and Device for Synchronization of a Decoder for a RFID Receiver. Authors: O. Märtens, A. Kuusik, A. Liimets. Filed 23.07.2009.
8. European Patent Application EP09013404. Method and device for fast measurement of frequency response with scalable short chirp signals. Inventors: Mart Min, Toivo Paavle, Raul Land, Paul Annus, Toomas Parve. Owners: TTU and TAK ELIKO. Filed 23.10.2009.
9. Estonian Patent Application nr EE201000049 „Optical method and device for quantitative concentration measurements of compounds in the biological fluids”. Inventors: Ivo Fridolin, Jana Jerotskaja, Kai Lauri, Merike Luman. Filed: 27.05.2010.
10. Patent Application nr P201000056. „Optical method and device for determination of middle molecules and protein bound uremic toxins in the biological fluids“. Inventors: Fridolin, I., Uhlin F., Jerotskaja, J., Tanner, R., Arund, J., Filed: 28.06.2010.
11. Estonian Patent Application E201000060. Method and device for frequency response measurement. Inventors: Olev Märtens, Mart Min, Raul Land, Paul Annus, Tõnis Saar, Marko Reidla. Owners: Tallinn University of Technology and TAK ELIKO. Filed 07.07.2010.
Granted patents:
1. European Patent EP1786322B1. Simultaneous discrete‐time analysis of features of substances. Inventors: Min Mart, Land Raul, Parve Toomas, Märtens Olev, Ronk Ants. Owner: Tallinn University of Technology. Granted 28.10.2009.
2. US Patent US7706872B2. Method and device for measurement of electrical bioimpedance. Inventors: Min Mart, Kink Andres, Land Raul, Parve Toomas. Owner: Tallinn University of Technology. Granted 27.04.2010.
3. European Patent EP157542A1. Method and device for measurement of electrical bioimpedance. Inventors: Min Mart, Kink Andres, Land Raul, Parve Toomas. Owner: Tallinn University of Technology. Decision to grant the patent by European Patent Office 28.05.2010.
4. Estonian patent EE05166B1. Method and device for synchronizing of decoder of a RFID receiver. Authors: Olev Märtens, Alar Kuusik, Aivar Liimets. Granted: 15.04.2009.
Publications:
Period Journal papers Conference papers
Monographies ISIWoS Other IEEEXplore, ISIWoK
2008‐2010 47 27 130 6 Organized conferences:
2008: BEC2008, IEEE International Baltic Electronics Conference, October 6‐8, Tallinn, Estonia;

Report of CEBE 2008‐2010
7
DATE Workshop; NORCHIP; Nordic Test Forum; EAEEIE; EWDTS, NBC; Hypertension. 2009: DDECS; NORCHIP; Nordic Test Forum; EAEEIE; EWDTS; LATW; Austrian‐Baltic Cardiology Update Conference; IEEE Estonian Section WS; Impedance Spectroscopy ‐ IS2009. 2010: BEC2010, IEEE International Baltic Electronics Conference, October 4‐6, Tallinn, Estonia; DAC‐DSNoC; EDCC; DDECS; BEC; NORCHIP; Nordic Test Forum; EAEEIE; EWDTS; LATW; IV Baltic Hypertension Congress; CREDES WS Dissemination:
Year Radio TV Articles Seminars/WS Presentations/Lectures2008 1 5 2 2 2009 7 3 9 2 8 2010 8 1 4 1 1
PhD thesis defended:
1. Maksim Jenihhin. Test Time Minimization for Parellel Hybrid BIST Architectures (2008). Supervisors: R.Ubar, J.Raik.
2. Andrei Pokatilov. Development of National Standard for Voltage Unit Based on Solid State References (2008). Supervisor: T.Rang.
3. Maie Bachman. Effect of Modulated Microwave Radiation on Human Resting Electroencefalographic Signal (2008). Supervisor: H.Hinrikus.
4. Sergei Devadze. Fault Simulation of Digital Systems (2009). Supervisors: R.Ubar, P.Ellervee. 5. Andrei Krivoshei. Model Based Method for Adaptive Decomposition of the Thorasic Bio‐Impedance
Variations into Cardiac and Respiratory Components (2009). Supervisors: M.Min, V.Kukk. 6. Vineeth Govind. DfT‐based External Test and Diagnosis of Mesh‐like Networks on Chips (2009).
Supervisor: J.Raik. 7. Paul Annus. Multichannel Bioimpedance Spectroscopy: Instrumentation Methods and Design
Principles (2010), Supervisors: M.Min, T.Parve. 8. Merike Luman. Dialysis dose and nutrition assessment by an optical method (2010). Supervisor:
I.Fridolin. Jointly developed new Master of Science programs
1. Computer & System Engineering 2. Electronics and Bionics 3. Communicative Electronics 4. Biomedical Engineering (modified through collaboration with University of Tartu)
3. Overview of the cooperation projects in CEBE
The main research objectives in CEBE are focused on dependable embedded systems. The biomedical technology can be classified as mission critical and dependable embedded systems with special features. To carry out successful technology transfer from the fundamental research to production of high‐quality

Report of CEBE 2008‐2010
8
and safe sensors and technology within biomedical engineering, six interdisciplinary collaboration projects between the research teams of CEBE have been launched.
In the collaboration activities seven research teams of CEBE participated: Cardiology, Brain Research and Biofluids Optics teams from Technomedicum (TM), Signal Processing team from Department of Electronics (ELIN), and Design, Verification and Test teams from the Department of Computer Engineering (ATI). The following projects are ongoing:
P1. Application Specific Processors for Signal Processing in Biomedicine Coordinator: P.Ellervee, ATI Design Team, ELIN EMBEL‐I team
P2. Verification, test generation and fault diagnosis Coordinator: R.Ubar, ATI Verification Team, ATI Design Team, ELIN Signal Processing Team
P3. Total Peripheral Resistance Coordinator: K.Meigas, TM Cardiology Team, ELIN EMBEL‐I team
P4. Evaluation of mental disorders using EEG analyser Coordinators: H.Hinrikus and M.Jenihhin, ATI Design Team, TM Brain Research Team
P5. Reliable and disturbance free monitoring of dialysis Coordinator: I.Fridolin, TM Biofluids OpticsTeam, ATI Verification Team
P6. Testing of complex electronic systems Coordinator: A.Jutman, ATI Test Team, ELIN EMBEL‐I team
P7. Semiconductor devices Coordinator Prof. Toomas Rang, ELIN EMBEL‐II and EMBEL‐I teams
The research in ATI is concentrated in design and test of digital systems including dependability issues, ELIN’s strengths are in semiconductor research, mixed‐signal and analogue design towards signal processing, whereas BME is focusing on sensorics and biosignal interpretation.
The network of CEBE teams, main research topics related to the teams and selected outputs of the research is depicted in Fig.2. The project labels are pointing the respective coordinating teams. Each team is coupled with its main research topic and input for the project. The flows of the related activities in different projects can be followed in Table 1 and in the flow‐graph of Fig.2.
The projects P1, P3 and P4 are devoted to developing different signal sensoring and interpretation methods (TM teams), developing of novel signal processing algorithms (ELIN team) and related new specific signal processor architectures (ATI design team). The ultimate output of these projects are demonstrators or prototype boards.
The project P2 (lead by ATI verification team) is tightly coupled with the design process in projects P1, P3 and P4, contributing with design verification and error diagnosis (debugging). In the project P2 also the testability analysis of the designs is carried out, and BIST structures will be developed which results in corresponding redesign cycles.
The project P6 (lead by ATI test team) is also tightly coupled with the previous projects having the goal of developing test strategies for board level testing and test generation or implementing the tests developed in P2.

Report of CEBE 2008‐2010
9
TM Brain Research
TeamTM
CardiologyTeam
TM Biofluids Optics
Team
Signal interpretation
ELIN SignalProcessing
Team
Signalprocessingalgorithms
Project P4
Project P1
Project P3
ATI DesignTeam
Impedance spectroscopy
Boards
Testing methods
Prototypes
Design solutions
ATI Verification
Team
Test generation methods
ATI Test Team
TestsProject P6
Fault diagnosismethods
Project P5
Dialysis monitoring
Simulation,verification.
design error
diagnosis
Research on development of processor architectures
Project P2
New algorithms of signal analysis
Fig.2. The network of project flows in CEBE
Table 1. Project research flows depicted in Fig.2.
Step Activity P1 P2 P3 P4 P5 P6 TM Cardiology Team Start 1 Signal interpretation + ELIN Signal Processing Team Start + 2 Impedance spectroscopy + + TM Brain Research Team Start 3 Signal processing algorithms + + + ATI Design Team + + + 4 New processor architectures + + + 5 Design solutions + Start + + ATI Verification Team + + + + 6 Verification and error diagnosis + + + + 7 Test generation methods + 8 Tests + Start ATI Test Team +9 Testing methods +10 Prototype boards Finish Finish Finish Finish 11 Fault diagnosis methods Finish Start TM Biofluids Optics Team + 12 New algorithms of signal analysis + 13 Toolkit for dialysis monitoring Finish
Report of CEBE 2008‐2010
10
The project P7 has been initiated in september 2010 (leaded by ELIN EMBEL‐II team) and the determination of workplan and future developments are under discussion.
A positive outcome of the project P5 (lead by TM Biofluids Optics Team) is the synergy obtained from the collaboration between two different technical disciplines – computer hardware diagnosis (ATI verification team) and medical diagnosis (TM Biofluids Optics Team) with a successful application of the hardware fault diagnosis methods for developing a new more reliable dialysis dose estimation method. In the following sections the more detailed descriptions of the listed six collaboration projects of CEBE will be presented. In frame of these projects also the main research results of the involved teams will be discussed.
Since not all of the research results of the TM and ELIN teams are directly related to the six collaborative projects, they present their other specific research outputs in separate sections. The results of the ATI teams are integrated in the project descriptions.
4. CEBE Project P1: Application Specific Processors for Signal Processing in Biomedicine
Coordinator: P. Ellervee
Cooperative partners: • ELIN Signal Processing Group (Leader: M. Min; Team: P. Annus) • ATI Design Group (Leader: P. Ellervee; Team: M. Gorev, V. Pesonen)
Goals:
Goals for ELIN: A1. Finding of appropriate excitation waveforms for the fast and wideband impedance spectroscopy; A2. Developing of signal processing methods and devices for processing of the response signals in impedance spectroscopy. Goals for ATI: To develop architectures and methods to design application specific processors for signal processing used in biomedical applications.
Background:
Multi‐channel data‐acquisition devices are used often in biomedicine to measure properties of organs/tissues. The main reason is in the fact that the useful information is hidden under the background signals generated by the normal body activity. Such signals appear as noise in measurements. An example would be respiration generated noise when measuring heart activities. Measurement of electrical bio‐impedance is one of the ways to characterize a state of tissues/organs. The essence is the measuring tissues’ impedance at different frequencies thus enabling to evaluate the state of fluids both inside and around cells. The use of multiple electrodes in measuring allows getting characteristics about different parts of body/organ thus enabling to evaluate various activities – hart behaviour, condition of blood vessels, status of muscles and other tissues. For efficient measuring of bio‐impedance, it is necessary to use multiple points (6‐10) and high frequencies (MHz‐s). The resulting high sampling frequency sets strict constraints to the signal processing that should be done, at least in part, in real time. On the other hand, this is simplified because the high performance part is related to

Report of CEBE 2008‐2010
11
the data pre‐processing (sampling, filtering, etc.) close to the measured object (e.g., an organ). That is, the high‐speed special processor is needed for specific tasks only. The sequent main analysis can be done using universal workstations or even personal computers.
Research objectives:
The first research objective is to analyze the existing bio‐impedance measurement unit to identify lacks that limit the flexibility of the pre‐processing unit. Another concern is related to the fact that because of the limitations of measurement and sampling, under‐sampling must be used. The problem with the under‐sampling is that it may cause so‐called aliasing effect (creation of phantom harmonics). This can be solved by using code controllable sampler to perform synchronous non‐uniform under‐sampling.
The second research objective is to implement an enhanced data capturing and pre‐processing unit for bio‐impedance measurements that works in real time. The pre‐processor should be reconfigurable to allow fast adjustments depending on the status of the organs/tissues under measure.
The third objective is to develop methods to define efficient sampling sequences for non‐uniform synchronous under‐sampling. This will be needed to perform Discrete Fourier Transforms without using multiplication operations thus allowing fast and energy saving solutions.
The fourth objective is to develop methodologies to design similar application specific processing units not taking into account constraints set by the signal processing algorithms but considering also performance, precision, power consumption, etc.
For the abovementioned objectives, a close cooperation of both ATI Design and ELIN Signal Processing Groups is needed. The third objective will solved together with partners from Latvian University in Riga, Latvia. The results of the second and the fourth objective will be of interest of the other CEBE projects, especially P2 and P3 (see also the figure).
Project P1
Specification analysis
Fig.3. Research cooperation in Project P1
Applications:
The bio‐impedance measurement unit can be used to characterize state of tissues/organs.
Signal sampling & processing
Non-uniform sampling & processing
methods
ATI Design
ELIN Signal
Processing
Tehno-
medicum
Enhanced data ca
pture architecture
Application specific DSP
design
methods Design
test & verification
ATI Test &
Verification
Projects P3 & P4
Projects P2 & P6

Report of CEBE 2008‐2010
12
The developed methods can be used to design signal processing algorithms that rely on non‐uniform sampling and to design high performance pre‐processing units.
Working plan:
1) June 2010: Analysis of architectural solutions how to implement the re‐programmable sampling module for the pre‐processing unit. Development of such module using reconfigurable technology (FPGA).
2) December 2010: Development of non‐uniform sampling sequences for bio‐impedance measurement unit. The sequences will take into account capability to re‐program the sampling module.
3) June 2011: Prototype of the enhanced bio‐impedance measurement unit. In addition to the re‐programmable sampling module, extensions to the excitation signal generator will be explored.
Results already achieved:
ELIN:
Results A1:
1. Synthesis of ternary signals to replace the sine wave excitation; 2. Synthesis of multifrequency sine waves and their processing methods based on synchronous
undersampling (for further study in frames of P1); 3. Synthesis of scalable chirp signals and their modifications as binary and trinary chirps, also short and
very short chirps – chirplets and titlets – for implementation in ultrafast spectroscopy (to be continued in frames of P1 and P3).
Results A2:
1. Further developed methods for processing of multifrequency response signals considering implementations in FPGA technology;
2. Design of the FPGA based code controllable sampler as a preprocessing unit for the following digital signal processor of multifrequency signals.
ATI:
1) Possible architectural solutions of the re‐programmable sampling module have been analysed and implemented. The solutions took into account performance requirements for the pre‐processing unit. Different implementation possibilities using reconfigurable technology (FPGA) were explored. Two papers have been published and one paper has been accepted for publication at international conferences.
2) A paper about advantages and limitations of synchronous non‐uniform under‐sampling has been accepted for publication at an international conference. The paper analyses how such non‐uniform sampling can be used to reduce aliasing effects.
Publications:
1. P. Ellervee, P. Annus, M. Min, "High Speed Data Preprocessing for Bioimpedance Measurements: Architectural Exploration." The 27th NORCHIP Conference, Trondheim, Norway, pp.1‐4, Nov. 2009.
2. V. Pesonen, M. Gorev, P. Annus, M. Min, P. Ellervee, "Reprogrammable Data Acquisition Unit to Reduce Aliasing Effect in Bioimpedance Measurements." The 7th Annual FPGAworld Conference, Copenhagen, Denmark, 6 pp., Sept. 2010.

Report of CEBE 2008‐2010
13
3. V. Pesonen, M. Gorev, P. Annus, M. Min, P. Ellervee, "Reconfigurable Data Acquisition Unit for Bioimpedance Measurements." Accepted for the 12th Biennial Baltic Electronics Conference (BEC'2010), Tallinn, Estonia, Oct. 2010.
4. I. Bilinskis, K. Sudars, M. Min, P. Annus, "Advantages and limitations of an approach to bioimpedance data acquisition and processing relying on fast ADCs." Accepted for the 12th Biennial Baltic Electronics Conference (BEC'2010), Tallinn, Estonia, Oct. 2010.
5. Min, M. Pliquett, Uwe; Nacke, Thomas; Barthel, Andreas; Annus, Paul; Land, Raul (2008). Broadband excitation for short‐time impedance spectroscopy. Physiological Measurement, 29(6), 185 – 192.
6. M. Min, R Land, T. Paavle, P. Annus. Broadband spectroscopy of a dynamic impedance. Journal of Physics: Conference Series, Vol. 224, No. 1 (2010) 012109, IOP Publishing, doi:10.1088/1742‐6596/224/1/012109.
7. Min, M.; Giannitsis, A.T.; Land, R.; Cahill, B.P.; Pliquett, U.; Nacke, T.; Frense, D.; Gastrock, G.; Beckmann, D. Comparison of rectangular wave Excitations in Broad band Impedance Spectroscopy for Microfluidic Applications. In: World Congress on Medical Physics and Biomedical Engineering (WC2009), Sept. 7‐12, 2009, Munich, Germany. O. Dössel and W.C. Schlegel (Eds.): IFMBE Proceedings 25/VII 2009, 85‐88,Springer‐Verlag, Heidelberg, Germany.
Patents and patent applications
Pat1. US Patent US7706872B2. Method and device for measurement of electrical bioimpedance. Inventors: Min Mart, Kink Andres, Land Raul, Parve Toomas. Owner: Tallinn University of Technology. Granted 27.04.2010. Pat2. European Patent EP1786322B1. Simultaneous discrete‐time analysis of features of substances. Inventors: Min Mart, Land Raul, Parve Toomas, Märtens Olev, Ronk Ants. Owner: Tallinn University of Technology. Granted 28.10.2009.
Dissertations
Paul Annus. Multichannel Bioimpedance Spectroscopy: Instrumentation Methods and Design Principles (PhD degree defended 2010). Supervisors: M. Min and T. Parve.
5. CEBE Project P2: Verification, test generation and fault diagnosis Coordinator: R.Ubar Cooperative partners:
• ATI Verification and Diagnosis Group (Leader: J.Raik; Team: S.Devadze, S.Kostin, U.Reinsalu, A.Tsepurov, D.Mironov, A.Karputkin, U.Repinski)
• ATI Design Group (Leader: Ellervee; Team: V.Pesonen, M.Gorev) • ELIN Signal Processing Group (Leader: Min; Team: P.Annus)
Goals:
To develop efficient methods for verification, self‐testing, fault diagnosis and debugging of digital systems with special attention to design of dependable application specific signal processors. Background: The use of complex embedded electronic devices and systems in life‐critical medical instrumentation makes dependability an extremely important requirement. Reliability of embedded systems is crucial,
Report of CEBE 2008‐2010
14
because the devices may need to operate without human supervision and control during several years without interrupting. In the same time the scalability of CMOS semiconductor technology is approaching physical limits, ultra‐thin wires and insulation layers will exhibit a reduced level of long‐term stability. Technology forecasts expect higher rates of permanent and transient faults, which makes fault tolerant design, built‐in self test and fault diagnosis a necessity. On the other hand, the exponential growth of the number of components in integrated circuits causes so‐called design gap – the productivity in circuit design does not increase as fast as the technical capabilities. Thus, more components can be integrated on a physical device than can be assembled in a meaningful way during circuit design. The verification gap, i.e. how to ensure the correctness of a design, is even wider. Thus, techniques and tools for the verification of circuits and design error diagnosis have received a lot of attention in the area of Computer Aided Design (CAD), and are particularly important for designing dependable medical instrumentation.
Systemspecification
Mathematical modeling
Design
Test generation
Design error diagnosis
Verification
Fault diagnosis
Code coverage analysis
Faultsimulation
ATI DesignTeam
Project P2
Testing
Project P6
ATI TestTeam ELIN Signal
ProcessingTeam
ATI Verification Team
Tehno-medicum
Team
Dialysis signal processing
Project P5
Tehno-medicum
Teams
Projects P1, P3, P4
ELIN Signal Processing
Team
Tehno-medicum
Teams
Projects P3, P4
Project P1
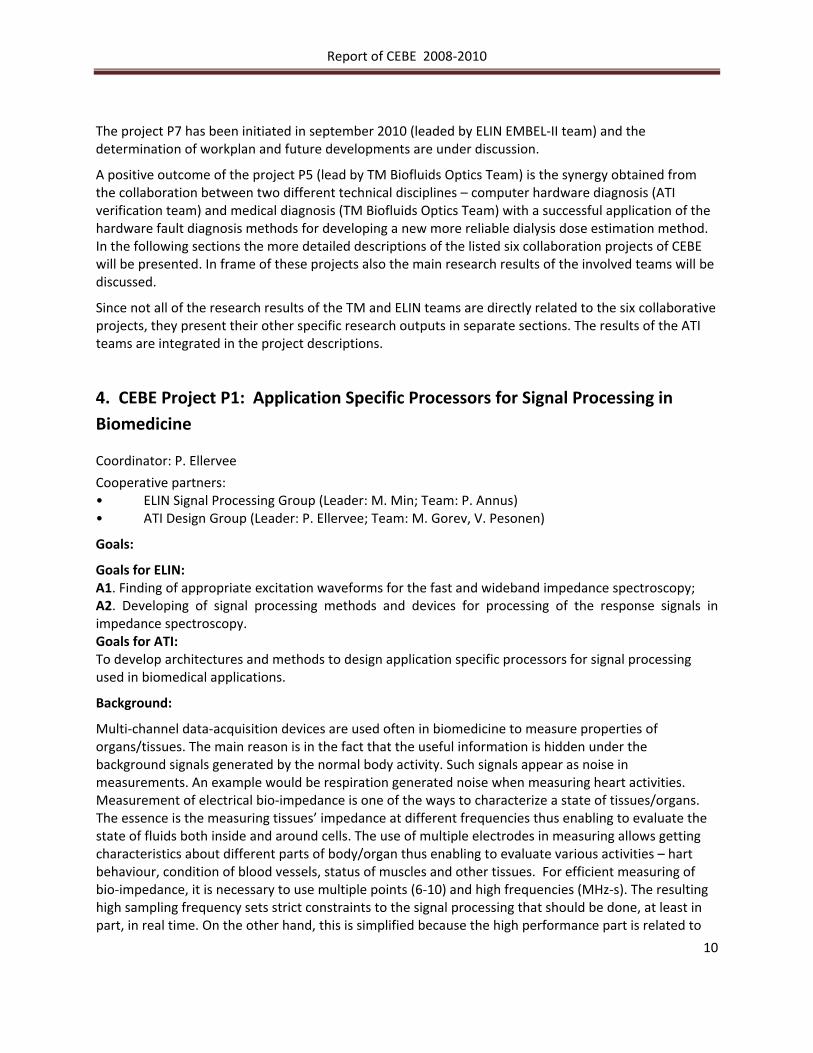
Fig.4. Research cooperation in Project P2
Research objectives:
The research objectives are twofold: (1) general objectives related to the development of new methods, and (2) specific CEBE cooperation related objectives regarding to testing the developed new methods on the signal processors designed in frame of CEBE.
The general research objectives of this project are digital systems, the models of components and architectures of these systems, the models of design errors and physical faults in systems, the methods of verification and error diagnosis in designs, the methods of fault simulation, test generation, testing and fault diagnosis of systems. Because of the continuously increasing complexity of systems, hierarchical and multi‐level approaches of solving the listed problems will be developed and investigated.

Report of CEBE 2008‐2010
15
The specific CEBE cooperation related research objectives of this project are embedded electronic systems, particularly application specific signal processors, verification and error diagnosis in the designs, developing of efficient self‐test methods and evaluating the quality of self‐test by novel fault simulation methods.
How the research objectives of the project are interrelated, and how the project is linked with the results of other projects in CEBE, is shown in the picture..
New results expected:
Development of new methods for fault simulation, test generation, design error diagnosis, and fault location in digital systems which outperform the known methods in performance and efficiency and cope with the continuously increasing complexity of systems.
The designs developed in CEBE are being used as benchmark systems for evaluation of the new methods in comparison with existing methods and tools.
Applications:
The new methods will be used for verification and error diagnosis in the architectures to be developed in frames of other cooperation projects ongoing in CEBE, particularly in the first place, in the project P1, and possible also in the projects P3 and P4. New test generation methods and BIST solutions can be used in the project P6.
Research results achieved (2008‐2010) by the ATI Verification Group:
1. Fault simulation: A new parallel critical path tracing method which allows the firs time to calculate the sets of detected faults beyond the fanout‐free regions in parallel for many test patterns for the extended class of conditional stuck‐at faults. Experiments showed that the speed of the new simulator exceeds the speeds of commercial fault simulators used in the CAD systems of Mentor Graphics and Synopsys [1].
2. Fault simulation: New very fast method for simulation of arbitrary physical defects in digital circuits by using X‐fault model and structurally synthesized BDDs. The X‐fault is the most general fault model used to cover a very large class of physical defects and has become very important in the field of defect diagnosis. Publication at the prestigious conference DATE’ 2010 [2]. The PhD thesis of S.Devadze.
3. High‐level test generation: A register‐transfer level automated test pattern generator implementing a constraint solver was developed enabling test of hard‐to‐test sequential designs [3]. The topic of PhD thesis of T.Viilukas.
4. A simulator developed for the design navigation tool ZamiaCAD in co‐operation with IBM Germany (Dr. R. Dorsch) and Zamia (G. Bartsch). The topic of PhD thesis of A. Tsepurov.
5. Verification and debug: Test, verification and debug tools developed in the frames of CEBE were collected into a system called APRICOT. The tools run on a uniform design model based on high‐level decision diagrams. The functionality includes currently test generation, code coverage analysis, assertion‐checking, mutation analysis and design error diagnosis [4].
6. Fault diagnosis: A novel hierarchical approach for the macro level cause‐effect physical defect diagnosis in digital circuits was developed [5]. The topic of PhD thesis of S.Kostin.
7. New class of BDDs (called SSMIBDD) which allows a significant reduction of the model complexity in the number of nodes, and leads directly to decreasing of memory requirements and increasing of the speed of logic simulation. On the other hand, the side‐effect of the model creation is fault

Report of CEBE 2008‐2010
16
collapsing. The SSMIBDD based new structural fault‐independent fault collapsing method has the linear complexity and is considerably more efficient than other strucural fault collapsing methods at the same time cost [4]. This is the topic of the PhD thesis of S.Mironov.
8. High‐level DDs: A canonical form for high‐level decision diagrams (HLDD) using characteristic polynomials, which allows fast proof of equivalence of two different HLDDs. The method is a new possibility for formal verification of digital systems and has high potentials to improve the efficiency of detecting design errors in design [7]. The topic of PhD thesis of A.Karputkin.
The research related to the results 3, 5 and 6 is coordinated by the EU FP7 STREP project DIAMOND (2010‐2012) where the team leaded by J.Raik has also the coordinator’s role. Other results have been achieved in frame of the EU REGPOT project CREDES (2009‐2012), and the national grants ETF 7068 (J.Raik), ETF 7483 (R.Ubar), and ETF 8478 (M.Jenihhin).
Project P2 related joint researh results:
1. Development of the converter for creating SSBDD based diagnostic models of the processor architectures developed in P1.
2. Converting the VHDL designs of 8 signal processors into the SSBDD based diagnostic models 3. Investigation of the testability of the processor architectures developed in P1. The family of 8
different processor circuits were investigated. 4. Investigation of the potential quality of testing the processors by traditional BIST methods.
Current activities:
1. A new method is being developed for effect‐cause diagnosis of design‐errors at the register transfer level was developed. The method is based on backtracing the failing test sequences on the design model of high‐level decision diagram. The topic of PhD thesis of U. Repinski.
2. Development of a new tool for debugging system‐level designs represented by C language descriptions called FoREnSiC (Formal Repair Engine for Simple C) was started in co‐operation with the University of Bremen (Germany) and TU Graz (Austria).
3. Development of the converter for creating diagnostic models of the processor architectures developed in P1.
4. Investigation of the testability of the processor architectures developed in P1. 5. Development of a new method and tool for high‐level fault simulation in complex digital systems
Activities planned for cooperative research in 2011:
1. Experimental research of the efficiency of the error diagnosis tool in the process of debugging the processor designs developed in P1.
2. Experimental research in developing BIST and hybrid BIST solutions for the processor architectures developed in P1.
3. Development of new methods and tools for efficient fault location in digital systems.
Selected referenced publications:
1. R.Ubar, S.Devadze, J.Raik, A.Jutman. Fast Fault Simulation for Extended Class of Faults in Scan‐Path Circuits. 5th IEEE Int. Symposium on Electronic Design, Test and Applications – DELTA 2010. Ho Chi Minh City, Vietnam, Jan. 13‐15, pp. 14‐19.

Report of CEBE 2008‐2010
17
2. R.Ubar, S.Devadze, J.Raik, A.Jutman. Parallel X‐Fault Simulation with Critical Path Tracing Technique. IEEE Conf. Design, Automation & Test in Europe – DATE’2010, Dresden, Germany, March 8‐12, 2010, pp. 1‐6.
3. T.Viilukas, J.Raik, M.Jenihhin, R.Ubar, A.Krivenko. Constraint‐based Test Pattern Generation at the Register‐Transfer Level. 13th IEEE Int. Symp. on Design and Diagnostics of Electronic Circuits and Systems – DDECS’2010. Vienna, April 14‐16, 2010, pp. 352‐357.
4. M.Jenihhin, J.Raik, A.Chepurov, R.Ubar. PSL Assertion Checking Using Temporally Extended High‐Level Decision Diagrams. Journal of Electronic Testing: Theory and Applications ‐ JETTA, Springer Science, 2009.
5. S.Kostin, R. Ubar, J.Raik. Macro Level Defect‐Oriented Diagnosability of Digital Circuits. Baltic Electronics Conference, Tallinn, Oct 4‐6, 2010.
6. R.Ubar, D.Mironov, J.Raik, A.Jutman. Structural Fault Collapsing by Superposition of BDDs for Test Generation in Digital Circuits. IEEE 11th International Symposium on Quality Electronic Design – ISQED’2010. March 22–24, 2010, San Jose, CA – USA, pp. 1‐6.
7. A.Karputkin, R.Ubar, J.Raik, M.Tombak. Canonical Representations of High Level Decision Diagrams. Estonian Journal of Engineering, Vol. 16, Issue 1, 2010, pp.39‐55.
The total number of publications of the ATI Verification and Test teams during 2008‐2010 is 92, including 14 journal articles and 78 conference papers (ISI WoK).
Dissertations
1. Maksim Jenihhin. Test Time Minimization for Parellel Hybrid BIST Architectures (2008). Supervisors: R.Ubar, J.Raik.
2. Sergei Devadze. Fault Simulation of Digital Systems (2009). Supervisors: R.Ubar, P.Ellervee. 3. Vineeth Govind. DfT‐based External Test and Diagnosis of Mesh‐like Networks on Chips (2009).
Supervisor: J.Raik.
6. CEBE Project P3: Total Peripheral Resistance Coordinator: K.Meigas
Cooperative partners:
TM Cardiology Group (Leader: K.Meigas; Team: K.Pilt, M.Viigimaa, K.Temitski, D.Karai). ELIN Signal Processing Group (Leader: M.Min; Team: A.Krivoshei). Clinic of Cardiology of North Estonian Regional Hospital (Leader: M.Viigimaa; Team: medical doctors of Clinic of Cardiology). ATI Design Group (Leader: P.Ellervee). ATI Verification and Diagnosis Group (Leader: J.Raik).
Goals:
1) To develop a method and prototype of device to monitor the total resistance of peripheral arteries noninvasively and continuously using optical and electrical methods in parallel.
2) To develop the methods for processing of composite impedance signals for adaptive separating of the cardiac component from noise, artifacts, and respiratory component (ELIN group);

Report of CEBE 2008‐2010
18
Background:
It is well known that the heart‐vascular diseases are the main cause for deaths in Europe. Early preventive actions are essentially important as Estonia have has the highest mortality level for such diseases in Europe. Improvement of non‐invasive methods for diagnostics in very early stage is extremely important. Pulse Wave Velocity (PWV) is an important parameter of arterial stiffness and it has been recognised in the European Hypertension Guidelines (2007) as a diagnostic method to search for subclinical organ damage. Peripheral resistance is dependent on the capacitance of the blood vessel through of which the blood travels and is also affected by the viscosity of the blood. Therefore, the peripheral resistance gives important complex information about the condition of the heart and arteries. This parameter is important to diagnose and evaluate different heart diseases as hypertension and heart failure. The method will be based on the optical monitoring of arterial stiffness using the PWV measurement from one side and on the monitoring of Cardiac Output (CO) using electrical impedance measurement from another side. Such the combining of two methods gives us possibility to monitor the total resistance of peripheral arteries noninvasively and continuously, which characterise the dynamics of changes in mechanical properties of arteries and heart capacity.
Research objectives:
The first research objective (TM Cardiology Group) is responsible for the further development of optical monitoring of arterial stiffness using PWV method. The simultaneous and quick registration of mechanical properties of arteries walls by optical method with simultaneous registration of pulse wave velocity, shape, and dynamics of blood pressure gives us possibility to measure dynamic compliance of arteries in non‐invasive way.
The second research objective (ELIN Signal Processing Group) performs the further development in monitoring of CO using electrical impedance method.
The third research objective (Clinic of Cardiology of North Estonian Regional Hospital) is the patient study. The hospital is responsible for the clinical evaluation and the patient studies. We plan to study the hypertonic patients to get information about the efficiency of the therapy and used drugs. This method gives also possibility to optimise the control of medical treatment of the hypertensive patients.
Fig.5. Research cooperation in Project P3

Report of CEBE 2008‐2010
19
The forth research objective (ATI Design Group) is the development of algorithms for optimizations of optical monitoring of arterial stiffness using PWV method and the monitoring of CO using electrical impedance method. The prototype of the signal processor is to be implemented. This research is performed in cooperation with the CEBE‐P1 project.
The fifth research objective (ATI Verification and Diagnosis Group) is development and application of hardware verification and design error diagnosis methodology. This research is performed in cooperation with the CEBE‐P2 project.
The project has a strong potential for cooperation with CEBE‐P6 project. The later stages of the project also consider creation of analog part of the device (primarily high precision analog‐to digital converter). This work will reveal the potential for cooperation of CEBE with the competence centre ELIKO.
Applications:
The monitoring device of the total resistance of peripheral arteries is aimed to be applied in medicine for non‐invasive diagnostics of heart‐vascular diseases. It is also aimed to be used in research in the related area by TM.
Working Plan 2010‐2012:
1) September 2010. Proofing of concept of optical monitoring of arterial stiffness using PWV and monitoring of CO using electrical impedance method.
2) March 2011. Patient studies in Clinic of Cardiology of North Estonian Regional Hospital. 3) December 2011. Development of the algorithms and optimization. 4) May 2012. Development of the specific signal processor methodology, optimizations for algorithms
implementation and verification methodology. 5) October 2012. Practical application of the prototype. Next iterations of the calculation algorithm and
development of related optical and electrical methods. Decision on the further project development steps.
Research results achieved (2008‐2010) within the cardiovascular diagnostics
The results are listed separately for the main research directions.
Clinical study on patients
In clinical study the objective was to compare aortic and arterial pulse wave velocity (PWV) in coronary heart disease (CHD) patients and healthy young volunteers. Severe coronary heart disease was confirmed by coronary angiography. Aortic PWV was measured using the TENSIOMed Arteriograph. Four arterial PWVs were gathered using a PowerLab 4/20T.
The major findings of the study were:
1) patients with CHD had increased aortic PWV compared with healthy subjects. in the CHD group,
2) aortic PWV had a positive correlation with arterial PWV. Our study showed that difference in aortic and arterial PWV between CHD patients with different atherosclerosis grade was not significant. Neither was there a difference between diabetic and non‐diabetic patients and in groups with or without previous myocardial infarction.
Development of signal processing methods for optimal technical solutions
Using different signal processing methods to calculate pulse transit time, which correlates with blood pressure, gives us possibility to increase signal to noise ratio of physiological signals. Pulse transit time is measured between the electrocardiogram R‐wave peak and 50% raising front level of a PPG signal.
Report of CEBE 2008‐2010
20
Registered PPG signal bandwidth may be shared by noises and therefore the signal raising front is undetectable. ECG reference adaptive sum comb filter is one solution to extract the harmonic components of the PPG signal and suppress the noises between them.
Averaging effect of the filter on the PPG signal was studied and adjustments were made. The influence of the comb filtered PPG signal on the measurement of pulse transit time was analyzed.
Results in ELIN:
1. A method for separating of two non‐stationary signals having randomly behaving features; 2. Readiness to implement the developed methods in medical diagnosing of cardiovascular system,
including extracting of cardiac impedance component and pulse wave optical signals.
Experimental measurement complex build‐up for physiological signals registration
1. The experimental measurement complex for physiological signals registration was built and tested to study the possibilities to get information about mechanical properties of arteries. This experimental complex enables to register the signals from different locations of body including pulse waves from periphery and arteries in comparison with reference signals from devices Sphygmocor, Arteriograph and Finapres. All physiological signals, including reference signals, are recorded synchronously during whole experiment.
2. The measurement complex was technically tested on volunteers. The results were similar with our previous study outcome, which ensures that our experimental complex can be used for experiments with larger group of patient
Cardiovascular diagnostics
A topic within cardiovascular diagnostics, which potentially will be connected to the project P3, deals with sudden cardiac death. Sudden cardiac death is a very frequent cause for death all over the world ‐ its incidence is 3 times higher than all lung cancer, breast cancer and AIDS deaths combined. The only possibility to decrease the number of SD cases would be the development of methods to identify risk groups as accurately as possible and provide them timely precautionary treatment. Aiming to explore and identify the high risk patients the level of myocardial electrical instability and prolongation of ventricular repolarization (VR) was assessed by the non‐invasive markers. Results achieved:
1. Two dynamic properties of VR‐ QT interval variability at 24‐hour ECG recording, so‐called (QTV) and QT interval rate‐adaptation (QTRA) have undergone more intensive investigation.
2. Relationship between hypertension and left‐ventricular hypertrophy was investigated in relation to certain peptides and QT‐dispersion.
3. Three large‐scale epidemiologic studies on Tallinn female population (50‐69 years) was performed which demonstrated correlation of QT parameters QTc and QTcD with several commonly known risk factors.
Project P3 related joint researh results:
1. A measurement complex for investigation the changes in pulse wave velocity (PWV) and parameters of pulse waveform have been built by TM Cardiology Group. The experimental complex enables to register synchronously 12 different signals from different arteries and peripheries.
2. The test experiments on volunteers for the validation of the measurement complex have been carried out in cooperation with Clinic of Cardiology of North Estonian Regional Hospital.

Report of CEBE 2008‐2010
21
3. The signal processing algorithm for the motion caused noise reduction from PPG signal has been written and tested by TM Cardiology Group.
4. The model based method for adaptive decomposition of the thoracic bio‐impedance variations into cardiac and respiratory components has been developed by ELIN Signal Processing Group.
5. The signal processing algorithms for the DC component and low frequency noises elimination from PPG signal is currently under development in cooperation with ELIN Signal Processing Group.
Selected published articles:
1. Viigimaa M, Abina J, Zemtsovskaya G, Tikhaze A, Konovalova G, Kumskova E, Lankin V “Malondialdehyde‐modified low‐density lipoproteins as biomarker for atherosclerosis”, Journal of Blood Press., 2010; 19(3),164‐168;
2. Vaverkova H, Farnier M, Averna M, Missault L, Viigimaa M, Dong Q, Shah A, Johnson‐Levonas AO, Brudi P. “Lipid‐Altering Efficacy of Ezetimibe/Simvastatin 10/20 mg Compared to Rosuvastatin 10 mg in High‐Risk Patients with and without Type 2 Diabetes Mellitus Inadequately Controlled Despite Prior Statin Monotherapy”, Journal of Cardiovascular Therapeutics, 2010 Jul, 1‐14;
3. K. Pilt, K. Meigas, R. Ferenets, J. Kaik, "Photoplethysmographic signal processing using adaptive sum comb filter for pulse delay measurement", Estonian Journal of Engineering, 2010, 16:1, pp. 78‐94;
4. K. Pilt, K. Meigas, M. Viigimaa, K. Temitski and J. Kaik "An Experimental Measurement Complex for Probable Estimation of Arterial Stiffness", Proc. IEEE EMBS, 2010, pp. 194‐197;
5. K. Pilt, K. Meigas, R. Ferenets, J. Kaik “Adjustment of adaptive sum comb filter for PPG signals”, Proc. IEEE EMBS, 2009, pp. 5693‐5696;
6. K. Pilt, K. Meigas, M. Viigimaa, J. Kaik, R. Kattai, and D. Karai "Arterial Pulse Transit Time Dependence on Applied Pressure", MEDICON 2010, IFMBE Proceedings, 2010, vol. 29, Part 3, pp. 406‐409;
7. K. Pilt, K. Meigas, D. Karai, J. Kaik “PPG Signal Processing for Pulse Delay Computing by Using Adaptive Comb Filter”, IFMBE Proceedings, 2009, vol. 25, pp. 1653‐1656;
8. K. Pilt, K. Meigas, M. Viigimaa, J. Kaik, R. Kattai and D. Karai “Arterial pulse waveform dependence on applied pressure”, Proc. of the Biennial Baltic Elect. Conf., 2010;
9. Krivošei, A., “Decomposition of the electrical bio‐impedance signal: A signal model based method for separation of the cardiac and respiratory components”, Saarbrücken, Germany: Lambert Academic Publishing, 2010;
10. Krivošei, A. Pilt, K. “Cardiac signal frequency estimation method based on a novel randomized multilevel crossing approach”, Physiological Measurement, IOP Publishing, Brighton (UK), to be submitted Oct. 2010.
11. Igor Pschenichnicov, T. Shipilova , J. Riipulk, K. Veski, D. Karai, J. Kaik. Association between QT interval dispersion parameters with arterial pressure and some other prognostic markers in Tallinn female population. Kardiologyia, 2010, 8:24‐28.
Dissertation
Andrei Krivoshei. Model Based Method for Adaptive Decomposition of the Thoracic Bio‐impedance Variations into Cardiac and Respiratory Components (PhD degree defended 2009). Supervisors: M. Min and V. Kukk. 7. CEBE Project P4: Evaluation of mental disorders using EEG analyser PI: H.Hinrikus Project coordinator: M.Jenihhin
Report of CEBE 2008‐2010
22
Cooperative partners: TM Brain Research Group (Leader: H. Hinrikus; Team: J.Lass, M.Bachmann, H.Lurje, A.Suhhova, V. Tuulik) ATI Design Group (Leader: P. Ellervee; Team: M.Gorev, V.Pesonen, D.Mihhailov, A.Batanov) ATI Verification and Diagnosis Group (Leader: J.Raik; Team: M.Jenihhin, A.Chepurov, U.Repinski) Consultants: P.Annus (ELIN), A.Sudnitsõn (ATI)
Goals:
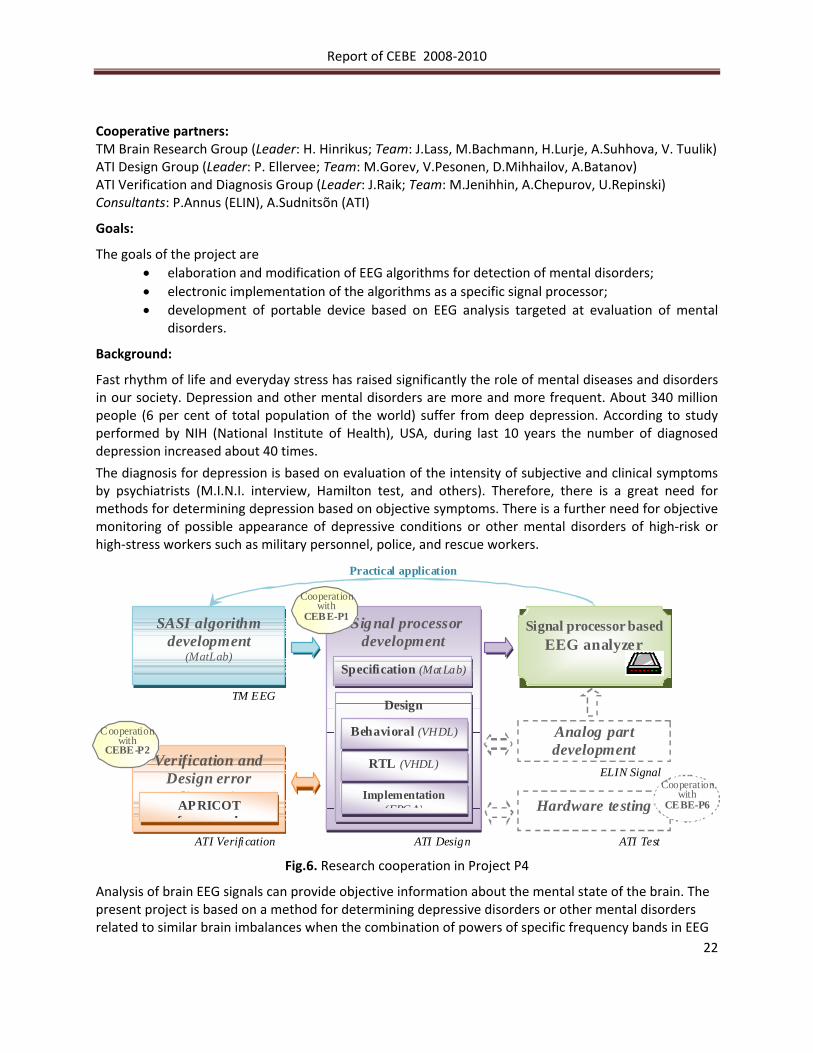
The goals of the project are • elaboration and modification of EEG algorithms for detection of mental disorders; • electronic implementation of the algorithms as a specific signal processor; • development of portable device based on EEG analysis targeted at evaluation of mental
disorders.
Background:
Fast rhythm of life and everyday stress has raised significantly the role of mental diseases and disorders in our society. Depression and other mental disorders are more and more frequent. About 340 million people (6 per cent of total population of the world) suffer from deep depression. According to study performed by NIH (National Institute of Health), USA, during last 10 years the number of diagnosed depression increased about 40 times.
The diagnosis for depression is based on evaluation of the intensity of subjective and clinical symptoms by psychiatrists (M.I.N.I. interview, Hamilton test, and others). Therefore, there is a great need for methods for determining depression based on objective symptoms. There is a further need for objective monitoring of possible appearance of depressive conditions or other mental disorders of high‐risk or high‐stress workers such as military personnel, police, and rescue workers.
SASI algorithm development
(MatLab)
Signal processor development
Specification (MatLab)
Design
Behavioral (VHDL)
Verification and Design error
diagnosis APRICOT f k
RTL (VHDL)
Implementation (FPGA)
ATI Verifi cation
TM EEG
ATI Design
Hardware testing
ATI Test
Analog part development
ELIN Signal
Practical application
Cooperation with
CEBE-P2
Cooperation with
CEBE-P1
Cooperation with
CEBE-P6
Signal processor based EEG analyzer
Fig.6. Research cooperation in Project P4
Analysis of brain EEG signals can provide objective information about the mental state of the brain. The present project is based on a method for determining depressive disorders or other mental disorders related to similar brain imbalances when the combination of powers of specific frequency bands in EEG

Report of CEBE 2008‐2010
23
has a certain positive or negative value (US 2009/0054801 by TM Brain Research group and North Estonia Medical Centre Foundation). It utilizes a calculation algorithm for spectral asymmetry index (SASI) based on the balance between the powers of two special EEG frequency bands selected lower and higher of the EEG spectrum maximum and excluding the central frequency from the calculations.
Research objectives:
1. Further development of the SASI calculation algorithm and other methods for EEG analysis targeting evaluation of the brain mental state (TM Brain Research Group).
2. Development of the specific signal processors design methodology as a case‐study of a mission critical biomedical system (ATI Design Group). This research is performed in cooperation with the CEBE‐P1 project.
3. Development of the algorithms optimizations for FPGA‐based implementation (ATI Design Group). The research in this direction is run in cooperation between ATI (A. Sudnitsõn) and University of Aveiro, Portugal.
4. Development and application of hardware verification and design error diagnosis methodology (ATI Verification and Diagnosis Group). This research is performed in cooperation with the CEBE‐P2 project.
5. Development of EEG analyzer as a portable device (TM Brain Research Group, ATI Verification and Diagnosis Group).
6. Testing of the EEG analyzer (TM Brain Research Group, ATI Verification and Diagnosis Group). in cooperation with North Estonia Medical Centre Foundation.
New results expected:
Development of new EEG analysis based methods for evaluation of mental disorders and their hardware implementation.
Applications:
The EEG analyser is targeted to medical diagnosis of depression or other mental disorders and monitoring of possible appearance of mental disorders of high‐risk or high‐stress workers such as military personnel, police, and rescue workers.
The device is also aimed to be used in research in the related area by TM. The development process of the device will provide the case‐studies and platform for research in several areas of digital systems design carried out by ATI (including CEBE‐P1 and CEBE‐P2).
Results already achieved:
1. The results of experimental studies showed positive average SASI values for depressive and negative SASI values for healthy group in all brain regions (p<0.05) and for majority of individual subjects [1,2].
2. Calculated SASI values behave similarly in all EEG channels and both hemispheres [1,2]. Consequently, one‐channel EEG can be used for SASI calculation.
3. SASI values are well correlated in different EEG channels and with Hamilton Depression Rating Scale score [2].
4. SASI distinguish significantly between depressive and healthy groups in the case of 1, 5 and 30 min EEG signal lengths [2]. Indication of SASI between depressive and healthy individual subjects increases with the length of the EEG signal and the optimal signal length is 15‐20 min. [2].
Report of CEBE 2008‐2010
24
5. The introduced SASI‐parameter, based on the combination of powers of two specific EEG frequency bands, provides much better results in detection of depression compared to EEG inter‐hemispheric asymmetry and coherence [1]. The SASI method has also advantages compared to other biometric methods for detection of depression [3]
6. The exposure to modulated at different low frequencies microwave radiation has been shown to increase EEG beta rhythm power and disturb the balance of EEG power spectral components. SASI reveals more clearly the effect of a low‐level physical stressor on the human brain activity than other measures (interhemispheric asymmetry, relative change in the EEG rhythms power, fault answers in psychological test) [4,5,6,7,8]. The topic of PhD thesis of Anna Suhhova.
Current activities:
1. Specification of the initial version of SASI calculation algorithm for depression in Matlab. 2. Implementation of the preliminary simulatable VHDL version of SASI calculation algorithm; its
verification by simulation results comparison with the Matlab version on the EEG signal database. 3. Development of the first simulatable implementation versions of SASI in accordance with the
targeted FPGA‐based implementation. (Specification in Matlab and behavioural VHDL) for the EEG Analyzer device.
4. Proof of concept. Development of the first simplified prototypes of the RTL VHDL and implementation in FPGA.
5. Development of controller and recorder of the EEG analyzer. Activities planned for cooperative research in 2011:
1. Development of RTL and FPGA implementation. Verification plan development. 2. Development of the specific signal processor methodology, FPGA optimizations for algorithms
implementation and verification methodology. 3. Practical application of the processor; development of portable device. 4. Next iterations of the SASI calculation algorithm and development of related methods for EEG
analysis based diagnosis of mental disorders.
Selected referenced publications:
1. Hiie Hinrikus, Anna Suhhova, Maie Bachmann, Kaire Aadamsoo, Ülle Võhma, Jaanus Lass and Viiu Tuulik. Electroencephalographic spectral asymmetry index for detection of depression. Medical & Biological Engineering & Computing, 2009, 47:1291‐1299.
2. Hiie Hinrikus1, Anna Suhhova, Maie Bachmann, Kaire Aadamsoo, Ülle Võhma, Hannes Pehlak, Jaanus Lass. Spectral features of EEG in depression. Biomedizinische Technik / Biomedical Engineering 2010, 55:155‐161
3. Milka Culic, Biljana Gjoneska, Hiie Hinrikus, Magnus Jändel, Wlodzimierz Klonowski, Hans Liljenström, Nada Pop‐Jordanova, Dan Psatta, Dietrich von Rosen, and BjörnWahlund. Signatures of Depression in Non‐Stationary Biometric Time Series. Comput Intell Neurosci. 2009:989824. doi: 10.1155/2009/989824
4. Anna Suhhova, Maie Bachmann, Jaanus Lass,Deniss Karai, Hiie Hinrikus. Effect of modulated microwave radiation on human EEG asymmetry. The Environmentalist 2009, 29:210–214.
5. Hiie Hinrikus, Deniss Karai, Jaanus Lass, Anastassia Rodina. Effect of noise in processing of visual information. Nonlinear Biomedical Physics, 2010, vol. 4, doi: 10.1186/1753‐4631‐4‐S1‐S5
Report of CEBE 2008‐2010
25
6. Hiie Hinrikus, Maie Bachmann, Jaanus Lass, Viiu Tuulik. Effect of modulated at different low frequencies microwave radiation on human EEG. The Environmentalist 2009, 29:215–219.
7. H. Hinrikus, M. Bachmann, J. Lass, A. Suhhova, V. Tuulik. Effect of Modulated Microwave Radiation on Brain Electrical Oscillations. Medical Physics and Biomedical Engineering, World Congress 2009, Munich, Sept 7‐12, IFMBE Proceedings 25/III, pp. 585–588, 2009.
8. Suhhova, H. Hinrikus, M. Bachmann, J. Lass. Effect of Modulated Microwave Exposure on Spectral Asymmetry of Human EEG. Medical Physics and Biomedical Engineering, World Congress 2009, Munich, Sept 7‐12, IFMBE Proceedings 25/III, pp. 406–409, 2009.
Patent application
US 2009/0054801 Method and device for determining depressive disorders by measuring bioelectromagnetic signals of the brain. Authors: Hiie Hinrikus Maie Bachmann, Jaanus Lass, Anna Suhhova, Viiu Tuulik, Kaire Aadamsoo, Ülle Võhma. Published Feb. 26, 2009.
Moreover, the results were presented at other international workshops and conferences and published in the conference materials.
8. CEBE Project P5: Reliable and disturbance free monitoring of dialysis Coordinator: I. Fridolin
Cooperative partners:
TM Biofluids Optics Group (Leader: I.Fridolin; Team: J. Arund, J. Jerotskaja, D. Karai, R. Kattai, K. Lauri, M. Luman, A. Talisainen, R. Tanner, R. Tomson) ATI Verification Group (Leader: R.Ubar; Team: S.Kostin)
Goals:
To develop an optical method for on‐line monitoring of solutes in the spent dialysate utilizing the UV‐absorbance, enabling one to follow a single haemodialysis session continuously, estimate dialysis adequacy, and monitor deviations in dialysis efficiency. A more specific goal of this project is to work out signal processing algorithms for highly reliable and disturbance free dialysis dose estimation during the dialysis therapy by the optical monitoring technique.
Background:
The project P5 emerged from the research area “Optical parameters of biofluids for clinical treatment monitoring” which belongs to the interdisciplinary target financed project of TUT Technomedicum “Interpretation of Biosignals in Biomedical Engineering”.
Dialysis dose has been reported to have great significance for the outcome of dialysis treatment. Many studies have shown a relationship between dialysis dose, measured as Kt/V and morbidity and mortality among haemodialysis patients. The Kt/V is a dimensionless ratio where K is the dialyser blood urea clearance in ml/min, t is the dialysis session length in min and V is the distribution volume of the urea in the body in ml. Urea kinetic modeling including calculation of Kt/V is in clinical practice usually based on blood‐based samples. Recently an optical method for on‐line monitoring of solutes in the spent dialysate utilizing the UV‐absorbance has been developed, enabling one to follow a single haemodialysis session continuously and monitor deviations in dialysis efficiency. The UV‐method does not need blood samples, any disposables or chemicals, is fast, and allows continuously measuring the elimination of the

Report of CEBE 2008‐2010
26
substances that are retained in the uremic patients. The method offers new perspectives to ensure dialysis adequacy and quality.
However, many events like patient blood pressure changes, needle displacement, concentrate depletion, etc can trigger dialysis machine alarm, which will stop the treatment and give wrong information to the dialysis on‐line monitor. Additionally, machine self‐tests and air bubbles add disturbances into measurements. An example about an unstable dialysis session (Fig. 7 A) and about a stable dialysis session (Fig. 7 B) illustrates the difference originated from the clinical practice.
Fig. 7 A: An unstable dialysis session Fig. 7 B: A stable dialysis session
Until today there has been used median filtering for elimination of the sudden disturbances (e.g due to air bubbles in the measurement system). This approach is shown to be not efficient enough.
ATI Verification
Team
Fault diagnosismethods
Toolkit for
dialysis monitoring
New algorithms of signal analysis
Project P2
Uremic toxins research
Clinical validation
Project P5
TM Biofluids Optics
Team
Toolkit for
dialysis monitoring
NovelDialysis
MonitoringMethods
Optical signal processing
Fig.8. Research cooperation in Project P5
Research objectives:
For the removal of disturbances not related to treatment course new signal processing algorithms will be developed in collaboration with Technomedicum (TM) Biofluids Optics Team and the Department of Computer Engineering (ATI) Verification Team.
Further ongoing topics, associated to the research area “Optical parameters of biofluids for clinical treatment monitoring” and P5 are: 1) exact identification of the remained prevalent peaks on the HPLC
0
10000
20000
30000
40000
50000
60000
0 00 00 000 500 000 500me
5 10 1500 2 2 3 3ti
sign
al
0
10000
20000
30000
40000
50000
60000
0 500 1000 1500 2000 2500 3000time
sign
al
Report of CEBE 2008‐2010
27
UV‐absorption and fluorescence profiles representing uremic retention solutes/CVD markers; 2) compilation of all spectra of uremic toxins/CVD markers – chromophores into a UTox Spectral Library; 3) development of reference methods for uremic toxins/CVD markers concentration measurements in the biological fluids (HPLC, ELISA, MS); 4) Signal processing of the absorbance and fluorescence spectra, appropriate multicomponent analysis; 5) work out of new optical methods for different groups of uremic toxins/CVD markers; 6) technical and clinical assessment of the novel optical methods; 7) prototyping of the novel optical methods, 8) patenting and commercialization of the developed novel optical methods. More specifically, the research is focused on developing a novel optical technology for: 1) small molecular weight uremic toxins/CVD markers monitoring; 2) middle molecular weight uremic toxins/CVD markers monitoring; 3) integrating the technology for small and middle molecular weight uremic toxins/CVD markers into one unified technology for multi component monitoring (MCM).
New results expected:
ATI will develop, optimize and apply new disturbance free signal processing algorithms. TM will implement the algorithms into the optical monitor and make the clinical evaluations. The algorithm is based on the idea of fault diagnosis procedures used in testing digital circuits based on ranking of suspected faults according to their detection rates. In a similar way the measured signal increments during the dialysis procedure will be here ranked according to their measurement rates in order to create the treatment curve as close to the reality as possible. A challenging aim will be to relate the detected disturbances with the real clinical cause. This result can offer a real feedback for the doctors and nurses in the form of a “treatment log” about the course of every dialysis treatment. This will enable to classify the most frequently occurring sources of the deviations and to plan and take actions in order to prevent them. A very positive outcome is the synergy obtained from the collaboration between two different technical disciplines – computer hardware diagnosis and medical diagnosis, with a successful application of the hardware fault diagnosis approach into more reliable dialysis dose estimation.
Applications:
1. Implementation of the disturbance free computer hardware diagnosis related signal processing algorithms into a optical dialysis monitor;
2. Implementation of a “treatment log” about the course of every dialysis treatment into electronic patient database system.
Working Plan:
1. June‐August, 2010. Development of a new algorithm for dialysis dose estimation which is based on ranking of measured signal increments during the monitoring of dialysis procedure.
2. October, 2010. Submission of a joint publication into a ISI Web category Biomedical Engineering journal.
3. September – December, 2010, clinical experiments at the North‐Estonian Medical Centre. 4. November, 2010 – February, 2011, analysis and evaluation of the new algorithms on the signals
from the clinical experiments at the North‐Estonian Medical Centre.
Research results achieved (2008‐2010) within the biofluids optics research;
The results were obtained in the two main directions listed below:
Development of the appropriate analysis methodology based on reversed phase liquid chromatography (HPLC) suitable to investigate the uremic toxins ‐ chromophores in the biofluids of dialysis patients.

Report of CEBE 2008‐2010
28
The relative contribution from the area of 10 main HPLC peaks to the total area of all detected peaks in percentage was 91 % at 280 nm.
1. Spiking experiments and UV spectra allowed to identify predominant uremic toxins in 5 chromatographic peaks identified as creatinine, uric acid, hypoxanthine, indoxyl sulfate, hippuric acid.
2. HPLC chromatograms at 254 nm and 280 nm are different being potentially representative for different chromophores – uremic toxins.
3. UV‐absorbance at 280 nm was best related to the removal of small water‐soluble non‐protein bound solutes. There was no significant difference in the removal of uremic solutes and the UV‐absorbance between the low flux and high flux membranes.
Clinical experiments in order to develop a new optical method for monitoring dialysis quality.
1. The biofluid (blood and dialysate) samples were collected from tenuremic patients on chronic thrice‐weekly hemodialysis at the Department of Dialysis and Nephrology, North‐Estonian Regional Hospital. The laboratory and spectrophotometrical analysis was carried out on the samples. The spectral data processing indicated that:
• Presence of at least two different wavelength ranges with the selective linear correlation was observed. The highest correlation in the spent dialysate for urea, creatinine, potassium, and phosphate was obtained at the wavelength 237 nm, and for uric acid at the wavelength 294 nm. This finding may add selectivity for monitoring several compounds.
• Applying certain signal processing tools on the UV‐spectra essentially improved accuracy and reliability of the results can be obtained e.g. for uric acid concentration estimation.
• The optical dialysis monitor DIAMON, developed in close collaboration between the researchers in TUT and Ldiamon AS, successfully estimated the dialysis quality parameter eKt/V and nutrition parameter nPNA.
Project P5 related joint researh results:
For the removal of disturbances not related to treatment course two new signal processing algorithms ‐AVRG and SMART, have been developed in collaboration with Technomedicum (TM) and Department of Computer Engineering (ATI). The algorithms have a significantly positive effect on removal the disturbances and data visualization for the doctors. Both algorithms show substantial improvement on both chart readability and measurement precision. As a result the estimation of dialysis dose will be more stable and less sensitive to various disturbances.
A new algorithm is under development which is directed to define the clinically relevant diagnosing parameters characterizing various disturbances during dialysis, distribution volume of the patients, etc. as an outcome from the signal analysis algorithms. The final aim will be deliver a practical toolkit for the clinicians helping obtain adequate dialysis targets meeting the individual needs of each patient and leading to “personalized healthcare” within haemodialysis. This aim will lead to deeper synergy between the CEBE project P5 and the other specific aims of the TM Biofluids Optics Group.
Related publications
1. Merike Luman, Jana Jerotskaja, Kai Lauri, Ivo Fridolin. (2009) “Dialysis dose and nutrition assessment by optical on‐line dialysis adequacy monitor”, Clinical Nephrology, vol 72 (4), pp.303‐311.
2. K. Lauri, R. Tanner, J. Jerotskaja, M. Luman, I. Fridolin (2010), „A HPLC Study of Uremic Fluids Related to Optical Dialysis Adequacy Monitoring“, Int J Art Org, 33(2): pp. 96‐104.

Report of CEBE 2008‐2010
29
3. Jerotskaja J, Uhlin F, Fridolin I, Lauri K, Luman M, Fernström A (2010) “Optical on‐line monitoring of uric acid removal during dialysis”, Blood Purification, 29:69‐74 (on‐line DOI: 10.1159/000264269)
4. Kai Lauri, Jürgen Arund, Risto Tanner, Jana Jerotskaja, Merike Luman, Ivo Fridolin (2010). “Behaviour of uremic toxins and UV absorbance in respect to low and high flux dialyzers”, Estonian Journal of Engineering, March 16(1): pp. 95–106 (doi: 10.3176/eng.2010.1.09)
5. Jerotskaja, Jana; Fridolin, Ivo; Lauri, Kai; Luman, Merike (2009). An enhanced optical method for measuring concentration of uric acid removed during dialysis. 11th International Congress of the Medical Physics and Biomedical Engineering, September 7‐12, 2009; Munich, Germany, 2009, Springer, 2009, IFMBE Proceedings, 9‐12, ISSN 1680‐0737
6. Jerotskaja, J., Uhlin F., Luman, M., Lauri, K., Fridolin, I. (2010) „Improved optical method for measuring concentration of uric acid removed during dialysis“ The XII Mediterranean Conference on Medical and Biological Engineering and Computing MEDICON 2010, Porto Carras Resort – Chalkidiki, 27 – 30 May 2010, IFMBE Proceedings, P.D. Bamidis and N. Pallikarakis (Eds.): Springer, 2010, vol. 29, pp. 124‐127
7. Fridolin, I., Jerotskaja, J., Lauri, K., Uhlin F., Luman, M. (2010). „A New Optical Method for Measuring Creatinine Concentration During Dialysis“ The XII Mediterranean Conference on Medical and Biological Engineering and Computing MEDICON 2010, Porto Carras Resort – Chalkidiki, 27 – 30 May 2010, IFMBE Proceedings, P.D. Bamidis and N. Pallikarakis (Eds.): Springer, 2010, vol. 29, pp. 379‐382.
Totally 8 conference full‐text papers have been published in the conference proceedings, among one is the first joint publication for TM and ATI groups: A. Talisainen, S. Kostin, D. Karai, I Fridolin, R. Ubar, “On‐line Monitoring of Dialysis Adequacy Using Diasens Optical Sensor: Accurate Kt/V Estimation by Smoothing Algorithms“, 2010 12th Biennial Baltic Electronics Conference (BEC2010) in Tallinn, Estonia October 4‐6, 2010. (Accepted)
Related patent applications
1. Ivo Fridolin, Jana Jerotskaja, Kai Lauri ja Merike Luman. „Optical method and device for measuring concentrations of substances in biological fluids” (autorid Ivo Fridolin jt). Taotluse nr PCT/EE2008000026. (Taotlus esitatud) Filed: 4.12.2008
2. Ivo Fridolin, Jana Jerotskaja, Kai Lauri ja Merike Luman. „ Optical method and device for quantitative concentration measurements of compounds in the biological fluids” EE201000049. Filed: 27.05.2010
3. Fridolin, I., Uhlin F., Jerotskaja, J., Tanner, R., Arund, J. Patenditaotlus „Optiline meetod ja seade keskmise suurusega ja valkudega seotud ureemiliste toksiinide määramiseks bioloogilistes vedelikes“., P201000056, prioriteedikuupäev 28.06.2010
Dissertations
M. Luman (supervisor Prof. I. Fridolin) “Dialysis Dose and Nutrition Assessment by an Optical Method”, Biomedical Engineering Centre, Tallinn University of Technology. Date of defendance: June 3, 2010.
9. CEBE Project P6: Testing of complex electronic systems Coordinator: A.Jutman
Cooperative partners:
ATI Test Group (Leader: A.Jutman; Team: S.Devadze, A.Tsertov, I.Aleksejev )

Report of CEBE 2008‐2010
30
ELIN Signal Processing Group (Leader: M.Min; Team: P.Annus)
Goals:
Current project is aimed at facilitating testing, diagnostic, and maintenance tasks in complex electronic systems through automation of test access solutions.
Background
The electronic system production has never been error‐free. Hence, post‐manufacturing test procedures have always been complex and test equipment – very costly. Many electronic products also incorporate self‐test routines to enable additional possibilities for testing and post‐sales maintenance in the field.
During the last decade the evolution of electronic systems has made a major leap. Complex multilayer boards densely stuffed with highly integrated components have become the state of the art in the consumer electronics such as mobile phones, medical devices, personal computers, etc. On one hand, this trend allows designing “smarter”, more compact and power‐efficient devices that improve the human’s quality of life. On the other hand, it influences in a negative way both the reliability and testability of modern electronic systems.
The electronic manufacturing industry is entering a new age, where static structural test technologies like Boundary Scan (BS) and in‐circuit test (ICT) start quickly losing their efficiency in terms of fault coverage, while there is currently no existing systematic alternative that can replace them. Despite of constantly improving test automation solutions, the new technological reality elevates the cost of testing in terms of extra engineering efforts and design‐for‐testability (DFT) overhead. This situation brings up a lot of concerns in the industry and needs a due attention from academic researchers.
Research objectives
The project is aimed at facilitating testing, diagnostic, and maintenance tasks in complex electronic systems through automation of test access solutions. Ultimately, we are building a test path based on available DFT standards, develop a model of that path, and implement automation algorithms for target diagnostic applications. In contrary to the model‐based or black‐box test methods, the test access path allows for better diagnosis and resource management within the System Under Test (SUT).
Fig.9. Test setup: tester and SUT

Report of CEBE 2008‐2010
31
Today, many electronic systems used at home or in industrial environment are based on one or several System‐on‐Chips (SoC). A SoC itself represents a complex test target. A multi‐SoC board would be a real challenge for a test engineer and a very interesting object for a researcher.
The advanced state of the art and new emerging test and debug solutions for complex electronic systems are typically based on various scan techniques and respective standard protocols that allow building a test path into the system. In a processor‐centric system, it is beneficial to use the debug backdoor of the processor and a testware to form the test path. A distributed system can be handled by IJTAG instruments connected into a 1149.7 network with an external test and debug controller. Both approaches are considered in the current project.
Fig.10. Component‐based “Lego style” SUT model
Modeling Test Path in Microprocessor‐Based Systems
In a processor‐centric system, the target is to build an integrated test path based on library components that could be plugged to one another forming a uniform model of the path: debug port, CPU core, peripheral Unit Under Test (UUT) controllers in the SoC, test firmware running on the CPU, interconnection structure between the SoC and target UUT, and the model of the UUT itself.
The key idea behind the concept is to represent the system as a set of tightly interrelated models that can be combined together slice by slice in a Lego style to represent the complete structure of a target SUT. Some model components (e.g. debug port functionality) can be described at the behavioral (functional) level, while some others require structural (e.g. interconnect) or timing information (UUTs, e.g. memory devices, controllers).
Fig.11. Building a test propagation path and its model in the SUT

Report of CEBE 2008‐2010
32
Typical model of the system would contain only those devices, functional blocks, busses, ports and etc., which are needed to be tested (interconnect test, functional test, etc.) or activated during test application for test data propagation.
We propose to use the well‐established framework of High‐Level Decision Diagrams (HLDD) to model the test path and system components.
In‐System Fault Management Based on Emerging DFT Standards
IEEE P1687 and IEEE 1149.7 are new DFT standards, developed especially to improve test access for debug and diagnostic tasks. P1687 also called IJTAG defines embedded instruments, their interfaced and work procedures, while 1149.7 improves the way of connecting distributed instruments into a single test data exchange system.
Here, the task of test path modeling is reduced to a trivial one as it is defined by the corresponding standards and description formats. The challenging task we target is the fault management. The target is to keep system working as long as possible while it is still capable of performing expected functions.
We define the following levels of fault management:
Level 1
Algorithms: actual fault diagnosis methods at the component level (logic or RTL) Hardware: specific diagnostic instruments for target faults (should be compliant with P1687) Fault types and granularity: single stuck‐at faults, bit errors, data transmission errors Examples: Logic BIST, Error Correcting Code Module, watchdog, property checker
Copyright: Al Crouch
Fig.12. Modern (and beyond state‐of‐the‐art) DFT infrastructure in a SoC

Report of CEBE 2008‐2010
33
Level 2 Algorithms: fault management methods at the component level (repair, recovery) Hardware: fault management/recovery HW, status report HW Fault types and granularity: critical fault, transient fault, permanent fault Examples: resending data or repeating calculations in case of an error Level 3
Algorithms: system‐wide (on‐chip) resource management algorithms Hardware: resource management (scheduling) HW + resource database Fault types and granularity: faulty resource/unit, partially faulty unit/core Examples: OS doesn’t schedule floating point operations to a certain faulty processor core
Level 4 Algorithms: data transfer level scheduling algorithms including SYNC and INT Hardware: (test) data transfer level HW ‐ 1149.7, 1149.1, 1500, P1687, debug modules (NEXUS, MIPI, etc), interrupt and synchronization channels
Examples: See Figure 12.
Research results achieved (2008‐2010) by the ATI Test Group
1. A new method for at‐speed testing of delay faults in asynchronous links connecting switches/ routers of a NoC communication infrastructure was developed [1]. The method has the property that all faulty chips are identified but some good chips may also be characterized as faulty with a small probability. A simple BIST hardware structure represented at register transfer level to implement the delay test method was also proposed.
2. A formal analytical method to calculate a customized polynomial and seed pair for each separate design/test case was developed [2]. The technique allows to shorten BIST runtimes and increase fault coverage by embedding given efficient test patterns into the LFSR sequence.
3. A new test access protocol for system‐level testing of printed circuit boards for manufacturing defects was developed [3,4]. The protocol can be based on standard Boundary Scan (BS) instructions and test access mechanism (TAM). The new technique dramatically extends the applicability of BS testing in the reality of modern complex on‐board data transfer buses and protocols. Potentially, it can also increase the speed of in‐system programming of flash memories and other tasks that are traditionally performed using BS.
4. An automation flow for microprocessor‐based board‐level structural test task was developed [5]. The approach is based on systematic processor modeling with the goal of automatic executable code synthesis. The synthesized machine code includes test programs and test pattern transportation core/handler (testware). The model synthesis is an engineer‐assisted task that needs to be done once. The subsequent testware synthesis is done automatically based on the processor model and test patterns provided by the system‐level automatic test pattern generator. The new methodology is intended to assist the Boundary Scan based test and extend its capabilities.
5. A general modeling methodology for test automation for microprocessor SoC‐based systems was proposed [6]. We describe the approach to automate the task of the unified system modeling beyond the SoCs with the ultimate goal to automatically generate and feed a sequence of stimuli trough the test propagation path mentioned above (from the debug port to the UUT and back) for the sake of improving the test coverage by enabling automated at‐speed testing. The new so‐called “lego‐style” test automation methodology forms a complimentary solution to traditional boundary

Report of CEBE 2008‐2010
34
scan technique. Together, they provide extended fault coverage that targets shorts, opens, stuck‐at faults as well as dynamic faults (e.g. delays, transition faults, wrong terminations, crosstalk). The “lego‐style” model allows reducing the labor effort drastically once the library of model components is created. In the same work, we also study particular challenges in testing the system’s infrastructure beyond the SoCs.
Selected referenced publications:
1. T.Bengtsson, S.Kumar, R.Ubar, A.Jutman, Z.Peng. Test Methods for Crosstalk Induced Delay and Glitch Faults in NoC Interconnects. J. of of IET Computers & Digital Techniques, 2(6), pp. 445‐460.
2. A.Jutman, A.Tsertov, R.Ubar. Calculation of LFSR Seed and Polynomial Pair for BIST Applications. Proc. of IEEE Workshop of Design and Diagnostics of Electronic Circuits and Systems – DDECS 2008. Bratislava, Slovakia, April 16‐18, 2008, pp.275‐278.
3. S.Devadze, A,Jutman, I.Aleksejev, R.Ubar. Turning JTAG Inside Out for Fast Extended Test Access. 10th IEEE Latin‐American Test Workshop – LATW 2009, Rio de Janeiro, Brazil, March. 2‐5, 2009, 6 p.
4. S. Devadze, A.Jutman, I. Aleksejev, R. Ubar. Fast Extended Test Access via JTAG and FPGAs. Proc. of 40th International Test Conference ‐ ITC’2009, Austin, Texas, Nov. 1‐6, 2009, paper 2.3, pp.1‐7.
5. S.Devadze, A.Jutman, A.Tsertov, R.Ubar. Microprocessor Modeling for Board Level Test Access Automation. Proc. of 10th IEEE Workshop on RTL and High Level Testing, Hong Kong, Nov. 27‐28, 2009, pp.154‐159.
6. A. Tsertov, A. Jutman, S. Devadze. Testing Beyond the SoCs in a Lego Style. Proc. of IEEE East‐West Design & Test Symposium (EWDTS’10). S.‐Peterburg, Russia, Sept. 17‐20, 2010, pp. 1‐5.
10. CEBE Project P7: Semiconductor devices Coordinator: T.Rang
Cooperative partners:
ELIN Signal Processing Group (Leader: M.Min; Team: P.Annus) Power Converters group from the Department of Electrical Drives and Power Electronics (Leader D. Vinnikov, Team: I. Roasto)
Backround.
The idea of this project has been initiated only in September 2010, when the Energy Technology initiative was launched in Estonia by the state. It bases on a long term research of EMBEL‐II group and newly developed cooperation with the power converters group from the faculty of Power Engineering. This is the new type cooperation in CEBE, which is oriented to joint activities between research group from CEBE and the group not involved in CEBE. Additionally the domestic industry like Clifton, Eesti Energia and Enerpoint Eesti are strongly involved.
At the moment the research topic titles as “GaAs and SiC based Schottky‐, pin‐ and hetero‐interfaces: improvement of electrical characteristics and new realizations”. The deeper cooperation with the EMBEL‐I team from ELIN is also planned in this field of using the spectroscopy as a method in different applications (the exactness of DLTS method applicability for measurement of PiN structures and for materials different from silicon is for example enough critical topic).

Report of CEBE 2008‐2010
35
EMBEL‐II Preliminary Goals:
B1. Developing of the practical solution for application of DLTS method for GaAs and SiC based power pin‐ and Schottky structures for deep energy level detection in sub‐contact epilayers.
B2. Finding an appropriate specification for realization of SiC polytypic heterojunction using diffusion welding (cold joining) technology.
Topic B1. The DLTS method relates to capacitance techniques currently employed in studying traps in semiconductors. The basic DLTS scheme is applicable to current transients as well as capacitance transients and therefore DLTS is a significant improvement in terms of sensitivity, trap depth range, and ease of operation and analysis. What DLTS effectively does is extending the trap spectroscopy into the regime of the deep and intermediate traps missed by luminescence, especially the non‐radiative centers about which there is almost a complete lack of understanding. For the experiments were used the GaAs p+‐p‐i‐n‐n+ structures fabricated in “Clifton Ltd”, Tartu, Estonia. The liquid phase epitaxy (LPE) p‐i‐n structures were grown on the polished and etched p+ substrates, doped by Zn, 2 inches diameter, 450 µm thickness and orientation (111), Czochralski grown. The substrates were purchased from CMK Gallium Arsenide Company, Slovakia. DLTS measurements were carried out by fully computer controlled deep level spectrometer DLS‐83D (Semilab, Semiconductor Physics Laboratory, Inc., Hungary). The measurements were performed in the temperature range of 77°K (liquid nitrogen) to 450°K, and frequency range of 2.5 to 2500Hz.
Results B1: During the DLTS measurements the majority of difficulties caused by the different approach structure (pin‐structure) have been detected. To obtain the firm belief of the results we suggest the following:
1. The p+‐p‐i‐n‐n+ chips, cut out from one and the same maternal plate are to be modified in accordance to the scheme developed by us, and then, in consecutive order each kind of specimen are to be measured by DLTS method.
2. The trap parameters measured in Schottky model were reliable; we observed the consecutive mutation of trap parameters from one model to another. The results of such experiment will give us a possibility to draw up the correction factors or transient functions as a pass from ideal Schottky specimen to variable p‐i‐n models.
3. The series of tests made in a wide interval of technological conditions will get us the steady potentiality for direct DLTS measurements on p+‐p‐i‐n‐n+ structures.
Topic B2. GaAs based solid‐state semiconductor devices have found confident application in power electronics. The diffusion welding (DW) of single diode structures in series provides a high voltage combination. A promising field for the DW application is manufacturing of high voltage GaAs diode stacks. The DW technique is a solid‐state joining process, which can be utilized to bond “difficult to join” materials. DW technology can combine several single structure into series (sandwich) and to yield the stacks with reverse voltage of thousands of volts.
Results B2: The investigations have been leaded for solution of some of the critical moments at manufacturing of stacks. Detailed information is limited today by the confidentiality contract with industrial partner Clifton Ltd, but in general:
Report of CEBE 2008‐2010
36
1. Suitable doping level of p+ substrate was estimated by the contact resistance measurements. Analysis has shown that for the p+ substrates with the current densities about 0.5‐1 A/cm2 the specific contact resistance depends weakly on doping concentration.
2. I‐V measurements showed that Al/p+‐pin contacts for n‐layer concentration 1x1015cm–3 have lock‐type barrier causing very high voltage drops in diode stacks.
3. For p+‐pin‐n+ structures the forward voltage drop depends on doping level as well as on epilayer thickness. The reverse voltage depends on pin‐layer thickness only. It was found that for diode stacks the suitable doping for p+ substrate is about 5x1018cm–3 and n+ layer doping in epitaxial p+‐pin‐n+ GaAs structures concentration must be higher than 1x1018 cm‐3.
Topic B3. The topic is considers new type JBS‐structures based on 4H‐SiC substrates. Usually in JBS structures Schottky regions alternate with local p‐n‐junctions, in which local p‐rings under the Schottky contact are formed by transient enhanced diffusion of boron specimens from implanted source. "Boron" p‐n‐junctions were shown to inject no minority carriers providing fast reverse recovery characteristics of JBS‐diodes like those of conventional Schottky barrier diodes. The 4H‐SiC JBS‐diodes with "boron" p‐n‐junctions have been investigated by means of deep level transient spectroscopy (DLTS).
The devices under study were fabricated using epiwafers purchased from Cree, Inc. The donor concentration in 12‐µm thick, n‐type epilayer is N = 2×1015 cm‐3. JBS‐diodes with different gaps between p‐rings were fabricated (diodes with uniform p‐n‐junction were also fabricated). The total dose of implanted boron atoms in p‐regions was 9 × 1013 cm‐2. For all diodes, the anode contact is 300 µm in diameter. Capacitance‐voltage (C‐V) characteristics and DLTS spectra has been used in research.
Results B3:
1. The DLTS spectra of a 4H‐SiC JBS‐diode measured with anode voltage switches from zero to a negative value that the sign of DLTS signal was expected to be negative (similarly for DLTS spetra of the reference silicon Schottky diode). However in the spectra of all the 4H‐SiC diodes under study, the sign of DLTS signal is positive. This means that the transient capacitance decreases during relaxation (in conventional Schottky diodes, the transient capacitance increases in consequence to detrapping of majority carriers).
2. The highest amplitude of positive DLTS peak showed diodes with uniform p‐n‐junction. The amplitude of DLTS peaks for JBS‐diodes depends on the gap width between the p‐rings: the wider the gap, the lower the amplitude. The measured "anomaly" of DLTS spectra is apparently connected with properties of the "boron" p‐n‐junction.
3. The temperature position of DLTS peak corresponds to ionization of boron "deep level" state having activation energy of about 0.55 eV. Possible explanations for the inverse DLTS signal will be discussed in the paper including the impact of high series resistance and extended compensation region in the "boron" p‐n‐junctions.
Future developments (EMBEL‐II):
1. Continuation of specific investigations on the influence of parameters of p‐guard rings on the output parameters of JBS diodes combining the experimental investigations with the theoretical (numerical simulations) investigations.
2. Making an attempt for creation of sharp hetero‐polytypic junction based on solid state bonding of two different polytypic silicon carbide wafers using DW technique.

Report of CEBE 2008‐2010
37
3. Improvement of DLTS technique taking into account the experiences gathered in impedance spectroscopy applications (specific signal forms for meqasurements).
Related publications
1. Korolkov, O., Kuznetsova, N., Sitnikova, A., Viljus, M., Rang, T.: Investigation of Subcontact Layers in SiC After Diffusion Welding. Materials Science Forum, v. 600‐603, 2009, 647 ‐ 650.
2. Toompuu, J.; Korolkov, O.; Sleptshuk, N.; Rang, T.: Investigation of p‐i‐n GaAs Structures by DLTS Method. Electronics and Electrical Engineering, 4 (100), 2010, 51 ‐ 54.
3. Voitovich, V.; Rang, T.; Rang, G.: LPE technology for power GaAs siode structures. Estonian Journal of Engineering, 16(1), 2010, 11 ‐ 22.
4. Toompuu, J. „Investigation of p‐i‐n GaAs structures by DLTS method. ISBN‐978‐3‐8383‐9223‐3, LAMBERT Academic Publishing, 2010, Saarbrücken, Germany, 137 pages.
Dissertations
D1. Andrei Pokatilov. Development of National Standard for Voltage Unit Based on Solid State References (PhD degree defended 2008). Supervisor: T. Rang.