Embed Size (px)
Citation preview
DOCUMENT RESUME
ED 077 928 TM 002 723
AUTHOR Boldt, Robert F.TITLE Trends in Aptitude of Graduate Students in
Science.INSTITUTION Educational Testing Service, Princeton, N.J.SPONS AGENCY National Science Foundaticn, Washington, D.C.REPORT NO ETS-PR-73-7PUB DATE 19 Jan 73NOTE 30p. .
EDRS PRICE MF-$0.65 HC-$3.29DESCRIPTORS Able Students; Aptitude Tests; *Career Choice;
*Economic Factors; *Employment Trends; GraduateStudents; *Graduate Study; Science Careers;Scientists; Technical Reports; *Test Results
IDENTIFIERS *Graduate Record Examination
ABSTRACTIn an attempt to provide some indication as to
whether the recent employment trends among scientists is resulting ina drop of the ability of students entering scientific fields, GREfiles were used to construct a history of aptitude test statisticsfor 1966-67, 1967-68, 1970-71, and 1971-72. For the latter threeyears, students were classified by the department which theyindicated should receive their scores. For data from1966-67,classifications were based on the fields which students indicated anintention to study. The latter means were unaccountably depressed.Declining trends in means were noted for the last three years studiedfor physical sciences math sciences, engineering, basic socialsciences, applied social sciences, and the arts and humanities. A"declining trend in the Quantitative score was very strong forphysical sciences, math sciences, and engineering, and a decliningtrend in Verbal scores was also noted in the other areas mentionedabove. The trends noted are in agreement with the hypotheses of thestudy, though such agreement does not by itself imply any particulareffective cause. Given these results, suggestions were made for acontinuing monitorship of similar data and a validation of trendsnoted in the history file. (Author/KM)

COPERMISSION TO REPRODUCE THIS COPY
RIGHTED ATERIAL HAS VAN GRA ED
BY .
, di,/ ../ //72/..,o Ern; A ORGANIZATIONS OPERATING
OF V.,PAGRAMENTS WITH THE US OFFICEOF UCATION FURTHER REPRODUCTIONOUTSIDE THE ERIC SYSTEM REQUIRES ^ERMISSION OF SHE COPYRIGHT OWNER
PR 73 7
TRENDS IN APTITUDE
OF GRADUATE STUDENTS IN SCIENCE
Robert F. Boldt
U S DEPARTMENT OF HEALTH.EDUCATION 8 WELFAREOFFICE OF EDUCATION
THIS DOCUMENT HAS BEEN REPRODUCED EXACTLY AS RECEIVED FROMTHE PERSON OP ORGANIZATION ORIGINATING IT POINTS OF VIEW OR OPINIONS STATED DO NOT NECESSARILYREPRESENT OFFICIAL OFFICE OF EDUCATION POSITION OR POUCY
Research Sponsored by the
National Science Foundation
Contract NSF C740
'LI
January 19, 1973EDUCATIONAL TESTING PERVICEPRINCETON, NF.W JERSEY
TRENDS IN APTITUDE OF GRADUATE STUDENTS IN SCIENCE
ABSTRACT
The present study stems from the concern that recent employment
trends among scientists will result in a drop of the abi_ity of students
entering scientific fields. In an attempt to provide some indication as to
whether such is the case, the history files of the Graduate Record
Examinations were used to construct a history of aptitude test statistics
for the years 1966-1967, 1967-1968, 1970-1971, and 1971-1972. For the
latter three years the classification of students by field was accomplished
using the department which they indicated should receive their scores:
A change of reporting procedure dictated...that for data from 1966-1967,
the classification should be based on'the field in which they indicated
an intention to study. These latter means were unaccountably depressed.
Declining trends in means were noted for the last three years studied
for physical science, math science, engineering, basic social science,
applied social science, and the arts and humanities. A declining trend
in the Quantitative score was very strong for physical science, math
science, and engineering, and a declining trend in Verbal scores was also
noted in the other areas mentioned above. The trends noted are in agreement
with the hypotheses of the study, though such agreement does not by itself
imply any particular effective cause. Given these results, suggestions
were made for a continuing monitorship of similar ch..ta and a validation
of trends noted in the history file.
Table of Contents
Page
Introduction1
The Graduate Record Examinations (GRE) 2
The GRE Population 6
Score Comparability9
Brief Statement of furpose 10
Sample11
Results14
Discussion17
Suggested Research 18
References21
TRENDS IN APTITUDE OF GRADUATE STUDENTS IN SCIENCE
Introduction
Concern has bees expressed recently over changes in the scientific
labor market, particularly for doctoral canaidates. Although traditionally
the supply of these highly educated specialists has been inadequate to meet
the needs of a technologically burgeoning society, more recently some speak
of the disenchantment of students with science and others believe that the
more promising students do not choose a scientific career. These attitudes
probably stem from a growing concern about projections indicating that the
vast numbers of Ph.D.'s to be produced in the next decade will far outstrip
any increase in open positions. Some forecasts of manpower needs in the
sciences and at the Ph.D. level indicate that there will be an overabundance
of persons with new doctorates in the sciences now and for some time.
Perhaps the market for technically educated personnel at the doctorate level
will be reduced for some time to come, possibly because of the decision of
private iciustry to recruit personnel at lower academic levels and to train
them in their own laboratories.
If such is the case and certainly if it is widely held that such is
the case, one would scarcely expect the vocational choices of the more able
students to remain unaffected. Students must, of course, speculate on the
most rewarding career in terms of their interests and t-e activities they
enjoy the most, but one would also expect the more aware of them to respond
to the realities of probab..e employment and income. To the extent that
these students are potential scientists the cause of science is hurt--and
-2-
the evidence is that in physics and mathematics the most able of students
are involved. One needs only to accept the possibility that those who are
the most able in terms of tested abilities are those who are most aware of
employment trends and perhaps able to act on the basis of this knowledge.
If they choose not to go into science in order to optimize, in some sense,
the quality of their personal experience, the long run effect for the country
could be quite unfortunate. It is, therefore, quite important to note and
detect trends in the quality of students going into the sciences.
With ample resources one could probably conduct a comprehensive
evaluation study of students entering the sciences, using measures that seem
particularly relevant and taking measurements periodically in a fashion
designed to sense trends of importance in the data. As an initial step,
however, it seems much more reasonable to use easily accessible data, both
for assessing the past as a baseline and for monitoring future trends. Then,
if hints of serious problems are detected, more energetic action could be
taken on a real time basis. One set of data which might serve the purpose
is the historical file of scores on the Graduate Record Examinations.
The Graduate Record Examinations (GRE)
Since the Graduate Record Examinations are required by many American
graduate schools and scholarship programs, thc. data accumulated and tabulated
in connection with these examinations are quite voluminous. They consist
of tests of scholastic aptitude, which yield a Verbal and a Quantitative
score, and a series of specialized achievement examinations in eighteen
subject matter areas. These examinations are enumerated below.
Biology Education Geography,
Chemistry Engineering German
Economics French History
History
Literaturein English
Mathematics
-3-
Music
Philosophy
PoliticalScience
Psychology
Sociology
Spanish
The fields listed above include the sciences as well as other fields that
could serve as a base of comparison. Thus, the people taking the examin-.
ations cover quite a wide range of specialities. While it may be true that
many of the examinees take only the aptitude tests since many American
graduate schools do not require the achievement examinations, it is known
that the aptitude tests are required for a large variety of graduate
departments (Lannholm, 1971).
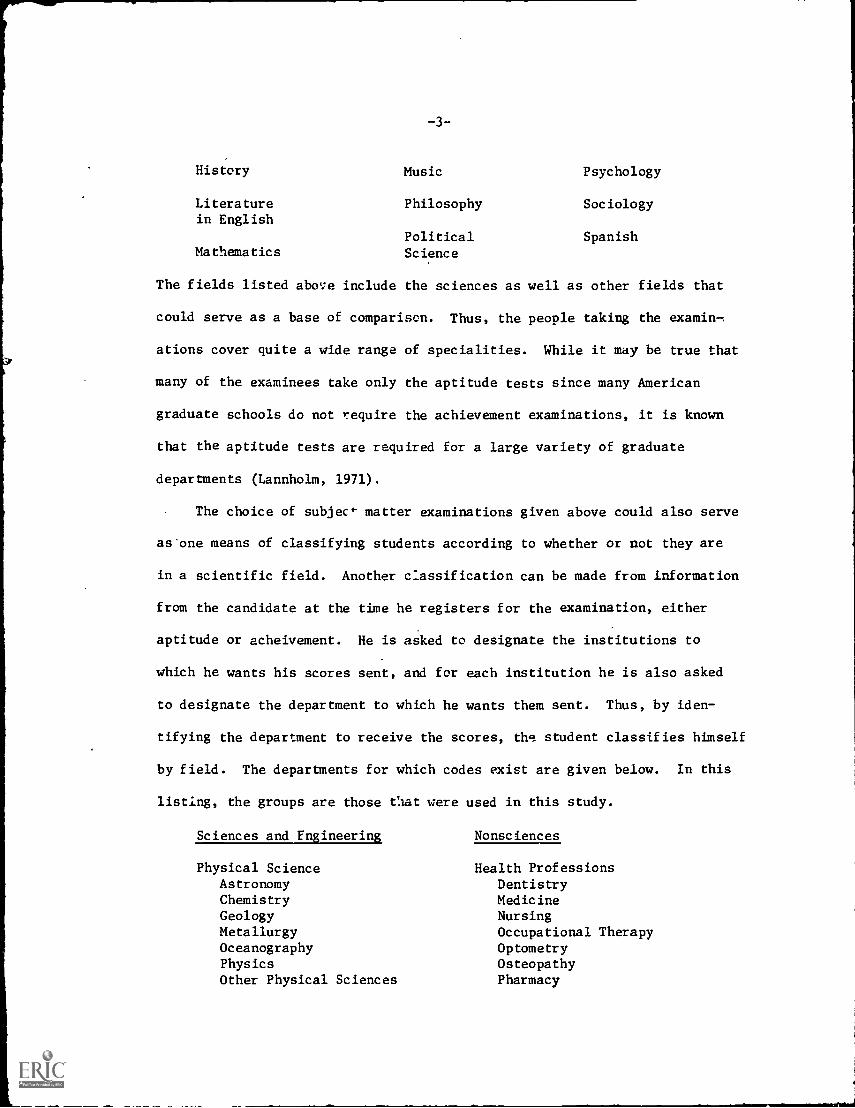
The choice of subjeo- matter examinations given above could also serve
as'one means of classifying students according to whether or not they are
in a scientific field. Another c:assification can be made from information
from the candidate at the time he registers for the examination, either
aptitude or acheivement. He is asked to designate the institutions to
which he wants his scores sent, and for each institution he is also asked
to designate the department to which he wants them sent. Thus, by iden-
tifying the department to receive the scores, the student classifies himself
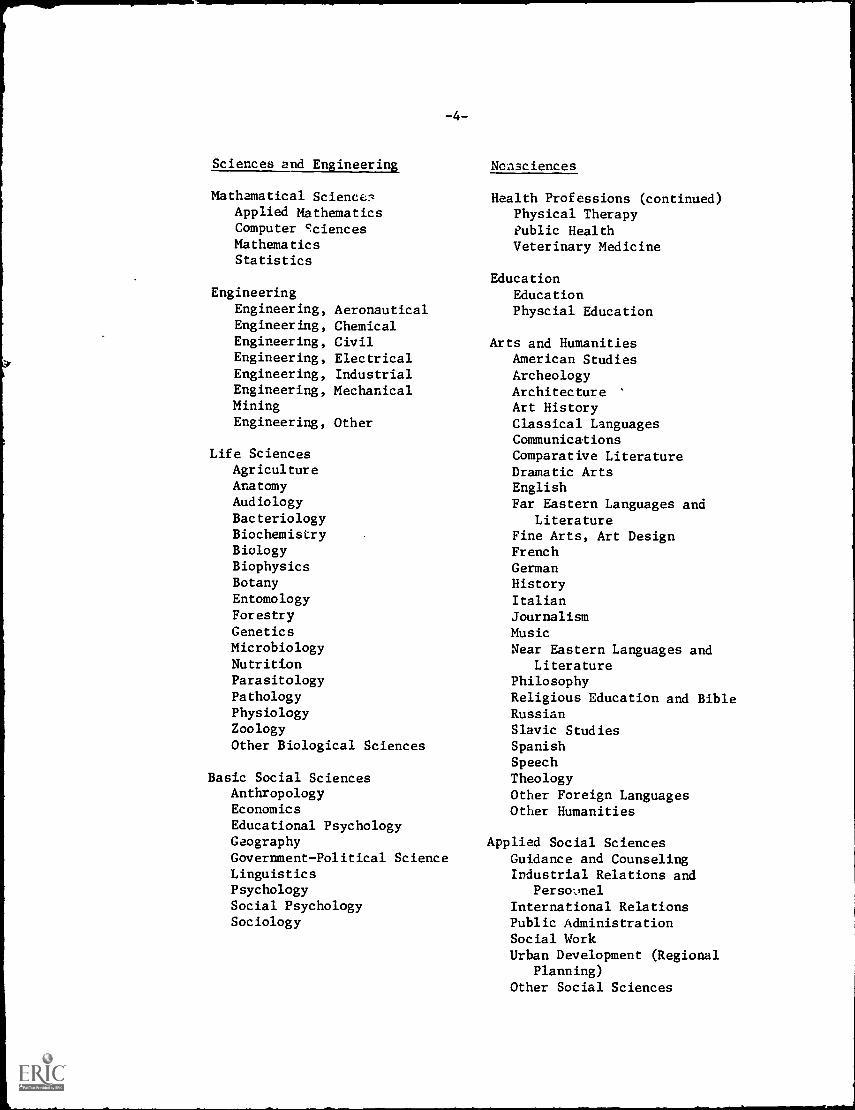
by field. The departments for which codes exist are given below. In this
listing, the groups are those that were used in this study.
Sciences and Engineering
Physical ScienceAstronomyChemistryGeologyMetallurgyOceanographyPhysicsOther Physical Sciences
Nonsciences
Health ProfessionsDentistryMedicineNursingOccupational TherapyOptometryOsteopathyPharmacy
-4-
Sciences and Engineering
Mathematical SciencesApplied MathematicsComputer SciencesMathematicsStatistics
EngineeringEngineering,Engineering,
Engineering,Engineering,
Engineering,Engineering,MiningEngineering,
AeronauticalChemicalCivilElectricalIndustrialMechanical
Other
Life SciencesAgricultureAnatomyAudiologyBacteriologyBiochemistryBiologyBiophysicsBotanyEntomologyForestryGeneticsMicrobiologyNutritionParasitologyPathologyPhysiologyZoologyOther Biological Sciences
Basic Social SciencesAnthropologyEconomics
Educational PsychologyGeography
Government-Political ScienceLinguisticsPsychologySocial PsychologySociology
Nensciences
Health Professions (continued)Physical TherapyPublic HealthVeterinary Medicine
EducationEducationPhyscial Education
Arts and Humanities
American StudiesArcheologyArchitecture '
Art HistoryClassical LanguagesCommunicationsComparative LiteratureDramatic ArtsEnglishFar Eastern Languages and
LiteratureFine Arts, Art DesignFrenchGermanHistoryItalianJournalismMusicNear Eastern Languages and
LiteraturePhilosophy
Religious Education and BibleRussianSlavic StudiesSpanishSpeechTheologyOther Foreign LanguagesOther Humanities
Applied Social SciencesGuidance and CounselingIndustrial Relations and
PersovnelInternational RelationsPublic AdministrationSocial WorkUrban Development (Regional
Planning)Other Social Sciences
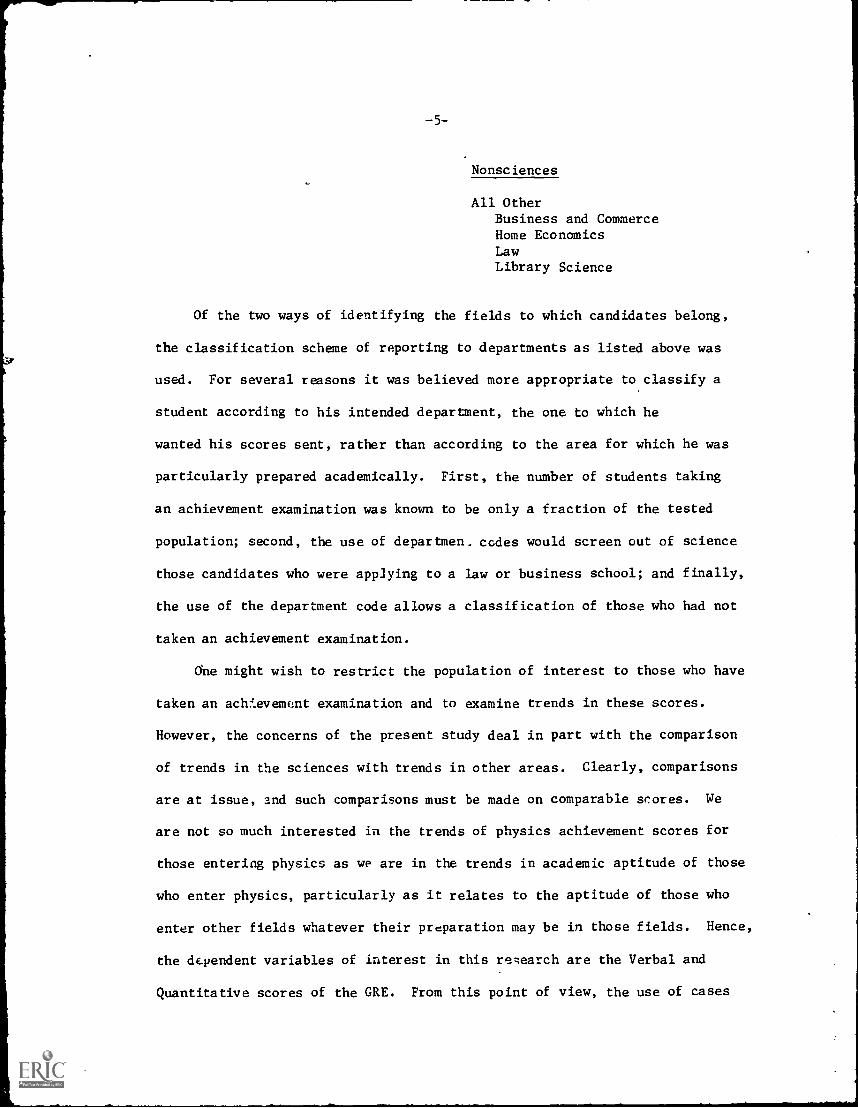
-5-
Nonsciences
All OtherBusiness and CommerceHome EconomicsLawLibrary Science
Of the two ways of identifying the fields to which candidates belong,
the classification scheme of reporting to departments as listed above was
used. For several reasons it was believed more appropriate to classify a
student according to his intended department, the one to which he
wanted his scores sent, rather than according to the area for which he was
particularly prepared academically. First, the number of students taking
an achievement examination was known to be only a fraction of the tested
population; second, the use of departmen. codes would screen out of science
those candidates who were applying to a law or business school; and finally,
the use of the department code allows a classification of those who had not
taken an achievement examination.
One might wish to restrict the population of interest to those who have
taken an achievement examination and to examine trends in these scores.
However, the concerns of the present study deal in part with the comparison
of trends in the sciences with trends in other areas. Clearly, comparisons
are at issue, and such comparisons must be made on comparable scores. We
are not so much interested in the trends of physics achievement scores for
those entering physics as we are in the trends in academic aptitude of those
who enter physics, particularly as it relates to the aptitude of those who
enter other fields whatever their preparation may be in those fields. Hence,
the dependent variables of interest in this re;earch are the Verbal and
Quantitative scores of the GRE. From this point of view, the use of cases
-6-
who have not taken the advanced examinations is quite justified, and the
use of the departmental code as an indicator of the major field is appropriate.
The GRE Population
The purpose of the GRE is to provide to a graduate school evidence that
the candidate seeking admission has the aptitude for graduate st "dy and has
achieved a mastery of the subject matter relevant to his intended field of
study, or at least of some subject matter material which is related to his
undergraduate field of study. There has been occasional discussion of the
desireability of making the examination useful for hiring purposes by supply-
ing scores to potential employers. However, an explicit policy that scores
will not be made available for that purpose, even at the candidate's request,
exists. The only purpose for which the examinations are intended, and the
only provision for score submission, is that of admissions to graduate school.
In order to provide an adequate service to the candidate and his potential
graduate school, a candidate's scores are supplied to score users as the
candidate requests within the administrative policy of the testing program.
Scores are also recorded on magnetic tape along with information which
identifies the candidate and gives a record of his test-taking history and
a partial record of the departments to which his scores have been sent.
The latter record is not complete because it is used only yearly in the course
of regular test program operations, and to store more than is needed on a
regular basis would expand a tape file which is already unwieldy. Also, there
is an erasing of a candidate's department codes in the event that he takes an
examination at more than one sitting. The reasons for this erasure are
unrelated to the purposes of this study are are related to the program
policies regarding score report". What is important for this study is that
-7-
the department codes available to the researcher for classifying a candidate
are those supplied by him at his last sitting if that sitting occurred- within
the fiscal year. Shortly after the beginning of a new fiscal year, certain
information is lost, among which is the department codes for any testing
during the preceding fiscal year.
The files of interest to this study are developed from the history files
preserved for the convenience of candidates who may wait to supply scores to
some institution not designated at the time of the candidate's initial
registration for the examination. The GRE history file does not constitute
a complete history of all GRE testing for the obvious reason that the size
of such a file would render it completely impractical. The file, therefore,
is reconstituted each fiscal year. In carrying out this reconstitution, only
those cases are retained for which there has been activity for the preceding
three fiscal years. Thus, the new file created as of June 30, 1972, contains
those cases tested during the period June 30, 1969, to June 30, 1972. The
file from which this new file is copied contains the information from June 30,
1968, through June 30, 1972, however, and the information on the period
June 30, 1971, to June 30, 1972, contains department code information since
the entries made during that fiscal year were not yet purged in this recon-
stitution process. For this reason, the sampling frame was taken as all those
records for a fiscal year for which there was department code information and
for which aptitude scores exist.
Originally it was intended to stratify the frame by year of graduation
since, even though the cases are obtained by fiscal year of testing, the
classification of most direct interest is that of candidates who would be
part of the same cohort. That is, the study is interested in the scores of
-8-
people who would appear at the graduate schools by year, rather than in a
grouping by year tested. However, the testing year was adopted as the
variable to be used for classification in this study because of the difficulty
of constituting:comparablP groups by year of expected college graduation.
The difficulty referred to stems from two factors: first, the testing years
studied, though adjacent, must obviously have a most recent and a first year,
and though the middle years studied may be fairly well represented by people
tested juniors, say, from the year before, the earliest year will not have
people who were tested as juniors the year before. Second, the more important
factor which places a limit on the value of the year of graduation is that
there had been some incompleteness of the historical cRE files so that data
from the fiscal years 1968-1969 and 1969-1970 were unuseable. Thus the end
effect noted for the data from the first fiscal year would be repeated in
the data from fiscal year 1970-1971. In all, four fiscal years of testing
data were available, and these were 1966-1967, 1967-1968, 1970-1971, and
1971-1972. With the loss of the middle two years, it was felt that the
reconstruction of data to represent cohorts would be completely impractical,
and it was decided that the sample would be taken by testing year. Although
the division by year is not the best possible, it should reflect marked trends
in the data which might be more closely related to year of graduation and is
at least an operationally reproducable criterion for classifying data that
might be related to year of the graduation at some time when suitable data
become available.
Prior to 1966-1967, the data were unuseable primarily because of the
age of the tapes and the use of different formats for collecting the depart-
mental codes. These differences in format are crucial since the data in the
-9-
first half of the decade are, in fact, stored on microfilm so that with a
sufficient expenditure of time and money they could be made accessible.
However, the means of classifying students into major departments would not
be comparable from year to year. Indeed, the department codes collected for
candidates tested in 1966-1967 were obtained under somewha' t instruc-
tions from those for subsequent years, though these data are included in the
present study. Those early instructions merely asked the candidate to tell
his expected major department without telling him that the information would
be used to indicate a destination for his scores. Beginning in 1967-1968
the department codes were identified and used as a part of the instructions
for sending score reports. However, it was not felt that the slight change
in instructions would materially effect the results of the study, and in any
case differences im the 1966-1967 data from the data in other years could be
noted with the interpretation of results. With the selection of the four
years of data, the means of identifying the graduate department, and the
choice of the aptitude test scores as dependent variables, the specification
of the population of interest in this study is completed.
Score Comparability
One additional point should be made concerning the comparability over
years of the aptitude test scores. Those familiar with the GRE aptituea
tests know that the actual questions which comprise the GRE aptitude tests
-re not always the same. Every year, in fact, a completely different GRE
Verbal Test (GRE-V) and GRE Quantitative Test (GRE-Q) are constructed and
administered as part of the opeational testing pro --m. This is necessary
as a precaution against the possible compromise of the tests and is a feature
of a number of testing programs which provide data that bear on admissions

-10-
decisions and which must be available on a large scale. However, the change
of test items introduces a need or some means of assuring that scores obtained
on differ forts of the test a:e comparable because candidates who have
taken different questions will receive scores that purport to be comparable.
To meet this need a procedure celled "score equating" is implemented with
each introduction of a new form. In intent, the procedure used for the GRE
aptitude examinations is to develop two similar populations that are repre-
sentative of the tested population and transform the fromula scores (the
formula is the number right minus one-fourth the number wrong) so that they
have the same average and standard deviation in the sample who took the new
test as the scores obtained ca the sample who took the old test. To produce
the two matched samples a practice called "spiralling" has been adopted in
which new forms are alternated in the test shipments. That is, when the
tests are actually handed out at the testing center, after the students are
seated and have no further opportunity to change seating arrangements, the
adjacent students actually take different examinations. In this way the
two halves of the populations are considered to be quite comparable, and the
sizes of the populations involved are so large (on the order of tens of
thousands) that random errors of sampling are negligible. Then, given the
scores on the GRE scale from the old form and the raw scores from the new
form, the formulae given by Gulliksen (1950, p. 274) may be used to get
constants for converting raw scores on the new form to scores on the GRE
scale. A more complete discussion of this procedure is given by Angoff
(1971, p. 578 and beyond).
Brief Statement of Purpose
Concern that economic conditions might discourage the most able students
from undertaking careers in science motivates an examination of aptitude
trends in the sciences. It would be desireable to obtain an actual sampling
of entering students over the years to detect trends in aptitude, but such
a survey is impractical. It is, therefore, intended in this study to examine
aptitude averages of students who indicated an intention to study in science
departments and those of students whose intended fields of study were in
nonscience areas. The data to be used are taken from the GRE aptitude scores
of candidates tested in fiscal years 1966-1967, 1967-1968, 1970-1971, and
1971-1972, which are readily available in the history files of the GRE test
program.
Sample
A preliminary examination of the historical data was deemed necessary
for the following reasons. First, one can see by inspection of the list of
possible graduate departments that the number of subjects by which a candidate
might be classified is potentially quite large. Thus, an attempt to study
trends by department would require a huge sample in order to get enough cases
for any reliance on the statistics of a department, and, failing a study by
department, a classification of departments is necessary so that there would
be a sufficient number of cases at least by Hype of department. Second,
there is a known source of confusion in the information supplied by candidates
about the department to which the score reports are to be supplied. This
confusion results from the fact that some candidates may mistakenly use the
source list for advanced test codes as the key to the department codes.
Since all of the test codes correspond with a department code, if the coded
number is one of those on the test code list, there is no cue whether the
source of the number was the department code list or the test code list.
-12-
If it came from the test code list, it is an error. For determining the
extent of such errors, a sample of historical data was also needed.
Accordingly a sample of five thousand cases was selected from the
1970-1971 historical tape file. The cases were sorted by the configuration
of department codes, and the number of cases for each configuration was
counted. The configurations referred to arise because a number of candidates
have their scores sent to more than one graduate department. Clearly, the
sampling plan would need to take such multiple applications into account,
and their existence is a third reason for the preliminary sample. Examin-
ation of the tape indicated that in no more than 15% of the cases had more
than two kinds of departments been designated and that in most cases the
departments designated came from the.same groups used in the classifications
defining the groups of departments. Furthermore, since note of the groups
used were essentially empty, the sample indicated that eacl- group would be
well represented. Examination of the cases where a department code was the
same as an advanced test code indicated that, in instances of multiple
classification of a candidate in terms of the types of departments to
receive scores, the test code was more consistent with other departments
indicated than was the department code. For example, a candidate might have
taken the chemistry test, test code 27, and have indicated department codes
27 and 64. However, as a department code, 27 is American Studies and 64 is
Chemical Engineering. Rather than believe that the candidate took the
Chemistry Test and then wished his grades to be sent to an American Studies
department as well as a department of Chemical Engineering, it seems more
reasonable to suppose that the department code 27 is an uncorrected error
made by using the Chemistry Test code:in the department code space. It is
...
-13-
the agreement between the substantive interpretation of the 64 as a
department code and the 27 as a test code that leads one to believe that
the copying error has occurred. Such agreement was found in all other
cases of obvious disparity between types of departments coded when one of
the codes was identical to a test code. Accordingly, it was concluded that
indeed such errors were being made. However, since these errors were noted
in less than 1% of the cases, it was concluded that, although such an error
was occurring, its occurrence was not in sufficient quantity to have an
appreciable effect on the study.
The considerations noted above led to the conclusion that a simple
sampling rate would be sufficient to yield the required sample. Accordingly,
a one to fifteen sampling was made, and then all cases with a missing aptitude
score or no departmental designation were eliminated. For each candidate
the group of each department code was recorded, the candidates were sorted
on the configuration of the group codes, and counts were given for each
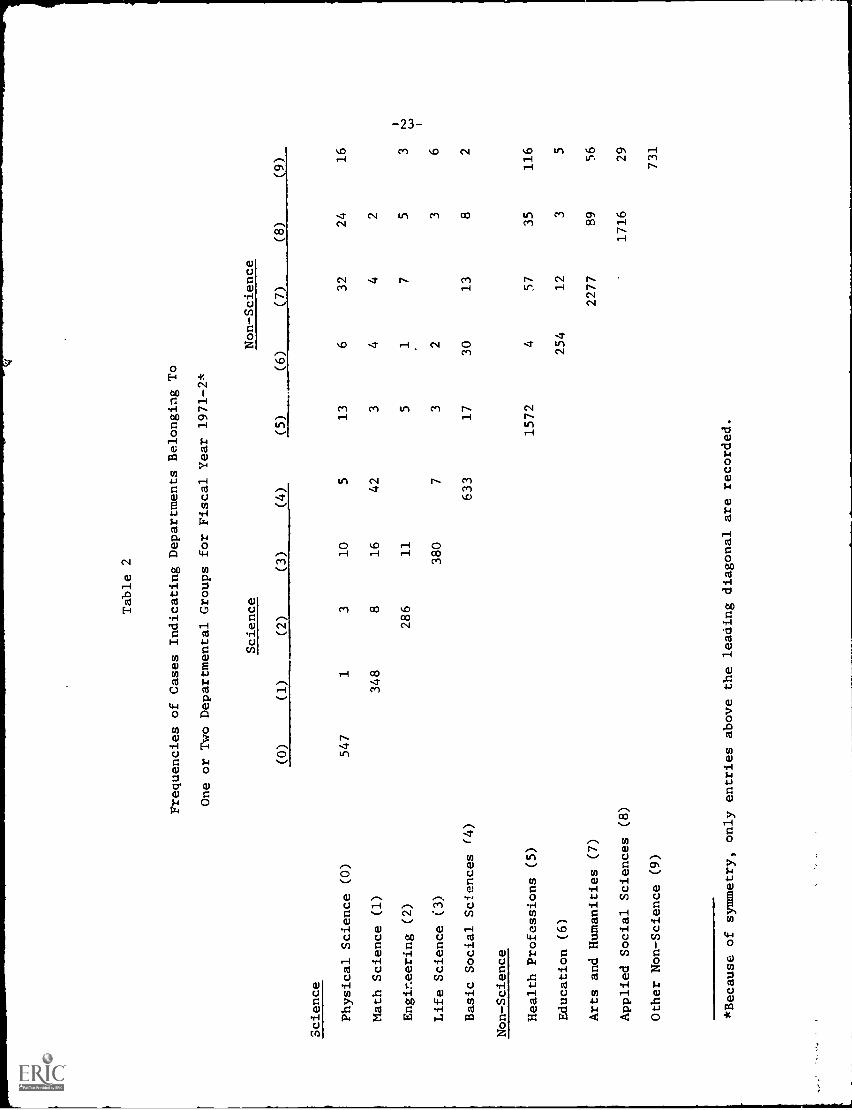
configuration. This was done for the years 1970-1971 and 1971-1972. For
both of these years, the data on persons indicating departments from one
or two groups are tabulated in Tables 1 and 2, respectively. The diagonal
entries of these tables give the number of cases for which one group only
was indicateJ; the off diagonals are for cases where two groups were indicated.
Note that the tables are highly dominated by the diagonals which account for
93% of Table 1 and 92% of Table 2. For 1970-1971, there were 84 candidates
with more than two groups indicated, leaving the number of candidates indi-
cating departments in only one group constituting 91% of the cases. For
1971-1972, the number of candidates indicating departments in only one grOup
constituted 92% of the total group, including 53 candidates who had indicated
departments in more than two groups.
-14-
At the outset of this project, it was not known to what extent application
to different departments or types of departments is common. It appears that
a small minority of the students make such application, but it is not common
by any means. Furthermore, it is certainly not clear how to categorize a
student who makes such classification, for the purposes of this study.
Therefore, the students who have made such multiple applications are omitted,
and this study focuses on the more than 90% who stay within one departmental
group.
Results
With the exclusions of cases with multiple group application, the
remaining students are the subject of this study. Table 3, which gives the
data on which the results of this study are based, contains by departmental
group and by year the number of cases, means, and standard deviations for both
Verbal and Quantitative scores, as well as the correlations between these
scores. Variation in the means will be discussed below, but a salient
feature of the standard deviations should be mentioned here. The comparison
of standard deviations for Verbal and Quantitative scores for 1966-1967
indicates that for the physical science, math, and engineering the standard
deviation for the Quantitative score is in excess of that for the Verbal
score, but for the other years under study the reverse is true. This result
is not in agreement with one's expectations since the quantitative subjects
tend to draw people who excell in quantitative ability; their average
Quantitative scores are higher and the range of Quantitative scores is
usually restricted, as is shown in Table 3 for fiscal years 1967-1968,
1970-1971, and 1971-1972. One may also note the reversal of Verbal and
Quantitative means for the math science and engineering groups in fiscal
year 1966-1967 compared to those means for physical science in that year,
or for any of the groups in the other years.
-15-
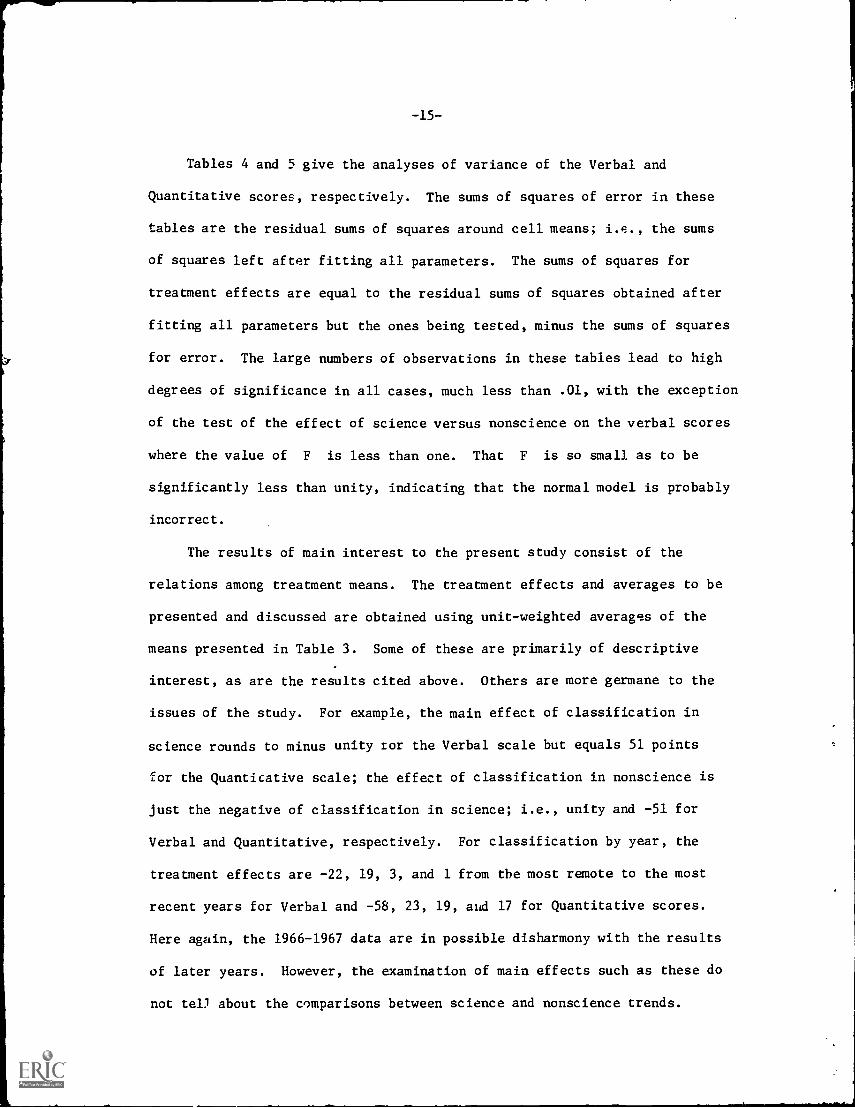
Tables 4 and 5 give the analyses of variance of the Verbal and
Quantitative scores, respectively. The sums of squares of error in these
tables are the residual sums of squares around cell means; i.e., the sums
of squares left after fitting all parameters. The sums of squares for
treatment effects are equal to the residual sums of squares obtained after
fitting all parameters but the ones being tested, minus the sums of squares
for error. The large numbers of observations in these tables lead to high
degrees of significance in all cases, much less than .01, with the exception
of the test of the effect of science versus nonscience on the verbal scores
where the value of F is less than one. That F is so small as to be
significantly less than unity, indicating that the normal model is probably
incorrect.
The results of main interest to the present study consist of the
relations among treatment means. The treatment effects and averages to be
presented and discussed are obtained using unit-weighted averages of the
means presented in Table 3. Some of these are primarily of descriptive
interest, as are the results cited above. Others are more germane to the
issues of the study. For example, the main effect of classification in
science rounds to minus unity tor the Verbal scale but equals 51 points
for the Quantitative scale; the effect of classification in nonscience is
just the negative of classification in science; i.e., unity and -51 for
Verbal and Quantitative, respectively. For classification by year, the
treatment effects are -22, 19, 3, and 1 from the most remote to the most
recent years for Verbal and -58, 23, 19, aid 17 for Quantitative scores.
Here again, the 1966-1967 data are in possible disharmony with the results
of later years. However, the examination of main effects such as these do
not tell about the comparisons between science and nonscience trends.
-16-
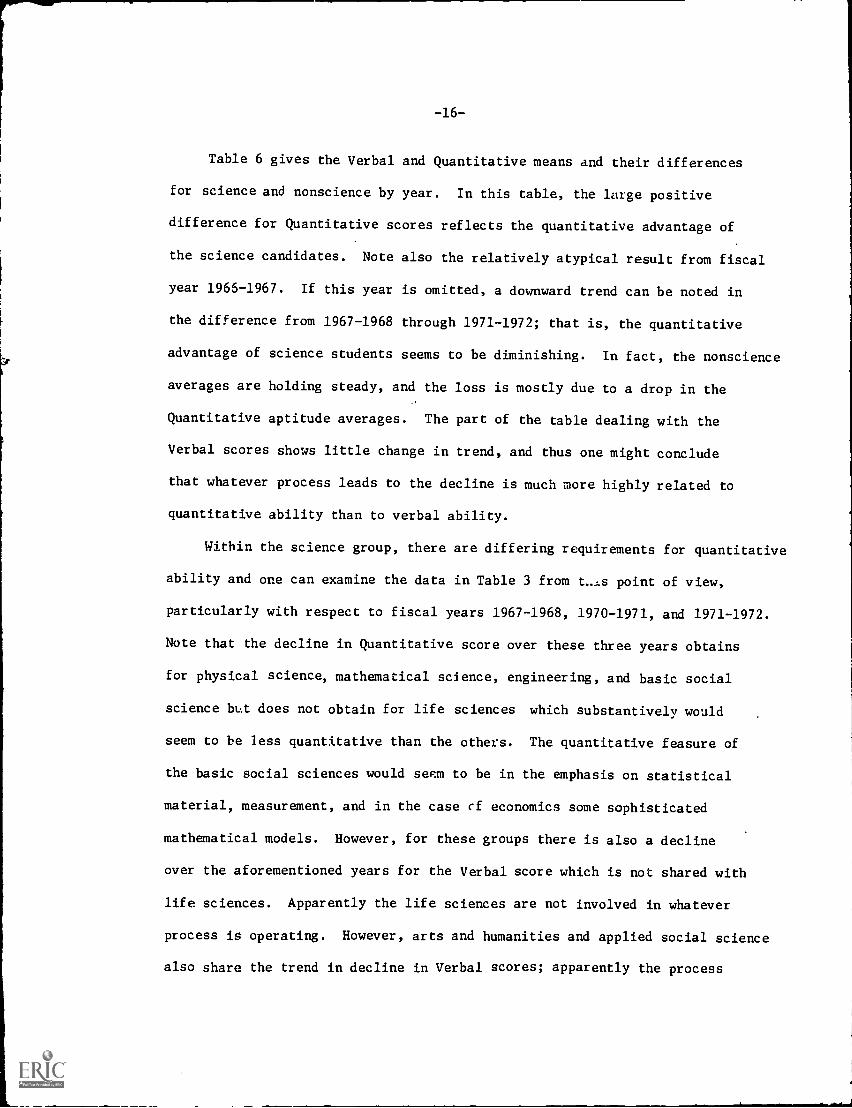
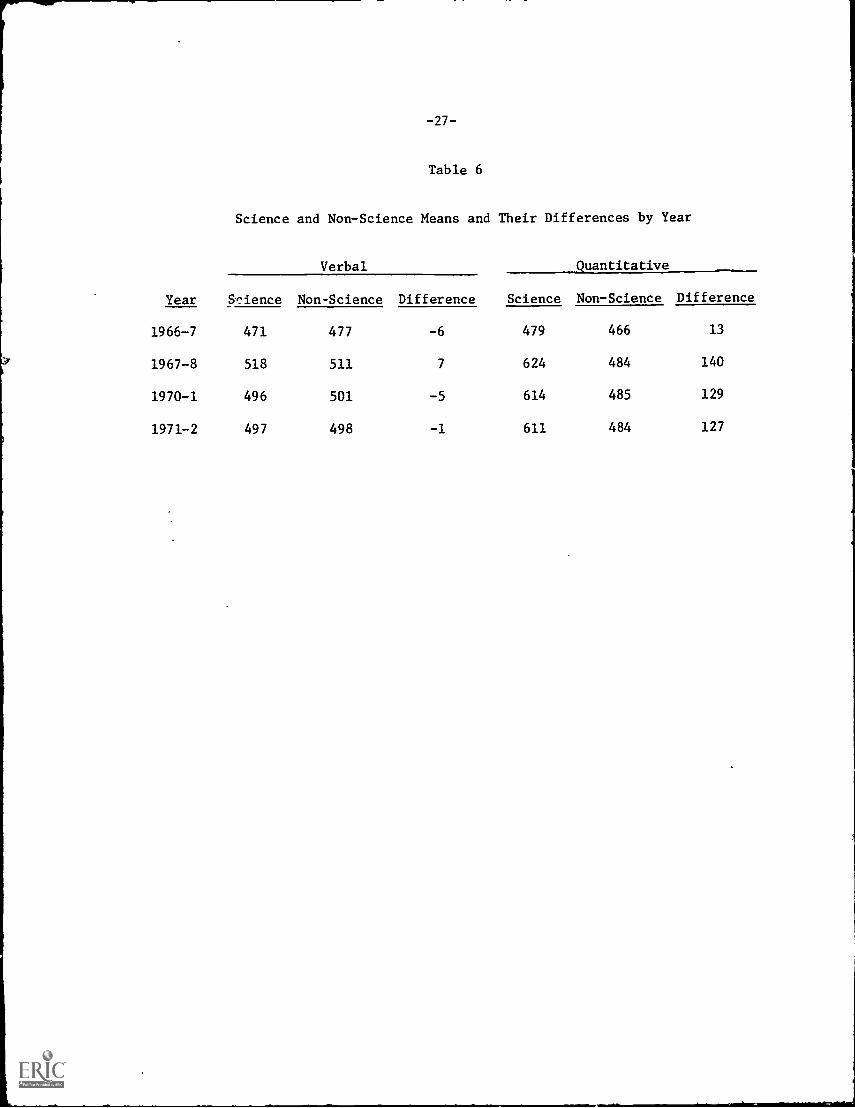
Table 6 gives the Verbal and Quantitative means and their differences
for science and nonscience by year. In this table, the large positive
difference for Quantitative scores reflects the quantitative advantage of
the science candidates. Note also the relatively atypical result from fiscal
year 1965 -1967. If this year is omitted, a downward trend can be noted in
the difference from 1967-1968 through 1971-1972; that is, the quantitative
advantage of science students seems to be diminishing. In fact, the nonscience
averages are holding steady, and the loss is mostly due to a drop in the
Quantitative aptitude averages. The part of the table dealing with the
Verbal scores shows little change in trend, and thus one might conclude
that whatever process leads to the decline is much more highly related to
quantitative ability than to verbal ability.
Within the science group, there are differing requirements for quantitative
ability and one can examine the data in Table 3 from t...Ls point of view,
particularly with respect to fiscal years 1967-1968, 1970-1971, and 1971-1972.
Note that the decline in Quantitative score over these three years obtains
for physical science, mathematical science, engineering, and basic social
science but does not obtain for life sciences which substantively would
seem to be less quantitative than the others. The quantitative feasure of
the basic social sciences would se'm to be in the emphasis on statistical
material, measurement, and in the case et economics some sophisticated
mathematical models. However, for these groups there is also a decline
over the aforementioned years for the Verbal score which is not shared with
life sciences. Apparently the life sciences are not involved in whatever
process is operating. However, arts and humanities and applied social science
also share the trend in decline in Verbal scores; apparently the process
-17-
producing the trend is not restricted to basic science and is not restricted
to fields with a strong quantitative component though the effect is strongest
in physical science, mathematical science, and engineering.
Discussion
At the outset of this study, the data from fiscal year 1966-1967 were
included because it was felt that certain differences in the way of collecting
departmental designations would not affect the purposes of the present study.
This decision was made on a priori grounds, and indeed it seems hart", to
question that decision on purely rational grounds. However, irregularities
were pointed out in the data in Table 3--irregularities which occur in almost
no other major set of GRE data. Other irregularities in Table 3 bear directly
on the interpretation of the results of the study; that is, that all of the
means for 1966-1967 are depressed relative to the others, and markedly so.
One might be inclined to conclude that the means from 1967-1968 Are erroneous
and that there is a trend for increasing means (and hence no problem with the
people choosing science as a career), that the 1966-1967 data are erroneous
and there is a trend for decreasing means, or that neither is erroneous and
there have been some unexplained changes in the mid-sixties with a current
declining trend. The author's predilection is to question the correctness
of the 1966-1967 sampling, though it is not at all clear what went wrong.
and to accept the apparent internal consistency of the data from 1967-1968
on.
Declining trends were noted for physical science, mathematical scinece,
engineering, and basic social scinece. The trends were much stronger for
Quantitative than for Verbal scores for the first three groups. Similar
trends were noted for arts and humanities and applied social science, though
the trends there are stronger for Verbal aptitude.
-18-
Suggested Research
Though the present study is certainly not definitive as to the cause
of these trends, the results clearly agree with the original speculation
that such trends might exist in the science areas and indeed are not limited
to them. For this reason, further research would seem warranted which would
verify the existance of the phenomenon and which might inquire into its
causes. The present study suffers from a number of limitations including,
for example, the fact that the use of departmental designation as a desig-
nation of field is an indication of the student's educational plan, or
perhaps his provision for one possible course of his future. It is not known
whether he actually applied, if he was admitted, and if admitted whether he
enrolled. It is not known whether this group that took the GRE is actually
representative of the group that applies and goes to graduate school, or how
different it is from such a group. It is not known whether the trend noted
is a continuing one or a temporary one attributable to a "good" year in
1967-1968. Finally, it is not why the students make the choices that they
do, and why they make them differently from one year to the next.
To answer these questions, three sources of data are suggested for
further examination. The first of these is the continuation of the type
of data collection and analysis which has occurred in the present study.
The use of the year-end history file seems like a simple and useful alternative.
One would not expect access to these data to be beset with the difficulties
encountered in accomplishing the present study because the tapes will be
new and the application can be included in operational planning. The analysis
is simple, including as it does a minimum of emphasis on complex hypothesis
testing procedures and a maximum of emphasis on simple descript!ve procedures.
-19-
It should be pointed out that a variety of additional information is currently
available on the students or could be collected to facilitate more informa-
tive analyses. The analyses could be done yearly as the period of the trends
of interest would seem to be well in excess of a year. It is questionable
whether a shorter term effect would have an impact of any seriousness on
science, or indeed whether agencies that might act to counteract changes in
the aptitude trends could do so on a schedule that would have their effect
within less than a year.
A second source of information would be a check on whether monitoring
the condition of the GRE file data provides a valid indication of the aptitude
trends in the GRE, graduate-school-go_ng population. For this, a follow-up
study of at least a sample of the students whose data appear in the history
file would be needed. Currently available are the university to which they
applied and the relevant department. These potential recipients of the
candidates' applications could be questioned about the subsequent careers
of the candidates, at least with respect to their institutions. Also avail-
able in the history file is an address for the candidate which was valid at
least at the time of the testing and could be used as a place to get information
about his current whereabouts. Of course, there is also a record of his
undergraduate institution which might have a current address for him. When
he is located, he could be approached for information about his subsequent
educational experience, and his scores could be reclassified for an analysis
similar to one done on the data taken directly from the history file.
Agreement of the data on the follow-up students would lend credibility to
findings available from the data taken from information in the history file.
-20-
Universities in which some students are admitted with GRE scores and
others without GRE scores might be a third source of data. It is known that,
even where GRE scores are required, not all students actually submit them,
and in many places the submission of scores is voluntary. One could obtain
from these departments an indication of the standing of the candidates
employing GRE scores with respect to others in the department. A shift in
these relative standings over time might indicate a national trend which is
not in harmony with that indicated in the GRE data, whereas agreement in
trends would lend credibility to the history file results.
-21-
REFERENCES
r.
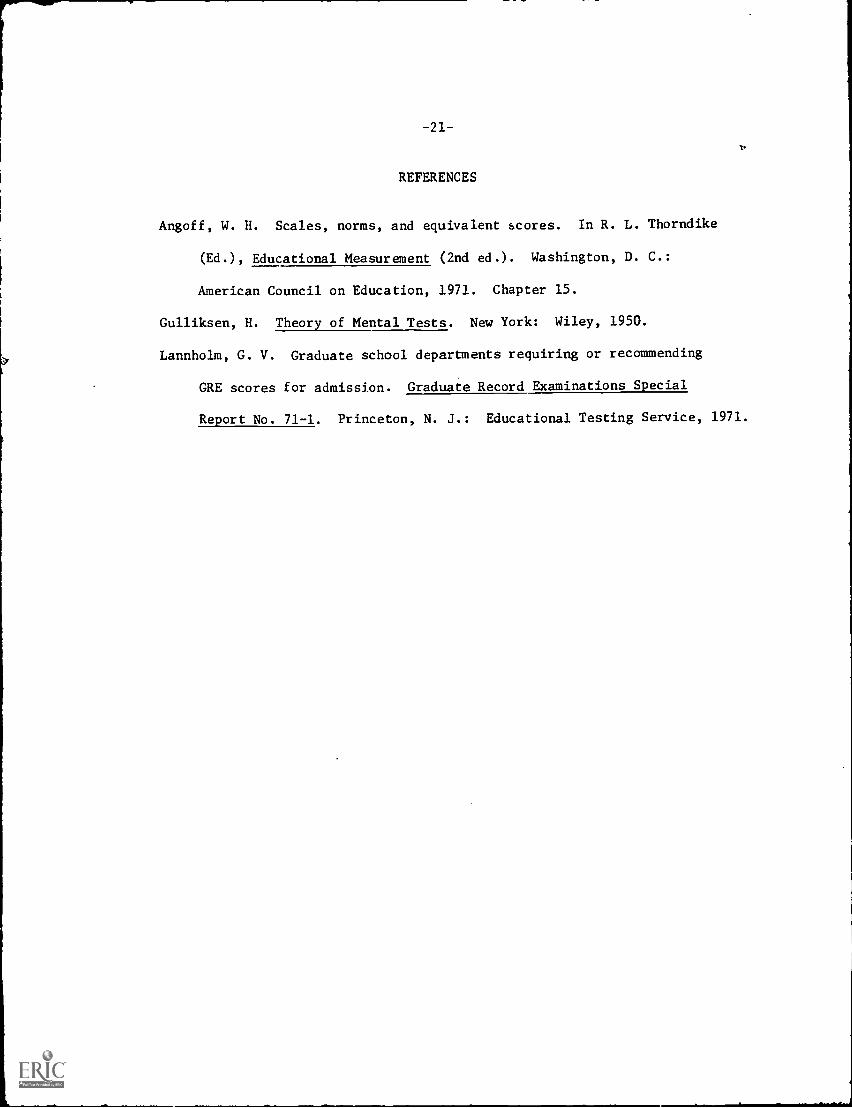
Angoff, W. H. Scales, norms, and equivalent scores. In R. L. Thorndike
(Ed.), Educational Measurement (2nd ed.). Washington, D. C.:
American Council on Education, 1971. Chapter 15.
Gulliksen, H. Theory of Mental Tests. New York: Wiley, 1950.
Lannholm, G. V. Graduate school departments requiring or recommending
GRE scores for admission. Graduate Record Examinations Special
Report No. 71-1. Princeton, N. J.: Educational Testing Service, 1971.
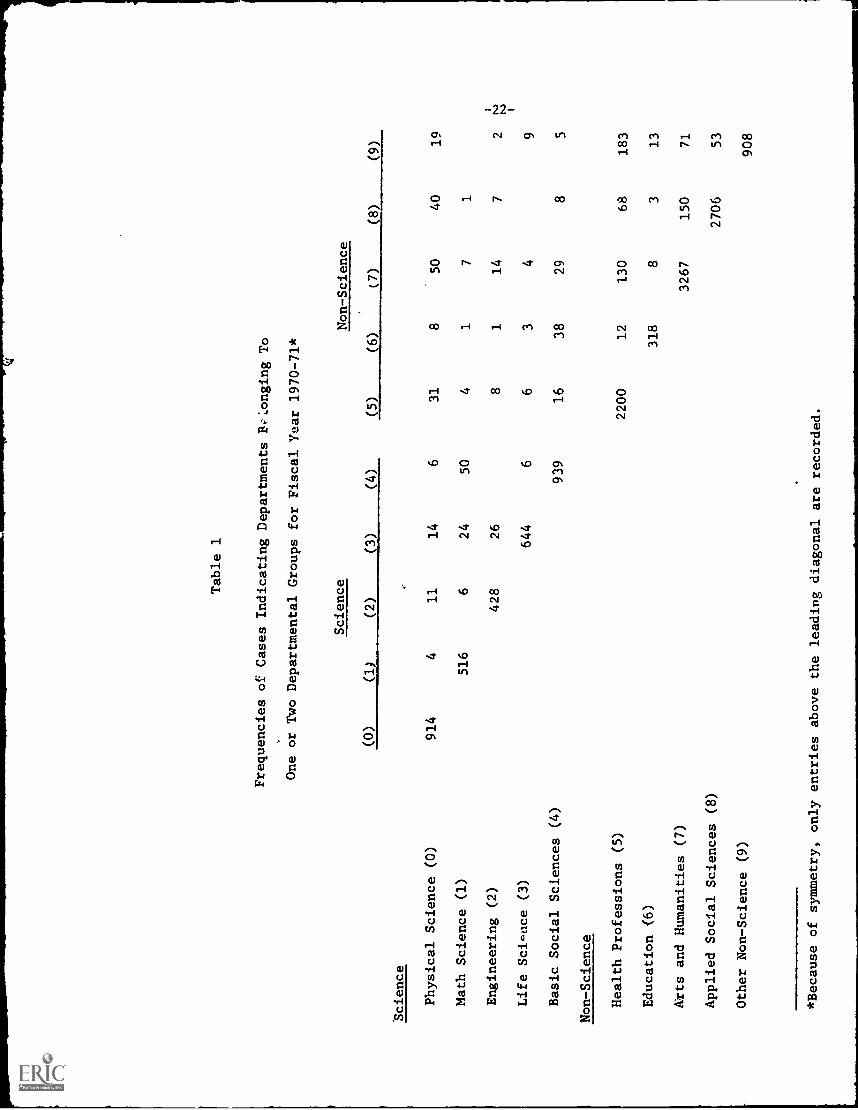
Table 1
Frequencies of Cases Indicating Departments Bi'Longing To
One or Two Departmental Groups for Fiscal Year 1970-71*
Science
Non-Science
(8)
(9)
(0)
(1)
(2)
(3)
(4)
(5)
(6)
(7)
Science
Physical Science (0)
914
411
14
631
850
40
19
Math Science (1)
516
624
50
41
71
Engineering (2)
428
26
81
14
72
ts-) N
Life Scic.ace (3)
644
66
34
9
Basic Social Sciences (4)
939
16
38
29
85
Non-Science
Health Professions (5)
2200
12
130
68
183
Education <6)
318
83
13
Arts and Humanities (7)
3267
150
71
Applied Social Sciences (8)
2706
53
Other Non-Science (9)
908
*Because of symmetry, only entries above the leading diagonalare recorded.
Frequencies of Cases Indicating Departments Belonging To
One or Two Departmental Groups for Fiscal Year 1971-2*
Science
Non-Science
(8)
(9)
(0)
(1)
(2)
(3)
(4)
(5)
(6)
(7)
Science
Physical Science (0)
547
13
10
513
632
24
16
Math Science (1)
348
816
42
34
42
Engineering (2)
286
11
51
75
3
Life Science (3)
380
73
23
6
Basic Social Sciences (4)
633
17
30
13
82
Non-Science
Health Professions (5)
1572
457
35
116
Education (6)
254
12
35
Arts and Humanities (7)
2277
89
56
Applied Social Sciences (8)
1716
29
Other Non-Science (9)
731
*Because of symmetry, only entries above the leading diagonal are recorded.
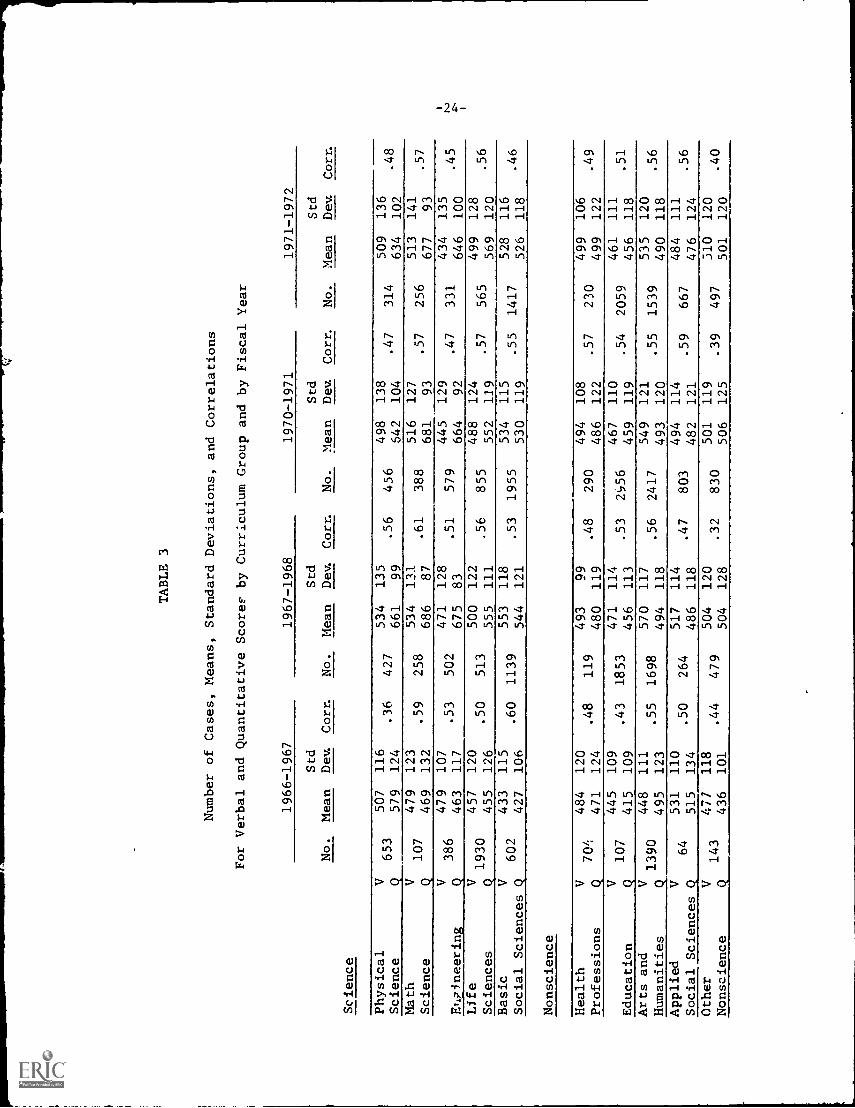
TABLE 3
Number of Cases, Means, Standard Deviations, and Correlations
For Verbal and Quantitative Score? by Curriculum
Group and by Fiscal Year
1966-1967
1967-1968
1970-1971
1971-1972
Std
Std
Std
Std
No.
Mean
Dem
Corr.
No.
Mean Dem
Corr.
No.
Mean
Dem
Corr.
No.
Mean
Dem
Corr.
Science
Physical
V653
.36
427
507
116
534
135
Science
Q579
124
661
99
Math
V479
123
534
131
107
.59
258
Science
Q469132 686 87
V386
479
107
.53
502
471
128
Et.pineering
Q463
117
675
83
Life
V1930
457
120
.50
513
500
122
Sciences
Q455
126
555
111
Basic
V602
.60
1139
433
115
553
118
Social Sciences Q
427
106
544
121
.56
456
.61
388
.51
579
.56
855
.53
1955
498
138
642
104
516
127
681
93
445
129
664
92
488
124
552
119
534
115
530
119
5. 47
314
509
136
634
102
5.57
256
513
141
677
93
4.47
331
434
135
646
100
4. 57
565
499
128
569
120
. 48
.57
. 45
. 56
. 55
1417
528
116
526
118
. 46
Nonscience
Health
V704
484
120
Professions
Q'
471
124
V107
445
109
Education
Q415
109
Arts and
v1390
448
111
Humanities
(2.
495
123
Applied
V64
531
110
Social Sciences Q
515
134
Other
V477
118
Nonscience
Q143
436
101
.48
119
493
99
480
119
471
114
456
113
570
117
494
118
517
114
486
118
504
120
504
128
.43
1853
.55
1698
.50
264
.44
479
4.48
290
494
108
486
122
. 53
2556
467
110
459
119
.56
2417
549
121
493
120
4.47
803
494
114
482
121
5. 32
830
501
119
506
125
4. 57
230
499
106
499
122
. 54
2059
461
111
456
118
.55
1539
535
120
490
118
484
111
476
124
510
120
501
120
59
667
39
497
. 49
.51
. 56
. 56
. 40
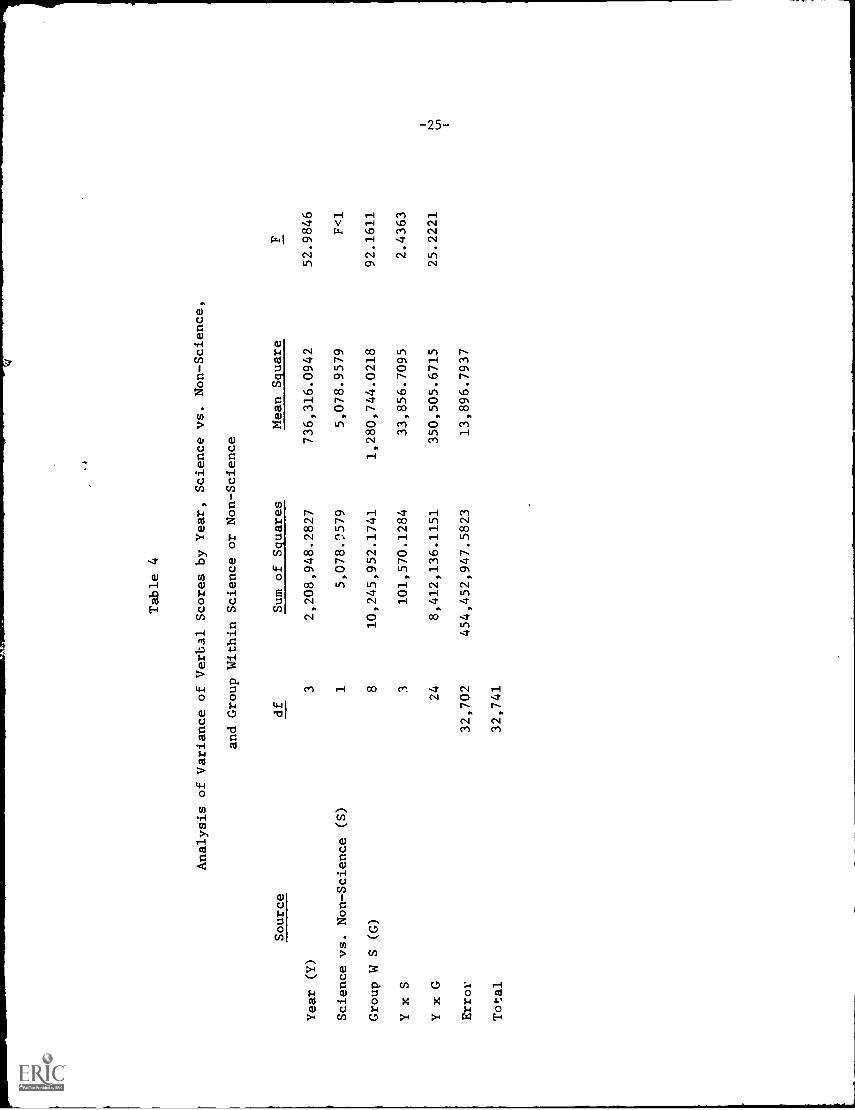
Table 4
Analysis of Variance of Verbal Scores by Year,
Science vs. Non-Science,
and Group Within Science or Non-Science
Source
df
Sum of Squares
Mean Square
F
Year (Y)
32,208,948.2827
736,316.0942
52.9846
Science vs. Non-Science (S)
15,078.9579
5,078.9579
F<1
Group W S (G)
810,245,952.1741
1,280,744.0218
92.1611
Y x S
3101,570.1284
33,856.7095
2.4363
Y x G
24
8,412,136.1151
350,505.6715
25.2221
Erro
32,702
454,452,947.5823
13,896.7937
Total
32,741
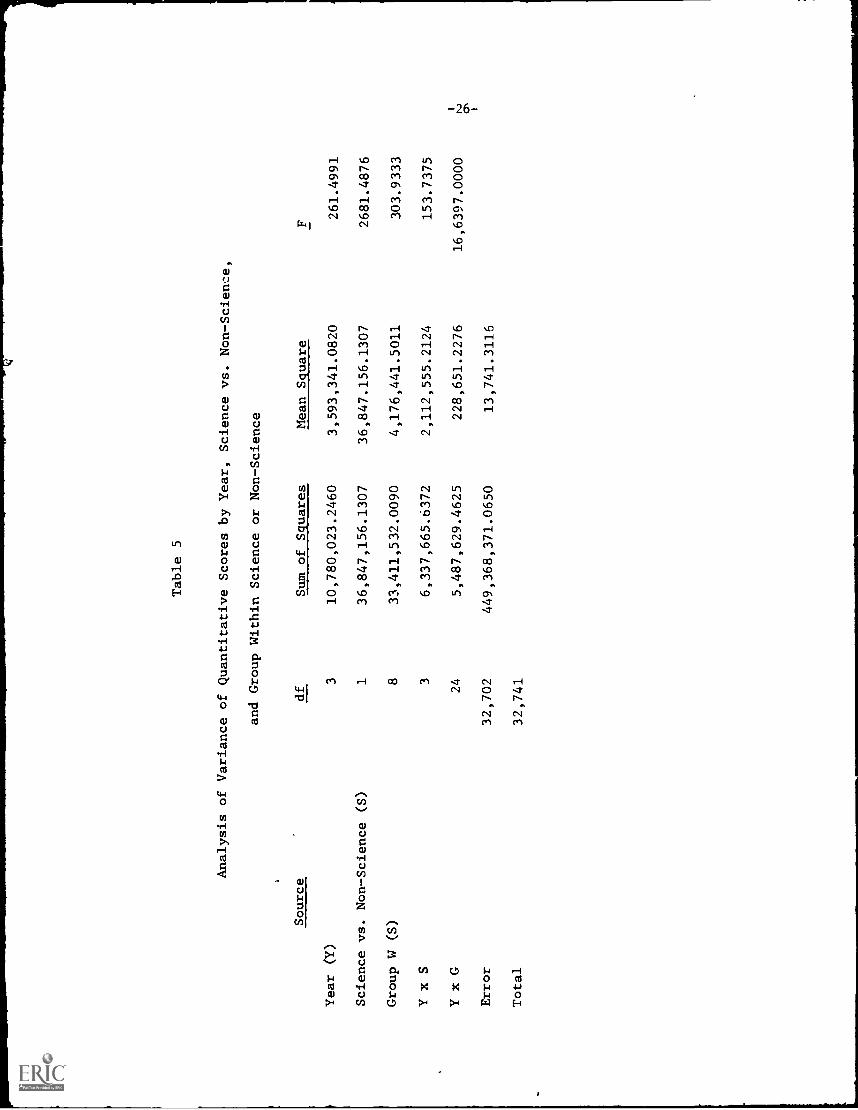
Table 5
Analysis of Variance of Quantitative Scores by Year, Sciencevs. Non-Science,
and Group Within Science or Non-Science
Source
df
Sum of Squares
Mean Square
F
Year (Y)
310,780,023.2460
3,593,341.0820
261.4991
Science vs. Non-Science (S)
136,847,156.1307
36,847.156.1307
2681.4876
Group W (S)
833,411,532.0090
4,176,441.5011
303.9333
Y x S
36,337,665.6372
2,112,555.2124
153.7375
Y x G
24
5,487,629.4625
228,651.2276
16,6397.0000
Error
32,702
449,368,371.0650
13,741.3116
Total
32,741
-27
Table 6
Science and Non-Science Means and Their Differences by Year
Year
Verbal Quantitative
Sr_sience Non-Science Difference Science Non-Science Difference
1966-7 471 477 -6 479 466 13
1967-8 518 511 7 624 484 140
1970-1 496 501 -5 614 485 129
1971-2 497 498 -1 611 484 127