Embed Size (px)
Citation preview
November 4, 2008
Document of the World Bank
Report N
o. 43906-CO
C
olombia
The Quality of Education in C
olombia
Report No. 43906-CO
ColombiaThe Quality of Education in ColombiaAn Analysis and Options for a Policy Agenda
Human Development Sector Management UnitLatin America and the Caribbean Regional Office
Pub
lic D
iscl
osur
e A
utho
rized
Pub
lic D
iscl
osur
e A
utho
rized
Pub
lic D
iscl
osur
e A
utho
rized
Pub
lic D
iscl
osur
e A
utho
rized
TABLE OF CONTENTS
.. Executive Summary ..................................................................................................................... vi1
CHAPTER 1 . THE COLOMBIAN EDUCATION SYSTEM 1 Sector Trends ........................................................................................................................... 1 Planning and Reform Efforts .................................................................................................... 3 Student assessment ................................................................................................................... 6 Conclusion ............................................................................................................................... 8
9 The Importance of Education Quality ...................................................................................... 9 Conceptual Framework ............................................................................................................ 9 International Evidence on the Determinants of Learning Outcomes ..................................... 11 Colombian Evidence on the Determinants of Learning Outcomes ........................................ 16 Conclusion ............................................................................................................................. 23
INTERNATIONAL STUDENT ASSESSMENT (PISA) 25 International and Regional Comparisons ............................................................................... 26 Predictors of Learning Outcomes Based on PISA Results ..................................................... 38 Conclusion ............................................................................................................................. 51
52 Agenda for Action .................................................................................................................. 52 Conclusion ............................................................................................................................. 62
References .................................................................................................................................... 63
CHAPTER 2 . DETERMINANTS OF LEARNING OUTCOMES: A CONCEPTUAL FRAMEWORK AND REVIEW OF THE LITERATURE
CHAPTER 3 . COLOMBIA’S PERFORMANCE IN THE PROGRAMME FOR
CHAPTER 4 . POLICY OPTIONS
ANNEXES Annex 1 . Annex 2 . Annex 3 . Annex 4 . Annex 5 .
Background on the Colombian Education System ................................................. 69 Plan Nacional Decenal de Educaci6n ..................................................................... 75 International Review of Studies of Determinants of Learning ............................... 77 Review of Previous Studies of Determinants of Learning in Colombia ................ 82 PISA Variables and Descriptive Statistics ............................................................. 90
ANNEX TABLES Table A . 1 . 1. Number o f Enrolled Students by Level and Sector ................................................ 69 Table A.1.2: Number of Enrolled Students by Area ................................................................... 69 Table A . 1.3: Institutional Responsibility for Education Administration in Colombia ................ 70 Table A.5.1: Summary of Key School, Student, and Family Characteristics by Proficiency Level
................................................................................................................................ 90 Table A.5.2: School, Student and Family Variables ................................................................... 92 Table A.5.3: School, Student and Family Variables ................................................................... 93
iv
Table 1.1 : Table 2.1 : Table 2.2: Table 3.1 : Table 3.2: Table 3.3: Table 3.4:
Figure 1.1: Figure 1.2: Figure 1.3:
Figure 2.1 : Figure 3.1 : Figure 3.2: Figure 3.3: Figure 3.4: Figure 3.5: Figure 3.6: Figure 3.7: Figure 3.8: Figure 3.9: Figure 3.10:
Figure 3.1 1:
Figure 3.12:
Figure 3.13:
Box 4.1 : Box 4.2: Box 4.3: Box 4.4: Box 4.5:
TABLES Summary o f Colombia’s Performance on International and Regional Assessments 7
Summary o f Variables ............................................................................................ 24 PISA 2006 LAC. Mean Math Scores by Institutional Characteristics ................... 38 Predictors o f Mathematics Learning. L A C - PISA 2006 ....................................... 40 Quantile regression o f Mathematics Learning. Colombia - PISA 2006 ................ 45 Summary o f Predictors o f Mathematics Learning in Colombia. PISA 2006 ......... 48
Student. School. and Institutional Variables that Affect Student Learning ............ 11
FIGURES Comparative Primary School Enrollment (% Net) ................................................... 1 Comparative Primary School Completion (% o f relevant age group) ...................... 2 Cumulative Increase in Preprimary. Primary. and Secondary Public School Enrollment o f Students Displaced by Violence ........................................................ 3 Conceptual Framework .......................................................................................... 10 Reading Scores, al l countries ................................................................................. 28 Math Scores, a l l countries ...................................................................................... 28 Science Scores, all countries .................................................................................. 29 Test scores in Reading versus GDP ....................................................................... 30 Test scores in Math versus GDP ............................................................................ 30 Test scores in Science versus GDP ........................................................................ 31 Dispersion vs . Mean Math all countries ................................................................. 33 Dispersion vs . Mean Science al l countries ............................................................. 33 Comparative Distribution o f PISA Test Scores by Proficiency Level ................... 35 Comparative Distribution o f PISA Test Scores in Mathematics by Proficiency Level, Colombia and the average for OECD countries .......................................... 35 Comparative Distribution o f PISA Test Scores in Mathematics by Proficiency Level, Colombia and Chile ..................................................................................... 36 Comparative Distribution o f PISA Test Scores in Mathematics by Proficiency
Variance in Science Test Scores: Between Schools and Within Schools - LAC ... 37 Level, Colombia and Mexico ................................................................................. 36
BOXES Student Achievement: the Case o f Tunisia and Jordan .......................................... 54 Compensatory Education: Mexico’s CONAFE .................................................... 56 Compensatory Education: Chile’s P900 Program ................................................. 57 Escuela Nueva ........................................................................................................ 58 Continuous and comulementarv reforms to immove student achievement: Chile . 6 1
V
Acknowledgements
This report was prepared by a team consisting o f Raja Bentaouet Kattan (Task Team Leader), Felipe Barrera, Amy Walter, and Bibiana Taboada with significant contributions from Kevin Macdonald, Vicente Garcia-Moreno, and Myrna Machuca-Sierra. The team received very useful feedback from Axel van Trotsenburg (Country Director, LCClC), Mark Hagerstrom (Lead Operations Officer, L C C 1 C), David Rosenblatt (Lead Economist, LCSPR), Eduardo Velez Bustillo (Sector Manager, EASHD), Emiliana Vegas (Senior Education Economist, HDNED), Christoph Kurowski (Sector Leader, LCSHD), and Chingboon Lee (Sector Manager, LCSHD). Peer reviewers for this task were Harry Patrinos (Lead Education Economist, HDNED) and Halsey Rogers (Senior Economist, DECRG). Tania Gomez and Viviana Gonzalez provided excellent assistance in coordinating the production o f this report.
The overall AAA work received thoughtful comments at the Concept Paper stage from the peer reviewers, David Rosenblatt (Lead Economist, LCSPR), Albert0 Rodriguez (Country Sector Coordinator, ECSHD), Erik Bloom (Senior Economist, LCSHE), Emiliana Vegas (Sr. Education Economist, HDNED), and Martha Laverde (Senior Education Specialist, LCSHE).
The report was discussed during a meeting chaired by Axel van Trotsenburg (Country Director for Mexico and Colombia). Written comments were received by the peer reviewers, Harry Patrinos and Halsey Rogers.
Furthermore, the report benefited f rom the comments o f Colombia's National Ministry o f Education (Ministerio de Educacidn Nacional), whose team included Cecilia MariaVdez White (Ministra de Educacidn Nacional), Isabel Segovia Ospina (Viceministra de Preescolar, B6sica y Media), Mdnica L6pez Castro (Directora de Calidad), and Julia Maria Rubiano (Asesora del Viceministerio de Preescolar, Bdsica y Media); as wel l as the Instituto Colombiano del Foment0 de Educacidn Superior (ICFES), including Margarita Peiia (Directora General), Julihn P. Mari i io (Subdirector Acadkmico), Blanca L i l ia Caro, Isabel Fernhndez and Luis Piiieros (Consultores).
vi
Executive Summary
The main objective o f this report i s to analyze student learning in Colombia in order to foster policies to improve education quality that are grounded in research and the Colombian context. In 2006, Colombia participated for the first time in the Programme for International Student Assessment (PISA) of the Organization for Economic Cooperation and Development (OECD), which provides an important opportunity to benchmark the quality and equity of i t s education system globally and to inform i t s education policy. Using the PISA results, this report calls attention to the need for improved student learning in Colombia and provides new analytical work on the factors associated with learning in Colombia and other participant countries. Based on an assessment of the current state of the Colombian education system (Chapter l), a review of the relevant literature (Chapter 2), and an analysis of PISA (Chapter 3), the report concludes with a set o f policy options that may inform a future agenda for system design and reform (Chapter 4).
Colombia has made laudable improvements in education access and internal efficiency. However, achieving greater quality and equity remains an urgent challenge.
As in many countries in the Latin America and Caribbean (LAC) region, Colombia has made significant progress over the past two decades in improving educational access and internal efficiency. The country has increased net primary enrollment to roughly 90 percent, approaching the regional average, and has both reduced primary repetition and increased primary completion. Colombia has also increased net secondary enrollment to 65 percent, which, though considerably below primary enrollment, also approaches the regional average.
Colombia i s now tasked with improving education quality and equity and increasing secondary completion rates. Colombia’s performance on international assessments, an important measure of quality, indicates that improvements in quality are needed. Although many students advance to secondary school, the graduation rate i s low. In addition to the high cost of education and the opportunity cost of not working, the low quality and relevance of learning has been cited as a reason that secondary students drop out of school. Furthermore, pronounced differences in enrollment, attainment, and completion exist between poorer and wealthier departments and between rural and urban areas. Improving education quality w i l l be instrumental not only to improving overall learning, but also to increasing retention among secondary students and in poor and rural areas, as well as to ensuring that as secondary enrollment increases and more students who are less well prepared enter the system, they too are academically successful.
An analysis of PISA 2006 shows Colombia’s performance to be low and fall short of i t s potential relative to i t s income level. Colombia performed well below the overall average among the 57 participant countries and below average among L A C countries, though it performed better than Argentina in reading and on par with Brazil in mathematics (see Figure 1 for mathematics scores). Given that national income per capita tends to correlate with performance and that Colombia was only one o f six lower middle-income countries to participate in PISA (and the only lower middle-income country in LAC), these results may be unsurprising. However, while Colombia’s performance among lower middle-income countries i s roughly average in reading, i t falls below average in mathematics and science. Furthermore, Colombia’s performance in mathematics and to a lesser extent in science falls short of expected performance in those
v i i
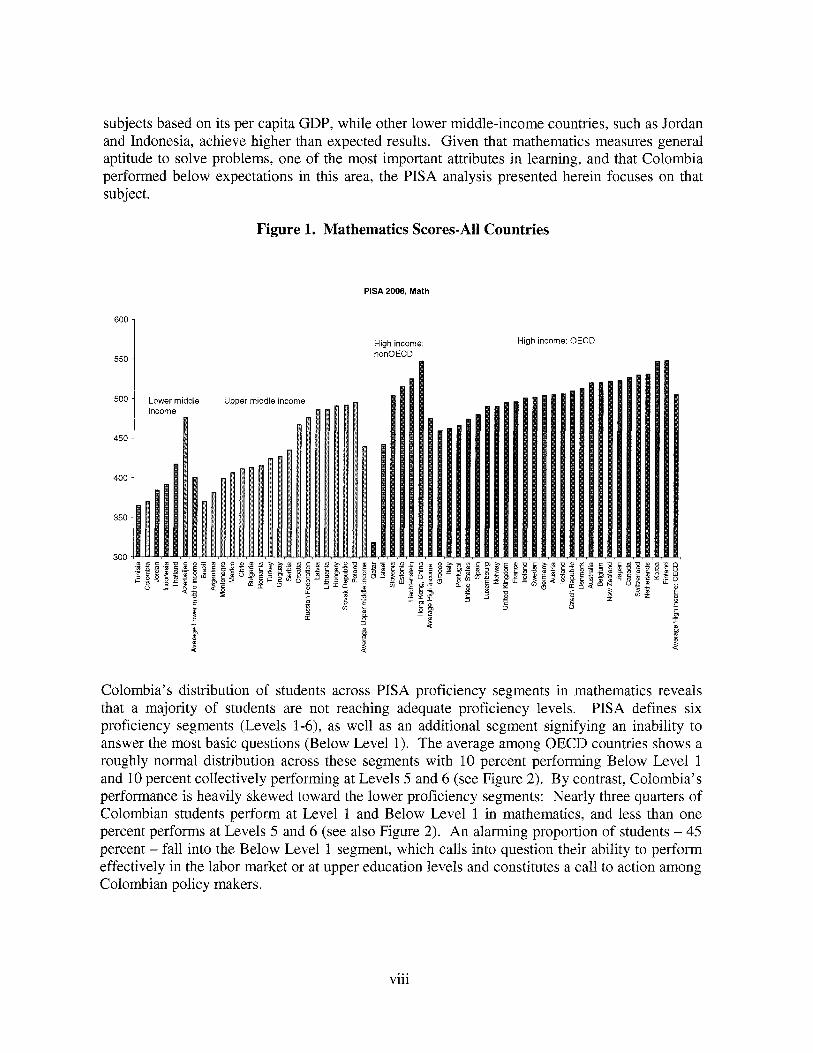
subjects based on i t s per capita GDP, while other lower middle-income countries, such as Jordan and Indonesia, achieve higher than expected results. Given that mathematics measures general aptitude to solve problems, one of the most important attributes in learning, and that Colombia performed below expectations in this area, the PISA analysis presented herein focuses on that subject.
Figure 1. Mathematics Scores-All Countries
1 550 4
500 Lower middle Upper middle income 1 income
450 1
i m
P B
PISA 2006, Math
High income: nonOECD
High income: OECD
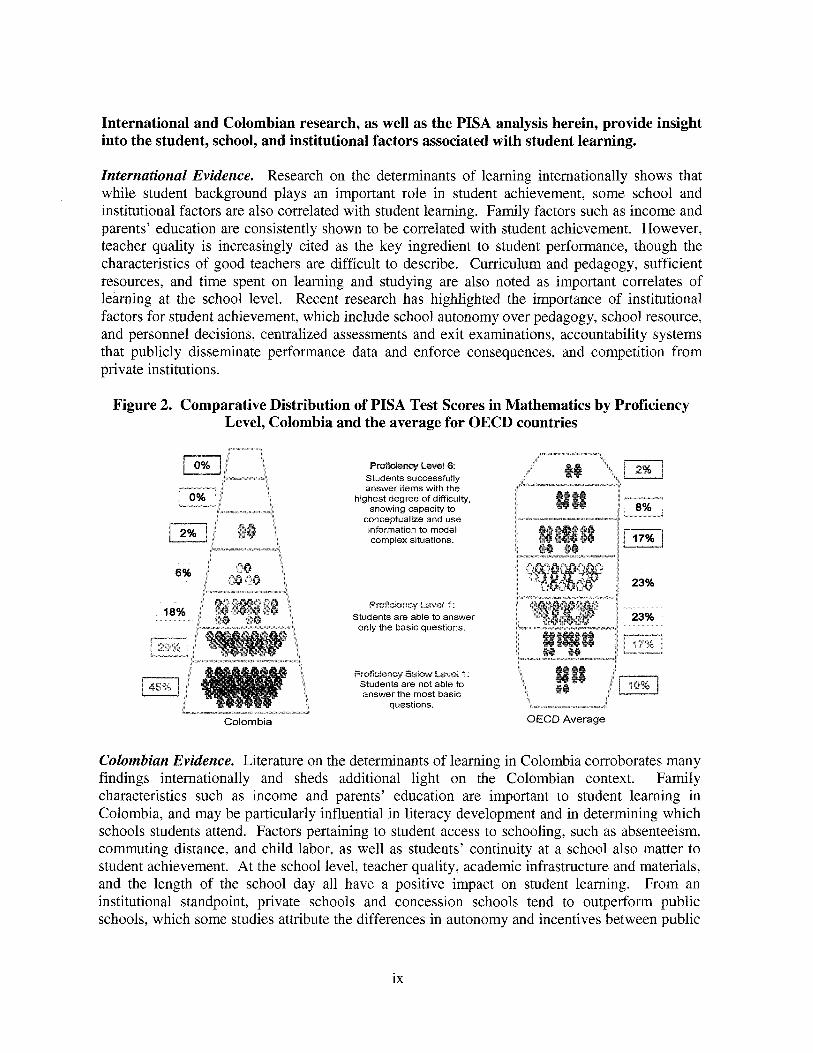
Colombia's distribution o f students across PISA proficiency segments in mathematics reveals that a majority of students are not reaching adequate proficiency levels. PISA defines six proficiency segments (Levels 1-6). as well as an additional segment signifying an inability to answer the most basic questions (Below Level 1). The average among OECD countries shows a roughly normal distribution across these segments with 10 percent performing Below Level 1 and 10 percent collectively performing at Levels 5 and 6 (see Figure 2). By contrast, Colombia's performance i s heavily skewed toward the lower proficiency segments: Nearly three quarters of Colombian students perform at Level 1 and Below Level 1 in mathematics, and less than one percent performs at Levels 5 and 6 (see also Figure 2). An alarming proportion of students - 45 percent - fall into the Below Level 1 segment, which calls into question their ability to perform effectively in the labor market or at upper education levels and constitutes a call to action among Colombian policy makers.
... V l l l
International and Colombian research, as well as the PISA analysis herein, provide insight into the student, school, and institutional factors associated with student learning.
International Evidence. Research on the determinants o f learning internationally shows that while student background plays an important role in student achievement, some school and institutional factors are also correlated with student learning. Family factors such as income and parents' education are consistently shown to be correlated with student achievement. However, teacher quality i s increasingly cited as the key ingredient to student performance, though the characteristics o f good teachers are difficult to describe. Curriculum and pedagogy, sufficient resources, and time spent on learning and studying are also noted as important correlates o f learning at the school level. Recent research has highlighted the importance o f institutional factors for student achievement. which include school autonomy over pedagogy, school resource, and personnel decisions, centralized assessments and exit examinations, accountability systems that publicly disseminate performance data and enforce consequences, and competition f rom private institutions.
Figure 2. Comparative Distribution of PISA Test Scores in Mathematics by Proficiency Level, Colombia and the average for OECD countries
F ~ ~ ~ ~ ~ 9 Fewel 6 Students successfully answer items with the
highest degree of difficulty, showing capacity to
conceptualize and use information to model complex situations.
18 "m%lanci. Lewi 4:
Students are able to answer only the basic questions.
~~~~~~~~~ Below Levo! . Students are not able to answer the most basic
questions.
23%
Colombian Evidence. Literature on the determinants o f learning in Colombia corroborates many findings internationally and sheds additional light on the Colombian context. Family characteristics such as income and parents' education are important to student learning in Colombia, and may be particularly influential in literacy development and in determining which schools students attend. Factors pertaining to student access to schooling, such as absenteeism, commuting distance, and chi ld labor, as wel l as students' continuity at a school also matter to student achievement. At the school level, teacher quality, academic infrastructure and materials, and the length o f the school day all have a positive impact on student learning. From an institutional standpoint, private schools and concession schools tend to outperform public schools, which some studies attribute the differences in autonomy and incentives between public
ix
schools and private and concession schools, though i t i s also important to consider such unobservable factors as differences in student selection policies.
PZSA 2006 Analysis. The cross-sectional analysis o f the PISA 2006 presented in this report provides new analytical work on the predictors o f student learning in Colombia, with a particular focus on mathematics achievement. While the analysis i s not causal, the estimation method applied allows for a close approximation o f the degree and direction o f association between two variables. Family factors including parents’ attainment o f university studies and the number o f books and presence o f computers in the home are positively and significantly correlated with mathematics achievement. Student enrollment in grades 9, 10, and 11 i s associated with a substantial, significant, positive effect that increases with each successive grade. Girls performed substantially and significantly worse than boys in mathematics. At the school level, the percent o f certified teachers i s strongly, significantly correlated with higher achievement, while the number o f hours that students spend studying mathematics correlates moderately with higher math scores. Private schools perform considerably better than public schools, as do schools located in urban areas relative to their rural counterparts. The use o f achievement data to evaluate teachers and school directors was the one institutional variable o f the four variables studied with a significant (positive) correlation with achievement, albeit a modest one. The other institutional variables, which pertain to schools competing for students, determining pedagogy, and being authorized to fire teachers, show no significant correlation with student achievement.
Colombia has rightly prioritized education quality in its national reforms and planning efforts. Its culture of education innovation and evaluation provides a strong foundation for improvement.
National Reforms and Planning Efforts. Colombia has recognized the need to improve education quality and has put i t at the center o f i t s education policy. The four strategies that comprise this policy are: (i) strengthening the education quality assurance system at al l levels; (ii) providing professional development for teachers and school directors; (iii) implementing programs to develop competencies; and (iv) fostering policy and program evaluation.
These strategies feature prominently in Colombia’s national education planning. I t s National Development Plan aims to undertake comparable multi-year academic assessments and use the results to improve the performance o f students, teachers, and schools. The National Education Plan further develops the national strategy for improving the quality o f education by: (i) establishing standards for basic competency in language, mathematics, social and natural sciences, and citizenship; (ii) evaluating students, teachers, and administrators and disseminating the results; and (iii) improving school quality, including the establishment o f a process for quality certification. Colombia has engaged the public in the development o f a ten-year plan to address these and other issues critical to education through i t s most recent Plan Nacional Decenal de Educacio’n.
Innovative Policies and Programs. Colombia has a demonstrated track record o f education innovation and evaluation, upon which it has built successive education reforms. At the student and family level, an early childhood development program, Hogares Comuniturios de Bienestar Familiar (HC), has been demonstrated to improve enrollment and promotion in later grades, and
X
a conditional cash transfer program, Familius en Accidn, has also been shown to improve enrollment. H C represents part of a larger national early childhood policy, which by law seeks to foster integrated care, education, nutrition, and health services for children under five years old. Furthermore, Colombia has recently instituted important reforms in i t s teacher policy, which require new teachers to demonstrate adequate performance in order to advance and to continue in the profession. At the school level, Colombia’s world-renowned and internationally replicated Escuela Nueva (EN) program has improved student achievement in rural areas by enabling students to progress through a flexible curriculum, by engaging them with active pedagogy supported by teacher training, and by adapting to local needs through democratic decision- making and community engagement. EN now comprises one of nine flexible education models that rural schools can choose to implement under the Programa de Educacidn Rural. In addition, based on the successful Programa de Amplicacidn de la Cobertura de Educacidn Secundaria (PACES) program, which enabled low-income students to attend private schools through vouchers and improved student achievement, Colombia has implemented a strategy of subsidizing private schools to serve low-income students. The country has moved progressively toward the decentralization of education service provision, in particular by endowing sub- national governments with the responsibility for ensuring enrollment and funding them accordingly. I t has also enabled sub-national governments to grant schools more autonomy while instilling accountability for performance through contracting arrangements, the most well- known of which i s the BogotA Concesiones Program, a strategy that has spread to other parts o f the country.
Colombia would benefit from adopting policies to improve student learning that set ambitious standards for all actors, strengthen the overall system, and target critical gaps.
International research has increasingly shown that education quality, more than quantity, has a causal impact on economic growth. While Colombia’s economic growth has improved in recent years, Colombia needs to increase education quality and equity for that growth to be sustainable and to benefit the population broadly.
Based on an assessment of the current state o f the Colombian education system, a review of the literature, and an analysis of PISA, an agenda for action was developed comprising four key levers for change: 1) Continue participation in and learning from assessments, 2) Enable disadvantaged populations to achieve high standards, 3) Strengthen the system of accountability, and 4) Use resources more efficiently.
Continue Participation in and Learning from International and National Assessments. The regular and systemic use o f accurate assessment data provides a strong foundation for education quality by enabling system benchmarking, informing decision-making at a l l levels, and galvanizing public involvement and support. Colombia could use i t s participation in PISA and other international assessments to benchmark the performance of i t s education system against international standards and to adapt policy so as to progress toward the achievement of those standards. In particular, i t might consider setting performance targets for future rounds o f assessments as part o f i t s National Education Plan. Colombia can learn from the experience o f Jordan, a lower middle-income country that has used international assessments and other benchmarking tools to achieve impressive gains. In addition, assessment data could be broadly
x i
and consistently publicly disseminated and used at all levels to enable participants to contribute more fully in the improvement process. Colombia could also consider using assessment results to engage the public and mobilize support for education, as it has done with the Plan Decenal. These policy options rest on the strength o f the national assessment system itself, which Colombia has taken important steps to develop and improve and should continue to do so.
Enable Disadvantaged Populations to Achieve High Standards. Colombia faces a systemic problem in providing a quality education to certain populations, which the country must rectify through carefully targeted and continuously evaluated policies and programs. I t i s important that Colombia continues to implement, evaluate, refine, and expand programs proven to improve school readiness and to increase enrollment, advancement, and achievement among poor, rural, and ethnic minority students, as well as those affected by violence. Furthermore, Colombia could learn from the experience of other countries, such as Mexico and Chile, in how to address the needs of these students and the teachers and schools that serve them. Finally, the disparity in achievement between girls and boys merits further exploration and the development o f an appropriate policy response.
Strengthen the System of Accountability. While Colombia possesses elements of an accountability system, it needs to strengthen them by aligning authority and capacity with responsibility for performance at each level of the system. At the student level, Colombia might consider establishing “high stakes” examinations (such as exit exams) and evaluate their impact on student learning. At the school level, Colombia could establish and enforce standards for school performance, for example through a quality certification process as outlined in the National Education Plan. Such a process might be coupled with school autonomy in areas such as pedagogy, resource allocation, and personnel decisions, as well as school improvement programs providing support for teachers and disadvantaged or low-achieving schools. At the sub-national level, municipalities, districts, and departments could be held responsible for education coverage and quality. For non-certified municipalities in particular, this may require strategies to grant them more authority and improve their capacity to fulfill their responsibilities. Again, i t may be instructive to learn from the experience of Chile in improving the efficacy of a decentralized system. While a teacher evaluation system has already been established, the system could be further empowered to remove poor-performing teachers. Finally, parents and community members might be granted a greater voice and degree of authority in the school improvement process.
Use Resources More Efficiently. Given that Colombia has greatly increased i t s public and total spending on education as a proportion of i t s GDP (to 4.75 and 6.33 percent respectively in 2007) and that teacher compensation among other factors constrain further spending increases, i t i s incumbent on the country to ensure that existing funds are spent effectively and efficiently. A weighted student funding formula based on student needs and characteristics i s a strategy that can help to ensure that students with the greatest needs are receiving an adequate and appropriate share o f resources, and it i s therefore one that bears further exploration. In addition, as Colombia continues to evaluate i t s various programs and policies aimed at improving educational outcomes for a l l students, i t might consider not only their efficacy but also their cost-effectiveness. This wi l l facilitate i t s decision-making in considering which programs to expand in the face of resource constraints.
x i i
Foreword
The World Bank i s undertaking a multi-year program o f analytic and advisory activities (AAA) to support the Government o f Colombia in improving its education programs and policies. The proposed program seeks to support government efforts to marshal public support for education, identify the determinants o f student learning in order to inform policy, and enhance government capacity to conduct research, monitoring, and evaluation o f education policies and programs. As a means toward these ends, the program, undertaken in partnership with the Ministe'rio de Educacidn Nacional (MEN), adopts a variety o f instruments and activities, including traditional sector analysis, technical assistance, policy briefs, workshops, and seminars, to support the improvement o f education in Colombia. The program coincides with government efforts to reform and improve education and comes at a time o f substantial interest in education quality. The World Bank therefore seeks to develop a program that i s responsive and programmatic as well as collaborative, and links to policy, other analytical work, and operations.
The work i s carried out in two phases, though not al l components wi l l span both phases. Phase 1 (FYOS-FYO9) focuses largely on: (i) supporting the MEN in the dissemination o f the results o f the National Assembly o f the Plan Decenal; and (ii) analyzing the determinants o f learning in Colombia, using results f rom the Programme for International Student Assessment (PISA) 2006 o f the Organization for Economic Cooperation and Development (OECD). Phase 2 (FYO9- FY10) w i l l focus on disseminating the results o f the determinants o f learning study and providing technical assistance to the Instituto Colombiano para el Foment0 de la Educacidn Superior (ICFES) for improving i t s capacity in analyzing and reporting results, including the consolidation o f national assessment databases and improvement o f comparability across testing cycles. The World Bank w i l l collaborate with the MEN to determine the most appropriate instruments for public dissemination to improve education quality, and the topics for technical assistance.
As a key output o f Phase 1, this report provides new analytical work on the determinants o f learning using data f rom PISA 2006. It also contributes to the growing body o f literature and evidence on the quality o f education, especially on the factors associated with quality that contribute to improved student learning, and builds on the recent World Bank study o f education quality in Latin America by Vegas and Petrow (2007) by applying the conceptual framework presented therein to the Colombian context. The main objective o f this report i s to identify the determinants o f learning in Colombia, focusing on equity, cross-country comparisons, and national studies. Using econometric research methods, the study analyzes the impact of factors related to institutions, schools, students, parents, and teachers on student outcomes. I t also includes some regional and international comparisons and an analysis o f achievement across the distribution - through the use of quantile regression - relating achievement to dispersion, both techniques used for the first time in Colombia. The report analyzes the evidence and develops possible policy options for Colombia to improve learning outcomes.
Chapter 1 presents an overview o f the state o f education in Colombia. Chapter 2 reviews the existing international and national literature on the determinants o f learning. Chapter 3 presents the analysis o f the results o f PISA 2006. Finally, Chapter 4 concludes the report wi th a series o f policy options that may inform a future agenda for system design and reform.
... X l l l
CHAPTER 1. THE COLOMBIAN EDUCATION SYSTEM
Sector Trends
1.1 Over the last two decades, Colombia has made great strides in improving access to education and has made some improvements in internal efficiency. However, there i s s t i l l much to be accomplished as the country faces challenges such as low completion rates in secondary education, inequality in access and attainment, and poor quality of education. In addition, performance on international and regional assessments shows considerable room for improvement.
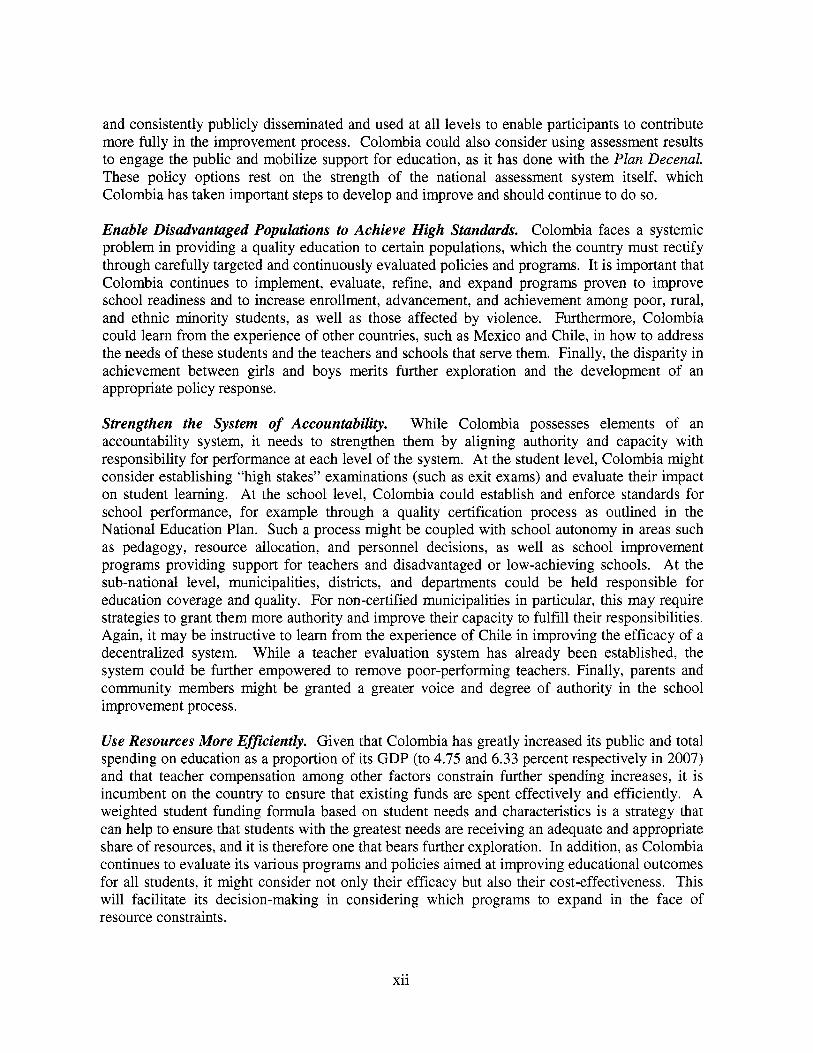
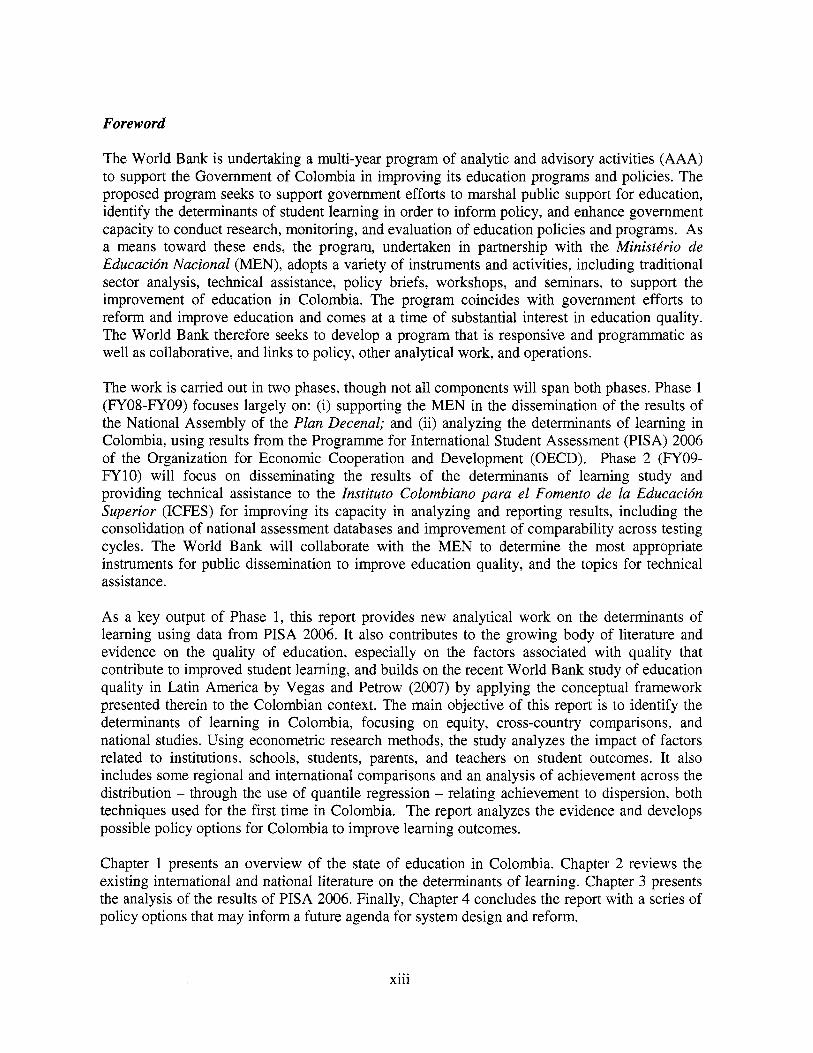
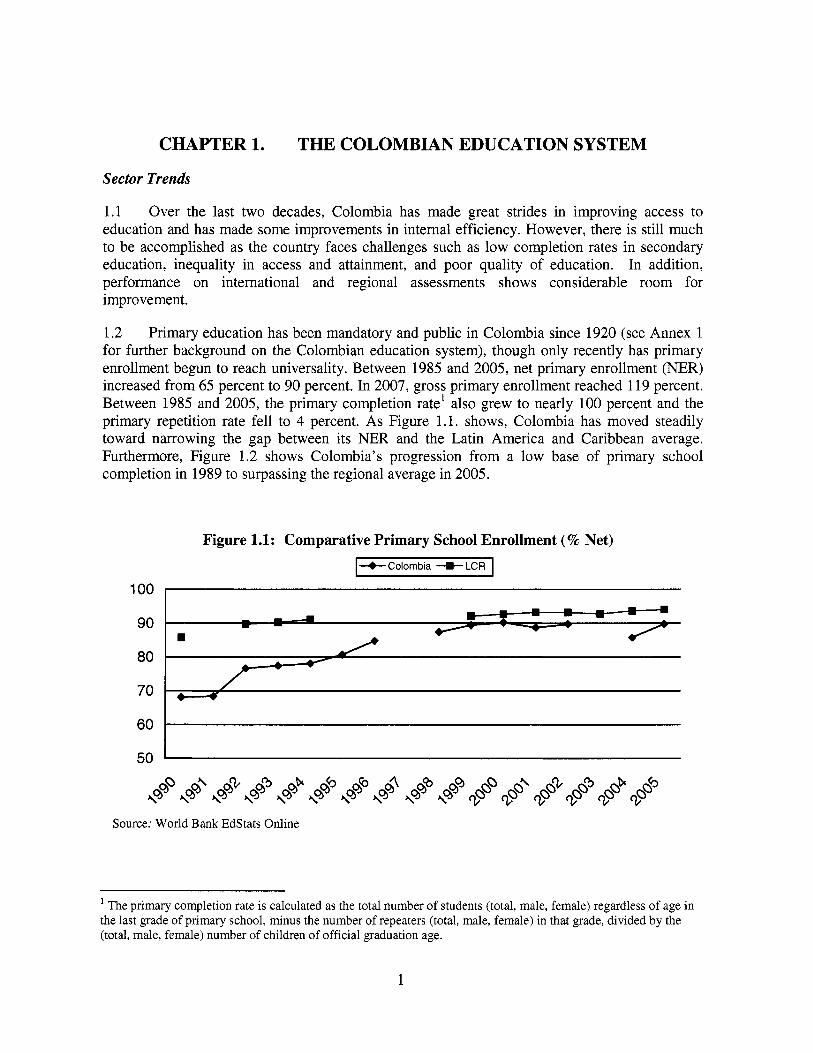
1.2 Primary education has been mandatory and public in Colombia since 1920 (see Annex 1 for further background on the Colombian education system), though only recently has primary enrollment begun to reach universality. Between 1985 and 2005, net primary enrollment (NER) increased from 65 percent to 90 percent. In 2007, gross primary enrollment reached 119 percent. Between 1985 and 2005, the primary completion rate' also grew to nearly 100 percent and the primary repetition rate fell to 4 percent. As Figure 1.1. shows, Colombia has moved steadily toward narrowing the gap between i t s NER and the Latin America and Caribbean average. Furthermore, Figure 1.2 shows Colombia's progression from a low base o f primary school completion in 1989 to surpassing the regional average in 2005.
Figure 1.1: Comparative Primary School Enrollment (% Net) -+-Colombia + LCR
v" I
Source: World Bank EdStats Online
The primary completion rate i s calculated as the total number o f students (total, male, female) regardless o f age in 1
the last grade o f primary school, minus the number o f repeaters (total, male, female) in that grade, divided by the (total, male, female) number o f children o f official graduation age.
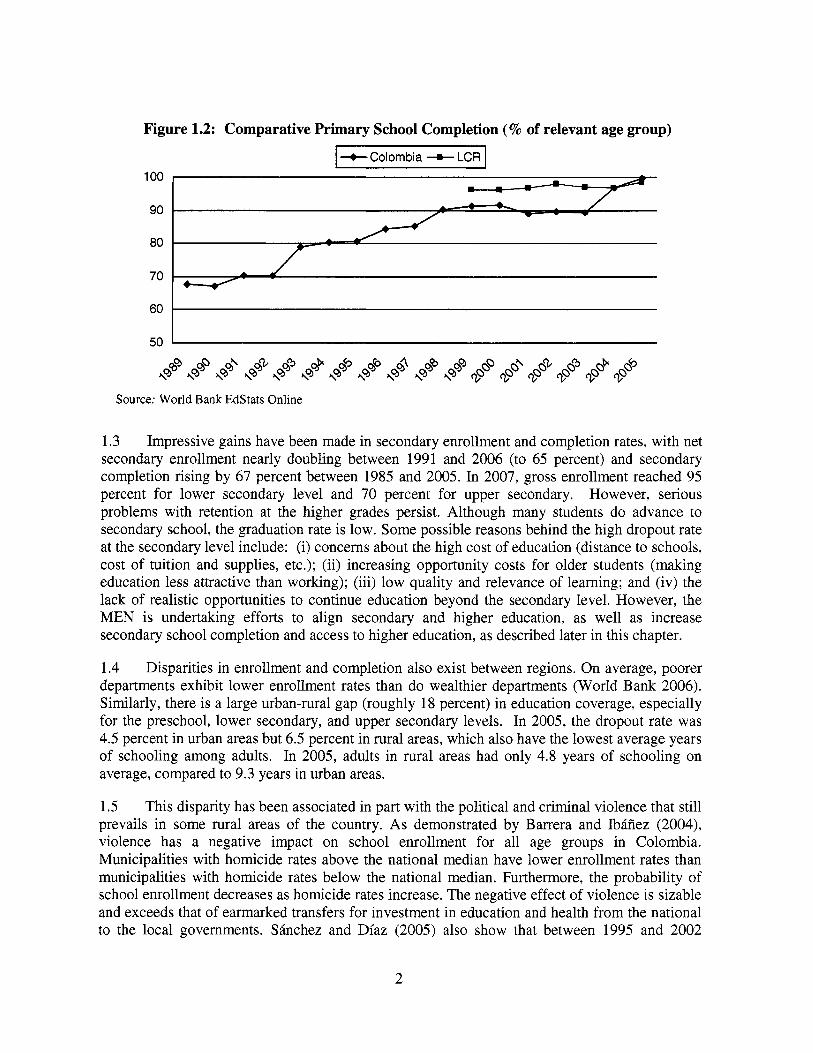
Figure 1.2: Comparative Primary School Completion (% of relevant age group)
I +Colombia -a- LCR I
90
80
.
Source: World Bank EdStats Online
1.3 Impressive gains have been made in secondary enrollment and completion rates, with net secondary enrollment nearly doubling between 1991 and 2006 (to 65 percent) and secondary completion rising by 67 percent between 1985 and 2005. In 2007, gross enrollment reached 95 percent for lower secondary level and 70 percent for upper secondary. However, serious problems with retention at the higher grades persist. Although many students do advance to secondary school, the graduation rate i s low. Some possible reasons behind the high dropout rate at the secondary level include: (i) concerns about the high cost of education (distance to schools, cost of tuition and supplies, etc.); (ii) increasing opportunity costs for older students (making education less attractive than working); (iii) low quality and relevance of learning; and (iv) the lack of realistic opportunities to continue education beyond the secondary level. However, the MEN i s undertaking efforts to align secondary and higher education, as well as increase secondary school completion and access to higher education, as described later in this chapter.
1.4 Disparities in enrollment and completion also exist between regions. On average, poorer departments exhibit lower enrollment rates than do wealthier departments (World Bank 2006). Similarly, there i s a large urban-rural gap (roughly 18 percent) in education coverage, especially for the preschool, lower secondary, and upper secondary levels. In 2005, the dropout rate was 4.5 percent in urban areas but 6.5 percent in rural areas, which also have the lowest average years of schooling among adults. In 2005, adults in rural areas had only 4.8 years of schooling on average, compared to 9.3 years in urban areas.
1.5 This disparity has been associated in part with the political and criminal violence that s t i l l prevails in some rural areas of the country. As demonstrated by Barrera and Ibaiiez (2004), violence has a negative impact on school enrollment for all age groups in Colombia. Municipalities with homicide rates above the national median have lower enrollment rates than municipalities with homicide rates below the national median. Furthermore, the probability of school enrollment decreases as homicide rates increase. The negative effect of violence i s sizable and exceeds that of earmarked transfers for investment in education and health from the national to the local governments. Shchez and Diaz (2005) also show that between 1995 and 2002
2
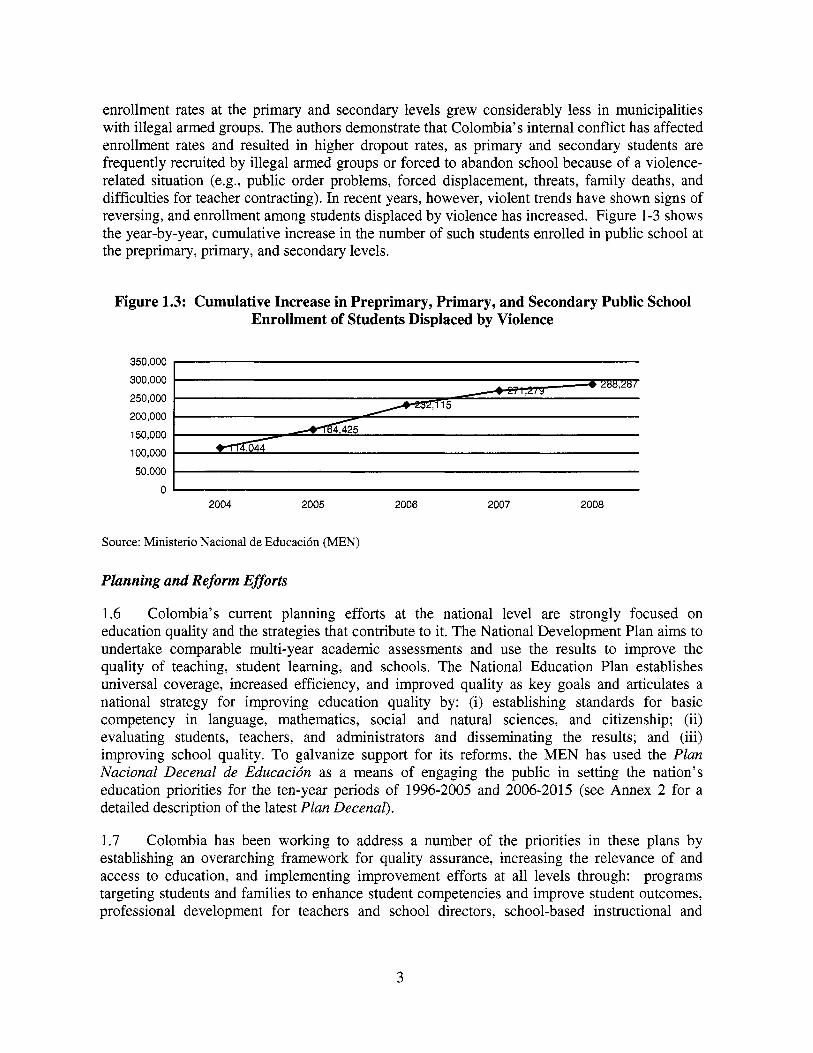
enrollment rates at the primary and secondary levels grew considerably less in municipalities with illegal armed groups. The authors demonstrate that Colombia’s internal conflict has affected enrollment rates and resulted in higher dropout rates, as primary and secondary students are frequently recruited by illegal armed groups or forced to abandon school because o f a violence- related situation (e.g., public order problems, forced displacement, threats, family deaths, and difficulties for teacher contracting). In recent years, however, violent trends have shown signs o f reversing, and enrollment among students displaced by violence has increased. Figure 1-3 shows the year-by-year, cumulative increase in the number o f such students enrolled in public school at the preprimary, primary, and secondary levels.
350,000
300,000
250,000
200,000
150,000
100,000
50,000
0
Figure 1.3: Cumulative Increase in Preprimary , Primary, and Secondary Public School Enrollment of Students Displaced by Violence
-5
L A d
Source: Ministerio Nacional de Educaci6n (MEN)
Planning and Reform Efforts
1.6 Colombia’s current planning efforts at the national level are strongly focused on education quality and the strategies that contribute to it. The National Development Plan aims to undertake comparable multi-year academic assessments and use the results to improve the quality o f teaching, student learning, and schools. The National Education Plan establishes universal coverage, increased efficiency, and improved quality as key goals and articulates a national strategy for improving education quality by: (i) establishing standards for basic competency in language, mathematics, social and natural sciences, and citizenship; (ii) evaluating students, teachers, and administrators and disseminating the results; and (iii) improving school quality. T o galvanize support for i t s reforms, the MEN has used the Plan Nacional Decenal de Educacidn as a means o f engaging the public in setting the nation’s education priorities for the ten-year periods o f 1996-2005 and 2006-2015 (see Annex 2 for a detailed description o f the latest Plan Decenal).
1.7 Colombia has been working to address a number o f the priorities in these plans by establishing an overarching framework for quality assurance, increasing the relevance o f and access to education, and implementing improvement efforts at al l levels through: programs targeting students and families to enhance student competencies and improve student outcomes, professional development for teachers and school directors, school-based instructional and
3
organizational interventions, and system reform efforts aimed at creating an environment conducive to student and school improvement.
1.8 Since 2002, Colombia has been strengthening i t s quality assurance system by developing basic competency standards, monitoring, analyzing and using evaluation data for student and teacher performance, fostering school quality through the use of self-evaluation, improvement plans and a certification process, and strengthening sub-national agencies to support schools’ improvement efforts, especially schools that are low-achieving.
1.9 Furthermore, Colombia has been working to increase the relevance of i t s education system from preprimary to higher education and to increase access at the higher levels, so as to build the human capital required to increase the productivity and competitiveness o f the country. I t s strategies include: (i) increasing the relevance of upper secondary education and establishing work-based competencies; (ii) preparing students for the workplace and fostering human development; (iii) strengthening technical and technological education, including the use of media and new technology; and (iv) promoting bilingualism. In order to prepare students to become effective citizens and community members, Colombia offers programs in environmental education, sexual education, civic education, and human rights. I t has expanded access to technical and technological secondary and higher education through Centros Regionales de Educacidn Superior (CERES) and the Acceso con Calidad a la Educacidn Superior (ACCES) project. CERES provide information and communication technology infrastructure for communities to access technical professional, technological, and university programs offered by different higher education institutions and has contributed in particular to indigenous people’s secondary school access, while ACCES provides low-income students with flexible financing for higher education, with an emphasis on professional technical and technological education.
1.10 In order to prepare students for school and ensure increased education access, Colombia has implemented policies and programs fostering early childhood development and demand for education services that have been shown to improve student outcomes such as enrollment and achievement. The MEN has worked in conjunction with the Znstituto Colombiano de Bienestar Familiar (ICBF) to establish an education policy for early childhood in accordance with Law 1098 of 2006, which stipulates an integrated approach to serving children under five through care, education, nutrition, and health. Hogares Comunitarios de Bienestar Familiar (HC), a proven program providing community nursery care and nutrition, has continued to constitute a part of this strategy. Important student-based, demand-side programs have included Familias en Accidn, which has provided cash transfers to families conditional on their children’s school attendance, and Programa de Ampliacidn de Cobertura de la Educacidn Secundaria (PACES), which provided vouchers for students to attend private schools as a means o f increasing enrollment. Although PACES ended more than ten years ago, i t s results have been instructive, and Colombia has adopted other strategies aimed at achieving similar outcomes, such as subsidizing private schools in providing education services to low-income students.
1.11 Furthermore, the MEN has engaged in specific efforts to increase enrollment and retention among students who have been forcibly displaced by violence. The recent increase in enrollment among these students i s partly attributable to their participation in flexible education models, such as Aceleracidn de Aprendizaje and Circulos de Aprendizaje, which respond to their needs and characteristics such as being over-age for their grade. Strategies aimed at improving retention among these students include: (i) education and nutrition subsidies delivered in
4
coordination with the Fumilius en Accidn program; (ii) preferential access among displaced families to social protection through Juntos, the Network for Overcoming Extreme Poverty; (iii) orienting local education entities in the use of resources allocated to school feeding programs; (iv) promotion and approval of projects investing resources from cooperatives and mutual associations in programs aimed at improving access and retention among displaced students; and (v) beginning in 2008, the provision of resources to local education entities to offer displaced students a free education at state educational institutions.
1.12 Colombia has carried out important efforts to improve teacher quality through evaluation and professional development. In June 2002, the government approved a new rating system and salary scale for teachers, which accounts for teachers’ responsibilities and performance and evaluates teachers through three basic examinations at different stages o f the teaching career.2 Furthermore, i t has established a system o f professional development that: (i) develops teachers’ basic competencies and establishes plans for their improvement; (ii) fosters their use of information and communication technologies; (iii) i s developing a cadre o f ethno-educators; and (iv) assures the quality of the higher education institutions that provide teacher training. In addition, teachers working with students displaced by violence are endowed with pedagogical tools that enable them to adapt their teaching to the challenges that such students face.
1.13 Colombia has also implemented school-based programs, particularly in rural areas, which aim to improve schools’ capacity and outcomes through relevant curriculum, engaging pedagogy, and professional development to support classroom teaching. Most notably, i t s Progrumu de Educucio’n Rural has provided rural schools with an opportunity to choose from among nine flexible educational models aimed at improving academic access, relevance, and achievement in rural areas. One of these interventions includes the internationally renowned Escuelu Nuevu, created in the mid 1970s and greatly expanded in the 1990s.
1.14 Furthermore, Colombia has engaged in important system-level reforms over the last few decades to devolve authority and responsibility for education provision to the local level and to foster accountability for student and school performance. The decentralization process that began in the late 1980s and was later strengthened by the Constitution of 1991 significantly influenced the organization o f the education sector in the country. I t granted the responsibility o f education provision to sub-national governments and reinforced the role of schools as semi-autonomous institutions, responsible for their own rules and academic objective^.^ The laws that followed the Constitution o f 199 1 gave sub-national governments the option to contract educational services with the private ~ e c t o r . ~ Several local administrations in Colombia have taken advantage o f this provision, which has allowed them to become more autonomous in their decision-making and strengthen their management capacity. The implementation and administration of contracts vary, depending on the territorial unit in which they operate, the type o f contracting parties, and the type of contract, though a large portion of their financing comes from the national g~vernment.~
For more information on teacher policy, please refer to Annex 1. For more information on the decentralization process, please refer to Annex 1. For more information on these laws, please refer to Annex 1. World Bank (2007a).
5
Student assessment
1.15 Colombia has taken important steps toward assessing student performance through standardized testing as a tool to improve education at the school, regional, and national levels. In 1991, the MEN began administering national achievement tests, known as the pruebas SABER. Tests were administered in 1991, 1992, 1997, and 1998 to nationally representative samples o f students in grades 3, 5, 7, and 9, which comprise two grades in primary and two in lower secondary. In 2002 and 2003, the MEN began administering the pruebas SABER to al l students in grades 5 and 9, corresponding to the end of primary and lower secondary and thus complementing the Examen de Estado para e l Ingreso a l a Educacidn Superior (Examen de Estado) administered at the end o f upper secondary. The SABER tests have assessed language and mathematics since 199 1 ; natural sciences and citizenship competencies were added in 2002 and 2003, and social sciences in 2005. The SABER tests are not “high stakes,” but rather are intended to generate performance data to inform decision-making and educational policy. The Instituto Colombiano del Foment0 de Educacidn Superior ( ICES) , which administers these tests, also produces statistical reports for the departments and disseminates test results publicly via the MEN website.
1.16 In addition to national assessments, Colombia has also participated in several international and regional assessments o f reading, mathematics, science, and civic education as a measure of i t s comparative level o f achievement. The country’s participation in these assessments shows a commitment to benchmarking i t s performance against international standards. However, as Table 1.1. indicates, Colombia has performed poorly on international assessments, though somewhat better on regional assessments.
6
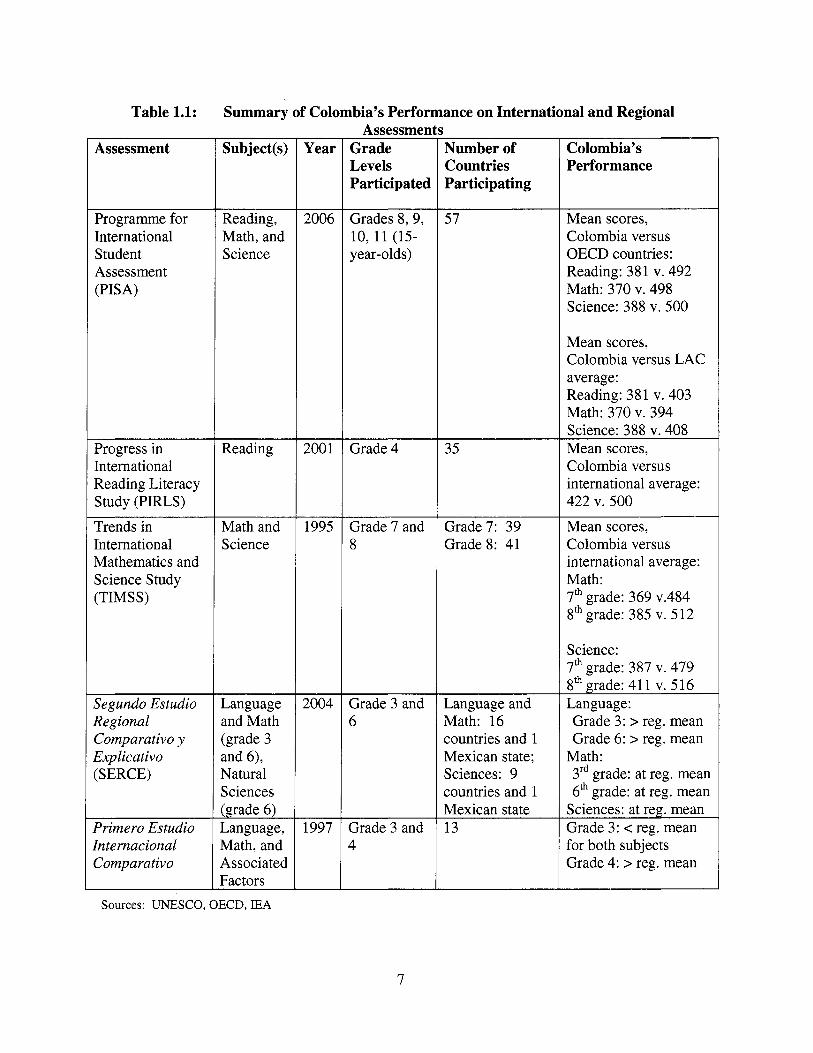
Table 1.1: Summary of Colombia's Performance on International and Regional ~~
Assessment
Programme for International Student Assessment (PISA)
Progress in International Reading Literacy Study (PIRLS)
Trends in International Mathematics and Science Study (TIMSS)
Segundo Estudio Regional Comparativo y Explicativo (SERCE)
Primero Estudio Internacional Comparativo
Subject@)
Reading, Math, and Science
Reading
Math and Science
Language and Math (grade 3 and 6), Natural Sciences (grade 6) Language, Math, and Associated Factors
Sources: UNESCO, OECD, IEA
Year
2006
200 1
1995
2004
1997
Assessmen Grade Levels Participated
Grades 8,9,
year-olds) 10, 11 (15-
Grade 4
Grade 7 and 8
Grade 3 and 6
Grade 3 and 4
7
Number of Countries Participating
57
35
Grade7: 39 Grade 8: 41
Language and Math: 16 countries and 1 Mexican state; Sciences: 9 countries and 1 Mexican state 13
Colombia's Performance
Mean scores, Colombia versus OECD countries: Reading: 381 v. 492 Math: 370 v. 498 Science: 388 v. 500
Mean scores, Colombia versus L A C average: Reading: 381 v. 403 Math: 370 v. 394 Science: 388 v. 408 Mean scores, Colombia versus international average: 422 v. 500
Mean scores, Colombia versus international average: Math: 7" grade: 369 v.484 8" grade: 385 v. 512
Science: 7" grade: 387 v. 479 8" grade: 41 1 v. 516 Language: Grade 3: > reg. mean Grade 6: > reg. mean
3rd grade: at reg. mean 6" grade: at reg. mean
Math:
Sciences: at reg. mean Grade 3: < reg. mean for both subjects Grade 4: > reg. mean
1.17 Colombia has recently participated in two important international evaluations, the Programme for International Student Assessment (PISA) 2006 and Trends in International Mathematics and Science Study (TIMSS) 2007. Chapter 3 of this report analyzes the results o f PISA 2006, which are summarized in the table above. The results of T I M S S 2007 w i l l provide an important point of comparison when they become available in December 2008.
Conclusion
1.18 This chapter has illustrated the progress that Colombia has made in improving education outcomes, the continued room for improvement, i t s planning efforts, and i t s reforms. While Colombia has made important progress in primary enrollment and completion, i t needs to achieve similar improvements in completion at the secondary level and in overall education quality and equity. Colombia i s engaging in planning efforts demonstrating that i t recognizes these priorities, and i t has undertaken reform efforts, some for several decades, aiming at key levers o f change.
1.19 The chapter has also depicted the different levels of the education system and elements student and family, school, and system- that interact to produce education outcomes. I t describes academic outcomes for different segments o f the student population, as well as the policies and programs in Colombia that target students and families to improve such outcomes. I t highlights national teacher evaluation and professional development policies, and school-based improvement programs. I t further mentions system-level efforts to devolve educational decision- making authority and assess student learning so as to inform efforts to improve school and system performance. In this sense, the chapter provides the context for Chapter 2, which describes the characteristics at each of these levels that determine student learning, based on a review o f the literature.
8
CHAPTER 2. DETERMINANTS OF LEARNING OUTCOMES: A CONCEPTUAL FRAMEWORK AND REVIEW OF THE
LITERATURE
2.1 This chapter reviews the existing literature on education quality and the determinants of learning. I t uses a conceptual framework developed by Vegas and Petrow (2007) and classifies the evidence accordingly. Given the complexity of education production, the challenge in determinants of learning studies i s to identify which specific characteristics have an impact. This chapter describes the literature on student, school, and institutional variables that affect student learning. I t analyzes research that uses both national and international assessment data.
The Importance of Education Quality
2.2 Students’ educational attainment matters both for national economic growth and social welfare and for individual economic and social well-being. Furthermore, Psacharopoulos and Patrinos (2004) find that the individual returns to education are higher in low-income countries than in high-income ones. In Colombia, Velez and Psacharopoulous (1 998) find strong evidence that education i s an important determinant o f earnings in BogotB. Indeed returns to education in Colombia appear to be high and increasing: in 1997, an additional year o f schooling yielded a 12.4 percent increase in individual earnings, while in 2003 i t yielded a 14 percent increase (Marcel0 and Ariza 2005).
2.3 A growing body of research places even greater importance on education quality than education quantity for economic growth. For example, two studies (Hanushek and Kimko 2000, Barro 2001) using data from the Trends in International Mathematics and Science Study (TIMSS) find that an improvement in math and science sk i l ls has a far greater impact on economic growth than an increase in schooling attained. Hanushek and Kimko (2000) find that the estimated growth effect of one standard deviation o f quality i s larger than what would be obtained from more than nine years in average schooling. Barro (2001) finds that while a one standard deviation increase in school attainment increases the growth rate by 0.2 percent a year, a one standard deviation increase in test scores increases the growth rate by one percent per year.
2.4 In studying the role of school improvement in economic development, Hanushek and Woessmann (2007) find strong evidence that the cognitive ski l ls of a population, rather than simply the level of schooling attained, i s powerfully related not only to economic growth but also to individual earnings and the distribution of income. They also cautiously conclude that returns to education quality may be even larger in developing countries than in developed countries.
Conceptual Framework
2.5 The demonstrated importance of education quality merits an exploration of the factors that determine student learning in Colombia. To that end, this paper applies the conceptual framework developed in a recent World Bank study on education quality in Latin America (Vegas and Petrow 2007) to the Colombian context. Vegas and Petrow (2007) summarize the factors and policies that affect student learning in the region and approach the problem o f raising
9
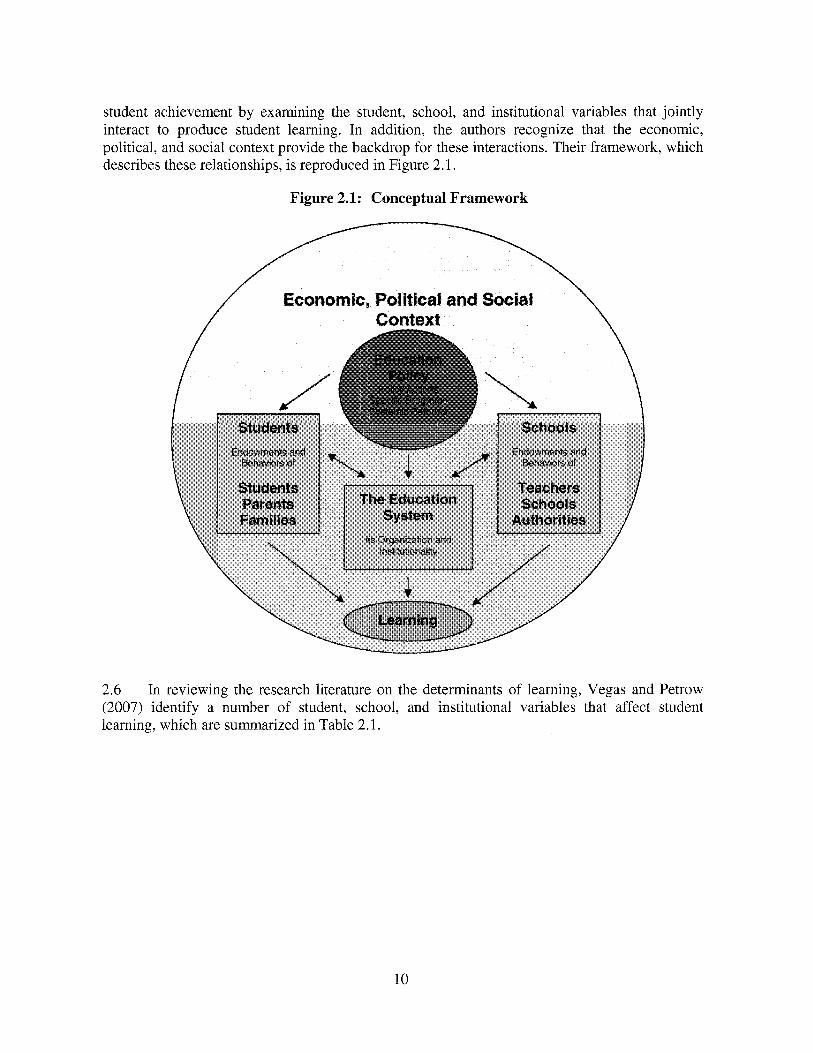
student achievement b y examining the student, school, and institutional variables that joint ly interact to produce student learning. In addition, the authors recognize that the economic, political, and social context provide the backdrop for these interactions. Their framework, which describes these relationships, i s reproduced in Figure 2.1.
Figure 2.1: Conceptual Framework
\ // Economic,
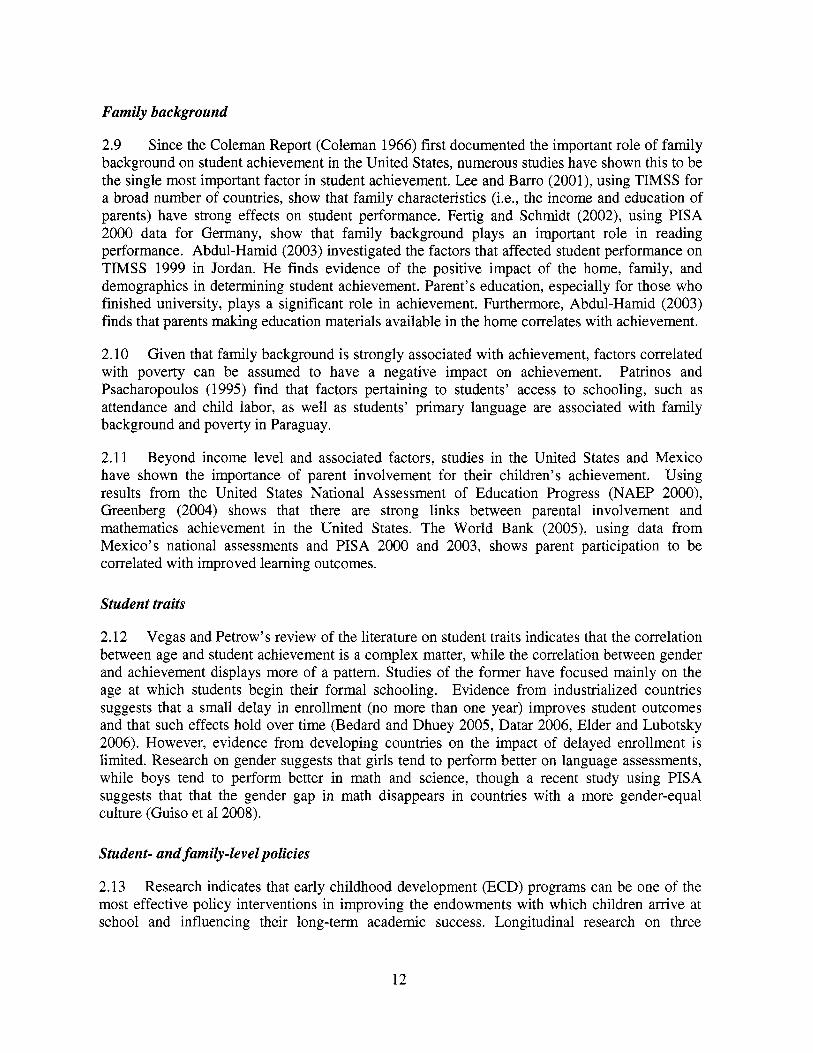
2.6 In reviewing the research literature on the determinants o f learning, Vegas and Petrow (2007) identify a number of student, school, and institutional variables that affect student learning, which are summarized in Table 2.1.
10
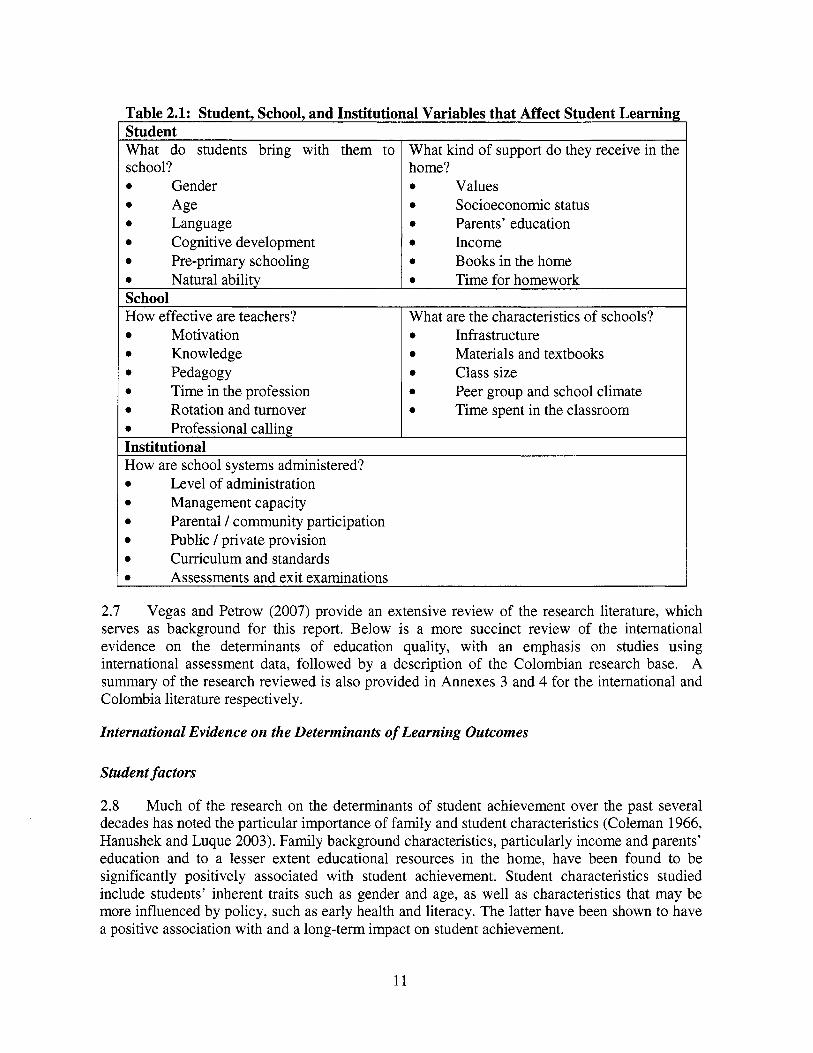
Table 2.1: Student, School, and Institutional Variables that Affect Student Learning Student What do students bring with them to school? 0 Gender 0 Age 0 Language 0 Cognitive development 0 Pre-primary schooling 0 Natural ability School H o w effective are teachers? 0 Motivation 0 Knowledge 0 Pedagogy 0 Time in the profession 0 Rotation and turnover 0 Professional calling
What kind o f support do they receive in the home? 0 Values 0 Socioeconomic status 0 Parents’ education 0 Income 0 Books in the home 0 Time for homework
What are the characteristics o f schools? 0 Infrastructure 0 Materials and textbooks 0 Class size 0
0
Peer group and school climate Time spent in the classroom
Institutional H o w are school systems administered? 0 Level o f administration 0 Management capacity 0 Parental / community participation 0 Public / private provision 0 Curriculum and standards 0 Assessments and exit examinations
2.7 Vegas and Petrow (2007) provide an extensive review o f the research literature, which serves as background for th is report. Below i s a more succinct review o f the international evidence on the determinants o f education quality, with an emphasis on studies using international assessment data, followed b y a description o f the Colombian research base. A summary o f the research reviewed i s also provided in Annexes 3 and 4 for the international and Colombia literature respectively.
International Evidence on the Determinants of Learning Outcomes
Student factors
2.8 Much o f the research on the determinants o f student achievement over the past several decades has noted the particular importance o f family and student characteristics (Coleman 1966, Hanushek and Luque 2003). Family background characteristics, particularly income and parents’ education and to a lesser extent educational resources in the home, have been found to be significantly positively associated with student achievement. Student characteristics studied include students’ inherent traits such as gender and age, as wel l as characteristics that may be more influenced by policy, such as early health and literacy. The latter have been shown to have a positive association wi th and a long-term impact on student achievement.
11
Family background
2.9 Since the Coleman Report (Coleman 1966) first documented the important role o f family background on student achievement in the United States, numerous studies have shown this to be the single most important factor in student achievement. Lee and Barro (2001), using TIMSS for a broad number of countries, show that family characteristics (Le., the income and education of parents) have strong effects on student performance. Fertig and Schmidt (2002), using PISA 2000 data for Germany, show that family background plays an important role in reading performance. Abdul-Hamid (2003) investigated the factors that affected student performance on TIMSS 1999 in Jordan. He finds evidence of the positive impact of the home, family, and demographics in determining student achievement. Parent’s education, especially for those who finished university, plays a significant role in achievement. Furthermore, Abdul-Hamid (2003) finds that parents making education materials available in the home correlates with achievement.
2.10 Given that family background i s strongly associated with achievement, factors correlated with poverty can be assumed to have a negative impact on achievement. Patrinos and Psacharopoulos (1995) find that factors pertaining to students’ access to schooling, such as attendance and child labor, as well as students’ primary language are associated with family background and poverty in Paraguay.
2.1 1 Beyond income level and associated factors, studies in the United States and Mexico have shown the importance of parent involvement for their children’s achievement. Using results from the United States National Assessment of Education Progress (NAEP 2000), Greenberg (2004) shows that there are strong links between parental involvement and mathematics achievement in the United States. The World Bank (2005), using data from Mexico’s national assessments and PISA 2000 and 2003, shows parent participation to be correlated with improved learning outcomes.
Student traits
2.12 Vegas and Petrow’s review o f the literature on student traits indicates that the correlation between age and student achievement i s a complex matter, while the correlation between gender and achievement displays more of a pattern. Studies of the former have focused mainly on the age at which students begin their formal schooling. Evidence from industrialized countries suggests that a small delay in enrollment (no more than one year) improves student outcomes and that such effects hold over time (Bedard and Dhuey 2005, Datar 2006, Elder and Lubotsky 2006). However, evidence from developing countries on the impact of delayed enrollment i s limited. Research on gender suggests that girls tend to perform better on language assessments, while boys tend to perform better in math and science, though a recent study using PISA suggests that that the gender gap in math disappears in countries with a more gender-equal culture (Guiso et a1 2008).
Student- and family-level policies
2.13 Research indicates that early childhood development (ECD) programs can be one of the most effective policy interventions in improving the endowments with which children arrive at school and influencing their long-term academic success. Longitudinal research on three
12
programs in the United States has shown that participants in high-quality ECD programs have higher cognitive and academic achievement, higher educational attainment, and lower levels o f risky behavior and criminal involvement (Galinsky 2006). In a review o f 20 rigorous studies on the effects o f E C D programs in developing countries, including Colombia, the Lancet Development Series finds that center-based pre-schools have a substantial effect on cognitive development and that parenting programs with home visiting also show positive effects on chi ld development (Engle et a1 2006).
School factors
2.14 While early literature on learning achievement concluded that the socioeconomic characteristics of children are the dominant determinants o f student academic performance, more recent research emphasizes that the influence o f teacher and school characteristics can be substantial (Woessmann 2003, Hanushek and Woessmann 2007). Research has examined the effects o f teacher quality and specific teacher characteristics such as education level and experience, as well as o f school characteristics such as resources and climate.
Teacher characteristics
2.15 Hanushek and Woessmann (2007) note the mounting evidence that teacher quality i s the key ingredient to student performance. Fertig and Schmidt (2002) find that school conditions, including teacher shortages, account for a sizeable fraction o f students’ individual success on PISA 2000. Furthermore, in a study using panel data on student test scores and teacher assignment, Rockoff (2004) shows that a one standard deviation increase in teacher quality (measured with teacher fixed effects) raises test scores by 0.1 standard deviations in reading and mathematics on nationally standardized distributions o f achievement. However, Hanushek and Woessmann note that the observed differences among teachers in terms o f student outcomes are not closely related to common characteristics o f teachers, such as teacher education.
2.16 In addition to teacher quality, teacher absenteeism has also been found to have an important effect on student performance. In most developing countries, i t i s unusual for teachers to be fired for absences, which results in extremely high levels o f absenteeism. Chaudhury et a1 (2006) find that, in a group o f six developing countries, teacher absenteeism in primary education reaches 19 percent, with even higher rates in the poorer regions. Such absenteeism reduces children’s opportunity to learn and achieve better academic results. In the case o f Indonesia, for example, Suryadarma et a1 (2006) find evidence that teacher absenteeism has a significant negative effect on fourth graders’ performance on mathematics tests in public schools.
2.17 One review o f studies on developing countries suggests that the curriculum and pedagogy that teachers employ matter for student achievement. Heneveld and Craig (1996) find that a curriculum with appropriate scope and sequence and content related to pupil experience, as well as appropriate teaching practices such as active student learning, including discussion and group work, comprise basic inputs in the development o f effective schools in developing countries.
13
School resources
2.18 Research on the impact of school resources has been inconsistent, but may imply that, beyond a minimum level of resources, resource allocation and institutional structure matter more than spending levels per se. On the one hand, Lee and Barro (2001) show that school resources are closely related to school outcomes, as measured by internationally comparable test scores, repetition rates, and dropout rates. The findings also indicate that more school resources - especially smaller class sizes - may enhance educational outcomes. However, Hanushek (2004a) emphasizes that existing research on the relationship between school resources and improved educational achievement i s inconclusive and that outcomes may in fact depend on interactions between resources, teacher quality, and other inputs, making it difficult to identify best practices. More recently, Hanushek and Woessmann (2007) also note the research finding that simple resource policies, such as reducing class sizes, increasing teacher salaries, spending more on schools, etc., have litt le consistent impact on student performance when the overall institutional structure remains unchanged. This i s not to say that resources never have an impact on education performance. For example, the authors note that basic resources in the least developed schools, such as textbooks for all students, are found to have a reliable impact.
2.19 In developing countries, Heneveld and Craig (1996) show that sufficient resources comprise necessary basic inputs in the development of effective schools. Specific inputs include instructional materials such as textbooks, supplementary teachers’ guides and materials, and library books, as well as time for learning in terms of the number and length of school days.
Other school factors
2.20 Research also highlights the value of school climate on achievement. Greenberg (2004) uses the United States’ National Assessment of Educational Progress (NAEP) 2000 to show that students in schools with the highest student behavior values had higher mean mathematics scores than students in schools in the middle or at the bottom of the student behavior distribution. Similar relationships existed between school morale and mathematics achievement. The World Bank Mexico study mentioned above finds that teacher morale, teacher-student relations, teacher behavior, school climate, teacher expectations of student performance, and active learningheaching styles are all associated with better learning outcomes. Fertig and Schmidt (2002) find that students in the bottom of the performance distribution appear to suffer most if their education environment i s sub-standard.
Institutional factors
2.21 Recent research has brought to the forefront the importance of institutional factors for student achievement. For example, Fuchs and Woessmann (2004) found that institutional factors explain one quarter of the variation in test scores between countries. Research on institutional factors has highlighted the importance of autonomy over different areas o f decision-making at different institutional levels. I t has also noted the importance that such autonomy be coupled with centralized assessment of student performance and institutional capacity. I t has furthermore described the importance o f competition from private educational institutions, accountability for performance, and effective governance.
14
2.22 In an important paper using TIMSS data to conduct an econometric, student-level estimation for more than 260,000 students from 39 countries, Woessmann (2003) suggests that differences in educational institutions explain the large international differences in student performance in cognitive achievement tests. The findings align with those of Hanushek and Woessman (2007) that international differences in student performance are not caused by differences in schooling resources but are mainly due to differences in educational institutions. Taking all countries into consideration, he finds that the following factors are correlates of science and mathematics performance:
Teacher influence on teaching methods School autonomy in personnel hiring and salary decisions Limited influence of unions on curriculum scope Centralized control of curriculum and budget matters Central examinations Scrutiny of student performance through exams, homework, and parent-teacher meetings Intermediate level of administration Competition from private educational institutions Encouragement of parents to take an interest in teaching matters
2.23 Woessmann distinguishes between factors over which schools should retain decision- making authority (i.e., pedagogy and personnel) and factors which should remain centralized (i.e., curriculum, assessment, and budgetary matters).
2.24 Evidence from Finland’s experience with PISA lends itself to highlighting the importance o f school autonomy in terms of flexible curriculum options. Among OECD countries, Finland earned the highest scores in reading literacy in 2000. In addition, Finland scored relatively high in terms of equality. The authors o f one report attribute Finland’s success to a flexible school curriculum and offering of optional subjects (Valijarvi et a1 2002). In 2003, Finland repeated i t s success in PISA, ranking highest among OECD countries in terms of math scores, and coming in second among all participant countries, behind Hong Kong. Finland tied with Japan for first place among all countries for reading scores. In 2006, Finland was the highest-ranking country in terms of science.
2.25 By setting standards for performance, centralized examinations may be an important complement to school autonomy. Fuchs and Woessmann (2004) find that school autonomy greatly improves student achievement in school systems that have central exit exams. Woessmann (2004) confirmed the role of central exams and school autonomy in raising levels o f student achievement. Using data from T I M S S 1995 and 1999 and PISA 2000, he finds that students in schools with central exams and autonomy over teacher salaries and course content, as well as schools that allowed for teacher influence over resource funding, outperformed students from schools with no autonomy and no central exams. They also scored higher than students from schools with no autonomy but with central exams.
2.26 The effectiveness o f decentralization may also require strong local institutional capacity. Studying the effects of decentralization b y comparing recently decentralized versus previously decentralized secondary schools in Argentina, Galiani et a1 (2005) find that, on average, decentralization improves performance on standardized Spanish and mathematics tests.
15
However, they further find that decentralization only has a positive effect in non-poor or well- managed provinces. B y contrast, test scores fell in schools that were newly decentralized in poor municipalities located in weakly managed provinces.
2.27 Finally, effective governance and accountability may also matter to student achievement. As mentioned above, Abdul-Hamid (2003) uses TIMSS 1999 data to investigate the factors that affected student performance in Jordan. He finds that school governance plays an important role in determining achievement. These factors matter not only for achievement but also for exposure to certain teaching methods, such as problem solving and critical thinking, to the advantage of private and urban schools. In a study of accountability mechanisms in the United States, Hanushek (2004b) finds that accountability systems raise levels o f student achievement. However, impact i s minimal when schools are just required to report scores. Tying incentives or disciplinary consequences to school performance has been shown to have a greater impact.
2.28 The conditions of autonomy and capacity likely work in concert with systems of assessment, governance, and accountability to produce student achievement. A World Bank (2005) study finds that school climate, pedagogic methods, autonomy, assessments, and accountability are all important to student achievement in Mexico. Lockheed and Verspoor (1 991) describe conditions favorable for improving schools in developing countries as including:
Community involvement and support, which includes both good school-community relations and parental involvement in the school; Flexibility relevant to pupil curricula and adjustments in level and pace and organizational flexibility to include school clusters and active teaching; Pedagogical flexibility to allow for teaching innovations; Implementing decentralized, school-based solutions to problems; School-based professionalism, including leadership by the school head, teacher collegiality, and commitment, and accountability through assessment, supervision, and support.
Colombian Evidence on the Determinants of Learning Outcomes
2.29 Available research on the determinants of learning in Colombia reinforces many of the findings from the international literature. Most of the research utilizes data from two national assessments, the Pruebas SABER and the Examen de Estado (described in Chapter 1) and seeks either to illuminate the determinants of learning per se or to evaluate certain programs and policies. O f the two studies using international assessment data that provide data on Colombia, one (Woessmann and Fuchs 2005) focuses on Colombia and Argentina specifically, while another (Hanushek and Luque 2003) discusses the country in the context of a large international data set.
Student factors
2.30 Research on the determinants of learning in Colombia finds that a number of student factors, notably socioeconomic background, play an important role in academic achievement. A strong and significant correlation between socioeconomic status and educational performance holds true at the primary level (Woessmann and Fuchs 2005, Car0 2000), as well as at the upper
16
secondary (Iregui et a1 2006, Pifieros and Rodriguez 1999). Woessmann and Fuchs (2005) find that after controlling for income, the positive impact o f books in the home on grade 4 reading scores i s small.
2.31 A number of studies suggest that family background may be influential in particular ways, such as on literacy development (Woessmann and Fuchs 2005, Pifieros and Rodriguez 1999) and in the determination of which school a child attends (Gaviria and Banientos 2001, Sarmiento et a1 2000). Using data from the 2001 Progress in International Reading Literacy Study (PIRLS), Woessmann and Fuchs (2005) find household income to be strongly and significantly related to grade 4 reading performance in Colombia. Pifieros and Rodriguez (1999) find that while socioeconomic level has a positive impact on performance on the national Exumen de Estudo, i t s predictive power i s particularly high for language, and less so for mathematics or science. Gaviria and Barrientos (2001) and Sarmiento et a1 (2000) find that parents’ education and socioeconomic background respectively strongly influence which schools students attend, which in turn effects their achievement.
2.32 Factors pertaining to students’ access to schooling have also been found to effect their achievement. Car0 (2000) finds absenteeism and child labor to have significant, negative effects on academic performance in grades 3 and 5 in BogotB. Pifieros and Rodriguez (1999) find the length of students’ commute to be negatively correlated with performance on the national Exumen de Estudo.
2.33 Continuity of the school attended i s another factor that may play a role in student achievement. Pifieros and Rodriguez (1999) find a positive correlation between performance on the Exumen de Estudo and keeping students in the same school for the duration of their secondary studies. They hypothesize this continuity acts to minimize “transition costs” that may negatively impact students’ performance. Woessmann and Fuchs (2005) find that students in schools where they typically stayed with the same teacher for one year or less in primary school performed statistically significantly lower in grade 4 reading.
Student- and family-level policies
2.34 As described in the review o f international literature, early childhood development programs show tremendous potential for short-term and long-term academic effects. A study of the Hogures Comuniturios de Bienestur Familiar (HC) program, which provided community nursery care with a nutritional component, shows that students aged 13-17 who had attended H C were more likely to be enrolled in school and to progress a grade (Attanasio and Vera-Hernandez 2004). Studies of daycare-based feeding and stimulation programs in Colombia show the greatest effect on cognitive development for those enrolling for the maximum time and beginning earliest (McKay et a1 1978 and Politt and Escarnilla 2007, cited in Engle et a1 2006). Studies o f nutritional and stimulation programs in Colombia show that children receiving nutritional supplements have higher motor development than the control group, while children receiving stimulation during home visits have greater language ability (Waber et a1 1981 and Super et a1 1990, cited in Engle et a1 2006).
2.35 A conditional cash transfer (CCT) program designed to offset the cost to families of investing in their children’s education has also been found to improve enrollment. Initially
17
targeting the lowest-income inhabitants in municipalities of less than 100,000, Familias en Accidn provided cash transfers to families contingent on their children’s school attendance. Attanasio et a1 (2006) find that the program had a positive impact: i t increased school participation of 14- to 17-year-old children by between 5 and 7 percentage points and of 8- to 13- year-old children by 1.5 to 2.5 percentage points.
2.36 Using a pilot study of a CCT program in the city of Bogotfi in 2005, Barrera et a1 (2008) find evidence o f a significant positive peer effect in attendance decisions. One child’s exposure to the cash incentives has an indirect effect on his peers. Even if they are not eligible for the program, peers increase their demand for schooling because of friendship networks effects. Moreover, the magnitude of this increase i s similar to that of the treated. This result confirms the efficacy o f conditional cash transfer programs even when financial restrictions limit the eligibility to targeted subgroups.
School factors
2.37 While student factors clearly matter to academic achievement in Colombia, several studies demonstrate that schools also have effects on student learning outcomes. Piiieros and Rodriguez (1999) find that schools have a small but significant effect on achievement, explaining 15-18 percent o f variance among students in private schools and 12-16 percent in public schools. Sarmiento et a1 (2000), who examined studies o f academic achievement across dissimilar samples at both the primary and upper secondary levels, find the’ weight o f the school on mathematics achievement to be consistently roughly 30 percent. Gaviria and Barrientos (2001) find that differences among schools explain a substantial portion of differences in individual achievement on the Examen de Estado. Piiieros and Rodriguez (1999) also show great differences in performance among schools, particularly private schools, and among students within schools on the Examen de Estado.
2.38 Research on Colombian schools has focused on teacher characteristics and school resources, such as class size, school infrastructure and materials, time on task and overall spending levels. While extensive research has been done comparing the performance of public and private schools, this body o f research i s addressed in the section on institutional factors, in accordance with the Vegas and Petrow (2007) framework.
Teacher characteristics
2.39 While Hanushek and Woessmann (2007) note the growing evidence of the importance of teacher quality for student performance, they also note the difficulty in describing the characteristics of good teachers. Perhaps for that reason, studies in Colombia as elsewhere have tended to focus on quantifiable characteristics such as teachers’ educational attainment and years of teaching experience. Some studies show that such factors are insignificant for student performance in Colombia, while others find an impact in certain cases. One study (Uribe et a1 2006) that examines teacher quality (measured with teacher fixed effects, highest educational degree obtained, and experience) by analyzing student performance over a one-year period shows that teacher quality does matter.
18
2.40 Two studies using international assessment data find teacher education, training, and experience to be insignificant. Woessmann and Fuchs (2005) find that there i s no statistically significant relationship between student performance on the 2001 PIRLS and teachers’ holding either a university degree or a teaching certificate. The relationship between teachers’ experience in the teaching profession and student performance i s also not statistically significant. Hanushek and Luque (2003), using performance data on the 1995 Third International Mathematics and Science Study (TIMSS) for more than 40 countries, find that the percent o f teachers with a university degree and the percent that receive specialized teacher training both had a positive but statistically insignificant effect on student performance.
2.41 By contrast, studies using national assessment data find these teacher characteristics to have statistically significant effect on student achievement among certain populations or under certain conditions. Examining student achievement in grades 3 and 5 in Bogota, Car0 (2000) finds the average schooling o f teachers to be correlated with differences in achievement among schools. Gaviria and Bamentos (2001) find that among private schools, the average education o f teachers and the number o f teachers per student are positively associated with student achievement on the Exumen de Estudo, but for public schools there i s no association between these characteristics and achievement.
2.42 In a study o f a Bogota policy to expand enrollment by subsidizing private schools, Uribe et a1 (2006) shed further light on the effect o f teacher quality and other school factors by examining the performance o f grade 5 students over a one-year period. They find that teacher quality, as wel l as peer group composition and class size, al l have an impact on student achievement in grade 5. They further show that teachers with less than a four-year degree are less effective, on average, than those with a four-year degree, while teachers with more than a four-year degree are no more effective than those with only a four-year degree. In addition, they note that the greatest gains from additional teaching experience come in the first years o f teaching, which aligns with the international evidence, and that more experienced teachers may be assigned to classes that are larger and have more needy students, which may neutralize the positive effect o f their teaching experience. They further show that there i s considerable variation in the effectiveness o f teachers, particularly among private schools. Finally, the authors find that students in classrooms in which their peers have more educated mothers achieve higher math scores6 and that class size i s a statistically significant predictor o f achievement.
School resources
2.43 Other studies examining the effect o f class size have yielded a range o f results, which may reflect the potential endogeneity of class size, that is, students requiring extra attention may be assigned to smaller classes. Woessmann and Fuchs (2005) find that small class size does not have a statistically significant effect on performance. Similarly, Hanushek and Luque (2003) find that class size has a negative but insignificant effect on student performance on the 1995 TIMSS in Colombia. Cox and Jimenez (1991) find that private school students do better in larger classes, while public school students do better in smaller classes.
The research design permitted the testing of this hypothesis in mathematics but not in other subjects.
19
2.44 Three studies show a significant association of academic infrastructure and educational materials with student achievement. Iregui et a1 (2006) determine that school infrastructure, such as science laboratories, libraries, and sports facilities, have a statistically significant, positive effect on student achievement on the Exumen de Estudo. Piiieros and Rodriguez (1999) also find that an adequate input supply positively impacts achievement on the Exumen de Estudo. Woessmann and Fuchs (2005) find that students who attend schools whose directors report that instruction i s strongly impeded by the lack o f instructional materials perform worse on the 2001 PIRLS to a statistically significant extent.
2.45 Three studies also show the positive effect of the length of the school day on student achievement, while a fourth indicates that instructional time i s not significant. Iregui et a1 (2006) find that having a full-day schedule i s significantly positively correlated with student achievement on the Exumen de Estudo. Similarly, Pifieros and Rodriguez (1999) find that students enrolled in schools with a full-day schedule show significantly higher performance than their counterparts. In addition, Car0 (2000) finds a correlation between the intensity o f the school day and differences in achievement among schools in Bogota in grades 3 and 5. By contrast, Woessmann and Fuchs (2005) find that instructional time i s not statistically significantly related to performance on the 200 1 PIRLS.
2.46 Finally, Gaviria and Barrientos (2001) note that the difference in quality between public and private schools has remained constant despite substantial increases in public spending on education, which may corroborate the finding from the international literature that how resources are spent matters more than the level of expenditure.
Institutional factors
2.47 The institutional characteristics studied in the greatest depth in Colombia have been those o f public versus private school provision and, as a corollary, decentralization and autonomy, while other important characteristics, such as a national curriculum and assessment system, have been studied to a much more limited extent.
National curriculum and assessment
2.48 Woessmann and Fuchs (2005), who studied the 2001 PIRLS performance of Colombia, Argentina and six comparator countries, describe their findings on the effects of curriculum and assessment on student performance within those countries. Students in schools whose curriculum i s strongly influenced by the national or regional curriculum did not perform statistically significantly better in Colombia, which may point to the success of local autonomy and adaptation. In addition, teachers’ methods to monitor student progress, in terms o f classroom tests or the centralized examinations administered in the countries studied, are not statistically significantly related to reading performance.
20
Private provision and contracting
2.49 Studies comparing student achievement in public and private schools on the whole have favored private schools. However, their results should be interpreted with caution, as an important selection problem prevails. Cox and Jimenez (1991) find that after standardizing for differences in student and school attributes, private school students have higher test scores. Yet, the authors also find that selection bias does affect the measurement of private-public achievement differences. Car0 (2000) finds that public schools are negatively correlated with differences in achievement among schools in grades 3 and 5 in Bogoth. In addition, N6iiez et a1 (2002) find that after controlling for student and home characteristics (including the endogeneity in the selection of the school), school infrastructure, and education level of teachers, at the national level, as well as the urban and rural levels, private school students outperform public school students on the Examen de Estado.
2.50 Some studies have attributed these differences in performance to the incentive structure present in private schools and schools implementing education reform models such as Escuela Nueva. For example, Nuiiez et a1 (2002) attribute the difference in performance between public and private school students to unobservable variables such as the system for teacher incentives and advancement. In addition, the authors determine that students in Escuela Nueva performed better than those at traditional public schools. They assert that Escuela Nueva succeeds in creating incentives and appropriate spaces for the improvement o f quality education. As mentioned earlier, Gaviria and Bamentos (2001) find that among private schools, the average education of the teachers and the number of teachers per student, are positively associated with student achievement, while for public schools there i s no association between these characteristics and student achievement. The authors conclude that the effects o f school characteristics on achievement are mediated by the structure o f incentives that governs relationships among students, teachers, public figures, and parents, for example through teacher compensation and promotion, community participation in school decision-making, and competition among schools.
2.5 1 However, other studies find that students’ socioeconomic status plays an important role in determining the performance of private and public school students. Sarmiento et a1 (2000) find that taking socioeconomic status into account, it i s not clear that private schools outperform public schools. Pifieros and Rodriguez (1999) find that after controlling for the effect of socioeconomic level on academic performance, students in public schools actually perform better than those in private schools. They further find that the relationship between socioeconomic level and academic performance i s greater in private schools. Nufiez et a1 (2002) find that at the lowest income level, public school students perform better than those at private schools. This may counter the claim of Uribe et a1 (2006) that students perform better when mixed with students whose mothers are more educated. However, i t may instead point to the possibility that lower- income students are likely to attend poorer quality private schools.
2.52 Research on policy initiatives undertaken by Colombia and Bogota in the private provision and contracting o f educational services provides additional insight into how such approaches affect student learning. This body of evidence i s described below.
2.53 While Colombia’s voucher program, Programa de Ampliacidn de Cobertura de la Educacidn Secundaria (PACES), i s no longer being implemented, i t i s an important program that
21
has been considered the gold standard for evaluation o f vouchers around the world. Studies of PACES show a positive impact on measures of efficiency and academic achievement. Angrist et a1 (2002,2006) find that PACES did not improve secondary school coverage, as i t s name would imply, but it did affect enrollment in private schools, as well as completion and achievement rates. Lotteries held in the municipalities in which demand for vouchers exceeded supply allowed the authors to assess the program by comparing winners and losers. In their 2002 study of students in Bogota and a suburb of Cali, they find that three years after the lotteries, voucher recipients were about 10 percentage points more likely to have finished grade 8, primarily because they were less likely to repeat grades, and scored 0.2 standard deviations higher on achievement tests. In the 2006 study of students in Bogota, the authors find that the PACES program increased the rate o f registration for the Exumen de Estudo and probably secondary school completion by 5-7 percentage points. They further find that the program increased test scores by 0.2 standard deviations.
2.54 In a complementary paper, Bettinger, Kremer, and Saavedra (2008) present evidence against the hypothesis that vouchers operate only through peer effects. Moreover, they show that private vocational institutions teach more relevant ski l ls than public vocational establishments do, which i s in line with the idea of flexibility as a key channel for higher education outcomes.
2.55 While these findings suggest a positive impact on those students who participated, King et a1 (1999) find that although participation in the program was widespread, only 25 percent of municipalities joined the program and most of the vouchers were distributed in large, urban areas. The authors conclude that municipalities with a larger number of underserved students or whose private schools had relatively l itt le excess capacity opted not to participate, presumably because the cost of participating would have exceeded the cost of building additional schools.
2.56 Rather than providing vouchers to students, the Bogota Concession Schools program enables the district to contract for the establishment and management o f private schools. Sarmiento et a1 (2005) find important differences between concession schools and other public schools in terms of greater autonomy in the definition o f their education approach, better management of teachers and resources, more capacity to adjust the education production process, and better management of school climate. Barrera-Osorio (2006) finds a positive impact of the program on student outcomes, for the concession schools themselves and by some measures for schools in the surrounding areas. H e shows that dropout rates are lower in concession schools than in similar public schools, other public schools nearby the concession schools have lower dropout rates than other public schools outside the area of influence, and test scores for concession schools are higher than in similar public schools.
Autonomy and decentralization
2.57 Several studies of the decentralization process have indicated a significant increase in the levels o f aggregate coverage and enrollment, though they also reveal inefficiencies and inequalities that impede the improved performance of the system. Vergara and Simpson (2002) find a positive trend on important education indicators such as coverage and literacy rates. Sanchez (2006) also finds a positive effect of decentralization on the supply of public education. In particular, he finds that certified municipalities that can independently decide how to spend their main national funding source have a positive and significant relation with the number of
22
enrolled students in public schools. However, he also finds that levels o f performance in the provision of education services vary greatly between municipalities. Similarly, Melo (2005) asserts the positive effect of the decentralization process on the levels of coverage in primary and secondary education; yet, she confirms, too, that important inefficiencies prevail in several departments around the country that impede higher performance rates.
2.58 The World Bank (2007a), which also notes considerable differences among municipalities, finds that certified municipalities are more efficient on average than non-certified municipalities in providing education coverage and quality, given certain inputs such as the teacher-student ratio, the level of per capita investment in education, the number of teachers per grade in the salary scale, and the classroom space available. This may partly be explained by the disjointed nature of non-certified municipalities’ responsibilities and poorly defined school ownership. For instance, the departments are in charge of the payroll while the municipalities are in charge of school maintenance. The study finds that certification of education services seems to reduce inefficiency in both education enrollment and education quality
.
2.59 Research on the impact o f decentralization on the quality of education i s more limited and generally suggests a negative effect. Melo (2005), for example, finds a negative effect on academic achievement. Using national scores from the Examen de Estado, the author finds that student performance in public schools declined considerably between 1987 and 1997, widening the gap with student performance in private schools. Rodriguez (2005) also shows that the quality gap between private and public schools increases after decentralization7. Similarly, using a quasi-experimental methodology, Barrera (2003) asserts that there i s a positive impact of decentralization on student test scores in those schools that are expected to benefit from the decentralization process (public and, specially, public in departments highly dependent on resources from the national government, as they would have more resources available from the national government). This impact, however, i s negative if a more flexible model that allows for nationwide shocks (like recessions) and other changes across public schools (like changes in curriculum) i s used. Such model takes into account a more complete description of potential events that have affected the education system.
Conclusion
2.60 Both the international and the Colombian literature have shown that a number o f student, school, and institutional factors are associated with student learning. A summary o f these variables and their correlation with student achievement i s presented in Table 2.2.
However when household decisions are taken into account, the results reverse.
23
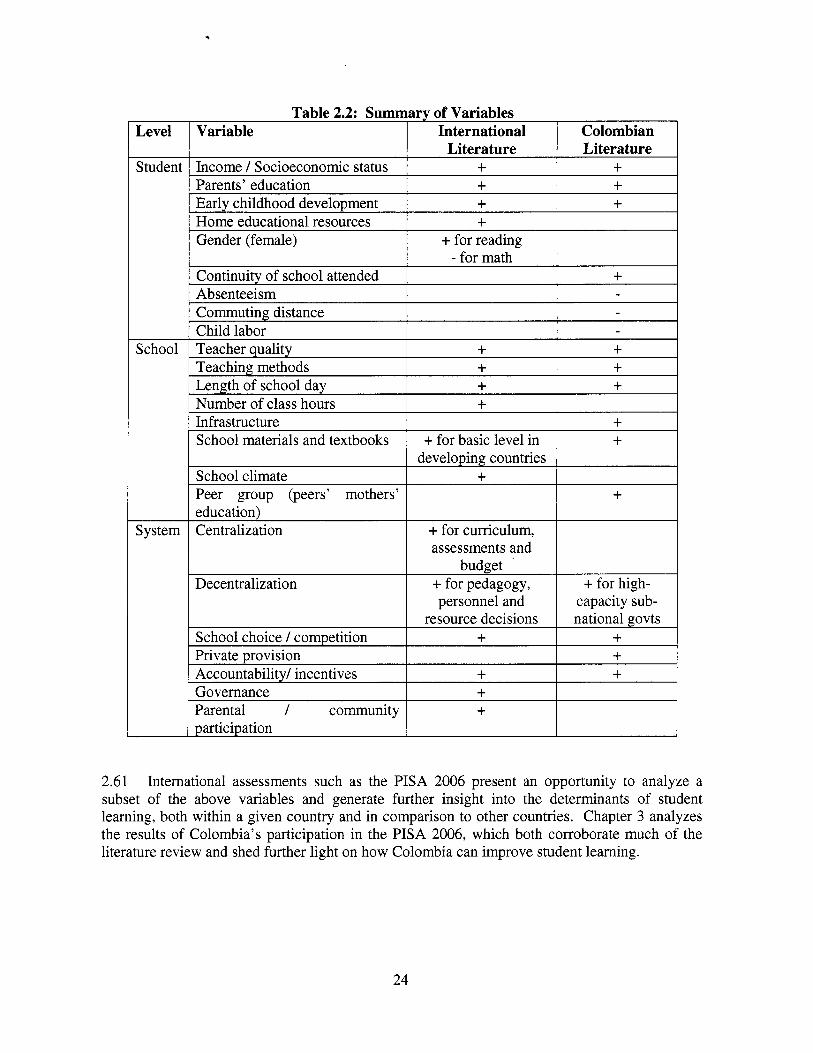
4
Table 2.2: Summary of Variables Variable International Colombian
Literature Literature Income / Socioeconomic status + + Parents’ education + + Earlv childhood develoPment + + Home educational resources + Gender (female) + for reading
- for math Continuity of school attended + Absenteeism Commuting distance Child labor
Private provision + Accountability/ incentives + + Parental I community + Governance + participation
2.61 International assessments such as the PISA 2006 present an opportunity to analyze a subset of the above variables and generate further insight into the determinants o f student learning, both within a given country and in comparison to other countries. Chapter 3 analyzes the results of Colombia’s participation in the PISA 2006, which both corroborate much o f the literature review and shed further light on how Colombia can improve student learning.
24
CHAPTER 3. COLOMBIA’S PERFORMANCE IN THE PROGRAMME FOR INTERNATIONAL STUDENT ASSESSMENT
(PISA)
3.1 In 2006, 57 countries participated in PISA, including Colombia and f ive other countries f rom the Latin America region. An initiative o f the OECD, PISA provides a measure o f reading, mathematics, and science achievement among 15-year-old students for a nationally representative sample o f schools. PISA’s assessment focuses on young people’s ability to apply their knowledge and sk i l ls to real-life problems and situations, rather than on how much curriculum-based knowledge they possess. Thus, the test focuses on evaluating students’ capabilities and readiness for lifelong learning, important factors in a knowledge-based economy. These measures are comparable across countries, making the test an extremely useful tool for benchmarking against other participant countries. Furthermore, PISA uses questionnaires to generate supplemental data on student, school, and institutional factors, which provide an opportunity for deeper analysis o f the relationship between these variables and student performance. Colombia’s participation in the PISA 2006 was the first in i t s history, a reflection o f the country’s commitment to improving the quality o f i t s education system.
3.2 The present analysis augments the existing literature and adds value by allowing the deep analysis o f the Colombian case using PISA data, rather than a general presentation o f PISA results or an analysis based on Colombia’s national assessment data. It aims to shed light on Colombia’s performance and level o f equity relative to other countries within and outside the region, including countries that are at the same level o f economic development. I t also provides insight into the factors that are correlated with i t s learning outcomes, particularly institutional variables that may be more readily studied using international datasets, and allows for a detailed analysis o f different categories (quintiles) o f performers. From these many vantage points, i t seeks to spark and deepen a dialogue on education quality in Colombia.
Methodology
3.3 The methodological approach i s as follows. Mean test score comparisons are used to understand Colombia’s performance relative to other countries and to expectations given i t s Gross Domestic Product (GDP) and the country’s socioeconomic characteristics. Countries are grouped by income level to facilitate comparison o f their performance, given the strong correlation between GDP and education outcomes (Hanushek and Woessmann 2007). A discussion o f the relative distribution o f equity and quality in the system i s also undertaken. The analysis then looks at the relationship between student, school, and institutional characteristics and the country’s learning outcomes. In addition, quantile regression estimations are used to
25
identify the relevant student, school, and institutional factors affecting test scores8, with an emphasis on their differential effects by level of student performance.
3.4 The estimators used in the analysis are Ordinary Least Squares (OLS), with clusters by school. Moreover, the analysis makes estimations using plausible values, as recommended by PISA. Cluster specification “specifies that the standard errors allow for intra-group correlation, relaxing the usual requirement that the observations be independent. That is, the observations are independent across groups (clusters) but not necessarily within groups.” (Stata manual, version 9.0). Indeed, what Multilevel Statistical Models allow i s to control for units grouped at different levels, in this case, students grouped in schools (Goldstein 1999).
3.5 Several limitations of the PISA data and the efforts of this analysis to mitigate them deserve mention. First, missing values are important. While several authors use imputations to address this problem, the approach of this analysis i s to work with the original data and attempt to maximize the use o f variables that have a high level of responses. Second, some variables are constructed using questions about perceptions, and clearly perceptions can be erroneous. T h i s analysis computes the sample statistics of several variables and uses the ones that, based on our knowledge, appear to reflect reality. Third, the data may contain questions that are interpreted differently in different contexts. For instance, the definition o f school autonomy may vary from one country to another. Similarly, an effort was made to report means and deviations of the most important variables in the text, choosing those that made sense according to data from other sources.
3.6 The analysis o f the distribution across PISA proficiency segments and the predictors of student learning focus in particular on mathematics performance, which also bears explanation. O f the three subjects tested, mathematics best measures the aptitude to solve problems, one of the most important attributes in learning. While science was an expanded subject in PISA 2006, science tends to be more curriculum-based, while math tends to be more independent o f the curriculum. In addition, the number of math questions included was the same in 2003 and 2006 and, therefore, reflected the same time dynamic in both years. While Colombia did not participate in PISA 2003, i t i s expected that Colombia wi l l participate in PISA 2009, which w i l l present an opportunity to compare like samples in terms of this time dynamic. Finally, as w i l l be discussed below, Colombia performed worst in mathematics of all three subjects, which merits further exploration.
International and Regional Comparisons
3.7 countries in the PISA 2006 assessment. Colombia’s overall performance i s as f01lows:~
Students from Colombia score lower on reading, mathematics, and science than most
In reading, i t s mean score i s 381 points, which i s 171 points below that of Korea, the best reading performer.
I t i s important to note that, even though PISA collects and reports information about teachers, i t does so as part o f a set o f contextual indicators relating students and school characteristics. Therefore, efforts to measure the complete effect of teachers on student learning fall out o f the scope o f t h i s study.
Rankings correspond to the estimated upper rank provided in the OECD report.
26
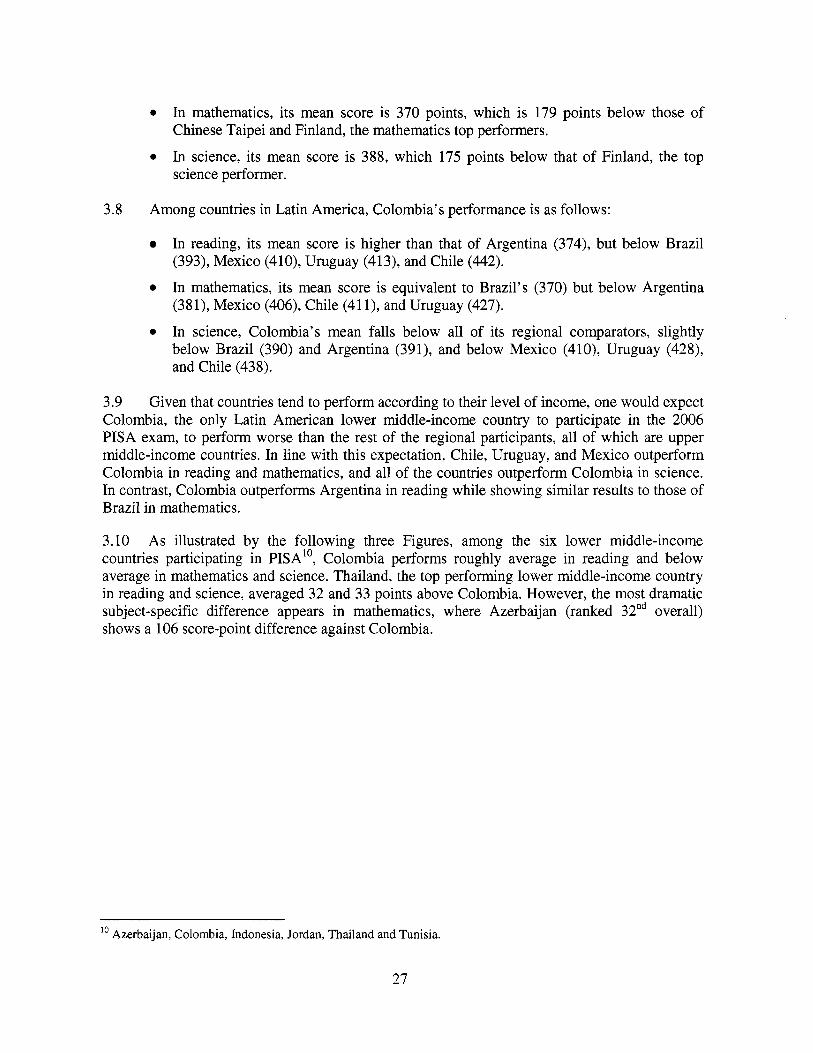
0 In mathematics, i t s mean score i s 370 points, which i s 179 points below those o f Chinese Taipei and Finland, the mathematics top performers.
In science, i t s mean score i s 388, which 175 points below that of Finland, the top science performer.
0
3.8 Among countries in Latin America, Colombia's performance i s as follows:
In reading, i t s mean score i s higher than that of Argentina (374), but below Brazil (393), Mexico (410), Uruguay (413), and Chile (442).
In mathematics, i t s mean score i s equivalent to Brazil's (370) but below Argentina (381), Mexico (406), Chile (41 l), and Uruguay (427).
In science, Colombia's mean falls below all of i t s regional comparators, slightly below Brazil (390) and Argentina (391), and below Mexico (410), Uruguay (428), and Chile (438).
3.9 Given that countries tend to perform according to their level of income, one would expect Colombia, the only Latin American lower middle-income country to participate in the 2006 PISA exam, to perform worse than the rest of the regional participants, all of which are upper middle-income countries. In line with this expectation, Chile, Uruguay, and Mexico outperform Colombia in reading and mathematics, and all of the countries outperform Colombia in science. In contrast, Colombia outperforms Argentina in reading while showing similar results to those of Brazil in mathematics.
3.10 As illustrated by the following three Figures, among the six lower middle-income countries participating in PISA", Colombia performs roughly average in reading and below average in mathematics and science. Thailand, the top performing lower middle-income country in reading and science, averaged 32 and 33 points above Colombia. However, the most dramatic subject-specific difference appears in mathematics, where Azerbaijan (ranked 32nd overall) shows a 106 score-point difference against Colombia.
lo Azerbaijan, Colombia, Indonesia, Jordan, Thailand and Tunisia.
27
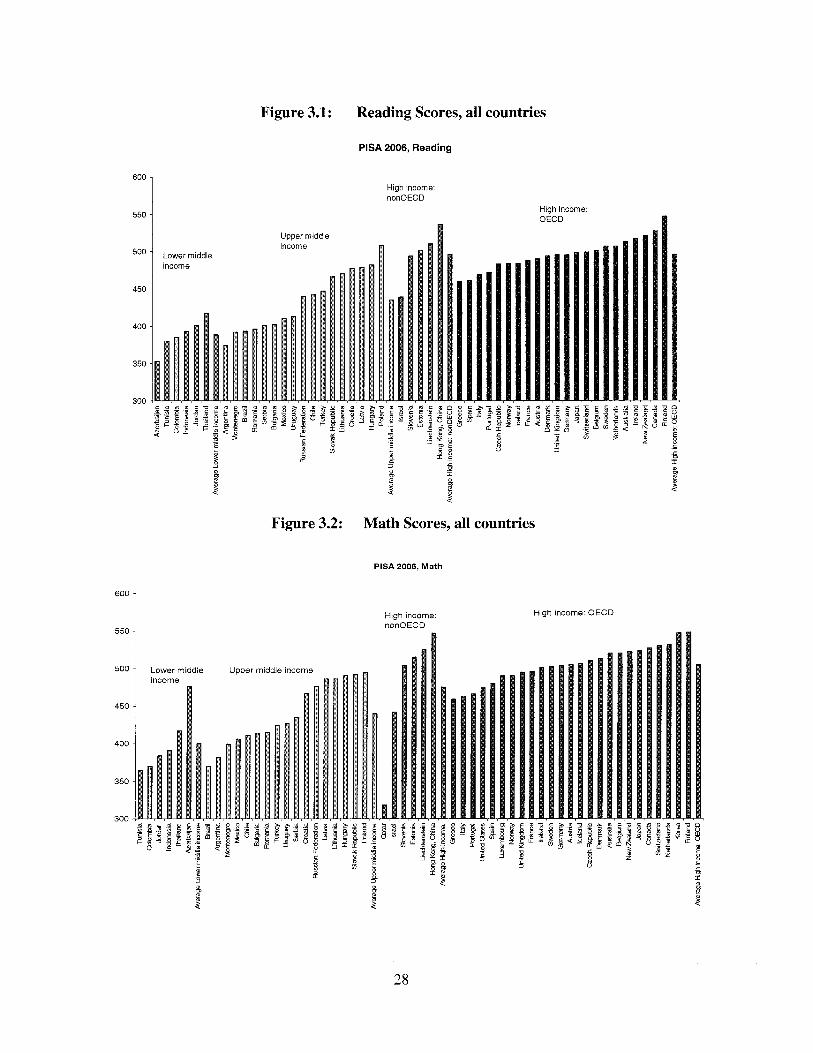
Figure 3.1: Reading Scores, all countries
600
550
500
450
400
350
300
6oo 1 ~
550 1
Lower middle income
' middle income
PlSA 2006, Reading
High income: nonOECD
High income: OECD
~
Figure 3.2: M a t h Scores, all countries
P E A 2006, Math
High income: nonOECD
High income: OECD
e
28
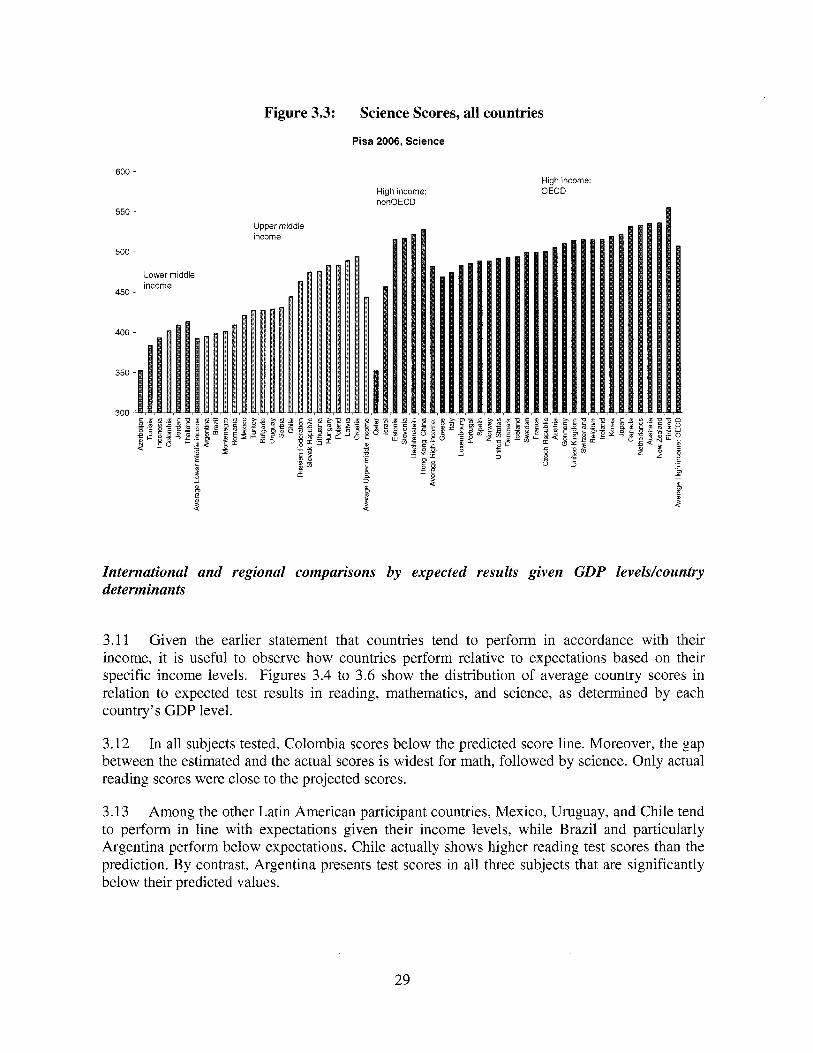
Figure 3.3: Science Scores, all countries
Pisa 2006, Science
600
550
500
450
400
350
300
Lower middle income
Upper middle income
High income: nonOECD
High income: OECD
m P B
International and regional comparisons by expected results given GDP levels/countuy determinants
3.11 Given the earlier statement that countries tend to perform in accordance with their income, it i s useful to observe how countries perform relative to expectations based on their specific income levels. Figures 3.4 to 3.6 show the distribution of average country scores in relation to expected test results in reading, mathematics, and science, as determined by each country’s GDP level.
3.12 In all subjects tested, Colombia scores below the predicted score line. Moreover, the gap between the estimated and the actual scores i s widest for math, followed by science. Only actual reading scores were close to the projected scores.
3.13 Among the other Latin American participant countries, Mexico, Uruguay, and Chile tend to perform in line with expectations given their income levels, while Brazil and particularly Argentina perform below expectations. Chile actually shows higher reading test scores than the prediction. By contrast, Argentina presents test scores in all three subjects that are significantly below their predicted values.
29
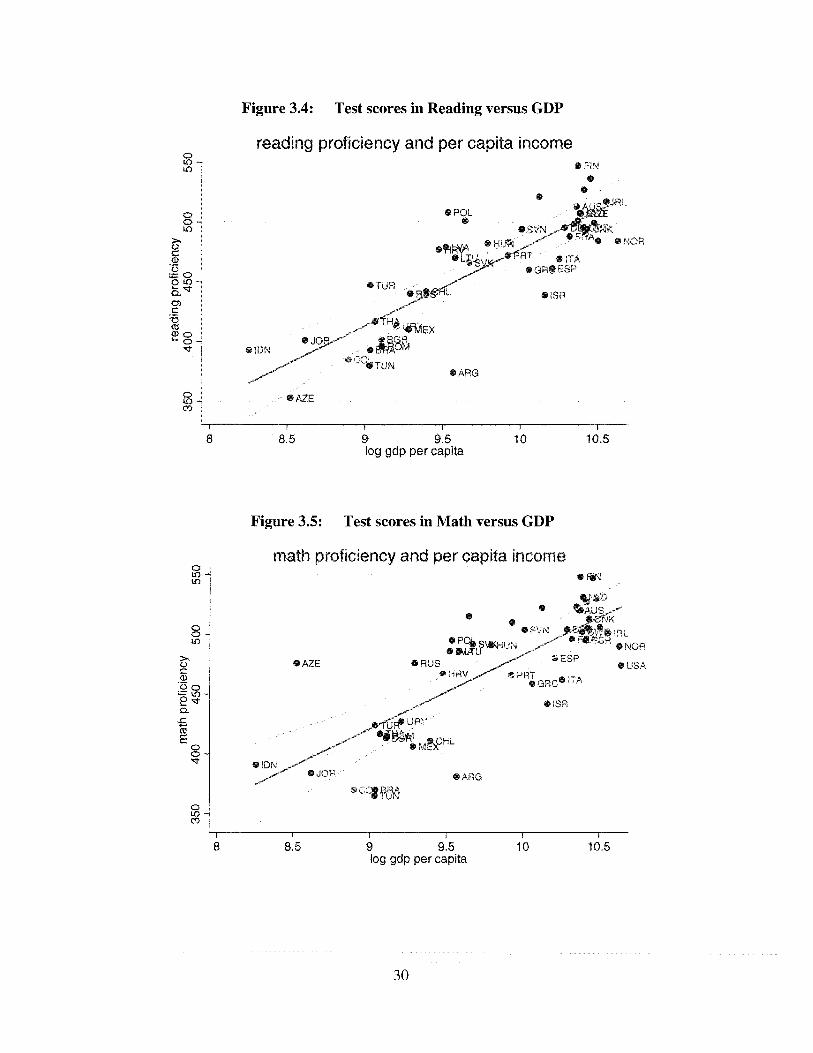
Figure 3.4: Test scores in Reading versus GDP
AZE
I I I I I I
8 8.5 9 9.5 10 10.5 log gdp per capita
Figure 3.5: Test scores in M a t h versus GDP
AZE
t I , I I f
8 8.5 9 9.5 10 10.5 log gdp per capita
30
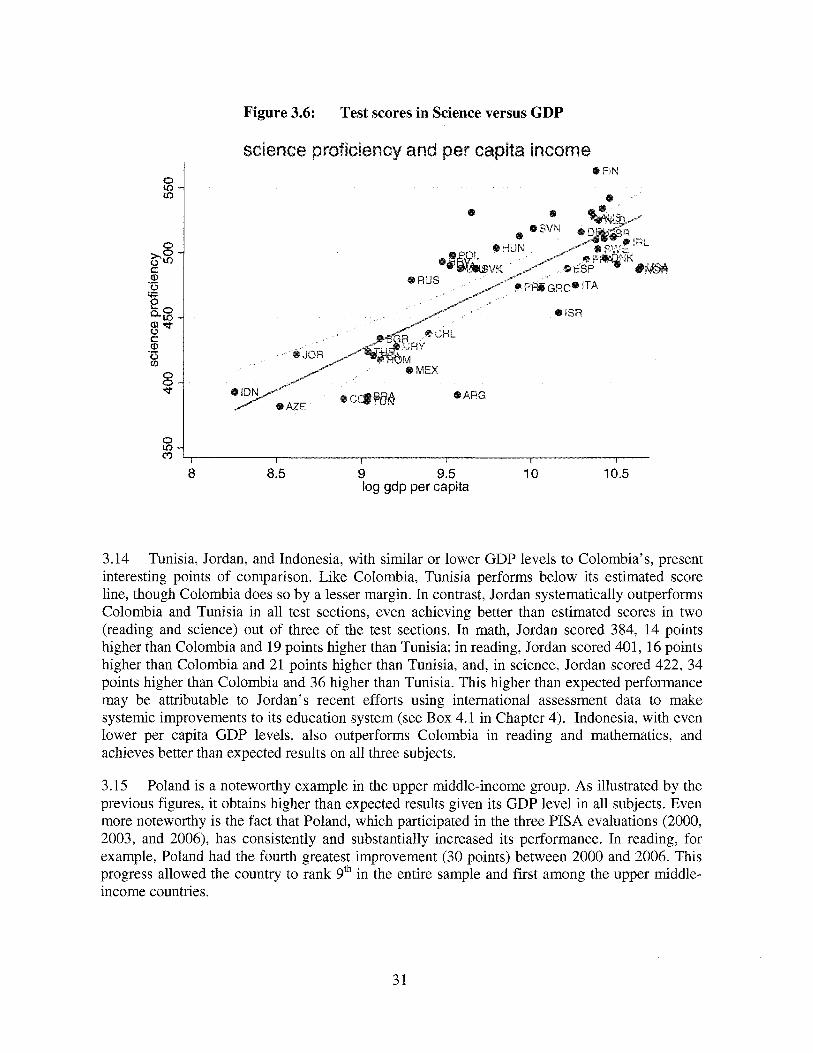
Figure 3.6: Test scores in Science versus GDP
0 L o - Lo
0 p - a, 0 4f 0
cud 0 c a, 0 03
.-
k.g -
.- 0 0 - d
FIN
ISR
ARG
0 Lo f 3 , I I I 1 I
8 8.5 9 9.5 10 10.5 log gdp per capita
3.14 Tunisia, Jordan, and Indonesia, with similar or lower GDP levels to Colombia’s, present interesting points o f comparison. Like Colombia, Tunisia performs below i t s estimated score line, though Colombia does so by a lesser margin. In contrast, Jordan systematically outperforms Colombia and Tunisia in a l l test sections, even achieving better than estimated scores in two (reading and science) out of three o f the test sections. In math, Jordan scored 384, 14 points higher than Colombia and 19 points higher than Tunisia; in reading, Jordan scored 401, 16 points higher than Colombia and 21 points higher than Tunisia, and, in science, Jordan scored 422, 34 points higher than Colombia and 36 higher than Tunisia. This higher than expected performance may be attributable to Jordan’s recent efforts using international assessment data to make systemic improvements to i t s education system (see Box 4.1 in Chapter 4). Indonesia, with even lower per capita GDP levels, also outperforms Colombia in reading and mathematics, and achieves better than expected results on a l l three subjects.
3.15 Poland i s a noteworthy example in the upper middle-income group. As illustrated by the previous figures, i t obtains higher than expected results given i t s GDP level in all subjects. Even more noteworthy i s the fact that Poland, which participated in the three PISA evaluations (2000, 2003, and 2006), has consistently and substantially increased i t s performance. In reading, for example, Poland had the fourth greatest improvement (30 points) between 2000 and 2006. This progress allowed the country to rank gth in the entire sample and f i rs t among the upper middle- income countries.
31
3.16 A country's GDP level i s only one of the many variables determining educational outcomes. As noted in the literature review, student achievement i s also a reflection of other student (e.g., mother's education), school (e.g., teacher-student ratio), and institutional (e.g., centralized assessments) ch arac ten s tic s .
3.17 In a general model controlling for a large set of these variables, the same patterns emerge as in the simple model using the GDP as the predictor". Colombia's performance relative to i t s predicted scores given the country's socioeconomic and institutional factors i s consistent with the one exhibited relative to i t s GDP level. The scores in the other Latin American countries were also close to the prediction line, with the exception of Argentina that performed significantly below i t s predicted average score.
Equity in scores and proficiency distributions
3.18 In addition to examining Colombia's overall performance, it i s important to analyze the extent to which the Colombian educational system provides a high-quality and equitable education, relative to other participating countries. This section examines equity using three different methodologies: overall test score dispersion, the distribution of test scores by proficiency level, and variance in test scores between schools versus within schools. Overall test score dispersion i s an indicator of how compressed the test score distribution i s around the mean, with a low dispersion indicating a high level of equity. The distribution of test scores by proficiency level shows the proportions of students performing at different performance levels, each indicating a certain degree of knowledge and skill. A concentration of students around any given proficiency level indicates a high degree of equity. Finally, the variance o f test scores between and within schools-a measure used by PISA extensively-presents a picture of the homogeneity of schools and the system. Greater homogeneity among schools than within schools indicates a higher degree o f equity. I t i s important to note that these measures are imperfect proxies for equity o f high achievement, given that i t i s possible to show a high degree o f equity but at a low level o f achievement.
3.19 Dispersion in test scores characterizes the level of heterogeneity in learning outcomes and therefore constitutes a measure of inequality. A high level of dispersion signifies a high gap between the top and the bottom students. Figures 3.7 and 3.8 present the average test scores and the dispersion between the top five percent versus the bottom five percent of students in math and science respectively.
In the general model the predicted test score i s obtained after estimating the effect o f common variables on observed test scores across countries. The variables used in the model included macroeconomic indicators (such as enrollment rate and income), and school, family, and individuals' characteristics. T h e model was run by a team in HDNED led by Hany Patrinos.
32
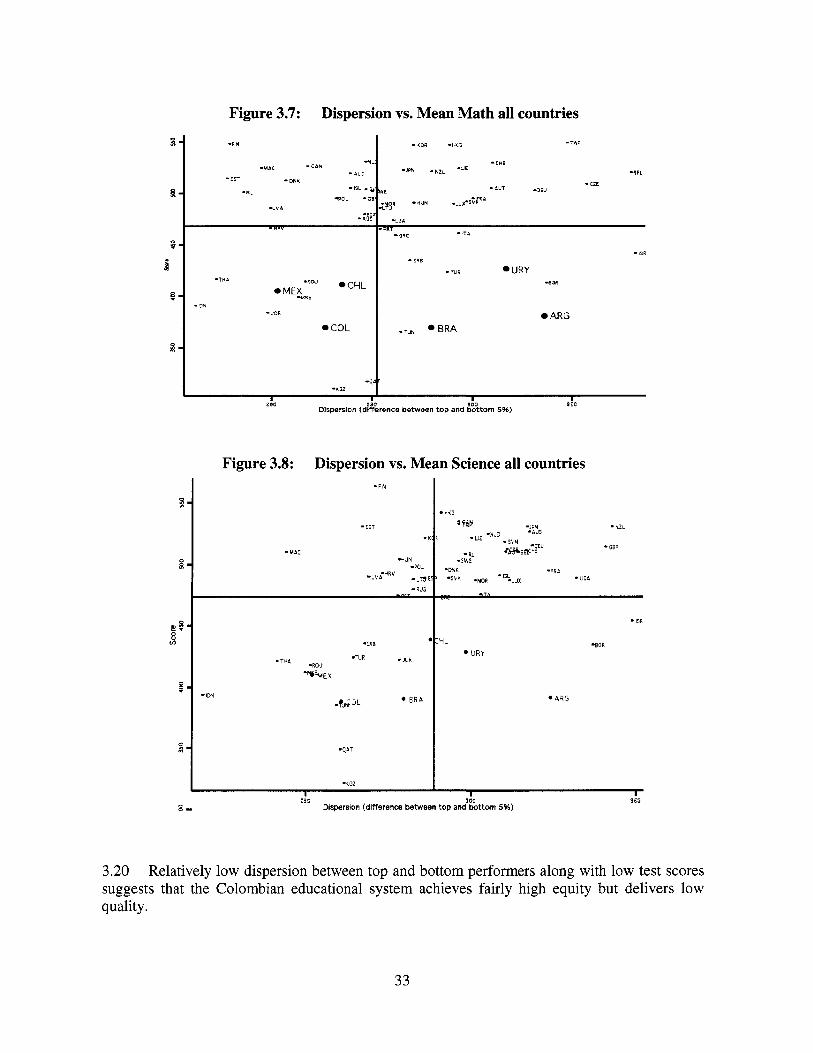
Figure 3.7: Dispersion vs. Mean Math all countries
R
w
g ? m
H
0 3
- m -.OR
0 COL
-3EL
ARG *BRA
I I 100 S e l l
mce between top and bottom 5%)
-<GZ I I I I
250 JW 350 8 - Dispersion (difference between top and bottwn 5%)
3.20 Relatively low dispersion between top and bottom performers along with low test scores suggests that the Colombian educational system achieves fairly high equity but delivers low quality.
33
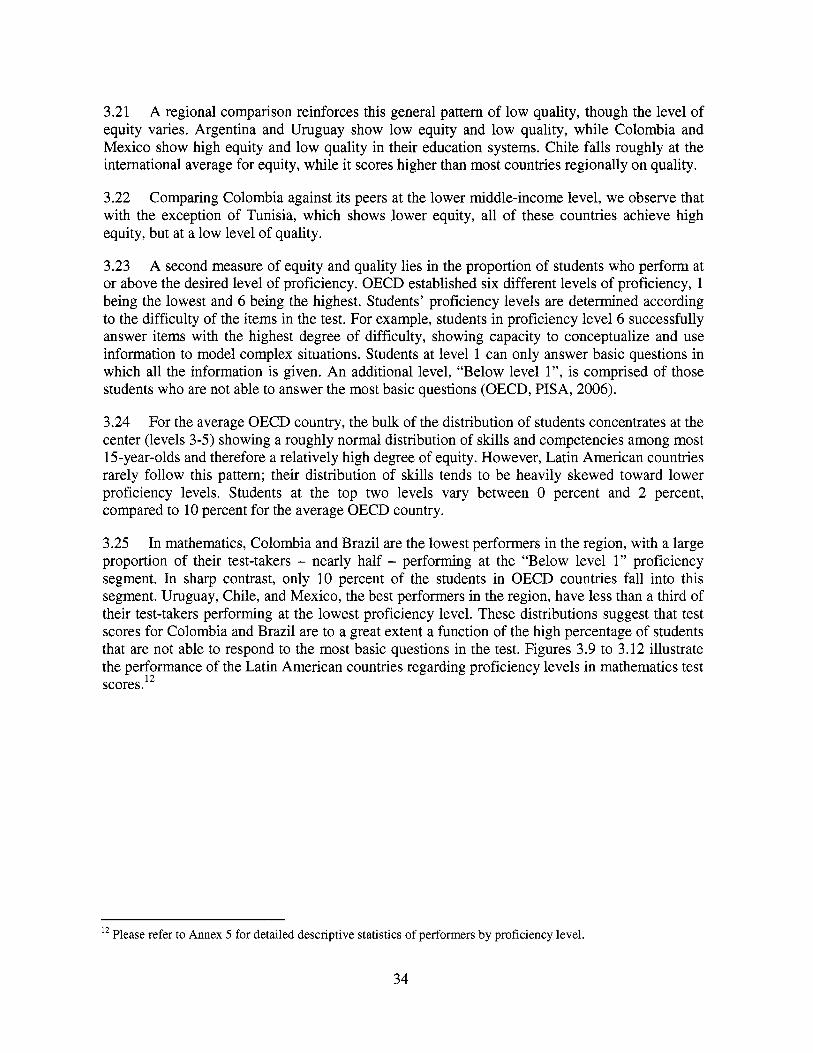
3.21 A regional comparison reinforces this general pattern of low quality, though the level of equity varies. Argentina and Uruguay show low equity and low quality, while Colombia and Mexico show high equity and low quality in their education systems. Chile falls roughly at the international average for equity, while it scores higher than most countries regionally on quality.
3.22 Comparing Colombia against i t s peers at the lower middle-income level, we observe that with the exception o f Tunisia, which shows lower equity, all of these countries achieve high equity, but at a low level of quality.
3.23 A second measure of equity and quality lies in the proportion of students who perform at or above the desired level of proficiency. OECD established six different levels of proficiency, 1 being the lowest and 6 being the highest. Students’ proficiency levels are determined according to the difficulty of the items in the test. For example, students in proficiency level 6 successfully answer items with the highest degree o f difficulty, showing capacity to conceptualize and use information to model complex situations. Students at level 1 can only answer basic questions in which all the information i s given. An additional level, “Below level l”, i s comprised of those students who are not able to answer the most basic questions (OECD, PISA, 2006).
3.24 For the average OECD country, the bulk o f the distribution of students concentrates at the center (levels 3-5) showing a roughly normal distribution of sk i l ls and competencies among most 15-year-olds and therefore a relatively high degree of equity. However, Latin American countries rarely follow this pattern; their distribution of ski l ls tends to be heavily skewed toward lower proficiency levels. Students at the top two levels vary between 0 percent and 2 percent, compared to 10 percent for the average OECD country.
3.25 In mathematics, Colombia and Brazil are the lowest performers in the region, with a large proportion of their test-takers - nearly half - performing at the “Below level 1” proficiency segment. In sharp contrast, only 10 percent of the students in OECD countries fall into this segment. Uruguay, Chile, and Mexico, the best performers in the region, have less than a third of their test-takers performing at the lowest proficiency level. These distributions suggest that test scores for Colombia and Brazil are to a great extent a function of the high percentage of students that are not able to respond to the most basic questions in the test. Figures 3.9 to 3.12 illustrate the performance of the Latin American countries regarding proficiency levels in mathematics test scores. l2
l2 Please refer to Annex 5 for detailed descriptive statistics of performers by proficiency level.
34
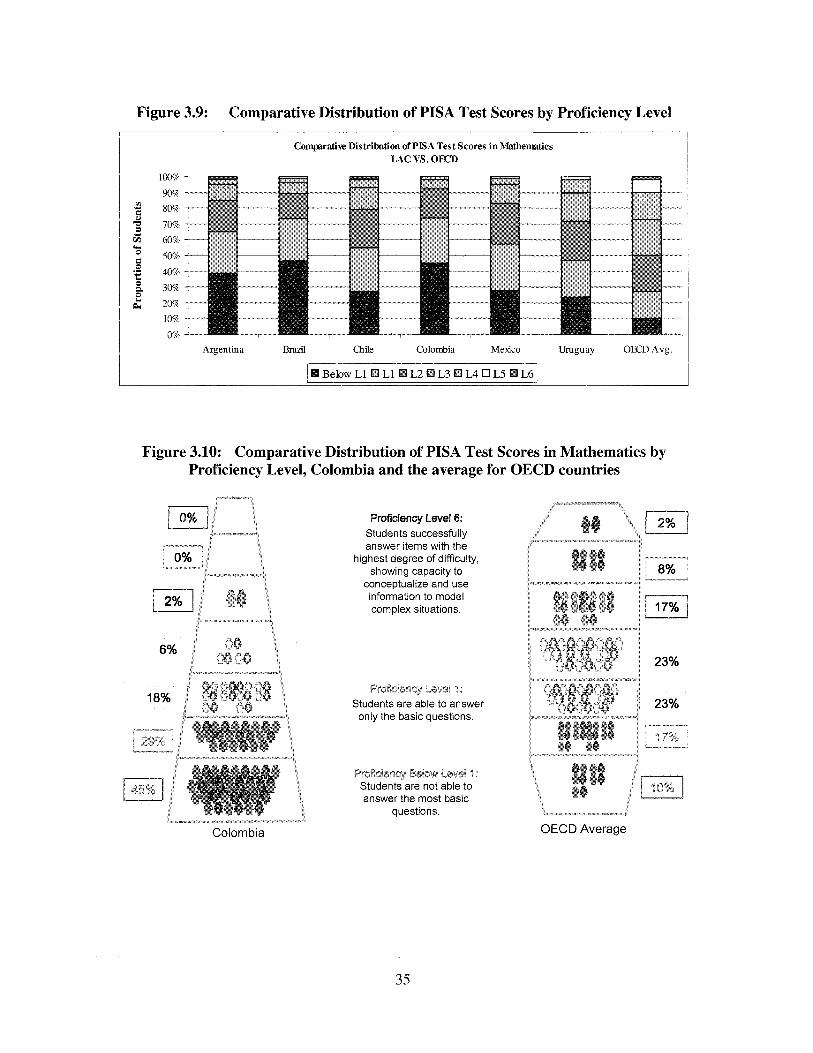
Figure 3.9: Comparative Distribution of P ISA Test Scores by Proficiency Level
Compratiw Distribution of P E A Test Scores in Mathematics LAC VS . O E D
100% 90% 80% 70% 60% 50% 10% 30% 20% 104 0%
Argentina Brad Chile Colombia Meldco Uruguay OECD Avg.
L2 BL3 0 LA 0 L 5
Figure 3.10: Comparative Distribution of PISA Test Scores in Mathematics by Proficiency Level, Colombia and the average for OECD countries
6%
18%
Colombia
Proficiency Lev& 6: Students successfully answer items with the
highest degree of difficulty, showing capacity to
conceptualize and use information to model complex situations.
PrORcmGy -BVBL 1 : Students are able to answer
only the basic questions.
raEcl@nGy Below Lev%! Students are not able to answer the most basic
questions.
p q
23%
23%
x 7 ' , r 2 -
OECD Average
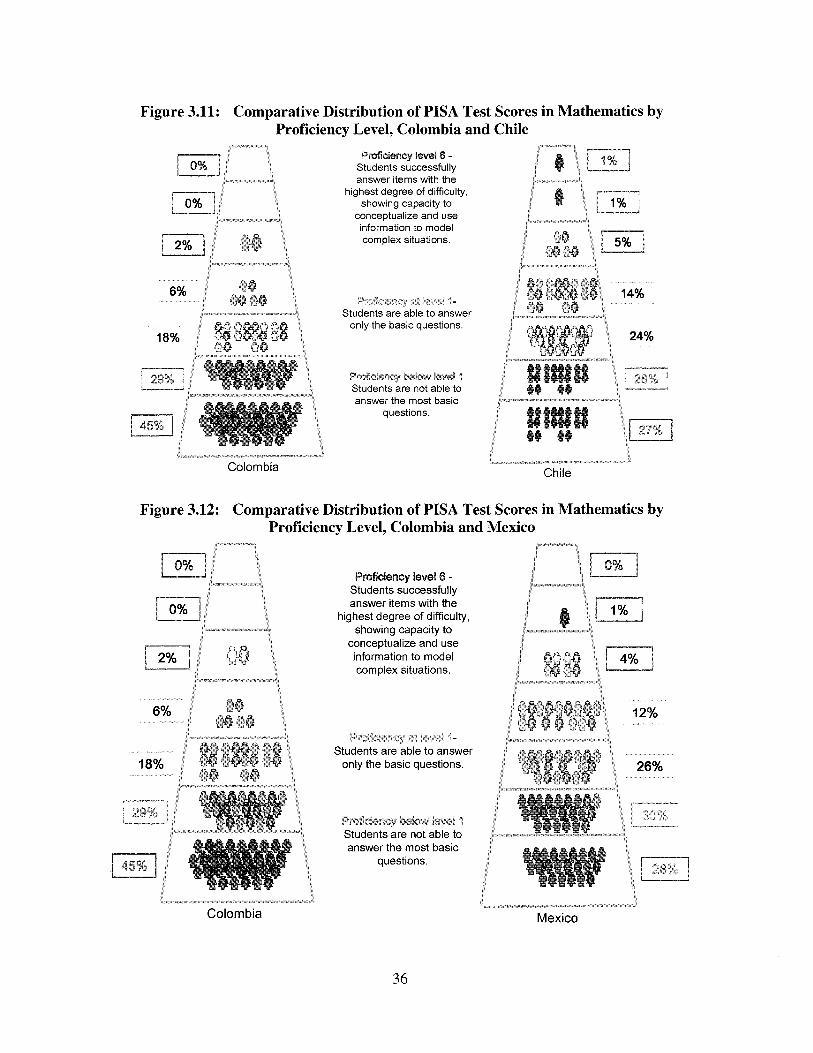
Figure 3.11: Comparative Distribution of PISA Test Scores in Mathematics by Proficiency Level, Colombia and Chile
-: i 2% 1" ,
18%
i - 7 29%
Colombia
~ ~ ~ ~ c J ~ ~ tevcJl8 - Students successfully answer items with the
highest degree of difficulty, showing capacity to
conceptualize and use information to model complex situations.
Students are able to answer only the basic questions.
Students are not able to answer the most basic
questions.
, 6..'r,
14%
24%
Figure 3.12: Comparative Distribution of PISA Test Scores in Mathematics by Proficiency Level, Colombia and Mexico
6%
18%
~ ~ ~ ~ e ~ c y level 8 - Students successfully answer items with the
highest degree of difficulty, showing capacity to
conceptualize and use information to model complex situations.
i j 1% 1
Students are able to answer only the basic questions.
3 n4:n q-".*
Students are not able to answer the most basic
questions
* .%*>&*Ite) Deiow itwe. :
12%
26%
Colombia
36
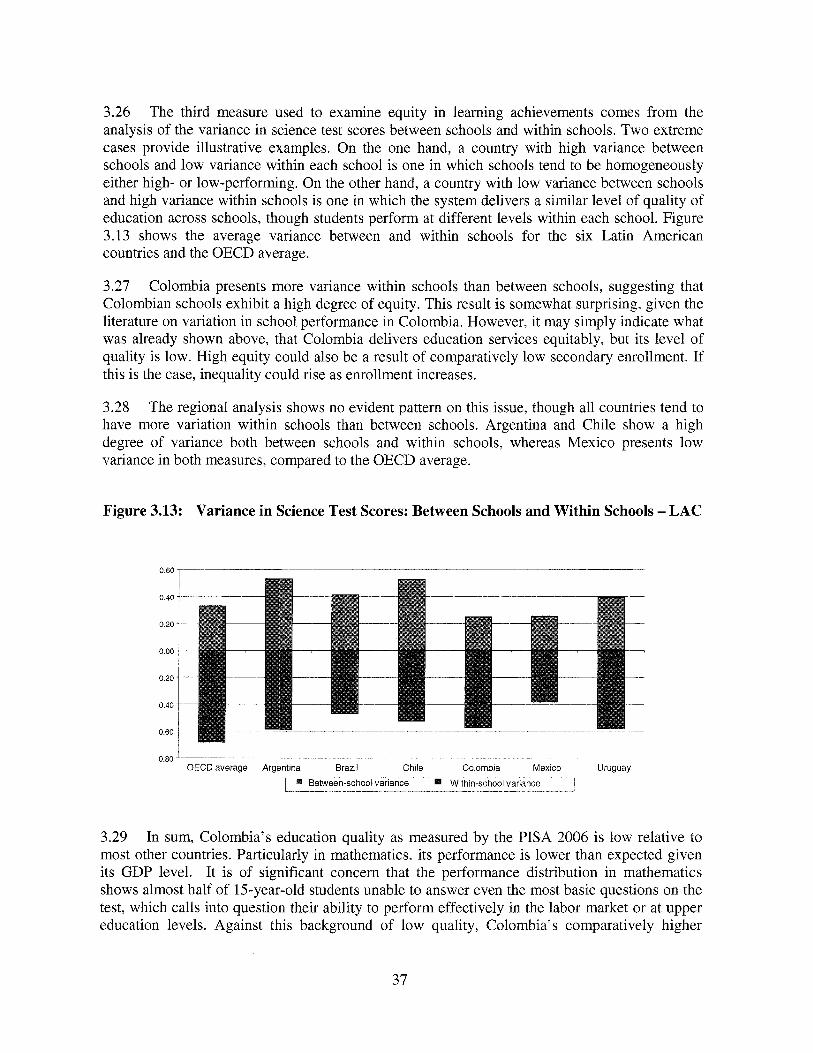
3.26 The third measure used to examine equity in learning achievements comes from the analysis of the variance in science test scores between schools and within schools. Two extreme cases provide illustrative examples. On the one hand, a country with high variance between schools and low variance within each school i s one in which schools tend to be homogeneously either high- or low-performing. On the other hand, a country with low variance between schools and high variance within schools i s one in which the system delivers a similar level o f quality of education across schools, though students perform at different levels within each school. Figure 3.13 shows the average variance between and within schools for the six Latin American countries and the OECD average.
3.27 Colombia presents more variance within schools than between schools, suggesting that Colombian schools exhibit a high degree of equity. This result i s somewhat surprising, given the literature on variation in school performance in Colombia. However, i t may simply indicate what was already shown above, that Colombia delivers education services equitably, but i t s level o f quality i s low. High equity could also be a result of comparatively low secondary enrollment. I f this i s the case, inequality could rise as enrollment increases.
3.28 The regional analysis shows no evident pattern on this issue, though all countries tend to have more variation within schools than between schools. Argentina and Chile show a high degree of variance both between schools and within schools, whereas Mexico presents low variance in both measures, compared to the OECD average.
Figure 3.13: Variance in Science Test Scores: Between Schools and Within Schools - LAC
Y "Y
OECD average Argentina Brazil Chile Colombia Mexico Uruguay _ _ _ ~ ~ I _ _ _ _ _ _ _ ___
Between-school variance Within-school variance 7 II_: - - __ _ _ ~ _ _ _ - _
3.29 In sum, Colombia's education quality as measured by the PISA 2006 i s low relative to most other countries. Particularly in mathematics, i t s performance i s lower than expected given i t s GDP level. I t i s of significant concern that the performance distribution in mathematics shows almost half o f 15-year-old students unable to answer even the most basic questions on the test, which calls into question their ability to perform effectively in the labor market or at upper education levels. Against this background o f low quality, Colombia's comparatively higher
37
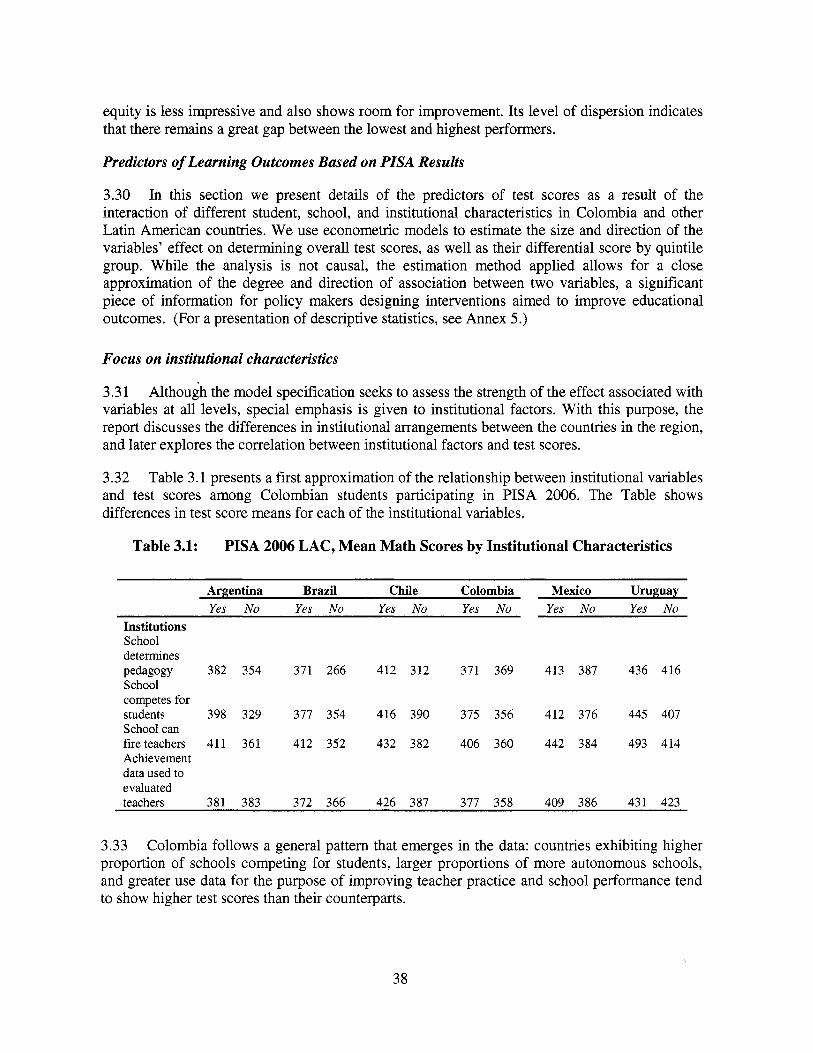
equity i s less impressive and also shows room for improvement. I t s level of dispersion indicates that there remains a great gap between the lowest and highest performers.
Predictors of Learning Outcomes Based on PISA Results
3.30 In this section we present details of the predictors of test scores as a result of the interaction of different student, school, and institutional characteristics in Colombia and other Latin American countries. We use econometric models to estimate the size and direction of the variables’ effect on determining overall test scores, as well as their differential score by quintile group. While the analysis i s not causal, the estimation method applied allows for a close approximation of the degree and direction o f association between two variables, a significant piece of information for policy makers designing interventions aimed to improve educational outcomes. (For a presentation of descriptive statistics, see Annex 5.)
Focus on institutional characteristics
3.3 1 Although the model specification seeks to assess the strength o f the effect associated with variables at all levels, special emphasis i s given to institutional factors. With this purpose, the report discusses the differences in institutional arrangements between the countries in the region, and later explores the correlation between institutional factors and test scores.
3.32 Table 3.1 presents a first approximation of the relationship between institutional variables and test scores among Colombian students participating in PISA 2006. The Table shows differences in test score means for each of the institutional variables.
Table 3.1: PISA 2006 LAC, Mean Math Scores by Institutional Characteristics
Argentina Brazil Chile Colombia Mexico Uruguay Yes No Yes No Yes No Yes No Yes No Yes No
Institutions School determines pedagogy 382 354 371 266 412 312 371 369 413 387 436 416 School competes for students 398 329 377 354 416 390 375 356 412 376 445 407 School can fireteachers 411 361 412 352 432 382 406 360 442 384 493 414 Achievement data used to evaluated teachers 381 383 372 366 426 387 377 358 409 386 431 423
3.33 Colombia follows a general pattern that emerges in the data: countries exhibiting higher proportion of schools competing for students, larger proportions o f more autonomous schools, and greater use data for the purpose o f improving teacher practice and school performance tend to show higher test scores than their counterparts.
38
3.34 However, i t i s interesting to note that the two countries that perform better on the test, Uruguay and Chile, seem to have very different mean values for their institutional variables. In Chile, the variables capturing competition, autonomy of the school, and use o f data present the higher values among the regional participants, whereas Uruguay shows the overall lowest values in the group for each institutional variable. Using descriptive statistics as a reference, we analyzed each country’s institutional context separately to search for differences from the overall regional pattern. However, the general trend st i l ls hold for both Uruguay and Chile: competition, autonomy, and use o f data are correlated with higher test scores.
Predictors of learning across countries
3.35 Because o f the contextual differences among countries and the way that variables may interact with one another, it i s important to analyze a comprehensive model that isolates the effect o f each variable by controlling for the other variables. For this purpose, findings on the effects o f individual student, school, and institutional variables are presented for overall intra- regional comparisons. Table 3.2 presents the results o f an econometric model incorporating country-wide, institutional, school, family, and student characteristics to measure their effects on education outcomes among 15-year-olds, across Latin American countries.
39
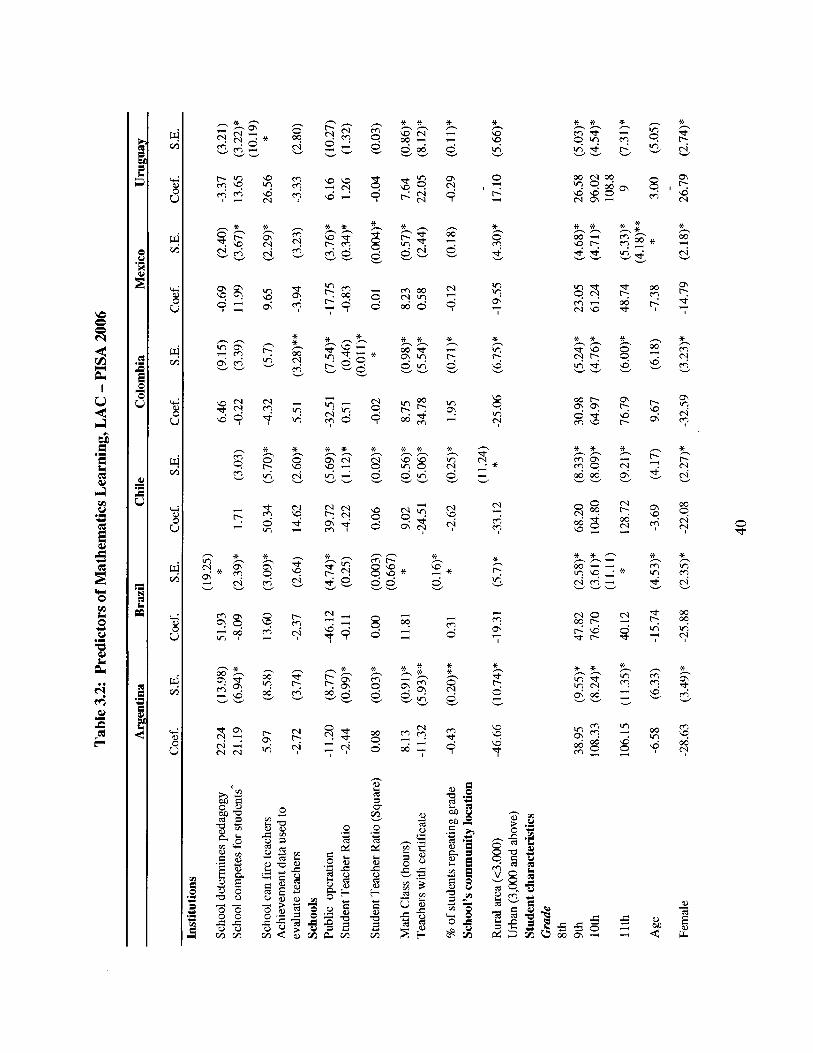
I u 2
Ccl 0
a a 0L" Y Z m e
A 3 2 W
A ? e d
m W II
r:
0 d-
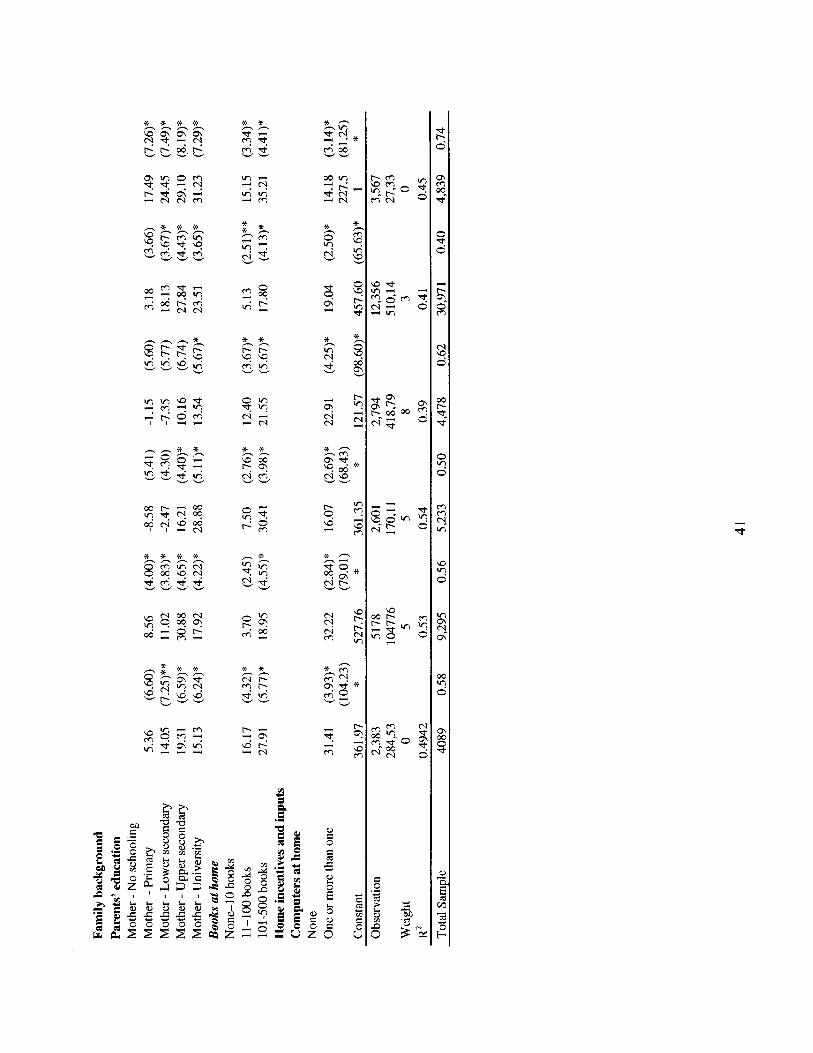
a=;. 1-4
1--
W r - i h l 1 9
- t e m
Family factors
3.36 Similar to other regional participants, mothers’ completion of university studies has a positive and statistically significant correlation with student performance in Colombia (with a coefficient of 13.54), though other parent education levels were not significantly associated with improved educational outcomes in that country. In all other regional participant countries, mothers’ completion o f upper secondary was also positively and significantly correlated with student performance. In Argentina, Brazil, Mexico, and Uruguay, this also holds true for mothers who completed lower secondary.
3.37 Having at least one computer and more than 10 books at home has a positive correlation with achievement in every Latin American PISA participant country. In Colombia, the presence o f one or more computers has a strong association (22.91). Having 101-500 books in the home has a similarly high association (21.55), while the correlation o f having 11-100 books i s more moderate (12.40). Given that books and computers at home are a proxy for family income, these correlations are unsurprising. They may also reflect parental orientation toward knowledge and learning that independently drives student achievement.
Student factors
3.38 Female gender emerges as one of the strongest negative and significant predictors of student mathematics performance across Latin American countries, with Colombia showing the greatest negative correlation for female test takers (32.59). This correlation may be a factor o f classroom practices and expectations, as well as societal and family attitudes toward girls’ education in general and mathematics education in particular.
3.39 Across grades, students in upper levels consistently scored better than their peers in lower grades, a fact consistent among test takers in Colombia. Indeed, students in grade 8 score systematically lower across countries than students at grade 11. In Colombia, the positive association with achievement increases substantially with each successive grade (30.98, 64.97 and 76.79 for grades 9, 10, and 11 respectively.) This may be explained by the fact that presumably 15-year-old students at grade 8 are likely repeaters or over-age for other reasons while those in higher grades are likely to have advanced because of their ability, in addition to being exposed to more and higher level academic content. In the case of Colombia, grades 10 and 11 comprise upper secondary, so students enrolled in those grades may be higher-achieving on the whole than those enrolled in lower secondary.
3.40 In Colombia, age was not significantly associated with higher student performance, though the association appears to be negative and significant in Brazi l and Mexico. The effect in these two countries may be explained by the fact that, on average, the best students do not repeat grades and progress faster in the school.
School factors
3.41 Teachers with a certificate comprised the school factor with the highest correlation with student achievement for Colombia (34.78), though i t s effect varied across the region. This variable was taken directly from the variable constructed by PISA, based on teacher responses. I t
42
i s therefore important to note that this variable may suffer from lack of comparability of degrees across countries. While the association was positive and significant in Colombia and Uruguay, i t was negative and significant in Argentina and Chile and insignificant in Mexico.13 A positive association may be the result of the certification process itself, but more likely may reflect certification as a signal of teacher quality.
3.42 Enrollment in a public or private school has strong correlations with student achievement in Colombia and most Latin American participant countries. In Colombia, Brazil, and Mexico, enrollment in a public institution i s significantly correlated with lower scores. In Colombia, public schools score 32.51 points lower than private schools. By contrast, attending a public institution in Chile i s positively and significantly correlated with better scores by 39.72 points. In Argentina and Uruguay, the relationship between attending a public institution and student performance i s not statistically significant. I t i s important to note that this analysis does not account for key unobservable factors, notably differences in student selection policies that tend to render public and private schools’ student populations systematically different from one another. Therefore, i t i s impossible to draw a conclusion regarding the relative efficacy o f public versus private schools from the analysis.
3.43 Rural schools in the six Latin American countries participating in the 2006 PISA scored negatively and significantly lower than did urban ones, with Argentina showing the largest average associated difference (44.66 points) and Colombia showing an associated difference of 25.06 points. Uruguay, Brazil, and Mexico all showed lower associated differences (17.10, 19.31 and 19.55 respectively).
3.44 The number of hours devoted to the study of mathematics as reported by students proved to be positively and significantly associated with test scores in Colombia and the other regional participant countries. However, given the fact that Colombia presents the highest regional proportion o f hours devoted to math and that i t s school day i s already quite long, the moderate positive effect (8.75) of time spent on math may have less relevance for Colombia from a policy standpoint. In addition, this correlation may reflect an omitted third variable, such as the community’s orientation toward education in general and math education in particular, that independently drives achievement.
3.45 The effect of the student-teacher ratio i s negative and significant in the case of Argentina, Chile, and Mexico. In Colombia, the effect i s only significant, and negative, for the squared variable. This implies that only very big classrooms have a negative correlation with student performance.
Institutional factors
3.46 Institutional characteristics play a different role and effect in each country in the region. The only variable that seems to have a (somewhat) stable coefficient i s competition for students, though this variable i s not statistically significant for Colombia. The rest of the variables have different signs and significance for each country.
l3 Data on teacher certification i s not available for Brazil.
43
3.47 The use o f data to improve teacher and school performance, as captured by the variable “achievement data i s used to evaluate teachers”, emerges as the only institutional factor that positively and significantly affects test scores in Colombia, with a modest coefficient o f 5.5 1. This variable i s also significant and has an even larger effect (14.62) in Chile. While this association may reflect the value o f using assessment data to evaluate teachers and school directors, i t may alternatively reflect an omitted “school management quality” variable. The variable was constructed using the following question: “In your school, are achievement data used in any o f the following: a) Achievement data are posted publicly; b) Achievement data are used in evaluation of the principal’s performance; c) Achievement data are used in evaluation of teachers’ performance; d) Achievement data are used in decisions about instructional resource allocation to the school.” It i s important to note that, although the data may be used in the evaluation o f teachers’ performance, it does not necessarily imply any consequences (e.g., a poorly performing teacher i s fired). Nonetheless, the critical assumption i s that the information i s used to highlight areas o f strength and weakness in order to improve performance.
3.48 With respect to the two variables on autonomy, “School can fire teachers” was positive and significant for all regional participants except Colombia and Argentina, while “School determines pedagogy” proved to be positive and significant only in Brazil.
3.49 Competition among schools proved to be significant for all but two countries in Latin America (Colombia and Chile). Given that competition among schools has been in effect in Chile since the beginning of the 198Os, it i s likely that the equalizing differences coming from competition had already taken place in previous years.
Predictors of test scores by quintiles of the distribution of students in Colombid4
3.50 In this section we investigate, in depth, the differential effects of predictors of test scores for students in Colombia by performance level. Table 3.3 presents the results of the same model used above, but applying quantile regression estimation to search for evidence of differential effects among higher-performing and lower-performing students for Colombia. I t i s possible that a certain characteristic plays a different role between students with low test scores and students with high scores. With the help of quantile regressions, we explore such differences, which can provide insights about interventions that aim to reduce educational inequality.
l4 Multinomial analyses were also used to determine how the variables in the model relate to absolute low achievers (instead o f conditional low achievers). Results from these models confirm the correlations revealed by the quintile regressions. In particular, variables positively correlated with the likelihood of achieving proficiency levels higher than below 1 and 1 and with incremental changes in proficiency, include teacher certification, higher grades, computer and books at home, and hours o f math class. In turn, the female dummy i s the only variable negatively associated with the probability o f achieving a higher proficiency level at levels below 1, 1, and 2.
44
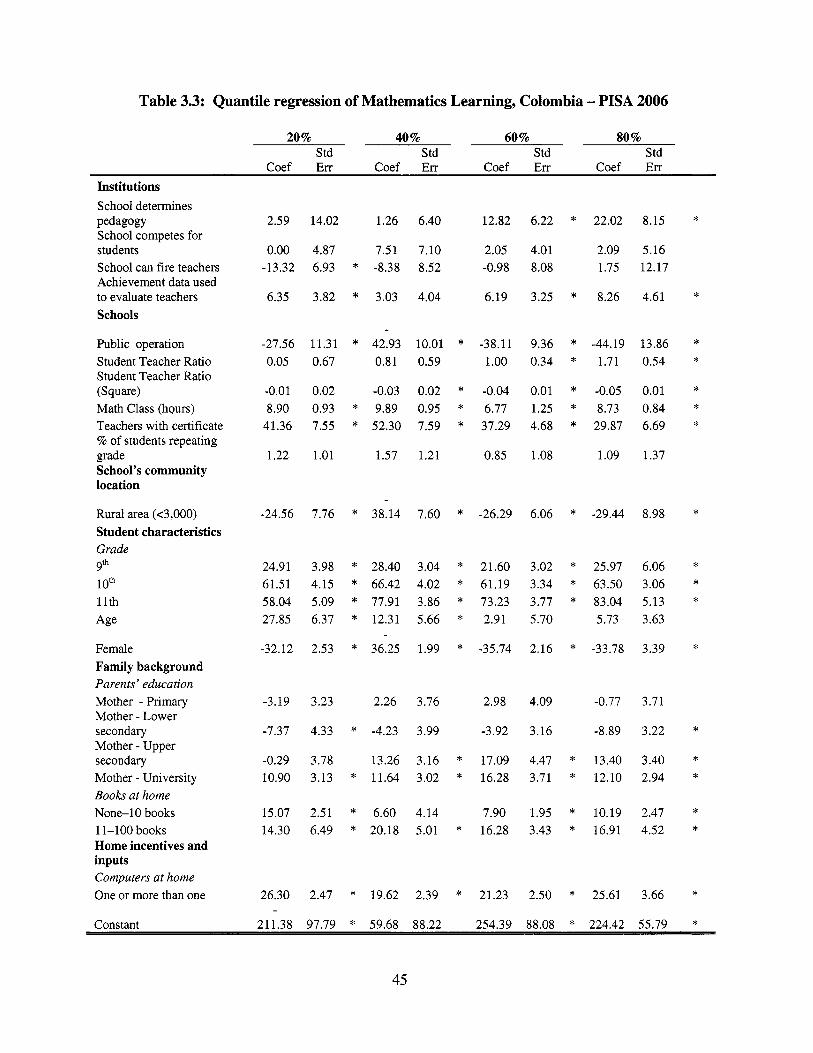
Table 3.3: Quantile regression of Mathematics Learning, Colombia - PISA 2006
20 % 40 % 60 % 80 % Std Std Std Std
Coef Err Coef Err Coef Err Coef Err Institutions School determines pedagogy School competes for students School can fire teachers Achievement data used to evaluate teachers Schools
Public operation Student Teacher Ratio Student Teacher Ratio (Square) Math Class (hours) Teachers with certificate % o f students repeating grade School's community location
Rural area (~3,000) Student characteristics Grade 9" 10" 1 lth Age
Female Family background Parents ' education Mother -Primary Mother - Lower secondary Mother - Upper secondary Mother - University Books at home None-10 books
Home incentives and inputs Computers at home One or more than one
11-100 books
2.59 14.02 1.26 6.40 12.82 6.22 * 22.02 8.15
0.00 4.87 7.51 7.10 2.05 4.01 2.09 5.16 -13.32 6.93 * -8.38 8.52 -0.98 8.08 1.75 12.17
6.35 3.82 * 3.03 4.04 6.19 3.25 * 8.26 4.61
-27.56 11.31 * 42.93 10.01 * -38.11 9.36 * -44.19 13.86 0.05 0.67 0.81 0.59 1.00 0.34 * 1.71 0.54
-0.01 0.02 -0.03 0.02 * -0.04 0.01 * -0.05 0.01 8.90 0.93 * 9.89 0.95 * 6.77 1.25 * 8.73 0.84
41.36 7.55 * 52.30 7.59 * 37.29 4.68 * 29.87 6.69
1.22 1.01 1.57 1.21 0.85 1.08 1.09 1.37
-24.56 7.76 * 38.14 7.60 * -26.29 6.06 * -29.44 8.98
24.91 3.98 * 28.40 3.04 * 21.60 3.02 * 25.97 6.06 61.51 4.15 * 66.42 4.02 * 61.19 3.34 * 63.50 3.06 58.04 5.09 * 77.91 3.86 * 73.23 3.77 * 83.04 5.13 27.85 6.37 * 12.31 5.66 * 2.91 5.70 5.73 3.63
-32.12 2.53 * 36.25 1.99 * -35.74 2.16 * -33.78 3.39
-3.19 3.23 2.26 3.76 2.98 4.09 -0.77 3.71
-7.37 4.33 * -4.23 3.99 -3.92 3.16 -8.89 3.22
-0.29 3.78 13.26 3.16 * 17.09 4.47 * 13.40 3.40 10.90 3.13 * 11.64 3.02 * 16.28 3.71 * 12.10 2.94
15.07 2.51 * 6.60 4.14 7.90 1.95 * 10.19 2.47 14.30 6.49 * 20.18 5.01 * 16.28 3.43 * 16.91 4.52
26.30 2.47 * 19.62 2.39 * 21.23 2.50 * 25.61 3.66
*
*
* * * * *
*
* * *
*
*
* *
* *
*
* Constant 211.38 97.79 * 59.68 88.22 254.39 88.08 * 224.42 55.79
45
Family factors
3.51 In the case o f Colombia, mother’s educational achievement has a differential effect among students across performance levels. For those with the poorest performance, mother’s education i s statistically significant only for those with lower secondary and university education. For the former group, the effect i s negative whereas for the latter, the effect i s positive. For students placing at the 40 and 60 percent quintile, only mother’s education at the upper and university level i s positive and significant for both, whereas for top performers, mother’s education starts to be significant at the lower secondary level.
3.52 In terms of the availability of educational inputs at home @e., books and computers), the regression estimations show statistically significant effects across all groups. As in the previous section, these correlations may be a function o f family income andlor parental orientation toward education.
Student factors
3.53 Similar to the cross-national comparisons, gender i s a strong predictor of test scores across the distribution: Females score lower than males in mathematics, regardless of the performance quintile. The effect i s significant and large, ranging from 32.12 to 36.25 test score points.
3.54 For all quintiles of the test score distribution, grade has an increasing positive effect on test scores. As in the prior section, this positive relation could be attributed to the fact that students in higher grades have more in-depth knowledge of the subjects tested. I t could also be attributed to the fact that students in higher grades are less likely to have repeated grades and more likely to have advanced more quickly.
3.55 Despite the fact that, on average, age does not have a significant impact on student achievement in Colombia, it i s an important predictor of test scores at the bottom o f the distribution. I t s coefficients in the 20 percent and 40 percent performance quintiles are big and significant: an additional year increases test scores by 27.85 and 12.31 points, respectively. This finding reveals that, among bottom performers, older students may have an advantage over the younger ones.
School factors
3.56 The teacher certification variable appears to have a large, positive, and significant effect for all quintiles. The effect i s highest for the 40 percent quintile (52.30) and decreases with each successive quintile (to 29.87 for the 80 percent).
3.57 Enrollment in a public institution in Colombia i s strongly, negatively associated with educational outcomes across performance quintiles. These effects are especially severe for those students performing at the 40 percent and 80 percent quintiles, where the differences are coefficients above 40 percentage score points. Again, given that this analysis does not take
46
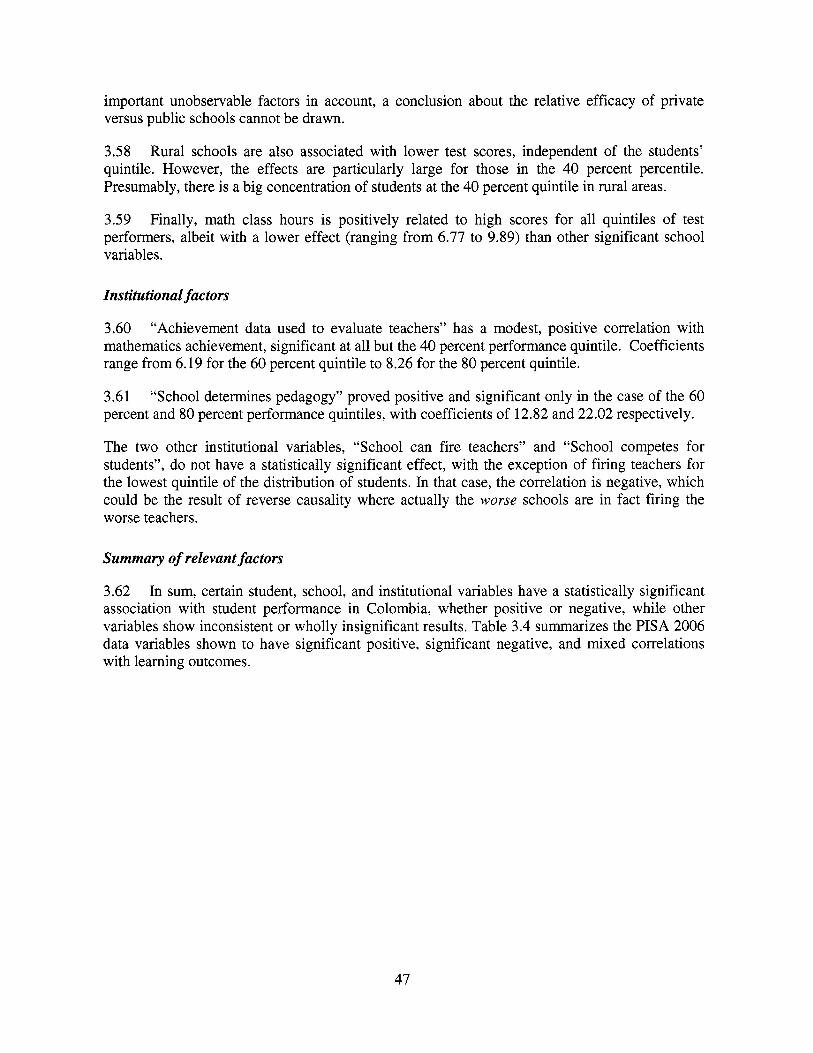
important unobservable factors in account, a conclusion about the relative efficacy of private versus public schools cannot be drawn.
3.58 Rural schools are also associated with lower test scores, independent o f the students’ quintile. However, the effects are particularly large for those in the 40 percent percentile. Presumably, there i s a big concentration o f students at the 40 percent quintile in rural areas.
3.59 Finally, math class hours i s positively related to high scores for all quintiles of test performers, albeit with a lower effect (ranging from 6.77 to 9.89) than other significant school variables.
Institutional factors
3.60 “Achievement data used to evaluate teachers” has a modest, positive correlation with mathematics achievement, significant at all but the 40 percent performance quintile. Coefficients range from 6.19 for the 60 percent quintile to 8.26 for the 80 percent quintile.
3.61 percent and 80 percent performance quintiles, with coefficients of 12.82 and 22.02 respectively.
“School determines pedagogy” proved positive and significant only in the case of the 60
The two other institutional variables, “School can fire teachers” and “School competes for students”, do not have a statistically significant effect, with the exception of firing teachers for the lowest quintile of the distribution of students. In that case, the correlation i s negative, which could be the result of reverse causality where actually the worse schools are in fact firing the worse teachers.
Summary of relevant factors
3.62 In sum, certain student, school, and institutional variables have a statistically significant association with student performance in Colombia, whether positive or negative, while other variables show inconsistent or wholly insignificant results. Table 3.4 summarizes the PISA 2006 data variables shown to have significant positive, significant negative, and mixed correlations with learning outcomes.
47
Table 3.4: Summary of Predictors of Mathematics Learning in Colombia, PISA 2006
Level Effect Variable Family factors Positive Computers at home
Books at home
Mother’s educational achievement (positive and significant for Mixed mothers with university studies)
Student factors Positive Enrollment in a higher grade
Negative Gender (female)
Mixed Age (positive and significant at 20% and 40% quintiles)
School factors Positive Teacher certification Number of hours of mathematics study
Negative Enrollment in a public school Rural schools
Student-teacher ratio (very small negative and significant Mixed effect for ratio squared)
Institutional factors Positive Use of data to improve teacher practice
Mixed Competition for students (not significant) Autonomy to determine pedagogical methods of instruction (positive and significant at 60% and 80% quintiles) Autonomy to f i re teachers (negative and significant at 20% quintile)
Hypothesis testing and areas for future research
3.63 The correlations described above point to areas for further exploration through hypothesis testing, a subset of which should addressed in Phase 2 of the World Bank’s program of Analytical and Advisory Activities with the Government o f Colombia. Analysis of existing policies and programs, as well as those designed specifically for experimentation, can shed light on which relationships might be causal and what additional factors may be at play. Below are suggestions of possible hypotheses to be tested.
3.64 Family background factors found by the analysis to have a positive association with student perfonnance, which include computers and books in the home and mothers’ attainment of a university degree, may be associated with a number of omitted variables. For example, these factors may simply be a function of higher household income, which consistently correlates with higher student achievement. Alternatively, the presence o f educational resources and an
48
educated parent who can provide guidance and support may in and o f themselves aid student learning. Finally, these factors may indicate a higher level o f parent engagement in student learning; the presence o f educational materials may signal a household highly motivated toward academic success, and the most educated parents might place a particular premium on their children’s achievement in school. These factors suggest that the following hypotheses be tested with augmented data that include both household income and variables pertaining to student and parent attitudes:
Controlling for household income, the strong positive association o f educational materials in the home or mother’s university attainment with student performance diminishes or disappears.
Students’ access to educational materials in the home, independent o f household income and parent attitudes, has a positive association with academic achievement.
Students, whose parents are involved in their children’s education, as reflected by parents’ attitudes and actions, are more academically successful. Policies that encourage parental support for and participation in their children’s education can have a positive effect on achievement.
3.65 The difference in performance between girls and boys suggests the need for greater understanding o f what factors cause this difference and which policies are effective in addressing it. Two general areas of hypotheses to be tested include:
School factors, such as classroom dynamics, peer effects, and/or teacher expectations, negatively affect female student achievement. Teacher and school administrator training, as wel l as single-sex classrooms and schools, can alter the attitudes and behaviors o f school personnel and students to rectify inequity o f achievement.
Family factors, such as parent expectations and/or girls’ competing work and home responsibilities, negatively affect female student achievement. CCT programs can provide an incentive to families to invest in girls’ education.
3.66 The positive and significant effect o f being enrolled in a higher grade may suggest that students in higher grades are exposed to higher-level content or have advanced more quickly, or that a higher percentage o f students in lower grades have repeated at least one grade. In addition, Colombia’s overall performance relative to other countries suggests that i t s course content ought to be more rigorous across grades. Hypotheses to be tested might therefore include:
Controlling for students’ rates of advancement or repetition relative to their age, the positive association o f being enrolled in a higher grade diminishes or disappears.
Colombia’s academic content, as evaluated by national assessments, does not match international standards o f rigor, even at the upper secondary level.
Increasing the rigor o f academic standards at al l grade levels can improve achievement on international assessments, increase attendance, and reduce repetition and drop-out.
49
o In particular, struggling or at-risk students are most successful when they are expected to meet high academic standards. Furthermore, their likelihood o f success increases when they are provided with the necessary support (e.g., accelerated programs, extra time, etc.) to excel at a higher level o f rigor.
3.67 Given that the effect o f age was positive and significant at the two lowest quintiles, a possible implication i s that at-risk students perform better when they slightly delay entry into school (e.g., by no more than one year) and may therefore be more mature and prepared upon entry. A policy on delayed school entry can be analyzed to test this hypothesis.
3.68 At the school level, the strong, positive correlation between teachers with a certificate and student achievement, both overall and at all performance quintiles, may suggest that either the teacher certification process itself or what certification signals correlates with student achievement. Hypothesis testing may generate insight into which specific factors associated with certification are in fact correlated with student achievement. Such an inquiry may lead to deeper analysis into the extent to which those characteristics are equitably represented across schools and regions, and how they may be expanded, particularly in high-need areas.
3.69 The moderate, positive correlation between the number of hours spent on mathematics study and student achievement in that subject may either suggest that time on task per se i s correlated with student achievement or reflect the presence o f an omitted variable such as a community’s orientation toward education that increases the time available for study. Increased time on task in particular subjects could be evaluated in different contexts, both as part o f and independent of broader reform policies. However, as noted earlier in this chapter, Colombia already has a long school day and the highest number of hours spent on math among regional participant countries, so testing this hypothesis may be a relatively low priority.
3.70 The difference in performance between public and private school students suggests the investigation of unobservable factors, such as student selection and population, as well as school autonomy and incentives. For example, while public schools are generally required to accept all students, special public schools that share admissions criteria with private schools (e.g., academic aptitude) provide the opportunity to test the hypothesis that public and private schools with academically similar student populations have comparable academic results. In addition, school concession programs that create public schools that have aspects o f autonomy and incentives similar to those of private schools allow for the testing of the hypothesis that those factors positively effect achievement.
3.7 1 The strong, negative association between rural schools and student achievement suggests many possible related factors, including a disadvantaged student population, curriculum that students perceive as boring and irrelevant to their context, under-resourced schools, and structural constraints such as long distances and low population density. The presence of these factors may all be verified through an analysis of policies and programs designed to address them. A program such as PER, which consists of nine different programs, may provide a unique opportunity to test multiple hypotheses, since programs share some elements but not others.
3.72 Finally, the institutional factor positively and significantly associated with student achievement, the use of achievement data to evaluate teachers, may suggest the importance o f data-driven decision-making. In order to improve their practice, i t follows that teachers examine assessment data to determine the extent to which students are mastering the material, so that they
50
may adjust their teaching accordingly. Data may also be used as an input in the personnel evaluation process, disseminated to inform the public about school and system quality, and serve as a basis of positive and negative consequences for personnel and/or schools. I t i s important to develop a better understanding o f which data are used and how, as well as whether th i s practice i s part of a larger policy or specific program that might influence achievement independent of the use of data per se. Hypotheses to be tested therefore may include:
National and/or other student assessment data (to be identified) are used on a regular basis (intervals to be defined) to inform teaching practice and/or school resource allocation decisions and/or to evaluate teacher and school director performance.
Such data are part o f the formal performance appraisal system for school personnel and/or lead to positive or negative consequences.
0 Data are disseminated to inform families and the community about school quality.
Conclusion
3.73 As noted earlier in t h i s chapter, the analysis of PISA 2006 reveals that Colombia shows considerable room for improvement in the quality of i t s education system learning outcomes. A substantial percent of i t s students fail even to understand basic test questions. This and other findings suggest that Colombia has correctly placed an emphasis on quality as a key priority o f i t s current education planning and reform efforts.
3.74 While the education system and research literature reviews descfibed in Chapters 1 and 2 respectively have policy implications, the PISA analysis complements these reviews by both sounding an alarm about Colombia’s performance and pointing to important areas for further study. Based on these complementary sources, Chapter 4 presents a point of departure for a discussion of the key levers o f change in improving educational quality, the policy interventions that can effect change, and the specific actions that the Government o f Colombia can take in improving i t s education system and engaging in further analysis.
51
CHAPTER 4. POLICY OPTIONS
4.1 The first three chapters of the report provide a description of the Colombian education system, an international review of the factors that are associated with student learning, and analyses of new data (PISA 2006) on learning outcomes. The findings in these chapters contribute to the international body o f knowledge on determinants o f learning and comprise an important addition to the research on education quality in developing countries, which i s relatively scant. At the same time, the PISA analysis highlights the glaring performance gaps among students and serves as a call to action for the Colombian government. The international and Colombian research base, as well as the successful approaches of other countries facing similar challenges, suggests a number of policy options for addressing these gaps. While the PISA results on the predictors o f student learning show correlation rather than causation and should therefore be used with caution in formulating policy recommendations, they suggest areas for further research that may aid policy development.
Agenda for Action
4.2 Reducing the proportion of students at the bottom two proficiency levels of PISA has to be the number one priority of education policy makers in Colombia. For Colombia to achieve sustainable and equitable economic growth, i t needs to improve learning outcomes among all students, but particularly among the significant proportion of i t s population that does not achieve minimum levels of performance. Based on the findings described earlier in this report, an agenda for action has been developed to achieve this goal. The agenda consists of four levers for change:
1. Continue participation in and learning from assessments
2. Enable disadvantaged populations to achieve high standards
3. Strengthen the system of accountability
4. Use resources more efficiently
(1) Continue participation in and learning from assessments
4.3 Benchmark performance against international standards. As Colombia continues i t s participation in international assessments such as TIMSS and PISA, i t w i l l be important to use the results to benchmark i t s performance against international standards, set targets for improvement over time, and implement corresponding system reforms. As other countries have shown, international assessment results provide an excellent opportunity for countries to evaluate their education systems, establish targets for future performance, and inform policy responses. Particularly instructive examples include Jordan, another lower middle-income country (see Box 4.1), as well as Chile and Poland, and Colombia might benefit from a study tour to one or more of these countries. In i t s National Education Plan, Colombia could adopt specific targets for improvements in test scores and the percent o f students performing at higher proficiency levels
52
for future rounds o f PISA and other assessments. Furthermore, i t might link i ts national assessments to PISA and adapt i t s learning standards accordingly so as to increase academic rigor. Given that establishing content standards in core subjects comprises a key plank in Colombia’s National Education Plan, the country would benefit substantially using PISA to inform the development of those learning standards. Colombia’s poor performance on the PISA suggests that i t needs to increase i t s expectations significantly for what students should know and be able to do.
4.4 Strengthen the national assessment system. While international assessments provide an important opportunity to benchmark a country’s education system and shine media attention on the issue o f education, they must be complemented by a strong system of national assessments that support continuous improvement and accountability. Although Colombia has a relatively long-standing tradition of administering student assessments, results have not always been used to provide feedback to educational planners. In addition, the national assessment and descriptive data generated by different agencies (ICFES, MEN and Departamento Administrativo Nacional de Estadistica - DANE) are not comparable and cannot be matched. These technical issues limit the value of the conclusions and impede rigorous comparisons of results over time. Thus, as a first step, i t w i l l be important to improve the comparability of national assessment and other education data. The ICFES i s currently engaged in efforts to make such improvements - an important first step towards establishing a mechanism to ensure greater responsibility and accountability in the educational framework and to improve the quality of education.
4.5 Broadly disseminate and use data to inform decision-making at all levels. Student assessments are a key tool to measure the learning that takes place in schools and thus provide valuable information for policy makers, teachers, and parents. Information from assessments can be used to identify where schools and regions are failing students and to target policies and programs that improve teaching and administrative practices and support struggling students. Assessment information can provide feedback to school leaders and teachers who can then use i t to improve teacher practice and school management. Parents can use assessment data to monitor their children’s learning and help their local schools improve. In order for stakeholders to engage in this data-driven decision-making, assessment data must be made broadly and consistently publicly available in a format that i s user-friendly and tailored to each specific audience. While Medellin regularly publishes test results, i t i s unclear how widespread this practice i s among other sub-national entities, though i t comprises part of the National Education Plan and therefore should become more widespread in the future. Publicly disseminated data are an important component of a strong accountability system, which i s discussed further below.
4.6 Media coverage and public debate about assessment results and their implications can be a powerful instrument o f change. A review of published media in OECD countries suggests that education policy-making was highly affected by the publication and dissemination of results. Countries where media coverage was extensive (especially low-performing countries) used the results to launch education reforms. In the case of Germany, for example, i t s poor performance on PISA in 2003 led to widespread public debate and a major review o f i t s education policies. This was also the case in Chile (see Box 4.5).
Foster public debate and involvement of stakeholders.
53
4.7 I t is noteworthy that Colombia has signaled its commitment to engaging the public in improving the nation’s education system, as it has done with the Plan Decenal. I t w i l l be important for Colombia to continue to be proactive and further involve stakeholders to engage in public debate of the assessment results.
rm efforts to reform
54
(2) Enable disadvantaged populations to achieve high standards
4.8 Continue to implement, evaluate, and refine programs that improve enrollment and achievement among poor students. The PISA analysis points to the need to identify and implement strategies to raise the achievement of the lowest-performing students, and the literature indicates a strong correlation between family income and student achievement. Colombia has demonstrated i t s openness to experimentation and rigorous impact evaluation in the implementation of education programs, including those targeting poor students and families. In this spirit, i t i s important that Colombia continues to evaluate and refine such programs, with a focus on the particular strategies that are most effective in improving student learning.
4.9 CCTprograms in Latin America (Oportunidades in Mexico, Bolsa Familia in Brazil, and Familias en Accwn and the Bogota‘ pilot program in Colombia) have proven to be very successful in improving access and retention of disadvantaged students. Evidence from the Oportunidades program in Mexico shows that the CCT program resulted in a significant reduction in the achievement gap between indigenous and non-indigenous children. In addition, evidence from the pilot study of a conditional cash transfer program in the city of Bogota in 2005 shows evidence of a significant positive peer effect in attendance decisions and confirms the efficacy o f conditional cash transfer programs even when financial restrictions limit the eligibility to targeted subgroups. I t i s important that these interventions be carefully targeted, particularly at the poor and most vulnerable. Furthermore, Colombia could consider incorporating into the design o f these programs elements that aim to improve student achievement, not simply attendance.
4.10 Although ended 10 years ago, Colombia’s voucher program, PACES, has been shown to improve academic achievement. It i s important to note the caveats presented by some o f the Colombia literature, for instance that the distribution of vouchers was most prevalent in large, urban areas and that the positive impact of private schools increases with students’ socioeconomic level. Therefore, i t wi l l be important to verify through evaluation that low- income students enrolled in private schools through vouchers and other mechanisms truly are benefiting academically and that either such programs are adapted for other (e.g., rural) contexts or other strategies more appropriate to those contexts are implemented.
4.1 1 High-quality early childhood development (ECD) programs improve school readiness and long-term academic success among poor students. Colombia’s H C program has been shown to have a demonstrated effect on enrollment and academic advancement, years after children participated. This finding corresponds to the larger body of research demonstrating the significant potential o f ECD programs to improve student outcomes, particularly among the most disadvantaged. In i t s National Education Plan and Plan Decenal, Colombia acknowledges the importance of high-quality ECD programs through i t s commitment to expand services to children ages 0 to 5, improve teacher training, and establish an accreditation system for service providers. I t i s also important that Colombia continues to evaluate, refine, and expand H C and other ECD programs to ensure that a high percentage of the country’s disadvantaged children are receiving high-quality services and demonstrating improved developmental outcomes, as measured through health and growth monitoring and by instruments such as the Early Years Evaluation.
55
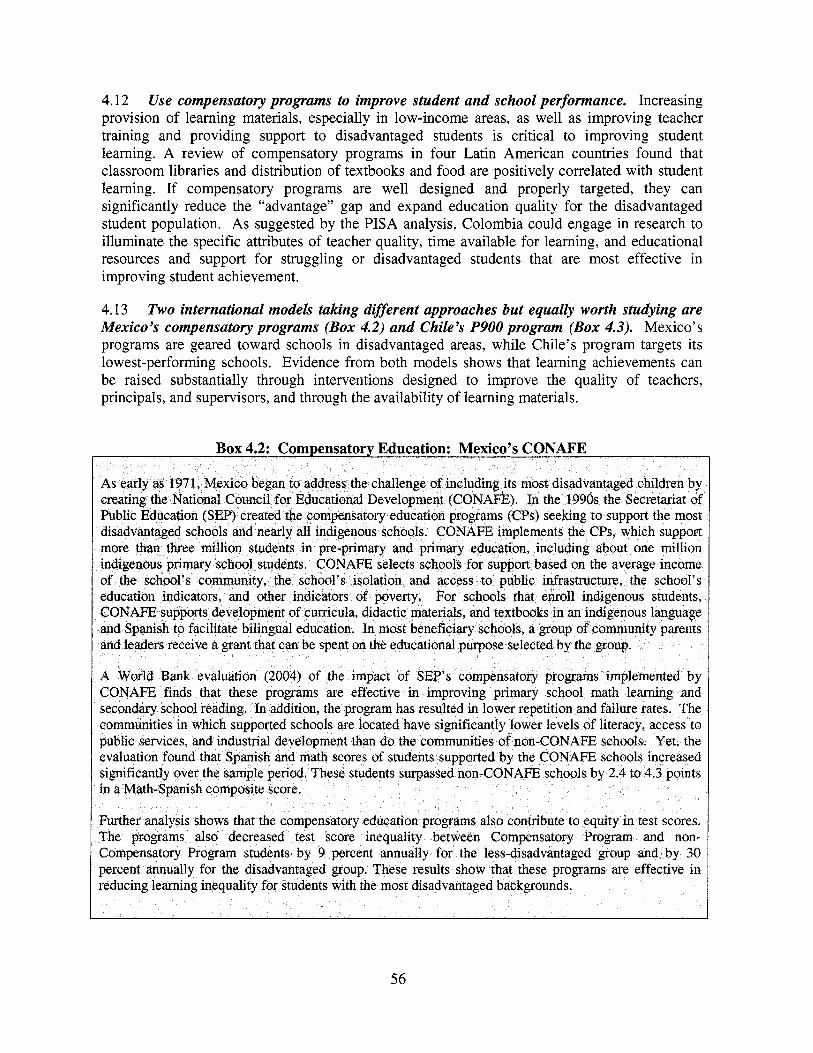
4.12 Use compensatory programs to improve student and school performance. Increasing provision of learning materials, especially in low-income areas, as well as improving teacher training and providing support to disadvantaged students i s critical to improving student learning. A review o f compensatory programs in four Latin American countries found that classroom libraries and distribution of textbooks and food are positively correlated with student learning. If compensatory programs are well designed and properly targeted, they can significantly reduce the “advantage” gap and expand education quality for the disadvantaged student population. As suggested by the PISA analysis, Colombia could engage in research to illuminate the specific attributes of teacher quality, time available for learning, and educational resources and support for struggling or disadvantaged students that are most effective in improving student achievement.
4.13 Two international models taking different approaches but equally worth studying are Mexico’s compensatory programs (Box 4.2) and Chile’s P900 program (Box 4.3). Mexico’s programs are geared toward schools in disadvantaged areas, while Chile’s program targets i t s lowest-performing schools. Evidence from both models shows that learning achievements can be raised substantially through interventions designed to improve the quality of teachers, principals, and supervisors, and through the availability o f learning materials.
56
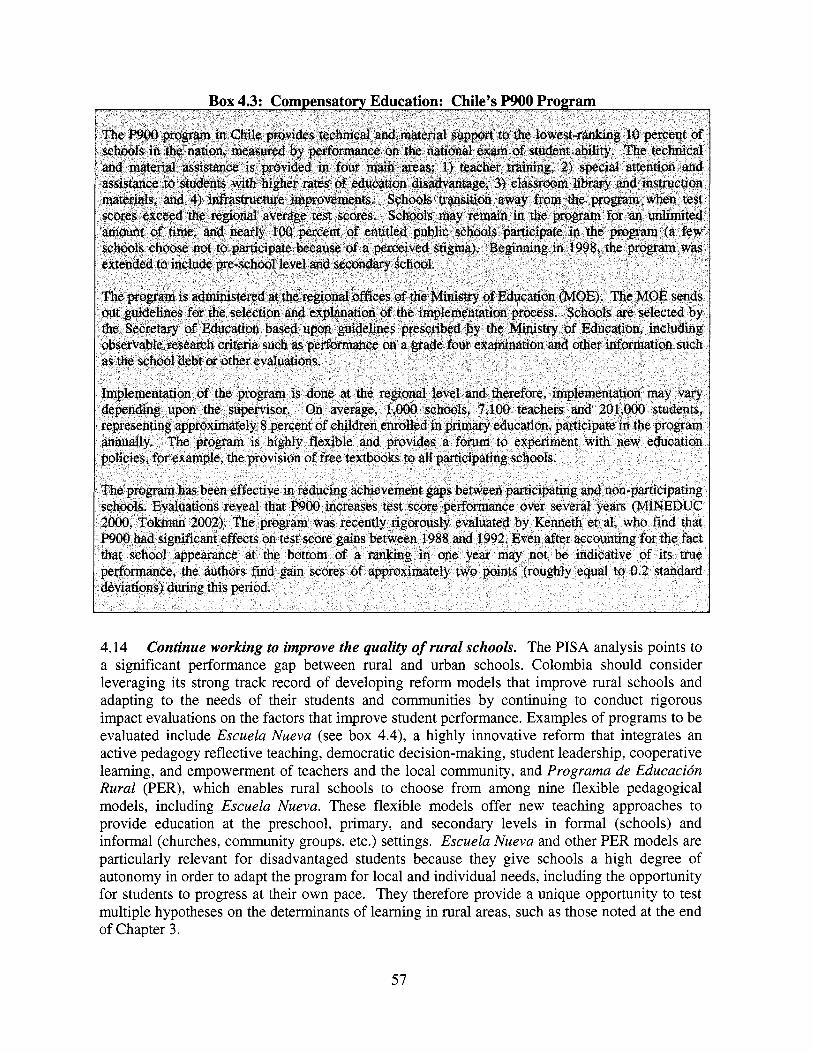
4.14 Continue working to improve the quality of rural schools. The PISA analysis points to a significant performance gap between rural and urban schools. Colombia should consider leveraging i t s strong track record o f developing reform models that improve rural schools and adapting to the needs o f their students and communities by continuing to conduct rigorous impact evaluations on the factors that improve student performance. Examples o f programs to be evaluated include Escuela Nueva (see box 4.4), a highly innovative reform that integrates an active pedagogy reflective teaching, democratic decision-making, student leadership, cooperative learning, and empowerment of teachers and the local community, and Programa de Educacio'n Rural (PER), which enables rural schools to choose from among nine flexible pedagogical models, including Escuela Nueva. These flexible models offer new teaching approaches to provide education at the preschool, primary, and secondary levels in formal (schools) and informal (churches, community groups, etc.) settings. Escuela Nueva and other PER models are particularly relevant for disadvantaged students because they give schools a high degree of autonomy in order to adapt the program for local and individual needs, including the opportunity for students to progress at their own pace. They therefore provide a unique opportunity to test multiple hypotheses on the determinants of learning in rural areas, such as those noted at the end o f Chapter 3.
57
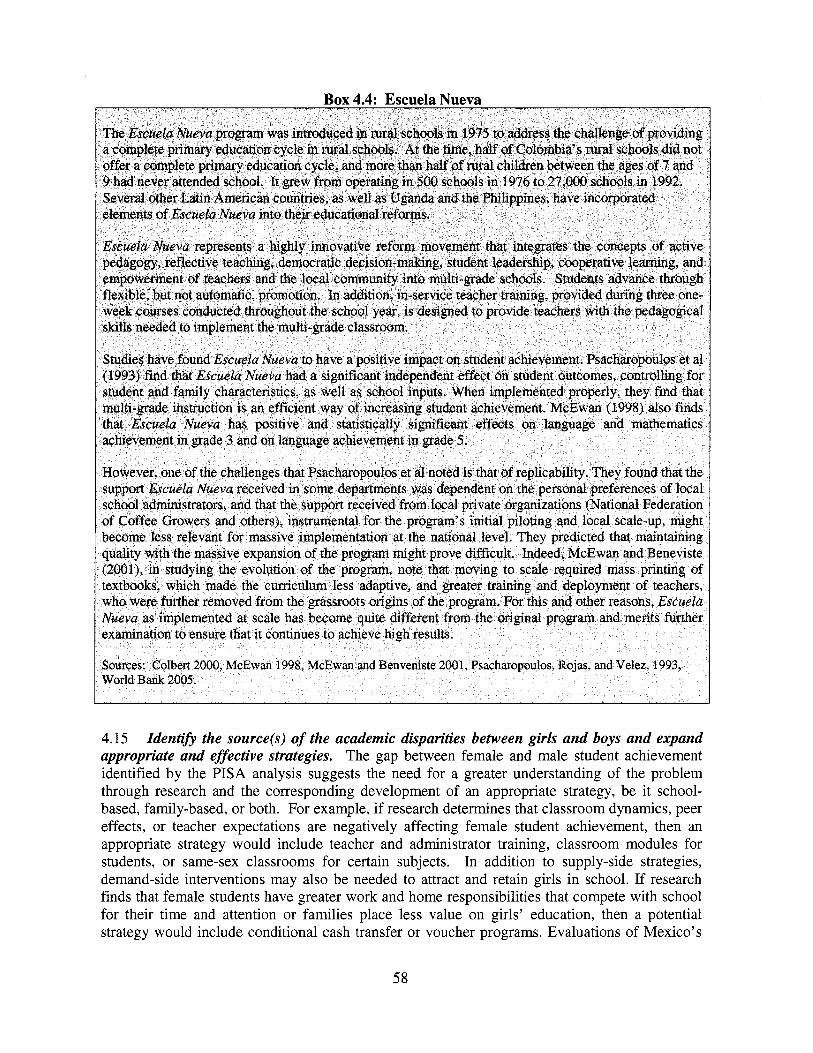
Box 4.4: Escuela Nueva
4.15 Identih the source(s) of the academic disparities between girls and boys and expand appropriate and effective strategies. The gap between female and male student achievement identified by the PISA analysis suggests the need for a greater understanding o f the problem through research and the corresponding development o f an appropriate strategy, be it school- based, family-based, or both. For example, i f research determines that classroom dynamics, peer effects, or teacher expectations are negatively affecting female student achievement, then an appropriate strategy would include teacher and administrator training, classroom modules for students, or same-sex classrooms for certain subjects. In addition to supply-side strategies, demand-side interventions may also be needed to attract and retain girls in school. If research finds that female students have greater work and home responsibilities that compete with school for their time and attention or families place less value on girls’ education, then a potential strategy would include conditional cash transfer or voucher programs. Evaluations o f Mexico’s
58
Oportunidudes program indicate that the program significantly increased the enrollment and retention of girls.
(3) Strengthen the system of accountability
4.16 Consider establishing national assessments as exit examinations. While Colombia has a long-standing practice of administering national assessments, as noted above, these assessments are not currently used to determine whether students advance to the next education cycle or graduate. However, international evidence has shown a strong correlation between exit examinations and test scores. Colombia should consider implementing exit exams and conducting an impact evaluation of the results. As noted earlier, i t could also publish the results of these assessments widely and in a format that i s digestible for diverse audiences.
4.17 Establish a process for quality certification. Schools must demonstrate that they can provide a quality education to a l l students. The National Education Plan makes reference to the establishment of a process for quality certification. A standardized process would enable schools to have a common understanding of the standards by which they are held accountable and to work toward achieving those standards. Such a process could also establish and facilitate the enforcement of consequences for failing to meet a minimum standard, as well as for achieving a particularly high standard.
4.18 Grant schools greater authority over pedagogical, school resources, and teacher- related decisions. In most countries that perform well in international assessments, local authorities and schools have substantial responsibility for educational content and/or use of resources. To enable i t s schools to achieve the quality standards established by a certification system, Colombia needs to continue i t s efforts to devolve decision-making to the school level. Given that the country already has a policy of school autonomy over pedagogy, i t might consider investigating the extent to which schools are utilizing that autonomy and to what effect.
4.19 Given the importance of teacher quality for student achievement, it is critical that the system has the authority to dismiss or reassign teachers who are not performing up to standard if schools are realistically to be expected to achieve quality standards. While the new statute on teacher professionalization permits teachers to enter and continue in the profession only if they perform adequately, the statute only applies to those teachers who have entered the system since June 2002 and therefore to a small fraction o f current teachers. As noted earlier, sub-national governments find dismissing teachers very difficult in practice. To the extent that students are not learning because o f ineffective teachers, i t i s incumbent on the system to address this issue.
4.20 Use contracting as a means to create greater autonomy for public schools and to demonstrate the efficacy of a performance-based model. I t i s important that municipalities take advantage of opportunities to engage in contracting, such as the use of concessions programs, to enable schools to operate with greater autonomy in areas such as pedagogy and personnel that have been demonstrated to have a positive impact on student achievement. The BogotB Concessions program, for instance, has been shown to reduce dropout rates and to improve test scores. Contracting has the additional benefit o f requiring schools to perform effectively as a condition to continue operating and therefore has an accountability mechanism built in. I t i s
59
important that such models continue to be evaluated, refined, and expanded to show what elements o f autonomy and accountability are most important for student achievement.
4.21 Improve the capacity of sub-national governments and hold them accountable for coverage and qua& Under Law 715, sub-national entities are compensated based on actual enrollment. However, several studies find considerable variation in efficiency among municipalities in achieving coverage and quality. A World Bank (2007a) study asserts that non- certified municipalities can benefit from becoming certified. The study reports that non-certified municipalities face a disconnect between their level of authority, which i s minimal, and their level o f responsibility. However, research has shown that some municipalities may lack the capacity to perform effectively under a decentralized system. I t i s therefore important to explore ways to improve sub-national governments’ capacity to assume the authority and responsibility for the effective administration of education services. Box 4.5 shows Chile’s experience in combining a long-standing policy o f decentralization and assessment with subsequent reforms that provide support for teachers and schools and establish a quality assurance system.
4.22 Strengthen the accountability framework by enhancing social and parental participation in schools. The PISA analysis may indirectly suggest that parents’ orientation toward learning, manifested by making educational resources such as computers and books available in the home, has a positive correlation with their children’s achievement. While parents may have the desire, incentive, and capacity to improve their children’s school, they often lack any voice or authority in the school improvement process. A strengthened accountability framework would therefore involve parents and the community to a greater extent and enable them to participate in setting clear goals and visions for the school system. Policies and programs that foster parent involvement might be evaluated to determine their most effective elements.
60
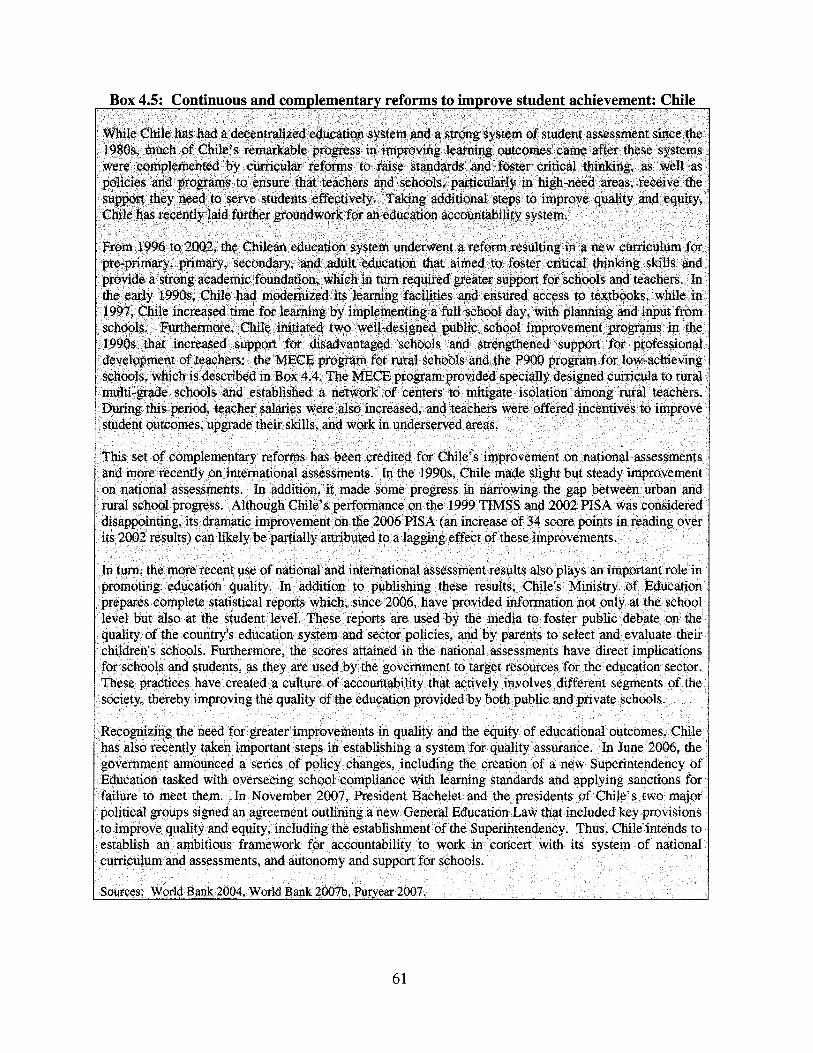
61
(4) Use resources more efficiently
4.23 Leverage existing resources. Colombia has increased i t s education spending significantly over the past several years, but that increased spending has not necessarily translated into better learning outcomes. Given resource constraints, especially those posed by teacher compensation and pensions, it wi l l be imperative to use existing resources more effectively and to ensure that they are targeted to those most in need.
4.24 Alhcate funds based on student and school needs. As Vegas and Petrow (2007) note, three types of information are needed to make effective decisions in allocating resources to schools and compensating for deficiencies: information on performance, context, and income. Colombia has already begun to allocate funding based on student needs by differentially weighting funding based on the percentage of the population that lives in rural areas and secondary enrollment as a proportion of total enrollment. A weighted student funding formula that takes these and other characteristics into consideration i s an area that merits further exploration.
4.25 Conduct cost-benefit analyses and focus resources accordingly. As Colombia continues to evaluate i t s various programs and policies aimed at improving educational outcomes for all students, it should consider not only their efficacy but also their cost-effectiveness. This w i l l facilitate i t s decision-making in considering which programs to expand in the face of resource constraints.
Conclusion
As we note above, based on an assessment of the existing international and Colombian literature on the determinants o f learning, a review of the Colombian education system, and an analysis .of PISA 2006, this report identifies four policy levers for education reform in Colombia: 1) the continued participation in and learning from assessments, 2) the enabling of disadvantaged populations to achieve high standards, 3) a strengthened system o f accountability, and 4) a more efficient use of resources. These recommendations are consistent with a growing body of literature and empirical evidence on the positive impact of education quality for improved welfare and economic growth. As such, they aim to improve quality of education and further advance the equity in the distribution of student achievements in Colombia in order to strengthen the educational base, promote sustainable economic growth, and expand education opportunities to a broader segment o f the population.
62
References
Abdul-Hamid, H. 2003. “What Jordan needs to do to prepare for the knowledge economy: Lessons learned from TIMMS-R.” University of Maryland (processed).
Alvarez, J., V. Garcia Moreno, and H. Patrinos. 2007. “Institutional Effects as Determinants of Learning Outcomes: Exploring State Variations in Mexico.” World Bank Background Paper.
Anderson, J.B. 2002. “The Effectiveness of Special Interventions in Latin American Public Primary Schools.” The Dante B. Fascell North-South Center Working Paper Series, No. 5. University of Miami.
Angrist, J., E. Bettinger, E. Bloom, E. King and M. Kremer. 2002. “Vouchers for Private Schooling in Colombia: Evidence from a Randomized Natural Experiment.” American Economic Review 92(5): 1535-1558.
Angrist, J., E. Bettinger and M. Kremer. 2006. “Long-Term Educational Consequences of Secondary School Vouchers: Evidence from Administrative Records in Colombia.” American Economic Review 96(3): 847-62.
Attanasio, 0. and M. Vera-Hernandez. 2004. “Medium and Long Run Effects of Nutrition and Child Care: Evaluation of a Community Nursery Programme in Rural Colombia.” IFS Working Paper EWP04/06. Institute for Fiscal Studies.
Attanasio, O., E. Fitzsimons, A. Gomez, D. Lopez, C. Meghir, and A. Mesnard. 2006. “Child Education and Work Choices in the Presence of a Conditional Cash Transfer Programme in Rural Colombia.” Discussion Paper 5792. Center for Economic Policy and Research.
Bando, R., L.F. Lopez-Calva and H.A. Patrinos. 2005. “Child Labor, School Attendance, and Indigenous Households: Evidence from Mexico.” World Bank Policy Research Working Paper No. 3487, Washington, D.C.
Barrera-Osorio, F. 2006. “The Impact of Private Provision of Public Education: Empirical Evidence from Bogotfi’ s Concession Schools.” World Bank Policy Research Working Paper 4121.
Barrera, F. 2003. “Decentralization and Education: an Empirical Investigation.” University of Maryland.
Barrera, F., Bertrand, M., Linden, L. and Perez-Calle, F. 2008. “Conditional Cash Transfers in Education: Design Features, Peer and Sibling Effects: Evidence from Randomized Experiment in Colombia.” National Bureau of Economic Research. Working paper 13890.
Barrera, F. and A. Gaviria. 2003. “Efficiency of Colombian Schools.” Fedesarrollo.
63
Barrera, F. and Ibifiez, A. 2004. “Does Violence Reduce Investment in Education?: A Theoretical and Empirical Approach.” Documento CEDE 2004-27.
Barro, R.J. 2001. “Human Capital and Growth.” American Economic Review, Papers and Proceedings 91(2): 12-17.
Bedard, K. and E. Dhuey. 2006. “The Persistence of Early Childhood Maturity: International Evidence of Long-Run Age Effects.” The Quarterly Journal of Economics 121(4).
Bettinger, E., M. Kremer, and J, E. Saavedra. 2008. “Are Vouchers Redistributive?” Mimeo Harvard, March 2008.
Caro, B.L. 2000. “Factores Asociados a1 Logro Acad6mico de 10s Alumnos de 3ro y 5to de Primaria de Bogoti.” Coyuntura Social, Fedesarrollo, No. 22, May, pp. 65-80.
Chaudhury, N., Hammer, J., Kremer, M., Muralidharan, K. and Rogers, H. 2006. “Missing in Action: Teacher and Health Worker Absence in Developing Countries.” Journal of Economic Perspectives 20( 1).
Coleman, J. 1966. Equality of Educational Opportunity. Washington, D.C.: U.S. Department of Education.
Cox, D. and E. Jimenez. 1991. “The Relative Effectiveness o f Private and Public Schools: Evidence from Two Developing Countries.” The Journal of Development Economics 34( 1991): 99-121.
Datar, A. 2006. “Does Delaying Kindergarten Entrance Give Children a Head Start?” Economics of Education Review 25:43-62.
Elder, T.E. and D.H. Lubotsky. 2006. Kindergarten Entrance Age and Children’s Achievement: Impact of State Policies, Family Background, and Peers. Unpublished manuscript, University of Illinois and University of Michigan.
Engle, P., Black, M., Behrman, J., Cabral de Mello, M., Gertler, P., Kapiriri, L., Martorell, R., Eming Young, M., and the International Child Development Steering Group. “Child Development in Developing Countries: Strategies to Avoid the Loss of Development Potential in More Than 200 Mill ion Children in the Developing World.” Lancet Child Development Series Volume 369.
Fertig, M. 2003. “Who’s to Blame? The Determinants of German Students’ Achievement in the PISA 2000 Study.” IZA Discussion Paper No. 739, Bonn.
Fertig, M. and C.M. Schmidt. 2002. “The Role of Background Factors for Reading Literacy: Straight National Scores in the PISA 2000 Study.” E A Discussion Paper No. 545, Bonn.
64
Fuchs, T. and L. Woessmann. 2004. “What Accounts for the International Differences in Student Performance? A Re-examination Using PISA Data.” CESifo Working Paper No. 1235, Center for Economic Studies and I f0 Institute of Economic Research, Munich.
Galiani, S., Gertler, E., and Schargrodsky, E. 2005. “School Decentralization: Helping the Good Get Better, but Leaving the Poor Behind.” (Processed.)
Galinsky, E. 2006. “The Economic Benefits of High-Quality Early Childhood Programs: What Makes the Difference?” Families and Work Institute.
Gaviria, A. and J. Barrientos. 2001. “Detemzinantes de la Calidad de la Educacidn en Colombia. ” National Planning Department, Archivos de Economia 159, November.
Goldstein, H. 1999. Multilevel Statistical Models, London: Institute of Education, Multilevel Models Project, April.
Greenberg, E. 2004. “Climates for Learning.” Paper presented at the American Educational Research Association 2004 Annual Meeting, April 12- 16, San Diego, CA.
Guiso, L., F. Monte, P. Sapienza, and L. Zingales. 2008. “Culture, Gender and Math.” Science 380(5880): 1164-1 165.
Hanushek, E.A. 2004a. “What if There are No Best Practices?” Scottish Journal of Political Economy 51(2): 156-172.
Hanushek, E.A. 2004b. “United States Lessons About School Accountability.” Journal for Institutional Comparisons. Center for Economic Studies and I f0 Institute of Economic Research, Munich.
Hanushek, E.A. 2007. “The Role of School Improvement in Economic Development.”
Hanushek, E.A. and J.A. Luque. 2003. “Efficiency and Equity in Schools around the World.” Economics of Education Review 22(5): 48 1-502.
Hanushek, E.A. and D.D. Kimko. 2000. “Schooling, Labor Force Quality, and the Growth of Nations.” American Economic Review 90(5): 1 184-1208.
Hanushek E.A. and L. Woessmann. 2007. “Education Quality and Economic Growth” The World Bank, Washington D.C.
Hanushek, E.A. and L. Woessmann. 2007. “The Role of School Improvement in Economic Development.” CESifo Working Paper No. 191 1, Center for Economic Studies and If to Institute of Economic Research, Munich.
Heneveld, W. and H. Craig. 1996. Schools Count. World Bank Technical Paper No. 303, Africa Technical Department Series, Washington, D.C.
65
Iregui, A., Melo, L. and Ramos, J. 2006. “Evaluaci6n y analisis de eficiencia de l a educacidn en Colombia. ” Banco de l a Republica de Colombia.
Kenneth, C., McEwan, P. and Urquiola, M. 2005. “The Central Role of Noise in Evaluating Interventions That Use Test Scores That Rank Schools.” American Economic Review.
King, E., P. Orazem, and D. Wohlgemuth. 1999. “Central Mandates and Local Incentives: The Colombia Education Voucher Program.” World Bank Economic Review 13(3): 467-491.
Lee, J.W. and R.J. Barro. 2001. “Schooling Quality in a Cross-section o f Countries.” Economica 68(272) : 465-488.
Lockheed, M. and A. Verspoor. 1991. Improving Primary Education in Developing Countries. New York: Oxford University Press.
McEwan, P. 1998. “The Effectiveness of Mulitgrade Schools in Colombia.” International Journal of Educational Development 18(6): 435-452.
McEwan, P. and L. Benveniste. 2001. “The Politics of Rural School Reform: Escuela Nueva in Colombia.” Journal of Education Policy 16(6): 547-559.
Marcelo, D. and Ariza, N. 2005. “Evoluci6n de 10s resultados de l a educacidn en Colombia (1 997-2003)”. Archivos de Econom’a, No. 286. Departamento Nacional de Planeacibn.
Melo, L. 2005. “Impact0 de l a descentralizacidn fiscal sobre l a educaci6n piiblica colombiana.” Borradores de econom’a, No. 350. Banco de l a Repiiblica.
Mina, A. 2004. “Factores asociados a1 logro educativo a nivel municipal.” Documento CEDE 2004- 15. Universidad de 10s Andes.
Nuiiez, J., R. Steiner, X. Cadena, and R. Pardo. 2002. “Cuales Colegios Ofrecen Mejor Educacidn en Colombia?” Archivos de Economi’a 193, June. Departamento Nacional de Planeacidn.
OREALC. 1998. “Primer Estudio Intemacional Comparativo sobre lenguaje, matematicas y factores asociados en tercer0 y cuarto grado.” Laboratorio Latinoamericano de Evaluacidn de l a Calidad de l a Educacidn. Santiago: OREALC.
Paqueo, V. and G. Lopez-Acevedo. 2003. “Supply-side School Improvement and the Learning Achievement of the Poorest Children in Indigenous and Rural Schools: the Case of PARE.” World Bank Policy Research Working Paper No. 3172. Washington, DC.
Patrinos, H.A. and G. Psacharopoulos. 1995. “Educational Performance and Child Labor in Paraguay.” International Journal of Educational Development 15( 1): 47-60.
Piiieros Jimenez, L.J. and A. Rodriguez Pinzdn. 1999. “School Inputs in Secondary Education and their Effects on Academic Achievement: A Study in Colombia.” LCSHD Paper Series No. 36. World Bank Human Development Department.
66
Psacharopoulos, G. and H.A. Patrinos. 2004. “Returns to investment in education: a further update.” Education Economics 12(2): 1 11-134.
Psacharopoulos, G., C. Rojas, and E. Velez. 1993. “Achievement Evaluation of Colombia’s ‘Escuela Nueva’ : I s Multi-Grade the Answer?” Comparative Education Review 37(3): 263-276.
Puryear, J. 2007. “No Chileno Left Behind: America Advisor, Inter-American Dialogue, Washington, D.C.
Reforms Most Ambitious in Region.” Latin
Ram’rez, M. and TCllez, J. 2006. “La educacibn primaria y secundaria en Colombia en el siglo XX.” Banco de la Repbblica.
Rockoff, J.E. 2004. “The Impact of Individual Teachers on Student Achievement: Evidence from Panel Data.” American Economic Review 94(2): 247-252.
Rodriguez, C. 2005 “Political economy, trade-offs and households’ schooling behavior after decentralization.” Boston University.
Sanchez, F. and Diaz, A. 2005. “Los efectos del conflict0 armado en el desarrollo social colombiano, 1990-2002.” Documento CEDE 2005-58. Universidad de 10s Andes.
Sanchez, F. 2006. “Decentralizacibn y progreso en el acceso a 10s servicios sociales de educacibn, salud y agua y alcantarillado.” Documento CEDE 2006-15. Universidad de 10s Andes.
Sarmiento, A., Alonso, C., Duncan, G. and Garzbn, C. 2005. “Evaluacibn de la gesti6n de 10s colegios en concesi6n Bogota 2000-2003.” Archivos de Econom’a, No. 291. Departamento Nacional de Planeacibn.
Sarmiento, A., Becera, L., and Gonzalez, J. 2000. “La incidencia del plantel en el logro educativo del alumno y su relacibn con el nivel socioeconbmico.” Coyunturu Social, Fedesarrollo, No. 22, May, pp. 53-64.
Suryadarma, D., Suryahadi, A., Sumarto, S. and Rogers, H. 2006. “Improving Student Performance in Public Primary Schools in Developing Countries: Evidence from Indonesia” Education Economics 14(4): 401 -429.
Tokman, Andrea (2002), “Evaluation of the P900 Program: A Targeted Education Program for Underperfonning Schools”, Working Papers, Central Bank of Chile, No. 170, Julio, 2002. http://www .bcentral.cVestudios/documentos-trabajo/pdf/dtbc 170.pdf
Umafia, C. 2004. “Esquemas de incentivos para la carrera docente.” Archivos de Econom’a, No. 270. Departamento Nacional de Planeacibn.
Uribe, C., Murnane, R., Willet, J. and Somers, M. 2005. “Expanding School Enrollment by Subsidizing Private Schools: Lessons from Bogota.” National Bureau o f Economic Research, Working Paper 1 1670.
67
Valijarvi, J., Linnakyla, P., Kupari, P., Reinikainen, P., and Arffman, I. 2002. The Finnish Success in PISA - and Some Reasons Behind It. Jyvaskyla: Institute for Educational Research.
Vegas, E. and J. Petrow. 2007. Raising Student Achievement in Latin America: The Challenge for the 21” Century. Latin American Development Forum. Washington, D.C.: World Bank.
Velez, E. and G. Psacharopoulos. 1992. “Schooling, Ability and Earnings in Colombia, 1988.” Economic Development and Cultural Change, Vol. 40, No. 3. (Apr., 1992), pp. 629- 643.
Vergara, C. and Simpson, M. 2001. “Evaluaci6n de l a descentralizacidn municipal en Colombia. Estudio general sobre 10s antecedentes, diseiio, avances y resultados generales del proceso de descentralizaci6n territorial en e l Sector Educativo.” Archivos de Economia, No. 168. Departamento Nacional de Planeaci6n.
Woessmann, L. 2003. “Schooling Resources, Educational Institutions, and Student Performance: the International Evidence.” Oxford Bulletin of Economics and Statistics 65(2): 1 17-170.
Woessmann, L. 2004. “The Effect Heterogeneity of Central Exams: Evidence from TIMSS, TIMSS-Repeat, and PISA.” CESifo Working Paper No. 1330, Center for Economic Studies and If0 Institute of Economic Research, Munich.
Woessmann, L. and T. Fuchs. 2005. “Families, Schools, and Primary-School Learning: Evidence for Argentina and Colombia in an International Perspective.” World Bank Policy Research Working Paper 3537. Washington, D.C.
World Bank. 2004. “Chile: Decades of Educational Reform Deliver.” En breve series, March 2004, No. 44. Washington, D.C
World Bank. 2004. “Education for All: Compensating for Disadvantage in Mexico.” Education Notes. Washington, DC.
World Bank. 2005. “Mexico Determinants of Learning Policy Note.” Washington, DC. (Report NO. 3 1842-MX).
World Bank. 2006. “Colombia Contracting Education Services.” Washington, DC. (Report No. 3 1841 -CO).
World Bank. 2007a. “Colombia Decentralization: Options and Incentives for Efficiency. Volumes I and 11.” Washington, DC. (Report No. 39832-CO).
World Bank, 2007b. “Chile: Institutional Design for an Effective Education Quality Assurance.” Washington, D.C. (Report No. 39830-CL).
68
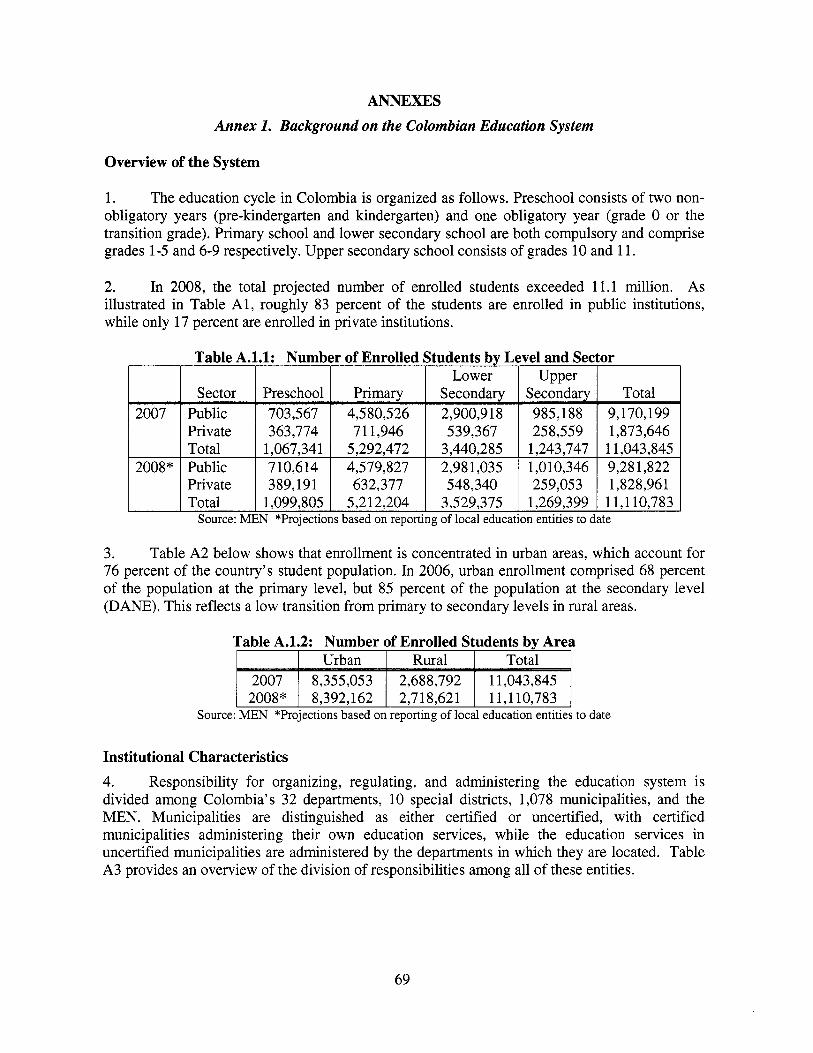
ANNEXES
Annex 1. Background on the Colombian Education System
2007 2008"
Overview of the System
Urban Rural Total 8,355,053 2,688,792 11,043,845 8,392,162 2,718,621 11,110,783
1. The education cycle in Colombia i s organized as follows. Preschool consists of two non- obligatory years (pre-kindergarten and kindergarten) and one obligatory year (grade 0 or the transition grade). Primary school and lower secondary school are both compulsory and comprise grades 1-5 and 6-9 respectively. Upper secondary school consists of grades 10 and 11.
2. In 2008, the total projected number o f enrolled students exceeded 11.1 million. As illustrated in Table A l , roughly 83 percent of the students are enrolled in public institutions, while only 17 percent are enrolled in private institutions.
Source: MEN "Projections based on reporting of local education entities to date
3. Table A2 below shows that enrollment i s concentrated in urban areas, which account for 76 percent o f the country's student population. In 2006, urban enrollment comprised 68 percent of the population at the primary level, but 85 percent o f the population at the secondary level (DANE). This reflects a low transition from primary to secondary levels in rural areas.
Institutional Characteristics 4. Responsibility for organizing, regulating, and administering the education system i s divided among Colombia's 32 departments, 10 special districts, 1,078 municipalities, and the MEN. Municipalities are distinguished as either certified or uncertified, with certified municipalities administering their own education services, while the education services in uncertified municipalities are administered by the departments in which they are located. Table A3 provides an overview of the division of responsibilities among all o f these entities.
69
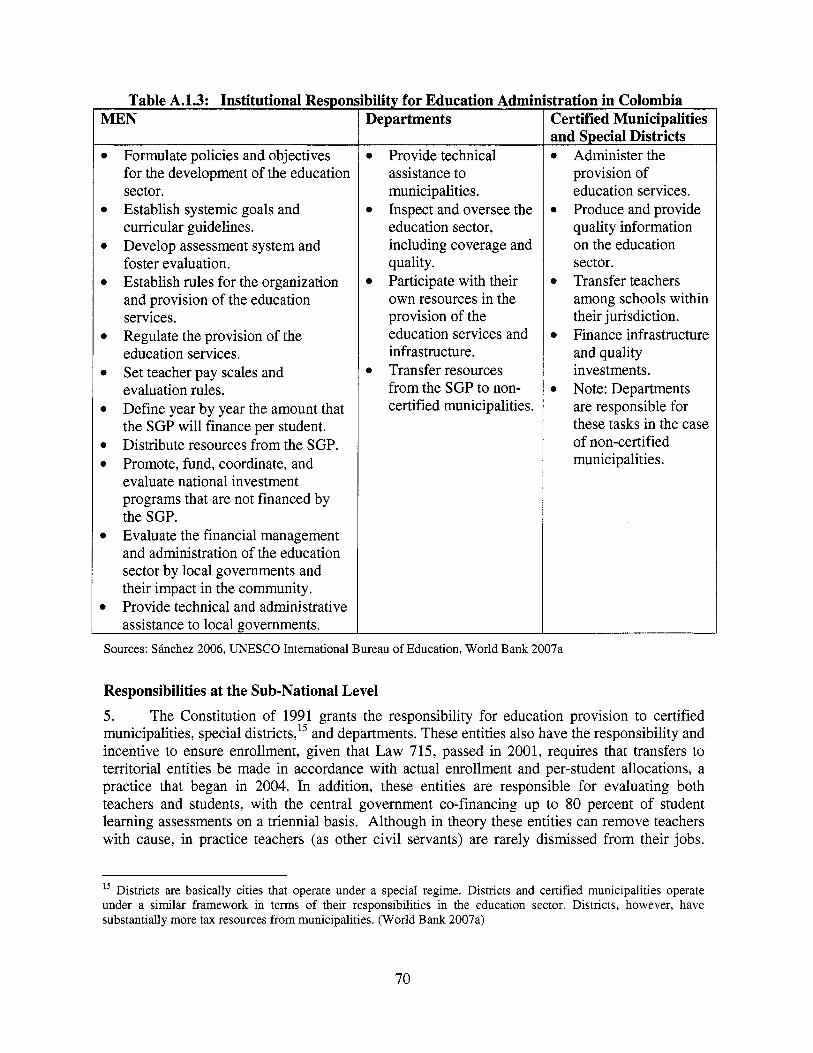
Table A.1.3: Institutional ResDon
Formulate policies and objectives for the development o f the education sector. Establish systemic goals and curricular guidelines. Develop assessment system and foster evaluation. Establish rules for the organization and provision o f the education services. Regulate the provision o f the education services. Set teacher pay scales and evaluation rules. Define year by year the amount that the SGP w i l l finance per student. Distribute resources from the SGP. Promote, fund, coordinate, and evaluate national investment programs that are not financed by the SGP. Evaluate the financial management and administration o f the education sector by local governments and their impact in the community. Provide technical and administrative assistance to local governments.
bilitv for Education Admin Departments
Provide technical assistance to municipalities. Inspect and oversee the education sector, including coverage and quality. Participate with their own resources in the provision of the education services and infrastructure. Transfer resources f rom the SGP to non- certified municipalities.
itration in Colombia Certified Municipalities and Special Districts
Administer the provision o f education services. Produce and provide quality information on the education sector. Transfer teachers among schools within their jurisdiction. Finance infrastructure and quality investments. Note: Departments are responsible for these tasks in the case o f non-certified municipalities.
Sources: SBnchez 2006, UNESCO International Bureau of Education, World Bank 2007a
Responsibilities at the Sub-National Level 5. The Constitution o f 1991 grants the responsibility for education provision to certified municipalities, special district^,'^ and departments. These entities also have the responsibility and incentive to ensure enrollment, given that L a w 715, passed in 2001, requires that transfers to territorial entities be made in accordance with actual enrollment and per-student allocations, a practice that began in 2004. In addition, these entities are responsible for evaluating both teachers and students, with the central government co-financing up to 80 percent o f student learning assessments on a triennial basis. Although in theory these entities can remove teachers with cause, in practice teachers (as other c iv i l servants) are rarely dismissed f rom their jobs.
l5 Districts are basically cities that operate under a special regime. Districts and certified municipalities operate under a s i m i l a r framework in terms of their responsibilities in the education sector. Districts, however, have substantially more tax resources from municipalities. (World Bank 2007a)
70
Most teachers are confirmed after their trial period and the average job performance rating for teachers tends to be very high.
6. To address coverage problems, the Constitution of 1991 has also allowed sub-national governments to contract education services with private providers as long as the State maintains i t s regulation, control, and supervision. Several laws set the regulatory framework for private contracting by municipalities and departments: (i) Law 80 of 1993 (Government Contracting and Procurement Law) regulates public contracting and includes the rights, duties, and responsibilities o f both State entities and contractors; (ii) Law 60 o f 1993 consolidates the decentralization process and authorizes demand subsidies with targeting criteria; (iii) Law 1 15 of 1994 establishes contracting for education services with legally established churches and religious confessional groups; (iv) Law 715 of 2001 provides that territorial entities w i l l be able to hire with either State or non-State entities the provision of education services using funds from the General System of Participation; and (v) Decree 4313 o f 2004 regulates contracting for public education services by certified territorial entities (World Bank 2006).
7. As noted above, at the sub-national level, the system distinguishes between certified municipalities, which are able to administer their own education services, and uncertified municipalities, whose education services are administered by the departments in which they are located. B y Law 715, municipalities that had been previously certified (Pasto and Armenia) remained as such. During this same year, municipalities with a population of 100,000 inhabitants or more were automatically certified, given that they complied with some minimum requirements established by the MEN. Smaller municipalities that do not meet the population requirement may be certified as long as they meet certain technical, administrative and financial conditions demanded by the national government (www.dnp.gov.co). Certified and uncertified municipalities, as well as departments, differ in their capacity to use resources efficiently and effectively.
8. A World Bank (2007a) study finds that the capacity of sub-national governments to effectively execute the resources they have varies greatly. There are considerable differences among their efficiency scores in enrollment and quality. Bogota, Cali, and Barranquilla are the only municipalities on the quality frontier. Certified municipalities are more efficient on average than non-certified municipalities in providing education coverage and quality, given certain inputs such as the teacher-student ratio, the level of per capita investment in education, the number of teachers per grade in the salary scale, and the classroom space available. In turn, responsibilities for education in non-certified municipalities are disjointed: the departments are in charge of the payroll while the municipalities are in charge of school maintenance. In addition, school ownership i s not clearly defined. The study finds that certification of education services seems to reduce inefficiency in both education enrollment and education quality.
Responsibilities at the National Level
Assessment and Evaluation 9. Colombia’s ICFES, under the MEN, i s the country’s institution for the promotion o f higher education. I t s main objective i s to evaluate the country’s education system at every level in order to improve quality and develop programs that foster higher education attainment. ICFES
71
evaluates students, teachers, and school principals with the aim of informing the development o f education programs and policy decisions. As an important example, i t has carried out evaluations of the teacher and school director entrance examination process.
10. Currently, I C E S administers the following national evaluations: Pruebas SABER, to students in primary and lower secondary; Examen de Estado, to students in the last year o f secondary; and ECAES, to students that are about to complete a higher education degree. In addition, ICFES has also implemented several international evaluations, such as PISA (Programme for International Student Assessment), SERCE (Segundo Estudio Regional Comparativo y Explicativo), T I M S S (Trends in International Mathematics and Science Study), and ICCS (International Civic and Citizenship Education Study).
Financing 11. After the Constitution of 1991, and as a result of the decentralization process, public spending on education has significantly increased in the entire country. Public spending on education as a proportion of GDP rose from 3.3 percent in 1993 to 4.75 percent in 2007, the total spending on education as a proportion of GDP rose to 6.33 percent in 2007.
12. The education system remains primarily centrally financed. Most of the observed spending in the education sector i s explained by the flow o f resources from the national government to the sub-national levels. While national funds accounted for 85.6 percent o f education expenditure between 1988 and 2004, the participation of local funds barely reached 14.4 percent.
13. Law 60 o f 1993 initially defined the parameters for the distribution of national resources, by sector and sub-national level. This law was modified later in 2001 by the “Acto Legislativo 01” and Law 715 to consolidate many funding streams into the Sistema General de Participaciones (Iregui, Melo and Ramos 2006).
14. Currently, the Sistema General de Participaciones (SGP) constitutes most o f the financing for public education, The primary component o f the SGP transfer i s based on the average cost o f providing the service to each enrolled student in a public school in that entity. Based on the percentage of the population that lives in rural areas and secondary enrollment as a proportion of total enrollment, sub-national governments are grouped and their per-student allocations are adjusted to account for the higher cost of serving those populations. In 2007, the SGP transferred education funds to 32 departments, four special districts, and 42 certified municipalities. l6
Human resource policy 15. Currently, human resource policy pertaining to the hiring, evaluation, and compensation of school personnel i s set at the national level. Responsibilities for administration of these areas are shared between the Comisio’n Nacional de Servicio Civil and the MEN.
l6 www.mineducacion.gov.co
72
16. According to recent laws, teachers must be hired through a competitive process administered by the Cornisio'n Nucional de Sewicio Civil. The MEN no longer has a role in selection. It i s s t i l l to be determined if sub-national governments w i l l have a role in the process. In any case, new teachers can be hired only if there i s a clear need and the local government has sufficient resources.
17. The first attempt to regulate the teaching profession in Colombia took place in 1979 with the creation o f the Estututo Docente and the establishment o f the Esculufo'n Nucionul Docente, which rated teachers and assigned salaries according to three basic principles: academic background, professional experience, and acknowledged merits such as written work (technical, didactic, or scientific publications approved by the MEN).
18. Although this system continues to govern every teacher who joined the profession before June 2002, a new Estututo de Profecionulizucio'n Docente has begun to govern those entering the profession subsequent to that date. The innovative element o f this new system i s that i t takes into account teachers' responsibilities and performance. To this end, i t establishes an evaluation system with three basic examinations:
Evuluucio'n de Period0 de Prueba: After completing and being approved through a merit test, eligible candidates are appointed to a teaching position for a trial period o f at least four months. At the end o f the academic year, new teachers are evaluated and only those that receive a rating o f 60 percent or more are registered in the Esculufo'n. Teachers that do not have a bachelor's degree in education are required to complete a graduate degree in education or pedagogy.
Evaluacio'n de Competencius: Three years after their registration in the Escalafh, teachers may voluntarily undergo an evaluation to advance in the system. I f they obtain a rating o f 80 percent or more they can attain a higher level and increase their salary. Teachers need to undergo this sk i l ls evaluation and comply with some specific academic requirements in order to continue rising in the Esculufo'n.
Evaluacio'n Anuul de Desempefio: At the end o f each academic year, teachers' performance i s evaluated. A teacher that obtains a rating o f 60 percent or more i s considered to satisfactorily meet the requirements to continue in the profession. Those who do not reach the 60 percent score in two consecutive years are retired f rom Esculufo'n and have to leave the teaching career.
19. The introduction o f this evaluation system i s expected to have a positive impact on the quality o f the education provided by Colombian teachers. However, research on this issue i s s t i l l limited, as reforms are just being implemented (at the moment, 84 percent o f public teachers are s t i l l in the old system). In any case, the approval o f the new Estatuto Docente w i l l generate important and positive changes in Colombia's teacher policy, as under this structure the cost per teacher i s substantially less than in the old system, which provided teachers with a very generous retirement and higher salary levels and which made promotions easier to secure.
20. Salaries and promotions are determined by the national government. The MEN sets the salary level for al l public school teachers through the Esculufo'n. Sub-national governments
73
cannot establish special bonuses or incentives. In addition, past salary, pension, and bonus rights are protected. Although the salary and benefit system for teachers has been reformed, local governments have to continue paying bonuses that were legally established in the past.
74
Annex 2. Plun Nacwnal Decenal de Educacwn
1. The current Plan Decenal was developed through a four-phase participatory process that took place between November 2005 and September 2007. The highly structured process, guided by a steering committee, provided multiple opportunities through various channels for the public to shape and refine the contents of the Plan. In the f i rst phase, spanning November 2005 to October 2006, research organizations and the government laid the groundwork for the process by documenting reflections on the prior Plan Decenal and establishing a vision for the future, articulated in Visidn 2019. The steering committee developed an initial, ten-point agenda for the new Plan, and in the second phase, from October 2006 to January 2007, institutions involved in education were given the opportunity to respond to these points online. The steering committee then studied these responses and, in coordination with the Plan management team, revised the agenda. The third phase, from January to May 2007, comprised a public debate, in which stakeholders reacted to and expanded upon the agenda through 13,000 phone calls and 1,000 emails, online forums, and work groups formed across the country. All o f their contributions were systematically summarized and made publicly available. In the fourth phase, a National Assembly for Education, representatives from work groups, virtual forums, and citizen proposals gathered to review these data and deliberate on the Plan’s objectives, goals and actions.
2. These deliberations were consolidated in the preliminary document, “Plan Nacional Decenal de Educacidn,” which outlines the Plan’s priority areas, as well as the mechanisms for i t s implementation. The document elaborates objectives and goals for the following 10 themes:
1. 2. 3.
4. 5. 6. 7. 8.
9.
10.
Purpose and Quality o f Education in the 21 st Century Education in and for Peace, Living Together, and Civic Involvement Pedagogical Improvement and the Use of Information Technology in Education Integrating Science and Technology into Education More and Better Investment in Education Early Childhood Development and Education Educational Equity, Access, Persistence, and Quality Leadership, Management, Transparency, and Accountability in the Education System Professional Development, Professionalization, and Capacity-Building for Teachers and School Directors Other Actors in and beyond the Education System
3. A National Implementation Commission, whose process for formation the document describes and who are tasked with managing the implementation of the Plan, w i l l assume responsibility for developing a strategic plan and convening assemblies in which the MEN and Secretarias de Educacidn report on their progress in achieving the Plan. A National Implementation Network and the Plan’s web portal wi l l continue to inform the public and enable i t s participation in the implementation of the Plan, which w i l l be monitored by an Obsewatorio.
4. The World Bank i s supporting the monitoring and dissemination o f the Plan in a number of ways. I t i s collaborating with the MEN in the design o f the Obsewatorio and the definition o f the indicators that could be used to monitor the Plan’s achievements. The Bank i s also helping
75
the MEN to enter into various partnerships to guarantee the participation of private organizations in managing the Obsewatorio. In terms of dissemination the Bank has promoted the inclusion of the 10 special themes in the agenda o f the new administration, using mainly the Rural Education Program, the Antioquia Upper Secondary project, and the Education for Peace partnership. The Bank has participated in the work of the two study groups set up by the MEN in preparation for the National Forum for the Education Management and Student Learning Assessment themes (as part o f the 10 priorities in the Plan Decenal). In the next few months, the Bank w i l l produce a paper drawing the lessons about this participatory process and the results of the Plan Decenal, to be shared with other interested countries in the region.
76
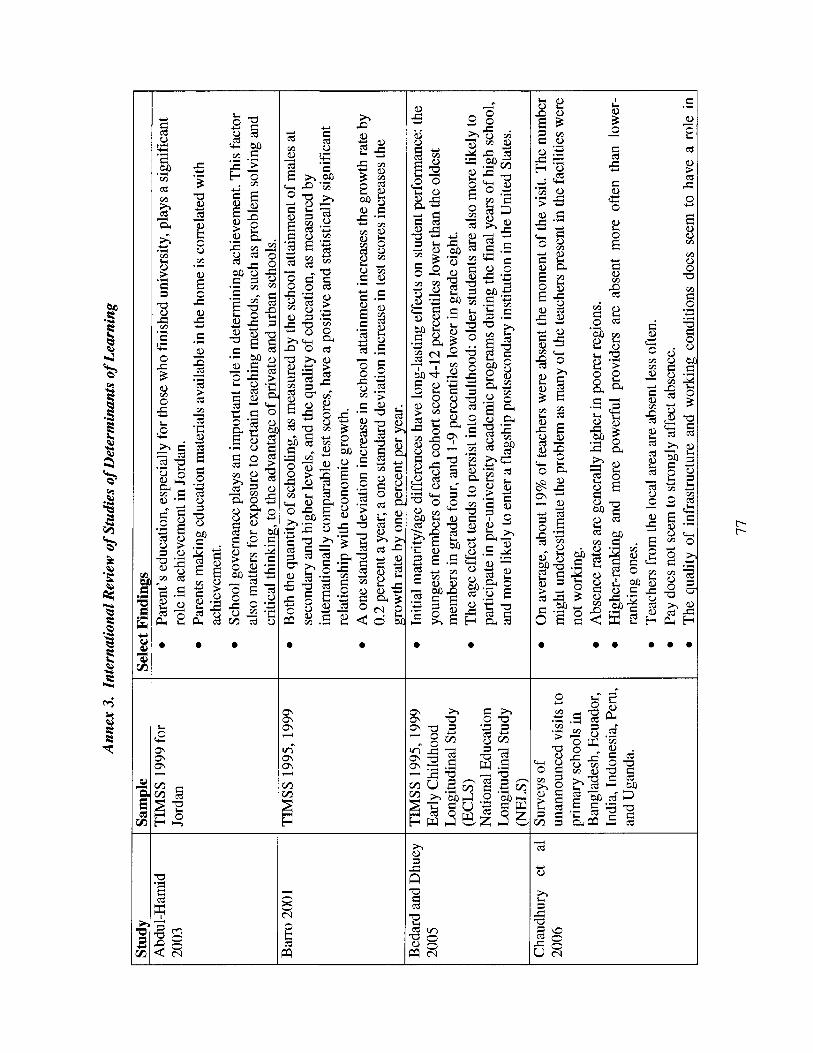
5 3 .3
z Y
cd - 3 rn
.C
8 0 c Q
e Q
5 .3
3 3
' F a > cd
e e e e e e a
d
6)
.3
3
cd 0 > cd c 0 U
E 2 Q
a
i (d
Q Y
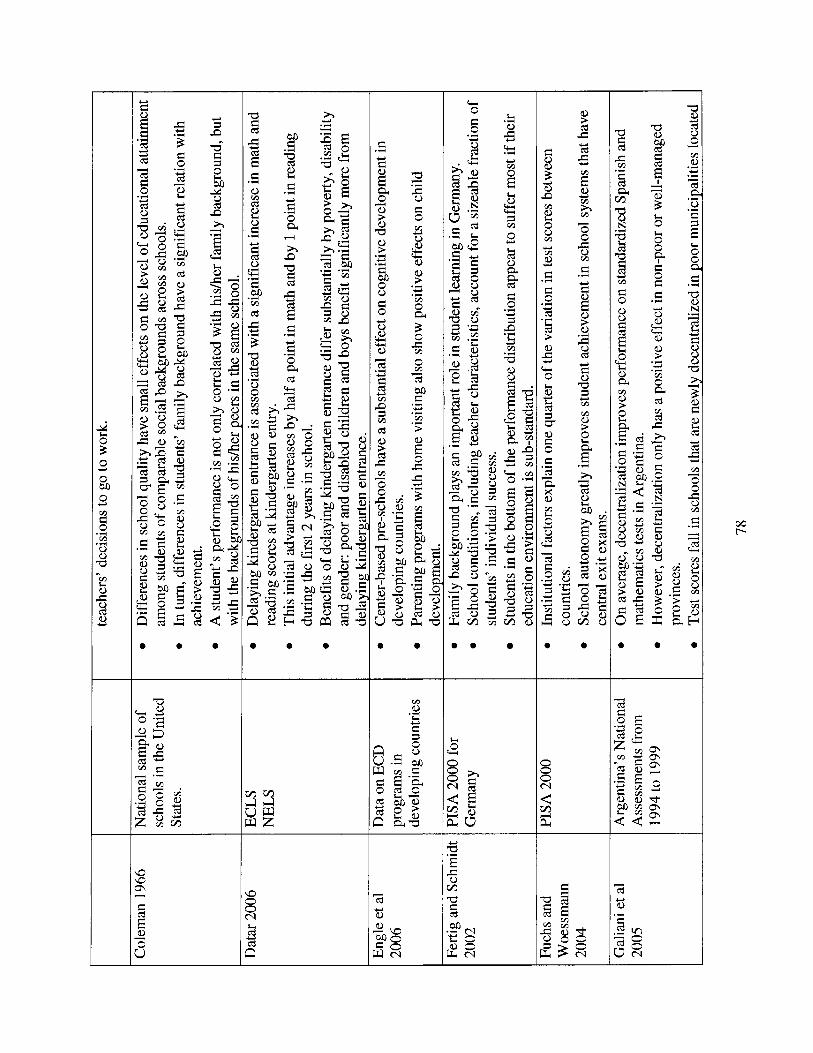
e e e e e e
9 3 8 2 ?" Y
c .3 Y
i i 8
*% 3
G
Q) >
Q) > $J .3 Y
c 0 0
Q)
cd
Y
3
.3
3 Y
G Lo
cd Q > cd c Lo i
0
s CO 3 .3
*
* Q Q >
0 a
.3 Y
.3 m
3 s: 3 cd ba c .3 Y .3 * .3
> 8 0 c
e e
Q
e cd
$
r4 U
s Q
h
0 0 c
e
Y * 0 i
X .3 Y
i 0 > Q) e .3
8 8
M
E
Y
3 Y
i%
* >
.3
x
e l e m e e e e
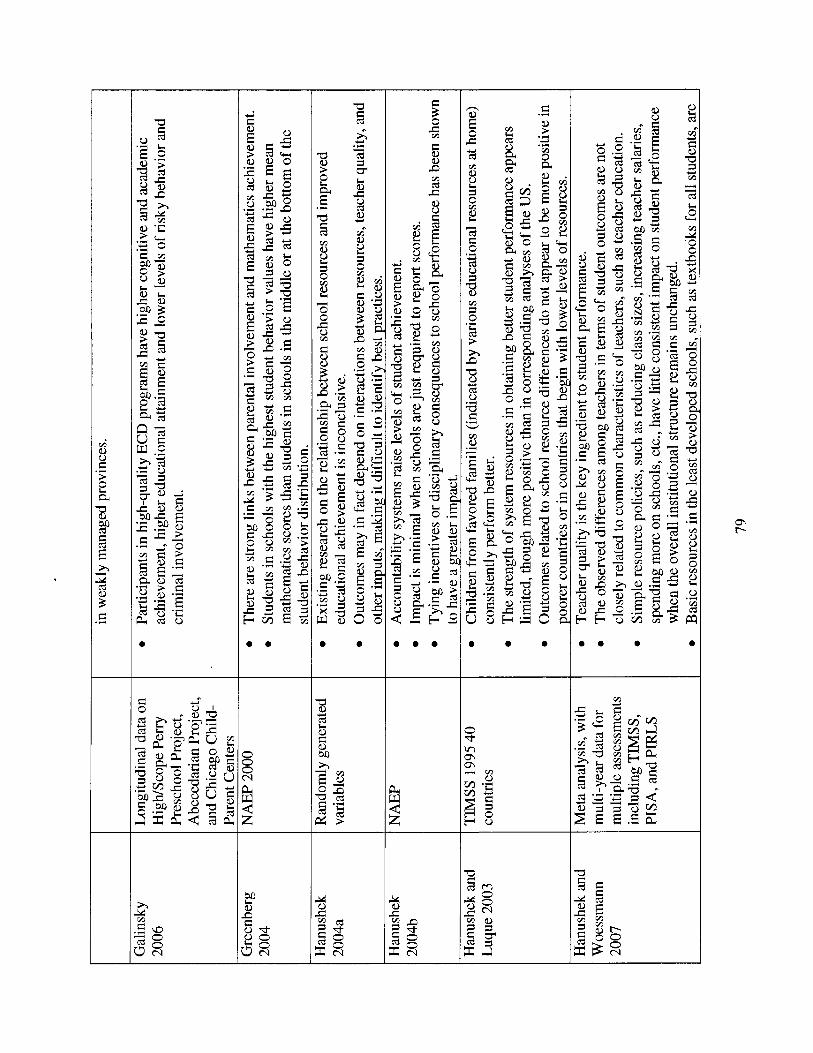
e
s
e e 0 . 0
G .3
0 e e
3 d-
0 . e 0
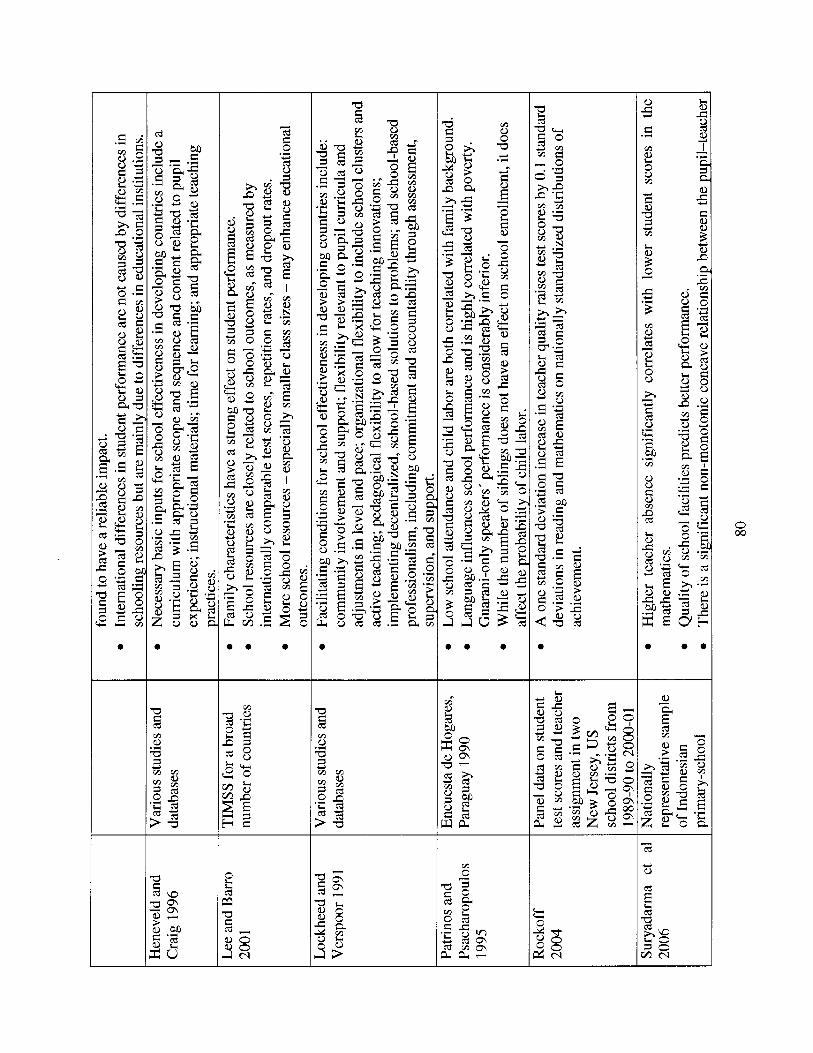
a a
4
8
a . a
a
a a . a
(/I 0 3
a
0
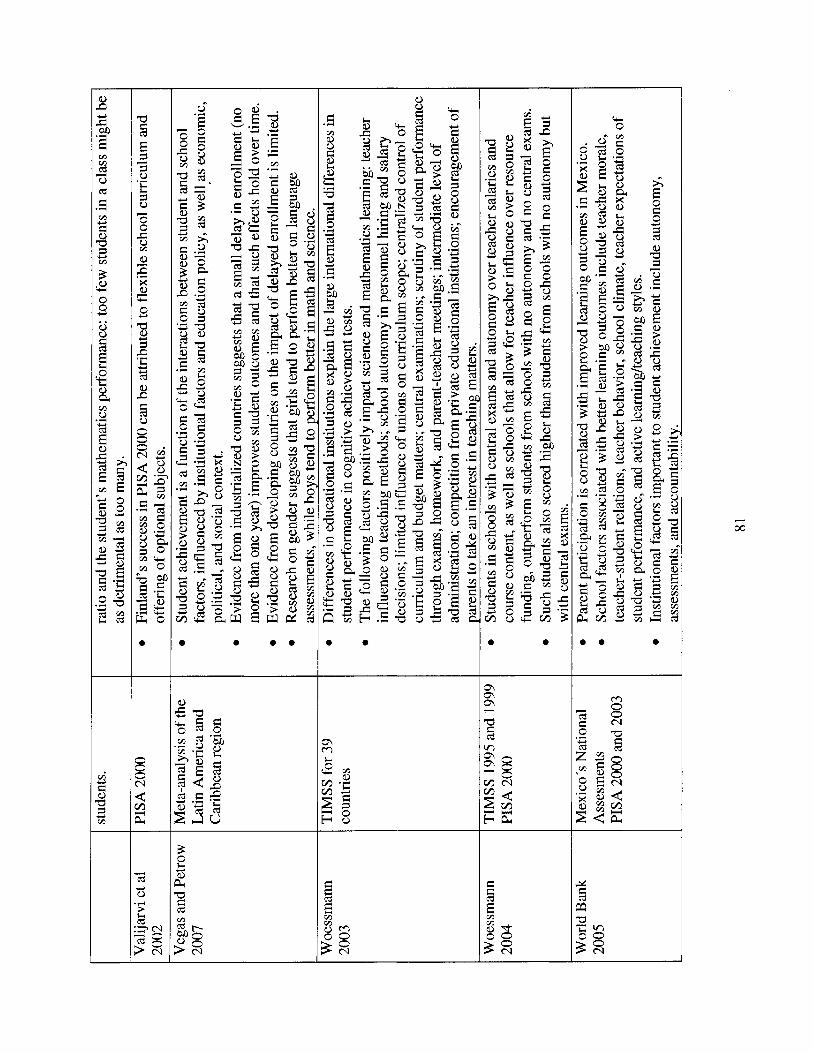
0 0 0 0 0 0
I - 0
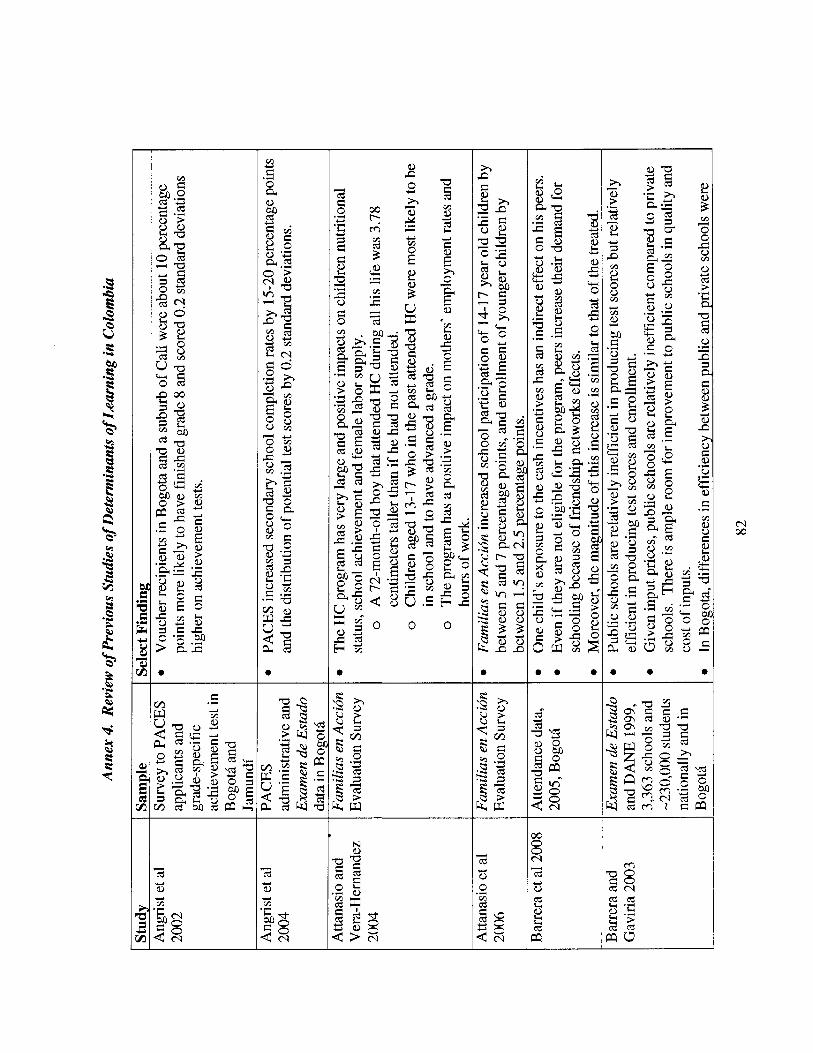
h e
. 0 . .
8
z 3 m 3
0 0
a, cd Y
'CI
0
e 1
s .3 3
!3 3 Y 6) e h 0 5 E ." 0
a, d .3
. .
FJ 00
. .
Y
8 a & 0 B .I
. . . . . .
& !ii cd
> 0
0 . . .
M 00
rc 0
e e e e e e e e
n n ? -.I
Y cd
6, an z
e e e
cd N .3
4 s $ 3 z a
-5
0 6, 3
e e
m 0 0 P4
0 c 3
. e . . . 0 .
n (A
*2 cd - a . . . e
U 0
IC 1 M Z
0 .
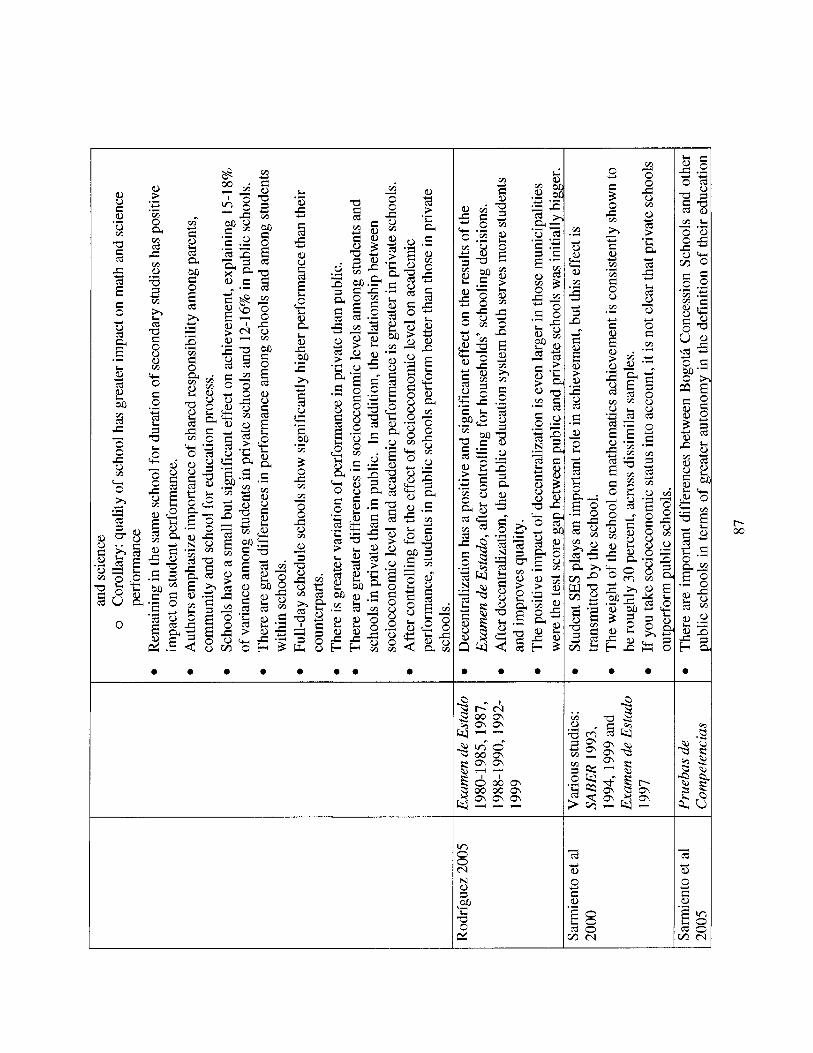
Q > .3 Y .3
3 % E
a
c .- 2 Y
m x a C 8
8 2
8 e
cu 0
.3 U
3 zt
v, 0 0 c\1 N e, \% a 2
r. 00
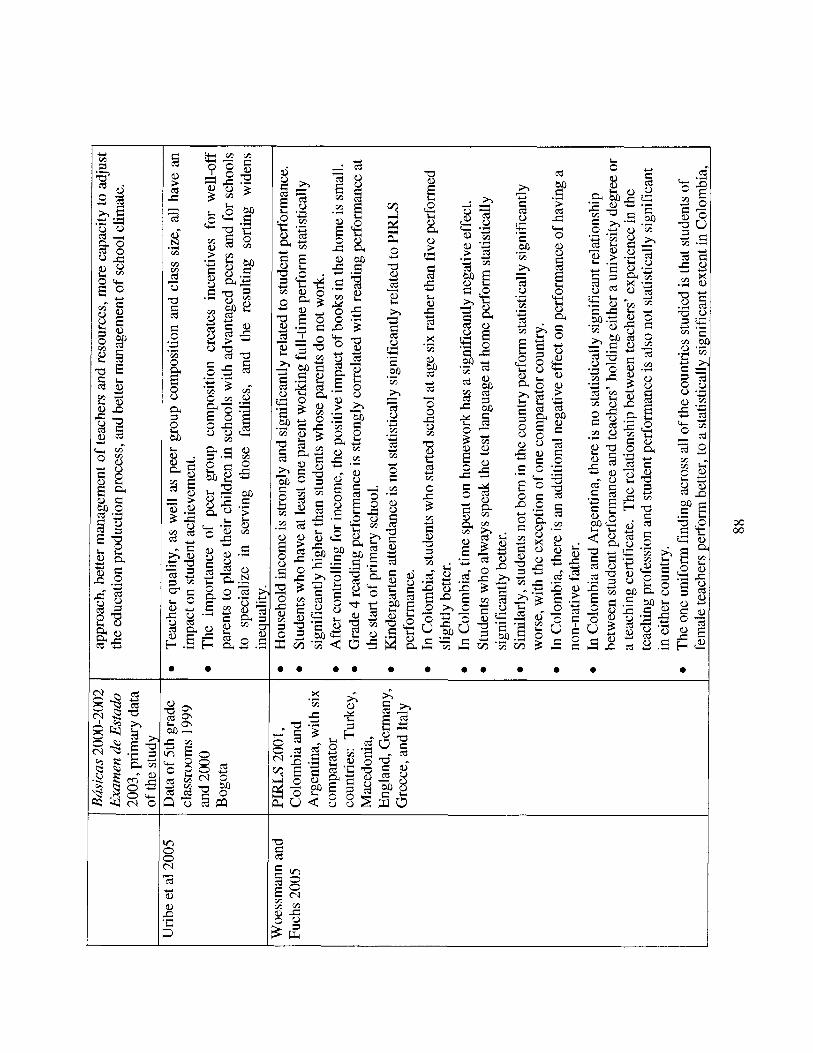
e e
v3 4
E 0
-5
cd
h
Y
B 2
3 9
3
3 Y
0
E .3 v)
h cd 0
3 i
.3 Y
(/3 .3 Y
Y v)
U
cd
0 E
cd
e . e . . . e . e . . e
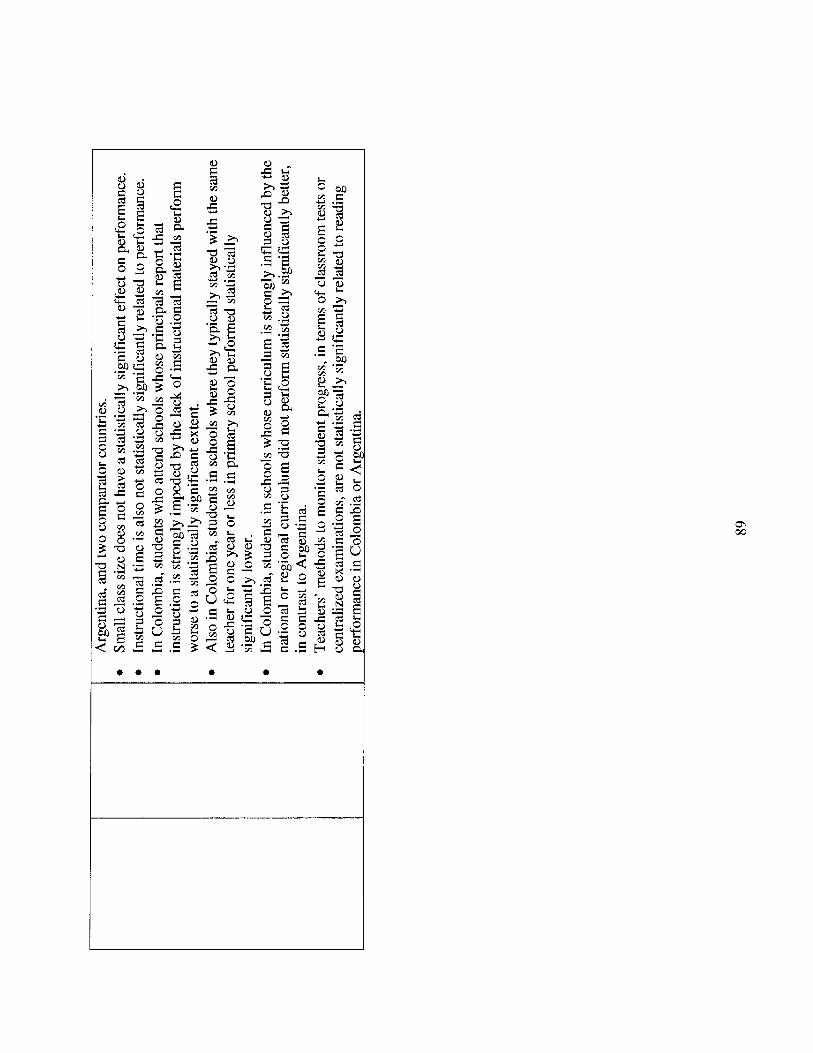
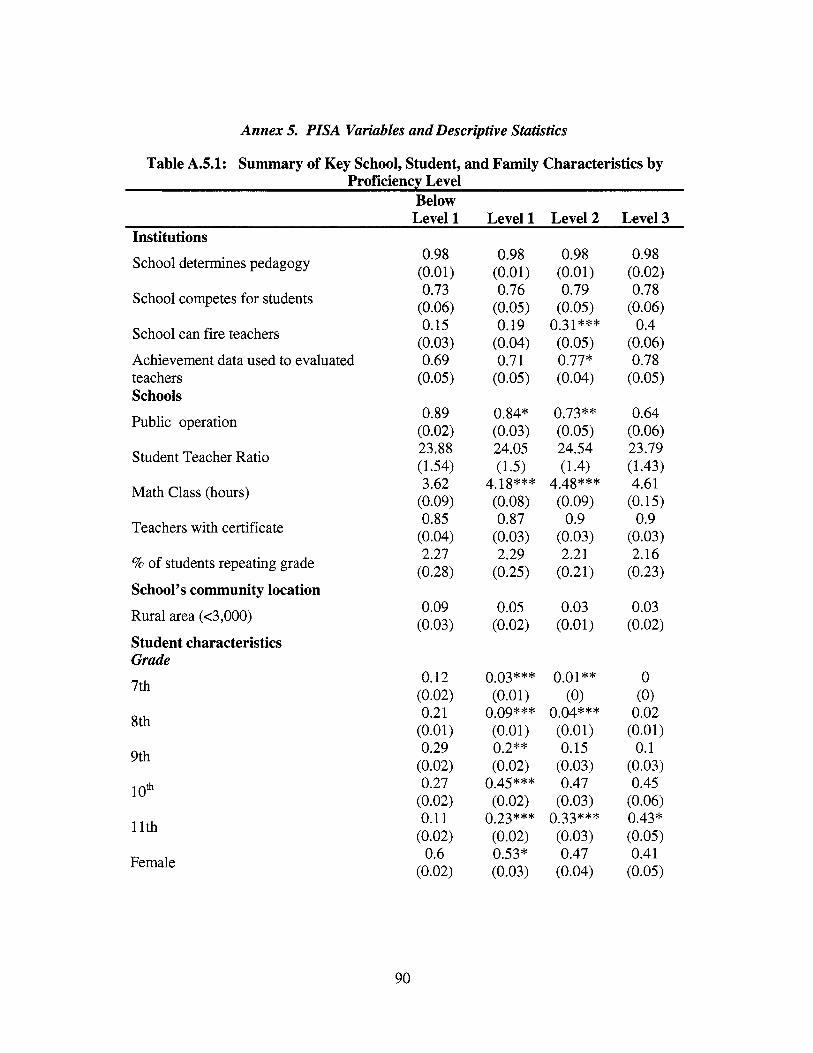
Annex 5. PISA Variables and Descriptive Statistics
Table A.5.1: Summary of Key School, Student, and Family Characteristics by Proficiency Level
Below Level 1 Level 1 Level 2 Level 3
Institutions
School determines pedagogy
School competes for students
School can fire teachers
Achievement data used to evaluated teachers Schools
Public operation
Student Teacher Ratio
Math Class (hours)
Teachers with certificate
% of students repeating grade
School's community location
Rural area (<3,000)
Student characteristics Grade 7 th
8 th
9th
1 oth
11th
Female
0.98 (0.01) 0.73
(0.06) 0.15
(0.03) 0.69
(0.05)
0.89 (0.02) 23.88 (1.54) 3.62
(0.09) 0.85
(0.04) 2.27
(0.28)
0.09 (0.03)
0.12 (0.02) 0.21
(0.01) 0.29
(0.02) 0.27
(0.02) 0.11
(0.02) 0.6
(0.02)
0.98
0.76 (0.05) 0.19
(0.04) 0.7 1
(0.05)
(0.01)
0.84" (0.03) 24.05 (1.5)
4.18*** (0.08) 0.87
(0.03) 2.29
(0.25)
0.98 (0.01) 0.79
(0.05) 0.3 1 *** (0.05) 0.77" (0.04)
0.73"" (0.05) 24.54 (1.4)
4.48""" (0.09)
0.9 (0.03) 2.21
(0.21)
0.05 0.03 (0.02) (0.01)
0.03 * * * (0.01)
0.09""" (0.01) 0.2"" (0.02)
0.45 * ** (0.02)
0.23""" (0.02) 0.53" (0.03)
0.01"" (0)
0.04""" (0.01) 0.15
(0.03) 0.47
(0.03) 0.33""" (0.03) 0.47
(0.04)
0.98 (0.02) 0.78
(0.06) 0.4
(0.06) 0.78
(0.05)
0.64 (0.06) 23.79 (1.43) 4.6 1
(0.15) 0.9
(0.03) 2.16
(0.23)
0.03 (0.02)
0 (0)
0.02 (0.01) 0.1
(0.03) 0.45
(0.06) 0.43" (0.05) 0.4 1
(0.05)
90
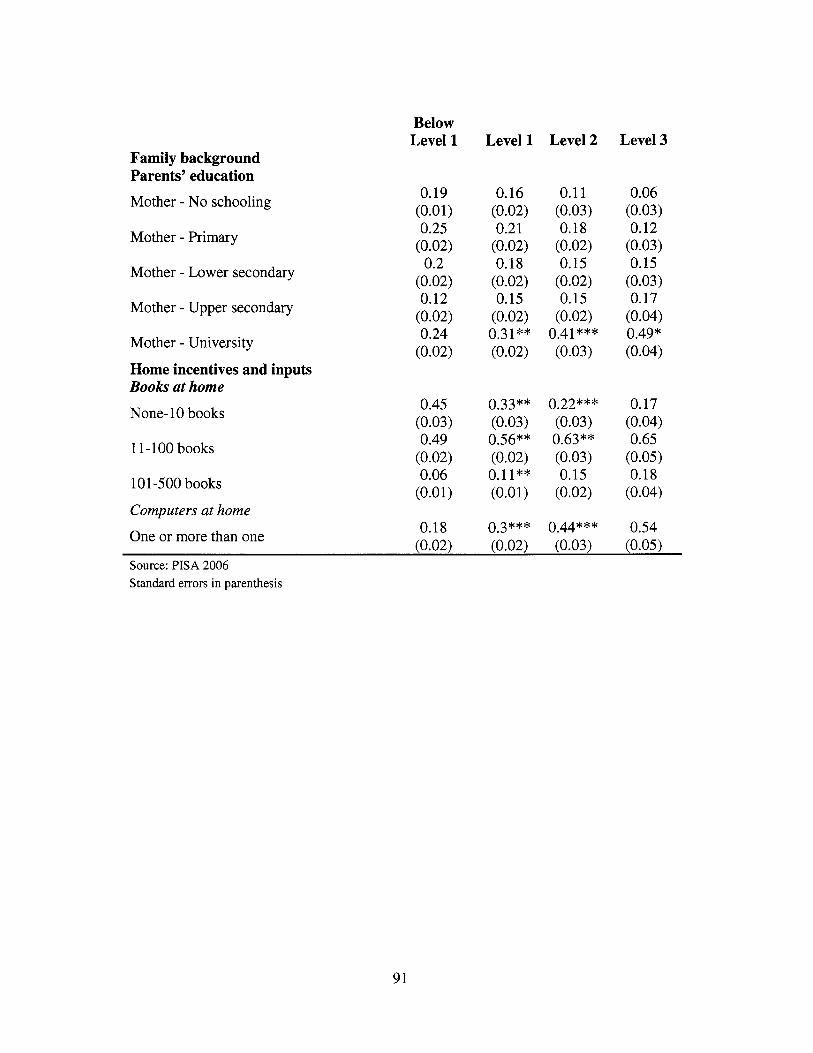
Family background Parents' education
Mother - No schooling
Mother - Primary
Mother - Lower secondary
Mother - Upper secondary
Mother - University
Home incentives and inputs Books at home None-10 books
11-100 books
101-500 books
Computers at home
Below Level 1
0.19 (0.01) 0.25
(0.02) 0.2
(0.02) 0.12
(0.02) 0.24 (0.02)
0.45 (0.03) 0.49
(0.02) 0.06
(0.01)
Level 1 Level 2
0.16 0.1 1 (0.02) (0.03) 0.21 0.18
(0.02) (0.02) 0.18 0.15
(0.02) (0.02) 0.15 0.15
(0.02) (0.02) 0.3 1 ** 0.41 *** (0.02) (0.03)
0.33"" 0.22*** (0.03) (0.03) 0.56"" 0.63"" (0.02) (0.03) 0.11** 0.15 (0.01) (0.02)
0.3*** 0.44""" 0.18 (0.02) (0.02) (0.03) (0.05) One or more than one
Level 3
0.06 (0.03) 0.12
(0.03) 0.15
(0.03) 0.17
(0.04) 0.49* (0.04)
0.17 (0.04) 0.65
(0.05) 0.18
(0.04)
0.54
Source: PISA 2006 Standard errors in parenthesis
91
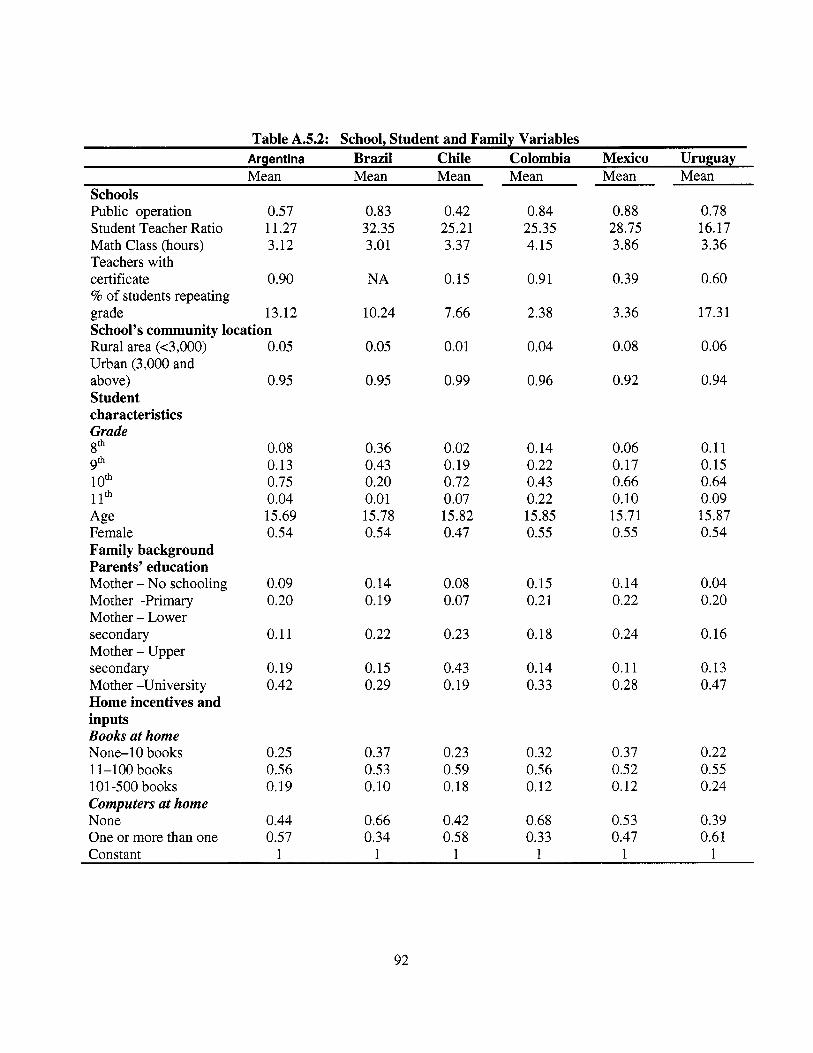
Table A.5.2: School, Student and Family Variables Argentina Brazil Chile Colombia Mexico Uruguay Mean Mean Mean Mean
Schools Public operation 0.57 Student Teacher Ratio 1 1.27 Math Class (hours) 3.12 Teachers with certificate 0.90 % of students repeating grade 13.12 School's community location Rural area (~3,000) Urban (3,000 and above) Student characteristics Grade 8" 9" 10" 1 1" Age Female Family background Parents' education Mother - N o schooling Mother -Primary Mother - Lower secondary Mother - Upper secondary Mother -University Home incentives and inputs Books at home None-10 books 11-100 books 101-500 books Computers at home None One or more than one
0.05
0.95
0.08 0.13 0.75 0.04 15.69 0.54
0.09 0.20
0.11
0.19 0.42
0.25 0.56 0.19
0.44 0.57
0.83 32.35 3.01
NA
10.24
0.05
0.95
0.36 0.43 0.20 0.01 15.78 0.54
0.14 0.19
0.22
0.15 0.29
0.37 0.53 0.10
0.66 0.34
Cnnstant 1 1
0.42 25.21 3.37
0.15
7.66
0.01
0.99
0.02 0.19 0.72 0.07 15.82 0.47
0.08 0.07
0.23
0.43 0.19
0.23 0.59 0.18
0.42 0.58
1
0.84 25.35 4.15
0.91
2.38
0.04
0.96
0.14 0.22 0.43 0.22 15.85 0.55
0.15 0.21
0.18
0.14 0.33
0.32 0.56 0.12
0.68 0.33
1
Mean
0.88 28.75 3.86
0.39
3.36
0.08
0.92
0.06 0.17 0.66 0.10 15.71 0.55
0.14 0.22
0.24
0.1 1 0.28
0.37 0.52 0.12
0.53 0.47
1
Mean
0.78 16.17 3.36
0.60
17.31
0.06
0.94
0.11 0.15 0.64 0.09 15.87 0.54
0.04 0.20
0.16
0.13 0.47
0.22 0.55 0.24
0.39 0.61
1
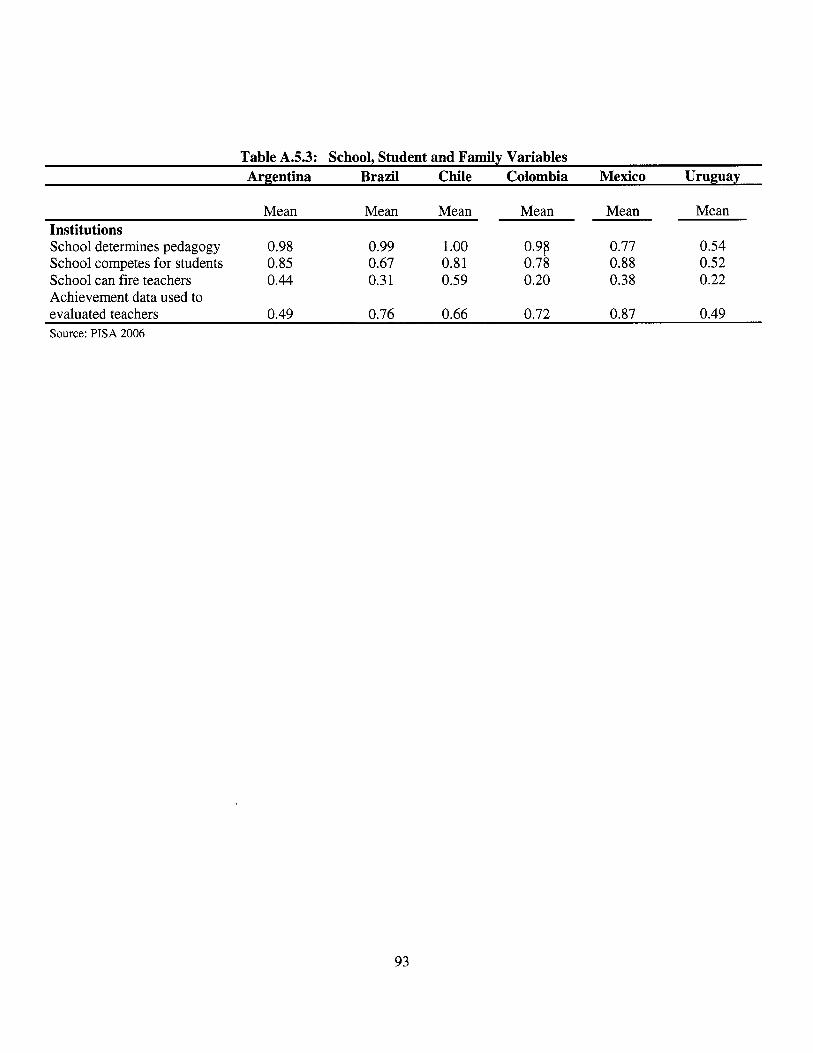
Table A.5.3: School, Student and Family Variables Argentina Brazil Chile Colombia Mexico Uruguay
Mean Mean Mean Mean Mean Mean Institutions School determines pedagogy 0.98 0.99 1 .oo 0.9s 0.77 0.54 School competes for students 0.85 0.67 0.81 0.78 0.88 0.52 School can fire teachers 0.44 0.3 1 0.59 0.20 0.38 0.22 Achievement data used to evaluated teachers 0.49 0.76 0.66 0.72 0.87 0.49 Source: PISA 2006
93