Embed Size (px)
Citation preview
REPORT on
Gas absorption and VCSEL emission spectra study
Andrei DOROGAN, PhD Student,
Technical University of Moldova
Prague,
September 15-25, 2011

2
SUMMARY
1 High resolution measurements of gas absorption spectra (H2O, CH4, CO2, HF and NH3)
3
2 High resolution measurements of VCSEL emission spectra (no temperature stabilization)
10
3 Time-resolved high resolution measurements of VCSEL emission 12 Conclusions Acknowledgement
3
Gas absorption and VCSEL emission spectra study
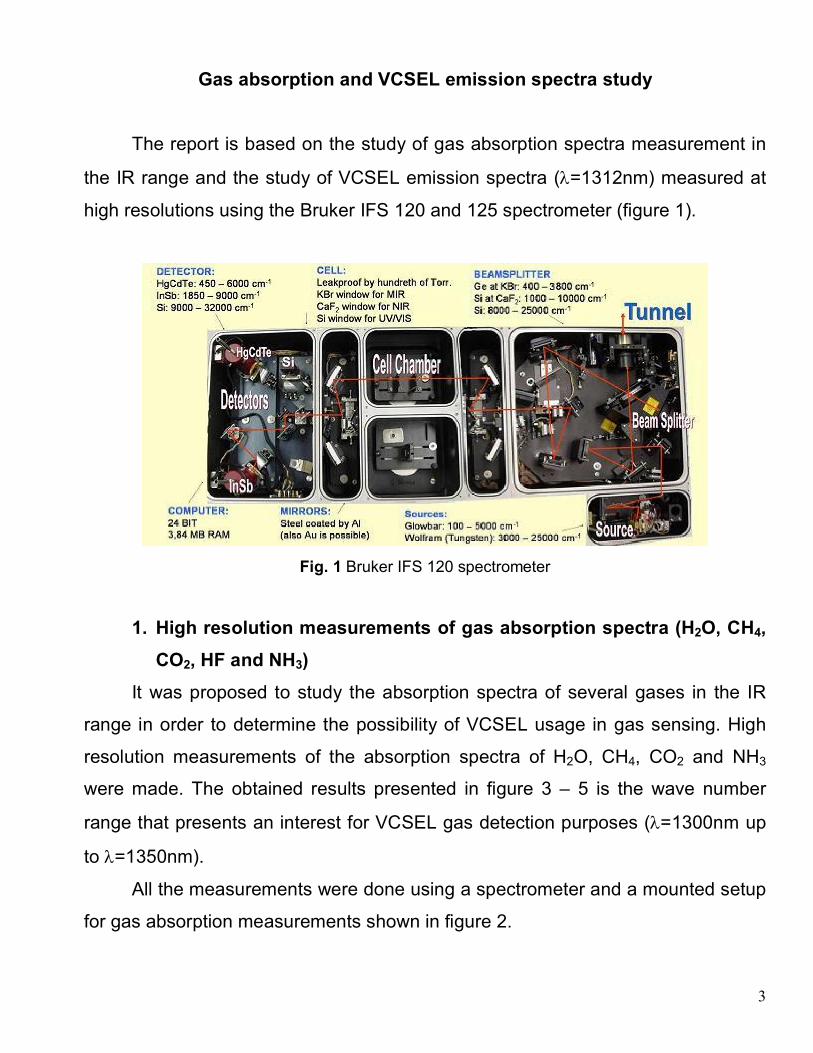
The report is based on the study of gas absorption spectra measurement in
the IR range and the study of VCSEL emission spectra (=1312nm) measured at
high resolutions using the Bruker IFS 120 and 125 spectrometer (figure 1).
Fig. 1 Bruker IFS 120 spectrometer
1. High resolution measurements of gas absorption spectra (H2O, CH4,
CO2, HF and NH3)
It was proposed to study the absorption spectra of several gases in the IR
range in order to determine the possibility of VCSEL usage in gas sensing. High
resolution measurements of the absorption spectra of H2O, CH4, CO2 and NH3
were made. The obtained results presented in figure 3 – 5 is the wave number
range that presents an interest for VCSEL gas detection purposes (=1300nm up
to =1350nm).
All the measurements were done using a spectrometer and a mounted setup
for gas absorption measurements shown in figure 2.
4
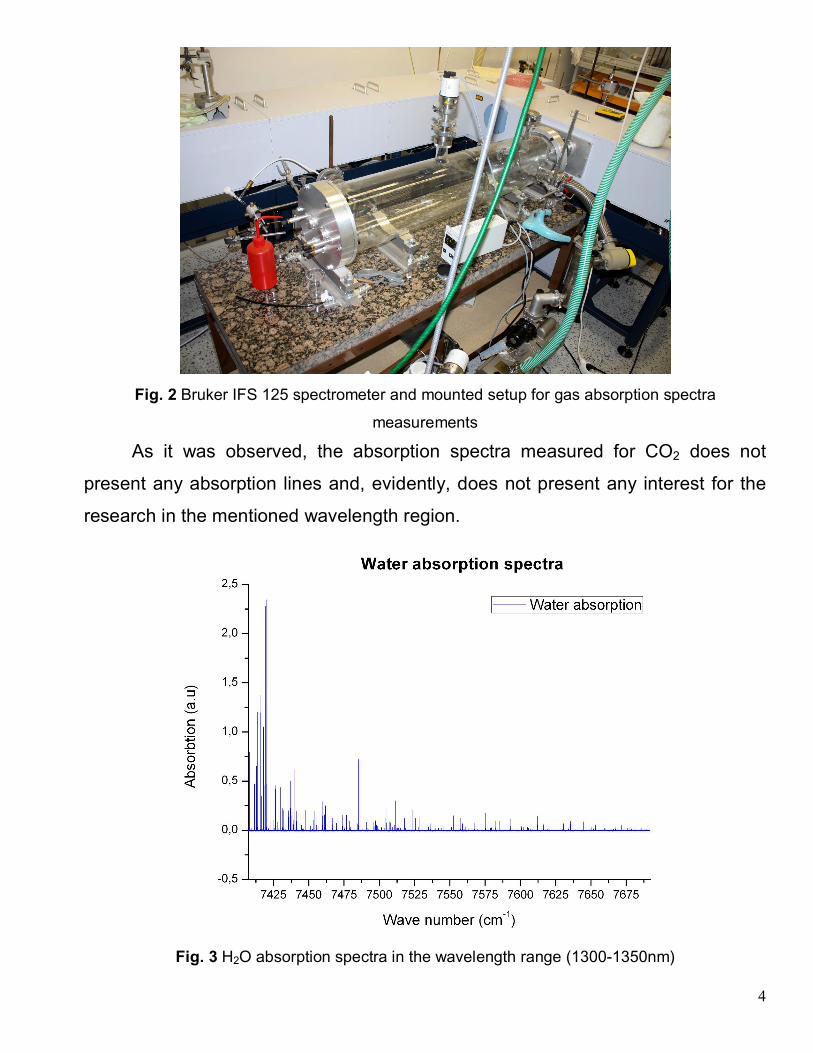
Fig. 2 Bruker IFS 125 spectrometer and mounted setup for gas absorption spectra
measurements
As it was observed, the absorption spectra measured for CO2 does not
present any absorption lines and, evidently, does not present any interest for the
research in the mentioned wavelength region.
Fig. 3 H2O absorption spectra in the wavelength range (1300-1350nm)
5
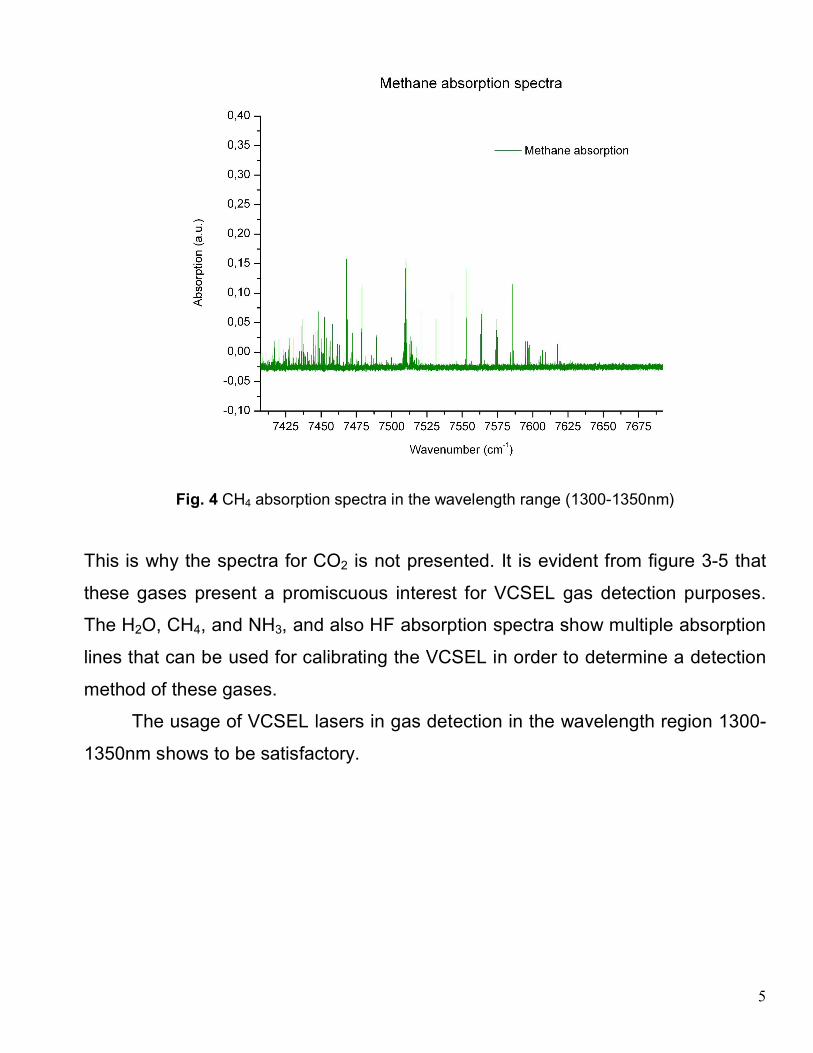
Fig. 4 CH4 absorption spectra in the wavelength range (1300-1350nm)
This is why the spectra for CO2 is not presented. It is evident from figure 3-5 that
these gases present a promiscuous interest for VCSEL gas detection purposes.
The H2O, CH4, and NH3, and also HF absorption spectra show multiple absorption
lines that can be used for calibrating the VCSEL in order to determine a detection
method of these gases.
The usage of VCSEL lasers in gas detection in the wavelength region 1300-
1350nm shows to be satisfactory.
6
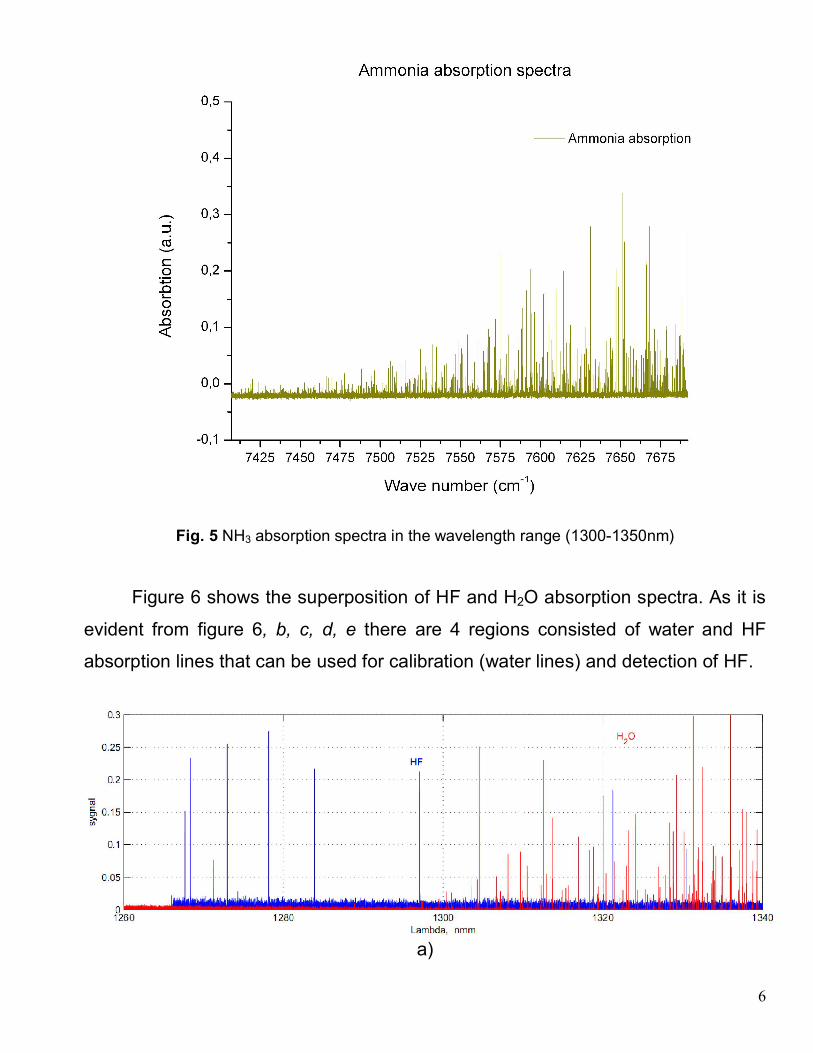
Fig. 5 NH3 absorption spectra in the wavelength range (1300-1350nm)
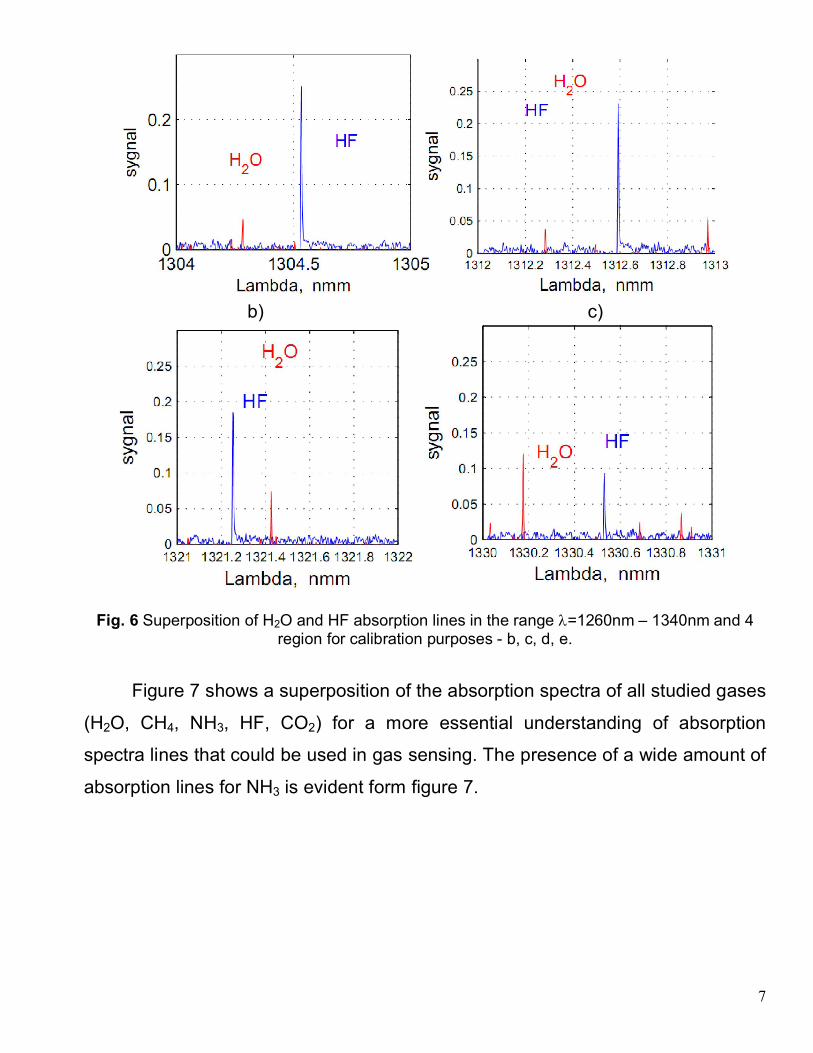
Figure 6 shows the superposition of HF and H2O absorption spectra. As it is
evident from figure 6, b, c, d, e there are 4 regions consisted of water and HF
absorption lines that can be used for calibration (water lines) and detection of HF.
a)
7
b) c)
Fig. 6 Superposition of H2O and HF absorption lines in the range =1260nm – 1340nm and 4 region for calibration purposes - b, c, d, e.
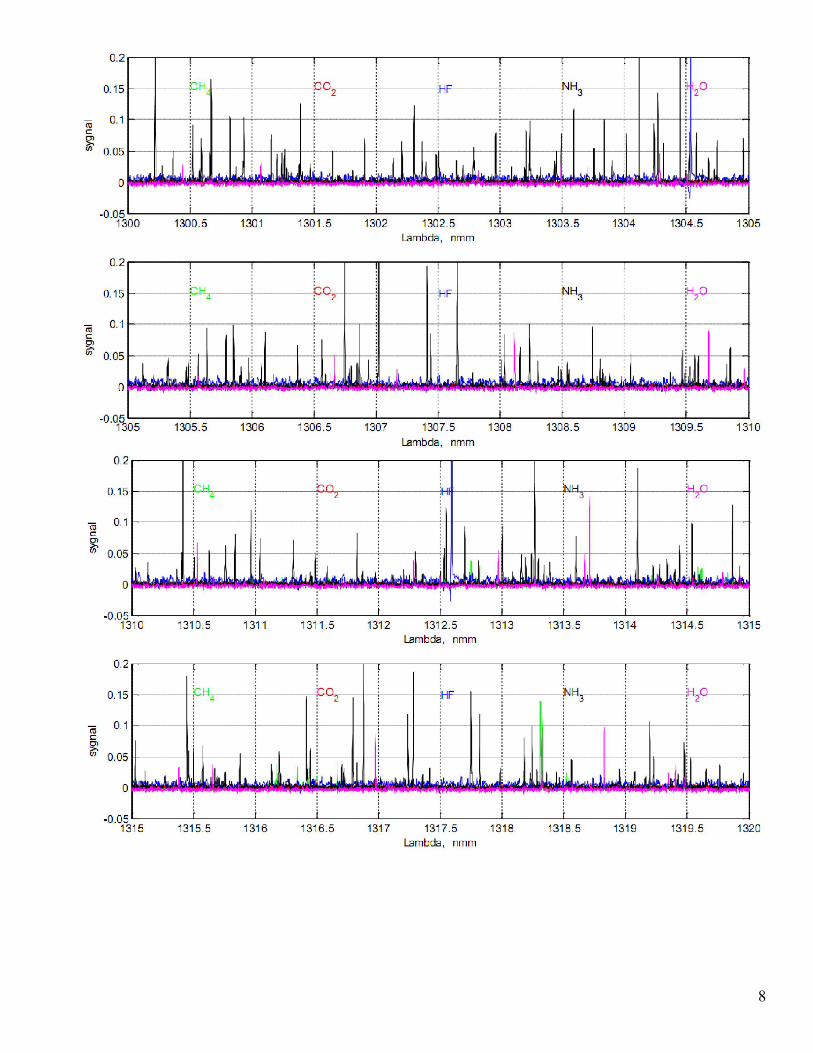
Figure 7 shows a superposition of the absorption spectra of all studied gases
(H2O, CH4, NH3, HF, CO2) for a more essential understanding of absorption
spectra lines that could be used in gas sensing. The presence of a wide amount of
absorption lines for NH3 is evident form figure 7.
8
9
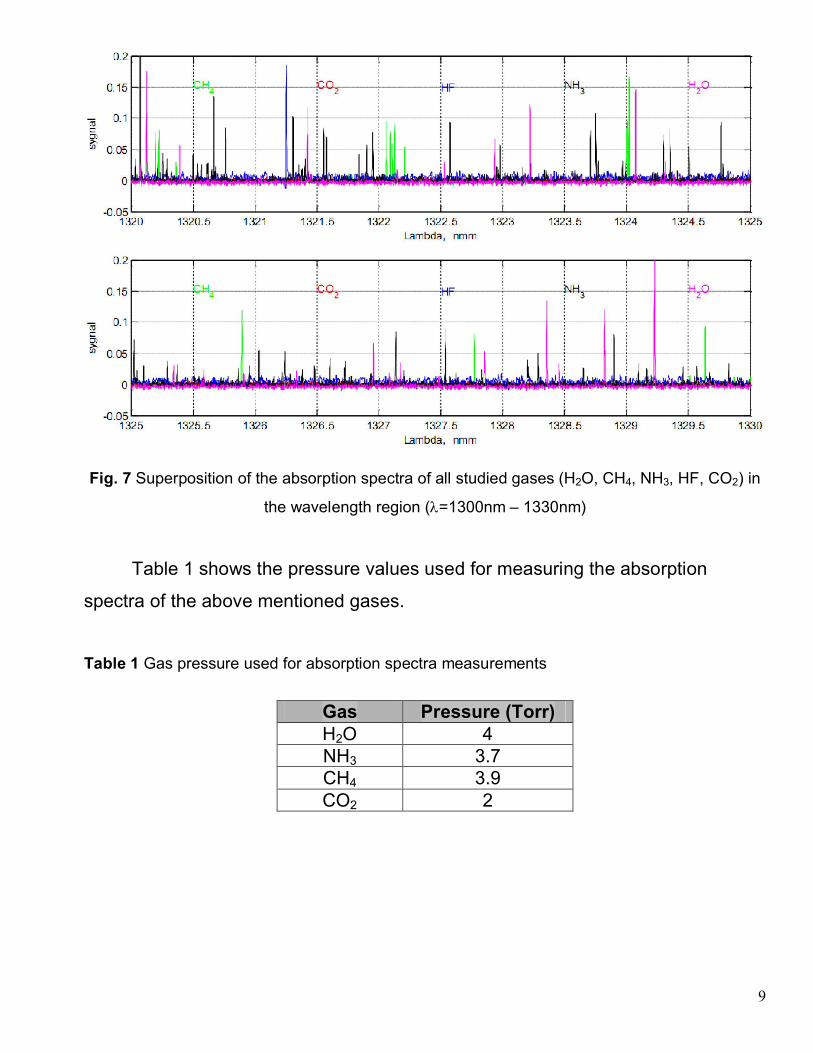
Fig. 7 Superposition of the absorption spectra of all studied gases (H2O, CH4, NH3, HF, CO2) in
the wavelength region (=1300nm – 1330nm)
Table 1 shows the pressure values used for measuring the absorption
spectra of the above mentioned gases.
Table 1 Gas pressure used for absorption spectra measurements
Gas Pressure (Torr) H2O 4 NH3 3.7 CH4 3.9 CO2 2
10
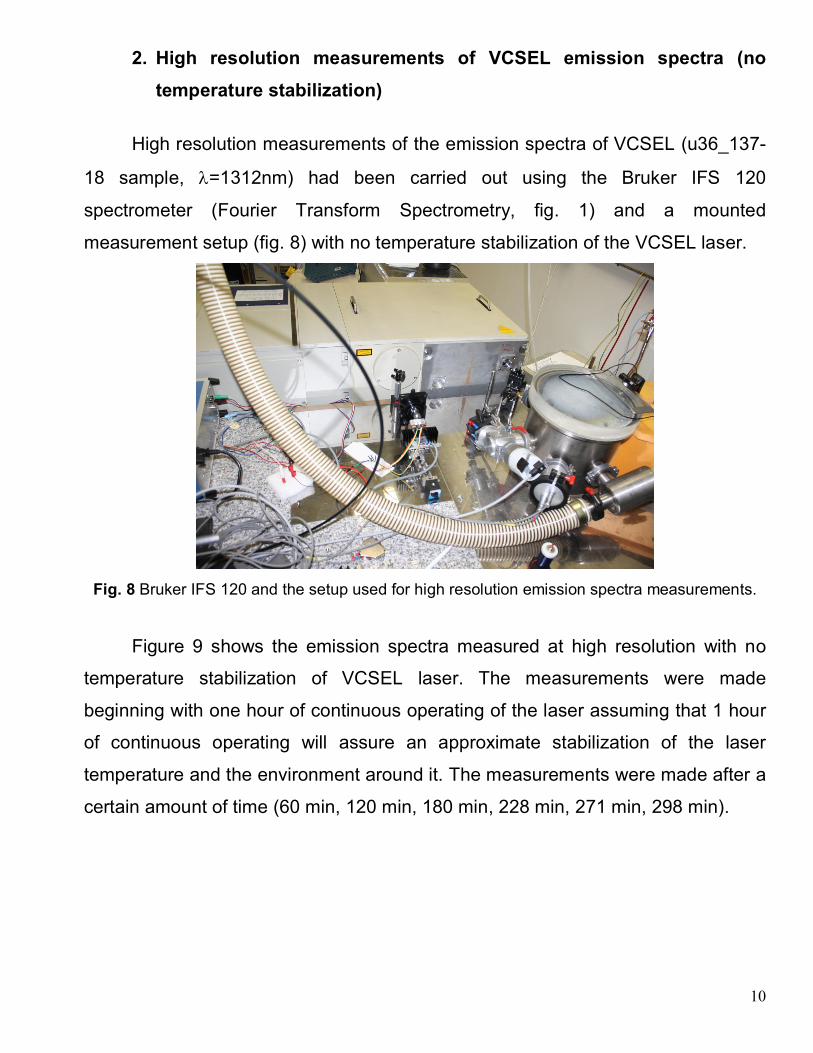
2. High resolution measurements of VCSEL emission spectra (no
temperature stabilization)
High resolution measurements of the emission spectra of VCSEL (u36_137-
18 sample, =1312nm) had been carried out using the Bruker IFS 120
spectrometer (Fourier Transform Spectrometry, fig. 1) and a mounted
measurement setup (fig. 8) with no temperature stabilization of the VCSEL laser.
Fig. 8 Bruker IFS 120 and the setup used for high resolution emission spectra measurements.
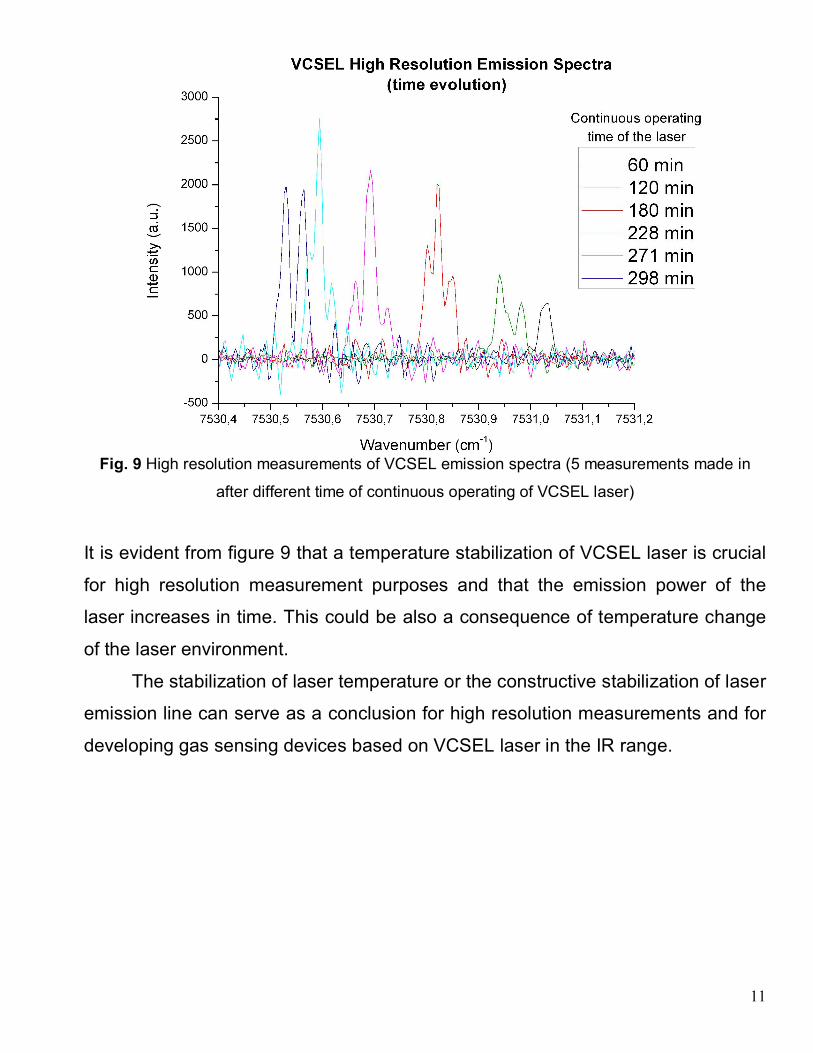
Figure 9 shows the emission spectra measured at high resolution with no
temperature stabilization of VCSEL laser. The measurements were made
beginning with one hour of continuous operating of the laser assuming that 1 hour
of continuous operating will assure an approximate stabilization of the laser
temperature and the environment around it. The measurements were made after a
certain amount of time (60 min, 120 min, 180 min, 228 min, 271 min, 298 min).
11
Fig. 9 High resolution measurements of VCSEL emission spectra (5 measurements made in
after different time of continuous operating of VCSEL laser)
It is evident from figure 9 that a temperature stabilization of VCSEL laser is crucial
for high resolution measurement purposes and that the emission power of the
laser increases in time. This could be also a consequence of temperature change
of the laser environment.
The stabilization of laser temperature or the constructive stabilization of laser
emission line can serve as a conclusion for high resolution measurements and for
developing gas sensing devices based on VCSEL laser in the IR range.
12
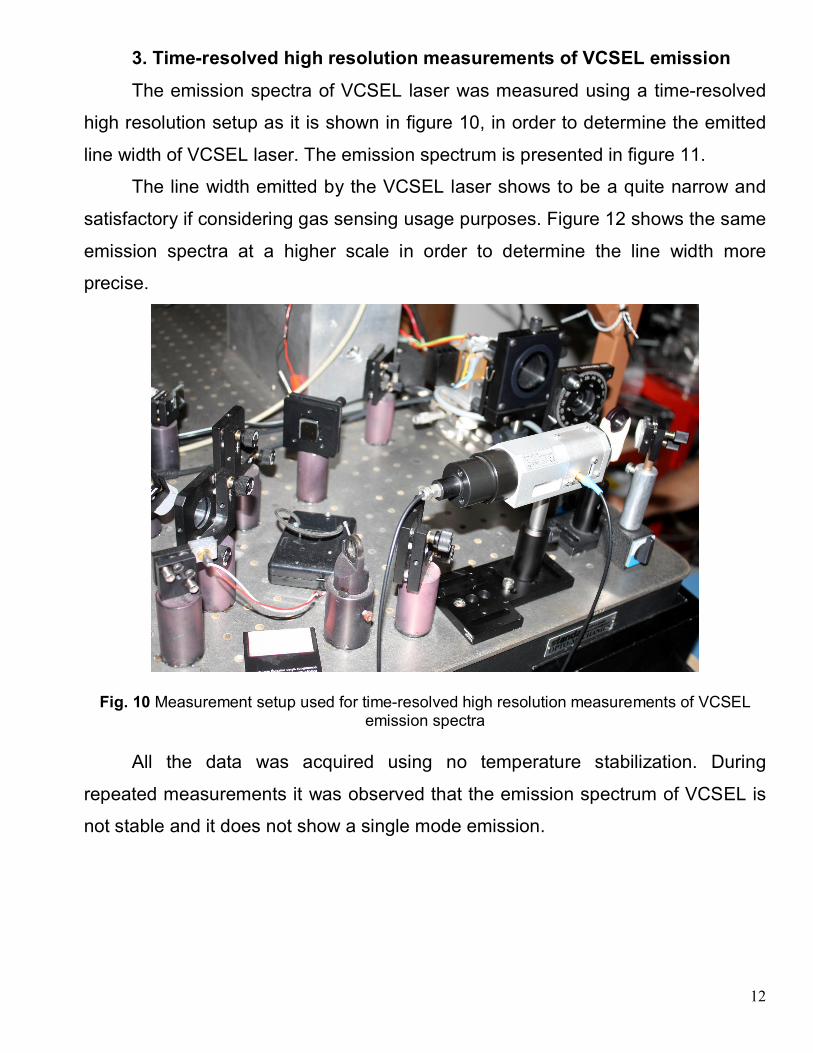
3. Time-resolved high resolution measurements of VCSEL emission
The emission spectra of VCSEL laser was measured using a time-resolved
high resolution setup as it is shown in figure 10, in order to determine the emitted
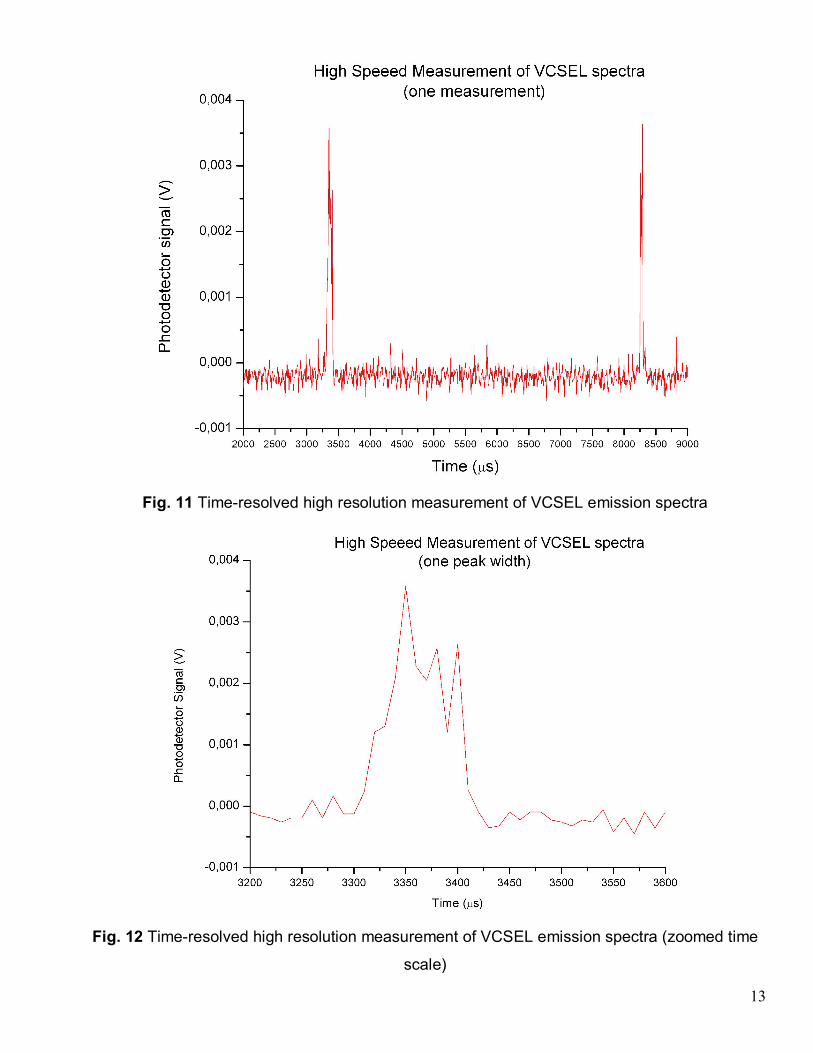
line width of VCSEL laser. The emission spectrum is presented in figure 11.
The line width emitted by the VCSEL laser shows to be a quite narrow and
satisfactory if considering gas sensing usage purposes. Figure 12 shows the same
emission spectra at a higher scale in order to determine the line width more
precise.
Fig. 10 Measurement setup used for time-resolved high resolution measurements of VCSEL emission spectra
All the data was acquired using no temperature stabilization. During
repeated measurements it was observed that the emission spectrum of VCSEL is
not stable and it does not show a single mode emission.
13
Fig. 11 Time-resolved high resolution measurement of VCSEL emission spectra
Fig. 12 Time-resolved high resolution measurement of VCSEL emission spectra (zoomed time
scale)
14
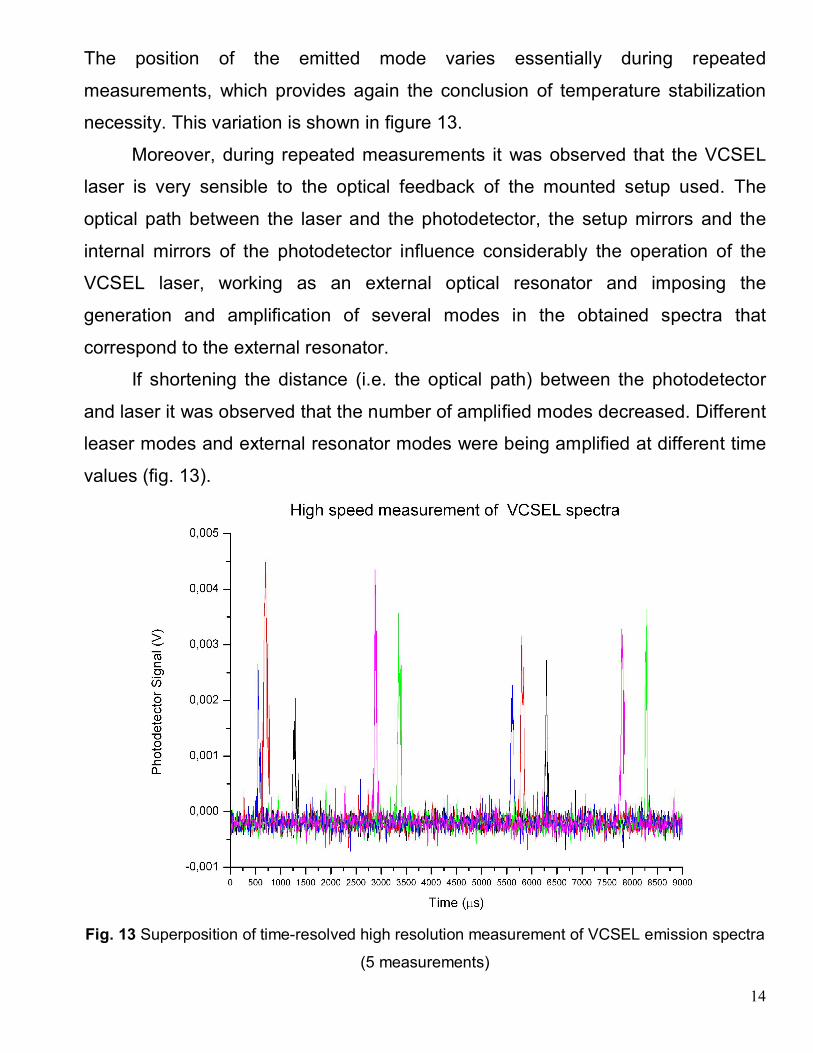
The position of the emitted mode varies essentially during repeated
measurements, which provides again the conclusion of temperature stabilization
necessity. This variation is shown in figure 13.
Moreover, during repeated measurements it was observed that the VCSEL
laser is very sensible to the optical feedback of the mounted setup used. The
optical path between the laser and the photodetector, the setup mirrors and the
internal mirrors of the photodetector influence considerably the operation of the
VCSEL laser, working as an external optical resonator and imposing the
generation and amplification of several modes in the obtained spectra that
correspond to the external resonator.
If shortening the distance (i.e. the optical path) between the photodetector
and laser it was observed that the number of amplified modes decreased. Different
leaser modes and external resonator modes were being amplified at different time
values (fig. 13).
Fig. 13 Superposition of time-resolved high resolution measurement of VCSEL emission spectra
(5 measurements)
15
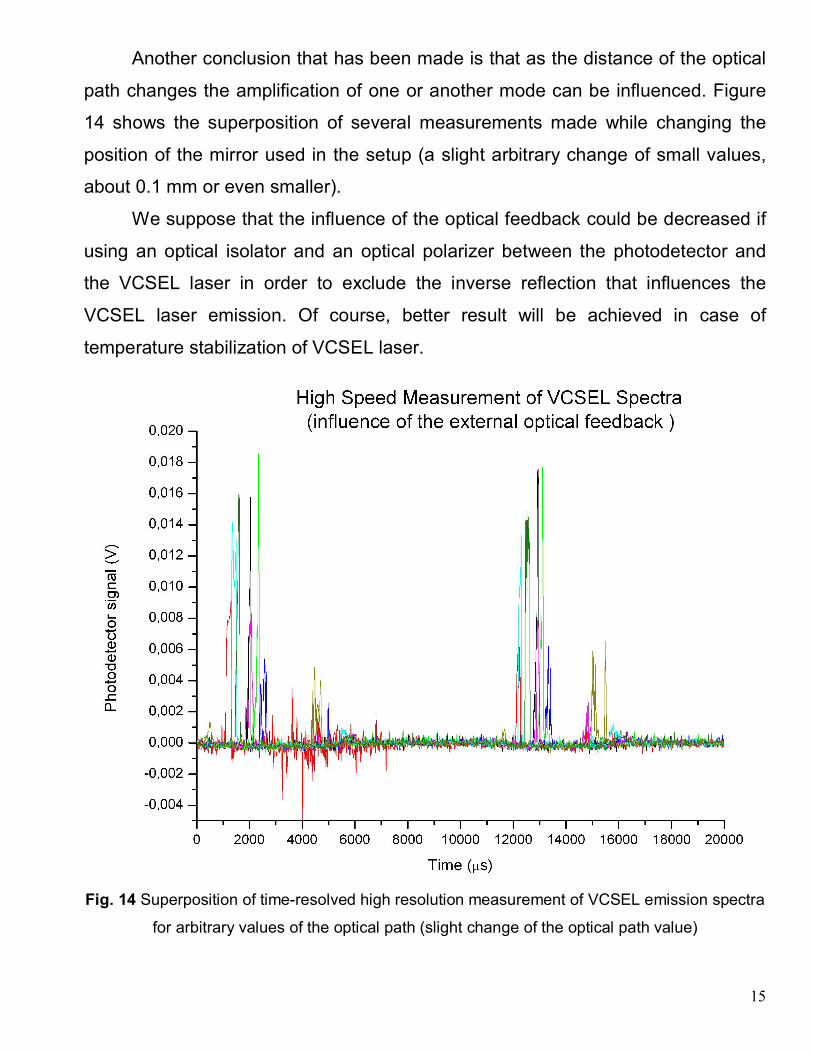
Another conclusion that has been made is that as the distance of the optical
path changes the amplification of one or another mode can be influenced. Figure
14 shows the superposition of several measurements made while changing the
position of the mirror used in the setup (a slight arbitrary change of small values,
about 0.1 mm or even smaller).
We suppose that the influence of the optical feedback could be decreased if
using an optical isolator and an optical polarizer between the photodetector and
the VCSEL laser in order to exclude the inverse reflection that influences the
VCSEL laser emission. Of course, better result will be achieved in case of
temperature stabilization of VCSEL laser.
Fig. 14 Superposition of time-resolved high resolution measurement of VCSEL emission spectra
for arbitrary values of the optical path (slight change of the optical path value)
16
Conclusions
The obtained high resolution absorption spectra of H2O, CH4, NH3, HF gases
in the interested IR range (=1300nm up to 1350nm) shows promising results in
developing gas sensing devices if using the water absorption lines for calibration.
The line width of the laser line emitted by VCSEL is satisfactory and quite
narrow for using it for gas sensing purposes. The main condition that has to be
assured is the amplified wavelength position of VCSEL (constructive or by
temperature stabilization) and the single mode operation of VCSEL. Temperature
stabilization is a crucial factor in high resolution measurements of VCSEL emission
spectra.
The optical feedback is influencing essentially the operation of VCSEL. The
value of the external optical path influences the amplification of different modes
that correspond to the external resonator created by the optical setup and to the
VCSEL laser.
Acknowledgement
Special thanks to the whole team from the Laboratory of FT and Laser Spectroscopy, Department of Spectroscopy, Jaroslav Heyrovský Institute of Physical Chemistry ASCR, Prague, for the help and equipment provided in realizing the study described in the report.