Embed Size (px)
Citation preview
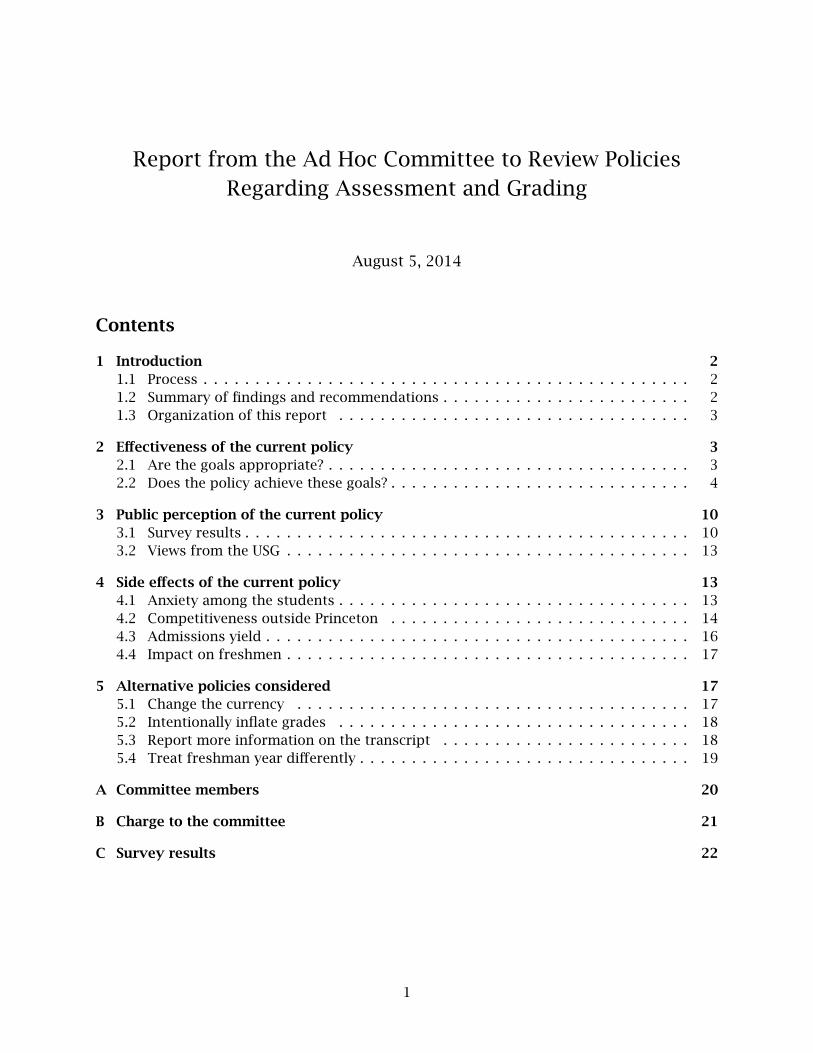
Report from the Ad Hoc Committee to Review PoliciesRegarding Assessment and Grading
August 5, 2014
Contents
1 Introduction 21.1 Process . . . . . . . . . . . . . . . . . . . . . . . . . . . . . . . . . . . . . . . . . . . . . . . 21.2 Summary of findings and recommendations . . . . . . . . . . . . . . . . . . . . . . . . 21.3 Organization of this report . . . . . . . . . . . . . . . . . . . . . . . . . . . . . . . . . . 3
2 Effectiveness of the current policy 32.1 Are the goals appropriate? . . . . . . . . . . . . . . . . . . . . . . . . . . . . . . . . . . . 32.2 Does the policy achieve these goals? . . . . . . . . . . . . . . . . . . . . . . . . . . . . . 4
3 Public perception of the current policy 103.1 Survey results . . . . . . . . . . . . . . . . . . . . . . . . . . . . . . . . . . . . . . . . . . . 103.2 Views from the USG . . . . . . . . . . . . . . . . . . . . . . . . . . . . . . . . . . . . . . . 13
4 Side effects of the current policy 134.1 Anxiety among the students . . . . . . . . . . . . . . . . . . . . . . . . . . . . . . . . . . 134.2 Competitiveness outside Princeton . . . . . . . . . . . . . . . . . . . . . . . . . . . . . 144.3 Admissions yield . . . . . . . . . . . . . . . . . . . . . . . . . . . . . . . . . . . . . . . . . 164.4 Impact on freshmen . . . . . . . . . . . . . . . . . . . . . . . . . . . . . . . . . . . . . . . 17
5 Alternative policies considered 175.1 Change the currency . . . . . . . . . . . . . . . . . . . . . . . . . . . . . . . . . . . . . . 175.2 Intentionally inflate grades . . . . . . . . . . . . . . . . . . . . . . . . . . . . . . . . . . 185.3 Report more information on the transcript . . . . . . . . . . . . . . . . . . . . . . . . 185.4 Treat freshman year differently . . . . . . . . . . . . . . . . . . . . . . . . . . . . . . . . 19
A Committee members 20
B Charge to the committee 21
C Survey results 22
1

1 Introduction
In April 2004, the faculty adopted a grading policy that aimed to provide common gradingstandards across academic departments and to give students clear signals from their teachersabout the difference between good work and their very best work. The policy recommendedthat, over time, each department award no more than 35% of A-range grades for course workand no more than 55% of A-range grades for junior and senior independent work.
In October 2013, President Eisgruber charged an ad hoc faculty committee with reviewingthe University’s policies for how student work is evaluated. The committee was composed offaculty members from each division and included current or past members of the Committeeon Grading and the Committee on Examinations and Standing, as well as faculty who regularlyteach large numbers of undergraduates. The members of the ad hoc committee are listed inAppendix A.
The president asked the members of the committee to explore whether the grading policy’sobjectives remain the appropriate ones against which to judge Princeton’s assessment prac-tices. He also asked them to examine whether the policy achieves the University’s pedagogicalgoals effectively, with as few negative consequences as possible, or whether there are betterways to reach those goals. The president’s charge to the ad hoc committee is attached to thisreport as Appendix B.
1.1 Process
In the course of its work, the committee sought broad input. We surveyed current faculty mem-bers and undergraduates, created a public comment website to elicit feedback from alumni andparents, and met with a range of administrators, faculty members, and students to discusstheir perspectives on and experiences under the grading policy. In addition, the committee an-alyzed existing quantitative and qualitative data and consulted with colleagues at select peerinstitutions to better understand their policies and practices with regard to grading.
1.2 Summary of findings and recommendations
Based on what we learned, we recommend a number of changes to the current policy, whichwe summarize here.
Remove the numerical targets from the grading policy. Such targets are too often misinter-preted as quotas. They add a large element of stress to students’ lives, making them feel asthough they are competing for a limited resource of A grades.
Charge departments with developing their own grading standards. We recommend replac-ing the numerical guidelines with a set of grading standards developed and articulated byeach department. These standards, which could be reported to the dean of the college as wasrecently done with standards for independent work, would help meet the goal of the currentpolicy of maintaining “consistent standards across departments.” Note that while “consistentstandards” has been interpreted to mean “consistent grades,” standards are not the same asgrades, as we discuss in Section 2.1. Indeed, it is difficult even to define how to compare the“standards” among departments in vastly different fields. Furthermore, the data discussedin Section 2.2 show that the grading policy has had limited success at improving consistency
2
of grades across departments, and in some cases has made the disparity worse (for instance,between students concentrating in Engineering as opposed to Mathematics or Physics).
As we show in Section 2.2, grades began to decline a year before the grading policy wasput in place. A reasonable interpretation is that this decline was due to conversations thedean of the college was having with departments about grade inflation, which resulted in anincrease in general awareness of grading policy among the faculty. We recommend that thedean of the college continue to monitor grades across departments and communicate withdepartments when their own grading policies appear to be changing over time. We furtherrecommend that departments internally review their grading history on a regular basis toensure consistency with their own promulgated grading standards. We suggest that this sort ofcontinuing conversation is a more effective and positive way of having an appropriate gradingpolicy, and with fewer undesirable side effects, than setting numerical targets.
Dissolve the Committee on Grading. The emphasis should move away from “grades,” andinstead focus on “quality of feedback.” To this end, we feel it would be appropriate to chargethe newly-formed Council on Teaching and Learning with advancing efforts to improve qualityof feedback, in place of the Committee on Grading’s current focus on limiting grade inflation.
No changes to the freshman year. While not part of our formal charge, we were also asked toexamine whether grading in freshman year ought to be treated differently in order to help easethe transition to Princeton. After careful consideration, we do not recommend any changesto the grading in freshman year. As discussed in Section 5.4, we considered many possiblescenarios, including covered grades, or no grades, for a semester or a year, and we think thatall of these have the potential to create more problems than they solve. We do note thatfreshman year (especially the first semester) is a stressful time for students, particularly forfirst-generation college students and those from disadvantaged backgrounds. However, we arenot convinced that grades are the central issue here. In order to address this issue, some othergroup could be convened to focus exclusively on freshman year and to consider more thanjust grades.
1.3 Organization of this report
The remainder of this report details the process and analysis we went through to reach ourconclusions. In Section 2, we discuss whether the goals of the current policy are the appro-priate ones and whether the policy has been effective in meeting those goals. In Section 3, welook at the public perception of the policy, discussing the results of the surveys mentionedabove. Next, in Section 4, we discuss our understanding of the main side effects of the policy.We then briefly describe, in Section 5, some alternative policies we considered but did not endup recommending.
2 Effectiveness of the current policy
2.1 Are the goals appropriate?
The current grading policy has two main objectives: a) to maintain “fair and consistent” grad-ing standards across academic departments; and b) to give students clear signals about the
3

quality of their work. We were concerned throughout our discussions to determine whetherthese goals are appropriate.
Our findings suggest that the first goal is not appropriate. In our online surveys, to bediscussed in more detail in Section 3.1, a majority of both students (68%) and faculty (60%)who responded agree or strongly agree that “Students in one academic department shouldbe graded according to the same standards as students in any other department.” But only5% of students and only 6% of faculty actually believe the current policy is effective in meet-ing that objective. (Another 19% of students, and another 32% of faculty, believe the policyis “somewhat effective.”) In our view, this disparity arises because “consistent standards” isoften interpreted, by students and instructors alike, to mean “consistent grades”—an under-standable misconception given the emphasis in the current policy on maintaining (in effect,standardizing) specific percentages of A-range grades.
But standards are not the same as grades. Standards are the evaluative rubrics departmentsand instructors develop to convey to students the specific expectations for their work andagainst which that work will be graded. Grades measure the extent to which students meetthose expectations. “Consistent standards” is an admirable goal in the abstract, but in practiceit is our judgment that it is difficult if not impossible to compare standards across departmentsin different fields. Meaningful standards are—or should be—not only detailed but also highlycourse- and discipline-specific. They can only be easily compared across disparate fields ifthey are vague or generic. As a consequence it also seems to us less important that the samepercentage of students in every department receive A-range grades—the current implicationof the “consistent standards” objective—than that there be a high correlation between thegrades students receive and the evaluative rubrics in the specific courses they take. Thus wehave come to feel strongly that departments should spend their time developing clear andmeaningful evaluative rubrics for work within their disciplines rather than aligning grades tomeet specific numeric targets.
Our findings suggest, on the other hand, that the second objective of the current gradingpolicy is appropriate: faculty should use grades to give students clear feedback about thequality of their work. This objective strikes us as integral to any grading policy. The onlinesurvey results affirm this belief: 79% of students and 93% of faculty who completed the surveyagree or strongly agree that “Grades should give clear signals about the difference betweenordinarily good work and the very best work.” At the same time, we do not believe that gradesare the only means, or even necessarily the most effective means, of giving such feedback.Instead it is the quality and content of instructor feedback—how detailed, informative, andtimely it is—that matters most and that should receive the highest emphasis in any gradingpolicy.
2.2 Does the policy achieve these goals?
We begin with a summary of the history of grades at Princeton that led to the current policy,and of the experience since the current policy was implemented. The analyses below rely ondata provided by the registrar on the course-specific distribution of grades at Princeton fromacademic years 1974–2013. It does not include information on grades in junior and seniorindependent work.
4

1975 1980 1985 1990 1995 2000 2005 2010 2015Academic year
3.00
3.05
3.10
3.15
3.20
3.25
3.30
3.35
3.40G
PA
1975 1980 1985 1990 1995 2000 2005 2010 2015Academic year
25%
30%
35%
40%
45%
50%
Fract
ion A
gra
des
Figure 1: Average GPA and fraction A-range grades by year, 1974–2013.
Average GPA and the fraction of A-range grades
The left panel of Figure 1 shows the average GPA at Princeton each academic year from 1974to 2013; the right panel shows the fraction of grades at Princeton in the A range (A+, A, A−)each year over the same period. Several interesting features are apparent from these figures:
• There was substantial grade inflation from 1974 through 2003. Over this period, the rawaverage grade at Princeton increased from 3.03 (B) to 3.38 (above B+). Over the sameperiod, the fraction of grades in the A range increased from 29.9% to 47.9%. Indeed, itwas recognition of this trend that resulted in the adoption of the current grading policyin 2004 (effective for the 2005 academic year).
• GPA peaked in the 2002 academic year and subsequently fell sharply through 2005, an-ticipating by two years the application of the current grading policy. While the drop inGPA in 2003 is influenced by a change in the way Pass/Fail grades were recorded (see thediscussion of Figure 2 below), both the average GPA and the fraction of A-range gradesdeclined further in 2004, a year before the present grading policy was adopted.
• GPA increased somewhat after 2006, by 0.05 GPA points. The fraction of A-range gradescontinued to decrease a bit for a few years after 2005, but between 2009 and 2013, thefraction increased by 3.3 percentage points. These recent increases may reflect a changein monitoring the current policy.
The timing of the decline in average GPA and the fraction of A-range grades suggests thatthe implementation of the current grading policy was only partially responsible for arrest-ing the increase in grades that had occurred over the previous quarter century. However, asoutlined above, the timing does suggest a potentially important alternative understanding thathelped guide us in formulating our recommendations. The decline in average GPA and the frac-tion of A-range grades began at about the time a vigorous debate started among the facultyregarding grading, grade inflation, and a potential change in grading policy. This discussionwas precipitated by interest from the dean of the college in the issue, and ultimately resultedin the 2004 grading policy with numerical targets for the fraction of A-range grades. What the
5

1975 1980 1985 1990 1995 2000 2005 2010 2015Academic year
0%
10%
20%
30%
40%
50%Fr
act
ion A+/A/A-
B+/B/B-
C+ or worse
Pass
1990 1995 2000 2005 2010 2015Academic year
0%
5%
10%
15%
20%
25%
Fract
ion
A+/AA-B+BB-
Figure 2: Fraction of A, B, and C-or-worse grades by year, 1974–2013
time pattern of results suggests is that much of the change resulted from the attention anddiscussion rather than from the hard guidelines themselves.
Clearly, guidelines can help keep the faculty focused on the importance of giving infor-mative feedback to students through grades. However, we believe that the same result canbe achieved through regular campus discussion at the departmental level. The dean of thecollege can evaluate on an ongoing basis whether departments are deviating from their pastnorms and suggest to such departments that they should examine why this might be the casein order to ensure that grades continue to play the role they are designed to have in providingfeedback to students.
Grade Compression
Fine distinctions among students cannot be made with a very narrow range of grades awarded,so one potential benefit of the 2004 grading policy would be that a reduction in the fractionof A-range grades would increase the effective range of grades awarded. The left panel ofFigure 2 contains plots over time of the fraction of grades that are A-range, B-range, and C-or-worse range, as well as the fraction of grades recorded as Pass.
We now mention a subtle point that complicates the interpretation of the data just prior tothe implementation of the 2004 grading policy. Note in Figure 2 that the number of Pass gradesdrops sharply in 2003, from 7.8% to 1%. This sharp drop reflects a change in the policy withregard to how these grades were recorded. Prior to 2003, if a student elected to take a coursePass/Fail, a passing grade was recorded by the registrar simply as a Pass. Starting in 2003,the grade recorded by the registrar was the letter grade assigned by the course instructor;these grades were then covered on the students’ transcripts, where they appeared as a Pass. In2003 and subsequent years, the only grades recorded as Pass are those for which the courseis Pass/Fail only, in which case the instructor does not assign a letter grade. The net result isthat more B and C-range grades were recorded in 2003 and thereafter; this in turn results in alower average GPA, since Pass grades are not included in GPA computation. However, it mayhave little effect on the fraction of A-range grades, since, given the ability of students to electP/D/F status fairly late in the term, it is likely that only a small fraction of grades previouslyrecorded as Pass grades would have been in the A range.
6

The time-series for the A-range grades shown in Figure 2 reproduces the raw plot in theright panel of Figure 1, and shows the steady increase in the fraction of A-range grades through2003. This is mirrored by an equally steady decrease in the fraction of C-or-worse grades overthe same period (from 20% of grades recorded—and presumably more, once Pass grades aretaken into account—to less than 10% in 2003). Interestingly, the fraction of B-range gradeswas constant through the early 1990s and then declined by about 5 percentage points through2002 as the fraction of A-range grades grew more rapidly.
Three changes subsequent to 2003 are clear:
1. The fraction of A-range grades declined significantly (by 7%) by 2005.
2. The fraction of B-range grades increased significantly (by 6.4%) by 2005.
3. The fraction of grades C or worse held steady (did not continue its trend decline).
We may attribute these changes to the discussion surrounding grading at Princeton that ledto the 2004 grading policy, but it does not seem that they did much to improve the ability tomake fine distinctions in student performance. A-range and B-range grades have accountedfor around 90% of grades at Princeton since 2003.
Neither the shift from A-range to B-range grades nor the lack of change in the fractionof C-or-worse grades between 2003 and 2005 is surprising given the focus of the discussion(and the resulting policy) on the fraction of A-range grades. A more nuanced look at thedata, contained in the right panel of Figure 2, shows the time series from 1992 of the gradedistribution for A+/A, A−, B+, B, and B−. Usage of each grade in the A range decreased between2003 and 2005 while usage of each grade in the B range increased over the same period. Thus,the faculty did not simply move some grades from A− to B+ to reduce the number of A-rangegrades awarded: the entire distribution of grades in the A-range and B-range moved down, asis apparent in the right panel of Figure 2.
Once again, the timing of these changes does not coincide with the implementation of the2004 grading policy. But it does coincide with the beginning of discussion among the facultyregarding grading, again suggesting that encouraging continuing discussion among the facultyof grading and its use to provide meaningful feedback to students is likely to be a fruitfulavenue going forward to encourage appropriate grading practices.
Variation across departments
The question of whether the grading policy has led to less variation in the grade distributionacross departments is a more subtle one. As discussed in Section 2.1, we feel there is adifference between “consistent standards” described in the policy and “consistent grades,” butsince the former is difficult to quantify across departments in a wide variety of disciplines,in this section we will examine the extent to which the grading policy has been successful inmaking grades more consistent across departments. This question is, of course, examinedregularly by the Committee on Grading, but our analysis might provide a different perspective.
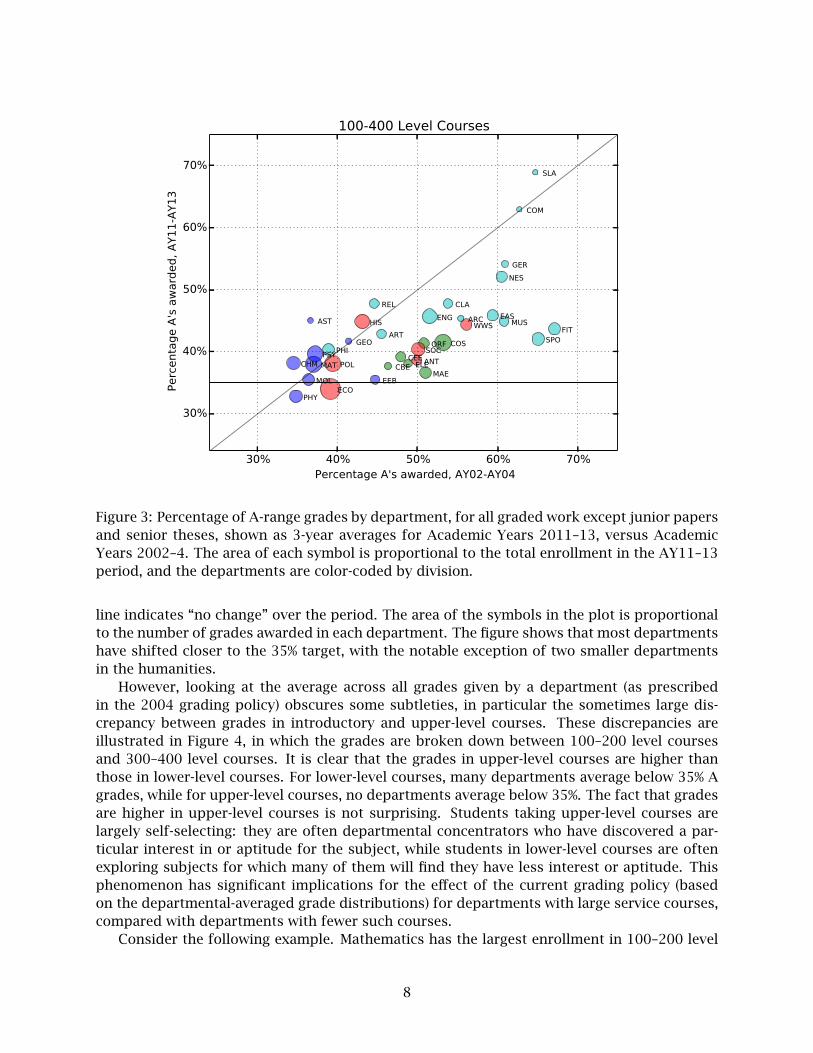
Overall, there has been some reduction since the 2002–2004 period in the disparity ofgrades across departments, but there is still significant variation. Figure 3 shows one view ofthe data, in which we show the fraction of A-range grades in each department, averaged overa three-year period ending in Academic Year 2013, compared with the same quantity for thethree-year period ending in Academic Year 2004, just before the policy was implemented. Thehorizontal line at 35% indicates the target number established by the policy, and the 45-degree
7
30% 40% 50% 60% 70%Percentage A's awarded, AY02-AY04
30%
40%
50%
60%
70%Perc
enta
ge A
's a
ward
ed,
AY1
1-A
Y1
3
ANT
ARC
ART
AST
CBECEE
CHM
CLA
COM
COS
EAS
ECOEEB
ELE
ENG
FIT
GEO
GER
HIS
MAEMAT
MOL
MUS
NES
ORFPHI
PHY
POLPSY
REL
SLA
SOCSPO
WWS
100-400 Level Courses
Figure 3: Percentage of A-range grades by department, for all graded work except junior papersand senior theses, shown as 3-year averages for Academic Years 2011–13, versus AcademicYears 2002–4. The area of each symbol is proportional to the total enrollment in the AY11–13period, and the departments are color-coded by division.
line indicates “no change” over the period. The area of the symbols in the plot is proportionalto the number of grades awarded in each department. The figure shows that most departmentshave shifted closer to the 35% target, with the notable exception of two smaller departmentsin the humanities.
However, looking at the average across all grades given by a department (as prescribedin the 2004 grading policy) obscures some subtleties, in particular the sometimes large dis-crepancy between grades in introductory and upper-level courses. These discrepancies areillustrated in Figure 4, in which the grades are broken down between 100–200 level coursesand 300–400 level courses. It is clear that the grades in upper-level courses are higher thanthose in lower-level courses. For lower-level courses, many departments average below 35% Agrades, while for upper-level courses, no departments average below 35%. The fact that gradesare higher in upper-level courses is not surprising. Students taking upper-level courses arelargely self-selecting: they are often departmental concentrators who have discovered a par-ticular interest in or aptitude for the subject, while students in lower-level courses are oftenexploring subjects for which many of them will find they have less interest or aptitude. Thisphenomenon has significant implications for the effect of the current grading policy (basedon the departmental-averaged grade distributions) for departments with large service courses,compared with departments with fewer such courses.
Consider the following example. Mathematics has the largest enrollment in 100–200 level
8

30% 40% 50% 60% 70%Percentage A's awarded, AY02-AY04
30%
40%
50%
60%
70%Perc
enta
ge A
's a
ward
ed,
AY1
1-A
Y1
3
ANT
ARC
ART
AST
CBECEE
CHM
CLA
COM
COS
EAS
ECO
EEB
ELE
ENG
FIT
GEO
GER
HIS
MAE
MATMOL
MUS
NES
ORFPHI
PHY
POL
PSY
REL
SLA
SOC
SPO
100-200 Level Courses
30% 40% 50% 60% 70%Percentage A's awarded, AY02-AY04
30%
40%
50%
60%
70%
Perc
enta
ge A
's a
ward
ed,
AY1
1-A
Y13
ANT ARC
ART
AST
CBE
CEECHM
CLA
COM
COSEAS
ECOEEBELE
ENG
FIT
GEO
GER
HIS
MAE
MAT
MOL
MUS
NES
ORF
PHI
PHY
POL
PSY
REL
SLA
SOC
SPO
WWS
300-400 Level Courses
Figure 4: Percentage of A-range grades by department, shown as 3-year averages as in Figure 3,separated into 100–200 level courses (top plot), and 300–400 level courses, excluding juniorpapers and senior theses (bottom plot). The area is again proportional to the enrollment, andthe departments are color-coded by division.
9

courses of any department, and the average fraction of A-range grades in these courses is32.4% (averaged over the 3-year period ending in Academic Year 2013). In contrast, the fractionof A-range grades in upper-level Mathematics courses is 59.9%. Across the whole Mathemat-ics department, the fraction of A-range grades is 38.0%. Looking only at the department-wideaverage, one might conclude that students concentrating in Mathematics should receive, onaverage, roughly the same fraction of A-range grades as those concentrating in Engineeringdepartments such as CBE (37.7%), ELE (38.1%), or MAE (36.6%). However, this is grossly mis-leading, since the upper-level courses in the Engineering departments have a much lower frac-tion of A-range grades than those in Mathematics and Physics: 38.3% for CBE, 37.8% for ELE,and 37.8% for MAE, compared with 59.9% for Mathematics and 50.4% for Physics. Ironically,many of the students taking the introductory Mathematics and Physics courses are in fact En-gineering students, so these students get hit twice: first in the introductory Math and Physicscourses, and then in their own departments, which are “limited” in the number of A-rangegrades they can give because Engineering departments do not offer service courses with largeenrollments.
Note that the grading policy has had little effect on the grades in the Mathematics depart-ment (for both lower-level and upper-level courses, the points in Figures 3 and 4 are on the45-degree line). However, it has had a substantial impact on the Engineering departments,which have significantly lowered the fraction of A-grades in both lower-level and upper-levelcourses. Thus, while it appears from the overall averages in Figure 3 that the grading policyhas reduced the disparity across departments, closer examination of Figure 4 reveals that, insome cases, it has made the disparity worse.
Thus, while the grading policy has succeeding in making the overall fraction of A-rangegrades more uniform across departments, in our view this is not a reliable measure of fairnessacross departments. Because some departments by their very nature offer service courseswith large enrollments, while others do not, comparing department-wide averages is not evena reliable measure of “consistent grades” across departments, much less the more subtle andelusive notion of “consistent standards” across departments.
On balance, we feel that emphasis on moving various departments further toward a com-mon grade distribution is misplaced. There is a long history of different departments usingdifferent distributions, and we understand that this is not a Princeton-specific phenomenon.Our educated guess is that the rank ordering of grading by departments does not differ muchacross our peer institutions. This is well understood by the world at large (e.g., graduateschools, employers), and it does not appear to cause problems, at least none that surfaced inour discussions with a wide range of groups. Our view is that grades within departments needto be meaningful in providing accurate feedback to students but that this does not requireidentical grade distributions across departments.
3 Public perception of the current policy
3.1 Survey results
The committee commissioned three surveys: for current students, current faculty, and thepublic at large. The surveys were administered and data collected by Vice Provost Jed Marshduring February and March 2014.
The full survey results are included in Appendix C. To summarize briefly, among the 45%of undergraduates who responded to the survey, a majority indicated support for the goals
10

of the grading policy, but expressed strongly negative views on the policy’s implementation,effectiveness, and influence on their academic experience at Princeton.
Faculty sentiment, with about half of the faculty responding, was roughly equal on bothsides of the question, though with significant differences among divisions: the humanistswere more strongly opposed to the policy than were the natural scientists. Public sentiment(primarily alumni and/or parents) was strongly in favor of the goals of the grading policy, butthere was an almost equally strong belief that it has been ineffective.
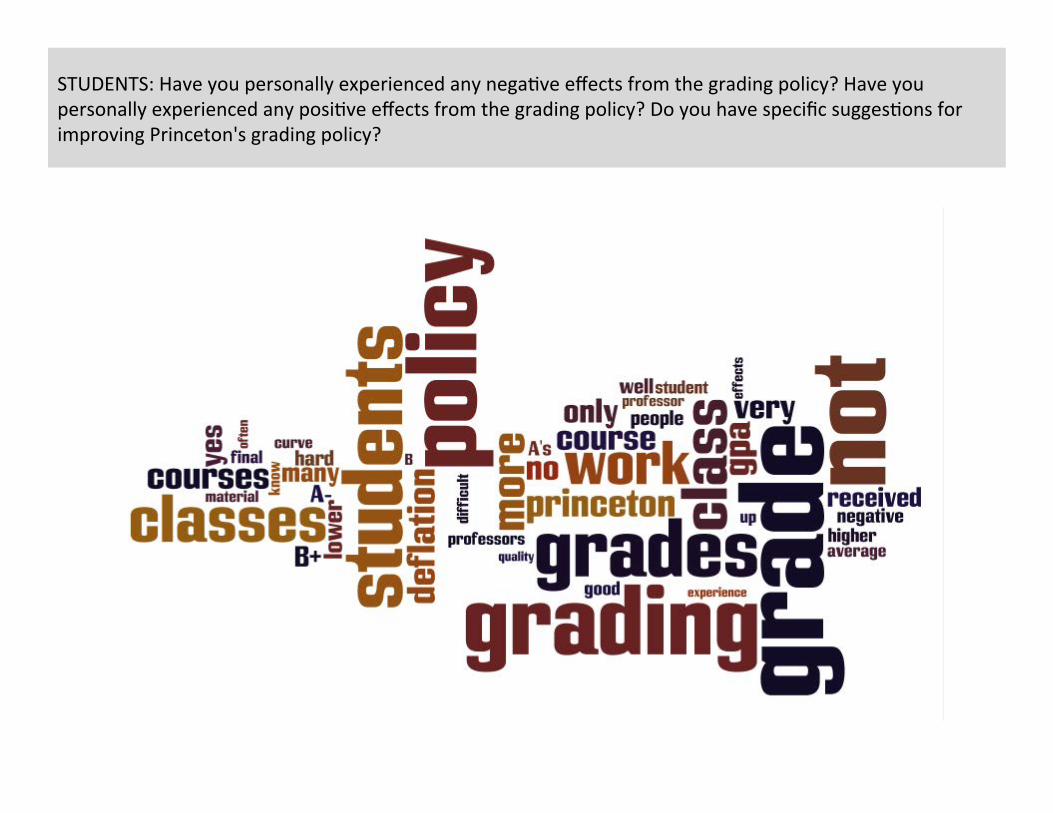
In addition to the numerical responses, there were a large number of free-text responses.The student survey included three free-response questions, discussed briefly below:
Have you personally experienced any negative effects from the grading policy?1429 text responses, with 87,883 words (average 61, longest 5,037). The word “negative”
occurred 211 times; the word “positive” occurred 24 times, but in context many apparent ‘pos-itives’ were not. For instance: “I do not think that the grading policy is a positive contributionto the school in any way.” “There are zero positive effects.”
Have you personally experienced any positive effects from the grading policy?1192 responses, 25,059 words (average 21, longest 1778). Again, “negative” occurred 36
times, “positive” occurred 124 times, but in context, many apparent ‘positives’ were not: “Ihave not experienced the positive effects of the grading policy.” “No I have experienced nopositive effects.”
Do you have specific suggestions for improving Princeton’s grading policy?1274 responses, 70,696 words (average 55, longest 5412). A list of “collocations,” that is,
word pairs that occur unusually frequently, is suggestive:
grade deflation; grading policy; Get rid; peer institutions; graduate schools; IvyLeague; Princeton students; grade inflation; quality work; across departments; grad-ing policies; graduate school; grading system; feel like; deflation policy; playingfield; current policy; grad school
Several themes emerged from the student responses, and we provide a few sample re-sponses below. Some of the comments revealed poor behavior on the part of the faculty:
I received a 91 on a midterm exam in a [particular department] course thispast fall (my concentration), but the 91 was scratched out and replacedwith an 88. When I asked my professor why he reduced my score, he toldme that normally the paper would be an A−, but due to grade deflation, hewas forced to lower several students’ grades to a B+.
The grading policy is particularly unreasonable in introductory languagecourses. On the first day of classes, my [language] teacher said that only 3 ofus in a class of 11 would receive As. This often means that despite receivingan overall grade of 90+ a student cannot receive an A-grade because someother student got a 91 or 92.
Another common theme was that the grading policy harms the spirit of collaboration:
11

I have experience[d] multiple negative effects from the grading policy. Be-cause of grade deflation it has been extremely hard to find any kind of col-laborative environment in any department and class I have taken at Prince-ton. Often even good friends of mine would refuse to explain simple con-cepts that I might have not understood in class for fear that I would dobetter than them. I have also heard from others about students activelysabotaging other student’s grades by giving them the wrong notes or tellingthem wrong information. Classes here often feel like shark tanks. If I hadknown about this I very probably would have not attended Princeton despiteit being a wonderful university otherwise.
Some students described how their low grades have had serious consequences, which theyblame (rightly or wrongly) on the grading policy:
I had to drop being Pre-Med here because the grades I was getting in thesciences were too low. I was getting low grades not because I didn’t under-stand the material, but because the curve was getting messed up by kidswho were very advanced in chemistry and taking Intro to Chem and getting100’s on the exams. Now my parents have to help me pay for a post-bacprogram so that I can take the sciences elsewhere post-graduation becausePrinceton didn’t allow me to take the necessary next step to realizing mydream by giving me unfair grades in the sciences. My sister went to [a peerinstitution] and was pre-med there, and even though I have been consis-tently better than her grade wise growing up, she was able to receive A’s inall the science courses and attend [a top medical school]. I don’t even knowif I have a shot at [that medical school] because of Princeton. Not becauseI’m not qualified or a good applicant, but because Princeton’s grading policymakes me look like a poor applicant compared to other students applyingwith incredibly high GPA’s.
I earned a college scholarship at the end of high school. To keep the schol-arship, I had to maintain a 3.4 GPA throughout college. I did not have a 3.4my first semester due to grade deflation in large introduction classes andlost my scholarship. / Also, many internships have 3.5 or 3.6 GPA cutoffs.They don’t care what school you go to or that Princeton has grade deflation.Your application isn’t considered if you don’t make the cutoff.
Other students have had positive experiences with the grading policy. One common themethat emerged was that, because of the policy, students appreciate A grades more:
On the whole I’ve gotten a relatively high GPA and Princeton’s grading policyhas made those grades count more, both in terms of applying for futureopportunities and for my self-esteem.
I do believe that most of my grades have been fair, and the grading policyhelps to know they are not inflated.
12

Another theme was that the policy provides an incentive for students to work harder:
I think the rigorous standards (either natural to Princeton or caused by thegrade deflation policy) have definitely pushed me harder to do better work,especially in the classes I enjoy. I think one of the unmentioned effects isthe clarification I feel because of grade deflation. In some classes, I’ll feelvery stressed trying to produce quality work, but in others, I enjoy puttingthe extra time/effort in and want to be challenged. Unsurprisingly, thishelped me figure out which departments and disciplines I enjoy, and whichI would rather avoid.
One student’s honest response summed up the situation nicely:
The grading policy provides students (myself included) with an easy excuseanytime we receive grades that we don’t feel reflect our work.
3.2 Views from the USG
The committee met with members of the Undergraduate Student Government (USG), who ex-pressed four major concerns with the grading policy:
1. It deters admitted students from matriculating.
2. It may cause students to select departments based upon perceived grading tendencies,and may harm concentrators in small departments or departments in which mostlyupper-level courses are offered.
3. It has led to emphasis on the letter grade rather than substantive instructor feedback.
4. It disadvantages Princeton students in the external marketplace, where some employershave GPA cutoffs and are likely to treat Ivy League GPAs as providing similar information.
The USG also shared key insights from the Academic Life Total Assessment (ALTA) adminis-tered in January 2012. Among the 2567 undergraduate respondents, 46% said they had re-ceived justification for a grade based on the grading policy and 23% said they were not gettingenough feedback. Students in both the survey and associated focus groups expressed interestin greater frequency of assessment and more informative feedback, especially earlier in theterm. The survey also raised concern over the psychological impact of grades, to be addressedin Section 4.1.
4 Side effects of the current policy
4.1 Anxiety among the students
One of the negative side effects of the grading policy has been its contribution—in percep-tion at least—to the anxiety about grades and indeed about themselves that many studentsexperience while at Princeton. Chemistry professor Michael Hecht expressed the idea well bydescribing the campus as a pressure cooker and suggesting that the grading policy has kept the
13

lid on tight. “I believe that student well-being, enthusiasm, and peace of mind are important—both for student life in general and for academic success,” he said, reflecting on his four yearsas Master of Forbes College. “I would rather our students be motivated by love of learning thananxiety about grades. [The] current grading policy is detrimental to the learning experienceand to the campus environment in general. Let’s fix that.”
Professor Hecht’s comments align with well-established research, which suggests that anoptimal level of anxiety is essential for performing to the best of one’s ability on academicwork, but that an elevated level of anxiety can block mental performance, lead to procrastina-tion, and be associated with psychosomatic symptoms, alienation, and diminished self worth.
We should note that the committee received no hard evidence with which to substantiateabsolutely that student anxiety has increased as a direct result of the grading policy during theyears in which the policy has been in effect. Although some data about mental health assess-ments might be available, the committee considered it unlikely that trends could be identifiedthat would separate grading policy effects from other factors associated with economic condi-tions, family backgrounds, and job markets.
However, the committee did receive considerable evidence to support the argument, unsur-prisingly, that grades, anxiety about grades, and students’ sense of psychological well-being(or lack thereof) are closely related. For example, the ALTA survey showed that 40% of stu-dents said grades have a “strong psychological impact on life outside of classes” while another48% said grades have some impact.
From the various faculty, staff, and students who met with the committee, we identifiedtwo possible ways in which the grading policy may be exacerbating student anxiety. Oneis students’ perception that only 35% of those enrolled in a particular class can receive A-range grades, no matter how hard everyone works. Such a perception would undoubtedlycontribute to the “culture of competition” that is already so prominent on campus, aggravatingit by reinforcing the idea that students are locked in a zero sum game and should view theirclassmates as competitors rather than as friends and colleagues.
The other possibility is anxiety driven by the belief that a 35% cap on A grades adds to,rather than reduces, whatever arbitrariness may be present in the relationship between effortand grades. If effort that truly leads to top-quality work does not result in equivalent grades,the psychological impact can be a kind of fatalism or at least a heightened level of uncertaintyabout how well one is doing and whether the reward system is functioning rationally.
4.2 Competitiveness outside Princeton
In recent months, two of our principal institutional competitors, Harvard and Yale, have beenin the national news for the high percentage of A-range grades that they award. The pressand general public opinion have not been kind to the revelations of such lax standards, butone might argue that Harvard and Yale have the last laugh since there is no evidence—or atleast we have not been presented with any—that students at these universities are adverselyaffected by transcripts peppered with A’s. All educational institutions are different, some-times in subtle ways, and we can be sure that comparisons between Princeton and such otherIvy League institutions are between apples and pears, if not apples and oranges. Nevertheless,it is inevitable that people—applicants, current students, parents, admissions committees atgraduate and professional schools, fellowship-awarding bodies, and employers—will compareour current policy with the public announcement of grading practices elsewhere. For exam-ple, Yale reported in February 2013 that by the spring of 2012, 62% of undergraduate gradeswere A’s and A−’s, while the dean of undergraduate education at Harvard, basing his remarks
14

on data from the fall of 2012 and several previous semesters, reported at a faculty meet-ing in February 2013 that “The median grade in Harvard College is indeed an A−. The mostfrequently awarded grade in Harvard College is actually a straight A.” Whether anything willchange at Harvard and Yale remains to be seen.
Does the discrepancy between our policy and the reality in Cambridge, New Haven, andperhaps elsewhere make us—and Boston University and Wellesley College, two institutionsthat have also attempted to do something about rampant grade inflation—less competitive?Other sections of this report consider the effect the policy may have on applicants to Princeton(Section 4.3) and the stress to which it may subject enrolled students (and, secondarily, theirfamilies) during the school year (Section 4.1). Here we consider how it may affect our under-graduates’ success in gaining admission to graduate and professional school, winning majorexternal fellowships, being placed in plum ROTC assignments, and landing jobs.
As far as graduate school is concerned, it is not evident that Princeton’s grading policy hasany effect. Students typically attend graduate school in subjects for which they have particularaptitude and in which they have done particularly well as undergraduates. While departmentssometimes make first cuts in their applicant pool based on such factors as GPA, we have noreason to believe that Princeton students are failing to gain admission to Ph.D. programs. Ofparticular interest is the related matter of medical school, since would-be doctors evince anunusually high degree of anxiety about getting in, especially to the most competitive programs(for instance, see one student’s comment on page 12). In a detailed report to the committee,Kate Fukawa-Connelly, Director of Health Professions Advising, presented evidence that ourgrading policy does not measurably affect our students’ frankly remarkable success; if the pol-icy were not in effect, the students who blame it for not achieving the results for which theyhoped—being accepted to top medical schools is necessarily a very difficult proposition underany circumstances—would presumably find something else on which to pin their dissatisfac-tion.
Another likewise difficult proposition is winning a major postgraduate fellowship, of whichthe most prominent ones that take into account the whole applicant and his/her overall aca-demic record, are the Rhodes, Marshall, and Gates Cambridge Scholarships. It is true that it isdifficult to get an interview for a Marshall Scholarship in particular without having a GPA of 3.9at the time of application. It is, however, also true that the number of available scholarships—like the number of available places at Stanford Medical School—is severely limited. WhileDeirdre Moloney, Director of Fellowship Advising, sees a positive correlation between Har-vard’s high grades and Harvard’s typically (though not inevitably) more robust number ofrecipients of major external fellowships, it is not obvious to the committee that removing thegrading policy would in itself increase the number of winners Princeton has each year; possiblyit would increase the number and range of Princetonians whose viability fellowship-grantingbodies might seriously debate, but it is not likely to significantly change how many ultimatelyprove successful, a number that will in any event be low. The notion that one or two moreof our very top students might in a given year win a major external fellowship is not a goodreason to change this policy. The fact remains that, as with admission to medical school,Princeton’s record in the Rhodes, Marshall, and Gates competitions is impressive, and it isworth noting that the American secretary of the Rhodes Trust has explicitly stated that thegrading policy “is not harming Princeton’s students” and that “We hope very much Princetonretains its standards, and frankly, would like to see other universities follow its lead.”
The relationship between GPA and employment—both in the summers during college andafter graduation—is more complicated. On the one hand, the committee was surprised tolearn that many of the most competitive jobs (e.g., in finance) require candidates to report
15

their GPA but without submitting a transcript. Under such circumstances—and especially forthose positions that have firm GPA cutoffs, which are in fact sometimes mandated by theDepartment of Labor—it is clear that more candidates will be “in the running” from Harvardand Yale than from Princeton. However, here, too, there are only so many jobs on offer atthe top firms, so while it is possible that a few different Princetonians would get jobs at, say,Goldman Sachs if grades were higher, the committee heard evidence that the actual number ofPrincetonians in such jobs would be the same. Indeed, although one prominent banker issuedstrong words about how the policy hurts Princetonians, close examination did not persuade usthat this is so. In addition, if one looks at the overall picture and does not concentrate solelyon the students at the top of the class, Princetonians appear not to have unusual difficultyconvincing potential employers to hire them for jobs at companies that are a notch below themost elite.
It should be noted that there is one constituency—a very small one at Princeton—for whichthere is a undeniable link between GPA and postgraduate position and, furthermore, for whichthis position is neither optional (as with a fellowship) nor more or less easily convertible (aswith a job): ROTC. Cadets and midshipmen across the country are ranked lineally, and anofficer’s number, for which GPA accounts for approximately two thirds of the calculation,directly affects his/her first assignment and, at a larger level, entire career. While it wouldbe unreasonable for Princeton to change its grading policy as a result of a choice made byonly a small number of students in each graduating class, ROTC comprises a special group ofstudents whose issues deserve to be taken seriously.
In short, with the small exception of ROTC, the best reasons to change Princeton’s gradingpolicy have more to do with psychological factors and campus atmosphere than with anytangible negative effects it has on the prospects of our students outside “the Orange Bubble.”
4.3 Admissions yield
The perception that the number of A-range grades is limited sends the message that studentswill not be properly rewarded for their work. During the application process, students andparents consider the possible ramifications in terms of reduced future placement and employ-ment potential. This concern is acute among admitted students who are making their final col-lege choice, including athletes. Coaches find the perception of the grading policy a significantobstacle to recruitment, making it more difficult for them to attract the best student-athletesto Princeton.
Janet Rapelye, Dean of Admission, reports that the grading policy is the most discussedtopic at Princeton Preview and explains that prospective students and their parents see thenumerical targets as inflexible. The committee was surprised to learn that students at otherschools (e.g., Harvard, Stanford, and Yale) use our grading policy to recruit against us.
In Dean Rapelye’s view, removing the numerical targets would go a long way towards alle-viating these concerns and would make the grading policy less of an issue among prospectivestudents and their families. People fixate on numbers, and the very existence of a numericalguideline such as 35% serves as a lightning rod, giving (perhaps wrongly) the impression ofinflexibility. Removing the numerical target without changing the intent of the policy wouldsolve many of these issues.
16
4.4 Impact on freshmen
The committee explored the possibility that the grading policy may be contributing to thesignificant pressure placed on freshmen as they move from high school to Princeton.
The transition from high school to Princeton is challenging on many levels. Adjustmentdisorder continues to rank as a top diagnosis for students seeking Princeton Counseling andPsychological Services. According to John Kolligian, Director of University Health Services, Na-tional College Health Assessment data reveal that Princeton undergraduates experience higherlevels of stress than the undergraduate reference group, with around 47% of Princeton stu-dents reporting “more than normal” levels of stress and around 10% reporting tremendousstress. The data also reveal that stress is the most significant factor negatively influencingacademic performance.
With these issues in mind, the committee considered whether the grading policy was con-tributing to stress in the freshman year as students from diverse backgrounds transition intothe rigorous academic programs at Princeton. Arguably, part of the “culture shock” in comingto Princeton is that the average GPA for freshmen is 3.24, a value significantly lower than whatmost students earned in high school. The committee investigated possible solutions includ-ing pass/fail grades or covering grades in the first semester or year. These options will bediscussed in Section 5.4.
5 Alternative policies considered
Here, we mention several possible changes to the current policy that we considered but ulti-mately did not end up recommending.
5.1 Change the currency
Until 1969, Princeton used a 7-point numerical grading scale rather than the letters A to Fthat all current students and nearly all members of the faculty take for granted and thatmost, though not all, of our peer institutions employ as well. Older alumni can be attached tothe 7-point scale, and the news that the ad hoc committee had been formed caused some ofthem to compose letters to suggest that Princeton return to it. Perhaps the most thoughtfulcommentary came from the pen of Richard Etlin ’69 ∗72 ∗78, a professor emeritus at theUniversity of Maryland, who wrote to the committee in November 2013 and whose piece waspublished in slightly shortened form in the Princeton Alumni Weekly in January.
The committee took the issue seriously. In the end, however, we are not convinced thatchanging the currency, as it were, would affect the distribution of grades—and even if it did,slightly, the resulting confusion would not be worth it. It is true that normalization is a trivialmechanical operation—converting between a 7-point scale and a 4-point one, which is in effectwhat A–F is, is hardly difficult—but we are not comfortable with the assumption that all, oreven most, readers of applications would understand and look kindly on a non-standard sys-tem and take the time to make the adjustment. (Our closest peer with a non-standard systemis MIT, which has a 5-point scale; the registrar’s page provides a brief section titled “Conver-sion to a 4.0 Scale,” the gist of which is that 1 gets subtracted from every grade that is notan F.) Furthermore, taking the current policy, which has had the unfortunate effect of mak-ing Princeton look anomalous rather than visionary, and replacing it in whole or in part witha different anomaly would be unlikely to help matters—and might, furthermore, continue to
17
suggest to the outside world that Princeton cares more about its grading policy as such thanabout articulating something truly important, namely what exactly the differences are betweena piece of A work and one that earns an A−, not to mention a B+ or a B or a C or a D.
The University grading policy draws a sharp line between A-range and non-A-range grades.This has had the effect of making students even more worried than usual about the (necessarilyarbitrary) distinction between an A− and a B+ while also giving faculty little incentive to makeuse of the entire grading scale and give grades below, or much below, a B+. The committee hasno wish to increase the number of C’s and D’s for the sake of show but hopes that, whateverpolicy is adopted for the years ahead, faculty will feel comfortable making distinctions inquality other than between an A and an A− and between an A− and a B+.
There is, to be sure, also the matter of the A+, which is supposed to be the mark of trulyexceptional work. Questions abound. Should the A+ be more widely employed or should someother new “super grade” be added to the grading scale? Should faculty really be required tocomplete “A+ Statements”? And should an A+ count again as a 4.3, as it did until 2000? Mem-bers of the committee do not all agree on the answers, though on the whole we are satisfiedwith the current state of affairs.
There is one last thing to note. Princeton is unusual in calculating GPA as a purely internalmatter: the numbers are not made public, either on transcripts or elsewhere. Students thuscalculate their own GPA and report it as they wish. It is beyond the charge of the committeeto pronounce on the wisdom of this laissez-faire attitude, which might seem at odds with thefierceness with which the percentage of A-range grades has sometimes been policed; this—likethe matter of A+’s—is an issue the University may wish to revisit.
5.2 Intentionally inflate grades
One possibility that the committee considered was to actually encourage grade inflation, sothat the transcripts of Princeton’s students would be more in line with those of our peerinstitutions. Indeed, inflating grades could have many positive side effects, as discussed inSection 4: it could relieve anxiety among students, make them more competitive for externalfellowships, give them better job placement after graduation, etc. Some students and alumniexpressed the view that, by giving lower grades than our peer institutions, we are activelyharming our students.
However, as discussed in Section 4, the committee saw no clear evidence that our studentsare actually being harmed by having lower GPAs than their peers at Harvard and Yale (withthe possible exception of a small number of ROTC students). Furthermore, we felt the dele-terious effects of grade inflation are more insidious and serious than these more superficialadvantages.
The committee acknowledges that removing the numerical targets may lead to some up-ward creep in grades. This is why our recommendations include continued monitoring andreporting of grades by the dean of the college, as discussed in Sections 1.2 and 2.2.
5.3 Report more information on the transcript
The committee spent a lot of time discussing what an A grade means, and possible alternativesor supplements to letter grades. In spite of the official definition of an A grade, there is noobjective definition that is sufficiently operational that everyone would agree on its meaningand could apply it uniformly; indeed, the only thing that one can say for sure is that an A isbetter than a B.
18
The committee discussed a variety of alternatives that would either eliminate letter gradesor make them more meaningful. Among the options:
1. Publish the percentages of A’s in each class, or the percentages of all grades, perhaps inconjunction with other courses in the same department, division, or the whole Univer-sity. These percentages are currently provided to individual faculty, so they can comparetheir grades with those of their colleagues; the information could be made more widelyavailable—to students, on transcripts, etc.
2. Provide each student (and transcript) with the student’s ordinal position within the class,either precisely or some suitable percentile. Princeton already groups students by quin-tiles, for better or worse; this information could be used in place of or to supplementletter grades.
3. Provide two GPA computations, inside and outside. The outside grade would be in someunspecified way normalized against our peers, notably Harvard and Yale. This wouldrequire sharing information with other institutions and would seem to be fraught withperils.
The committee did not feel that any of these options would alleviate anxiety around gradesor soften the competitive atmosphere on campus.
5.4 Treat freshman year differently
Several peer institutions have used covered grading (MIT and Johns Hopkins) or pass/fail grad-ing (Caltech and Swarthmore) in the freshman year. Each policy has subtle differences, butthe basic idea is to report only pass/fail grades on the transcripts for the first semester offreshman year. Similarly, the earned grades do not count towards the student’s overall GPA.“Covered grades” mean that the students themselves and authorized university personnel haveaccess to the actual grades. At some institutions, the students may request that their actualgrades be sent to potential employers. Interestingly, Johns Hopkins recently voted to repeala covered grading policy because the policy created several significant academic problems.For example, in sequential courses, the students were often underprepared for the secondsemester, presumably because the first semester “did not count.” Grades provide strong in-centives to work hard, even to freshmen.
Overall, the committee foresaw several academic complications that might be created bypass/fail or covered grades and came to the conclusion that the freshman year adjustmentproblem, particularly for certain groups, is a complex issue that is not likely to be solved bysimple changes to the grading policy. In the end, the members concluded that the issue wasbeyond the scope of the committee and that the freshman year transition may merit a morein-depth analysis.
19

A Committee members
Name Title
Clancy Rowley (chair) Professor of Mechanical and Aerospace Engineering
Henry Farber Hughes-Rogers Professor of Economics and Director of theIndustrial Relations Section
Devin Fore Associate Professor of German
Alison Gammie Senior Lecturer in Molecular Biology
William Gleason Profesor of English and Chair of the Department of English
Joshua Katz Professor of Classics
Brian Kernighan Professor of Computer Science
Bess Ward William J. Sinclair Professor of Geosciences and Chair ofthe Department of Geosciences
Robert Wuthnow Gerhard R. Andlinger ’52 Professor of Social Sciences, Pro-fessor of Sociology, and Director of the Center for theStudy of Religion
Elizabeth Colagiuri (staff) Associate Dean of the College
20
B Charge to the committee
The evaluation of student work is a critical component of a liberal arts education. Faculty mem-bers expect students to submit their best work, and in turn, students expect faculty membersto provide timely, thoughtful and fair feedback that will foster their intellectual growth.
Nearly ten years ago, in April 2004, the Faculty adopted a University grading policy. Thepolicy recommends that each department, over time, award no more than 35% of A-rangegrades for course work, and no more than 55% of A-range grades for junior and senior inde-pendent work. The Faculty Committee on Grading has stated that
The grading policy has two fundamental objectives. The first is that the Princetonfaculty wants grading to be done in such a way that students in one academic de-partment can expect to be graded according to the same standards as students inany other academic department. . . . The second reason for the adoption of the grad-ing policy is the conviction that students deserve clear signals from their teachersabout the difference between their ordinarily good work and their very best work.
Since the implementation of the policy ten years ago, the number of A-range grades awardedacross departments has become much more consistent. Likewise, the grade inflation of the late’90s and early 2000s has been halted. Yet concerns persist that the grading policy may havehad unintended impacts upon the undergraduate academic experience that are not consistentwith our broader educational goals.
The University periodically reviews major policies to determine whether they continue toserve its mission. The tenth anniversary of the grading policy’s enactment is an appropriatetime to undertake such a review. I have accordingly asked a committee of faculty members tospend the next year exploring a set of broad questions about the evaluation of student work:
1. Do the objectives of the Grading Policy, as recapitulated by the Faculty Committee onGrading, remain the appropriate ones against which to judge Princeton’s assessmentpractices?
2. Does the current Policy achieve the University’s pedagogical goals effectively and with asfew negative consequences as possible, or are there better ways to do so?
I would ask the Committee, in the course of its deliberations, to consider any available evi-dence about the effects that the current policy might have on levels of feedback that studentsreceive on academic work; the success of Princeton students with regard to employment pro-cesses and graduate school admissions; and the attitude of students toward their academicwork and their peers. I would also ask the Committee to consider whether a grading policymight achieve Princeton’s aims more effectively, and with fewer side effects, if it were to focuson clear standards, thoughtful rubrics and effective feedback, with less emphasis on numericaltargets.
I expect that the Committee will consult broadly with the University community aboutthe questions pending before it. I will ask the Committee to conclude its deliberations byrecommending to the faculty any changes to the University’s grading policies that would, inthe Committee’s judgment, improve our assessment practices, our pedagogy, and our generallearning environment.
21

C Survey results
22
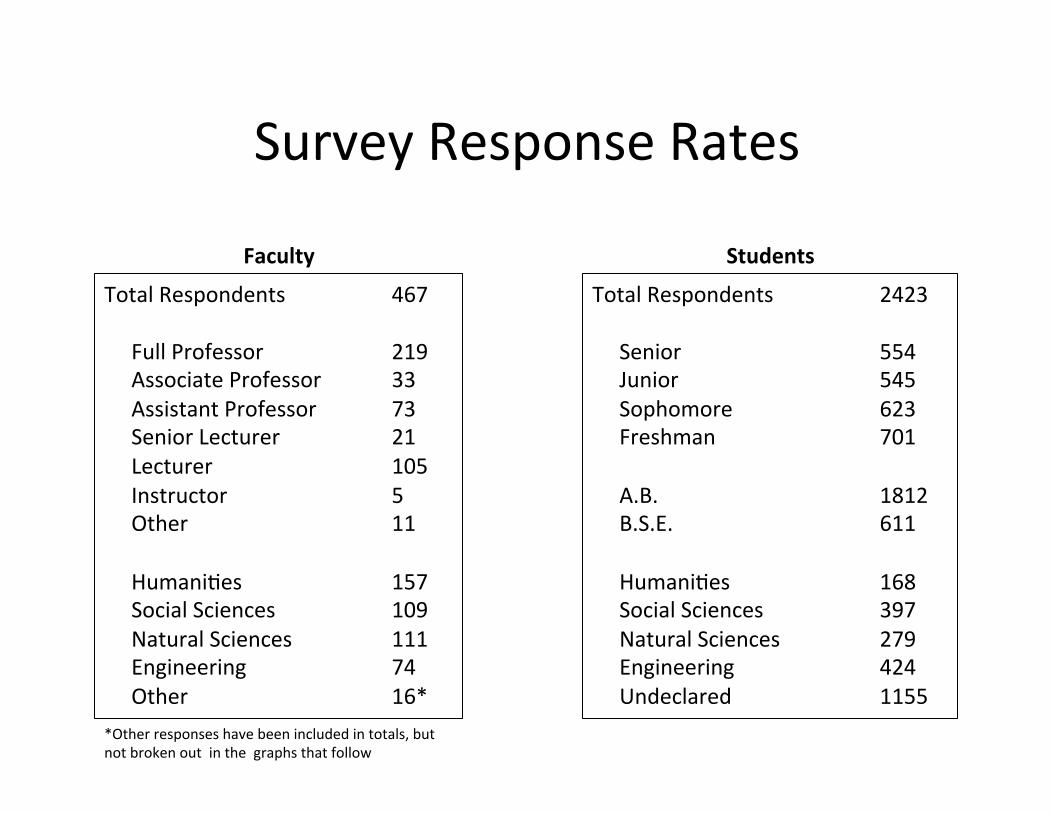
Survey Response Rates
Faculty Students
Total Respondents 467 Full Professor 219 Associate Professor 33 Assistant Professor 73 Senior Lecturer 21 Lecturer 105 Instructor 5 Other 11 HumaniJes 157 Social Sciences 109 Natural Sciences 111 Engineering 74 Other 16*
Total Respondents 2423 Senior 554 Junior 545 Sophomore 623 Freshman 701 A.B. 1812 B.S.E. 611 HumaniJes 168 Social Sciences 397 Natural Sciences 279 Engineering 424 Undeclared 1155
*Other responses have been included in totals, but not broken out in the graphs that follow

Q1A. To what extent do you agree or disagree with the following statement? Students in one academic department should be graded according to the same standards as students in any other department.
Faculty Students
Count 156 107 110 73 462 Count 168 394 277 422 1149 2410
17% 30% 29% 29% 25%
32%
32% 41%
36% 35%
15%
18% 12% 23%
16%
26%
15% 12% 10%
17%
10% 6% 6% 3% 7%
0%
10%
20%
30%
40%
50%
60%
70%
80%
90%
100%
HumaniJes Social Sciences
Natural Sciences
Engineering Total
Strongly Disagree
Disagree
Neither Agree nor Disagree
Agree
Strongly Agree 23%
33% 38% 42%
27% 32%
32%
35% 38% 34%
37% 36%
21%
13% 11% 8%
13% 12%
15% 14%
9% 13% 19% 16%
9% 4% 4% 3% 4% 4%
0%
10%
20%
30%
40%
50%
60%
70%
80%
90%
100%
HumaniJes Social Sciences
Natural Sciences
Engineering Undeclared Total
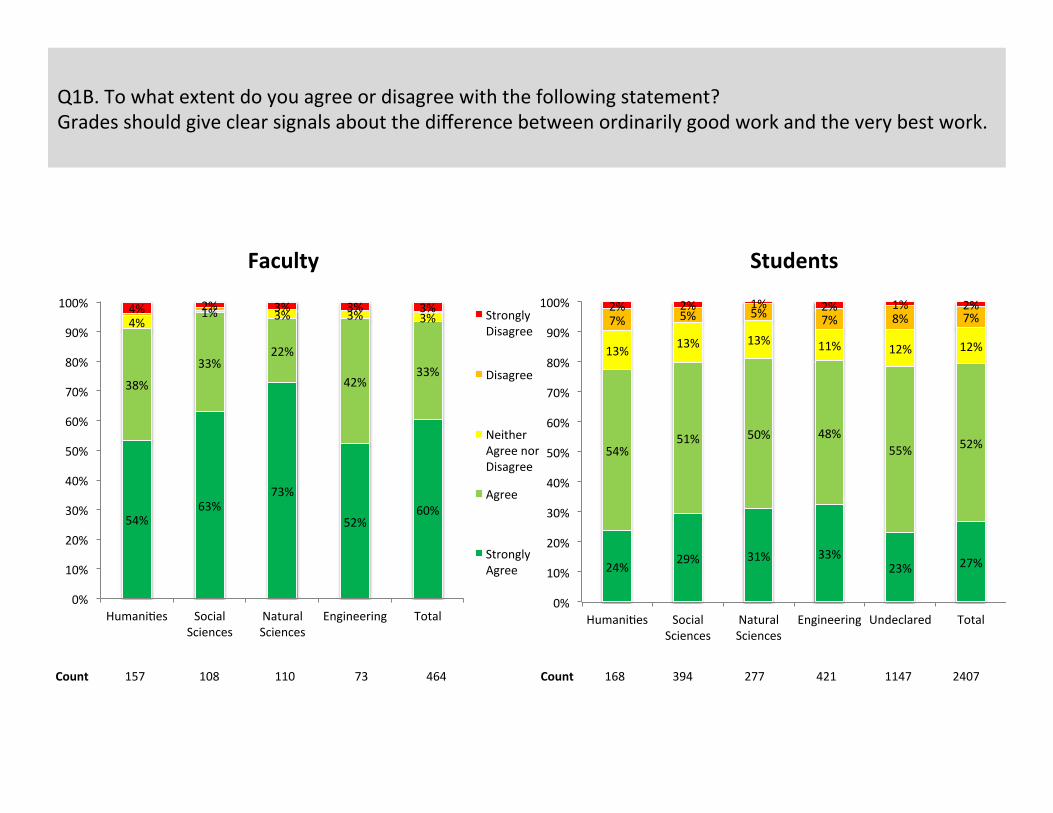
Q1B. To what extent do you agree or disagree with the following statement? Grades should give clear signals about the difference between ordinarily good work and the very best work.
Faculty Students
Count 157 108 110 73 464 Count 168 394 277 421 1147 2407
54% 63%
73%
52% 60%
38%
33% 22%
42% 33%
4% 1% 3% 3% 3%
4% 2% 3% 3% 3%
0%
10%
20%
30%
40%
50%
60%
70%
80%
90%
100%
HumaniJes Social Sciences
Natural Sciences
Engineering Total
Strongly Disagree
Disagree
Neither Agree nor Disagree
Agree
Strongly Agree 24%
29% 31% 33% 23% 27%
54% 51% 50% 48%
55% 52%
13% 13% 13% 11% 12% 12%
7% 5% 5% 7% 8% 7% 2% 2% 1% 2% 1% 2%
0%
10%
20%
30%
40%
50%
60%
70%
80%
90%
100%
HumaniJes Social Sciences
Natural Sciences
Engineering Undeclared Total

Q2A. How effecJve do you feel the grading policy has been in meeJng the following objecJve? Students in one academic department are graded according to the same standards as students in any other department.
Faculty Students
Count 140 96 101 69 419 Count 166 395 278 416 1135 2390
2% 5% 13% 7% 6%
26%
35% 33%
36% 32%
25%
32% 27% 33%
28%
24%
14% 18% 12%
18%
24% 14% 10% 12% 16%
0%
10%
20%
30%
40%
50%
60%
70%
80%
90%
100%
HumaniJes Social Sciences
Natural Sciences
Engineering Total
IneffecJve
Somewhat IneffecJve
Neither EffecJve nor IneffecJve
Somewhat EffecJve
EffecJve
7% 5% 4% 5% 5% 5%
19% 15% 17% 19% 21% 19%
20%
19% 15% 14%
24% 20%
27% 35%
33% 32%
31% 32%
27% 27% 31% 30% 19% 24%
0%
10%
20%
30%
40%
50%
60%
70%
80%
90%
100%
HumaniJes Social Sciences
Natural Sciences
Engineering Undeclared Total

Q2B. How effecJve do you feel the grading policy has been in meeJng the following objecJve? Grades give clear signals about the difference between ordinarily good work and the very best work.
Faculty Students
Count 149 103 103 71 441 Count 167 395 278 418 1136 2394
14% 18% 23% 20% 18%
50% 50%
52% 49% 51%
13% 16%
14% 23% 15%
12%
11% 7% 4%
9% 11%
5% 4% 4% 7%
0%
10%
20%
30%
40%
50%
60%
70%
80%
90%
100%
HumaniJes Social Sciences
Natural Sciences
Engineering Total
IneffecJve
Somewhat IneffecJve
Neither EffecJve nor IneffecJve
Somewhat EffecJve
EffecJve 18% 14% 10% 16% 18% 16%
31% 32% 41%
39% 35% 35%
14% 14%
19% 17%
15% 16%
27% 24%
20% 19% 20% 21%
10% 16%
10% 9% 12% 12%
0%
10%
20%
30%
40%
50%
60%
70%
80%
90%
100%
HumaniJes Social Sciences
Natural Sciences
Engineering Undeclared Total

Q3A/B. STUDENTS: Based on your experience during your Jme at Princeton, to what extent do you agree with the following statements?
Across the courses I have taken, I have been graded according to the same
standards
Count 692 616 543 553 2404 Count 691 614 541 554 2400
The grades in the courses I have taken have given me clear signals about the quality of my
work
3% 2% 2% 1% 2%
25% 14% 11% 12%
16%
20%
16% 10% 12%
15%
41%
46%
45% 42%
43%
12% 22%
32% 32% 24%
0%
10%
20%
30%
40%
50%
60%
70%
80%
90%
100%
Freshman Sophomore Junior Senior Total
Strongly Disagree
Disagree
Neither Agree nor Disagree
Agree
Strongly Agree 8% 6% 4% 5% 6%
37%
27% 29% 34% 32%
22%
23% 23% 21% 22%
24%
30% 31% 25% 28%
9% 14% 13% 14% 12%
0%
10%
20%
30%
40%
50%
60%
70%
80%
90%
100%
Freshman Sophomore Junior Senior Total
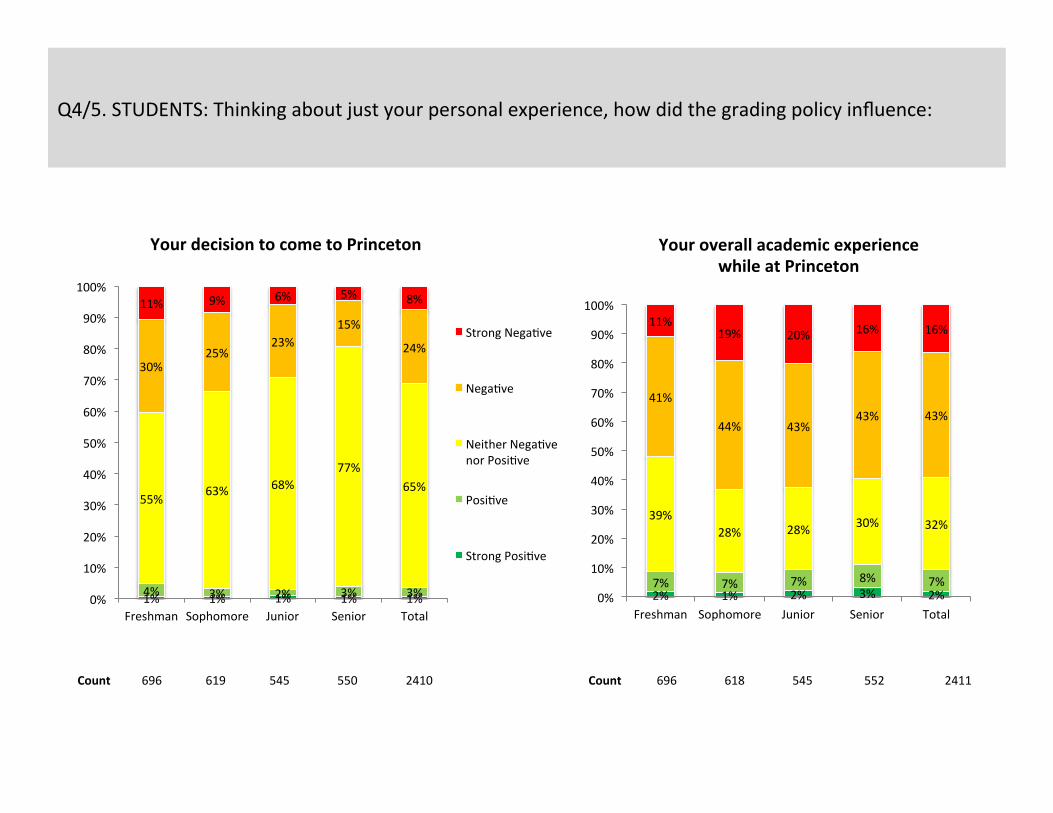
Q4/5. STUDENTS: Thinking about just your personal experience, how did the grading policy influence:
Your decision to come to Princeton
Count 696 619 545 550 2410 Count 696 618 545 552 2411
Your overall academic experience while at Princeton
1% 1% 1% 1% 1% 4% 3% 2% 3% 3%
55% 63% 68%
77% 65%
30% 25%
23% 15%
24%
11% 9% 6% 5% 8%
0%
10%
20%
30%
40%
50%
60%
70%
80%
90%
100%
Freshman Sophomore Junior Senior Total
Strong NegaJve
NegaJve
Neither NegaJve nor PosiJve
PosiJve
Strong PosiJve
2% 1% 2% 3% 2% 7% 7% 7% 8% 7%
39% 28% 28% 30% 32%
41%
44% 43% 43% 43%
11% 19% 20% 16% 16%
0%
10%
20%
30%
40%
50%
60%
70%
80%
90%
100%
Freshman Sophomore Junior Senior Total

Q6. STUDENTS: During your Jme at Princeton, how oaen have your professors and/or other instructors (preceptors, lab instructors, language instructors, et al.) done each of the following? * indicates that “Not Applicable” responses have not been reported.
Discussed or provided their standards/guidelines for grading
Given you a non-‐A course grade you felt was the result of the grading policy
When quesHoned about a non-‐A course grade, provided you with specific feedback on your work in the course*
When quesHoned about a non-‐A course grade, said the grading policy prevented them from giving more A grades*
Count 328 349 291 309 1277 Count 337 361 320 322 1340
Count 693 608 543 551 2395 Count 694 616 544 552 2406
28% 24% 20% 21% 24%
37% 36% 37% 36% 36%
30% 37% 39% 38% 36%
5% 4% 4% 3% 4%
0%
20%
40%
60%
80%
100%
Freshman Sophomore Junior Senior Total
Not Applicable
Never
Occasionally
Oaen
Very Oaen 19% 10% 11% 14% 14%
35% 44% 42%
43% 41%
23% 23% 25% 22% 23%
14% 20% 20% 18% 18% 8% 3% 2% 2% 4%
0%
20%
40%
60%
80%
100%
Freshman Sophomore Junior Senior Total
Not Applicable
Very Oaen
Oaen
Occasionally
Never
7% 6% 3% 5% 5%
18% 21% 13% 16% 17%
36% 45%
51% 52% 46%
39% 27% 33% 28% 32%
0%
20%
40%
60%
80%
100%
Freshman Sophomore Junior Senior Total
Never
Occasionally
Oaen
Very Oaen
46% 39% 31% 37% 38%
21% 27%
33% 36% 29%
15% 19% 22% 15%
18%
18% 16% 15% 12% 15%
0%
20%
40%
60%
80%
100%
Freshman Sophomore Junior Senior Total
Very Oaen
Oaen
Occasionally
Never
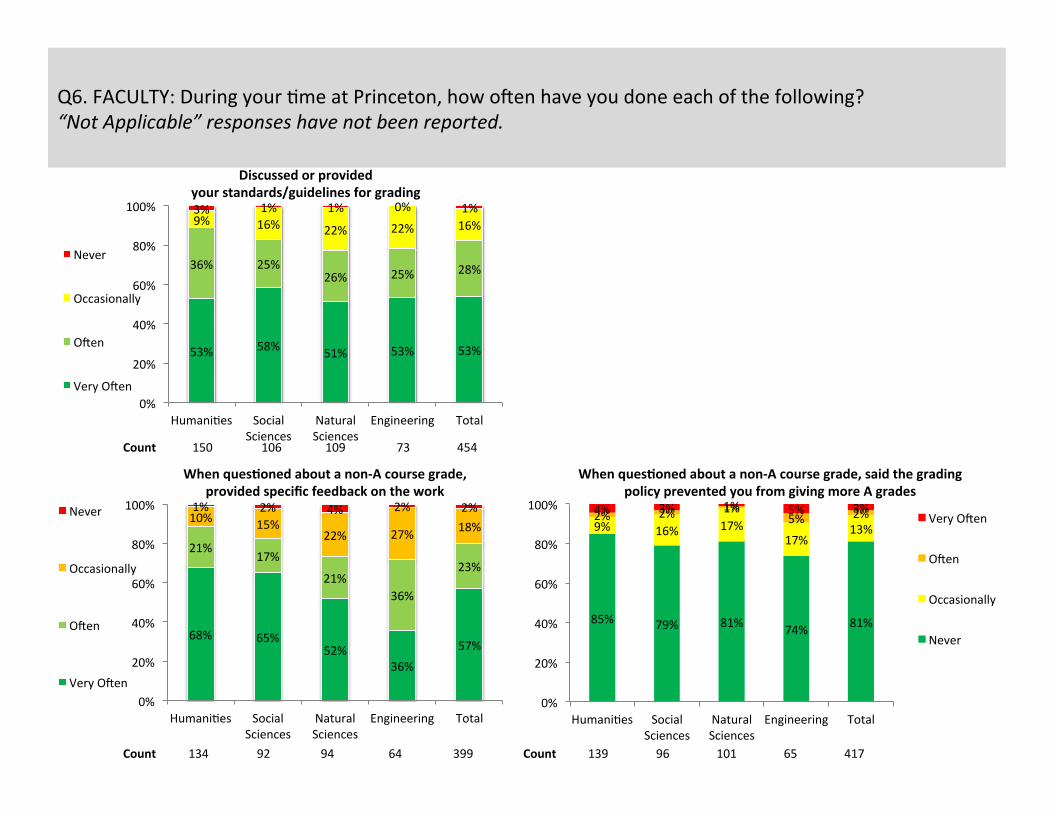
Q6. FACULTY: During your Jme at Princeton, how oaen have you done each of the following? “Not Applicable” responses have not been reported.
Discussed or provided your standards/guidelines for grading
When quesHoned about a non-‐A course grade, provided specific feedback on the work
When quesHoned about a non-‐A course grade, said the grading policy prevented you from giving more A grades
Count 134 92 94 64 399 Count 139 96 101 65 417
Count 150 106 109 73 454
53% 58% 51% 53% 53%
36% 25% 26% 25% 28%
9% 16% 22% 22% 16% 3% 1% 1% 0% 1%
0%
20%
40%
60%
80%
100%
HumaniJes Social Sciences
Natural Sciences
Engineering Total
Never
Occasionally
Oaen
Very Oaen
68% 65% 52%
36% 57%
21% 17%
21% 36%
23%
10% 15% 22% 27% 18%
1% 2% 4% 2% 2%
0%
20%
40%
60%
80%
100%
HumaniJes Social Sciences
Natural Sciences
Engineering Total
Never
Occasionally
Oaen
Very Oaen
85% 79% 81% 74% 81%
9% 16% 17% 17%
13% 2% 2% 1%
5% 2% 4% 3% 1% 5% 3%
0%
20%
40%
60%
80%
100%
HumaniJes Social Sciences
Natural Sciences
Engineering Total
Very Oaen
Oaen
Occasionally
Never

Q7. FACULTY: The current grading policy, which provides guidelines on the percentage of A grades awarded, was approved by the Faculty in April 2004.
What was your posiHon on the grading policy in April 2004?
Count 76 59 71 46 259 Count 155 109 110 74 464
What is your posiHon on the grading policy now?
9%
27% 39%
15% 24%
25%
25%
28%
26%
26% 16%
15%
17%
15%
15% 25%
15%
10%
37% 20%
25% 17%
6% 7% 15%
0%
20%
40%
60%
80%
100%
HumaniJes Social Sciences
Natural Sciences
Engineering Total
Strongly Opposed
Somewhat Opposed
Neither Opposed nor In Favor
Somewhat In Favor
Strongly In Favor
10%
25% 32%
23% 21%
23%
27%
29%
27% 26% 15%
19%
15%
9% 16%
30%
17% 19%
27% 23%
21% 12%
5% 14% 14%
0%
20%
40%
60%
80%
100%
HumaniJes Social Sciences
Natural Sciences
Engineering Total

FACULTY: Have you personally experienced any negaJve effects from the grading policy? Have you personally experienced any posiJve effects from the grading policy? Do you have specific suggesJons for improving Princeton's grading policy?
STUDENTS: Have you personally experienced any negaJve effects from the grading policy? Have you personally experienced any posiJve effects from the grading policy? Do you have specific suggesJons for improving Princeton's grading policy?

The public comment website received 211 submissions—half from undergraduate alumni, one-‐fiah from current undergraduates, and one-‐sixth from parents.
44%
36%
12%
4% 4%
Grades should give clear signals about the difference between ordinarily good work and the very best work.
35%
34%
8%
11%
12%
Students in one academic department should be graded according to
the same standards as students in any other department. 2%
12%
25%
34%
27%
Students in one academic department are graded according to the same standards as students in any other department.
8%
25%
20%
29%
18%
Grades give clear signals about the difference between ordinarily good work and the very best work.
Goals EffecJveness