Embed Size (px)
Citation preview
Congressional Research Service ˜ The Library of Congress
Report for CongressReceived through the CRS Web
Order Code RL30947
U.S. Tobacco Production, Consumption, and Export Trends
Updated June 3, 2003
Jasper WomachAgriculture Policy Specialist
Resources, Science, and Industry Division
U.S. Tobacco Production, Consumption, and Export Trends
Summary
Examination of historical tobacco data reveals a declining long-term trend in theutilization of tobacco by U.S. manufacturers and leaf exporters. While world tobaccoexports increased over the past two decades, U.S. leaf tobacco exports declined inrelative and absolute terms. Cigarette manufacturers have been increasing the use ofless expensive foreign tobacco and decreasing the use of more costly U.S.-growntobacco. Now, actions taken as a result of the 1998 Master Settlement Agreementbetween cigarette manufacturers and states’ attorneys general are further diminishingthe consumption of tobacco products in the United States. Cigarette exports alsohave been declining recently in contrast to a history of growth.
! Total utilization of U.S.-grown tobacco has been declining since 1975, from1.941 billion pounds to 1.121 billion pounds in 2001 (a 42% drop in the farmweight).
! Exports of tobacco leaf peaked in 1978 at 765 million pounds (farm weight),and then declined to an estimated 399 million pounds in 2002. This declineoccurred during a time when world exports were growing. The U.S. share ofworld exports has declined from 27% in 1969 to 7% in 2002.
! Even when U.S. cigarette manufacturing output was growing, the use ofdomestic leaf was declining. Manufacturing use declined from 1.6 billionpounds in 1952 to 688 million pounds in 2001. Use of domestic leaf tobaccohas declined because: the amount of tobacco in each cigarette is now about40% less than what it was 45 years ago; the total number of cigarettesconsumed in the United States has declined from 640 billion in 1981 to anestimated 420 billion in 2002; and cigarettes now contain only about 52%domestic tobacco while they once contained more than 90% (a reflection ofthe declining competitiveness of U.S.-grown tobacco).
! The only growth market for U.S. tobacco since 1984 has been through theexport of cigarettes. Cigarette exports climbed from less than 60 billion in theearly 1980s to 244 billion in 1996. This market has since declined to 127billion in 2002. The drop in cigarette exports is the equivalent of about 119million pounds of U.S.-grown tobacco.
! The federal tobacco price support program keeps U.S. tobacco prices higherthan they would otherwise be and encourages the use of less expensive foreigntobacco. Foreign producers have been increasing the quantity and improvingthe quality of their tobacco. In 2002, imported cigarette tobacco was deliveredto the United States for about 40% of the cost of U.S.-grown tobacco.
! The farm price of tobacco and the total value of production have trendedupward when measured in current dollars. However, since 1980 reducedoutput and inflation have caused a decline in the inflation-adjusted value.

Contents
Overview . . . . . . . . . . . . . . . . . . . . . . . . . . . . . . . . . . . . . . . . . . . . . . . . . . . . . . . . 1U.S. Tobacco Production and Farm Revenue . . . . . . . . . . . . . . . . . . . . . . . . . . . . 5Utilization of U.S.-Grown Tobacco . . . . . . . . . . . . . . . . . . . . . . . . . . . . . . . . . . . 12U.S. Tobacco Leaf Exports . . . . . . . . . . . . . . . . . . . . . . . . . . . . . . . . . . . . . . . . . 13Manufacturing Use of Leaf Tobacco . . . . . . . . . . . . . . . . . . . . . . . . . . . . . . . . . . 17Cigarette Production . . . . . . . . . . . . . . . . . . . . . . . . . . . . . . . . . . . . . . . . . . . . . . 18Cigarette Consumption . . . . . . . . . . . . . . . . . . . . . . . . . . . . . . . . . . . . . . . . . . . . 19U.S. Consumption of U.S.-Grown Cigarette Tobacco . . . . . . . . . . . . . . . . . . . . . 22Cigarette Exports . . . . . . . . . . . . . . . . . . . . . . . . . . . . . . . . . . . . . . . . . . . . . . . . . 26
List of Figures
Figure 1. U.S. Tobacco Production . . . . . . . . . . . . . . . . . . . . . . . . . . . . . . . . . . . . 5Figure 2. U.S. Tobacco Acreage . . . . . . . . . . . . . . . . . . . . . . . . . . . . . . . . . . . . . . 6Figure 3. Farms Growing Tobacco in the U.S. . . . . . . . . . . . . . . . . . . . . . . . . . . . 7Figure 4. Average Farm Price for Leaf Tobacco . . . . . . . . . . . . . . . . . . . . . . . . . . 8Figure 5. Farm Value of Tobacco Production . . . . . . . . . . . . . . . . . . . . . . . . . . . . 9Figure 6. Deflated Average Farm Price for Leaf Tobacco . . . . . . . . . . . . . . . . . 10Figure 7. Deflated Farm Value of the U.S. Tobacco Crop . . . . . . . . . . . . . . . . . 11Figure 8. Utilization (Manufacture and Export) of U.S.-Grown Tobacco . . . . . 12Figure 9. Exports of U.S.-Grown Tobacco . . . . . . . . . . . . . . . . . . . . . . . . . . . . . 13Figure 10. U.S. Tobacco Exports as Share of World Total Exports . . . . . . . . . . 14Figure 11. Domestic Manufacturing Use of U.S.-Grown Tobacco . . . . . . . . . . 17Figure 12. U.S. Cigarette Production . . . . . . . . . . . . . . . . . . . . . . . . . . . . . . . . . 18Figure 13. U.S. Cigarette Consumption . . . . . . . . . . . . . . . . . . . . . . . . . . . . . . . 19Figure 14. Cigarette Smoking Prevalence of the U.S. Adult Population . . . . . . 20Figure 15. Number of Adult Smokers in the U.S. Population . . . . . . . . . . . . . . 21Figure 16. Total Tobacco Consumed by U.S. Smokers . . . . . . . . . . . . . . . . . . . 22Figure 17. Tobacco Content of U.S.-Manufactured Cigarettes . . . . . . . . . . . . . 23Figure 18. Share of Imported Tobacco in U.S.-Manufactured Cigarettes . . . . . 24Figure 19. Consumption of U.S.-Grown Tobacco by U.S. Smokers . . . . . . . . . 25Figure 20. World Cigarette Exports . . . . . . . . . . . . . . . . . . . . . . . . . . . . . . . . . . 26Figure 21. U.S. Cigarette Exports as Share of Foreign Consumption . . . . . . . . 27Figure 22. U.S. Cigarette Exports . . . . . . . . . . . . . . . . . . . . . . . . . . . . . . . . . . . . 28Figure 23. Exported Cigarettes as Share of U.S. Output . . . . . . . . . . . . . . . . . . 29Figure 24. U.S. Share of World Cigarette Exports . . . . . . . . . . . . . . . . . . . . . . . 30
List of Tables
Table 1. Farms, Acres, and Average Acres of Tobacco, by State, 1997 . . . . . . . . 3Table 2. Selected U.S. and World Tobacco Statistics, 1998-2002 . . . . . . . . . . . . 4

1 Unless otherwise noted, basic data are from the U.S. Department of Agriculture’sEconomic Research Service (ERS) and Foreign Agriculture Service (FAS). Historical dataare published in U.S. Tobacco Statistics, 1935-92, ERS Statistical Bulletin Number 869,April 1994. Current data are published in recent issues of ERS’s Tobacco Situation andOutlook and FAS’s Tobacco: World Markets and Trade.2 In many cases, the data plotted in the numerous graphs are interrelated. Several graphssimply offer different ways of viewing the same factor. It would be a mistake to see the dataas additive. The trend lines are constructed using linear regression to create a “best fit” andthe R-squared (R2) value of the trend line (listed with each graph) measures how well theactual data fit the trend line. Sizable and important deviations from the trend line may havelittle impact on the R2 because of the numerous observations in the time series. The closerR2 is to 1.0, the closer the data and the trend line are to a perfect fit. However, even aperfect fit does not impart predictive value to a time series correlation. A trend line isvisually helpful in identifying the directional momentum (i.e., increasing, decreasing,constant) of the data, not in making forecasts. The functional form of the linear equationused to construct the trend lines is: y = a + b1x + b2x
2.
U.S. Tobacco Production, Consumption, and Export Trends
Overview
This report portrays the current supply and demand situation for U.S. tobaccoin the context of historical trends.1 An examination of historical patterns combinedwith the knowledge of current forces shaping domestic and export demand for U.S.tobacco underscores the pessimism heard from farmers about prospects for the future.Farmers and rural communities in tobacco regions have received some and areseeking additional economic adjustment assistance, and the reasons why are madeobvious by the data.
Graphical presentations of historical data show the time path that has broughtthe U.S. tobacco industry to its current situation. In addition, with the aid of linearregression techniques, trend lines are plotted that project through the year 2005.These trend lines are not intended as predictions of the future and they are notconstructed from explanatory models of the tobacco economy. The trend lineprojections assume that the forces in place in the past will continue without change.Changes in consumer preferences, changes in regulations or laws that affectconsumption or international trade, or large changes in purchasing power, if theyoccur, can be expected to substantially alter the projections from the trend lines.2
A number of forces already are in place and others could arise that likely willshift the utilization of U.S. tobacco below the historical trend. It is not the purposeof this report to analyze these forces, but some of the obvious ones are listed andshould temper any evaluation of the time-series projections.

CRS-2
Contributing to an outlook of substantially reduced U.S. demand for tobaccoproducts is the November 1998 Master Settlement Agreement (MSA) betweencigarette manufacturers and states’ attorneys general. The MSA requiresmanufacturers to pay $206 billion over 26 years to states. The manufacturers haveraised wholesale prices 67¢ per pack primarily to help meet their MSA obligations.Furthermore, while states individually will determine how to spend the funds, someportion likely will be used to discourage smoking.
Tobacco farmers anticipated that the MSA would negatively impact productionand therefore the economic welfare of themselves and their communities. In fact, theutilization of U.S.-grown tobacco has dropped more than expected from domesticcigarette price increases alone. In 1997, U.S. tobacco production was 1.787 billionpounds and by 2002 it was down to 890 million pounds – a 50% decline in five years.
Federal and state excise taxes also continue to increase. The federal excise taxincreased to $0.34 per pack on January 1, 2000, and to $0.39 on January 1, 2002.State and local excise taxes vary widely but the weighted average was $0.42 per packover the 2001/02 period. The highest tax rate as of January 1, 2003, was $1.51 perpack in Massachusetts and the lowest was 2.5¢ per pack in Virginia.
Health education and anti-smoking efforts are developing in many othercountries, and these could negatively influence global consumption and trade. InMay 2003, the World Health Organization adopted the Framework Convention onTobacco Control (FCTC) aimed at curbing tobacco-related deaths and disease.
U.S. leaf tobacco has long been losing competitive strength in global exportmarkets. The primary reason is the high price for U.S. tobacco, caused by the federalprice support program. The quality characteristics that have long made U.S. tobaccomore valuable than tobacco from other countries are becoming less important. Thequality of foreign tobacco is improving. Also, cigarette manufacturers have learnedhow to utilize lower quality tobacco in cigarettes without adversely impacting on thefinal product.
Export markets long have been the growth opportunity for U.S.-manufacturedcigarettes. Now it appears that world cigarette markets are likely to be supplied thelight blend American style cigarette from overseas plants, many owned by U.S.companies.
Tobacco farmers and their communities want and have received some assistanceto help offset the decline in sales revenues associated with reduced production.While not included in the MSA, the manufacturers did agree to give tobacco farmers$5.15 billion over 12 years as compensation in order to help them adjust (called thePhase II Settlement). In addition, Congress provided $328 million in compensationto tobacco farmers for the reductions in marketing quotas in 1999 (P.L. 106-78, Sec.803(c)), $340 million in 2000 (P.L. 106-224, Sec. 204(b), $129 million in 2001 (P.L.107-25, Sec. 4), and $53 million in 2003 (P.L. 108-7, Division N, Title II, Sec. 205).In other legislation (P.L. 106-387, Sec. 844), the large inventory of 1999 crop burleytobacco under price support loan was turned over to the federal government andlikely will never be marketed. (See CRS Report RS20802, Tobacco FarmerAssistance.)
CRS-3
Policy makers are now examining a range of alternatives to provide assistancein the future. Farmer assistance options range from compensatory payments forquota reductions (as was done for the 1999 and 2000 crops) to quota buyouts (anoption debated by Congress in 1998, 2002, and 2003 (see CRS Report RL31790,Tobacco Quota Buyout Proposals in the 108th Congress). Other suggestions includehelping farmers to shift to alternative agricultural enterprises, non-farm businessdevelopment, training for non-farm occupations, household income support, andpossibly even support for the economic infrastructure and social services that willsuffer with a shrinking tobacco economy.
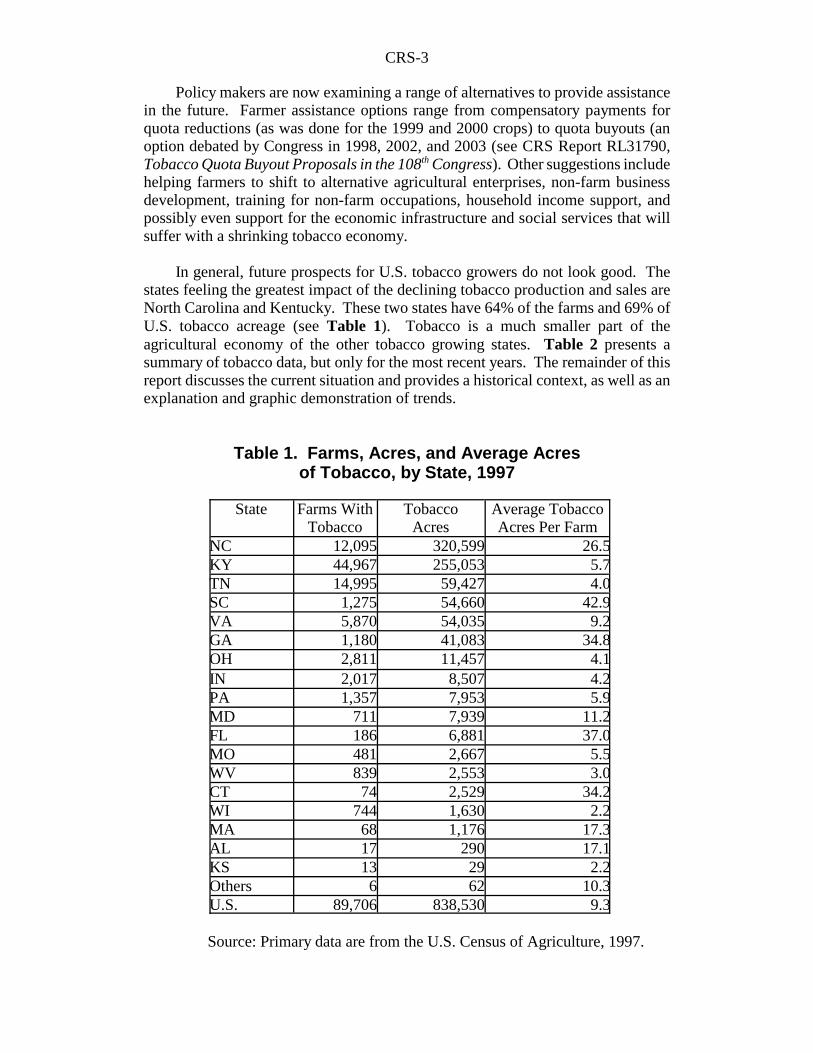
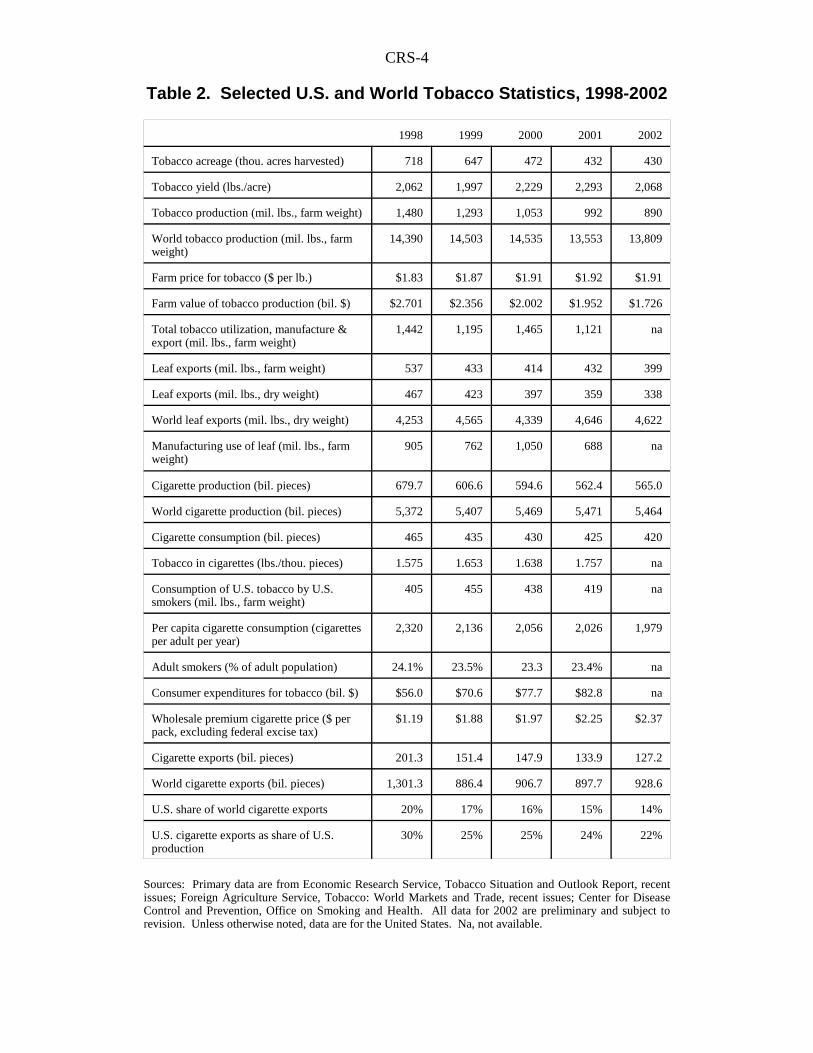
In general, future prospects for U.S. tobacco growers do not look good. Thestates feeling the greatest impact of the declining tobacco production and sales areNorth Carolina and Kentucky. These two states have 64% of the farms and 69% ofU.S. tobacco acreage (see Table 1). Tobacco is a much smaller part of theagricultural economy of the other tobacco growing states. Table 2 presents asummary of tobacco data, but only for the most recent years. The remainder of thisreport discusses the current situation and provides a historical context, as well as anexplanation and graphic demonstration of trends.
Table 1. Farms, Acres, and Average Acresof Tobacco, by State, 1997
State Farms WithTobacco
TobaccoAcres
Average TobaccoAcres Per Farm
NC 12,095 320,599 26.5KY 44,967 255,053 5.7TN 14,995 59,427 4.0SC 1,275 54,660 42.9VA 5,870 54,035 9.2GA 1,180 41,083 34.8OH 2,811 11,457 4.1IN 2,017 8,507 4.2PA 1,357 7,953 5.9MD 711 7,939 11.2FL 186 6,881 37.0MO 481 2,667 5.5WV 839 2,553 3.0CT 74 2,529 34.2WI 744 1,630 2.2MA 68 1,176 17.3AL 17 290 17.1KS 13 29 2.2Others 6 62 10.3U.S. 89,706 838,530 9.3
Source: Primary data are from the U.S. Census of Agriculture, 1997.
CRS-4
Table 2. Selected U.S. and World Tobacco Statistics, 1998-2002
1998 1999 2000 2001 2002
Tobacco acreage (thou. acres harvested) 718 647 472 432 430
Tobacco yield (lbs./acre) 2,062 1,997 2,229 2,293 2,068
Tobacco production (mil. lbs., farm weight) 1,480 1,293 1,053 992 890
World tobacco production (mil. lbs., farmweight)
14,390 14,503 14,535 13,553 13,809
Farm price for tobacco ($ per lb.) $1.83 $1.87 $1.91 $1.92 $1.91
Farm value of tobacco production (bil. $) $2.701 $2.356 $2.002 $1.952 $1.726
Total tobacco utilization, manufacture &export (mil. lbs., farm weight)
1,442 1,195 1,465 1,121 na
Leaf exports (mil. lbs., farm weight) 537 433 414 432 399
Leaf exports (mil. lbs., dry weight) 467 423 397 359 338
World leaf exports (mil. lbs., dry weight) 4,253 4,565 4,339 4,646 4,622
Manufacturing use of leaf (mil. lbs., farmweight)
905 762 1,050 688 na
Cigarette production (bil. pieces) 679.7 606.6 594.6 562.4 565.0
World cigarette production (bil. pieces) 5,372 5,407 5,469 5,471 5,464
Cigarette consumption (bil. pieces) 465 435 430 425 420
Tobacco in cigarettes (lbs./thou. pieces) 1.575 1.653 1.638 1.757 na
Consumption of U.S. tobacco by U.S.smokers (mil. lbs., farm weight)
405 455 438 419 na
Per capita cigarette consumption (cigarettesper adult per year)
2,320 2,136 2,056 2,026 1,979
Adult smokers (% of adult population) 24.1% 23.5% 23.3 23.4% na
Consumer expenditures for tobacco (bil. $) $56.0 $70.6 $77.7 $82.8 na
Wholesale premium cigarette price ($ perpack, excluding federal excise tax)
$1.19 $1.88 $1.97 $2.25 $2.37
Cigarette exports (bil. pieces) 201.3 151.4 147.9 133.9 127.2
World cigarette exports (bil. pieces) 1,301.3 886.4 906.7 897.7 928.6
U.S. share of world cigarette exports 20% 17% 16% 15% 14%
U.S. cigarette exports as share of U.S.production
30% 25% 25% 24% 22%
Sources: Primary data are from Economic Research Service, Tobacco Situation and Outlook Report, recentissues; Foreign Agriculture Service, Tobacco: World Markets and Trade, recent issues; Center for DiseaseControl and Prevention, Office on Smoking and Health. All data for 2002 are preliminary and subject torevision. Unless otherwise noted, data are for the United States. Na, not available.
CRS-5
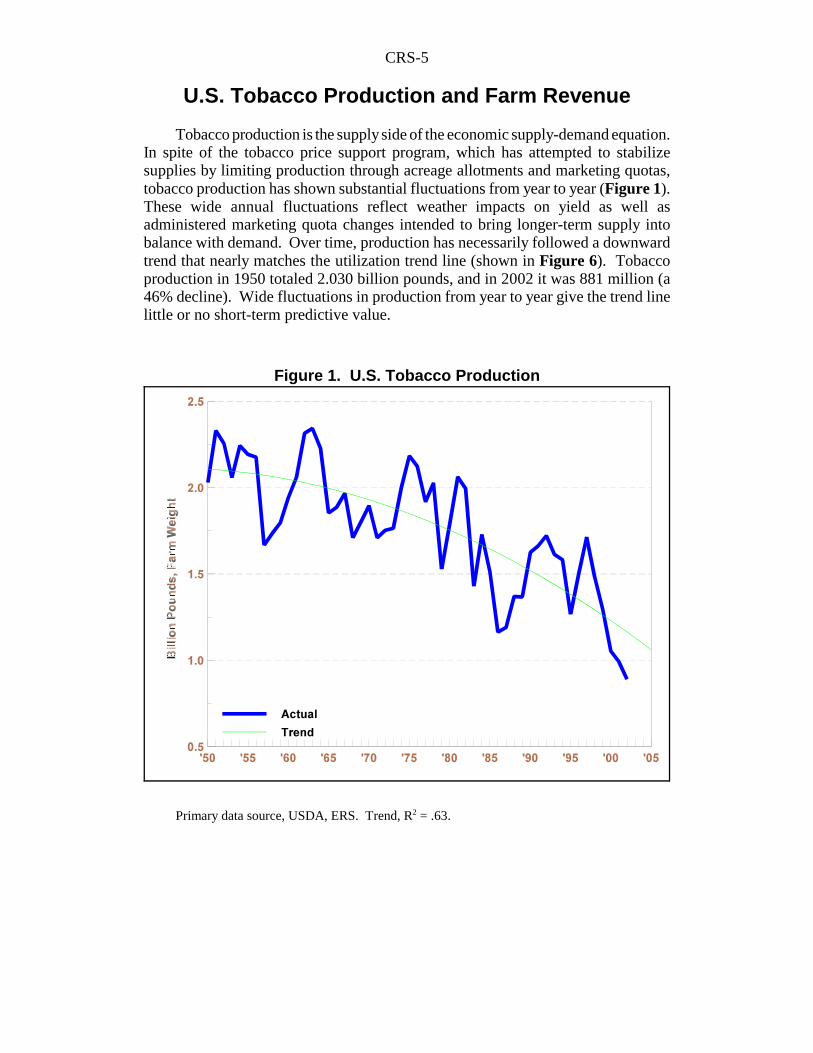
Figure 1. U.S. Tobacco Production
U.S. Tobacco Production and Farm Revenue
Tobacco production is the supply side of the economic supply-demand equation.In spite of the tobacco price support program, which has attempted to stabilizesupplies by limiting production through acreage allotments and marketing quotas,tobacco production has shown substantial fluctuations from year to year (Figure 1).These wide annual fluctuations reflect weather impacts on yield as well asadministered marketing quota changes intended to bring longer-term supply intobalance with demand. Over time, production has necessarily followed a downwardtrend that nearly matches the utilization trend line (shown in Figure 6). Tobaccoproduction in 1950 totaled 2.030 billion pounds, and in 2002 it was 881 million (a46% decline). Wide fluctuations in production from year to year give the trend linelittle or no short-term predictive value.
Primary data source, USDA, ERS. Trend, R2 = .63.
CRS-6
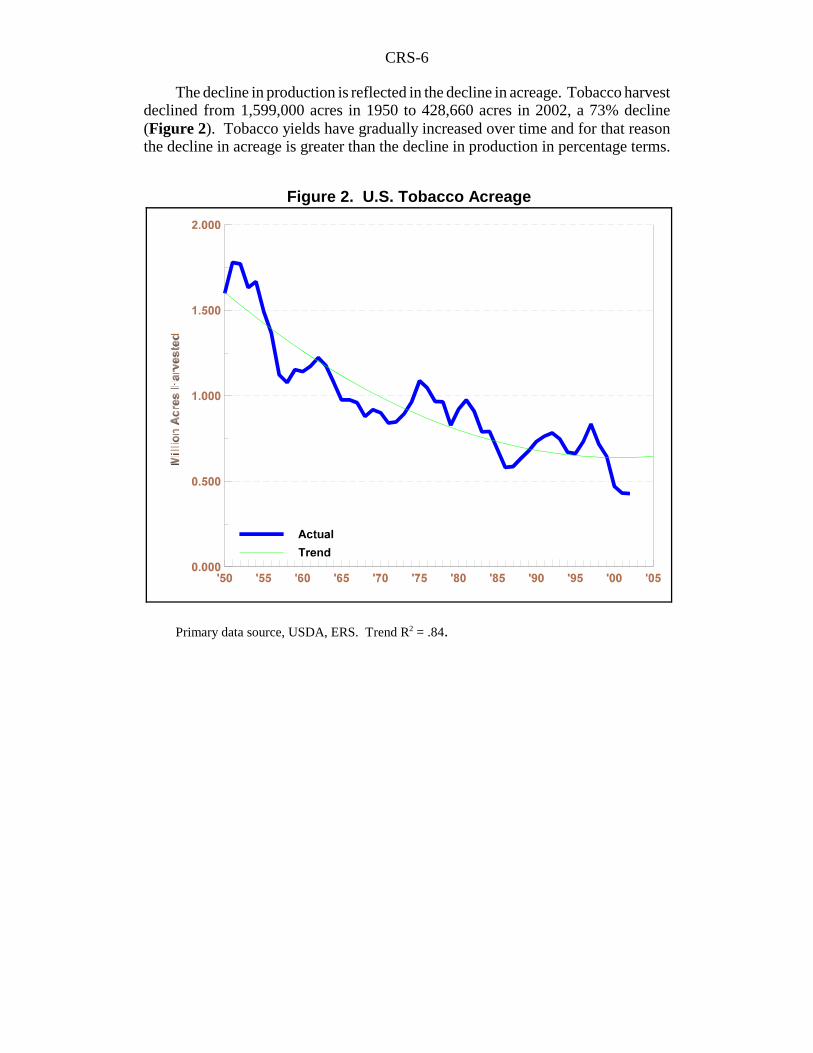
Figure 2. U.S. Tobacco Acreage
The decline in production is reflected in the decline in acreage. Tobacco harvestdeclined from 1,599,000 acres in 1950 to 428,660 acres in 2002, a 73% decline(Figure 2). Tobacco yields have gradually increased over time and for that reasonthe decline in acreage is greater than the decline in production in percentage terms.
Primary data source, USDA, ERS. Trend R2 = .84.
CRS-7
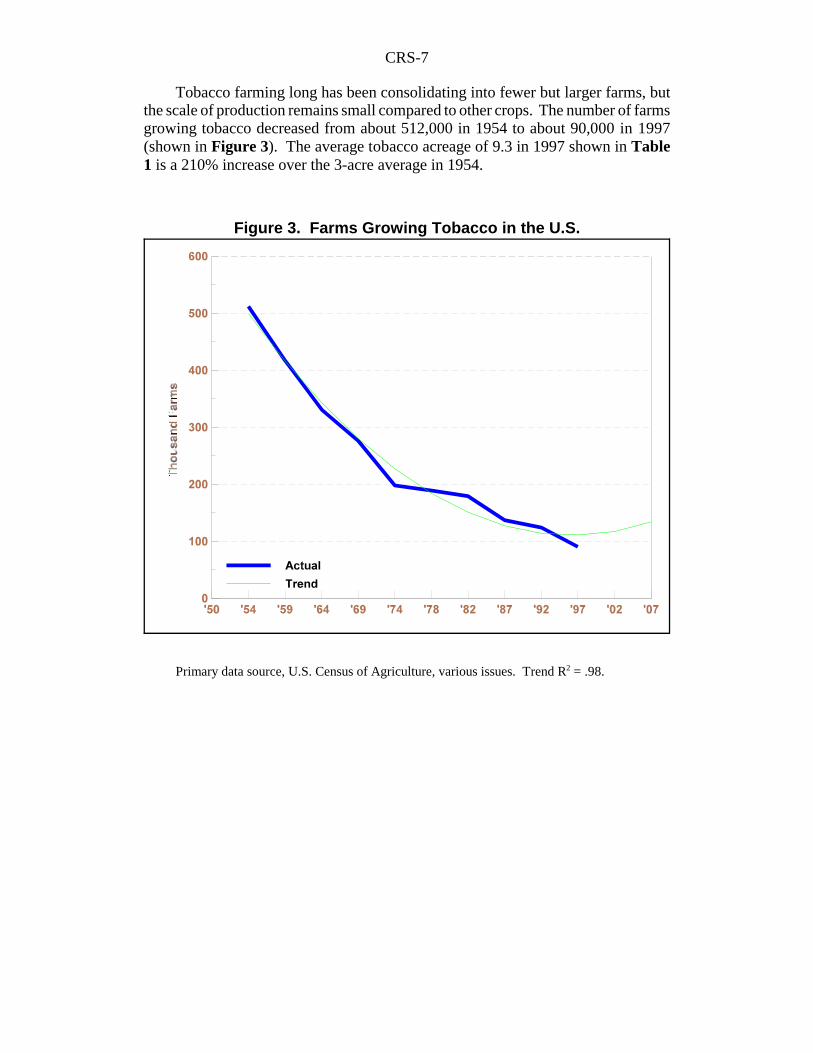
Figure 3. Farms Growing Tobacco in the U.S.
Tobacco farming long has been consolidating into fewer but larger farms, butthe scale of production remains small compared to other crops. The number of farmsgrowing tobacco decreased from about 512,000 in 1954 to about 90,000 in 1997(shown in Figure 3). The average tobacco acreage of 9.3 in 1997 shown in Table1 is a 210% increase over the 3-acre average in 1954.
Primary data source, U.S. Census of Agriculture, various issues. Trend R2 = .98.
CRS-8
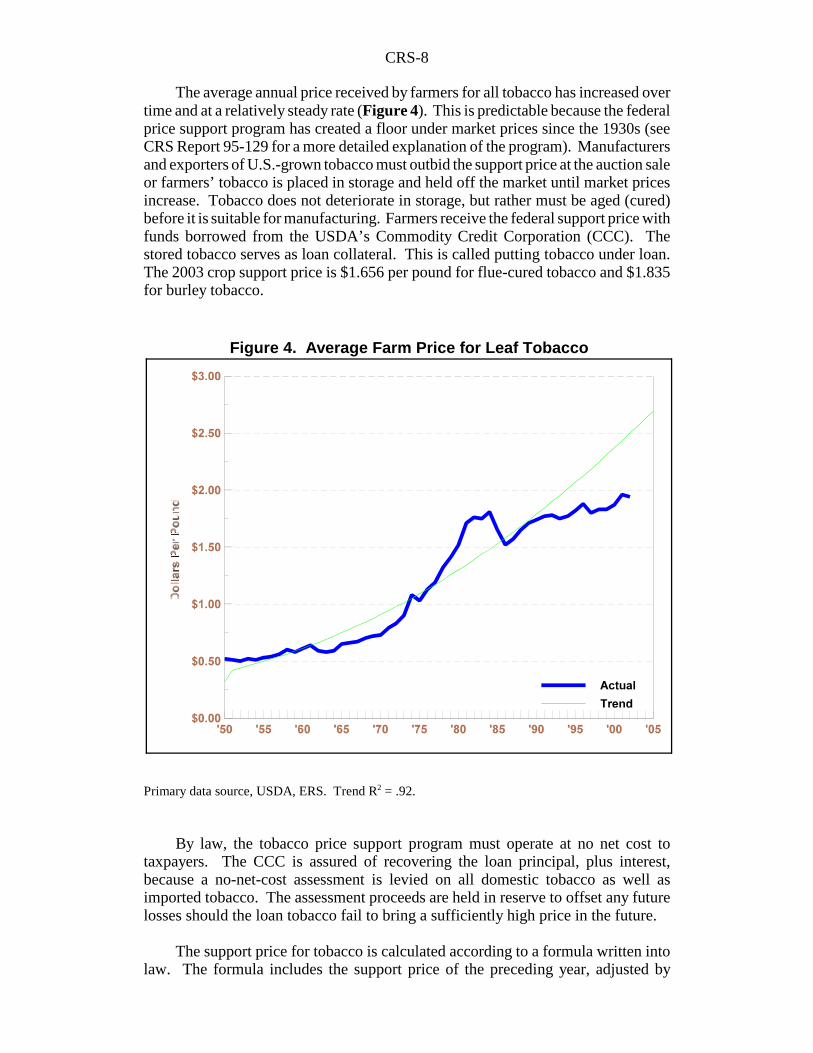
Figure 4. Average Farm Price for Leaf Tobacco
The average annual price received by farmers for all tobacco has increased overtime and at a relatively steady rate (Figure 4). This is predictable because the federalprice support program has created a floor under market prices since the 1930s (seeCRS Report 95-129 for a more detailed explanation of the program). Manufacturersand exporters of U.S.-grown tobacco must outbid the support price at the auction saleor farmers’ tobacco is placed in storage and held off the market until market pricesincrease. Tobacco does not deteriorate in storage, but rather must be aged (cured)before it is suitable for manufacturing. Farmers receive the federal support price withfunds borrowed from the USDA’s Commodity Credit Corporation (CCC). Thestored tobacco serves as loan collateral. This is called putting tobacco under loan.The 2003 crop support price is $1.656 per pound for flue-cured tobacco and $1.835for burley tobacco.
Primary data source, USDA, ERS. Trend R2 = .92.
By law, the tobacco price support program must operate at no net cost totaxpayers. The CCC is assured of recovering the loan principal, plus interest,because a no-net-cost assessment is levied on all domestic tobacco as well asimported tobacco. The assessment proceeds are held in reserve to offset any futurelosses should the loan tobacco fail to bring a sufficiently high price in the future.
The support price for tobacco is calculated according to a formula written intolaw. The formula includes the support price of the preceding year, adjusted by
CRS-9
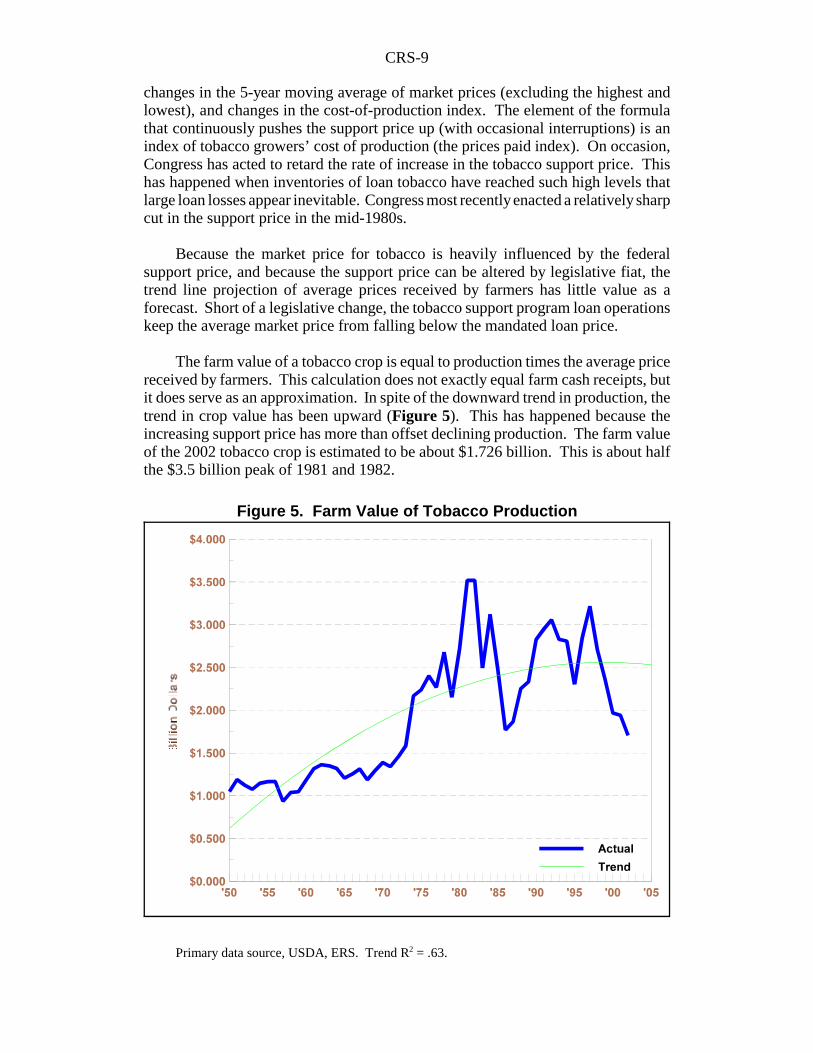
Figure 5. Farm Value of Tobacco Production
changes in the 5-year moving average of market prices (excluding the highest andlowest), and changes in the cost-of-production index. The element of the formulathat continuously pushes the support price up (with occasional interruptions) is anindex of tobacco growers’ cost of production (the prices paid index). On occasion,Congress has acted to retard the rate of increase in the tobacco support price. Thishas happened when inventories of loan tobacco have reached such high levels thatlarge loan losses appear inevitable. Congress most recently enacted a relatively sharpcut in the support price in the mid-1980s.
Because the market price for tobacco is heavily influenced by the federalsupport price, and because the support price can be altered by legislative fiat, thetrend line projection of average prices received by farmers has little value as aforecast. Short of a legislative change, the tobacco support program loan operationskeep the average market price from falling below the mandated loan price.
The farm value of a tobacco crop is equal to production times the average pricereceived by farmers. This calculation does not exactly equal farm cash receipts, butit does serve as an approximation. In spite of the downward trend in production, thetrend in crop value has been upward (Figure 5). This has happened because theincreasing support price has more than offset declining production. The farm valueof the 2002 tobacco crop is estimated to be about $1.726 billion. This is about halfthe $3.5 billion peak of 1981 and 1982.
Primary data source, USDA, ERS. Trend R2 = .63.
CRS-10
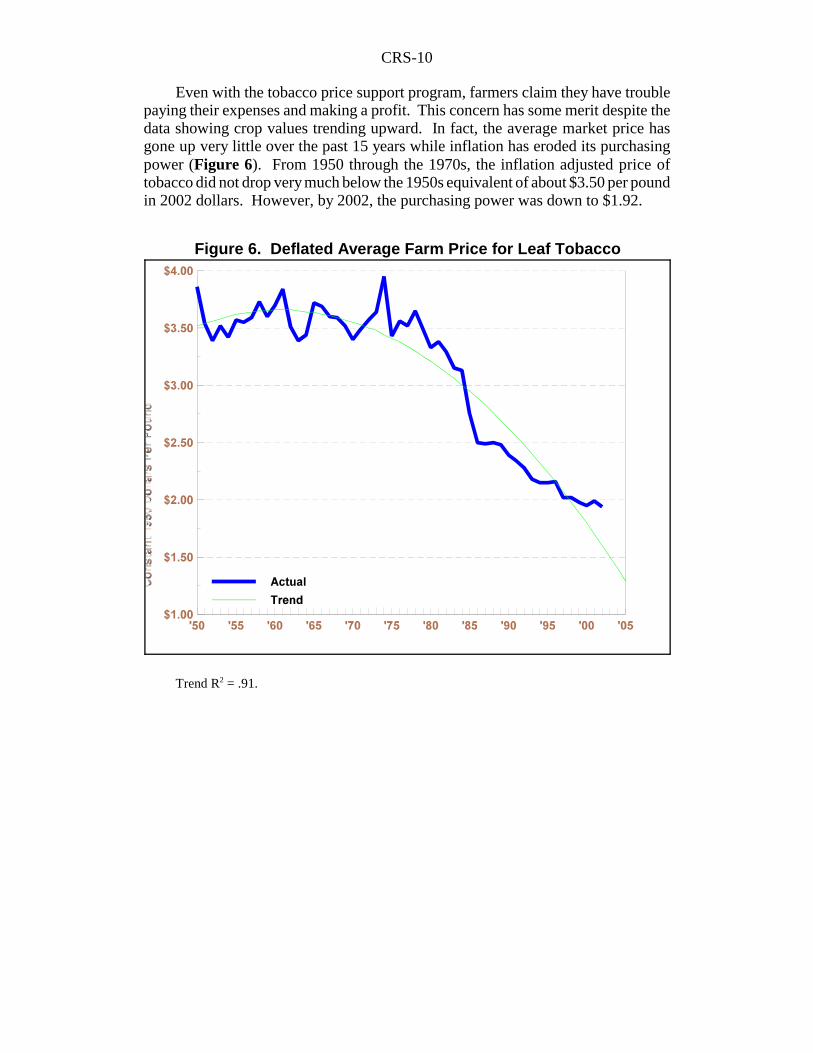
Figure 6. Deflated Average Farm Price for Leaf Tobacco
Even with the tobacco price support program, farmers claim they have troublepaying their expenses and making a profit. This concern has some merit despite thedata showing crop values trending upward. In fact, the average market price hasgone up very little over the past 15 years while inflation has eroded its purchasingpower (Figure 6). From 1950 through the 1970s, the inflation adjusted price oftobacco did not drop very much below the 1950s equivalent of about $3.50 per poundin 2002 dollars. However, by 2002, the purchasing power was down to $1.92.
Trend R2 = .91.

CRS-11
Figure 7. Deflated Farm Value of the U.S. Tobacco Crop
Corresponding to the decline in the deflated tobacco price, the deflated value oftobacco production also shows a comparatively sharp drop after 1980 (Figure 7).Certainly, an assessment of farmers’ economic condition requires an examination ofcosts and net revenues, but these are beyond the scope of this report.
Trend R2 = .85.
The historical data on tobacco production, prices, and crop value show a tobaccofarm sector struggling to maintain itself since 1980, but sometimes not able to keepup with inflation. Even prior to the 1998 Master Settlement Agreement, there waslittle reason to expect future growth. The long-term trend in production of U.S.tobacco has been downward, which matches the declining utilization of U.S.-growntobacco by manufacturers—as necessary to balance supply with demand. The 1998MSA envisions a drop in U.S. cigarette consumption, particularly among teenagersand children. Financial terms of the Settlement imply higher cigarette prices, reducedconsumption in response to the higher prices, and reduced use of leaf tobacco by themanufacturers.
CRS-12
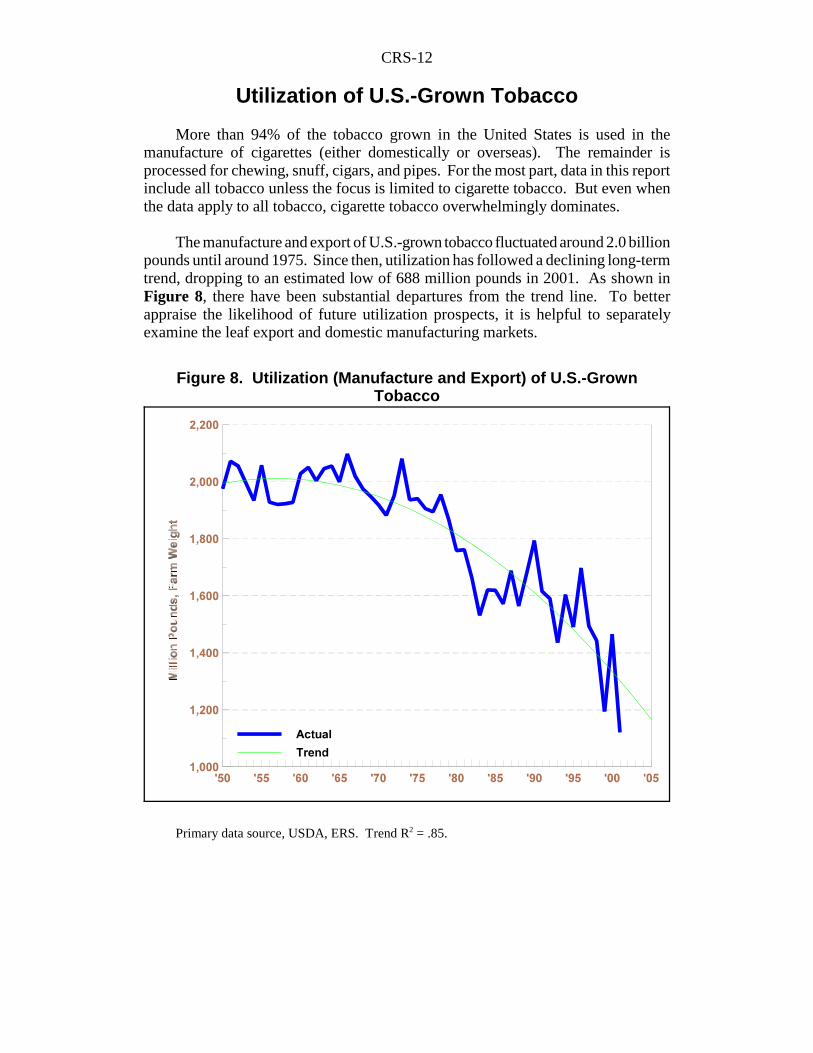
Figure 8. Utilization (Manufacture and Export) of U.S.-GrownTobacco
Utilization of U.S.-Grown Tobacco
More than 94% of the tobacco grown in the United States is used in themanufacture of cigarettes (either domestically or overseas). The remainder isprocessed for chewing, snuff, cigars, and pipes. For the most part, data in this reportinclude all tobacco unless the focus is limited to cigarette tobacco. But even whenthe data apply to all tobacco, cigarette tobacco overwhelmingly dominates.
The manufacture and export of U.S.-grown tobacco fluctuated around 2.0 billionpounds until around 1975. Since then, utilization has followed a declining long-termtrend, dropping to an estimated low of 688 million pounds in 2001. As shown inFigure 8, there have been substantial departures from the trend line. To betterappraise the likelihood of future utilization prospects, it is helpful to separatelyexamine the leaf export and domestic manufacturing markets.
Primary data source, USDA, ERS. Trend R2 = .85.
CRS-13
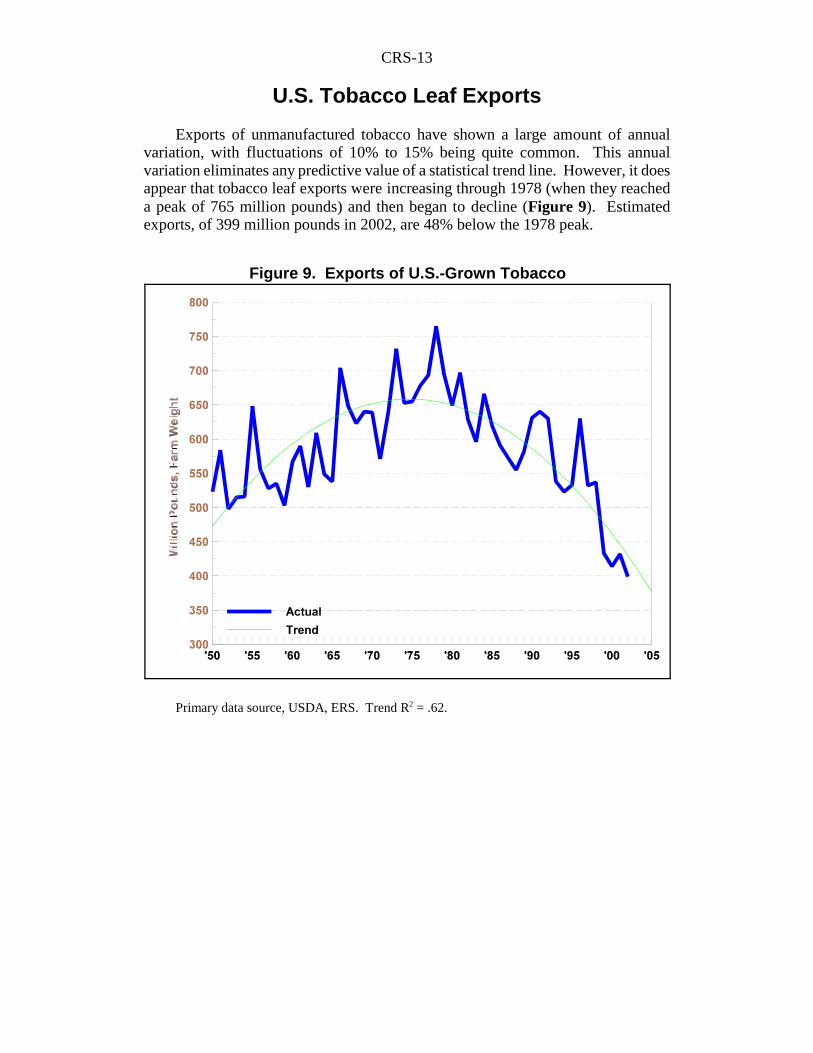
Figure 9. Exports of U.S.-Grown Tobacco
U.S. Tobacco Leaf Exports
Exports of unmanufactured tobacco have shown a large amount of annualvariation, with fluctuations of 10% to 15% being quite common. This annualvariation eliminates any predictive value of a statistical trend line. However, it doesappear that tobacco leaf exports were increasing through 1978 (when they reacheda peak of 765 million pounds) and then began to decline (Figure 9). Estimatedexports, of 399 million pounds in 2002, are 48% below the 1978 peak.
Primary data source, USDA, ERS. Trend R2 = .62.
CRS-14
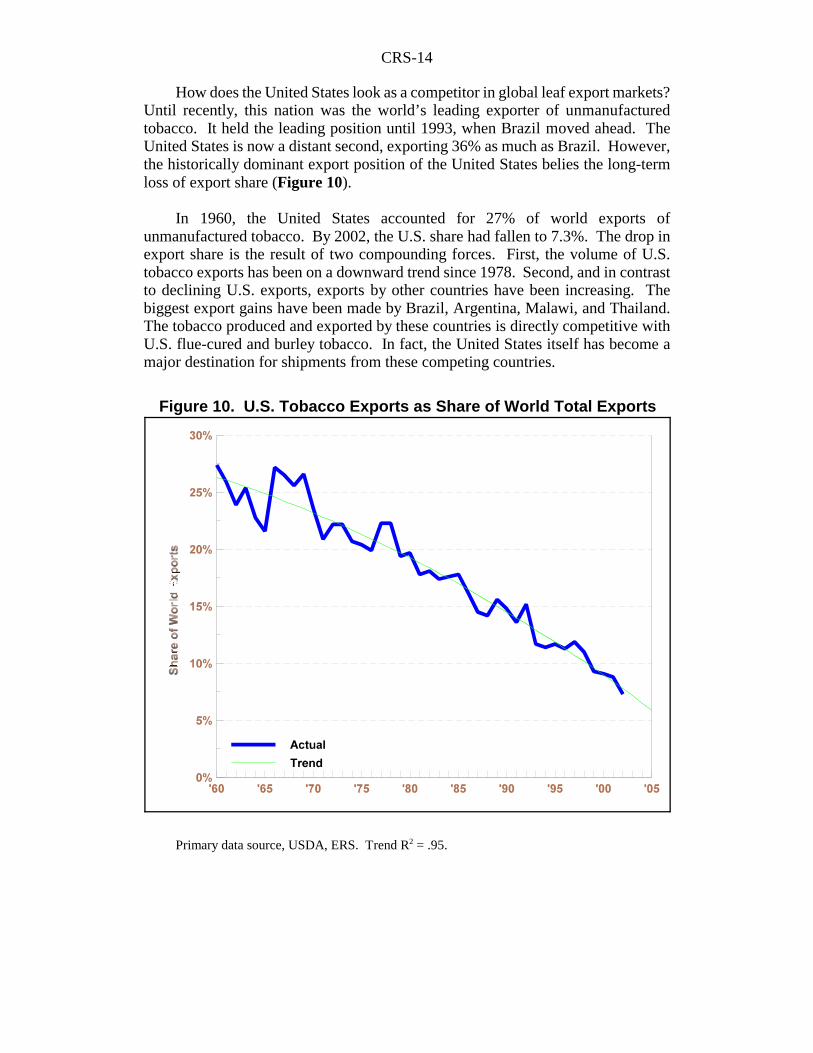
Figure 10. U.S. Tobacco Exports as Share of World Total Exports
How does the United States look as a competitor in global leaf export markets?Until recently, this nation was the world’s leading exporter of unmanufacturedtobacco. It held the leading position until 1993, when Brazil moved ahead. TheUnited States is now a distant second, exporting 36% as much as Brazil. However,the historically dominant export position of the United States belies the long-termloss of export share (Figure 10).
In 1960, the United States accounted for 27% of world exports ofunmanufactured tobacco. By 2002, the U.S. share had fallen to 7.3%. The drop inexport share is the result of two compounding forces. First, the volume of U.S.tobacco exports has been on a downward trend since 1978. Second, and in contrastto declining U.S. exports, exports by other countries have been increasing. Thebiggest export gains have been made by Brazil, Argentina, Malawi, and Thailand.The tobacco produced and exported by these countries is directly competitive withU.S. flue-cured and burley tobacco. In fact, the United States itself has become amajor destination for shipments from these competing countries.
Primary data source, USDA, ERS. Trend R2 = .95.
CRS-15
3 While these data apply directly to Kentucky, they are probably not far from lease and saleprices in North Carolina, according to experts in North Carolina and the U.S. Departmentof Agriculture. Data are not available on North Carolina. These data are compiled andpublished by Dr. William Snell, University of Kentucky, in an annual report titled TheKentucky Quota Sales and Leasing Market.4 Import and export quantity and value data are collected by the Department of Commerce.These calculations are from data published in USDA, FAS, Tobacco: World Markets andTrade, April 2003. All tobacco undergoes certain processing, packing and storage beforeit is ready for manufacturing. These processing and handling costs account for the pricebeing higher at the export terminal than at farm auction.
Historically, the United States’ dominant export position was due to its abilityto deliver large supplies of high quality cigarette tobacco. This tobacco has provenquite desirable in the milder American-style cigarettes that have gained in worldwidepopularity over the traditional stronger cigarettes so common outside the UnitedStates. Until as recently as 20 years ago, only small quantities of foreign tobaccocould be blended successfully with U.S.-grown tobacco in the American-stylecigarettes. To a large degree U.S. tobacco growers had a monopoly in the productionof high quality mild tobaccos used to manufacture American-style cigarettes.
The near monopoly situation for U.S. tobacco made it possible to create adomestic price support program with high and continuously increasing prices. Infact, the profits created by the price support program have become capitalized intoannual quota rental rates that have averaged 43¢ per pound over the past 10 years,increasing to 53¢ over the past 3 years (about $1,000 per acre). Similarly, the saleof farmland with tobacco quota has brought a premium of about $1.85 per poundover the past 10 years, and $2.14 over the past 3 years (about $4,200 per acre).3
Ultimately, the federal support program created an umbrella of price protectionfor foreign producers. With assistance from cigarette manufacturers, tobaccogrowers in especially Brazil, Zimbabwe, Malawi, and Argentina have improved thequality of their tobacco and expanded production. At the same time, cigarettemanufacturers have developed methods for utilizing larger proportions of lowerquality tobacco while still maintaining acceptable smoking quality. Finally,consumers have shown a willingness to accept the so-called lower quality “generic”cigarettes in return for lower prices. Together, these factors have enabled foreigntobacco to displace U.S.-grown tobacco in American-style cigarettes.
The obvious motivation for cigarette manufacturers to use non-U.S. tobacco isto lower their input costs. Currently, foreign-grown tobacco is being delivered toU.S. buyers at about 40% of the cost of domestic tobacco. Data from invoicesexamined at ports of entry in 2002 show the landed value of imported tobaccoaveraged $1.25 per pound. In contrast, sales invoices report the export price of U.S.tobacco averaged $3.10 per pound.4
There are two reasons that the price of U.S. tobacco is currently 2.3 times ashigh as imported tobacco. First, and most important, the federal tobacco pricesupport program establishes a floor under market prices. If commercial buyers do notoffer bids higher than the support price, farmers are paid the support price with
CRS-16
5 This estimate is based upon the separate analyses of Dr. Blake Brown of North CarolinaState University and Dr. William Snell of the University of Kentucky, as they reported intestimony before the Senate Committee on Agriculture, Nutrition, and Forestry onSeptember 18, 1997.6 The dispute settlement panel of GATT issued its report July 15, 1994. In addition todetermining that the domestic content requirement violated the Agreement, the panel foundthat a Budget Deficit Assessment on imported tobacco was also in violation, but the no-net-cost assessment on imported tobacco did not violate GATT. A tariff rate quota allowsimports of a specified quantity (quota) with a minimal tariff and above that quantity imposesa prohibitively high tariff. Imposition of a tariff rate quota obligates the United States tonegotiate compensation with exporting countries who lose access to the U.S. market.Failure to negotiate acceptable compensation entitles the injured countries to retaliate.However, to date the tariff rate quota on tobacco has been sufficiently large compared toimports that it has not been restrictive.
money lent by the Commodity Credit Corporation. This tobacco goes into storageand is held off the market until prices improve. Second, much U.S.-grown tobaccohas a quality advantage that manufacturers are willing to pay extra for, asdemonstrated by its continued use in domestic cigarettes and its export to foreigncigarette manufacturers.
In the absence of a federal support program, the price of U.S.-grown tobaccowould decline, but probably not as low as the price of foreign tobacco. Someeconomists predict that prices would decline by 25% or more, which translates intoa decline of about $0.50 from the 2002 average of $1.91 per pound.5
In 1993, the congressional reaction to the competitive price advantage achievedby foreign tobacco was to impose high penalties on cigarette manufacturers who usedless than 75% U.S.-grown tobacco in their cigarettes. Contained in the OmnibusBudget Reconciliation Act of 1993 (P.L. 103-66) was a provision that effectivelyestablished a 75% domestic content requirement on U.S.-manufactured cigarettes.
The domestic content requirement soon was determined to be in violation ofinternational trading rules. As part of the implementing legislation for the UruguayRound Trade Agreement, the domestic content rule was replaced with tariff ratequota provisions.6 However, this tariff rate quota does not effectively limit imports.First, the quota quantity is sufficiently large that it has not been reached. Second,duty drawback rules allow the recovery of duty on all imported tobacco that isexported in cigarettes. The policy of duty drawback, which applies to all imports, notjust tobacco, encourages manufacturing jobs in the United States yet the end productsdo not compete in the domestic market because they are exported.

CRS-17
Figure 11. Domestic Manufacturing Use of U.S.-Grown Tobacco
Manufacturing Use of Leaf Tobacco
At the peak in 1952, U.S. manufacturers utilized nearly 1.6 billion pounds ofdomestically produced tobacco in the manufacture of tobacco products. Following45 years of decline, estimated 2001 utilization of 688 billion pounds is already downto the trend level projected for the year 2005.
Primary data source, USDA, ERS. Trend R2 = .86.
Much of the decline in domestic manufacturing utilization of U.S.-growntobacco can be attributed to reduced cigarette consumption by Americans.Nevertheless, cigarette output has actually followed an upward trend over the sameperiod that domestic tobacco utilization has been declining. This seemingcontradiction can be explained by the changing character of U.S.-manufacturedcigarettes. The amount of tobacco in each cigarette has declined, and the proportionof foreign-grown tobacco in U.S. cigarettes has been increasing.
CRS-18
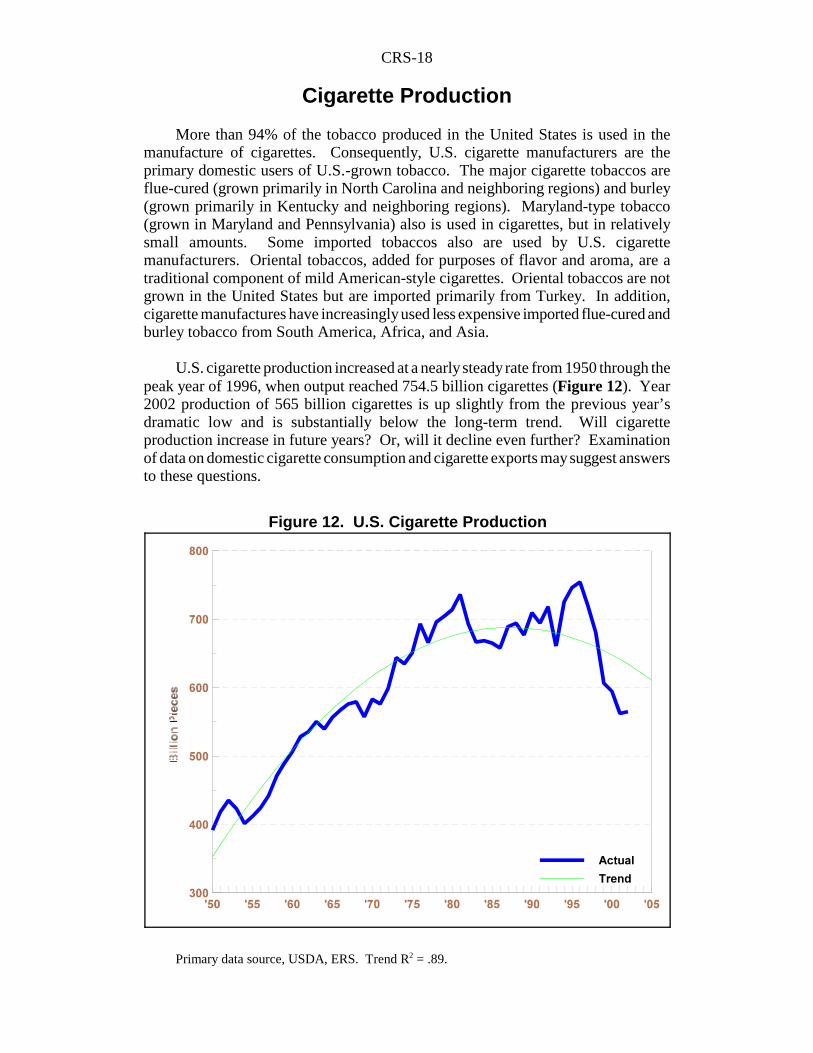
Figure 12. U.S. Cigarette Production
Cigarette Production
More than 94% of the tobacco produced in the United States is used in themanufacture of cigarettes. Consequently, U.S. cigarette manufacturers are theprimary domestic users of U.S.-grown tobacco. The major cigarette tobaccos areflue-cured (grown primarily in North Carolina and neighboring regions) and burley(grown primarily in Kentucky and neighboring regions). Maryland-type tobacco(grown in Maryland and Pennsylvania) also is used in cigarettes, but in relativelysmall amounts. Some imported tobaccos also are used by U.S. cigarettemanufacturers. Oriental tobaccos, added for purposes of flavor and aroma, are atraditional component of mild American-style cigarettes. Oriental tobaccos are notgrown in the United States but are imported primarily from Turkey. In addition,cigarette manufactures have increasingly used less expensive imported flue-cured andburley tobacco from South America, Africa, and Asia.
U.S. cigarette production increased at a nearly steady rate from 1950 through thepeak year of 1996, when output reached 754.5 billion cigarettes (Figure 12). Year2002 production of 565 billion cigarettes is up slightly from the previous year’sdramatic low and is substantially below the long-term trend. Will cigaretteproduction increase in future years? Or, will it decline even further? Examinationof data on domestic cigarette consumption and cigarette exports may suggest answersto these questions.
Primary data source, USDA, ERS. Trend R2 = .89.
CRS-19
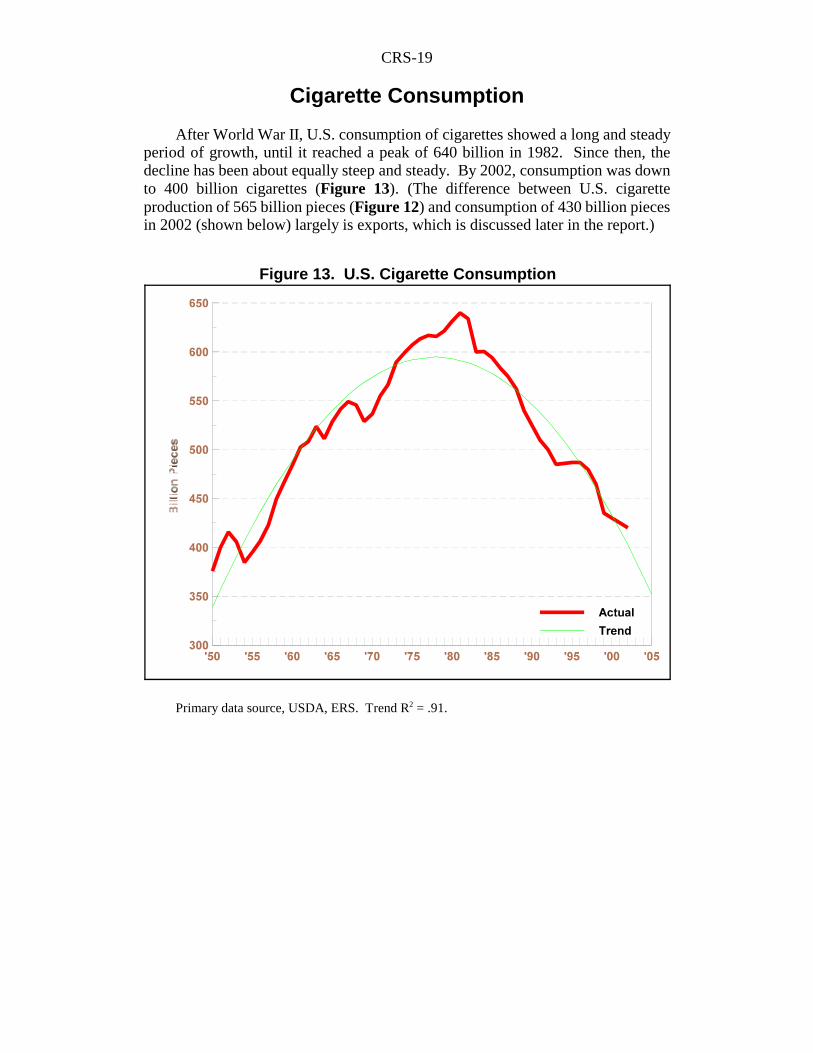
Figure 13. U.S. Cigarette Consumption
Cigarette Consumption
After World War II, U.S. consumption of cigarettes showed a long and steadyperiod of growth, until it reached a peak of 640 billion in 1982. Since then, thedecline has been about equally steep and steady. By 2002, consumption was downto 400 billion cigarettes (Figure 13). (The difference between U.S. cigaretteproduction of 565 billion pieces (Figure 12) and consumption of 430 billion piecesin 2002 (shown below) largely is exports, which is discussed later in the report.)
Primary data source, USDA, ERS. Trend R2 = .91.
CRS-20
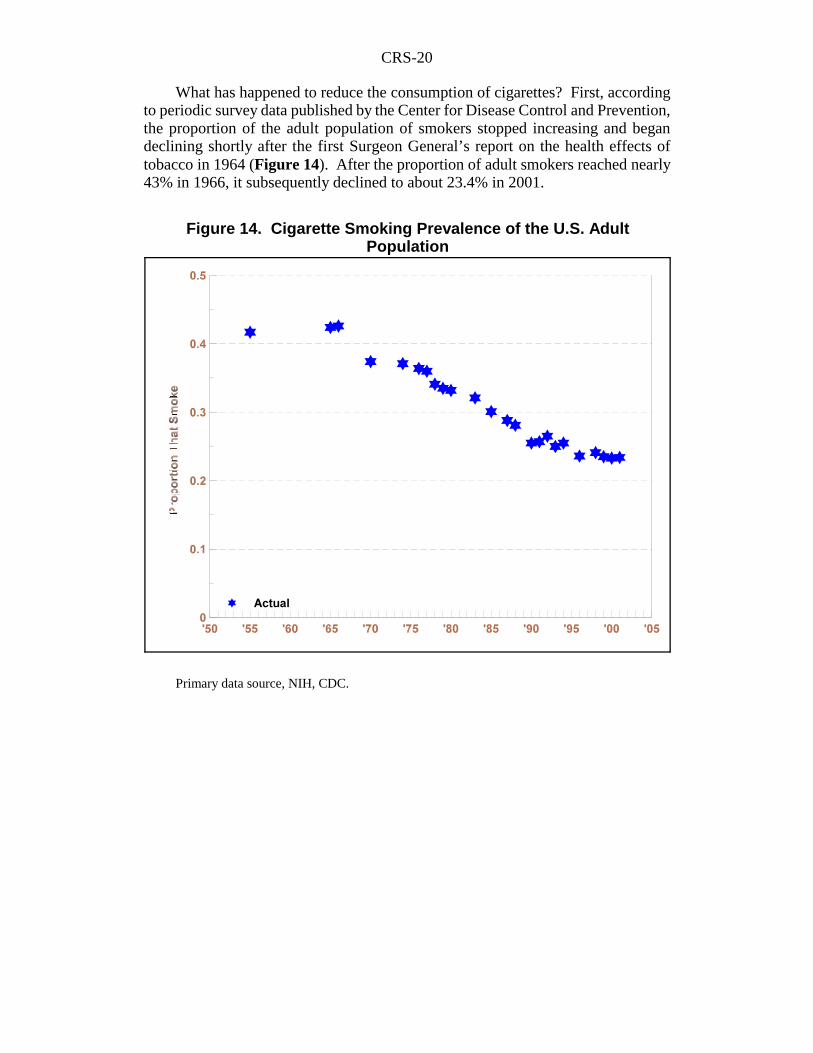
Figure 14. Cigarette Smoking Prevalence of the U.S. AdultPopulation
What has happened to reduce the consumption of cigarettes? First, accordingto periodic survey data published by the Center for Disease Control and Prevention,the proportion of the adult population of smokers stopped increasing and begandeclining shortly after the first Surgeon General’s report on the health effects oftobacco in 1964 (Figure 14). After the proportion of adult smokers reached nearly43% in 1966, it subsequently declined to about 23.4% in 2001.
Primary data source, NIH, CDC.
CRS-21
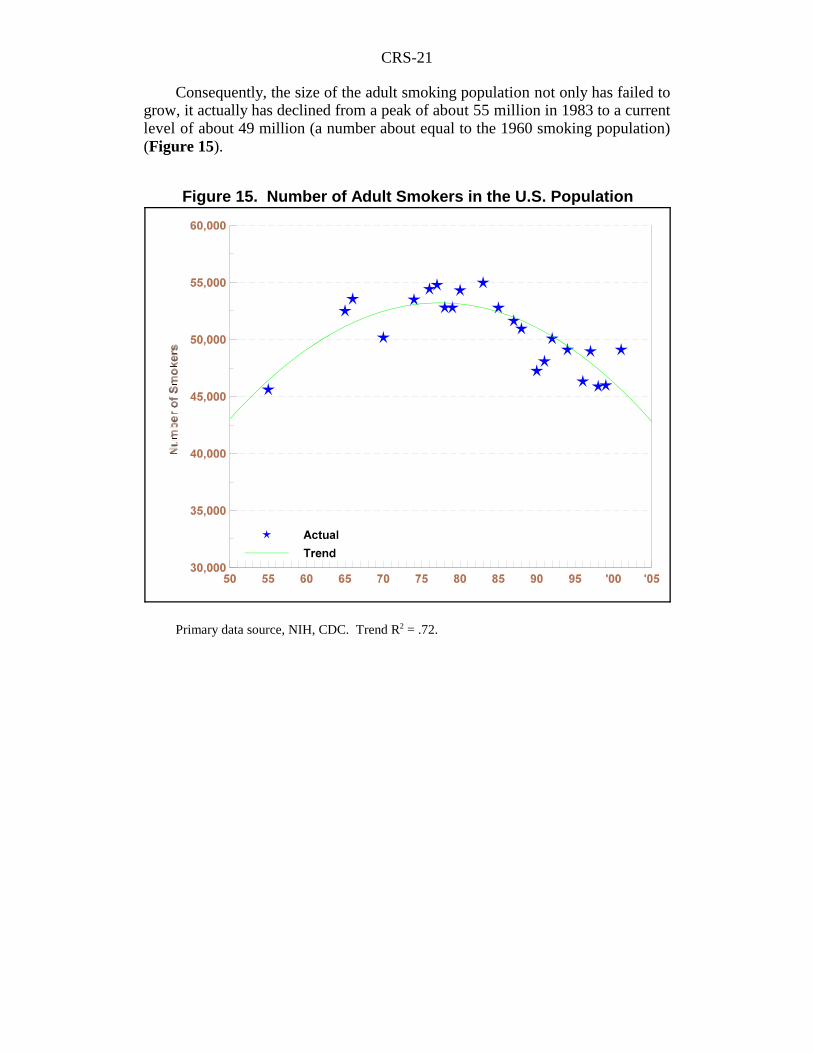
Figure 15. Number of Adult Smokers in the U.S. Population
Consequently, the size of the adult smoking population not only has failed togrow, it actually has declined from a peak of about 55 million in 1983 to a currentlevel of about 49 million (a number about equal to the 1960 smoking population)(Figure 15).
Primary data source, NIH, CDC. Trend R2 = .72.
CRS-22
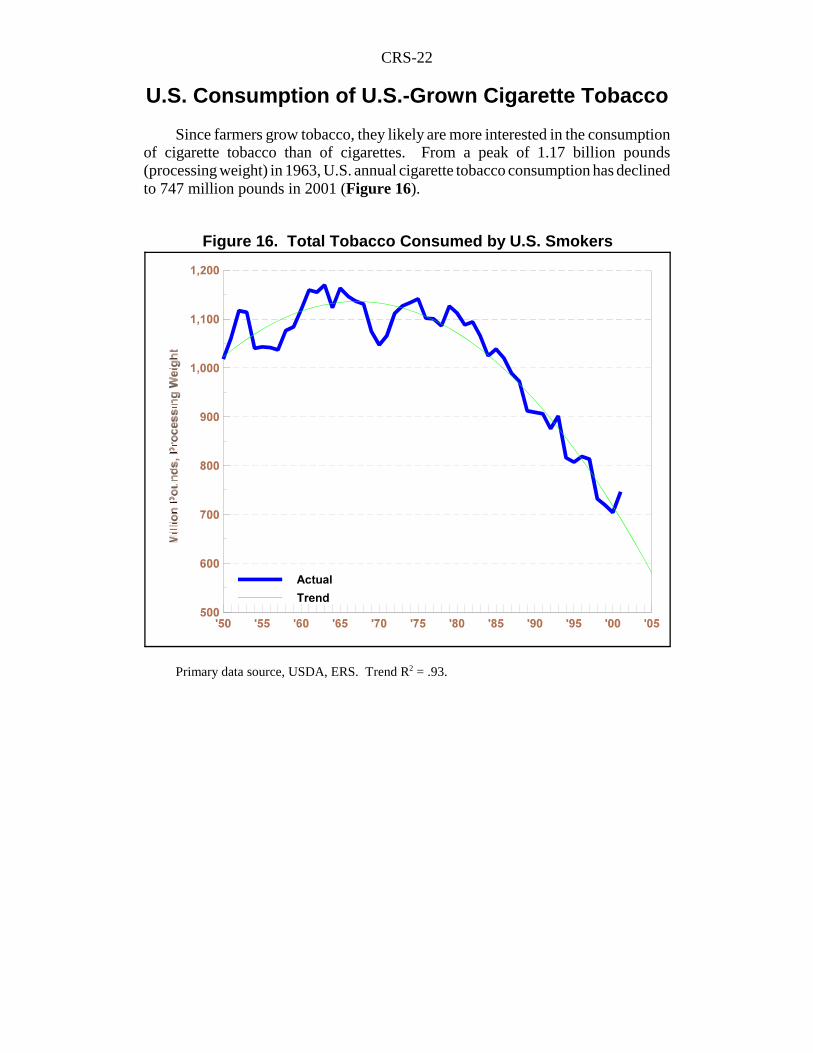
Figure 16. Total Tobacco Consumed by U.S. Smokers
U.S. Consumption of U.S.-Grown Cigarette Tobacco
Since farmers grow tobacco, they likely are more interested in the consumptionof cigarette tobacco than of cigarettes. From a peak of 1.17 billion pounds(processing weight) in 1963, U.S. annual cigarette tobacco consumption has declinedto 747 million pounds in 2001 (Figure 16).
Primary data source, USDA, ERS. Trend R2 = .93.
CRS-23
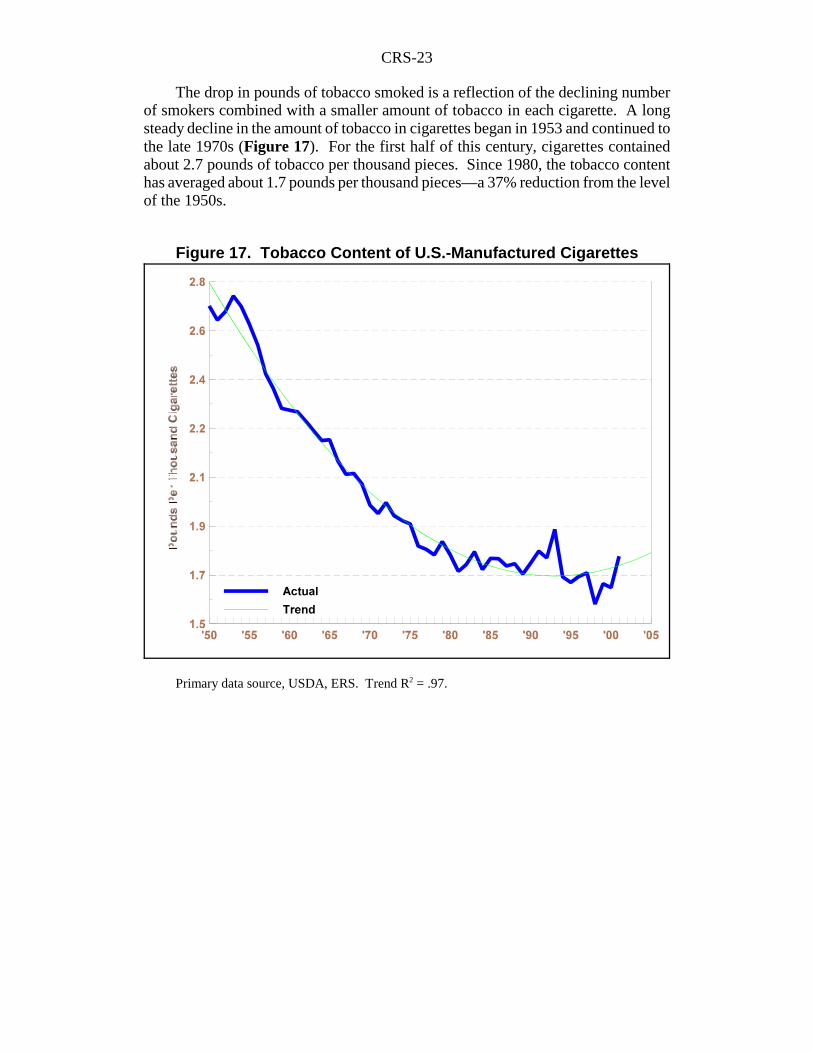
Figure 17. Tobacco Content of U.S.-Manufactured Cigarettes
The drop in pounds of tobacco smoked is a reflection of the declining numberof smokers combined with a smaller amount of tobacco in each cigarette. A longsteady decline in the amount of tobacco in cigarettes began in 1953 and continued tothe late 1970s (Figure 17). For the first half of this century, cigarettes containedabout 2.7 pounds of tobacco per thousand pieces. Since 1980, the tobacco contenthas averaged about 1.7 pounds per thousand pieces—a 37% reduction from the levelof the 1950s.
Primary data source, USDA, ERS. Trend R2 = .97.
CRS-24
Figure 18. Share of Imported Tobacco in U.S.-ManufacturedCigarettes
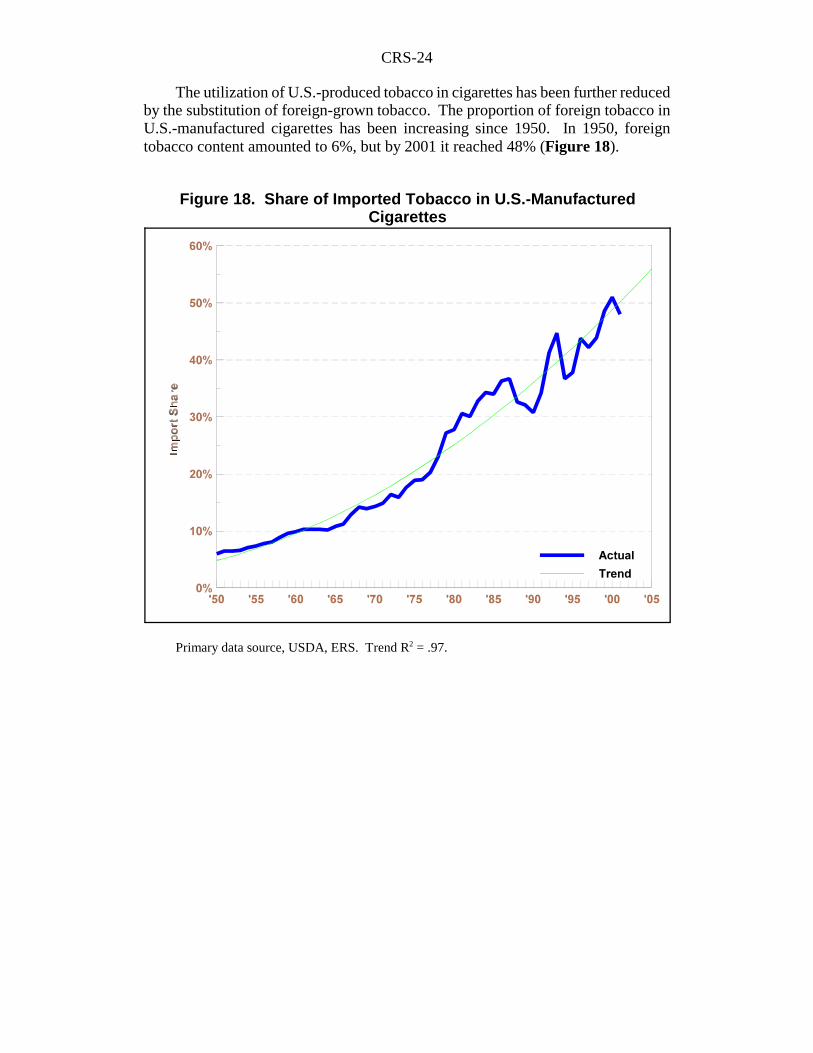
The utilization of U.S.-produced tobacco in cigarettes has been further reducedby the substitution of foreign-grown tobacco. The proportion of foreign tobacco inU.S.-manufactured cigarettes has been increasing since 1950. In 1950, foreigntobacco content amounted to 6%, but by 2001 it reached 48% (Figure 18).
Primary data source, USDA, ERS. Trend R2 = .97.
CRS-25
Figure 19. Consumption of U.S.-Grown Tobacco by U.S. Smokers
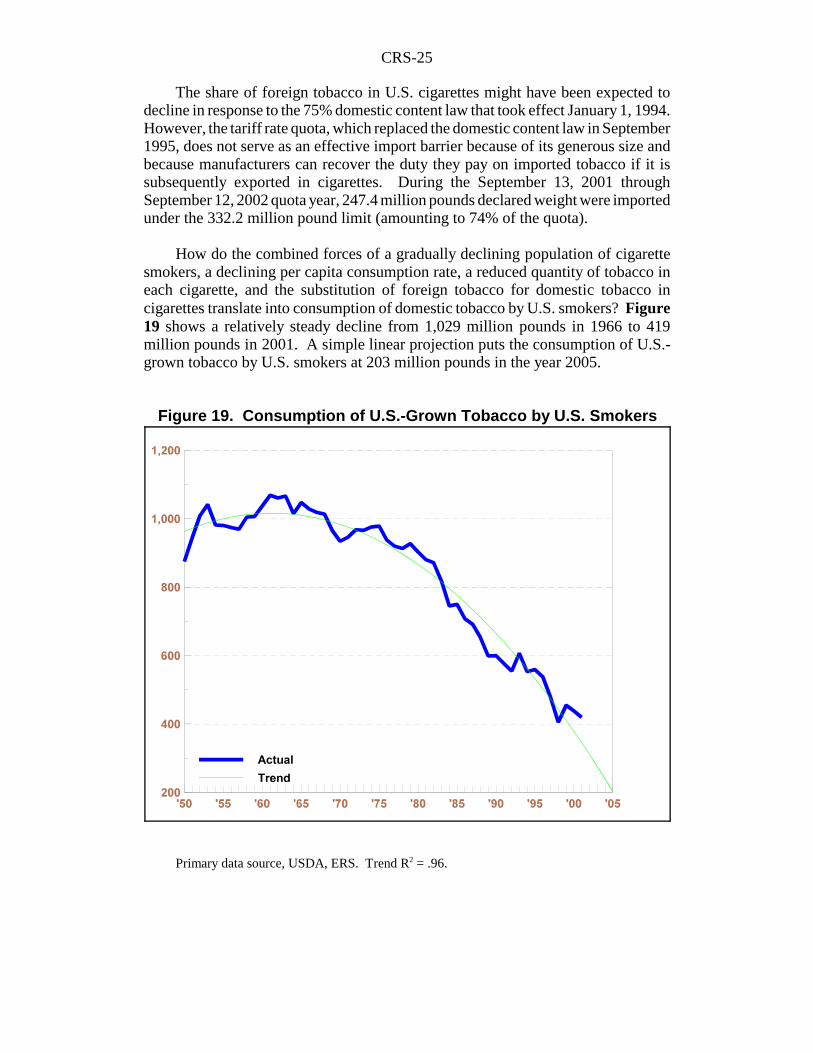
The share of foreign tobacco in U.S. cigarettes might have been expected todecline in response to the 75% domestic content law that took effect January 1, 1994.However, the tariff rate quota, which replaced the domestic content law in September1995, does not serve as an effective import barrier because of its generous size andbecause manufacturers can recover the duty they pay on imported tobacco if it issubsequently exported in cigarettes. During the September 13, 2001 throughSeptember 12, 2002 quota year, 247.4 million pounds declared weight were importedunder the 332.2 million pound limit (amounting to 74% of the quota).
How do the combined forces of a gradually declining population of cigarettesmokers, a declining per capita consumption rate, a reduced quantity of tobacco ineach cigarette, and the substitution of foreign tobacco for domestic tobacco incigarettes translate into consumption of domestic tobacco by U.S. smokers? Figure19 shows a relatively steady decline from 1,029 million pounds in 1966 to 419million pounds in 2001. A simple linear projection puts the consumption of U.S.-grown tobacco by U.S. smokers at 203 million pounds in the year 2005.
Primary data source, USDA, ERS. Trend R2 = .96.

CRS-26
Figure 20. World Cigarette Exports
Cigarette Exports
Cigarette manufacturers have not had to depend solely upon the U.S. market forthe sale of cigarettes. In sharp contrast to the declining domestic market, the rest ofthe world has offered U.S. cigarette makers opportunities for expansion. Worldcigarette trade has been increasing steadily for most of the past 30 years (Figure 20).The ups and downs of the past 6 years are unusual and are partially attributed tofinancial crises in Asia and Eastern Europe that impacted demand. However, withincreasing incomes and consumption in many of the developing countries of theworld, there is little reason to believe the longer term opportunity for growth in thesemarkets has stopped. However, there is a growing health concern throughout theworld combined with restraints on advertising that could reduce the growth prospectsfor cigarette manufacturers.
World consumption in 2002 (using world cigarette production as a proxy forconsumption), excluding the United States, may have been about 5 trillion cigarettes,with about one-third being American-style cigarettes made from primarily flue-curedand burley tobacco. If the milder American-style cigarette is the preferred choice,then manufacturers have a large market of existing smokers yet to be reached withAmerican-style cigarettes.
Primary data source, USDA, FAS. Trend R2 = .93.
CRS-27
Figure 21. U.S. Cigarette ExportsAs Share of Foreign Consumption
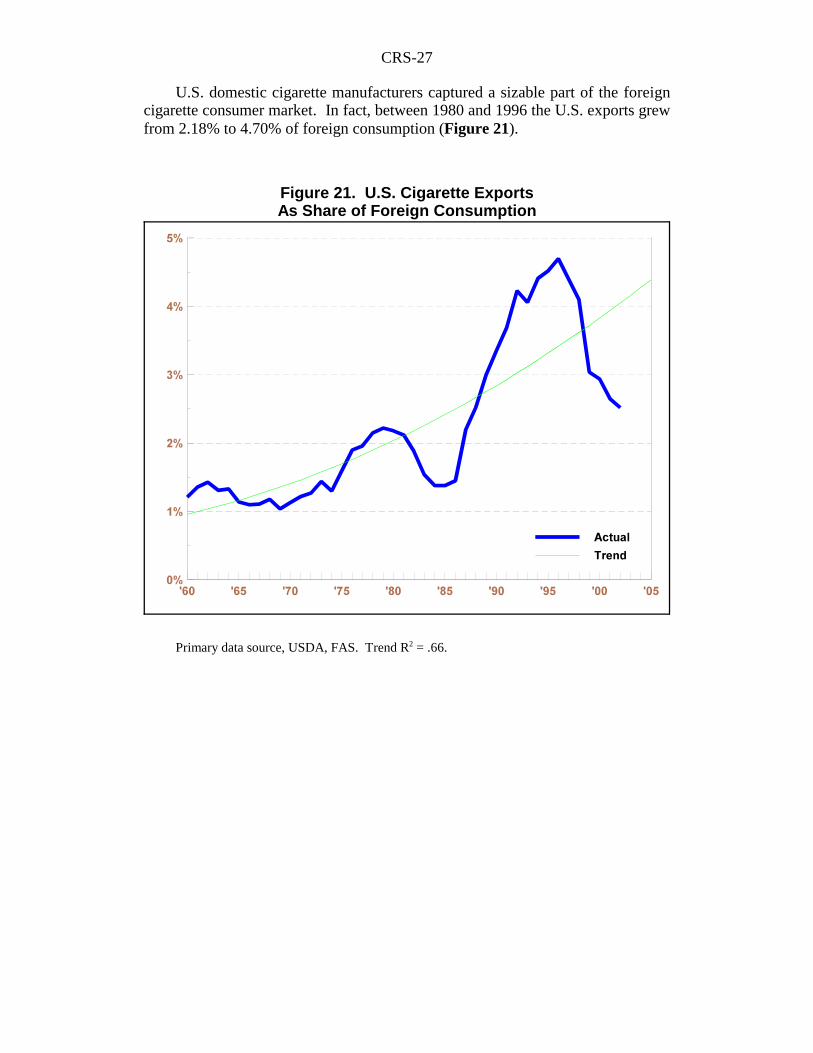
U.S. domestic cigarette manufacturers captured a sizable part of the foreigncigarette consumer market. In fact, between 1980 and 1996 the U.S. exports grewfrom 2.18% to 4.70% of foreign consumption (Figure 21).
Primary data source, USDA, FAS. Trend R2 = .66.
CRS-28
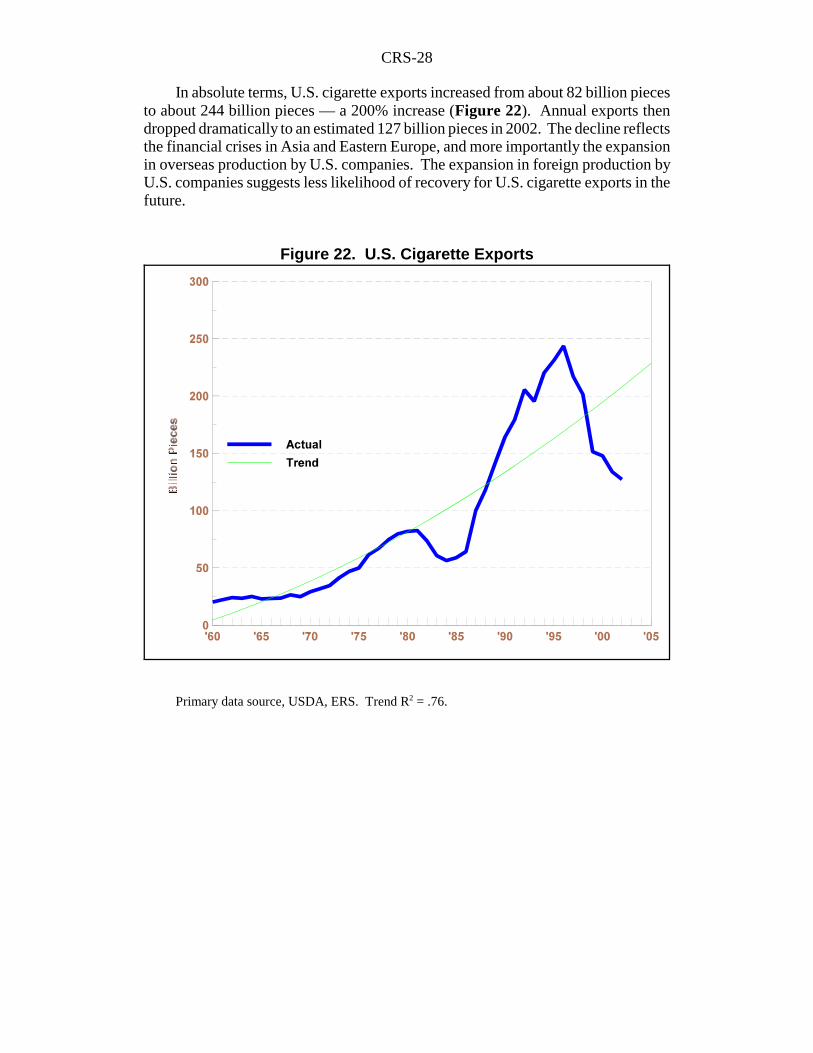
Figure 22. U.S. Cigarette Exports
In absolute terms, U.S. cigarette exports increased from about 82 billion piecesto about 244 billion pieces — a 200% increase (Figure 22). Annual exports thendropped dramatically to an estimated 127 billion pieces in 2002. The decline reflectsthe financial crises in Asia and Eastern Europe, and more importantly the expansionin overseas production by U.S. companies. The expansion in foreign production byU.S. companies suggests less likelihood of recovery for U.S. cigarette exports in thefuture.
Primary data source, USDA, ERS. Trend R2 = .76.

CRS-29
Figure 23. Exported Cigarettes as Share of U.S. Output
Exports grew from less than 10% of the total market for U.S. cigarettemanufacturers in the mid-1980s to 32% in 1996, and dropped to 22% in 2002(Figure 23). In spite of the recent decline, the foreign cigarette market remainsimportant to America’s farmers as an outlet for their tobacco, taking nearly 130million pounds farm weight in 2002 (15% of production).
Primary data source, USDA, ERS. Trend R2 = .90.
CRS-30
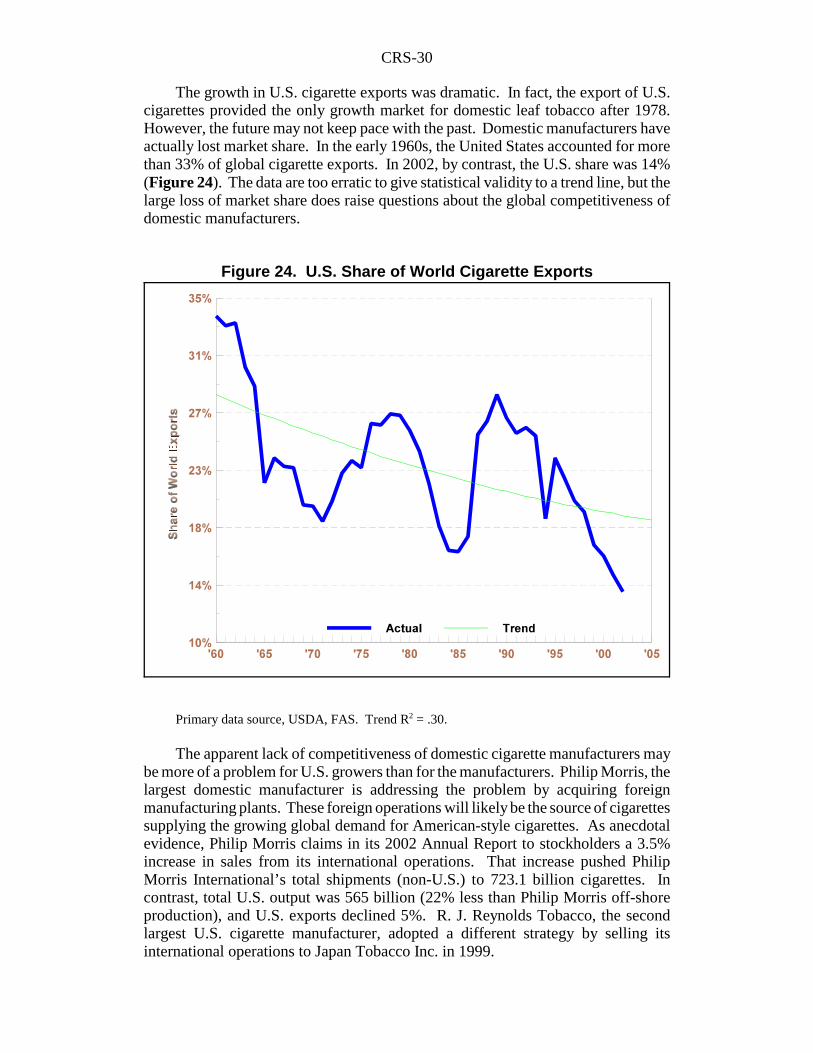
Figure 24. U.S. Share of World Cigarette Exports
The growth in U.S. cigarette exports was dramatic. In fact, the export of U.S.cigarettes provided the only growth market for domestic leaf tobacco after 1978.However, the future may not keep pace with the past. Domestic manufacturers haveactually lost market share. In the early 1960s, the United States accounted for morethan 33% of global cigarette exports. In 2002, by contrast, the U.S. share was 14%(Figure 24). The data are too erratic to give statistical validity to a trend line, but thelarge loss of market share does raise questions about the global competitiveness ofdomestic manufacturers.
Primary data source, USDA, FAS. Trend R2 = .30.
The apparent lack of competitiveness of domestic cigarette manufacturers maybe more of a problem for U.S. growers than for the manufacturers. Philip Morris, thelargest domestic manufacturer is addressing the problem by acquiring foreignmanufacturing plants. These foreign operations will likely be the source of cigarettessupplying the growing global demand for American-style cigarettes. As anecdotalevidence, Philip Morris claims in its 2002 Annual Report to stockholders a 3.5%increase in sales from its international operations. That increase pushed PhilipMorris International’s total shipments (non-U.S.) to 723.1 billion cigarettes. Incontrast, total U.S. output was 565 billion (22% less than Philip Morris off-shoreproduction), and U.S. exports declined 5%. R. J. Reynolds Tobacco, the secondlargest U.S. cigarette manufacturer, adopted a different strategy by selling itsinternational operations to Japan Tobacco Inc. in 1999.