Embed Size (px)
Citation preview

REPORT R E S U M E S
ED 020 093 RC DO 623
NEW HANOVER COUNTY SCHOOL UNIT'S PLAN FOR UTILIZATION OF THE
FUNDS FOR TITLE I OF THE ELEMENTARY AND SECONDARY EDUCATION
ACT OF 1965, A STUDY PRESENTED TO THE FACULTY OF THE SCHOOL
OF EDUCATION, THE'UNIVERSITY OF NORTH CAROLINA.
BY... SCOTT, JOHN J.PUB DATE JAN 66
EDRS PRICE. MF -$O.50 HC -42.52 61F.
DESCRIPTORS- ACHIEVEMENT TESTS, COGNITIVE DEVELOPMENT,
CULTURALLY DISADVANTAGED, *DISADVANTAGED YOUTH, 'DROPOUT
RATE, ECONOMIC CISADVANTAGEMENT, *HEALTH NEEDS,
INDIVIDUALIZED PROGRAMS, LANGUAGE DEVELOPMENT, LEARNING
ACTIVITIES, MEDICAL SERVICES, MIDDLE CLASS VALUES, PHYSICAL
HEALTH, PROBLEM SOLVING, READIG MATERIALS, READING
PROCESSES, REMEDIAL READING, RURAL ENVIRONMENT, SLUM
ENVIRONMENT, SMALL GROUP INSTRUCTION, SPECIALISTS, *STUDENT
NEEDS, SELF CONCEPT, NEW HANOVER COUNTY NORTH CAROLINA, ESEA,
THE EDUCATIONAL ACHIEVEMENT OF 3,635 STUDENTS FROM
EDUCATIONALLY DEPRIVED SCHOOLS WAS COMPARED WITH STUDENTS
ATTENDING SCHOOLS WHERE HIGHER SOCIO-E'ONOMIC LEVELS
PREVAILED. RESULTS REVEALED SIGNIFICANT DIFFERENCES WITH
REGARD TO (1) LANGUAGE ARTS, (2) READING ACHIEVEMENT, (3)
AREAS OTHER THAN LANGUAGE ARTS AND READING (ARITHMETIC AND
PROBLEM SOLVING, SOCIAL STUDIES, AND SCIENCE), AND (4) HEALTH
AND PHYSICAL EDUCATION. IT WAS DETERMINED THAT THE
DIFFERENCES BETWEEN THE TWO SCHOOL GROUPS WERE CLEARLY IN
FAVOR OF THE MORE SOCIO- ECONOMICALLY ADVANTAGED, AND THAT
HEALTH NEEDS SEVERELY IMPEDED EFFORTS TO ENRICH THE
EDUCATIONAL EXPERIENCES FOR THE DISADVANTAGED. PROVISION WAS
MADE FOR SPECIAL ASSISTANCE IN THE FORM OF MEDICAL CARE,
FOOD, AND CLOTHING. WELL - EQUIPPED DIAGNOSTIC AND CORRECTIVE
CENTERS, STAFFED BY SPECIALISTS, WERE ESTABLISHEDFOR THE AID
OF THOSE STUDENTS WHOSE DIAGNOSTIC RECORDS INDICATED A NEED
FOR THIS SERVICE. TEACHERS WERE PROVIDED FOR SPECIAL
ADJUSTMENT CLASSES TO MEET THE NEEDS OF PREDICTIVE DROPOUTS,
WITH HOME CONTACTS BEING MADE BY SOCIAL COUNSELORS. A
TUITION -FREE SUMMER PROGRAM, INCLUDING REMEDIAL COURSES AND A
SPEECHTHERAPY CLINIC, WAS PROVIDED. THE EVALUATION PHASE OF
THE'PROGRAM IS NOW PLANNED. (DA)

OO
CDC)
0
THE NEW HANOVER COUNTY SCHOOL UNIT'S PLAN FOR
UTILIZATION OF THE FUNDS FOR TITLE 1 OF THE
ELEMENTARY AND SECONDARY EDUCATION ACT OF 1965
A STUDY
PRESENTED TO
THE FACULTY OF THE SCHOOL OF EDUCATION
THE UNIVERSITY OF NORTH CAROLINA
BY
JOHN J. SCOTT
TY,

U.S. DEPARTMENT Of HEALTH, EDUCATION & WELFARE
OFFICE Of EDUCATION
THIS DOCUMENT HAS BEEN REPRODUCED EXACTLY AS RECEIVED FROM THE
PERSON OR ORGANIZATION ORIGINATING IT. POINTS Of VIEW OR OPINIONS
STATED DO NOT NECESSARILY REPRESENT OFFICIAL OFFICE Of EDUCATION
POSITION OR POLICY.
THE NEW HANOVER. COUNTY SCHOOL UNIT'S PLAN FOR
UTILIZATION OF THE FUNDS FOR TITLE I OF THE
ELEMENTARY AND SECONDARY EDUCATION ACT OF 1965
A Study
Presented to
The Faculty of the School of Education
The University of North Carolina
In Partial Fulfillment
of the Requirements for Education 295
by
John J. Scott
January, 1966

ACKNOWLEDGMENTS
This study could not have been completed without the generous
help which came from many people. The author wishes to thank the
following people for the help that they have supplied.
To Dr. William H. Wagoner who authorized this as an official
study for the New Hanover County School Unit.
To Dr. Neal H. Tracy who advised the writer of this study.
To the central office staff of the New Hanover County School
Unit, as a whole; Mrs. Ethel Booth and the guidance counselors, who
compiled the dropout statistics; Mrs. Ruth Adams, who compiled the data
on testing; the teachers making up the Advisory Council; the unit's
principals, who gave their time during the early planning stages; Mr.
Dale K. Spencer, whose research located the eligible schools; Mr. Leon
Brogden, who compiled the results of the physical education testing
program; and Mr. John N. Bridgman, who served with Mr. Heyward Bellamy
as a steering committee in the development of this plan.
To Mr. Heyward Bellamy and Mr. Cyrus D. Gurganus for their
advice and help on many difficult issues.

CHAPTER
I.
TABLE CF CONTENTS
INTRODUCTION
The Problem OO OO
PAGE
1
1
Statement of the problem 1
Justification3.
Limitations of the study
Procedures
Establishment of project piiorities
Comparison of achievement
Evaluation of techniques
Definitions of terms used
Adjustment Classes
Corrective Center
Diagnostic Learning Center
Diagnostic Learning Center Coordinator
Educationally deprived child
Non - qualifying schools
Project Coordinator 0
Qualifying schools
Social Counselors
Teacher Technicians *
2
2
2
3
3
5.
5
5
5
5
5
5
5
5
6
6
Television Coordinator 2 6
Television Teacher 6

CHAPTER
Television Technician
Organization of Remainder of the Field Study
II. REVIEW OF THE LITERATURE
Language Arts 4,
Health .
8
8
9
Self- concept . 010
Specialist Teachers and Aides 10
MuSic11
Art 4,
12
Arithmetic 013
Social Studies 13
Science e . ,14
Physical Education 14
III. PRESENTATION OF DATA ID15
Funds available . 4, 4, 4, 4, 4115
Language Arts Achievement in Grades Three and Six 16
Reading Achievement in Grade Nine and Twelve . 16
Achievement in subjects other than Language Arts
and Reading 18
General Achievement in Grades Nine and Twelve 18
Health and Learning 19
Physical Fitness 026
Dropouts 0 27
Absences and Retentions . 31
IV. PROPOSED PROGRAM 33
Activities and Services 35

PAGE
Project Coordinator 35
Diagnostic Learning Center . 35
Diagnostic Learning Center Equipment 35
Referrals to the Diagnostic Learning Center 35
36
Corrective Centers .36
Specialist aid in non-academic areas . . . . 36
In-service education program . . . . 36
Summer program for specialists in the field
Specialists in the field of Language Arts
of Language Arts
Health programs .,
Physical Education
Adjustment class teachers .
37
37
38
38
The adjustment class program 38
39
39
39
Closed-circuit television 0 39
Summer library activities 0 40
Private school participation . 40
Home contact plans
Summer school .
Teacher technicians
Summary and Conclusions 41
BIBLIOGRAPHY 44
APPENDIX A. Physical Fitness School Medians . 46
,

TABLE
I.
X.
XI.
XII.
LIST OF TABLES
Priority of Needs
Qualifying and Non-qualifying New Hanover
PAGE
County Schools17
Mean Grade Level Achievement in Language Arts
for participating schools, third grade 20
Mean Grade Level Achievement in Language Arts
for participating schools, sixth grade ... 21
Reading percentiles for grade nine and
twelve in participating schools 22
Mean Grade Level Achievement in Arithmetic for third
grade pupils in participating schools 23
Mean Grade Level Achievement for sixth grade pupils of
participating schools in areas other than Language Arts . 24
Percentiles for grades nine and twelve for areas
other than reading 25
Homeroom Analysis of Health Needs for Qualifying Schools . 28
Homeroom Analysis of Health Needs for non-
qualifying schools 29
Homeroom Analysis of Physical Defects Grades 1 . 12 30
New Hanover County Dropouts 32

CHAPTER I
INTRODUCTION
The New Hanover County School system, located in south eastern
North Carolina, in an effort to obtain funds under Title I of the
Elementary and Secondary Education Act 1965s developed a proposal for
presentation to the proper state authorities for approval, so that the
unit could receive benefits made available through this legislation.
I. THE PROBLEM
Statement of the problem. The problem was the implementation of
an improved educational program in the qualifying schools of New Hanover
County. The needs of children in these schools had to be determined
and this diagnosis used as a basis for establishing a program of
improvement with the funds available under Title I of the Elementary and
Secondary Education Act 1965.
Justification. In New Hanover County,-3,635 children were found
to be eligible for this aid. To meet the needs of the educationally
deprived, funds were granted. With needed funds supplied, a program
was established to meet specific needs of the educationally deprived.
With a school program to meet the needs of this group of people, their
education was expected to continue for a longer period of time and the
dropout rate expected to lower. Students were better prepared to live
useful lives as citizens in a democratic society. John W. Frazer,

2
speaking at the seventieth annual meeting of the Southern Association
of Colleges and Schools, November 30, 1965, said, "Unless we break the
cycle of poverty, by 1970 we can expect that one out of every two
children in 1.,rge cities will bq in the category of the deprived child."1
By all known criteria, the majority of urban and rural slum
schools are failures. In neighborhood after neighborhood acrossthe country, more than half of each age group fails to completehigh school, and 5 per cent or fewer go on to some form of highereducation. In many schools the average measured IQ is under 85,and it drops steadily as the children grow older. Adolescentsdepart from these schools ill-prepared to lead a satisfying,,useful life or to participate successfully in the community.4
Limitations of the study. The study was limited to the New
Hanover County School Unit, in so far as geographical scope was con-
cerned. Further, the scope of this project was limited to areas that
were fundable only through the Elementary and Secondary Education Act
of 1965. Duplication of effort by the Board of Education and the
community action agencies was avoided in order to insure the most
effective use of the funds made available under Title I.
II. PROCEDURES
Establishment of project priorities. In order to determine
a project priority list in New Hanover County, it was decided to have
several meetings between members of the central office staff and other
groups in the school unit. Two conferences with the principals of the
unit's schools and two meetings with sixteen teacher representatives
made up this phase of the study. The meetings were all day work-
'Permission to quote secured.
2Jerrold R. Zacharias, Innovation and Experiment in Education
(Washington: U. S. Government Printing Office, 1964), p. 30.

3
conferences with substitutes for the teachers being provided by the
county. The teachers indicated that they believed the greatest need
was in the area of language arts. The principals believed in the
importance of language arts, but they felt that health needs must be
met before educationally deprived children could make optimum progress
in any academic area. These conferences were conducted along the
following lines: (1) introduction to the problem; (2) defining eli-
gibility of projects; (3) discussions about the unit's specific
needs; (4) breakup into small groups for continued discussion; and (5)
participants listing the priority of needs, as they considered the
matter. The priority lists constructed by the teachers and principals
of New Hanover County are illustrated in Table I.
Comparison of achievement. A study of the achievement of 3,635
children from the qualifying schools as compared with children in
schools in attendance areas of a higher socio-economic level in New
Hanover County was made in the following areas: reading in grades 3,
6, 9, and 12; general achievement in grades 3, 6, 9, and 12; summary of
physical fitness tests, grades 4.12; summary of health and physical
defects, grades 1-12; analysis of dropouts, grades 7-12, 1964-65;
analysis of student retentions, grades 1-12, 1964-65; and analysis of
student absences, grades 1-12, 1964-65. The findings in each of these
areas were discussed and were utilized as exhibits justifying the major
project and its sub-parts. These findings were further illustrated in
tables, to which references were made as each area was examined.
Evaluation of techniques. The findings in each of the areas
compared showed specific needs of the qualifying schools. Funds pro-
vided by the act allowed New Hanover County to establish a program
. .

PRIORITY OF NEEDS
Need Ranking byTeachers
Ranking byPrincipals
Language Arts:
Health:
NurseSuppliesMedicalFoodClothing
Instruction:
Adjustment ClassesContinuation ProgramWork StudyTutorialEnrichment Classes
Pupil Personnel Services:
GuidanceCoordinatorsSocial WorkersPsychologistsSpecial Teachers
1
2
2
1
3 3
4 4

specifically designed to alleviate the problems of the educationally
deprived child.
III. DEFINITIONS OF TERMS USED
5
Ad ustment Classes. These were small classes of twenty or
fewer students on the junior and senior high school levels. A flexible
program was designed to meet specific needs of individuals.
Corrective Center. The Corrective Center was an office located
in each qualifying school to serve as the headquarters of the corrective
specialist when that person was in the school.
Diagnostic Learning Center. The Diagnostic Learning Center
established in the unit's central office, served all qualifying schools.
Diagnostic Learning Center Coordinator. This person directed
the work of the staff located at the Diagnostic Learning Center, and
coordinated the work of the specialists in the qualifying schools.
Educationally deprived child. These children were defined as:
Children whose educational achievement is below or without
special aid are likely to fall below that normally expected of
children of their age and grade. The term also includes children
who are handicapped by physical, mental, or emotional impairment.
Non-qualifying schools. These were schools which did not meet
the criterion necessary in order to be provided for by the program.
12s2ject. Coordinator. The program was under the immediate super-
vision of the Project Coordinator, who was assigned to the staff of the
unit's director of instruction.
Qualifying schools. Schools referred to in this way were those
3School Programs for Educationally Deprived Children. U. S.
Department of Health, Education, and Welfare Office of Education,
Washington, D. C., 1965, P. 1.

6
which met the criterion established as necessary in order to be included
in the program.
Social Counselors. These persons made home contacts in cases
where student difficulties indicated the need for such action. The
counselors visited homes of dropouts in an effort to get them back into
school.
Teacher Technicians. These people had previous college training
or were currently enrolled in an approved college program. The tech-
nicians were assigned to work with the primary grade teachers.
Television Coordinator. A bachelor's degree and a minimum of
three successful years of teaching experience were required for the
Television Coordinator, who was assigned to the staff of the Director of
Instruction. He was responsible for the selection and training of
other studio personnel, and for the content and the quality of the
programs.
Television Teacher. A class "A" certificate in elementary edu-
cation and successful teaching experience were established as qualifi-
cations for this position. The television Teacher was responsible for
the development and the prec:entation of television lessons, and assisted
with in-service programs dealing with the use of television in the
classroom.
Television Technician. The pori.:1n, holding this position was at
least a high school graduate with addl'donal training in electronics.
The technician was responsible to Le Television Coordinator for the
operation and maintenance of all studio equipment.
IV. ORGANIZATION OF THE REMAINDER
OF THE FIELD STUDY
The remainder of the field study included a review of the
literature, a report on the results of research in the New Hanover
County unit, and a proposed program for the educationally deprived
students.

REVIEW OF THE LITERATURE
The Elementary and Secondary Education Act of 1965, Title I,
called for financial assistance to local educational agencies for the
education of children of low=income families. The literature relative
to the topic at hand was limited. The recency of the act obviated the
existence of extensive writings and evaluations of the act.
Inasmuch as it appeared that communication skills were basic
to a continuing education, no child should be deprived of the opportunity
to develop these skills. Strickland, in support of this position,
stated:
He cannot learn to read chemistry, higher mathematics, psy=
chology, economics, or all the other intellectual matter into
which he may be drawn in later years. To learn to deal with the
vocabulary of these areas would do him no good until he has
occasion to use the vocabulary and hall developed the background
and the maturity for understanding it.'
Evidence indicated that an effective way to improve language
facilities was to begin with a diagnosis to determine the difficulties.
This was seen in the following paragraphs:
A teacher who desires to help a retarded reader needs to
study the individual diagnostically. The diagnostic study will
help the teacher know the child better and understand the cause
of his retardation in reading.
Another type of diagnosis is needed. Before the teacher can
1Ruth G. Strickland, The Language Arts in the Elementary School
(Boston: D. C. Heath and Company, 1957), p. 2Z5.
9
begin an effective corrective program it is necessary to know what
the child needs to learn in order to become a good reader. A study
must be made to determine what reading skills the child now pos-
sesses and what skills he must learn. Then the teaching of reading
may be specific, and designed to equip the child with the specific
skills which he needs. It is frequently said in reading clinics the.
the teaching of reading begins with appraisal and must be specific.'
Gordon, writing on educational trends in meeting the needs of
poverty stricken children, stated:
The principal focus of fundamental curricular change in com-
pensatory programs has been reading and language development.
New reading methods and materials, the training of teachers to use
them and the extensive use of such special personnel as remedial
reading teachers or reading specialists all are evidence of the
primacy of reading in the hierarchy of school learning.3
A paper given by Doxey A. Wilkerson, at the Western Regional
Membership of the College Entrance Examination Board, crane 7, 1964,
dealing with the subject of education for disadvantaged children,
reported:
All of the programs that we have learned about stress language
arts and reading. Explanation of the reading emphasis, of course,
is quite obvious. All of the studies that have been made of the
academic performance of disadvantaged children reveal, among other
things, major deficiencies in the use of language, a basic tool
for all other academic success. But more than that, as the studies
of Bernstein, in London, and others are pointing out, language
development is intimately tied up with cognitive development itself.
It is more than a tool for learning, but the process of linguistic
growth directly conditions cognitive growth. Hence, language de-
velopment is fundamental; and efforts to improve language abilities
of disadvantaged children are characteristic of all of the programs
we have thus far heard about.4'
Learning was recognized as related to the health of the indi-
vidual. "While the satisfaction of all needs depends in some degree on
2Carl F. Brown and Richard Walser, A Guide to Curriculum Stuk
English Language Arts (Raleigh: State Board of Education, 1959), p. 29..
3Edmund W. Gordon, "A Review of Programs of Compensatory Educa-
tion," Reprinted from American Journal of Orthopsychiatry, XXXV (July,
1965), 644.
4Permission to quote secured.

10
the extent to which other needs are met, the importance of physical
health is apparent."5 Olson, writing on experiences for growth, said:
Adequate planning for growth includes provisions for food,
exercise, shelter, clothing, health protection, and opportunities
for learning. All areas of nurture are interppendent, and
advances are best made by work on all fronts. bb
A section of the National Education Association's project on
the instructional program, of the public schools, dealing with health
education, stated that:
Emphasis on health education is particularly important in a
curriculum for the culturally deprived child. To be effectivethis instruction, too, must be realistic for the child's situa-
tion. . . . Since economic deprivation is a major factor in the
health problems of the culturally disadvantaged, special servicesthe school can help mobilize from other community agencies should
be considered.f
The value of one's self-concept was realized and emphasized
as the main underlying necessity in reaching one's potential. Lee and
Lee, in stressing the importance of the self-concept, wrote:
If a child's concept of himself is that of someone whom otherpeople are friendly toward, he is friendly in turn. But, if he
sees himself as someone whom others ignore or belittle, his con-
cept of himself is poor. He reacts accordingly and withdraws orstrikes out beforg the other person has a chance to establish a
friendly feeling. °
Gordon pointed out that different programs have been provided
for classroom teachers in order that individual instruction might take
place. In this connection, he stated:
Various programs have provided time for classroom teachers to
5J. Murray Lee, and Dorris May Lee, The Child and His Curriculum
(New York: Appleton-Century-Crofts, Inc., 175.60777-3. 24.
6Willard C. Olson, Child Development (Boston: D. C. Heath and
Company, 1949), p. 325.
?Dorothy M. Fraser, Deciding, What to Teach (Washington: National
Education Association of the United States, 177 p. 59.
8Lee, 22. cit., p. 31.

IS?
11
offer individual instruction and generally function with greater
flexibility. These programs include employment of extra class-
room teachers; use of specialists in such areas as music, science,
art, or mathematicg, and use of volunteer aides to assume routine
classroom burdens.
Evidence appeared to indicate that teacher technicians were of
great strength to instructional programs. A progress report by the
staff of the North Carolina Comprehensive School Improvement Project
reported:
In general the reactions made by the respondents that favored
the teacher aide services were: (1) teachers had more time to
teach; (2) teachers had more time for planning; (3) contributed to
instructional program by taking on clerical duties of the teachers;
(4) contributed to the instructional program by helping with
preparation and in securing instructions}} materials and supplies;
and (5) teacher aides are indispensable."
Evidence existed to indicate the need for a strong music
program. "General music is a special area and the teacher of general
music is, or should be, a highly skilled specialist."11
Wilson, writing on the title "Why Music Education? ", stated that
music gave a basis for forming value judgments. In this connection,
he wrote:
"Value judgment" means being able to distinguish between right
and wrong, between good and bad, between material that has intrinsic
worth and that which is cheap, tawdry, or vulgar. The ability to
form value judgments helps to differentiate man from other species- -
makes him different from an animal or vegetable.12
9Gordon, loc. cit.
10North Carolina Comprehensive School Improvement Project Staff,
"A Progress Report of the North Carolina Comprehensive School Improvement
Project 1964-65 School Year" (Raleigh: State Department of Public
Instruction, 1965), p. 11. (Mimeographed.)
11liyman I. Krongard, "Why Music in the Public Schools?", Music
Educators Journal (September-October, 1963), 127.
12A. Verne Wilson, "Why Music Education?", The National Elementary
Principal, XXXIX (December, 1959), 8.

12
Taylor, writing on music as a source of knowledge, stated:
We do know, from the experience which teachers have had with
students in the arts, that one of the quickest ways to the creation
of a live intelligence is to provide an opportunity for those who
have been culturally deprived to engage directly in one of the
arts.13
Krongard, writing on music as a teaching tool, said:
Music can be and is a powerful and pervading teaching tool. In
social studies, in geography, in citizenship education, in litera-
ture, art and drama, in language arts, in foreign languages, even
in the remedial reading pgram, proper and full use of music can
illuminate subject areas.
Writing on the importance of art to the curriculum, Haan said:
Art teachers learned before many other teachers did the impor-
tance of giving the child autonomy in the learning and exploring
process of art. The sequential organization of experiences in
art is dependent on understanding children's developmental stages.
Because art expression is so. central to personality development
the products of children have particular significance for the
teacher who wants help in understatlding the meaning the child's
behavior has to the child himself.J6
Working on the problem of who should teach art, Lee and Lee
said, in part:
Seeing the depth and breadth to which the program has developed,
only a specialist in the field can know all of it. Hence, the
answer seems to be that the art specialist is needed to work with
teachers and, occasionally, in certain situations and for specific
purposes directly with the children.
The art specialist can help the teacher think through a project
so that the all important accuracy of concept is retained but the
art work is of a much more desirable nature. The art specialist can
13Harold Taylor, "Music as a Source of Knowledge," Music Educa-
tors Journal (September - October, 1964), 151.
14Krongard, 22. cit., p. 124.
15Aubrey Haan, Elementary School Curriculum (Boston: Allyn and
Bacon, Inc., 1961), p. 263.
also help Oe teacher with the various media, techniques, andmaterials.1°
Writing on the subject of organizing for teaching arithmetic,
Stendler pointed out that pupils differ in arithmetic as they do in
reading. This author then wrote:
To provide for these individual differences, the class
may be divid3d into sin *11 groups or some plan of individual
instruction developed.4
Lee and Lee, wrote on grouping for arithmetic instruction in
the following manner:
Some children will be working on concrete, some on semi -
concrete, and some on abstract experiences. Such a program requires
the teacher to be very familiar with the ability and achievementlevel of his pupils. . . .
18
In dealing with the problem of improving children's learning in
the social studies, Michaelis wrote:
Teachers should also understand and be sensitive to differences
among children due to varying social backgrounds, recognizing thatchildren from the lower classes differ from those in the middle andupper classes ilettitudes, moral values, customs, privileges, and
training.
Lee and Lee came to grips with this same social problem. In this
connection they wroteon the development of values in the following
manner:
The home, church, school, and other agencies that work with
children are all concerned with values. Certainly all forces do not
16Lee, sz cit., p. 532.
17Celia B. Stendler, Teachin in the Elementary School (New York:
Harcourt, Brace and Company, 1958 , p. 230.
18Lee, 22. cit., p. 392.
19John U. Michaelis, Social Studies for Children in a Democracy
(Englewood Cliffs: Prentice. -Hall, Inc., 19-56),1-7767-

14
York to develop the same values. The result is conflict and
uncertainty. These conflicts complicate the problem for both
the teacher and the learner. Conflicts sometimes occur between
home and school. The school is most likely to hold to middle -
class values. Lower -class homes are likely to have a different set
of values. Obviously, problems will,Arise due to value conflicts
unless the teacher is understanding."
Lee and lit;e, writing on the subject of developing scientific
concepts, said:
Man's greatest problem is the control of natural forces and the
forces which he has put into operation for the welfare of all.
These man-made forces created as a result of scientific development,
have only partially contributed to the common good. Schools have
been principally concerned with a type of descriptive knowledge
about the result of scientific development. The real concern
should be directed to science as a way of thinking and as an element
which max or may not contribute to social good, depending upon
control.'1
Dealing with the way curriculum varies with the neighborhood,
Haan made the following comments in respect to physical education:
Physical education has a role to play in personality development
second to no other elementary school area. Seen primarily as a
contributer to the child's health, his physical skills, and his
acquisition of moral values, it should also be seen, and utilized,
for its contribution to his solution of some of his normal con-
flicts. . . . Physical education is peculiarly valuable in helping
the children from some lower socioeconomic areas make the transition
from personal, physical aggressions to the organized, socially
approved aggressiveness of slam and individual games. It is an
accepted medium for learni.3f1- some of the values of sportsmanship
and interpersonal relations generally that these children will need
to become mobile persons. .
Each school staff should look carefully at the physical skills
of its pupils and at the kinds of purposes physical education can
serve. 22
20Lee, 22. cit., p. 235.
21Lee, 22 cit., pp. _406.407p,
22Haan, 22. p. 114.

CHAPTER III
PRESENTATION OF DATA
As defined by the Act, low income families will.e those whose
annual income was less than $2,000. Also included were those families
who received assistance under the plan for aid to dependent children.
This standard was used through the year ending on June 30, 1966. Since
exact information concerning income was not available, the 1960 census
was authorized to be used for making this determination.
I. FUNDS AVAILABLE
Using the 1960 census figures, the amount of money to be allo-
cated to New Hanover County, under Title I, was $591,321,44, These
funds were based on 3,656 eligible children five to seventeen years of
age. New Hanover County had twenty-seven schools. The total number of
children served was 19,134. The per Cent of low-income families was
18.99. The Act called for the local public school personnel to determine
the degree of concentration of children from low-income families within
each attendance area, as compared to the concentration for the district
as a whole. In order to be eligible for funds, under Title I, a school
had to have a concentration of eligible children which was the same as
or greater than, the concentration of such children for the unit as a
whole. Schools also became qualified when they 'did not have the
necessary concentration of low- income children hit met another qualifying
g.,
16
criterion. This second reason for qualification existed when the school
in question served children from feeder schools which were qualified.
Utilizing these formulas for eligibility, it was found that New Hanover
County had seventeen qualifying schools. It was important to note that
New Hanover High School, Sunset Park Junior High School, and Chestnut
Street School were qualified by virtue of the eligibility of schools
from whom they received students. These eligibility statistics are
illustrated in Table II.
II. LANGUAGE ARTS ACHIEVEMENT IN
GRADES THREE AND SIX
The achievement studies indicated that the qualifying schools
were below the remaining schools in the county in the language arts
area. Table III, page 20, compared the qualifying and non-qualifying
schools in the area of language arts for the third grade; the same
information for the sixth grade was gathered and illustrated in Table
IV, page 21.
III. READING ACHIEVEMENT GRADES
NINE AND TWELVE
Table V, page 22, appeared to indicate that the children in the
qualifying schools operated at a disadvantage When their reading skills
were compared with the same skills of children in the non-qual4ying
schools. Table V, illustrated that there was only one non-qualifying
school on the junior and senior high school levels. The two schools with
higher percentile scores than the non-qualifying school and the one
school which tied with the non-qualifying school were schools which were
qualified because they received pupils from qualifying schools rather than
xma,ww4mowapsa5===7,T3ZW:i5X17

TABLE II
QUALIFYING AND NON-QUALIFYINGNEW HANOVER COUNTY SCHOOLS
17
School AttendanceArea
All Eligible Per cent of
Children Children Concentration
Served
Washington CatlettWilliam H. BlountWilliston Sr. HighD. C. Virgo Jr. HighPeabodyWilliston Jr. HighJames B. DudleyMary Washington HoweGregoryWilliam HooperTilestonLake ForestWrightsboroCarolina Beach
38585888632705866488481
1,226259408
1,026633254
1925839126328935419318847893139325123
49
50.044.144041.641.040.9
39.539.139.035.934.131.719.419.3
New Hanover High 2,466 253 10.3
Sunset Park Jr. High 705 50 7.1
Chestnut 1,380 73 5.3
Sunset Park Elem. 987 30 3.0
J. C. Roe 385 11 2.9
Forest Hills 519 9 1.7
Ogden 297 5 1.7
College Park 470 7 1.5
Roland-Grise Jr. 1,248 18 1.4
Winter Park 725 9 1.2
Bradley Creek 730 6 .8
Edwin A. Alderman 544 2 .4
Wrightsville Beach 189 0 0.0
Total 19,134 3.635 18.9
NOTE: The first fourteen schools listed were qualified due to
concentration. of low -income families. The next three schools were
qualified because they received pupils from schools that were qualified.
The last ten schools on the list, beginning with Sunset Park Elementary,
were not qualified.

18
because of the concentration of students from low-income homes.
IV. ACHIEVEMENT IN SUBJECTS OTHER THAN
LANGUAGE ARTS AND READING
It was decided to check the achievement of children in the
different schools in major areas other than reading. Third grade
pupils were compared in arithmetic comprehension and problem solving;
the sixth grades were evaluated in the areas of arithmetic compre-
hension, problem solving, social studies information, and social
studies study skills; and grades nine and twelve were checked in mathe-
matics, science, and social studies. In this portion of the study,
certain significant findings were brought to light. In the third
grade, achievement in arithmetic comprehension greatly favored the non -
qualifying schools. Of the ten qualifying elementary schools, only
four achieved a comprehension of from 4.0 to 4.5. The nine non-
qualifying schools ranged from 4.1 to 4.8. In the area of problem
solving, the qualifying schools were spread from 2.9 to 4.3; the non.
qualifying schools were ranked from 3.4 to 5.3. It was interesting to
note that the non- qualifying school with the lowest ranking in compre-
hension and problem solving was a school in a very low- income area that
was slightly over the maximum qualifying income figure. The results of
the comparisons are illustrated in Tables VI, page 23, and Table VII,
page 24.
The comparison in general achievement for the ninth grade was in
favor of the one non-qualifying school. The only qualifying school whose
ninth grade students scored higher than the non -qualifying school's stu-
dent body was one of the schools which had been qualified because it drew
some students from a qualifying school. These findings are disclosed in

Table VIII, page 25.
V. HEALTH AND LEARNING
19
The health of the child was closely related to his efficiency
as a learner. The steps taken to improve language arts in qualifying
schools, in order to succeed, had to be presented to healthy, well fed,
adequately clothed children. The area of health and physical education
constituted an important supplementary area, as the problems of learning
were considered.
This study established an analysis of health needs in order to
determine whether or not the health needs in the qualifying schools
were more critical than in the non-qualifying schools. Four general
types of defects were evaluated. They were_dental,visual,_audio, and
amiscellaneous classification for other defects. Needs were broken
down as nutritional, examinational, clothing, and psychological. The
findings of this survey follow:
1. Under the heading "Dental" the qualifying schools had a
high of 93.8 per cent and a low of 4.0 per cent. The high
for non - qualifying schools, under this heading, was 38.7
with a low of 1.4 per cent.
2. Visual defects for the qualifying schools ranged from 17.8
to 1.4 per cent, as compared with a high of 38.8 per cent.
to a low of .4 per cent in the non-qualifying schools.
3. The qualifying schools showed audio defects of from 5.6 to
0 per,cent. The same defect went from 1.1 per cent to 0
in the non - qualifying schools.
4. Other defects in the non-qualifying schools ranged from a

TABLE III
MEAN GRADE LEVEL ACHIEVEMENT IN LANGUAGE ARTS
FOR PARTICIPATING SCHOOLS
THIRD GRADE
Qualifying Schools
aD
Non-Qualifying Schools
eo C 0 Cd
eD
Peabody
Mary W. Howe
Tileston
Wk. H. Blount
Gregory
Lake Forest
Win. Hooper
Wrightsboro
Carolina Beach
Chestnut
Means
2.8
3.8
2.9
3.1
5.0
3.4
3.1
3.6
3.1
3.2
3.2
2.6
3.4
4.5
3.5
3.6
3.9
4.1
3.8
4.9
4.4
3.8
4.7
4.7
4.0
4.8
5.1
-11.1
3.4
4.3
3.7
J. C. Roe
Sunset Park Elem.
Ogden
College Park
Bradley Creek
Forest Hills
Wrightsville Beach
Winter Park
Edwin A. Alderman
3.5
3.7
3.8
3.9
3.9
4.2
4.5
4.7
5.22
3.9
3.8
4.6
4.9
4.2
4.3
4.7
4.4
5.4
4.8
5.1
5.0
5.2
5.5
5.6
5.9
12.1
6.0
4.1
4.9
5.0
NOTE:
The test from which these figures were compiled was given in April,
1965.
The Metropolitan Complete Achievement test was used.

TABLE IV
MEAN GRADE LEVEL ACHIEVEMENT
IN LANGUAGE ARTS
FOR PARTICIPATING SCHOOLS
SIXTH GRADE
Qualifying Schools
44
Win. H. Blount
4.30
James B. Dudley
4.30
Gregory
4.90
Lake Forest
5.86
Wm. Hooper
5.91
Tileston
5.95
Wrightsboro
6.55
Chestnut
6.98
Carolina Beach
8.65
Means
5.47
ea
11
Non-Qualifying Schools
A
5.12
5.10
6.22
5.68
6.48
5.89
7.02
6.85
7.79
6.89
6.23
6.25
7.01
7.48
7.06
7.32
2.11
7.95
6.55
6.21
Ogden
J. C. Roe
Bradley Creek
Sunset Park Elem.
Winter Park
College Park
Forest Hills
Edwin A. Alderman
Wrightsville Beach
5.14
6.26
6.85
6.87
7.41
7.51
7.99
8.02
9.48
7.24
.111
.11
OD
ri
r4
a) OD ti° p-1
6.47
6.02
7.10
6.97
7.10
7.62
7.20
7.92
7.81
8.24
7.40
7.43
7.46
8.55
8.33
8.64
8.55
9.62
7.32
7.97
NOTE:
The test from which these figures were compiledwas given in April,
1965.
The Metropolitan Complete Achievement
test was used.
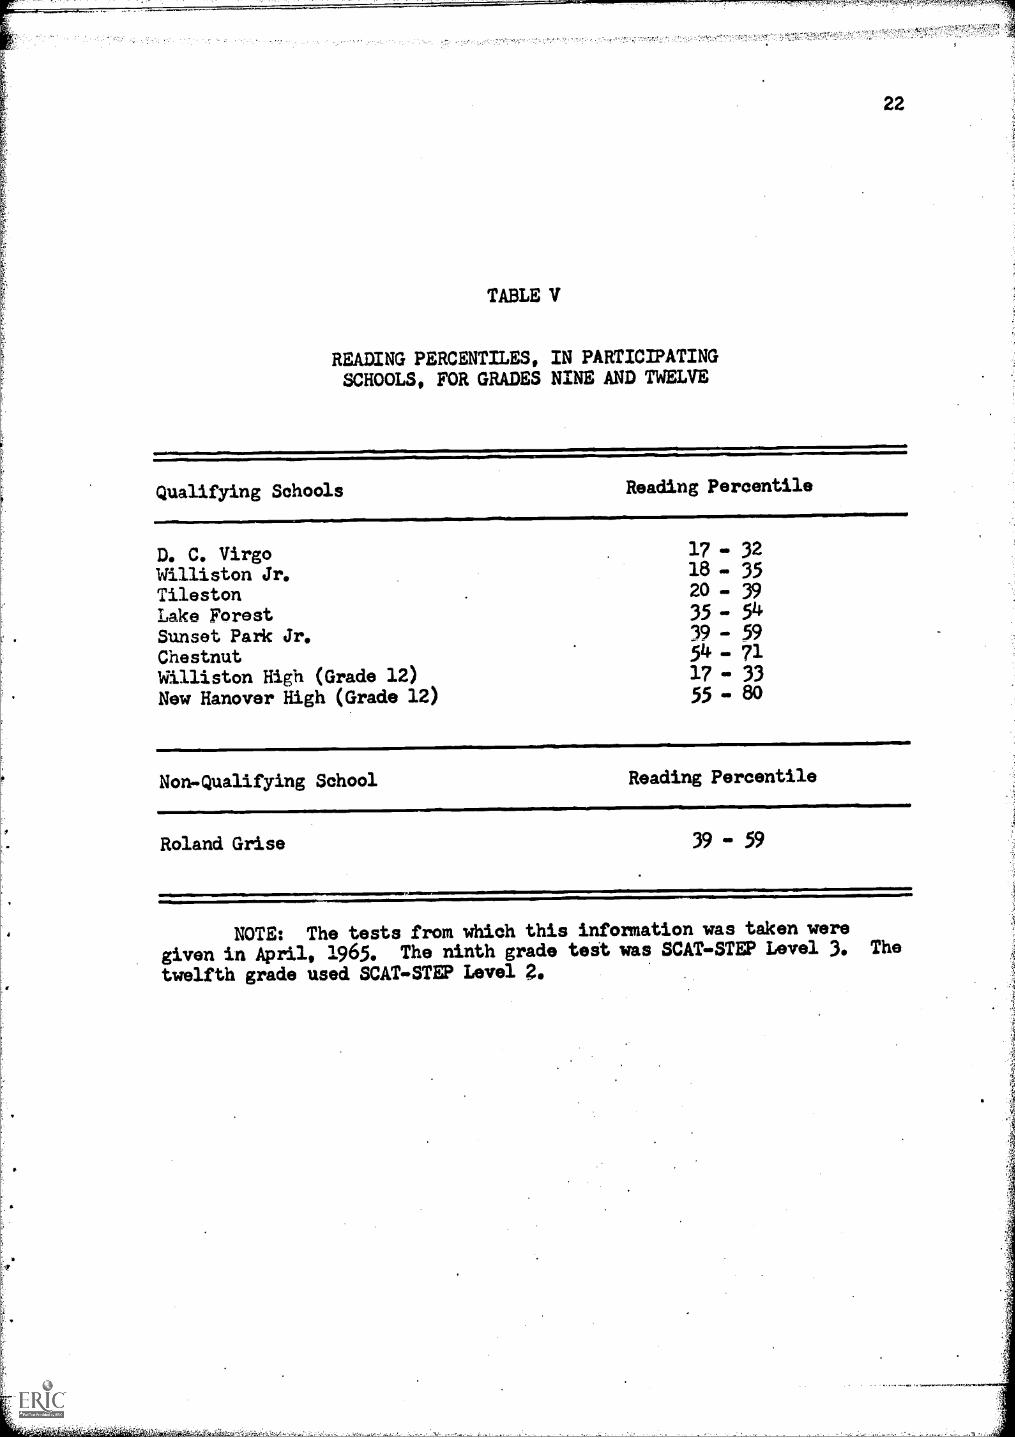
TABLE V
READING PERCENTILES, IN PARTICIPATINGSCHOOLS, FOR GRADES NINE AND TWELVE
Qualifying Schools Reading Percentile
D. C. VirgoWilliston Jr.TilestonLake ForestSunset Park Jr.ChestnutWilliston High (Grade 12)New Hanover High (Grade 12)
17 - 3218 3520 3935 - 54
39 - 5954 . 7117 -3355 80
Non.Qualifying School Reading Percentile
Roland Grise 39 - 59
NOTE: The tests from which this information was taken were
given in April, 1965. The ninth grade test was SCAT-STEP Level 3. The
twelfth grade used SCAT-STEP Level 2.

TABLE VI
MEAN GRADE LEVEL ACHIEVEMENT
IN ARITHMETIC
FOR PARTICIPATING SCHOOLS
THIRD GRADE
Qualifying Schools
0-
0 v40
mv4
04,
0
vi 0
44f.40
Non-Qualifying Schools
gbD
0 g
Erg
ex,
1471. H. Blount
Mary W. Howe
Peabody
Tileston
Lake Forest
Gregory
William Hooper
Wrightsboro
Carolina Beach
Chestnut
Means
3.1
3.5
3.5
3.7
3.8
3.9
4.0
4.3
4.3
AL/
3.8
2.9
3:3
3.0
3.2
3.7
3.4
3.8
4.0
3.8
3.5
J. C. Roe
Ogden
College Park
Forest Hills
Wrightsville Beach
Edwin A. Alderman
Sunset Park Elem.
Bradley Creek
Winter Park
4.1
3.4
4.1
3.7
4.2
3.8
4.2
4.2
4.2
4.6
4.3
4.7
4.3
4.1
4.7
4.0
4.8
1,2
4.4
4.2
NOTE:
Tho test from which these figures were compiled was
given in April, 1965.
The Metropolitan Complete Achievement
test was used.

TABLE VII
MEAN GRADE LEVEL ACHIEVEMENT
IN AREAS
OTHER THAN LANGUAGE ARTS
SIXTH GRADES
Qualifying
Schools
.11
0 M
or, g X
4) 0
0 .1Non-Qualifying
4.,
fZ a.
Schools
44
Wm. H. Blount
5.66
Gregory
5.98
James B. Dudley
6.33
6.44
6.48
6.84
6.91
Lake Forest
Tileston
Wrightsboro
Chestnut
Wm. Hooper
Carolina Beach
5.40
i.55
4.59
J. C. Roe
6.35
6.37 6.98
5.49
5.85
4.89
5.00
Ogden
6.49
5.91 5.51
5.40
5.58
4.65-
4.58
Bradley Creek
7.12
7.11 7.04 6.95
6.51 6.42
5.42
Sunset Park Elem.
7.31
7.31 6.66
6.12
6.49
5.75
5.19
Forest Hills
7.40
7.65 7.92 7.43
7.18 6.82
5.87
College Park
7.43
7.11 7.11
7.27
7.21
6.91
7.07
Winter Park
7.44
7.32 6.86
7.22
7.30
6.71
7.51
5.30
Wrightsville Beach 8.79
8.55 7.55
9.03
7.70
1.2.
17.88
Zell
Edwin A. Alderman 22.81
8.09 7L 7.46
6.39
6.14
5.64
5.36
7.32
7.30 7.08 6.83
...11
1011
0111
1110
1....
....1
00.1
,*
NOTE:
The Test from which these figureswere compiled was givenin April, 1965.
The Metropolitan Complete
Achievement test was used.
,rrz
vptn
.t:ri
v:,:F
,R+
r.I.
7,!r
qrtf
ig'e
gp:&
J'M
t!31
,4rA
M7T
-M"'
,ale
aver
ra,a
rani
annu
arad
:

.1111.1111111011...111
TABLE VIII
PERCENTILES FOR GRADES NINE AND TWELVE
FOR AREAS OTHER THAN READING,FOR PARTICIPATING SCHOOLS
Qualifying Schools
0 00 ri 0g
+.1 n1 ea
COX CO 03 03
D. C. Virgo. 00 - 29 09- 38 08. 27
Williston Jr. 11- 43 12- 45 15 - 43
Tileston 12 - 44 16 - 50 18 - 46
Lake Forest 21 - 55 24 - 58 28 - 58
Sunset Park Jr. 21 - 55 38 - 76 43 . 69
Chestnut 49 . 72 64 - 90 63 - 84
Williston Sr. (Grade 12) 07 - 29 09 - 43 17 - 47
New Hanover High (Grade 12) 51 - 76 48 - 78 63 - 79
Non-Qualifying School
Roland Grise 35 - 66 45 - 79 52 - 77
NOTE: These tests were given in April, 1965. Ninth grade test
was SCAT-STEP, Level 3. The Twelfth grade used SCAT-STEP, Level 2.
26
high of 4.1 to 0. The qualifying schools went from a high
of 15.7 to a low of 0 per cent.
The gap between the two school groups in the four areas of needs
was as pronounced as were the differences under the defects heading.
The non-qualifying school with the highest incidence of defects and needs
was the same school that was referred to earlier as having the lowest
combined comprehension and problem solving ranking of all the non.
qualifying schools. It was believed that the result of the homeroom
analysis of health defects and needs clearly established the fact that
health defects and needs loom menacingly in the path of efforts to
strengthen and enrich the school experiences of the children concerned.
The results of this analysis are illustrated in Table IX, page 28,
and Table X, page 29.
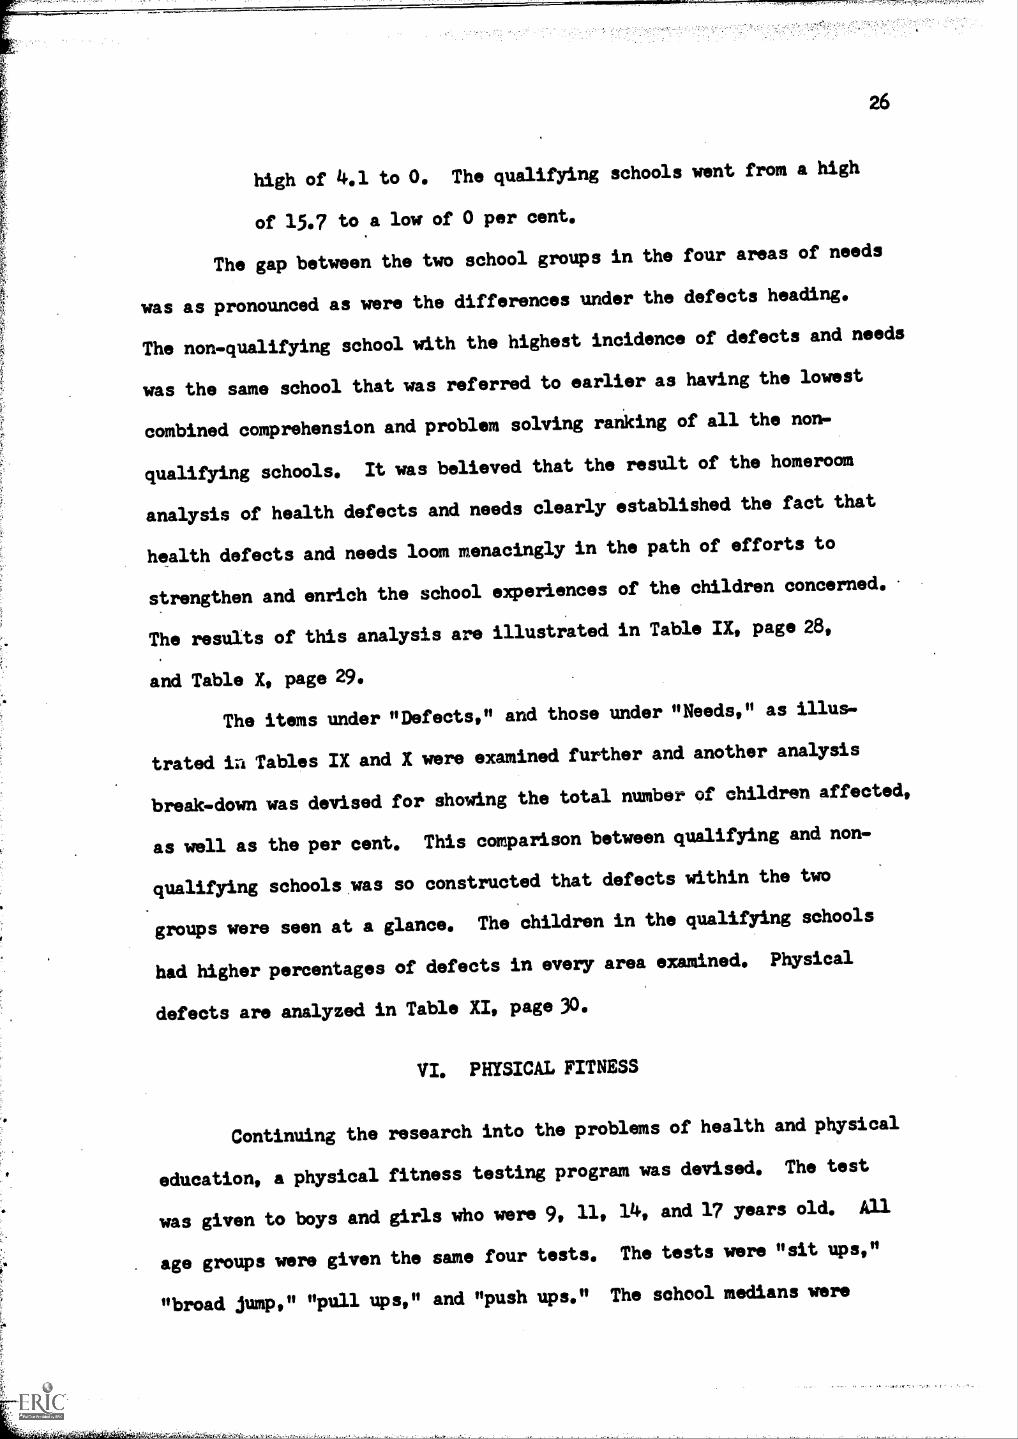
The items under "Defects," and those under "Needs," as illus-
trated is Tables IX and X were examined further and another analysis
break-down was devised for showing the total number of children affected,
as well as the per cent. This comparison between qualifying and non-
qualifying schools was so constructed that defects within the two
groups were seen at a glance. The children in the qualifying schools
had higher percentages of defects in every area examined. Physical
defects are analyzed in Table XI, page 30.
VI. PHYSICAL FITNESS
Continuing the research into the problems of health and physical
education, a physical fitness testing program was devised. The test
was given to boys and girls who were 9, 11, 14, and 17 years old. All
.age groups were given the same four tests. The tests were "sit ups,"
"broad jump," "pull ups," and "push ups." The school medians were

compared with North Carolina median scores as well as with the scores
of the qualifying and non - qualifying schools. The non - qualifying
schools reported "pull up" and "push up" scores that were slightly
higher than those reported by the qualifying schools. The results of
this physical fitness testing program are contained in Appendix A.
VII. DROPOUTS
A study of dropouts in the junior and senior high schools
showed that in the 1964.1965 school year, a total of 215 boys and 167
girls dropped out of school in New Hanover County. Of this total of
382 dropouts, 12 came from the one non - qualifying junior high school.
The qualifying schools had 370 dropouts. The reasons for dropping
out, as recorded in school registers, were listed as follows:
Reason Number
Reached 16th birthday 110
Physical or mental illness 20
EmplOyment 12
Correctional institutions 15
Joined armed forces 19
Marriage 63
Dismissed from school 37
Unknown 106
A follow up study of the 382 dropouts disclosed the following infor
mation:
Re-entered school
Working
Unemployed
27

TABLE IX
HOMEROOM ANALYSIS OF HEALTH NEEDS
28
Defects
QualifyingSchools
0rf
William H. Blount 93.8 13.5
Tileston 55.4 9.9Washington Catlett 50.0 2.6
James B. Dudley 42.1 17.8William Hooper 40.4 7.8Peabody 38.1 8.1
Wrightsboro 27.3 7.1D. C. Virgo Jr. 26.5 17.5
Gregory 22.9 9.0Mary W. Howe 19.7 2.3
Lake Forest 19.6 8.4Williston Jr. 19.5 10.1
Carolina Beach 18.1 5.0
Sunset Park Jr. 16.3 5.6
Chestnut 12.2 5.1
Williston Sr. 9.8 6.3New Hanover High 4.0 1.4
0
Needs
S
I
4.5 4.9
2.7 9.6.09 0.0
5.6 15.70.0 6.41.1 4.21.4 3.94.1 7.0
3.2 7.41.7 0.0
1.1 1.61.1 5.61.4 3.6.8 .5
.3 1.01.2 1.6.4 .2
13.1 9.8
19.5 32.318.4 10.518.0 23.013.8 14.07.8 13.97.9 6.93.8 10.88.1 8.49.4 2.8
3.8 2.94.1 6.42.3 2.3.1 0.0
.7 .7
.87 3.4
.4 1.6
18.1 19.417.7 22.534.2 50.028.4' 13.016.5 19.28.1 10.95.1 6.56.8 6.0
8.2 8.1
5.8 1.7
3.5 5.35.3 8.3.5 7.7
0.0 3.3.06 4.8
2.5 3.9
.07 9.9
NOTE: The figures in this table are expressed in per cent.

29
HOMEROOM ANALYSIS OF HEALTH NEEDS
Non-QualifyingSchools
Defects
r-4
4-1
r4
:la044 0
J. C. Roe 38.7 38.8 .6 4.1
Sunset Park Elem. 34.6 2.5 1.1 .8
College Park 22.7 .7 .7 .0
Ogden 13.8 .7 .0 .0
Forest Hills 13.8 .4 .2 .2
Bradley Creek 11.2 4.2 .1 .0
Roland-Grise 6.2 2.5 .2 .3
Winter. Park 5.7 .6 .0 .1
Wrightsville Beach 5.3 1.7 .5 .0
Edwin A. Alderman 1.4 .4 .0 .0
Needs
rgcd
0 r-Icd
0 .1-1ba
0 0.4i T1 04 I-1
9.5 38.8 8.5 13.21.2 1.6 .8 3.41.4 .0 .2 2.91.1 .0 .7 3.0
3.0 6.5 4.5 6.7.4 .6 1.1 3.1
.8 .7 .7 4.9
.1 .0 .0 1.9
.0 .0 .0 3.5
.0 .0 .0 .4
NOTE: The figures in this table are expressed in per cent.
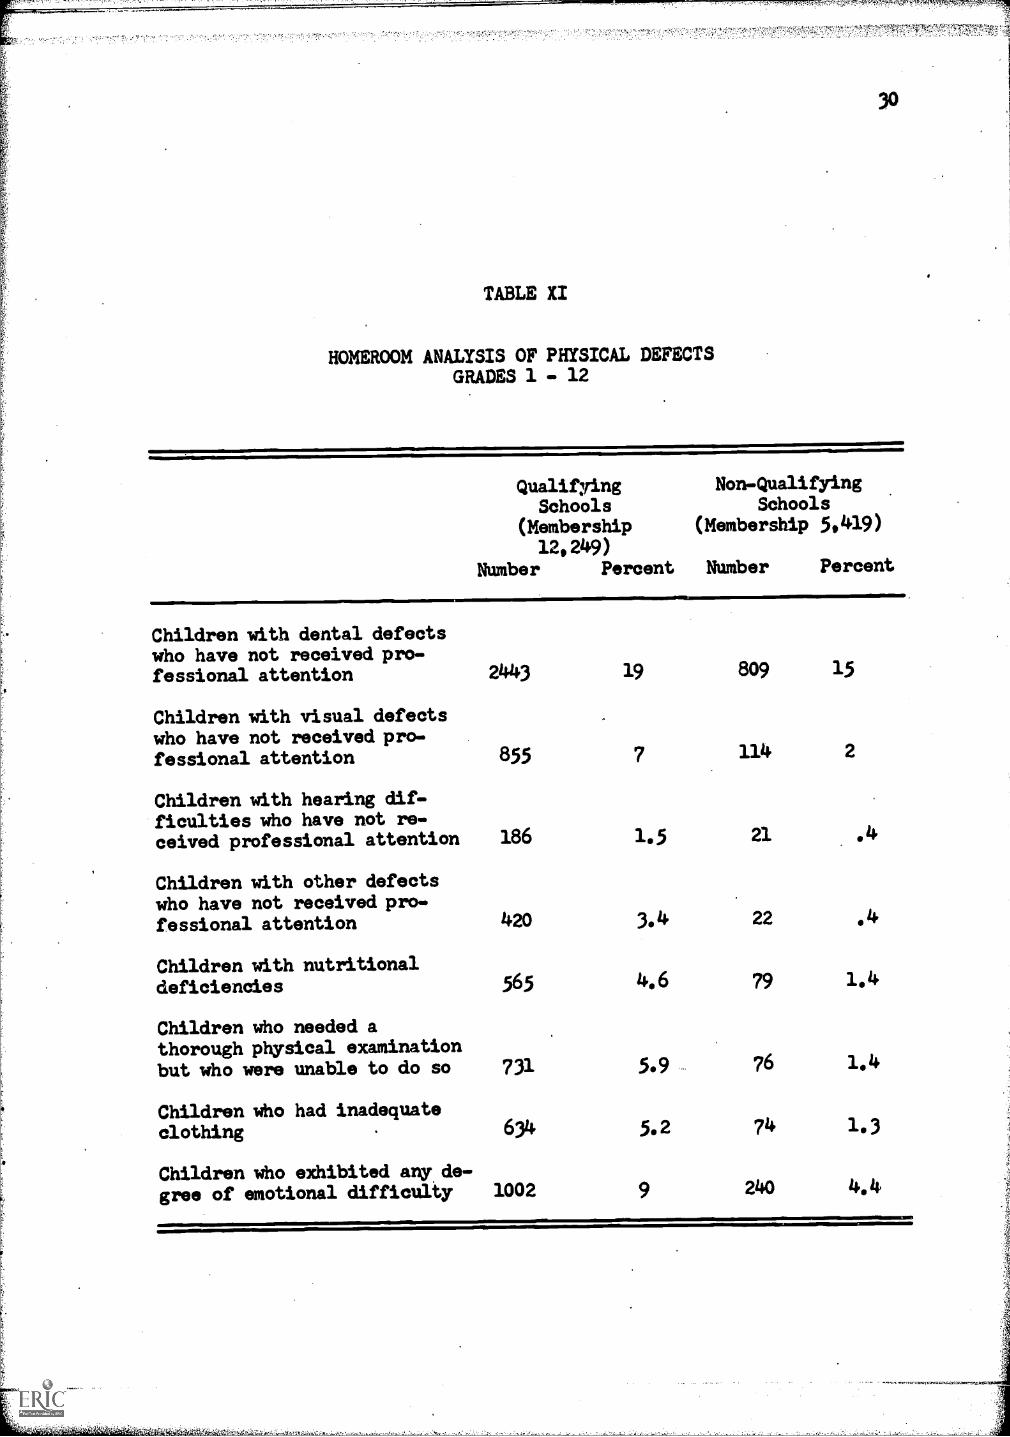
TABLE XI
HOMEROOM ANALYSIS OF PHYSICAL DEFECTSGRADES 1 - 12
QualifyingSchools
(Membership12,249)
Number Percent
Non-QualifyingSchools
(Membership 5,419)
Number Percent
Children with dental defectswho have not received pro-fessional attention
Children with visual defectswho have not received pro-fessional attention
Children with hearing dif-ficulties who have not re-ceived professional attention
Children with other defectswho have not received pro-fessional attention
Children with nutritionaldeficiencies
Children who needed athorough physical examinationbut who were unable to do so
Children who had inadequateclothing
Children who exhibited any de-gree of emotional difficulty
2443 19
855 7
186 1.5
420 3.4
565 4.6
731
634
1002
5.9
5.2
9
809 15
114 2
21 .4
22
79 1.4
76 1.4
74 1.3
240 4.4
31
I11 2
Correctional institutions 18
Armed forces 17
Moved away 12'
Could not be contacted 142
The statistics on dropout studies by
XII, page 32.
schools are contained in Table
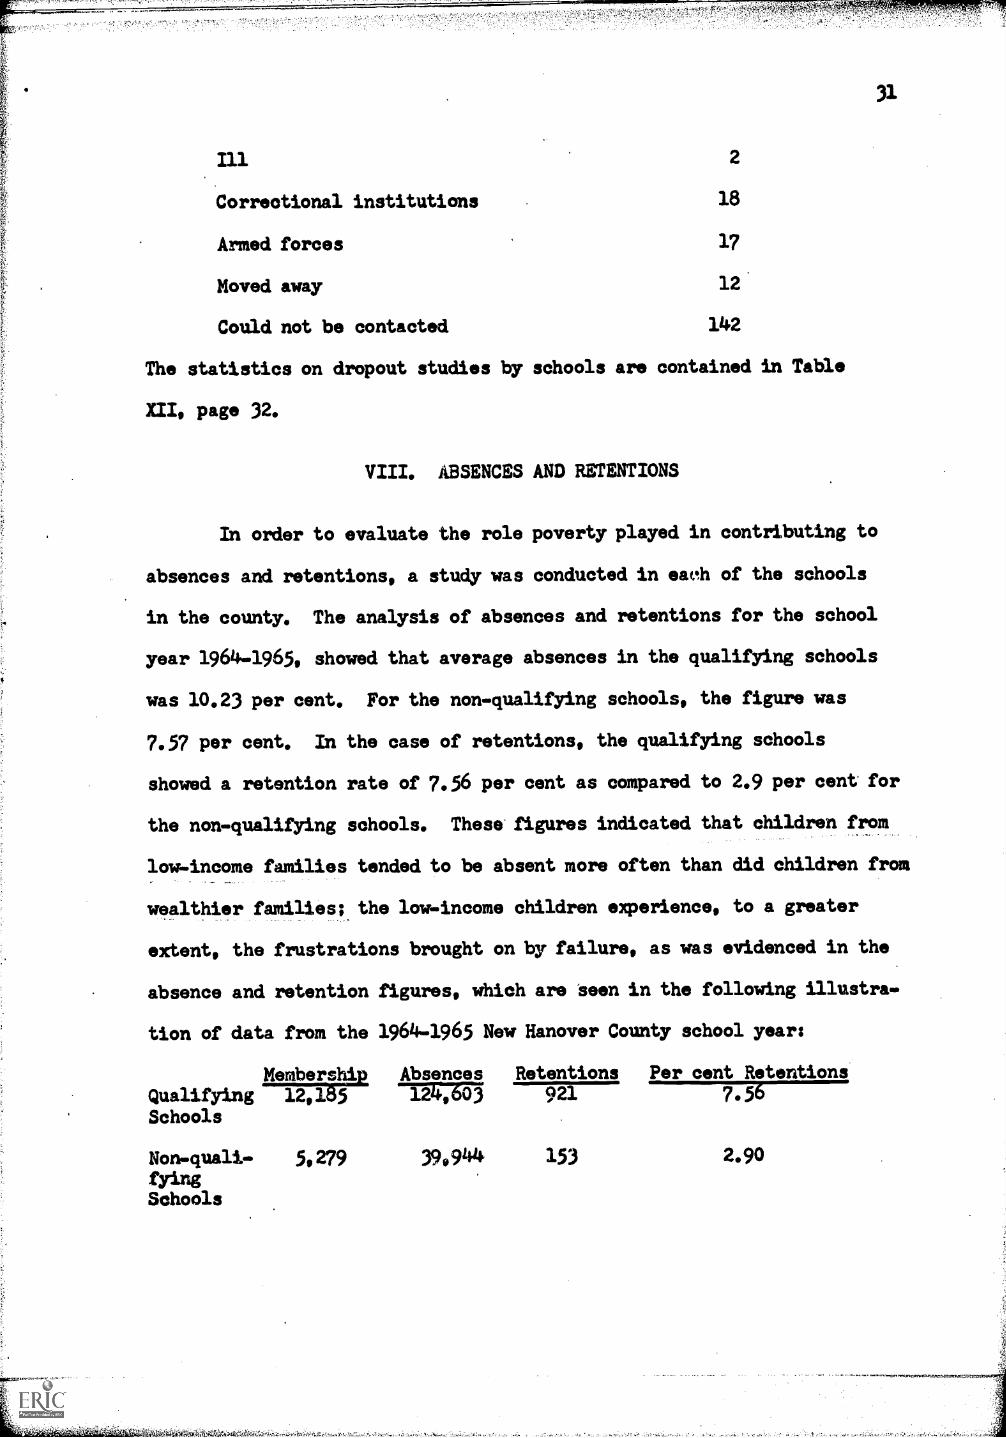
VIII. ABSENCES AND RETENTIONS
In order to evaluate the role poverty played in contributing to
absences and retentions, a study was conducted in eaoh of the schools
in the county. The analysis of absences and retentions for the school
year 1964-1965, showed that average absences in the qualifying schools
was 10.23 per cent. For the non-qualifying schools, the figure was
7.57 per cent. In the case of retentions, the qualifying schools
showed a retention rate of 7.56 per cent as compared to 2.9 per cent for
the non-qualifying schools. These figures indicated that children from
low- income families tended to be absent more often than did children from
wealthier families; the low-income children experience, to a greater
extent, the frustrations brought on by failure, as was evidenced in the
absence and retention figures, which are teen in the following illustra-
tion of data from the 1964-1965 New Hanover County school year:
QualifyingSchools
Non-quali-fyingSchools
Member11AI Absences Retentions Per cent Retentions
12,165 372v,z55 921 7.56
5,279 390914 153 2.90

4
32
TABLE XII
NEW HANOVER COUNTY DROPOUTS1964.1965
SchoolGrade
7 T 9 10 11 12 Total DropoutsPercent
Chestnut Jr.Lake Forest Jr.Roland-Grise Jr.Sunset Park Jr.Tileston Jr.Virgo Jr.Williston Jr.New Hanover HighWilliston High
0 0 40 3 90 3 95 6 9
1 2 162 4 12
5 7 35
4 .5712 4.9012 .9920 3.0919 8.0218 2.9947 6.06
106 18 22 146 5.78
56 32 16 104 10.64

CHAPTER IV
PROPOSED PROGRAM
A project designed to correct some of the problems encountered
by the child in the area of language arts should do much to open the
paths of learning in all areas of the curriculum, to improve the child's
self-concept, to enable him to enjoy the many pleasures of life, to aid
him in the acquisition of saleable skills, and to provide the community
with a more informed citizenry. This project was planned to meet spe-
cific objectives. These objectives are listed as follows:
1. To improve the reading skills, interests, tastes, attitudes,
and habits of children in qualifying schools.
2. To aid the child in developing a feeling of himself as an
individual of dignity and worth.
3. To help each child to develop the art of cooperative action.
To improve the general achievement of children in qualifying
schools.
5. To up-grade the background of personnel in qualifying schools
in teaching of the language arts, with emphasis on reading
and a better understanding of the deprived child.
To provide qualified diagnosis of learning difficulties of
children in qualifying schools upon which an adequate program
may be developed.
7. To provide corrective measures for children in qualifying
schools to fulfill the recommendations of this evaluation.
8. To provide more personnel to effectively reduce classload.
9. To provide professional assistance for teachers in qualifying
schools in carrying out the moommendations of a diagnostic
center and in providing for a more effective classroom
program.
a:,

10. To.provide an intensive diagnostic and corrective reading
program in the summer for children in qualifying schools.
11. To provide the materials necessary to meet the needs of
dren at all levels, in language arts and the related areas
of health and physical fitness.
12. To provide space and equipment for a diagnostic program.
13. To provide personnel to administer the project.
14. To evaluate the effectiveness of the project by studying the
results of objective instruments in language arts and
general achievement.
15. To provide a program for the diagnosis, treatment and preven-
tion of mental and physical defects.
16. To provide a program for the potential and actual school drop-
out through understanding of the child, his environment,
and his need.
17. To provide a year-round program that will allow the child to
develop physical fitness and coordination.
18. To provide a summer program of recreational reading to develop
attitudes, interests, and habits.
19. To provide additional opportunities of enrichment to develop
cultural backgrounds.
The teachers working with the children in the qualifying schools
needed special information. The teacher had to be aware of the fact
that these children did not have the verbal ability of children from
more favorable socio-economic backgrounds. These children were more apt
to want to do something than to express it in words. The teacher needed
to exercise wisdom in setting up materials and situations which helped*
the children to learn.1
Writing on the subject, "Optimum Presentation of Materials,"
Zacharias stated:
But it is encouraging to see the extent to which improvement
1Zacharias, oQ, cit.p p. 33.

35
in performance can be achieved by organizing class discussion into
a generalized form of dialogue, using texts and documents as
resources to be tapped when needed. One experimental program in
New York, for example, raised reading skills and achievement scores
of culturally deprived junior high school students by more than a
year and a half in less than 3 months of intensive work of this
kind.2
I. ACTIVITIES AND SERVICES
The all important and culminating point in this field study was
the formulation of the program. The importance of this aspect of the
study was amplified by Alford:
Once the needs are established, it becomes necessary to design
and propose a specific program or programs. Under this title,
the range of such programs is limited only by the imagination.
They may include preschool programs; all types of subject-matter
remedial programs; cultural enrichment programs; health and
nutrition services; summer, after - school, or weekend classes; and
special programs for dropouts, to mention a few - -so long as they
are concentrated on the children of low- income families."
Project Coordinator. The project was under the immediate super-
vision of a project coordinator, who was assigned to the staff of the
director of instruction. The coordinator was provided with a statis-
tical accountant and a secretary.
Diagnostic Learning Center. A diagnostic learning center was
established in the unit's central office and served all qualifying
schools. The table of organization called for this center to be staffed
by a coordinator, a psychologist, a diagnostician, a technical aide, and
a secretary.
,Diagnostic Learninh Center Equipment. The center was provided
2Ibid., P. 13.
3Albert L. Alford, "The Elementary and Secondary Education Act
of 1965--What to anticipate," Phi Delta Kaman, XLVI (June, 1985), 485,

with adequate instruments for the diagnosis of learning difficulties.
The detection of sight, hearing, and speech defects was possible.
Specific diagnosis of problems in language arts as well as in the broad
achievement areas was possible.
Referrals to the Diagnostic Leazinin Center. Referrals were
examined and returned to their schools; a diagnostic report, with
recommendations, followed. Remedial help was provided by specialists
who worked with the children whom the diagnostic report indicated
should receive this service.
Specialists in the field of Language Arts. These specialists
worked in the schools under the direction of the project coordinator.
They aided teachers in organizing the classroom for more effective
language arts instruction, and worked with extreme problem cases on an
individual and small group basis.
Corrective, Centers. Each qualifying school was provided with a
corrective center. This center served as headquarters for the specialist
and provided materials covering a broad range of interest and ability.
The specialist utilized these materials, as appropriate, for classroom
instruction in the school or for working with individuals and small
groups.
Specialist aid in non-academic areas. The qualifying elementary
schools shared visiting teachers in the areas of art, music and physical
education.
In-service education program. An initial two weeks in-service
program prepared project personnel for their immediate duties. A short
term in-service_program for all teachers in qualifying schools was
scheduled during the summer. Emphasis was placed on the teaching of

37
language arts, the correlation of subject areas with language arts,
and approaches to be used by faculties in bolstering the self-concept
of the deprived child. The importance of the self-concept of these
children cannot be over emphasized.
Summer program for the specialists in the field of Language,
Arts. A summer program designed to upgrade the background of teachers
in the field of language arts was scheduled. A specialist in language
arts taught a six week program for personnel immediately assigned to
this area of the project, as well as selected teachers from qualifying
schools. This instructional period was followed by a laboratory period
in which participating teachers worked with children in the correction
of language arts difficulties under the direct supervision of the
specialist.
Health programs, Children in the qualifying schools were pro-
vided food on the basis of need. The project staff included personnel
who aided existing medical facilities in diagnosing and treating medical
problems. A head nurse and six other registered nurses were assigned to
the project. A medical doctor was retained to diagnose and treat phy-
sical defects and illness, and to coordinate the work of the nurses in
the schools with public and private medical facilities in the county.
Health rooms were upgraded in the qualifying schools. .Funds were pro-
vided for physical examinations, medicines, corrective devices and other
medical referrals as diagnosed and referred by a physician. Clothing
was available for needy children. A statement of need from the school
principal to the office of the project coordinator was followed by an
authority to purchase the clothes needed. In planning the special
services--food, clothing, and medical services--the danger of labeling
38
the low-income child was encountered. The danger of identifying
individual children as being poverty stricken has been pointed out by
Alford:
While the focus of this title is on children of poverty, it
has never been intended that individual children be identified
as participating in a welfare program or coming from a family of
less than the low-income factor--$2,000 for the first year. These
measures are used to identify statistically the geographic con-
centrations of poverty and to allocate money; but once a program
is approved by the state educational agency for a school attendance
area, all children in that area having the particular educational
deficiency may participate in the special program. This may also
mean that some low- income children will not benefit directly from
Title I if they are not in an area of high concentration. There
would seem to be no alternative to this, however, unless the
legislation were to support a general remedial program--not the
intent--or children were individually labeled as poor. The nega-
tive results of the latter procedure might offset most of the
benefits of the title.''
vallail Education. A physical fitness program involved all
qualifying schools. Physical education teachers and aides gave the
necessary help to the classroom teachers in providing an adequate
physical education program and in planning a year-round recreational
program for children. Playgrounds and gymnasiums remained open during
the summer at the qualifying schools. Although spaces were already
available, equipment, transportation, and work on the playgrounds was
required to operate an adequate program.
Adjustment Class teachers. Teachers for special adjustment
classes at the junior and senior high school levels were provided as
appropriate. Predictive dropouts were placed with these teachers and
a flexible program, designed to meet their specific needs, was deter-
mined.
The Adjustment Class programs. The adjustment class programs
Ibid.

39
were enriched by special teachers in the areas of art, music, and phy-
sical education. When the junior high and senior high school adjustment
class students were scheduled for art, music, and physical education
they were assigned to classes of regular students. The special
teachers aided the adjustment class teachers, in the qualifying schools,
in upgrading the cultural levels of the deprived children. Arrange-
ments, including transportation, were made to allow children to attend
various community activities such as concerts, ballet, plays, art
shows, and other types of cultural activities. Diagnostic teaching was
undertaken in these classes. Materials appropriate to the subject area
and the reading levels of the students were purchased.
Home contact plans. Social counselors provided adequate home
contacts in an attempt to diagnose the potential school dropout, in
order that corrective action might be taken. Children who had already
dropped out of school were contacted in an effort to have them return
to school. Office space for the social counselors was provided at the
unit's central office.
Summer school. A tuition free summer program was provided for
the predictive dropout at all levels of instruction. This part of the
program presented little in the way of problems since New Hanover County
had a planned six-weeks tuition summer school. This summer school was
for kindergarten through the twelfth grade. The program included reme-
dial as well as enrichment courses and a speech therapy clinic.
Teacher technicians. These people assisted the primary grade
teachers in the qualifying schools. This additional help allowed the
classroom teacher to provide more attention to the individual student.
Closed-circuit television. This was a cooperative effort in

which the Ford Foundation, for the North Carolina Comprehensive School
Improvement Project; Title I directors; a commercial television cable
company; and the local government worked together to make this phase of
the program possible. The Ford Foundation supplied $12,000 for
equipment. Title I funds were authorized to pay salaries to the tele-
vision teacher, the television coordinator, the television technician,
and the secretary. Title I also supplied an additional $1600 for
equipment. The commercial cable company donated the labor and the
materials needed to provide cable service to the schools. Local funds
were used to plan and develop the studio space as well as to supply the
needed studio materials. The cable system provided a variety of enrich-
ment experiences, and an effective in-service program for teachers, in
an effort to close the gap for the educationally deprived child. In
addition, the circuit was used to develop an experimental program of
pre-school readiness experiences, in an effort to reach children in
disadvantaged environments earlier. Separate evaluative procedures were
developed to assure a complete follow-up in order to determine the
effectiveness of the effort.
Summer library, activities. A summer library program was planned
as an important part of the project. School libraries were to be open
for use of children at strategic locations throughout the county. These
libraries were to be in qualifying schools. Trained librarians were pro-
vided to plan and diroct this program.
Private school participation. Title I called for private school
pupils to have opp'rtunities for participation. This opportunity was
provided to the extent consistent with the number of ed,-:ationally
deprived children who were enrolled in private schools in areas served

by the program. Children attending private schools in qualifying areas
were allowed to participate in all activities planned for in this
project.
II. SUMMARY AND CONCLUSIONS
It was anticipated that improvement of the language arts would
be attained by this project. Reading skills, interests, and attitudes
should shim particular growth, as emphasis was placed on those activi-
ties that were designed to correct deficiencies in this area. There
was evidence which indicated that the most effective way to improve
language facilities was to begin with a diagnosis to determine the
difficulties. Corrective measures were designed according to the levels
of need in the areas of difficulty. They diagnostic and corrective
centers, designed for this proposal, were a direct outgrowth of this
philosophy and the research that supported it.
Authorities in the field accepted the position of reading as the
basic skill underlying all of the language arts facilities as well as
all of the academic areas of the curriculum. Based upon this philosophy,
improvement in general achievement was an expected outcome of the
project.
The correction and prevention of physical maladies and defects
are of prime importance in raising achievement levels in any area.
This proposal included facilities for improving not only physical
health, but also provided for the improvement of mental health.
Improvement in general health was expected as a result of the assurance
of proper nutrition, the furnishing of appropriate clothing, the treat-
ment of physical defects, and the provision of a physical fitness
'ijii>7:4144a,

program.
An evaluation of the program was planned. This procedure was
designed to compare the pre-tests in the areas listed in this study
with post-tests in the same areas. In addition, a program of subjec-
tive evaluation of the various actiAties of the project was formu-
lated. Availability of the results of this evaluation to the partici-
pating schools and to tho North Carolina Department of Public Instruc-
tion was guaranteed.
The plans for this program were reldewed by the directors of
the county Community Action Agency, Opportunities, Inc. This agency
coordinated its efforts with the New Hanover County Board of Education
to augment the Elementary and Secondary Education Act program with
cooperatively planned projects such as a Head Start Program for pre-
school children, a tutorial program for pupils having academic diffi-
culties, and a work-study program to encourage high school students to
remain in school. The close cooperation between the New Hanover County
Board of Education and the Community Action Agency eliminated duplica-
tion of effort and an attendant waste of funds,
BIBLIOGRAPHY

BIBLIOGRAPHY
A. BOOKS
Haan, Aubrey. Elementary School Curriculum. Boston: Allyn and
Bacon, Inc., 1961.
McKee,. Paul. The Teaching of Reading in the Elementary School.
Boston: Houghton Mifflin Company, 147:
Michaelis, John U. Social Studies for Children in a Democracy.
Englewood Cliffs: Prentice-Hall, Inc., 1956:-
Olson, Willard C. Child Development. Boston: D. C. Heath and
Company, 1949.
Stendler, Celia B. Teaching in the Elementary School. New York:
Harcourt, Brace and Company, 1958.
Strickland, Ruth G. The Language Arts in the Elementary School.
Boston: D. C. Heath and Company, 1957.
B. PUBLICATIONS OF THE GOVERNMENT, LEARNED SOCIETIES,
AND OTHER ORGANIZATIONS
Barrow, Harold M. and Rosemary McGee. North Carolina Fitness Test.
Raleigh: State Department of Public Instruction, 19 1.
Brown, Carl F. and Richard Walser. A Guide To Curriculum Study English,
Language Arts. Raleigh: State Board of Education, 1959.
Fraser, Dorothy M. Deciding What To Teach. Washington: National
Education Association of the United States, 1963.
Gordon, Edmund W. "A Review of Programs of Compensatory Education,"
Reprinted from American Journal of Orthopsychiatry, XXXV (July,
1965).
School Programs for Educationally Deprived Children. Elementary and
Secondary Education Act of 1965 Title I Publication OE- 35075.
U. S. Department of Health, Education, and Welfare Office of
Education. Washington: 1965,
Youth Physical Fitness. Suggested Elements of A School-Centered Program

45
by the President's Council on Youth Fitness. U. S. GovernmentPrinting Office. Washington: 1961.
Zacharias, Jerrold R. Innovation and Experiment in Education, AProgress Report of the Panel on Educational Research and Develop-ment to the U. S. Commissioner of Education, the Director of theNational Science Foundation, and Technology, U. S. Office of
Education. Washington: 1964,
C. PERIODICALS
Alford, Albert L. "The Elementary and Secondary Education Act of1965--What to Anticipate," Phi Delta Kaman, XLVI (June, 1965),483-488.
Krongard, Hyman I. "Why Music in the Public Schools?", Music Educa-tors Journal, (September-October, 1963), 123-128.
Taylor, Harold. "Music as a Source of Knowledge," Music EducatorsJournal, (September-October, 1964), 35-38, 15115 7
"Wilson, A. Verne. "Why Music Education?", The National ElementaryPrincipal, XXXIX (December, 1959), 6-1a.
D. UNPUBLISHED MATERIALS
North Carolina Comprehensive School Improvement Project Staff. "AProgress Report of the North Carolina Comprehensive School Im-provement Project 1964.1965 School Year." Raleigh: StateDepartment of Public Instruction, 1965. (Mimeographed.)

,
-;
" , .-,,r5:NraT',..A.V.I.2...;ItVV'X.,VCIW-VatV.Fttr.,.'tV.,StF:'Mt'1:A9%V.'P!::.'A=VA.Z.17
APPENDIX A
PHYSICAL FITNESS
SCHOOL MEDIANS

EXHIBIT ONE
PHYSICAL FITNESSSCHOOL MEDIANS
9 YEAR OLD GIRLS
47
Qualifying Schools Sit Broad Pull Push
Ups Jump Ups Ups
N. C. Median Scores 11* log* 5* .**
Washington CatlettWilliam H. BlountJnraes B. DudleyMary W. HoweGr-goryWilliam HooperTilestonLake ForestWrightsboroCarolina BeachChestnut
12 36"
12 36"
11 18" 9 11
11 47" 4 7
8 43" 1 14
11 45" 9 15
54411 6 6
10 46" 12 12
8 53" 6 12
11 50" 16 21
18 52" 17 22
Non-Qualifying Schools
Sunset Park Elementary 6 53" 13 20
J. C. Roe 5 49".
6 13
Forest Hills ..) 49" 21 24
Ogden 12 51" 15 21
College Park 11 50" 11 13
Winter Park 12 59" 3 22
Bradley Creek 8 47" 14 17
Edwin A. Alderman 9 49" 14 18
Wrightsville Beach 12 49" 18 18
MMIMIMIIM11,1M.L7101.1....
*These figures were taken from Harold M. Barrow and Rosemary
McGee, North Carolina Fitness Test (Raleigh: State Department of
Public Instruction, 19gr717.716:
**North Carolina medians not available.

EXHIBIT TWO
PHYSICAL FITNESSSCHOOL MEDIANS
9 YEAR OLD BOYS
48
Qualifying Schools SitUps
N. C. Median Scores 13*
William H. Blount 14
James B. Dldley 11
Mary W. Howe 13
Gregory 14William Hooper 11
Tile ston 10
Lake Forest 15
Wrightsboro 16
Carolina Beach 14Chestnut 18
Non-Qualifying Schools
Sunset Park Elementary 11
J. C. Roe 11
Forest Hills 12
Ogden 14.
College Park 12
Winter Park 15
Bradley Creek 15
Edwin A. Alderman 14Wrightsville Beach 15
BroadJump
53"*
PullUps
8**
PushUps
* * *
46"4811
51"59"51"53"49"49"
53"51"
12116
713915111817
16231113182119152227
56"
51"49"
58"49"67"54"56"
57"
14 2115 2418 2118 2416 136 2522 2214 2314 22
McGee,Public
McGee,Public
*These figures were taken from HaroldNorth Carolina Fitness Test (Raleigh:
Instruction, 1961), p. 18.
**This figure was adapted from Harold
North Carolina Fitness Test (Raleigh:
Instruction, 1617,77.7 18.
M. Barrow and RosemaryState Department of
M. Barrow and RosemaryState Department of
***North Carolina medians not available.

EXHIBIT THREE
PHYSICAL FITNESSSCHOOL MEDIANS
11 YEAR OLD GIRLS
Qualifying Schools SitUps
N. C. Median Scores 13*
William H. Blount 14
James B. Dudley 9Gregory 13
William Hooper 12
Tileston 9Lake Forest 12
Wrightsboro 15Carolina Beach 14
Chestnut 17
BroadJump
PullUps
PushUps
5211*
36"53"50"
50"46"51"56"54"
58"
1598158
13
71520
151415181617202116
Non-Qualifying Schools
Sunset Park ElementaryJ. C. RoeForest HillsOgdenCollege ParkWinter ParkBradley CreekEdwin A. AldermanWrightsville Beach
131116111716
91212
58"50"54"56"56"5810
51"49"64"
11 2111 20
17 2411 1620 136 2217 1611 2215 18
McGee,Public
McGee,Public
*These figures were taken from HaroldNorth Carolina Fitness Test (Raleigh:
Instruction, 1061777: 20.
**This figure was adapted from Harold1,7,.)rth Carolina Fitness Test (Raleigh:
Instruction, 19 3.6-571: 20.
M. Barrow and RosemaryState Department of
M. Barrow and RosemaryState Department of
***North Carolina medians not available,

EXHIBIT FOUR
PHYSICAL FITNESSSCHOOL MEDIANS
11 YEAR OLD BOYS
50
Qualifying Schools Sit BroadUps Jump
N. C. Median Scores 16* 58 **
William H. Blount 17
James B. Dudley 8
Gregory 15
William Hooper 18
Tileston 10
Lake Forest 18
Wrightsboro 18
Carolina Beach 18
Chestnut 18
5665"56"
58"62"
57"68"51"61"
Non-Qualifying Schools
Sunset Park Elementary 14 57"
J. C. Roe 14 56"
Forest Hills 21 66"
Ogden 16 66"
College Park 14 56"
Winter Park 19 66"
Bradley Creek 15 59"
Edwin A. Alderman 20 60"
Wrightsville Beach 20 59"
PullUps
PushUps
12** ..***
16 2215 178 17
19 21
12 1814 2714 1816 2616 25
12 2213 30
22 3212 1914 1211 2621 2413 2813 25
*This figure was adapted from Harold M. Barrow and Rosemary
McGee, North Carolina Fitness Test (Raleigh: State ',..partment of
Public Instruction, 19.617757 20.
**These figures were taken from Harold M. Barrow and Rosemary
McGee, North Carolina Fitness Test (Raleigh: State Department of
Public Instruction, 19z1 y757 20.
***North Carolina medians not available.

EXHIBIT FIVE
PHYSICAL FITNESSSCHOOL MEDIANS
14 YEAR OLD GIRLS
51
Qualifying Schools SitUps
N. C. Median Scores 13*
William H. Blount 15Williston Senior High 17
Williston Junior High 12
Lake Forest 16
New Hanover High 13
Sunset Park Junior 14
Chestnut 17
Non-Qualifying Schools
Roland Grise 14
Broad Pull Push
Jump Ups Ups
62" ** 5** .***
36" 14 19
55" 4 21
53" 13 12
61" 13 18
68" 14 11
63" 7 16
60u 6 22
61" 6 10
*This figure was adapted from Harold M. Barrow and Rosemary
McGee, North Carolina Fitness Test (Raleigh: State Department of
Public Instruction, 193ITIF: 23.
**These figures were taken from Harold M. Barrow and Rosemary
McGee, North Carolina Fitness Test (Raleigh: State Department of
Public Instruction, 19-61177: 23.
***North Carolina medians not available.

Iry
EXHIBIT SIX
PHYSICAL FITNESSSCHOOL MEDIANS
14 YEAR OLD BOYS
Qualifying Schools SitUps
BroadJump
PullUps
PushUps
N. C. Median Scores 20* 73"** 3* * * *
Williston Senior HighD. C. Virgo Junior HighWilliston Junior HighLake ForestWrightsboroSunset Park JuniorChestnut
39202020162322
66"
690
76"66"63"63"
77"
2 415 16
10 136 21
22 202 138 26
Non-Qualifying Schools
OgdenRoland Grise
1619
83"
69"
144 22
*These figures were adapted from Harold, M. Barrow and Rosemary
McGee, North CarolAna Fitness Test (Raleigh: State Department of
Public Instruction, I9g1 777 23.
**This figure was taken from Harold M. Barrow and Rosemary
McGee, North Carolina Fitness Test .(Raleighs State Department of
Public Instruction, 1961), p. 23.
***North Carolina medians not available.

IR
EXHIBIT SEVEN
PHYSICAL FITNESSSCHOOL MEDIANS
17 YEAR OLD GIRLS
53
Qualifying Schools
N. C. Median Scores
SitUps
14*
BroadJump
65't*
PullUps
12**
PushUps
.***
Williston Senior HighWilliston Junior HighNew Hanover HighChestnut
11111713
56"
44"
67"58"
61918
9221617
McGee,Public
McGee,Public
*These figures were taken from Harold
North Carolina Fitness Test (Raleigh:
Instructfion, 1961E737 767
**This figure was adapted from Harold
North Carolina Fitness Test (Raleigh:
Instruction, 19Z17,777 767
M. Barrow and RosemaryState Department of
M. Barrow and RosemaryState Department of
***North Carolina medians not available.

f
V
PHYSICAL FITNESSSCHOOL MEDIANS
17 YEAR OLD BOYS
QuaJLifying Schools Sit Broad Pull Push
Ups Jump Ups Ups
N. C. Median Scores 21* 86 " ** 6* .4144
Williston Senior High 22 71" 4 9D. C. Virgo Junior High 24 12 25
Williston Junior High 18 76" 10 17
Lake Forest 22 71" 4 19
New Hanover High 26 84" 9 26
Chestnut 23 60" .. 13 27
Non-Qualifying Schools
Roland Grise, 20 77" 11 18
*These figures were adapted from Harold M. Barrow and RosemaryMcGee, North Carolina Fitness Test (Raleigh: State Department of
Public Instruction, 1961), p. .26.**This figure was taken from Harold M. Barrow and Rosemary
McGee, North Carolina Fitness Test (Raleigh: State Department of
Public Instruction, 19T1577:767
***North Carolina medians not available.