Embed Size (px)
Citation preview
Anne Arundel County Department of Health May 2017
Report Card of Community Health Indicators
I am pleased to present the Anne Arundel County Department of Health’s 2017 Report Card of Community Health Indicators. This report is a valuable resource to help monitor the status of Anne Arundel County residents. The Report Card information guides county leaders to make informed decisions, and it helps direct resources to neighborhoods and populations most in need of public health interventions. This report demonstrates Anne Arundel County has achieved our health goals in some areas. Other areas, including substance abuse and maternal and infant health, still face challenges. Health is all around us – from the air we breathe to the water we drink to the friends and family that surround us. I thank the Department of Health staff for the quality services they offer and the deep partnerships they continue to develop with other agencies and community members. Respectfully, Steven Schuh County Executive
County Executive’s Message
2

The Anne Arundel County Department of Health continues to make progress toward our vision of a vibrant county with healthy people in healthy communities. We have done well improving several of our key community health indicators. According to the latest County Health Rankings, we have experienced improving trends for length of life, health insurance coverage, air quality and high school graduation, as well as a decrease in violent crime. However, there are some concerning trends as well. Even when taking age into account, county residents have higher cancer rates than Maryland and the nation, especially for lung cancers and melanoma. Mortality rates have declined for all major causes of death in the county over the past decade with the exception of suicides. This may reflect our continuing struggle to prevent and treat substance use disorders. Our communities around the county are strong and ready to respond to calls to action in cancer, suicide and overdose. To connect opioid overdose survivors with treatment, the department partnered with Anne Arundel Medical Center and Baltimore Washington Medical Center to provide referrals to treatment for people admitted to the emergency departments. This past summer, the department joined with the Maryland Department of Agriculture to mount a rapid response to the Zika virus threat to ensure no local transmission occurred. Whatever the challenge, the Anne Arundel County Department of Health stands ready with our partners to preserve, promote and protect the health of all those who live, work and play in our beautiful county. Warm regards, Jinlene Chan, M.D., M.P.H. Health Officer
Health Officer’s Message
3

Table of Contents
Who lives in Anne Arundel County?
Population 7
Race and Ethnicity 7
Age 7
How do social resources affect our health?
Income and Poverty 9
Education 9
Crime 9
How do individual behaviors affect our health?
Tobacco Use 11
Drug and Alcohol Use 12
Sexually Transmitted Infection and Teen Pregnancy 13
Overweight and Obesity 14
How does the physical environment affect our health?
Food Environment 16
Rabies 17
How do we access care?
Health Care Insurance Coverage 19
Prenatal Care 20
How healthy are we?
Healthy People 2020 22
Leading Causes of Death 23
Mortality Trends 24
Cancer Incidence and Mortality 25-26
Maternal and Child Health 27
Infant Mortality 28
General Disease Reporting 29

Who lives in Anne Arundel County?
6

2015 Estimates Anne
Arundel Maryland United States
Population
Total Population 564,195 6,006,401 321,418,820
Male 49.6% 48.5% 49.2%
Female 50.4% 51.5% 50.8%
Race and Ethnicity
White, non-Hispanic (NH) 69.5% 52.0% 61.6%
Black, NH 16.3% 29.4% 12.4%
Hispanic 7.3% 9.5% 17.6%
Asian, NH 3.9% 6.4% 5.4%
American Indian and Alaska Native, NH
0.3% 0.2% 0.7%
Others 2.7% 2.5% 2.3%
Age
Under 5 Years Old 6.3% 6.1% 6.2%
18 Years and Over 77.5% 77.6% 77.1%
65 Years and Over 13.7% 14.1% 14.9%
Median Age (Years) 38.1 38.4 37.8
Data Source: U.S. Census Bureau: State and County Quick Facts; 2015 Population Estimates; 2015 American Community Survey 5-year Estimates and 1-year Estimates; United States Department of Labor; Bureau of Labor Statistics (not seasonally adjusted unemployment rates); National Behavioral Risk Factor Surveillance System (BRFSS), Centers for Disease Control and Prevention (CDC); Maryland BRFSS, Department of Health and Mental Hygiene (DHMH).
Demographics
7
How do social resources affect our health?
8
2015 Estimates Anne
Arundel Maryland United States
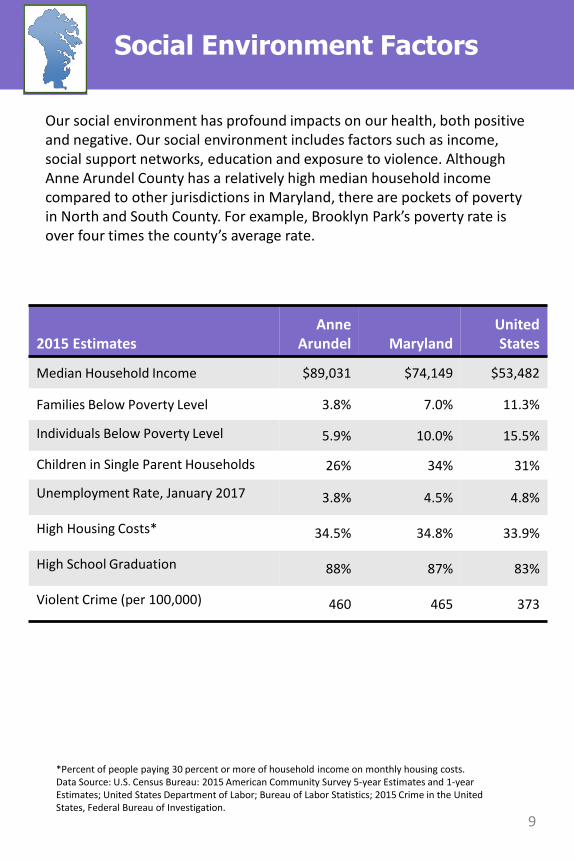
Median Household Income $89,031 $74,149 $53,482
Families Below Poverty Level 3.8% 7.0% 11.3%
Individuals Below Poverty Level 5.9% 10.0% 15.5%
Children in Single Parent Households 26% 34% 31%
Unemployment Rate, January 2017 3.8% 4.5% 4.8%
High Housing Costs* 34.5% 34.8% 33.9%
High School Graduation 88% 87% 83%
Violent Crime (per 100,000) 460 465 373
Social Environment Factors
*Percent of people paying 30 percent or more of household income on monthly housing costs. Data Source: U.S. Census Bureau: 2015 American Community Survey 5-year Estimates and 1-year Estimates; United States Department of Labor; Bureau of Labor Statistics; 2015 Crime in the United States, Federal Bureau of Investigation.
Our social environment has profound impacts on our health, both positive and negative. Our social environment includes factors such as income, social support networks, education and exposure to violence. Although Anne Arundel County has a relatively high median household income compared to other jurisdictions in Maryland, there are pockets of poverty in North and South County. For example, Brooklyn Park’s poverty rate is over four times the county’s average rate.
9
How do individual behaviors affect our health?
10

Data Source: CDC; 2015 Maryland BRFSS, 2014 and 2015 Youth Risk Behavior Survey (YRBS).
Tobacco Use
Tobacco use is a risk factor, not just for lung and bronchus cancer, but for several other comorbidities, such as coronary heart disease and stroke. Cigarette smoke impacts almost every organ in the body and is associated with several of the leading causes of death in Anne Arundel County. Current adult cigarette use has declined significantly in the county over the past decade, but still slightly above the Healthy People 2020 goal of 12 percent.
Current Adult Cigarette Smokers
2015 HP 2020 Met?
Anne Arundel 14.9% 12% No
Maryland 14.6% 12% No
United States 15.1% 12% No
11
12th Graders Cigarette and E-Cigarette Use
Currently Using
Cigarettes
Currently Using E-
Cigarettes
Ever Used E-Cigarettes
Anne Arundel (2014) 16.2% 28.5% 50.8%
Maryland (2015) 11.9% 24.2% 45.1%
United States (2015) 14.1% 28.2% 50.9%

Drug and Alcohol Use
*Binge drinking is defined as five or more drinks for men and four or more drinks for women, in about two hours. (CDC) Data Source: 2015 Drug and Alcohol Related Intoxication Deaths Report, Maryland DHMH; 2015 Maryland BRFSS; 2014 Maryland Youth Risk Behavioral Survey; National Institutes of Health Institute on Alcohol Abuse and Alcoholism.
Over the past five years, substance use disorders, specifically prescription opioid and heroin use, have increased dramatically in the county. One of the major concerns of opioid use disorders is the risk of fatal overdose, particularly when fentanyl, a drug several times more powerful than heroin, is knowingly or unwittingly used. Alcohol dependence is related to other substance use. Individuals with a dependence on alcohol are more likely than the general population to use other drugs. Substance use disorders involving either opioids or alcohol are associated with increased risks of accidental death.
Opioid-Related Intoxication Deaths in Anne Arundel County, 2007-2015
12
0
10
20
30
40
50
60
2007 2008 2009 2010 2011 2012 2013 2014 2015
Deat
hs
Year
Heroin
RxOpioid
Fentanyl
Sexually Transmitted Infection/ Teen Pregnancy
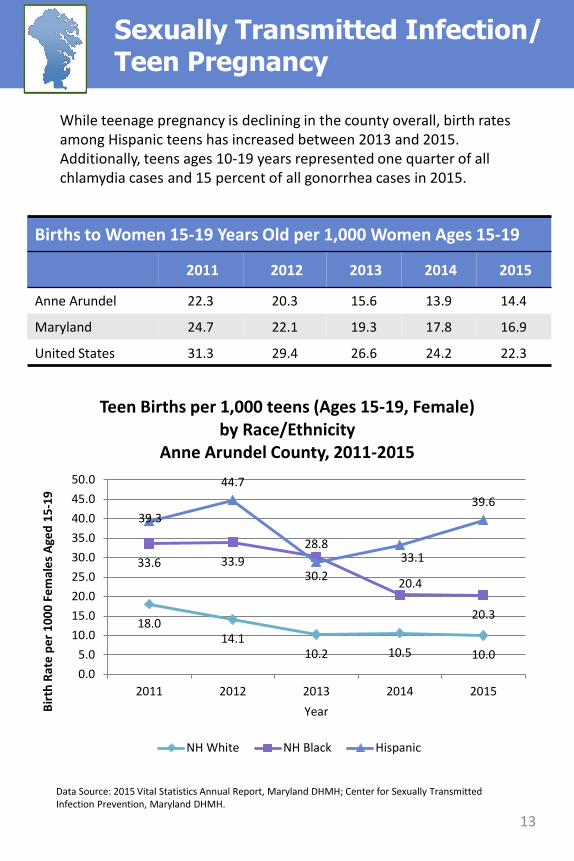
Births to Women 15-19 Years Old per 1,000 Women Ages 15-19
2011 2012 2013 2014 2015
Anne Arundel 22.3 20.3 15.6 13.9 14.4
Maryland 24.7 22.1 19.3 17.8 16.9
United States 31.3 29.4 26.6 24.2 22.3
18.0 14.1
10.2 10.5 10.0
33.6 33.9 30.2 20.4
20.3
39.3
44.7
28.8 33.1
39.6
0.05.0
10.015.020.025.030.035.040.045.050.0
2011 2012 2013 2014 2015
Birt
h Ra
te p
er 1
000
Fem
ales
Age
d 15
-19
Year
Teen Births per 1,000 teens (Ages 15-19, Female) by Race/Ethnicity
Anne Arundel County, 2011-2015
NH White NH Black Hispanic
Data Source: 2015 Vital Statistics Annual Report, Maryland DHMH; Center for Sexually Transmitted Infection Prevention, Maryland DHMH.
While teenage pregnancy is declining in the county overall, birth rates among Hispanic teens has increased between 2013 and 2015. Additionally, teens ages 10-19 years represented one quarter of all chlamydia cases and 15 percent of all gonorrhea cases in 2015.
13
*Percentages of healthy weight, overweight and obese do not add up to 100 percent because of missing values in the survey responses. Data Source: 2015 Maryland BRFSS; Healthy People 2020, U.S. Department of Health and Human Services (DHHS).
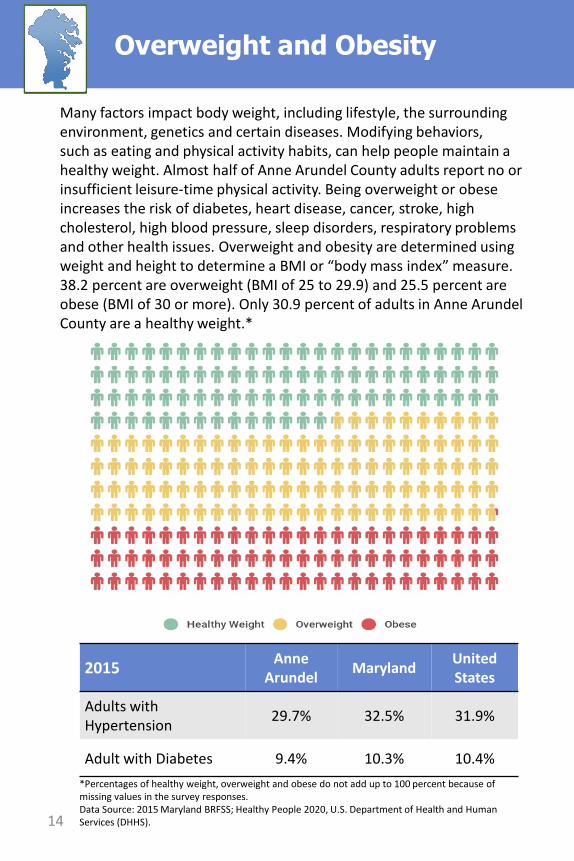
Overweight and Obesity
2015 Anne Arundel Maryland United
States
Adults with Hypertension 29.7% 32.5% 31.9%
Adult with Diabetes 9.4% 10.3% 10.4%
Many factors impact body weight, including lifestyle, the surrounding environment, genetics and certain diseases. Modifying behaviors, such as eating and physical activity habits, can help people maintain a healthy weight. Almost half of Anne Arundel County adults report no or insufficient leisure-time physical activity. Being overweight or obese increases the risk of diabetes, heart disease, cancer, stroke, high cholesterol, high blood pressure, sleep disorders, respiratory problems and other health issues. Overweight and obesity are determined using weight and height to determine a BMI or “body mass index” measure. 38.2 percent are overweight (BMI of 25 to 29.9) and 25.5 percent are obese (BMI of 30 or more). Only 30.9 percent of adults in Anne Arundel County are a healthy weight.*
14

How does the physical environment affect our health?
15

Food Environment
Data Source: 2014 USDA Food Environment Atlas, US Census Bureau. 16
Food deserts are defined by the United States Department of Agriculture (USDA) as urban neighborhoods and rural towns without ready access to fresh, healthy and affordable food. Typically, these areas are low-income, where the population lacks economic resources to travel for food purchases. There are 17 census tracts in Anne Arundel County which are considered food deserts; these areas are in Glen Burnie, Brooklyn Park, Linthicum Heights, Eastport, Fort Meade, Jessup and Severn. Of the 69,000 county residents that live in food deserts, 54 percent are non-Hispanic White, 26 percent are non-Hispanic Black or African American, 12 percent are Hispanic (any race) and 4 percent are Asian. Approximately 26 percent (18,000) of the population living in food deserts are less than 18 years of age.
For more information on the food environment in
Anne Arundel County, visit: http://www.aahealth.org/pdf/ FoodEnvironmentFact.pdf

Rabies
Data Source: Bureau of Environmental Health, Anne Arundel County Department of Health.
Rabies is a significant public health threat since rabid animals can come in contact with people and their pets. Rabies is a fatal viral infection. While pets can be vaccinated against rabies, people exposed to rabies must undergo a costly series of injections to protect themselves from the disease. In 2016, there were 15 confirmed cases of rabid animals in the county, down from 35 confirmed rabid animals in 2015.
17

How do we access care?
18
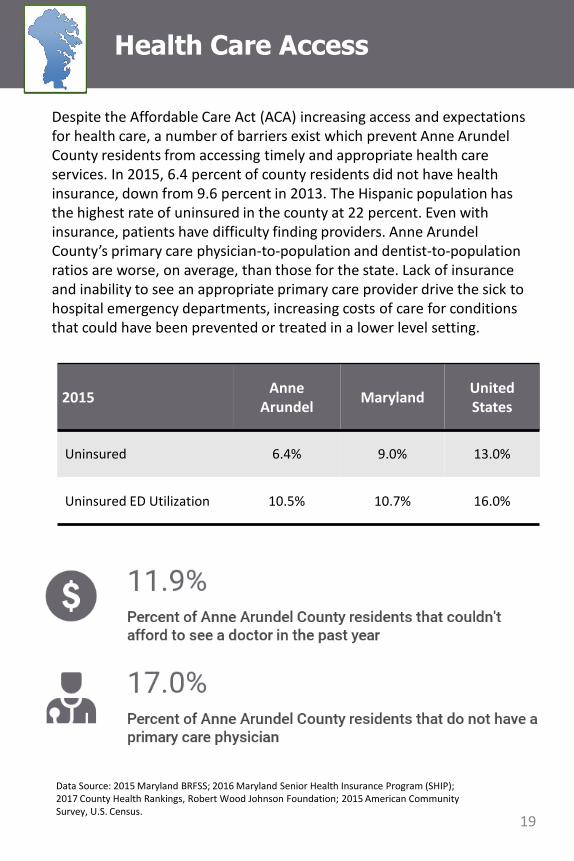
2015 Anne Arundel Maryland United
States
Uninsured 6.4% 9.0% 13.0%
Uninsured ED Utilization 10.5% 10.7% 16.0%
Health Care Access
Data Source: 2015 Maryland BRFSS; 2016 Maryland Senior Health Insurance Program (SHIP); 2017 County Health Rankings, Robert Wood Johnson Foundation; 2015 American Community Survey, U.S. Census.
Despite the Affordable Care Act (ACA) increasing access and expectations for health care, a number of barriers exist which prevent Anne Arundel County residents from accessing timely and appropriate health care services. In 2015, 6.4 percent of county residents did not have health insurance, down from 9.6 percent in 2013. The Hispanic population has the highest rate of uninsured in the county at 22 percent. Even with insurance, patients have difficulty finding providers. Anne Arundel County’s primary care physician-to-population and dentist-to-population ratios are worse, on average, than those for the state. Lack of insurance and inability to see an appropriate primary care provider drive the sick to hospital emergency departments, increasing costs of care for conditions that could have been prevented or treated in a lower level setting.
19

Data Source: 2015 Vital Statistics Annual Report, Maryland DHMH; Healthy People 2020, U.S. DHHS.
Prenatal Care
Percent of Women Receiving First Trimester Prenatal Care (First trimester includes the first 12 weeks of pregnancy)
2011 2012 2013 2014 2015
Anne Arundel 74.7% 71.4% 74.2% 68.5% 65.3%
Maryland 67.7% 67.9% 67.0% 66.6% 66.9%
White, NH 77.2% 74.1% 75.3% 74.7% 71.5%
Black, NH 58.5% 62.4% 62.1% 58.0% 57.1%
Hispanic, Any Race 61.5% 55.6% 61.2% 53.5% 46.4%
Anne Arundel County’s prenatal care trends are concerning. The county has not reached its Healthy People 2020 goal of 77.9% of women receiving prenatal care during their first trimester. We are not moving closer to this goal. Indeed, between 2011 and 2015, there has been a decrease of 9.4% of pregnant women in Anne Arundel County receiving prenatal care in their first trimester. Rates of early prenatal care have decreased since 2011 for Whites, Blacks and Hispanics. Getting early and regular prenatal care improves the health of both mothers and their babies. With regular prenatal care, women and their providers are able to reduce the risk of pregnancy complications like preeclampsia and complications with the infant like neural tube defects. These complications not only cause high emergency medical costs, but may result in disability and death.
20

How healthy are we?
21

*Rates based on data from 2013-2015. **Rates based on data from 2009-2013. ***Rates for fewer than 20 deaths not calculated. Lung cancer data also includes data on cancer of bronchus. Data Source: 2015 Vital Statistics Annual Report, Maryland DHMH; 2017 Cancer Report, Cigarette Restitution Fund Program, Maryland DHMH; Healthy People 2020, U.S. DHHS.
Indicator Anne Arundel (as of 2015*)
National 2020 Goal
Met National 2020 Goal
Mortality (age-adjusted rates per 100,000 population)
Coronary Heart Disease 159.3 103.4 No
Stroke 37.6 34.8 No
Diabetes 16.6 66.6 Yes
Unintentional Injuries 24.9 36.4 Yes
All Cancer 175.4 161.4 No
Lung Cancer 50.0 45.5 No
Female Breast Cancer 23.3 20.7 No
Homicide *** 5.5 Yes
Suicide 10.9 10.2 No
At the start of each decade, the U.S. Department of Health and Human Services provides a set of ten-year national objectives for improving health. The Healthy People 2020 goals help guide Anne Arundel County’s ongoing efforts toward building a healthier community. The county has already met some of the 2020 goals and continues to work toward others.
Healthy People 2020
22

In 2015, 4,095 Anne Arundel County residents were reported to have died, and life expectancy was 79.8 years. There are many modifiable risk factors that contribute to the leading causes of death, including smoking, high blood pressure, overweight and obesity, physical inactivity, poor diet and excess alcohol consumption. Leading a healthy lifestyle can reduce the burden of long-term disability and premature death.
Leading Causes of Death
*Chronic lower respiratory diseases (CLRD) include chronic obstructive pulmonary disease and asthma. Data Source: 2015 Vital Statistics Annual Report, Maryland DHMH; Maryland SHIP.
23
Top Ten Leading Causes of Death Among Anne Arundel County Residents, 2015
69
76
82
83
128
145
226
226
920
954
10. IntentionalSelf-Harm (Suicide)
9. Alzheimer's Disease
8. Diabetes Mellitus
7. Septicemia
6. Influenza and Pneumonia
5. Accidents(Unintentional Injury)
3. (tie) Cerebrovascular Disease
3. (tie) Chronic Lower Respiratory Disease*
2. Diseases of the Heart
1. Malignant Neoplasms

Data Source: 2015 Vital Statistics Annual Report, Maryland DHMH.
Mortality Rates, Anne Arundel County, 2005 vs. 2015
Mortality Trends
211.9
197.4
57.1
44.8
29.8
159.3
164.7
37.6
36.7
24.9
Heart Disease
Cancer
Stroke
CLRD
Accidents
Age-Adjusted Mortality Rate per 100,000 Population
2005
2015
23.7
24.0
16.6
20.6
12.3
9.4
16.6
20.3
14.1
13.7
10.5
10.9
Diabetes
Influenza and Pneumonia
Septicemia
Alzheimer's Disease
Kidney Diseases
Suicide
Age-Adjusted Mortality Rate per 100,000 Population
2005
2015
24
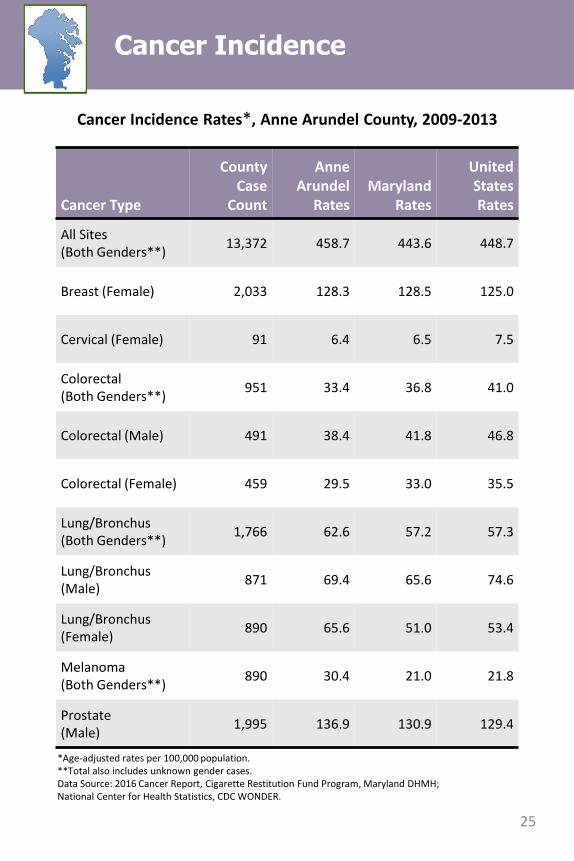
Cancer Type
County Case
Count
Anne Arundel
Rates Maryland
Rates
United States Rates
All Sites (Both Genders**) 13,372 458.7 443.6 448.7
Breast (Female) 2,033 128.3 128.5 125.0
Cervical (Female) 91 6.4 6.5 7.5
Colorectal (Both Genders**) 951 33.4 36.8 41.0
Colorectal (Male) 491 38.4 41.8 46.8
Colorectal (Female) 459 29.5 33.0 35.5
Lung/Bronchus (Both Genders**) 1,766 62.6 57.2 57.3
Lung/Bronchus (Male) 871 69.4 65.6 74.6
Lung/Bronchus (Female) 890 65.6 51.0 53.4
Melanoma (Both Genders**) 890 30.4 21.0 21.8
Prostate (Male) 1,995 136.9 130.9 129.4
*Age-adjusted rates per 100,000 population. **Total also includes unknown gender cases. Data Source: 2016 Cancer Report, Cigarette Restitution Fund Program, Maryland DHMH; National Center for Health Statistics, CDC WONDER.
Cancer Incidence Rates*, Anne Arundel County, 2009-2013
Cancer Incidence
25

*Age-adjusted rates per 100,000 population. **Includes cancer of the trachea. Data Source: 2017 Cancer Report, Cigarette Restitution Fund Program, Maryland DHMH; National Center for Health Statistics, CDC WONDER.
Cancer Mortality Rates*, Anne Arundel County, 2009-2013
Cancer Type
County Death Count
Anne Arundel
Rates Maryland
Rates
United States Rates
All Sites (Both Genders) 4,884 175.4 168.4 168.5
Breast (Female) 362 23.3 23.1 21.5
Cervical (Female) 41 2.8 2.1 2.3
Colorectal (Both Genders) 365 13.1 14.9 15.1
Colorectal (Male) 201 16.2 18.2 18.1
Colorectal (Female) 164 10.7 12.5 12.7
Lung/Bronchus** (Both Genders) 1,766 50.0 44.5 46.0
Lung/Bronchus (Male) 871 59.0 54.1 57.8
Lung/Bronchus (Female) 890 43.3 37.4 37.0
Melanoma (Both Genders) 91 3.3 2.6 2.7
Prostate (Male) 212 20.1 21.3 20.7
Cancer Mortality
26

Data Source: 2011-2015 Vital Statistics Annual Reports, Maryland DHMH; National Center for Health Statistics, CDC.
Maternal and Child Health
In 2015, there were 6,924 births in Anne Arundel County. Of those births, 4,393 were non-Hispanic white, 1,259 were non-Hispanic black and 847 were Hispanic. Many factors affect pregnancy and childbirth including the mother’s pre-pregnancy health status, the mother’s age at birth, access to health care and socioeconomic status. Anne Arundel County achieved its Healthy People 2020 goal for both low birth weight and preterm births.
2011 2012 2013 2014 2015 Percent of Low Birth Weight Infants
Anne Arundel 8.1% 7.8% 7.5% 8.1% 7.8%
Maryland 8.9% 8.8% 8.5% 8.6% 8.6%
United States 8.1% 8.0% 8.0% 8.0% 8.1%
Percent of Low Birth Weight Infants, Anne Arundel by Race/Ethnicity
White, NH 6.7% 6.5% 6.1% 6.9% 6.4%
Black, NH 13.5% 12.1% 12.3% 13.8% 12.6%
Hispanic, Any Race 7.9% 7.9% 7.4% 6.9% 7.2%
Percent of Women Having Preterm Births
Anne Arundel 9.9% 9.4% 8.9% 9.1% 9.3%
Maryland 11.1% 12.7% 12.5% 12.2% 11.9%
United States 11.4% 12.0% 11.7% 11.5% 11.4%
Percent of Preterm Infants, Anne Arundel by Race/Ethnicity
White, NH 9.0% 8.9% 8.0% 8.2% 8.4%
Black, NH 14.1% 10.4% 11.9% 13.5% 12.1%
Hispanic, Any Race 8.9% 9.5% 8.9% 7.9% 9.6%
27
Data Source: 2011-2015 Vital Statistics Annual Reports, Maryland DHMH; National Center for Health Statistics, CDC, CDC Wonder.
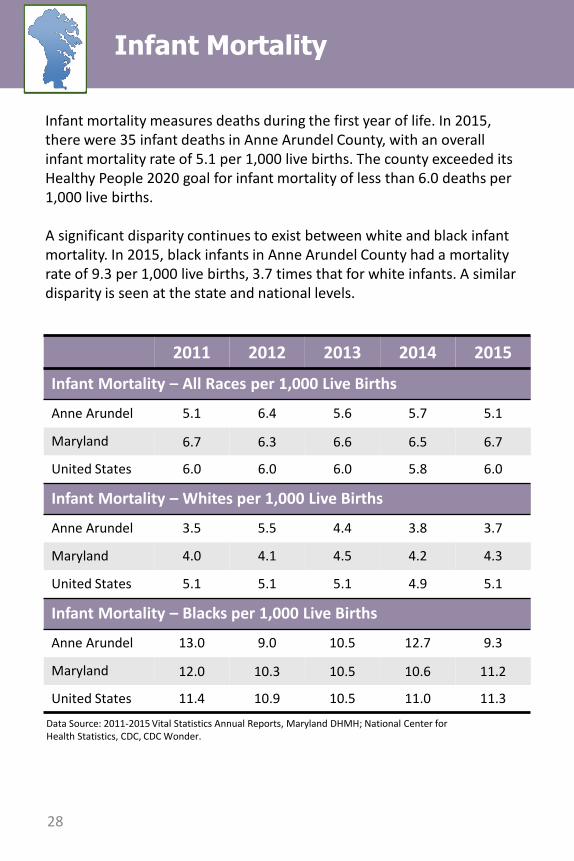
2011 2012 2013 2014 2015
Infant Mortality – All Races per 1,000 Live Births
Anne Arundel 5.1 6.4 5.6 5.7 5.1
Maryland 6.7 6.3 6.6 6.5 6.7
United States 6.0 6.0 6.0 5.8 6.0
Infant Mortality – Whites per 1,000 Live Births
Anne Arundel 3.5 5.5 4.4 3.8 3.7
Maryland 4.0 4.1 4.5 4.2 4.3
United States 5.1 5.1 5.1 4.9 5.1
Infant Mortality – Blacks per 1,000 Live Births
Anne Arundel 13.0 9.0 10.5 12.7 9.3
Maryland 12.0 10.3 10.5 10.6 11.2
United States 11.4 10.9 10.5 11.0 11.3
Infant mortality measures deaths during the first year of life. In 2015, there were 35 infant deaths in Anne Arundel County, with an overall infant mortality rate of 5.1 per 1,000 live births. The county exceeded its Healthy People 2020 goal for infant mortality of less than 6.0 deaths per 1,000 live births. A significant disparity continues to exist between white and black infant mortality. In 2015, black infants in Anne Arundel County had a mortality rate of 9.3 per 1,000 live births, 3.7 times that for white infants. A similar disparity is seen at the state and national levels.
Infant Mortality
28
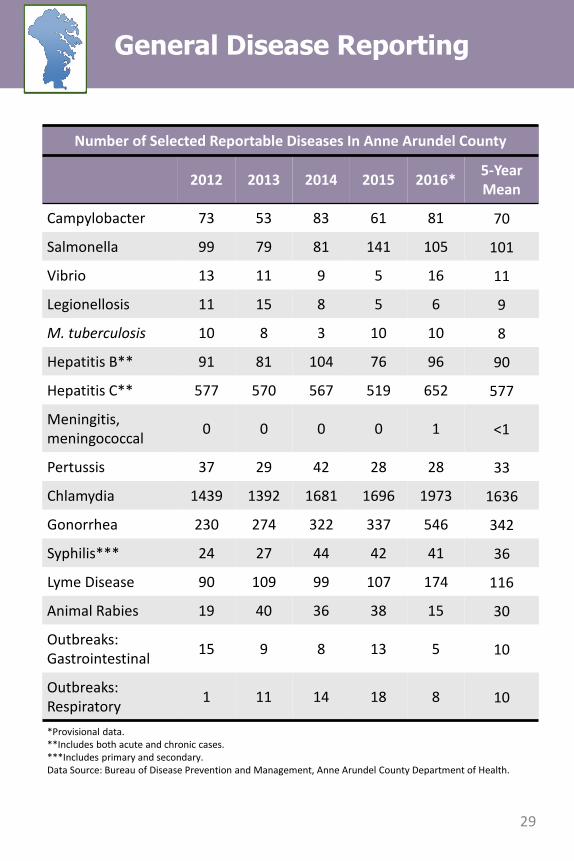
*Provisional data. **Includes both acute and chronic cases. ***Includes primary and secondary. Data Source: Bureau of Disease Prevention and Management, Anne Arundel County Department of Health.
General Disease Reporting
Number of Selected Reportable Diseases In Anne Arundel County
2012 2013 2014 2015 2016* 5-Year Mean
Campylobacter 73 53 83 61 81 70
Salmonella 99 79 81 141 105 101
Vibrio 13 11 9 5 16 11
Legionellosis 11 15 8 5 6 9
M. tuberculosis 10 8 3 10 10 8
Hepatitis B** 91 81 104 76 96 90
Hepatitis C** 577 570 567 519 652 577
Meningitis, meningococcal 0 0 0 0 1 <1
Pertussis 37 29 42 28 28 33
Chlamydia 1439 1392 1681 1696 1973 1636
Gonorrhea 230 274 322 337 546 342
Syphilis*** 24 27 44 42 41 36
Lyme Disease 90 109 99 107 174 116
Animal Rabies 19 40 36 38 15 30
Outbreaks: Gastrointestinal 15 9 8 13 5 10
Outbreaks: Respiratory 1 11 14 18 8 10
29

Compiled in 2017 by: Christina Gray, M.S. Technical and editorial assistance provided by: AZ Snyder Jinlene Chan, M.D., M.P.H. David C. Rose, M.D., M.B.A. Jackie Young, CHES Public Information Office
Anne Arundel County Department of Health Office of Assessment and Planning 3 Harry S. Truman Parkway, HD17 Annapolis, MD 21401 410-222-4224 www.aahealth.org
The services and facilities of the Anne Arundel County Department of Health are available to all regardless of race, color, religion, political affiliation,
national origin, age, gender identity, sexual orientation or disability.
Contact Information
31
30