Embed Size (px)
Citation preview
Report as of March 31, 2009May 14, 2009
Silicon & Wafer
Solar Cell & Module
Thin Film
Semiconductor
centrotherm photovoltaics AG Report as of March 31, 2009 2
Disclaimer
We have exercised utmost care in the preparation of this presentation. It contains forecasts
and/or information relating to forecasts. Forecasts are based on facts, expectations, and/or
past figures. As with all forward-looking statements, forecasts are connected with known and
unknown uncertainties, which may mean the actual result deviates significantly from the
forecast. Forecasts prepared by third parties, or data or evaluations used by third parties and
mentioned in this communication, may be inappropriate, incomplete, or falsified. We cannot
assess whether information, evaluations, or forecasts made by third parties are appropriate,
complete, and not misleading. To the extent that information in this presentation has been
taken from third parties, or these provide the basis of our own evaluations, such use is made
known in this report. As a result of the above-mentioned circumstances, we can provide no
warranty regarding the correctness, completeness, and up-to-date nature of information taken,
and declared as being taken, from third parties, as well as for forward-looking statements,
irrespective of whether these derive from third parties or ourselves.
Rounding differences may arise.
centrotherm photovoltaics AG Report as of March 31, 2009 3
Contents
1. Highlights
4. Financial Results
3. Research and Development
2. Market Development
5. Outlook
6. Appendix
centrotherm photovoltaics AG Report as of March 31, 2009 4
Highlights
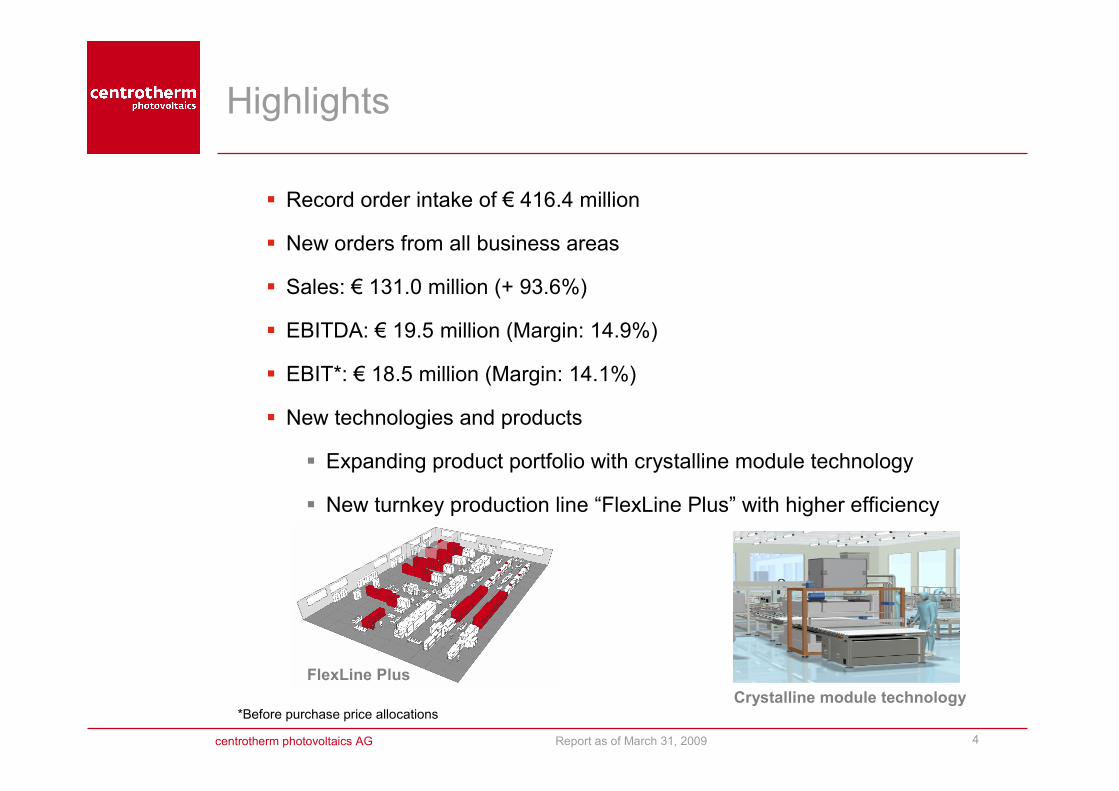
� Record order intake of € 416.4 million
� New orders from all business areas
� Sales: € 131.0 million (+ 93.6%)
� EBITDA: € 19.5 million (Margin: 14.9%)
� EBIT*: € 18.5 million (Margin: 14.1%)
� New technologies and products
� Expanding product portfolio with crystalline module technology
� New turnkey production line “FlexLine Plus” with higher efficiency
FlexLine Plus
Crystalline module technology*Before purchase price allocations
centrotherm photovoltaics AG Report as of March 31, 2009 5
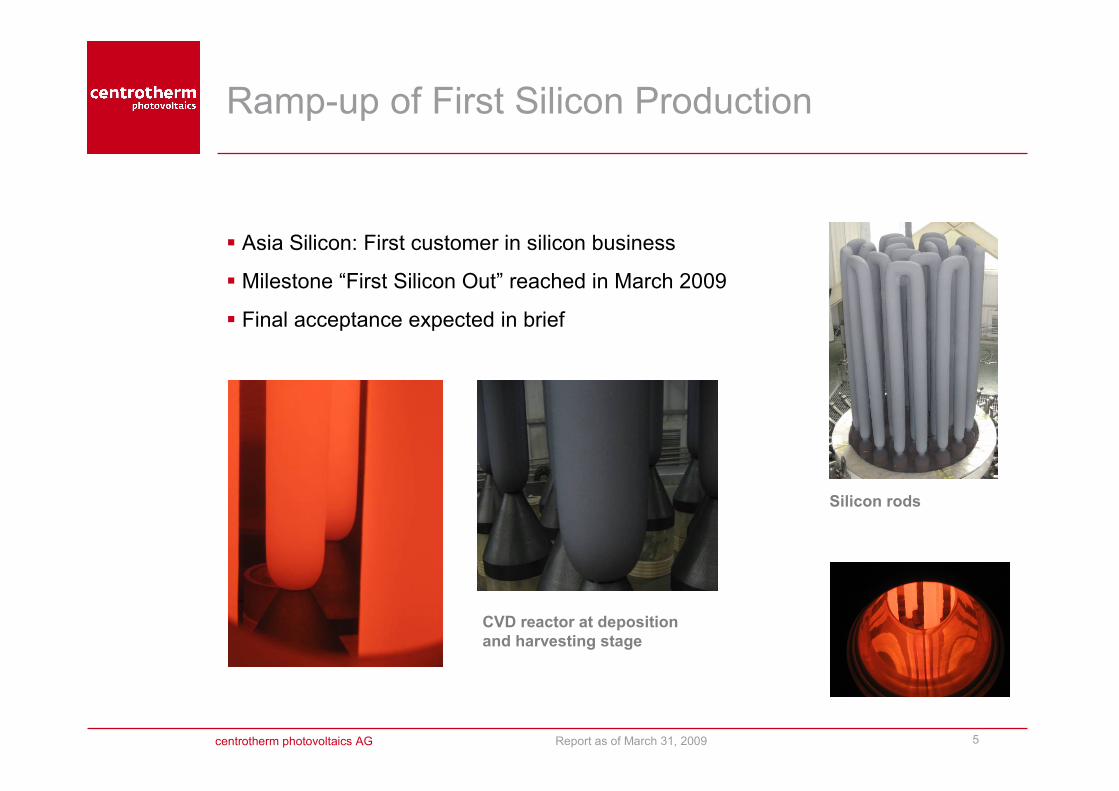
Ramp-up of First Silicon Production
� Asia Silicon: First customer in silicon business
� Milestone “First Silicon Out” reached in March 2009
� Final acceptance expected in brief
CVD reactor at deposition
and harvesting stage
Silicon rods
centrotherm photovoltaics AG Report as of March 31, 2009 6
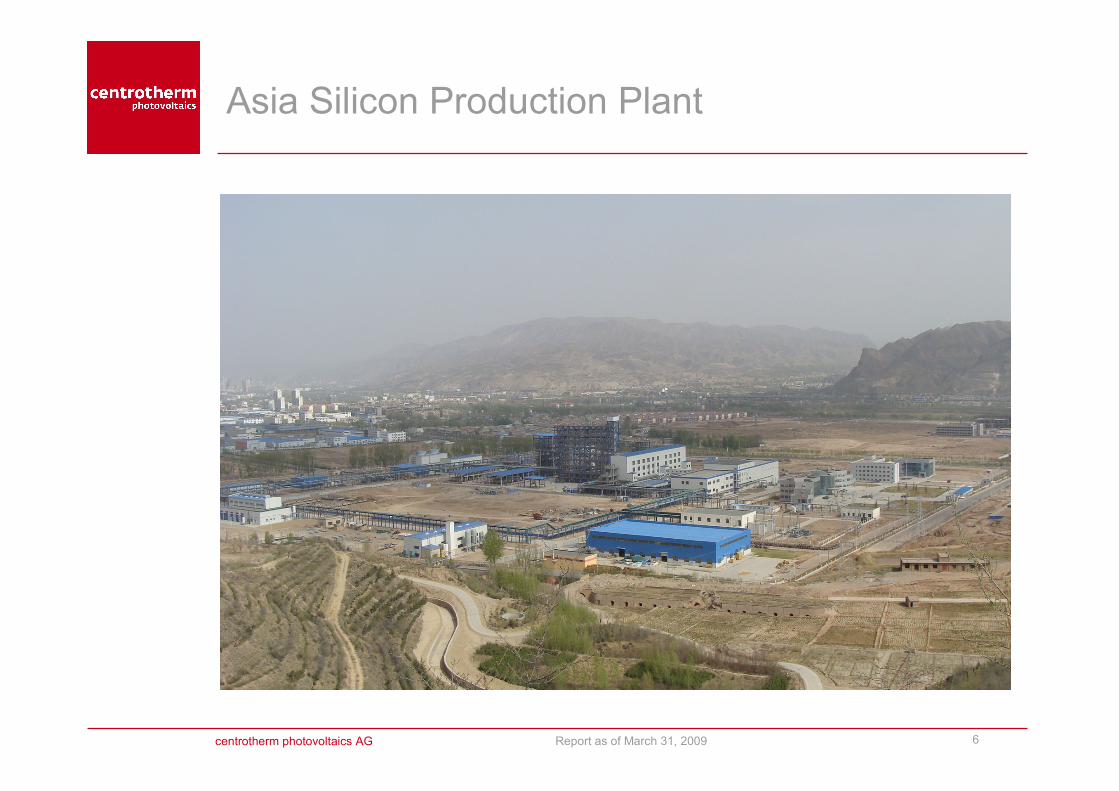
Asia Silicon Production Plant
VGR
VGR VGR
centrotherm photovoltaics AG Report as of March 31, 2009 7
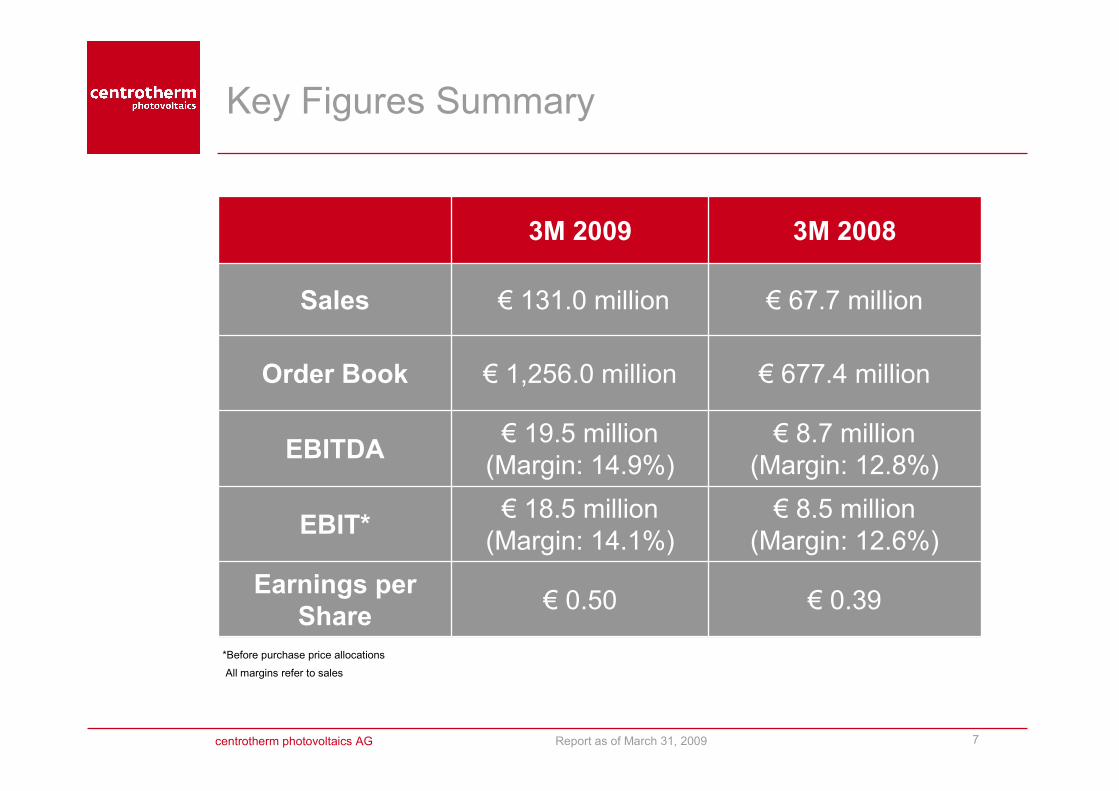
Key Figures Summary
€ 8.7 million
(Margin: 12.8%)
€ 19.5 million
(Margin: 14.9%)EBITDA
€ 0.39€ 0.50Earnings per
Share
€ 8.5 million
(Margin: 12.6%)
€ 18.5 million
(Margin: 14.1%)EBIT*
€ 677.4 million€ 1,256.0 millionOrder Book
€ 67.7 million€ 131.0 millionSales
3M 20083M 2009
*Before purchase price allocations
All margins refer to sales
centrotherm photovoltaics AG Report as of March 31, 2009 8
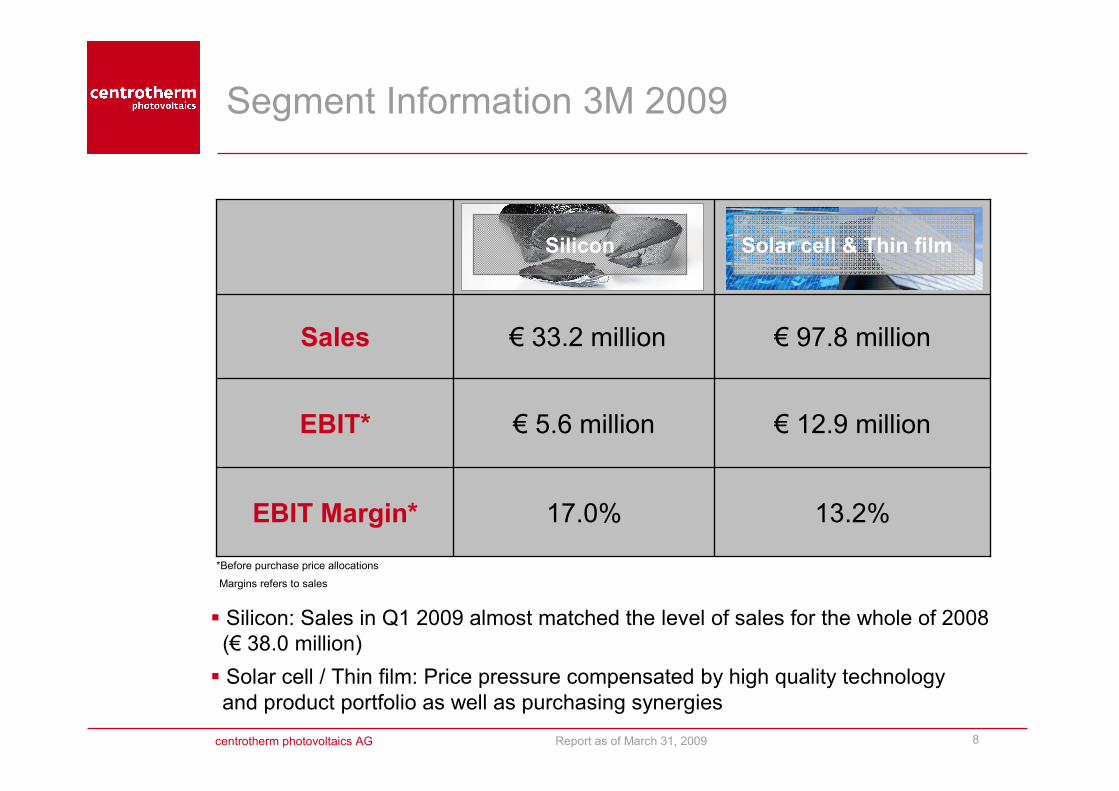
Segment Information 3M 2009
13.2%17.0%EBIT Margin*
€ 12.9 million€ 5.6 millionEBIT*
€ 97.8 million€ 33.2 millionSales
*Before purchase price allocations
Margins refers to sales
� Silicon: Sales in Q1 2009 almost matched the level of sales for the whole of 2008
(€ 38.0 million)
� Solar cell / Thin film: Price pressure compensated by high quality technology
and product portfolio as well as purchasing synergies
Silicon Solar cell & Thin film
centrotherm photovoltaics AG Report as of March 31, 2009 9
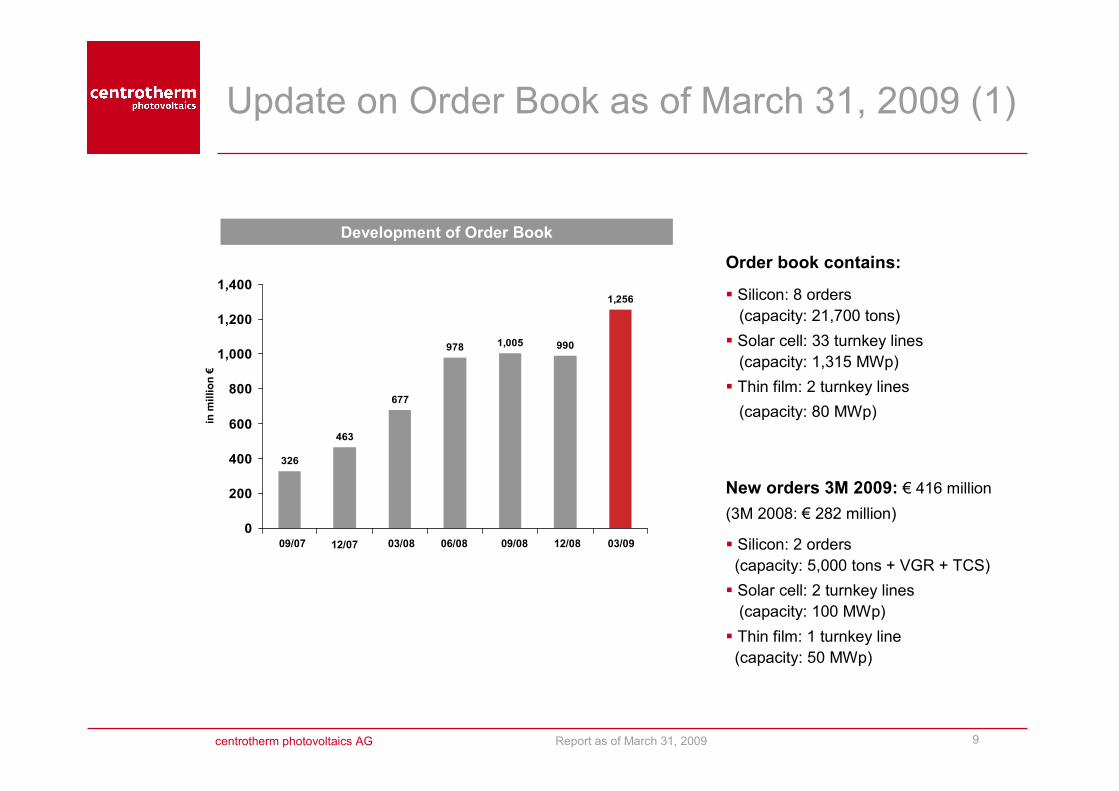
Update on Order Book as of March 31, 2009 (1)
326
463
677
978 1,005 990
1,256
0
200
400
600
800
1,000
1,200
1,400
Development of Order Book
in m
illion €
Order book contains:
� Silicon: 8 orders
(capacity: 21,700 tons)
� Solar cell: 33 turnkey lines
(capacity: 1,315 MWp)
� Thin film: 2 turnkey lines
(capacity: 80 MWp)
New orders 3M 2009: € 416 million
(3M 2008: € 282 million)
� Silicon: 2 orders
(capacity: 5,000 tons + VGR + TCS)
� Solar cell: 2 turnkey lines
(capacity: 100 MWp)
� Thin film: 1 turnkey line
(capacity: 50 MWp)
03/0812/07 06/08 09/08 09/07 12/08 03/09
centrotherm photovoltaics AG Report as of March 31, 2009 10
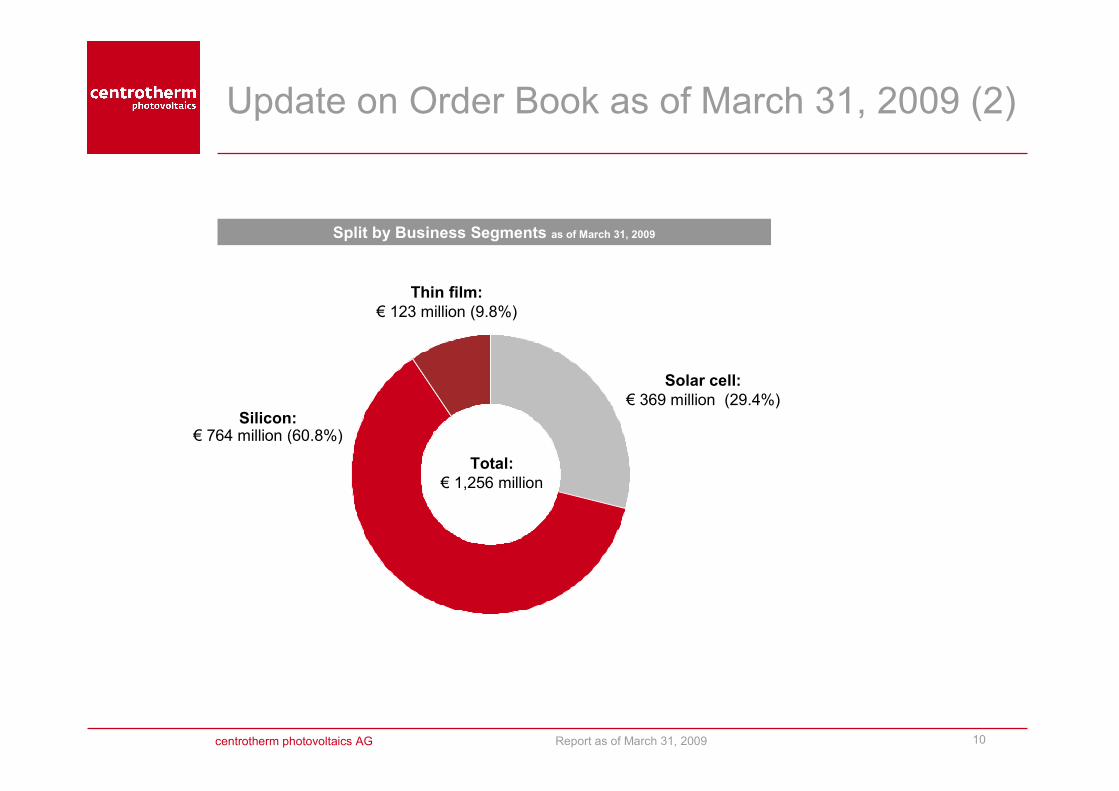
Solar cell:
€ 369 million (29.4%)
Thin film:
€ 123 million (9.8%)
Silicon:€ 764 million (60.8%)
Total:
€ 1,256 million
Split by Business Segments as of March 31, 2009
Update on Order Book as of March 31, 2009 (2)
centrotherm photovoltaics AG Report as of March 31, 2009 11
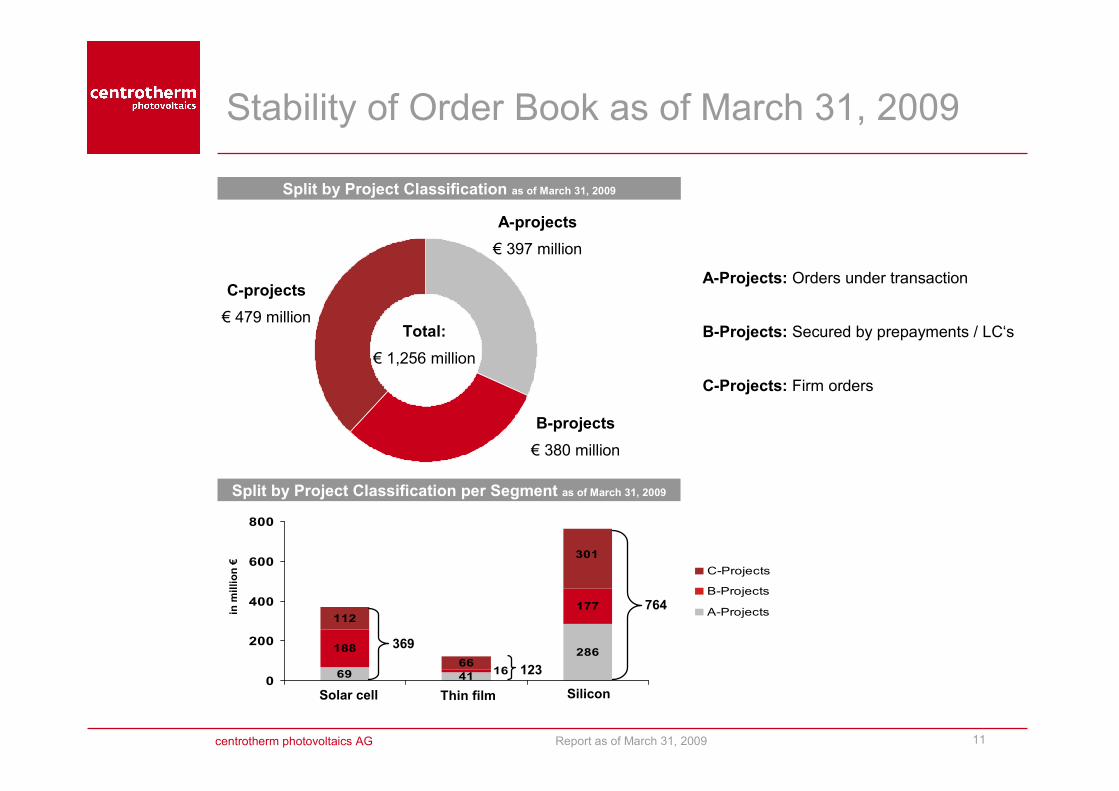
Stability of Order Book as of March 31, 2009
Split by Project Classification as of March 31, 2009
A-Projects: Orders under transaction
B-Projects: Secured by prepayments / LC‘s
C-Projects: Firm orders
Total:
€ 1,256 million
B-projects
€ 380 million
A-projects
€ 397 million
C-projects
€ 479 million
41
177112
6669
286188
16
301
0
200
400
600
800
Solar cell Thin film Silicon
C-Projects
B-Projects
A-Projects
369
764
123
Split by Project Classification per Segment as of March 31, 2009
in m
illion €
Solar cell Thin film Silicon
centrotherm photovoltaics AG Report as of March 31, 2009 12
Contents
1. Highlights
4. Financial Results
3. Research and Development
2. Market Development
5. Outlook
6. Appendix
centrotherm photovoltaics AG Report as of March 31, 2009 13
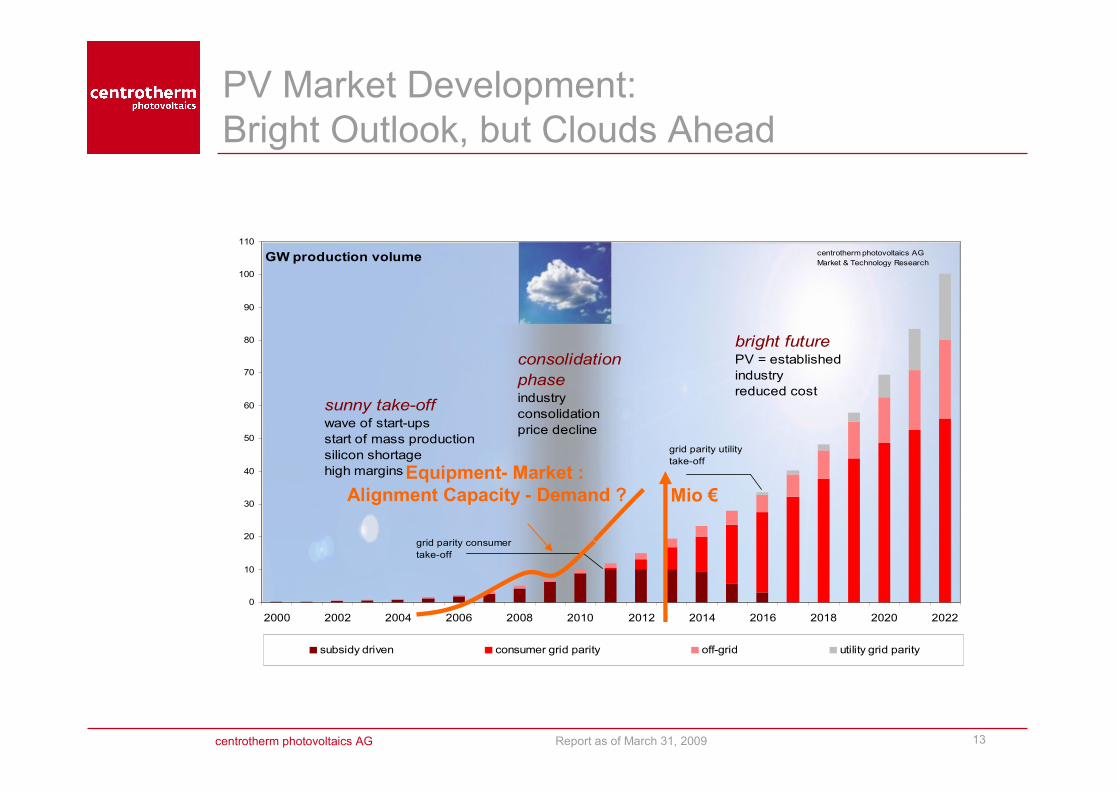
0
10
20
30
40
50
60
70
80
90
100
110
2000 2002 2004 2006 2008 2010 2012 2014 2016 2018 2020 2022
subsidy driven consumer grid parity off-grid utility grid parity
bright futurePV = established
industry
reduced cost
sunny take-offwave of start-ups
start of mass production
silicon shortage
high margins
consolidation
phaseindustry
consolidation
price decline
GW production volume
grid parity consumer
take-off
grid parity utility
take-off
centrotherm photovoltaics AG
Market & Technology Research
PV Market Development:
Bright Outlook, but Clouds Ahead
Equipment- Market :
Alignment Capacity - Demand ? Mio €
centrotherm photovoltaics AG Report as of March 31, 2009 14
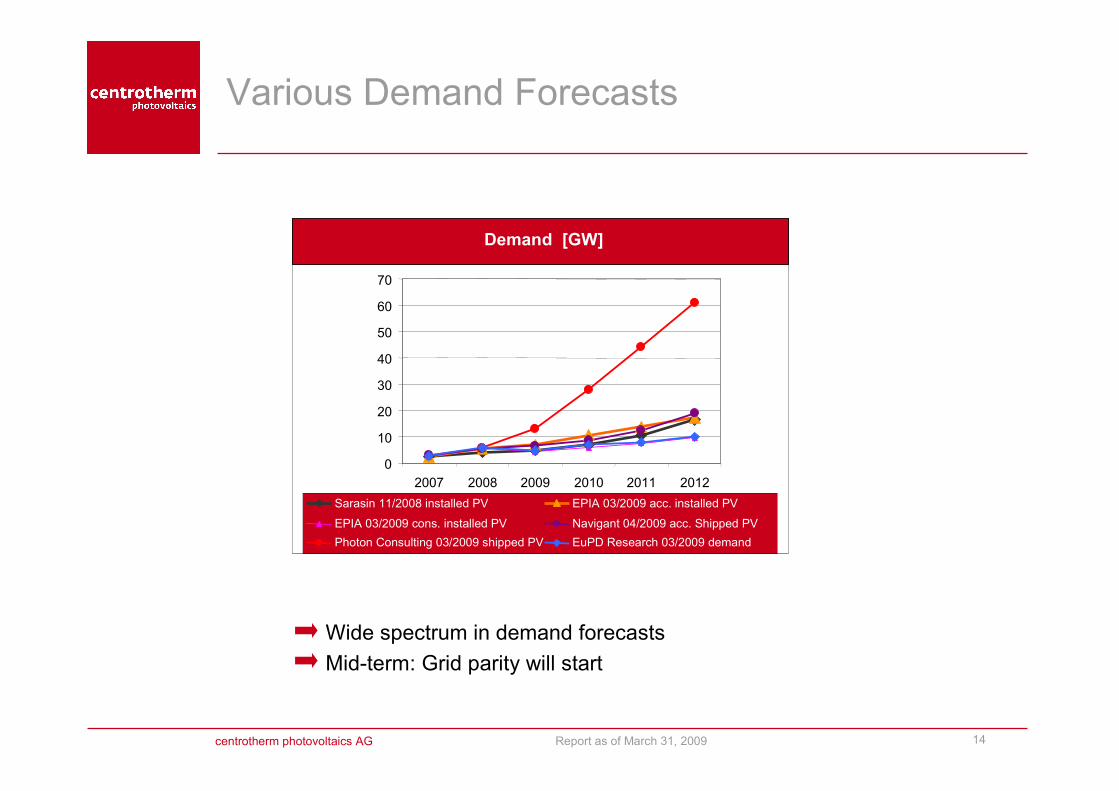
Various Demand Forecasts
Wide spectrum in demand forecasts
Mid-term: Grid parity will start
0
10
20
30
40
50
60
70
2007 2008 2009 2010 2011 2012
Sarasin 11/2008 installed PV EPIA 03/2009 acc. installed PV
EPIA 03/2009 cons. installed PV Navigant 04/2009 acc. Shipped PV
Photon Consulting 03/2009 shipped PV EuPD Research 03/2009 demand
Demand [GW]
centrotherm photovoltaics AG Report as of March 31, 2009 15
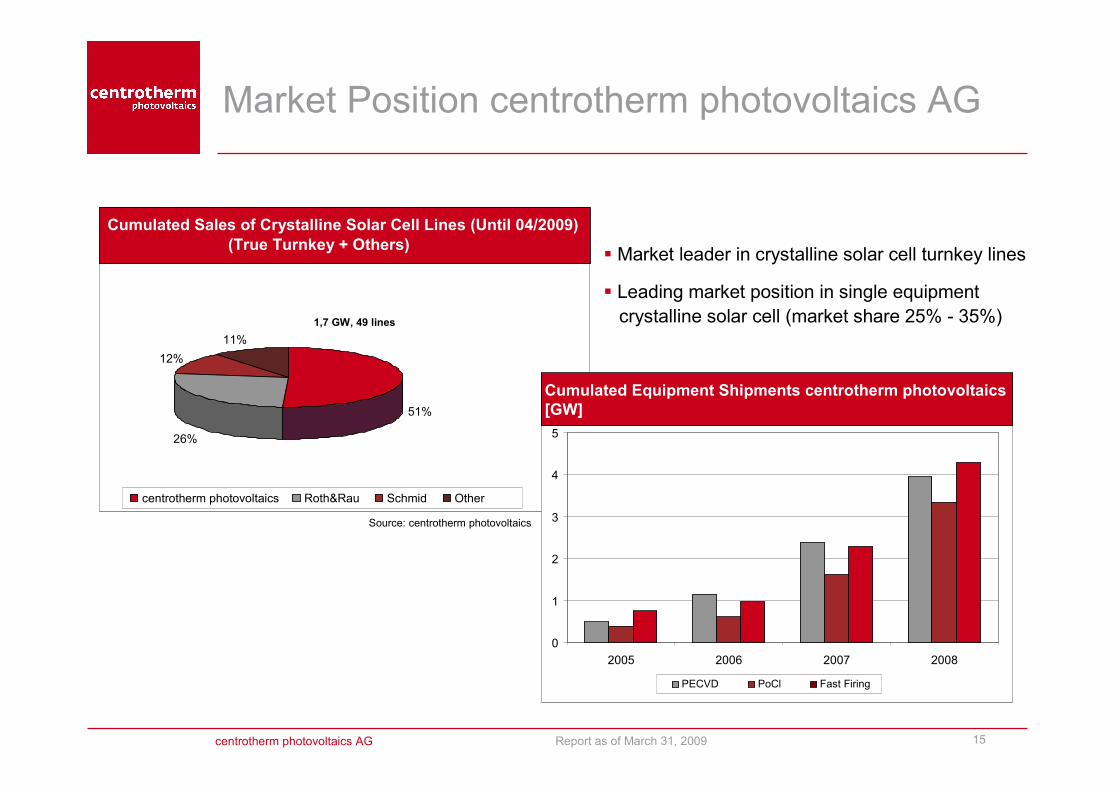
Market Position centrotherm photovoltaics AG
51%
26%
12%
11%
centrotherm photovoltaics Roth&Rau Schmid Other
1,7 GW, 49 lines
Source: centrotherm photovoltaics
Cumulated Sales of Crystalline Solar Cell Lines (Until 04/2009)
(True Turnkey + Others)
0
1
2
3
4
5
2005 2006 2007 2008
PECVD PoCl Fast Firing
Cumulated Equipment Shipments centrotherm photovoltaics
[GW]
� Market leader in crystalline solar cell turnkey lines
� Leading market position in single equipment
crystalline solar cell (market share 25% - 35%)
centrotherm photovoltaics AG Report as of March 31, 2009 16
Contents
1. Highlights
4. Financial Results
3. Research and Development
2. Market Development
5. Outlook
6. Appendix
centrotherm photovoltaics AG Report as of March 31, 2009 17
Research and Development
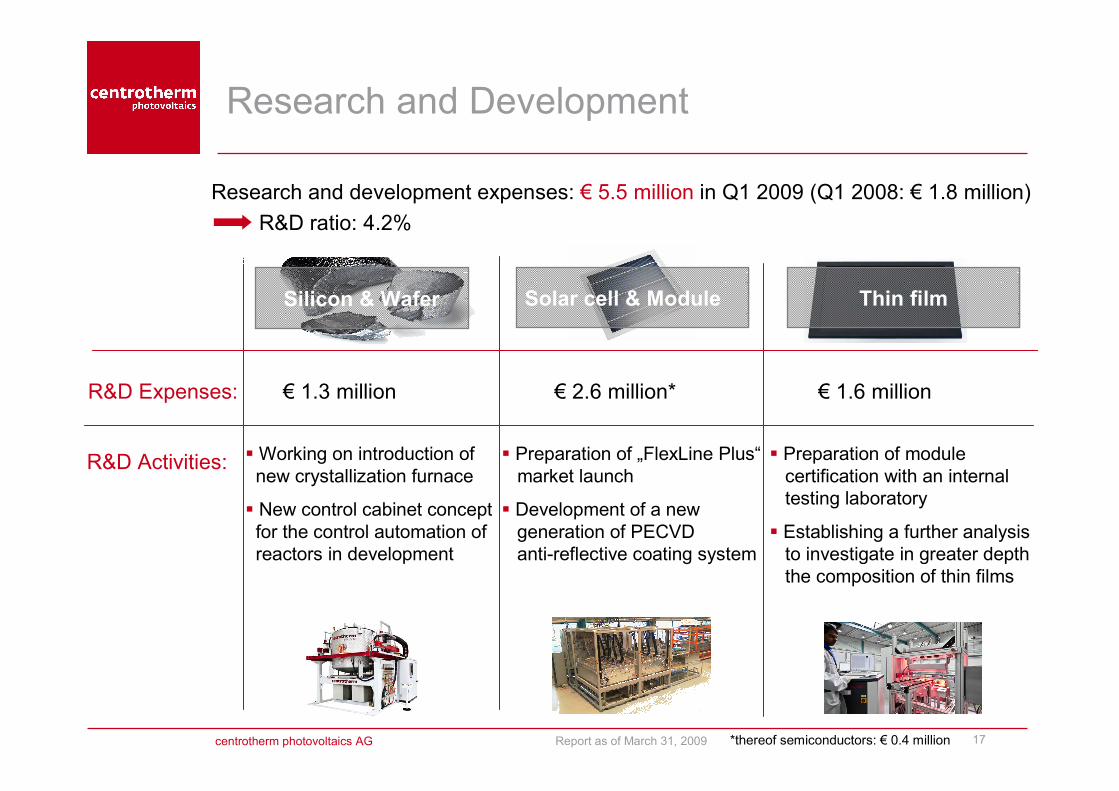
Research and development expenses: € 5.5 million in Q1 2009 (Q1 2008: € 1.8 million)
R&D ratio: 4.2%
Silicon & Wafer Solar cell & Module Thin film
R&D Expenses:
R&D Activities:
€ 1.3 million € 2.6 million* € 1.6 million
� Working on introduction of
new crystallization furnace
� New control cabinet concept
for the control automation of
reactors in development
� Preparation of „FlexLine Plus“
market launch
� Development of a new
generation of PECVD
anti-reflective coating system
� Preparation of module
certification with an internal
testing laboratory
� Establishing a further analysis
to investigate in greater depth
the composition of thin films
*thereof semiconductors: € 0.4 million
centrotherm photovoltaics AG Report as of March 31, 2009 18
Contents
1. Highlights
4. Financial Results
3. Research and Development
2. Market Development
5. Outlook
6. Appendix
centrotherm photovoltaics AG Report as of March 31, 2009 19
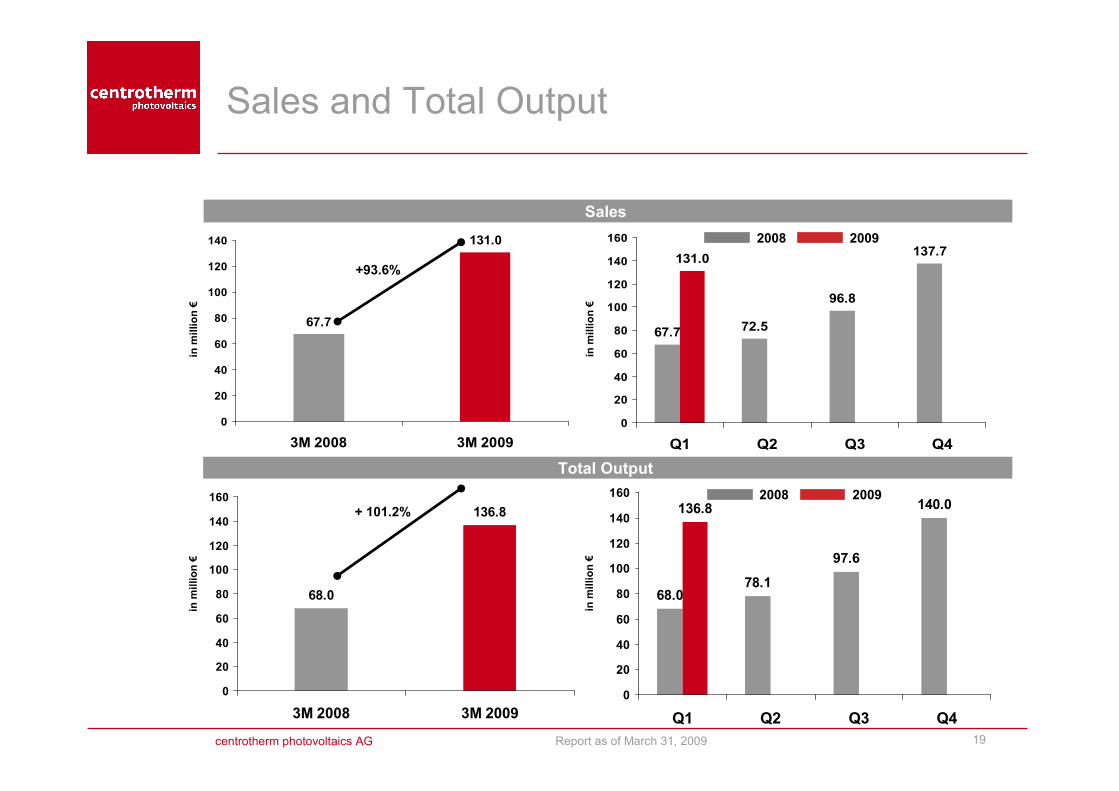
Sales and Total Output
67.7 72.5
96.8
137.7131.0
0
20
40
60
80
100
120
140
160
Q1 Q2 Q3 Q4
67.7
131.0
0
20
40
60
80
100
120
140
3M 2008 3M 2009
136.8
68.0
0
20
40
60
80
100
120
140
160
3M 2008 3M 2009
Sales
+93.6%
in m
illion €
Total Output
+ 101.2%
2008 2009
68.078.1
97.6
140.0136.8
0
20
40
60
80
100
120
140
160
Q1 Q2 Q3 Q4
2008 2009
in m
illion €
in m
illion €
in m
illion €
centrotherm photovoltaics AG Report as of March 31, 2009 20
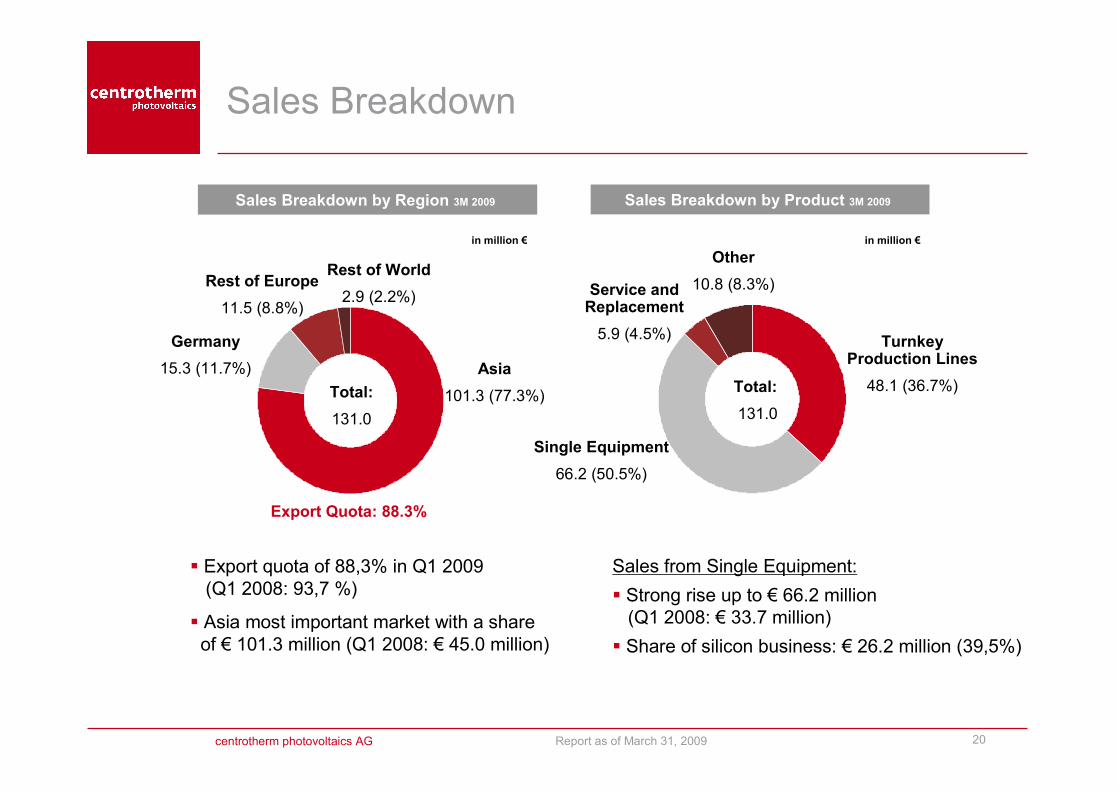
Sales Breakdown
Sales Breakdown by Region 3M 2009
Asia
101.3 (77.3%)
Germany
15.3 (11.7%)
Rest of Europe
11.5 (8.8%)
Rest of World
2.9 (2.2%)
Sales Breakdown by Product 3M 2009
Turnkey Production Lines
48.1 (36.7%)
Single Equipment
66.2 (50.5%)
Service and Replacement
5.9 (4.5%)
Other
10.8 (8.3%)
Total:
131.0
Total:
131.0
in million €
Export Quota: 88.3%
in million €
� Export quota of 88,3% in Q1 2009
(Q1 2008: 93,7 %)
� Asia most important market with a share
of € 101.3 million (Q1 2008: € 45.0 million)
Sales from Single Equipment:
� Strong rise up to € 66.2 million
(Q1 2008: € 33.7 million)
� Share of silicon business: € 26.2 million (39,5%)
centrotherm photovoltaics AG Report as of March 31, 2009 21
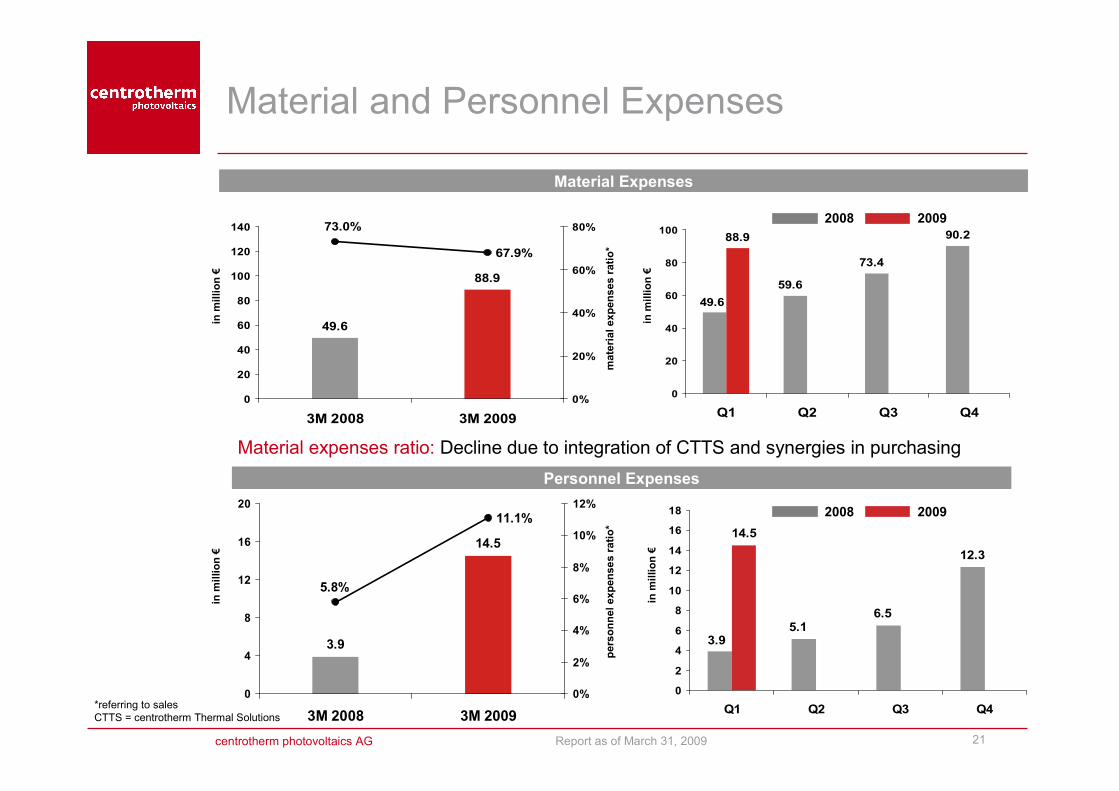
Material and Personnel Expenses
90.288.9
49.6
73.4
59.6
0
20
40
60
80
100
Q1 Q2 Q3 Q4
49.6
88.9
67.9%
73.0%
0
20
40
60
80
100
120
140
3M 2008 3M 2009
0%
20%
40%
60%
80%
3.9
14.5
11.1%
5.8%
0
4
8
12
16
20
3M 2008 3M 2009
0%
2%
4%
6%
8%
10%
12%
*referring to sales
CTTS = centrotherm Thermal Solutions
Material Expenses
in m
illion €
material expensesratio*
Personnel Expenses
12.3
14.5
3.9
6.55.1
0
2
4
6
8
10
12
14
16
18
Q1 Q2 Q3 Q4
personnel expenses ratio*
in m
illion €
in m
illion €
in m
illion €
2008 2009
2008 2009
Material expenses ratio: Decline due to integration of CTTS and synergies in purchasing
centrotherm photovoltaics AG Report as of March 31, 2009 22
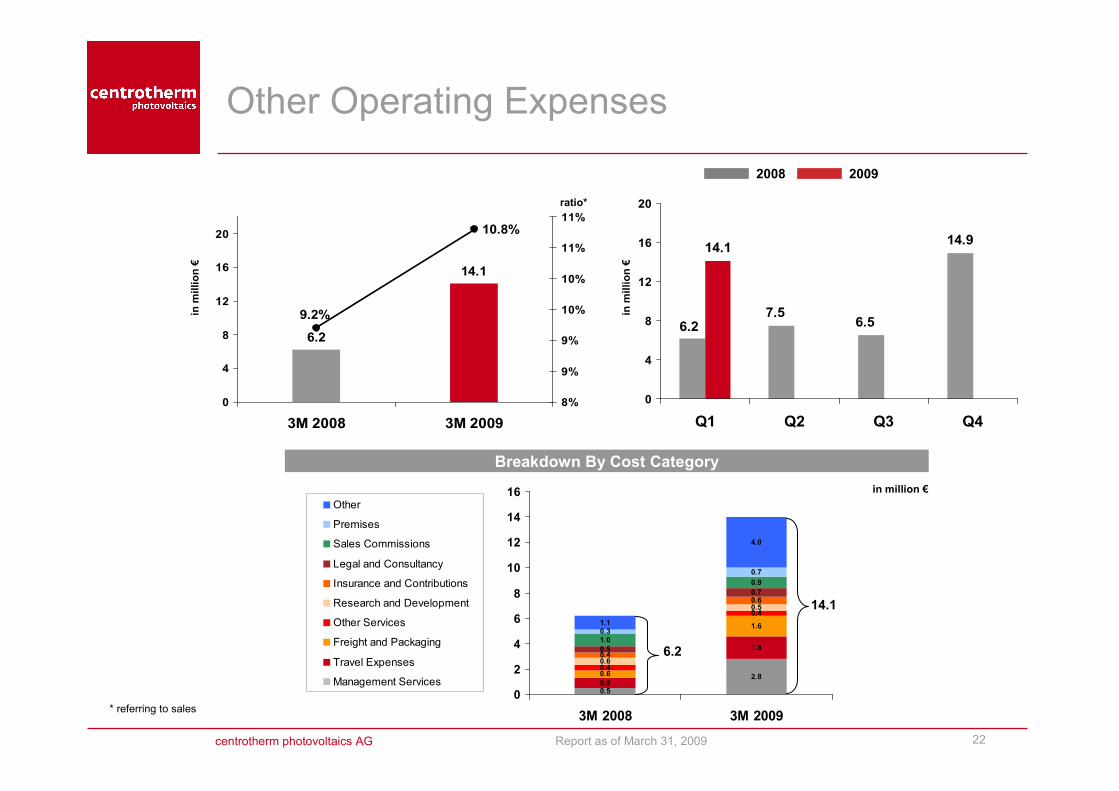
Other Operating Expenses
6.2
14.1
10.8%
9.2%
0
4
8
12
16
20
3M 2008 3M 2009
8%
9%
9%
10%
10%
11%
11%
14.914.1
6.2 6.57.5
0
4
8
12
16
20
Q1 Q2 Q3 Q4
* referring to sales
Breakdown By Cost Category
ratio*in m
illion €
in m
illion €
1.8
0.6
1.6
0.4
0.4
0.6
0.50.6
0.5
0.7
1.0
0.9
0.3
0.7
1.1
4.0
2.8
0.50.8
0.4
0
2
4
6
8
10
12
14
16
3M 2008 3M 2009
Other
Premises
Sales Commissions
Legal and Consultancy
Insurance and Contributions
Research and Development
Other Services
Freight and Packaging
Travel Expenses
Management Services
6.2
in million €
14.1
2008 2009
centrotherm photovoltaics AG Report as of March 31, 2009 23
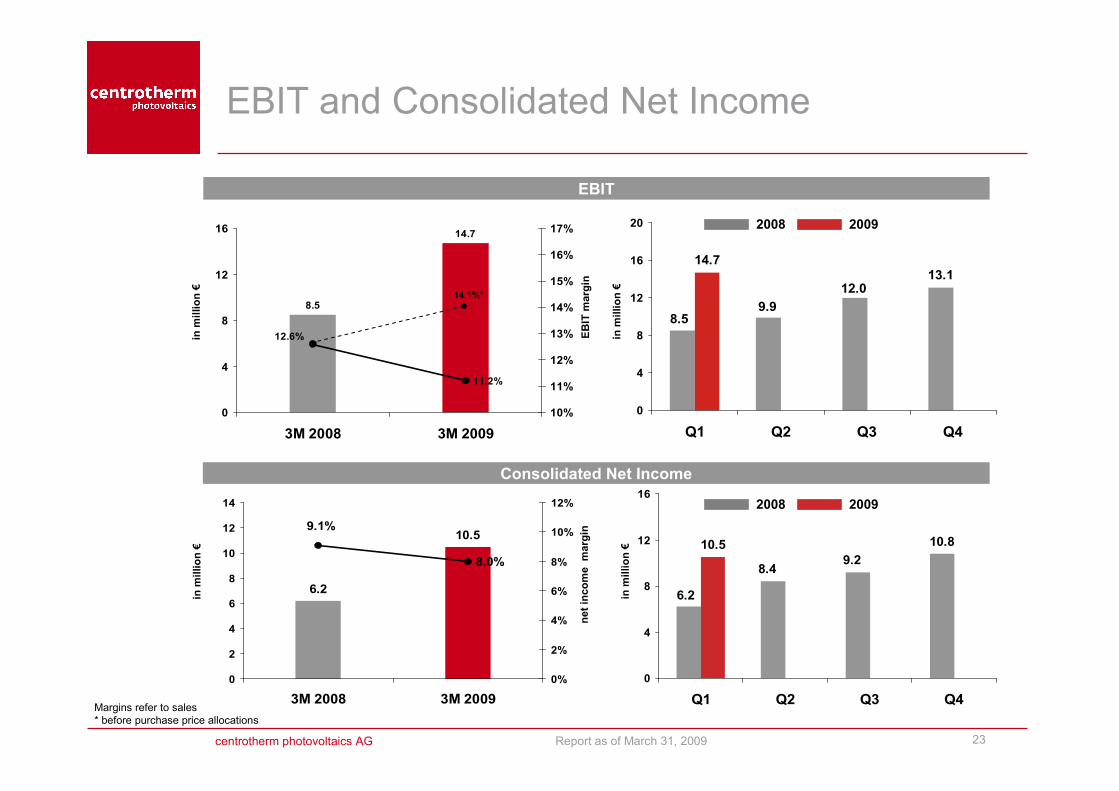
EBIT and Consolidated Net Income
8.5
14.7
11.2%
12.6%
0
4
8
12
16
3M 2008 3M 2009
10%
11%
12%
13%
14%
15%
16%
17%
13.114.7
8.5
12.0
9.9
0
4
8
12
16
20
Q1 Q2 Q3 Q4
6.2
10.5
8.0%
9.1%
0
2
4
6
8
10
12
14
3M 2008 3M 2009
0%
2%
4%
6%
8%
10%
12%
EBIT
Consolidated Net Income
10.810.5
6.2
9.28.4
0
4
8
12
16
Q1 Q2 Q3 Q4
in m
illion €
in m
illion €
in m
illion €
in m
illion €
EBIT m
argin
net income margin
Margins refer to sales
* before purchase price allocations
14.1%*
2008 2009
2008 2009
centrotherm photovoltaics AG Report as of March 31, 2009 24
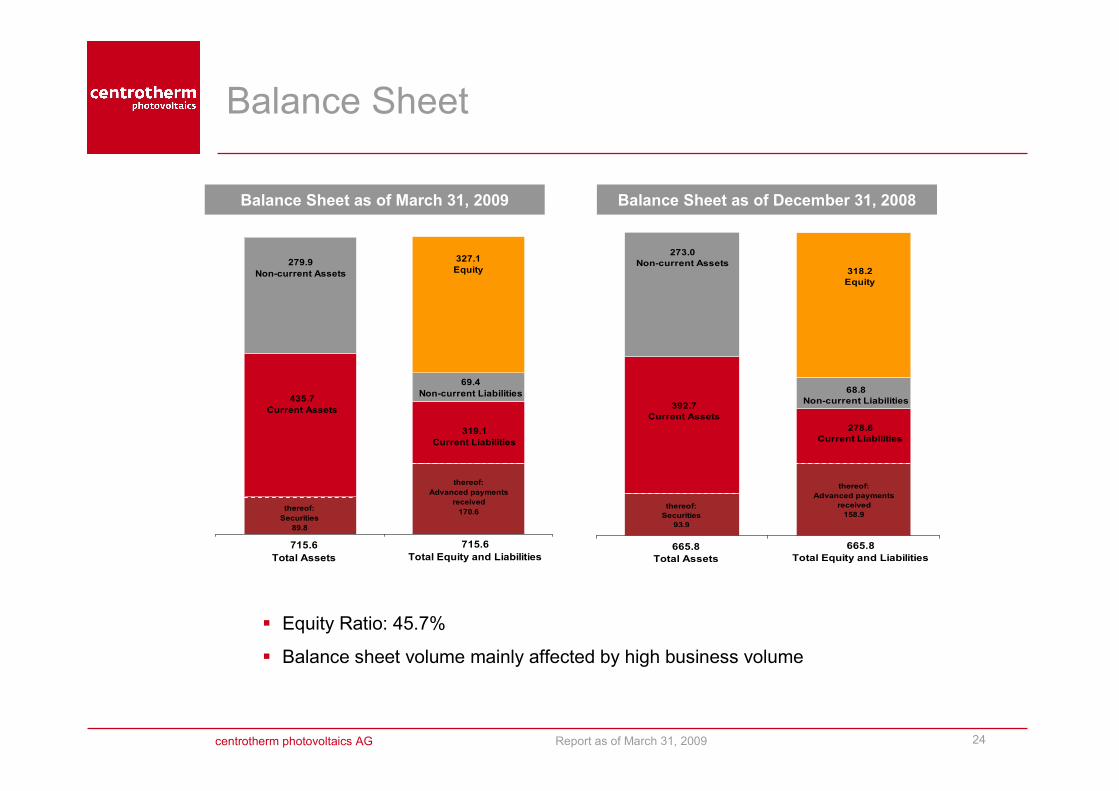
Balance Sheet
� Equity Ratio: 45.7%
� Balance sheet volume mainly affected by high business volume
715.6
Total Assets
715.6
Total Equity and Liabilities
279.9
Non-current Assets
thereof:
Securities
89.8
327.1
Equity
319.1
Current Liabilities
69.4
Non-current Liabilities435.7
Current Assets
thereof:
Advanced payments
received
170.6
Balance Sheet as of March 31, 2009 Balance Sheet as of December 31, 2008
665.8
Total Assets
665.8
Total Equity and Liabilities
273.0
Non-current Assets
thereof:
Securities
93.9
318.2
Equity
278.8
Current Liabilities
68.8
Non-current Liabilities392.7
Current Assets
thereof:
Advanced payments
received
158.9
centrotherm photovoltaics AG Report as of March 31, 2009 25
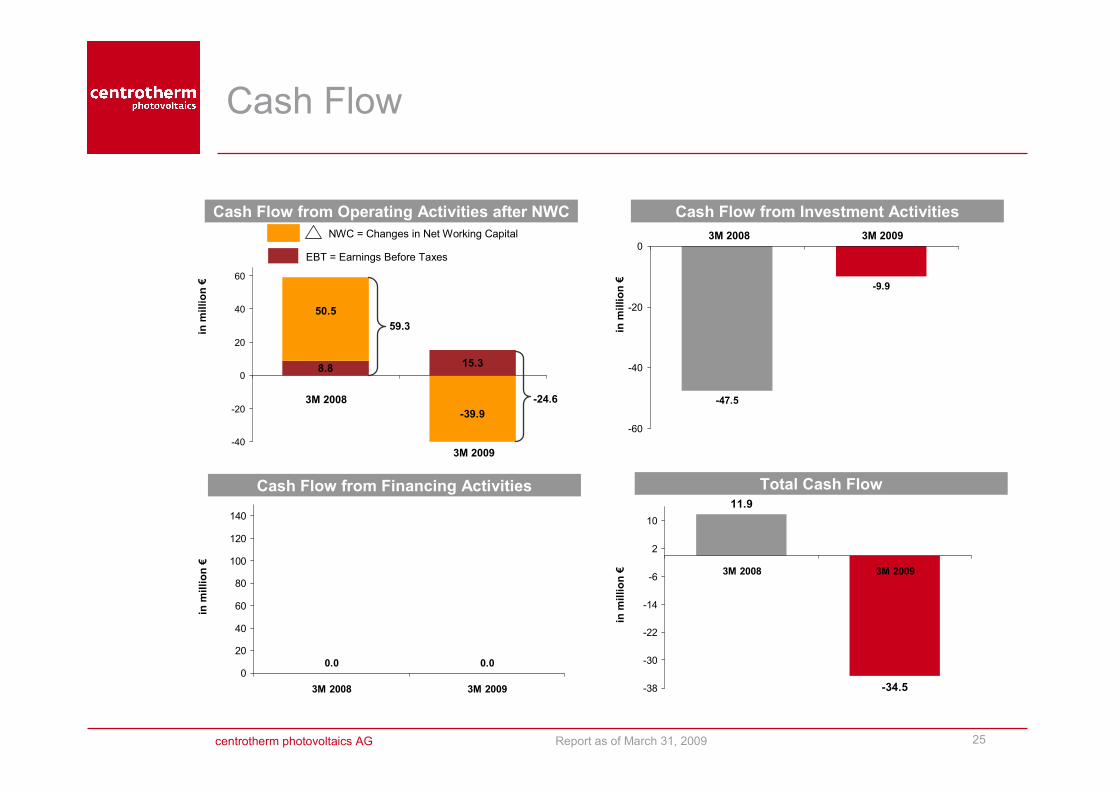
Cash Flow
8.815.3
-39.9
50.5
-40
-20
0
20
40
60
11.9
-34.5-38
-30
-22
-14
-6
2
10
3M 2008 3M 2009
Total Cash Flow
59.3
Cash Flow from Operating Activities after NWC
-24.6 -47.5
-9.9
-60
-40
-20
0
Cash Flow from Investment Activities
3M 2008
0.00.00
20
40
60
80
100
120
140
3M 2008 3M 2009
Cash Flow from Financing Activities
3M 2009NWC = Changes in Net Working Capital
EBT = Earnings Before Taxes
3M 2009
3M 2008
in m
illion €
in m
illion €
in m
illion €
in m
illion €
centrotherm photovoltaics AG Report as of March 31, 2009 26
Contents
1. Highlights
4. Financial Results
3. Research and Development
2. Market Development
5. Outlook
6. Appendix
centrotherm photovoltaics AG Report as of March 31, 2009 27
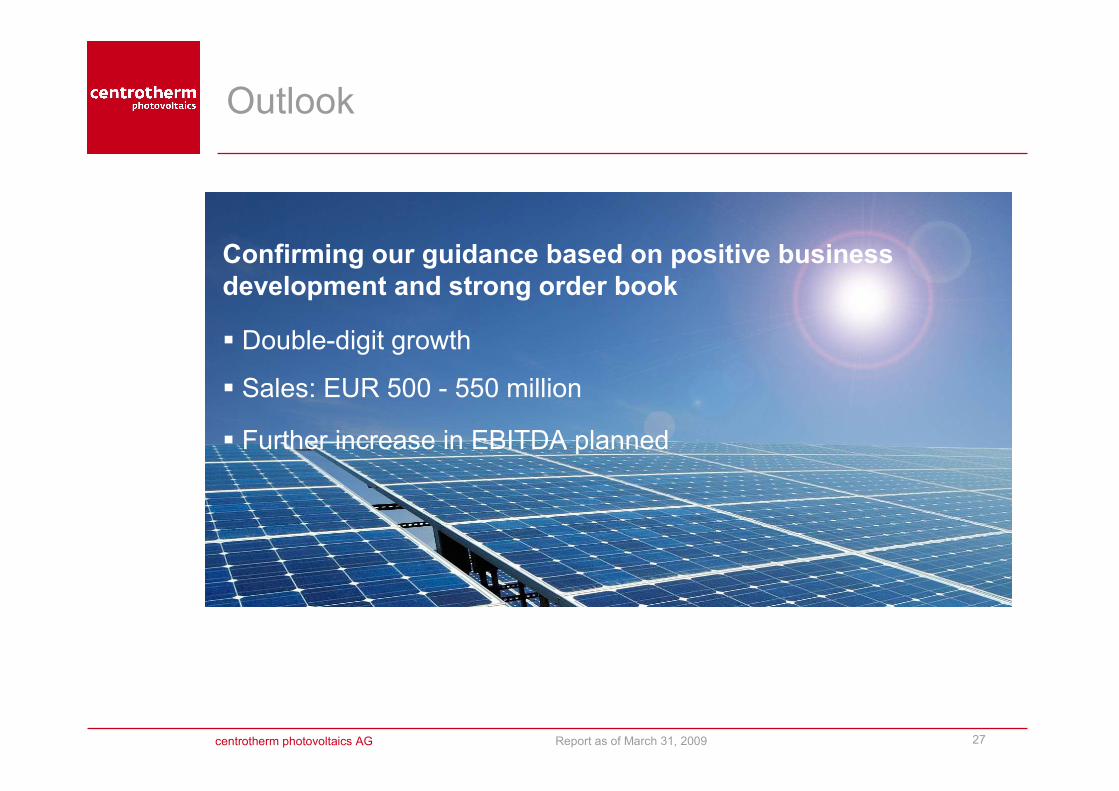
Outlook
Confirming our guidance based on positive business
development and strong order book
� Double-digit growth
� Sales: EUR 500 - 550 million
� Further increase in EBITDA planned
centrotherm photovoltaics AG Report as of March 31, 2009 28
Contents
1. Highlights 3M 2009
4. Financial Results
3. Research and Development
2. Market Development
5. Outlook
6. Appendix
centrotherm photovoltaics AG Report as of March 31, 2009 29
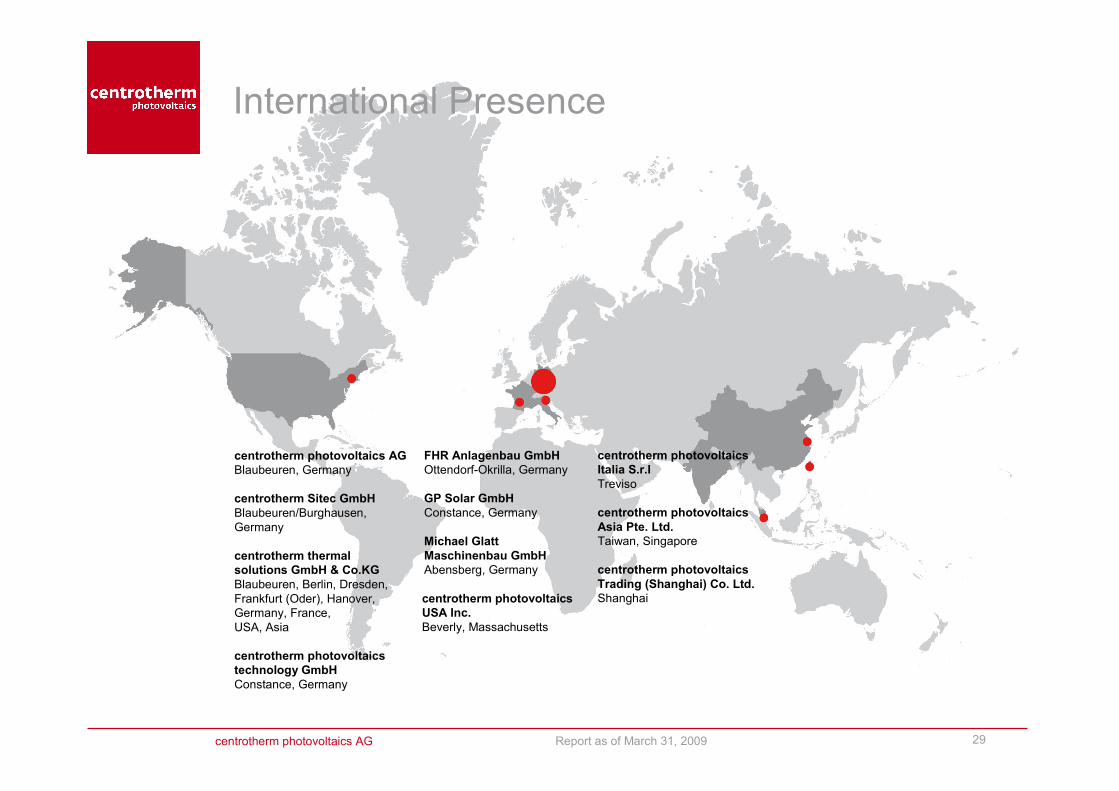
International Presence
centrotherm photovoltaics AG
Blaubeuren, Germany
centrotherm Sitec GmbH
Blaubeuren/Burghausen,
Germany
centrotherm thermal
solutions GmbH & Co.KG
Blaubeuren, Berlin, Dresden,
Frankfurt (Oder), Hanover,
Germany, France,
USA, Asia
centrotherm photovoltaics
technology GmbH
Constance, Germany
centrotherm photovoltaics
Italia S.r.I
Treviso
centrotherm photovoltaics
Asia Pte. Ltd.
Taiwan, Singapore
centrotherm photovoltaics
Trading (Shanghai) Co. Ltd.
Shanghai
FHR Anlagenbau GmbH
Ottendorf-Okrilla, Germany
GP Solar GmbH
Constance, Germany
Michael Glatt
Maschinenbau GmbH
Abensberg, Germany
centrotherm photovoltaics
USA Inc.
Beverly, Massachusetts
centrotherm photovoltaics AG Report as of March 31, 2009 30
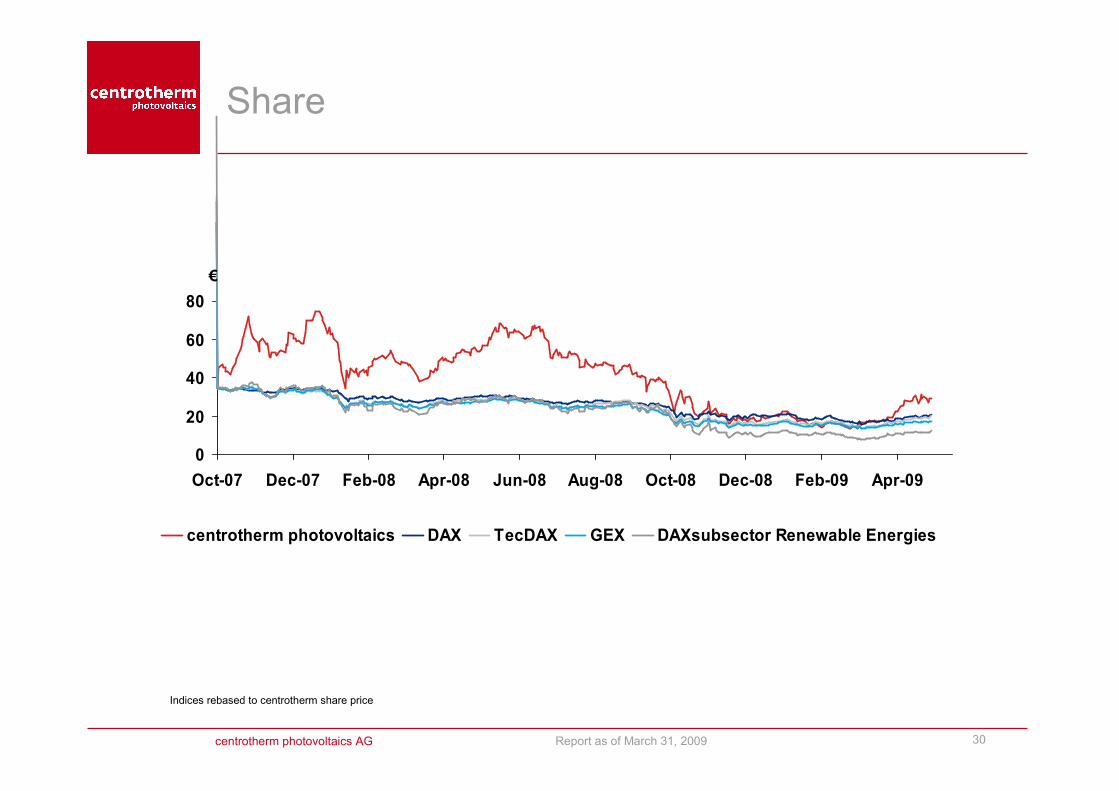
0
20
40
60
80
Oct-07 Dec-07 Feb-08 Apr-08 Jun-08 Aug-08 Oct-08 Dec-08 Feb-09 Apr-09
centrotherm photovoltaics DAX TecDAX GEX DAXsubsector Renewable Energies
Share
Indices rebased to centrotherm share price
€
centrotherm photovoltaics AG Report as of March 31, 2009 31
Financial Calendar 2009
� June 30, 2009:
Annual General Meeting
� August 13, 2009:
Publication of interim report as of June 30, 2009
� November 11, 2009:
Publication of interim report as of September 30, 2009
centrotherm photovoltaics AG Report as of March 31, 2009 32
Contact
centrotherm - empowering photovoltaics
Contact: Saskia Schultz-Ebert
Investor Relations
centrotherm photovoltaics AG
Johannes-Schmid-Strasse 8
89143 Blaubeuren
Tel +49 (0)7344 9188-890
Fax +49 (0)7344 9189-389