Embed Size (px)
Citation preview

REPORT AND ACCOUNTS
2007
THE YEAR AT A GLANCE AND FIVE YEAR SUMMARY 1
DIRECTORS AND ADVISORS 2
COMPANY OVERVIEW 3
CHAIRMAN’S STATEMENT 4
BUSINESS REVIEW 5
REPORT OF THE DIRECTORS 8
DIRECTORS' REMUNERATION REPORT 10
CORPORATE GOVERNANCE 13
REPORT OF THE INDEPENDENT AUDITORS 15
GROUP INCOME STATEMENT 16
GROUP BALANCE SHEET 17
CASH FLOW STATEMENTS 18
GROUP STATEMENT OF CHANGES IN EQUITY 19
COMPANY BALANCE SHEET 20
COMPANY STATEMENT OF CHANGES IN EQUITY 21
NOTES TO THE FINANCIAL STATEMENTS 22
NOTICE OF ANNUAL GENERAL MEETING 40
SHAREHOLDER INFORMATION inside back page
Contents
1
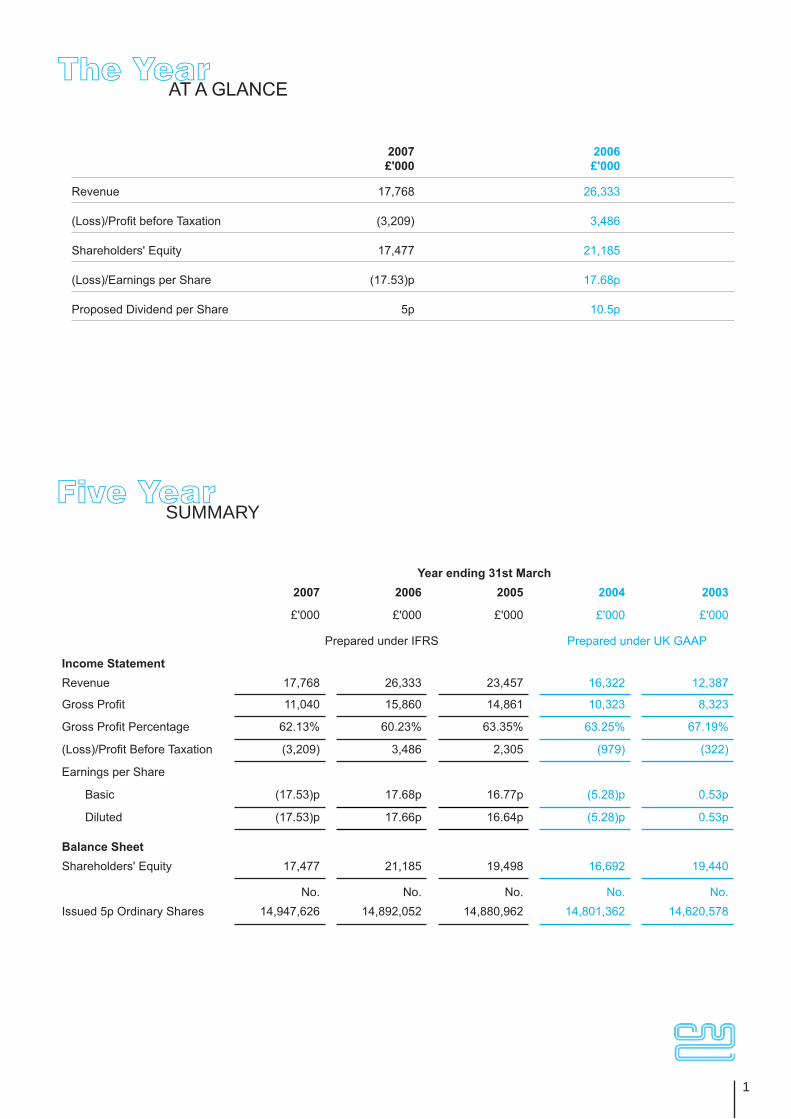
2007 2006 £'000 £'000
Revenue 17,768 26,333
(Loss)/Profi t before Taxation (3,209) 3,486
Shareholders' Equity 17,477 21,185
(Loss)/Earnings per Share (17.53)p 17.68p
Proposed Dividend per Share 5p 10.5p
Year ending 31st March2007 2006 2005 2004 2003
£'000 £'000 £'000 £'000 £'000
Prepared under IFRS Prepared under UK GAAP
Income StatementRevenue 17,768 26,333 23,457 16,322 12,387
Gross Profi t 11,040 15,860 14,861 10,323 8,323
Gross Profi t Percentage 62.13% 60.23% 63.35% 63.25% 67.19%
(Loss)/Profi t Before Taxation (3,209) 3,486 2,305 (979) (322)
Earnings per Share
Basic (17.53)p 17.68p 16.77p (5.28)p 0.53p
Diluted (17.53)p 17.66p 16.64p (5.28)p 0.53p
Balance SheetShareholders' Equity 17,477 21,185 19,498 16,692 19,440
No. No. No. No. No.Issued 5p Ordinary Shares 14,947,626 14,892,052 14,880,962 14,801,362 14,620,578
Five YearSUMMARY
The YearAT A GLANCE
2
George William Gurry Aged 75, is Group Executive Chairman. He is a founder of the Company.
Nigel Graham ClarkAged 53, joined the Group in August 1980. He was appointed Company Secretary in December 1983 and Group Financial Director in December 1985.
Christopher Arthur GurryAged 43, joined the Group in 1994. He was appointed to the board in April 2000 as Business Development Director.
George James BatesAged 60, joined the Group in November 1971. He was appointed Group Director of Engineering in May 1994. On 31st March 2006 he resigned as Group Director of Engineering but has continued in the capacity of a Non-Executive Director.
Ronald Jacob ShashouaAged 73, joined the Group as a Non-Executive Director in June 1996. Formerly of Casson Beckman, Chartered Accountants, Mr Shashoua was a corporate fi nance specialist partner and also held a number of management positions within the partnership, including Chief Executive.
Registered Offi ce Oval ParkLangfordMaldonEssex CM9 6WG
Registrars and Transfer Offi ce Lloyds TSB Registrars The Causeway Worthing West Sussex BN99 6DA
AuditorsBaker Tilly UK Audit LLP Chartered Accountants2 Bloomsbury StreetLondon WC1B 3ST
StockbrokersPanmure Gordon & CoMoorgate Hall155, Moorgate London EC2M 6XB
Solicitors Kidd Rapinet14 & 15 Craven StreetLondon WC2N 5AD
Womble Carlyle Sandridge & Rice 200 West Second Street Winston-Salem North Carolina USA
Financial Public Relations Parkgreen Communications Ltd. Pegasus House37-43 Sackville StreetLondon W1S 3EH
Bankers Barclays Bank Plc9 High StreetColchesterEssex CO1 1DD
DirectorsAND ADVISORS
3
CompanyOVERVIEW
IntroductionCML Microsystems Plc (CML) was founded in 1968 in the United Kingdom (as Consumer Microcircuits Limited). Today, through eight operating subsidiaries located in the UK, the United States, Germany, Singapore and Taiwan, the Group designs, manufactures and markets a range of integrated circuits (ICs) for global industrial, professional and consumer applications within wireless communication, wireline communication, storage and networking market areas.Headquartered in Essex, UK, CML employs over 200 people worldwide. The Company operates a ‘fabless’ semiconductor model (outsources silicon wafer fabrication) and performs IC assembly and test functions at facilities in the UK and through subcontractors around the globe.CML operates sales and technical support offi ces in Essex (UK), Konstanz (Germany), North Carolina (USA), Singapore, Taipei, and Shanghai and is supported by a global network of distributors and manufacturer's representatives. Long recognised as an innovator in IC products, CML has achieved a leading position in mixed-signal (combined analog and digital) circuit design and supply to many major electronic equipment manufacturers across the globe. Originating from the development of high-performance ICs during the 1970’s and 80’s, the Group has signifi cant experience in delivering ICs for applications that demand world-class quality, performance, extended battery life and integration-levels. The Group maintains and enhances its market position by delivering an array of products that are often designed in conjunction with customers' specifi cations and/or complex international standards.
StrategyHistorically, CML has carved out a profi table niche in global markets dominated by large corporations by pursuing a simple and consistent niche strategy; to deliver a solution rather than merely a component product to the customer; and to concentrate on markets that have signifi cant expertise barriers to entry and limited economic appeal to larger competitors. More recently, the acquisition of German fabless IC company, Hyperstone GmbH, has seen this strategy evolve further to include consumer and industrial markets with increased global competition - but the key strategy remains.Group semiconductor products focus on four main segments of the global semiconductor market:
WirelessICs covering voice, data, signalling and radio frequency (RF) requirements within historic and emerging markets for professional radio (PMR/LMR), marine radio, leisure radio, paging and voice security.
Wireline TelecomVoice, data and signalling ICs predominantly for ‘wired’ telephony applications and ‘gateway’ applications where traditional telephony infrastructure converges with digital and wireless applications.
StorageFlash controller IC’s for use within consumer memory cards (CF, SD, miniSD, microSD, MMC, RSMMC, MicroMMC) and industrial storage products such as solid state drives (SSDs).
NetworkingProprietary RISC/DSP System on Chip (SoC) processor IC’s for industrial networking/automation (Ethernet communications), security (IP-cameras, digital video recorders for CCTV) and biometrics (fi ngerprint recognition, access control / time and attendance logging) applications.
The Group’s wide-ranging design skills, diversifi ed technology portfolio and system-level understanding, coupled with market leading product functionality and an extensive selling network are key factors in the Group’s future success.
•
•
•
•
4
IntroductionAs foreshadowed when reporting on the interim results and the outlook for the second half, the results for the full year ended 31 March 2007 refl ect the material losses posted for each of the six month trading periods.
The losses at the operating level were much as had been forecast internally, and arising from the product introduction delays and lost customer issues referred to in my interim statement, but the overall reported loss is increased under the new accounting and reporting standards. Notwithstanding that, the loss is broadly in line with market expectations for the year.
ResultsGroup revenues amounted to £17.77m (2006: £26.33m) for the year, the decline attributable largely to the serious reduction in product shipments to a key customer within the consumer storage market area.
A loss before taxation of £3.21m (2006: Profi t before taxation £3.49m) was recorded although it can be noted that a weaker dollar along with amortisation and pensions adjustments were signifi cant contributing factors.
The posted loss per share of 17.53p was better than market expectations although down on the prior year (2006: earnings per share 17.68p).
Cash fl ow was negative during the year and cash balances reduced by £2.7m following a £3.2m loss before taxation and the payment of a £1.6m dividend.
DividendYour directors have considered the material loss and negative cash fl ow recorded for the year just ended, and the pressure that has been placed on cash reserves and working capital, and they believe it is appropriate to ensure that resources should be prioritised towards ensuring a return to profi tability for your Company.
The Board has confi dence that your Company can achieve its planned progress in this current year, and is recommending payment of a dividend of 5p per ordinary share (2006: 10.5p per ordinary share) to be payable on 3 August 2007 to shareholders registered on 6 July 2007.
ProspectsThe opening months of the current year are generally on or slightly ahead of operating targets, although fi rm progress will most likely not become evident before the second half.
Action to address the product availability delays of last year will only begin to bite in coming months.
I am disappointed with the full year results but encouraged that steps to tackle issues under management control will bear effect. I am confi dent, subject to unforeseen circumstances, in expecting a fi rm improvement in performance for this current year, including clear visibility of the point when the Group will return to profi tability.
The progress of any business is always dependent on the quality and dedication of the people it employs. I am confi dent that our employees are motivated towards the success of the Group and its return to profi t and the Board wish to thank the employees worldwide for their dedication and support through the year.
G. W. Gurry
Chairman
Chairman'sSTATEMENT
5
IntroductionThis year can be characterised by good progress with a number of the Company’s growth plans, coupled with certain disappointments that signifi cantly impacted fi nancial improvement over the prior year.
On a market segmental basis, performance during the year was mixed:
WirelessA signifi cant reduction in revenues from products shipped into the very low cost analogue leisure radio market was partially countered by growth in application areas for voice privacy and digital radio markets. The Company benefi ted from historic investments in this area and voice privacy IC shipments for military digital radios along with revenues from wireless data IC’s for telemetry systems exceeded those that were planned.
Revenues from shipments to professional analogue radio manufacturers continued to grow and steady progress with customer design-in activity occurred. It is noteworthy that growth continued in this historic analogue segment alongside that seen within the newer digital radio markets where the Company is also well placed and has been active for some years.
Adoption of products based upon the Company’s proprietary FirmASIC technology was encouraging and production volumes began shipping towards the year-end. Time-to-market with products based upon this technology improved noticeably.
Wireline TelecomFar-East data modem IC stocking issues were cleared and revenue levels moved ahead as expected. Shipments of products to manufacturers within the wireless local loop / fi xed wireless terminal markets were particularly pleasing, despite pricing pressure. It should be noted that business levels with certain customers within this market sub-segment continue to exhibit uncertainty due to the bid and tender process that is a pre-requisite to any signifi cant contract awards.
As noted at the interim period, the Company achieved good progress with its strategy of expanding product integration, reducing time to market and improving commercial competitiveness.
StorageIn the consumer storage area, revenues were impacted by the decision of the single largest Group customer to exit the fl ash memory card market. This situation was unexpected as we began the year, and occurred whilst the customer base in the storage segment was relatively low, and during a period where these customers were in the process of designing-in Group products or in the early production phase.
This event was unfortunate but has to be considered along with the fact that the Company intends to become a major player in certain sub-sectors of the storage market, and volatility can be experienced during the early stages of the growth phase whilst customer concentration is high.
Outside of the consumer memory card markets, progress was on track and penetration of the customer base for solid-state drives (SSD) was signifi cant. SSD storage devices offer a number of benefi ts over magnetic media for certain applications such as faster access times, lower current consumption, higher operating temperatures and improved reliability. The Company has extensive experience, a strong patent and technology portfolio and world-class products in this area that all contributed to a noteworthy revenue increase during the year.
BusinessREVIEW

6
NetworkingShipments of ICs into networking applications fell slightly year on year. This is an area where R&D investment has been substantial and the reduction in revenues masked the underlying progress that was made and refl ected the typical delay from new product introduction through to customer volume production phase. Revenues from older, less integrated products fell whilst shipments of newer technology ICs released to production at the beginning of the year began to increase as the year-end approached. Investment in the development of support tools for these new ICs along with reference designs for target market applications continued.
In a year where revenues have reduced dramatically as a direct result of unexpected issues associated with a single customer, it is appropriate to reiterate that during the year the Group had no single customer who represented more than ten percent of Group revenues and only one customer who represented more than fi ve percent of Group revenues.
MarginsGross margins within the Group's historical markets of wireline telecom and wireless were held at previous year levels and, with the reduction in revenues experienced within the storage market, the overall gross profi t margin improved slightly to 62% (2006 - 60%). Product delays within consumer storage application areas contributed to increased pricing pressure towards the year-end.
OverheadsDuring the year, the majority of customer transactions were in US dollars. The Group had a partial natural hedge due to signifi cant raw material purchases being made in US dollars and no further hedging arrangements were entered into. The weakening of the US dollar had an adverse effect on profi ts.
Tight control over the overheads was maintained whilst having appropriate regard for the growth objectives of the business. Despite the increased control measures, overheads increased and the main contributors to that were accounting for pensions under IAS 19, the effects of amortisation and the weakening of the US dollar.
PensionsOver the last few years the Board, in conjunction with the pension schemes trustees and actuary, have been working to reduce the scheme defi cit in the Group's defi ned benefi t pension scheme and various measures have been put in place with this objective in mind. These measures are agreed with the scheme actuary who conducts a triennial valuation, as required by law. In addition, the Group has to comply with IAS 19 for the accounting of this liability in the consolidated fi nancial statements. In arriving at the effect of IAS 19 for retirement benefi t obligations on the income statement, the scheme actuary calculates the movements in the scheme defi cit. It is not practical for the Company to calculate this and then estimate the effect on internal forecasts, so any non-recurring charge has the potential to alter results unexpectedly.
During the year, a new set of pension commutation factors were introduced which had the effect of increasing the past service liabilities of the scheme. This charge amounted to £587k (2006 – £nil) and has been confi rmed as a one off cost. The net of the current years service costs and the past service costs are added to the administration cost and this resulted in a charge for the year of £993k (2006 - £380k) refl ecting a year-on-year negative variance of £613k. The fi nancial income or cost is adjusted in a similar manner and this year’s income amounted to £227k (2006 – cost of £20k) posting a positive comparative variance of £247k.
The net effect of IAS 19 on the income statement was to increase the loss before taxation by £766k (2006 - decrease profi t before tax by £400k). A further actuarial gain was recorded of £1,063k (2006 - £222k) and this is posted through the statement of recognised income and expenditure resulting in a scheme defi cit, before any deferred tax adjustment, of £2,289k (2006 - £3,135k).
BusinessREVIEWcontinued

7
Taxation
The low taxation credit within the income statement refl ects the large adjustment to the taxation charge on the subsidiary Hyperstone GmbH. This followed a revised determination by the German tax authority following a tax inspection that took place on one of the previous owners. The basis on which certain allowances were claimed in prior years was disallowed and resulted in a further amount of £450k becoming payable. The whole of this amount was charged to tax during the year.
PropertyIn addition to property from which operating subsidiaries trade, the Group owns a number of investment properties that are stated within the balance sheet at market value. The remaining property is stated at historical cost. The Board is mindful of the signifi cant value held in property within the balance sheet and accordingly took moves during the year to ensure this area of the business provides a better return for shareholders. The long leasehold premises at Fareham, Hampshire which was previously held as an investment property was placed on the market for sale prior to the year end and an investigation commenced into the possibility of increased development of the Group headquarters site in Essex.
Development costsSteady new product progress was made in the wireless and wireline telecom markets with eight new products being launched during the year. Development of the networking and storage solutions products fell signifi cantly behind schedule, as reported at the interim stage. Overall spend on development was slightly down on the previous year at £4.704m (2006 - £5.063m). The effects of adopting IAS 38, as opposed to following historical policies under UK GAAP where all development expenditure was written off during the year incurred, resulted in a small negative effect on the income statement of approximately £85k.
Working capital and cash fl owWith a signifi cant reduction in revenues becoming apparent during the year, and in keeping with management objectives, inventory levels reduced signifi cantly and tight fi nancial control was exercised over cash fl ow. The resulting effect was that cash balances reduced by £2.7m following a £3.2m loss and the payment of a £1.6m dividend.
BusinessREVIEWcontinued
8
The directors submit their Report and Group fi nancial statements for the year ended 31st March 2007.Statement of Directors’ Responsibilities in respect of the Financial StatementsThe directors are responsible for preparing the Annual Report and the fi nancial statements in accordance with applicable law and regulations.UK company law requires the directors to prepare Group and Company Financial Statements for each fi nancial year. Under that law the directors are required to prepare Group fi nancial statements in accordance with International Financial Reporting Standards ("IFRS") adopted by the EU and have also elected to prepare the Company fi nancial statements in accordance with IFRS adopted by the EU. These fi nancial statements are required to present fairly the fi nancial position and performance of the group; the Companies Act 1985 provides in relation to such fi nancial statements that references in the relevant part of that Act to fi nancial statements giving a true and fair view are references to their achieving a fair presentation.
The Company fi nancial statements are required by law to give a true and fair view of the state of affairs of the company.In preparing each of the group and company fi nancial statements, the directors are required to:a. select suitable accounting policies and then apply them consistently:b. make judgements and estimates that are reasonable and prudent;c. for the group and company statements, state whether they have been prepared in accordance with IFRS adopted
by the EU;d. prepare the fi nancial statements on the going concern basis unless it is inappropriate to presume that the group
and the company will continue in business.The directors are responsible for keeping proper accounting records which disclose with reasonable accuracy at any time the fi nancial position of the company and to enable them to ensure that the fi nancial statements comply with the requirements of the Companies Act 1985.They are also responsible for safeguarding the assets of the group and hence for taking reasonable steps for the prevention and detection of fraud and other irregularities.Principal ActivitiesThe Group designs, manufactures and markets a range of electronic products for use in communications industries.Business Review and Future DevelopmentsThe Chairman's Statement on page 4 and Business Review on pages 5 to 7 give a detailed review of the business of the Group along with the development and performance of the business during the year and the position at the year end. A range of performance measures to monitor and manage the businesses are used some of which are considered key performance indicators (KPIs). These KPIs include revenue, gross profi t and operating profi t.Principal Risks and UncertaintiesThe principal risks and uncertainties facing the Group are with foreign currencies and customer dependency. With the majority of the Group's earnings being linked to the US Dollar a decline in this currency will have a direct effect on revenue, although since the majority of the cost of sales are also linked to the US Dollar, this risk is reduced at the gross profi t line. Additionally, though the Group has a very diverse customer base in certain market segments, key customers can represent a signifi cant amount of revenue. Key customer relationships are closely monitored, however changes in buying patterns of a key customer could have an adverse effect on the Group's performance.
ResultsThe results for the year are set out in the Group income statement on page 16. The Group's pre-tax loss was £3,209,224 (2006 - profi t £3,485,861) and the loss attributable to ordinary shareholders was £2,618,419 (2006 - profi t £2,632,529).DividendsThe directors propose a dividend of £747,381 for the year (2006 - £1,563,665) payable on 3rd August 2007. This is equivalent to 5p per 5p Ordinary share (2006 - 10.5p per 5p Ordinary share).Research and DevelopmentThe Group actively reviews developments in its markets with a view to taking advantage of the opportunities available to maintain and improve its competitive position.Substantial ShareholdingsOther than the directors’ interests shown on page 9, the Company has been advised of the following substantial holdings as at 8th June 2007:Liontrust Asset Management Plc 17.13%Advance Aim Value Realisation Company Limited 6.69%M & G Investment Management Ltd. 5.35%Legal and General 4.18%Universities Superannuation Scheme Ltd. 3.48%Payment of PayablesIt is the Company’s policy to negotiate payment terms with its suppliers in all sectors and to ensure that they know the terms on which payment will take place when the business is agreed. It is our policy to abide by these terms. The Company has no trade payables outstanding at the end of the fi nancial year and therefore the Company's practice in respect of the year with regard to its payment of creditors, as defi ned by the Companies Act 1985, has been zero days.
ReportOF THE DIRECTORS

9
Directors and their InterestsThe directors of the Company at 31st March 2007, all of whom have served throughout the year unless otherwise stated, together with their interests in the shares of the Company were: Ordinary Shares of 5p each 31st March 2007 1st April 2006
G.W. Gurry 4,389,262 4,389,262 N.G. Clark 123,571 120,726 G.J. Bates 44,409 44,409C.A. Gurry 408,936 405,061R.J. Shashoua 83,755 83,635
The above interests in the ordinary share capital of the Company are beneficial other than Mr G. W. Gurry's holding which includes 1,700,000 (2006 - 1,700,000) shares held by him as trustee in a non-benefi cial capacity. Details of the directors' interests in options granted over ordinary shares are disclosed in the Directors' Remuneration Report. There have been no changes in the directors' interests in shares or share options between 1st April 2007 and 8th June 2007.There are no contracts of signifi cance in which the directors have an interest.
Annual General MeetingThe notice of the Annual General Meeting sets forth resolutions for the customary Ordinary Business and also Special Business comprising two Special Resolutions relating to the following matters:
Special Resolutions1. To renew the authority to the Company to make market purchases of its own shares.
2. To disapply the pre-emption provisions of Section 89(1) of the Companies Act 1985 for a maximum of 15 months up to an aggregate nominal amount of £35,750.
Disabled EmployeesThe Company makes every reasonable effort to ensure that disabled employees receive equal opportunities and are not discriminated against on the grounds of their disability.
Employee InvolvementThe Company encourages employees to participate directly in the success of the business through a free fl ow of information and ideas.
Statement as to Disclosure of Information to AuditorsThe directors who were in offi ce on the date of approval of these fi nancial statements have confi rmed that, as far as they are aware, there is no relevant audit information of which the auditors are unaware. Each of the directors have confi rmed that they have taken all the steps that they ought to have taken as directors in order to make themselves aware of any relevant audit information and to establish that it has been communicated to the auditor.
AuditorsThe directors, having been notifi ed of the cessation of the partnership known as Baker Tilly, resolved that Baker Tilly UK Audit LLP be appointed as successor auditor with effect from 1st April 2007, in accordance with the provisions of the Companies Act 1989, s26(5). Baker Tilly UK Audit LLP has indicated its willingness to continue in offi ce.A resolution to re-appoint Baker Tilly UK Audit LLP as auditors of the Company will be put to the members at the Annual General Meeting.
By order of the BoardN.G. ClarkCompany Secretary; 18th June 2007
ReportOF THE DIRECTORScontinued
10
Directors'REMUNERATION REPORT
IntroductionThis report has been prepared in accordance with Schedule 7a of the Companies Act 1985 which introduced new statutory requirements for the disclosure of directors' remuneration in respect of periods ending on or after 31st December 2002.As required a resolution to approve the Directors' Remuneration Report will be proposed at the forthcoming Annual General Meeting of the Company at which the fi nancial statements will be approved. The vote will have advisory status, will be in respect of the remuneration policy and overall remuneration packages and will not be specifi c to individual levels of remuneration.
Remuneration CommitteeThe Board has established a Remuneration Committee comprising G. W. Gurry and N. G. Clark.
Executive Remuneration PolicyThe Group aims to ensure that the executive remuneration arrangements are in line with the Group's overall practice on pay and benefi ts and having regard to the size and nature of the business, are competitive and designed to attract, retain and motivate executive directors of high calibre.
Basic Annual Salary
The basic salary of each director is determined by taking into account the director's experience, responsibility, value to the organisation and mutual value. In deciding appropriate levels, the Committee takes account of information from various sources, both internal and external, to ensure that the level of basic salary is appropriate.
Annual BonusThe Committee establishes the objectives for each fi nancial year where a cash bonus might be paid. The Committee believes that any incentive should be tied to the overall profi tability and progress of the Group. No bonus payments were made during the year.
Long Term Incentive PlansThe Company has no long term incentive plans for executive directors.
Benefi ts in KindThe executive directors receive certain benefi ts in kind, principally a car and private medical insurance.
Pension ArrangementsAll executive directors except G. W. Gurry are members of the Company's defi ned benefi t pension scheme. The Company's contribution to the scheme is 12.1% of salary for all members. Life insurance cover and widows death in service cover is provided under the scheme. Company contributions of £15,000 (2006 - £11,000) were made towards the money purchase pension scheme during the year.
Share OptionsNo separate share option scheme exists purely for executive directors and they therefore only participate in share option plans that are eligible to all employees. The Committee believes that share option schemes for all employees maximise shareholder value over time and therefore no specifi c performance conditions attach to the number of options granted to executive directors on an individual basis.
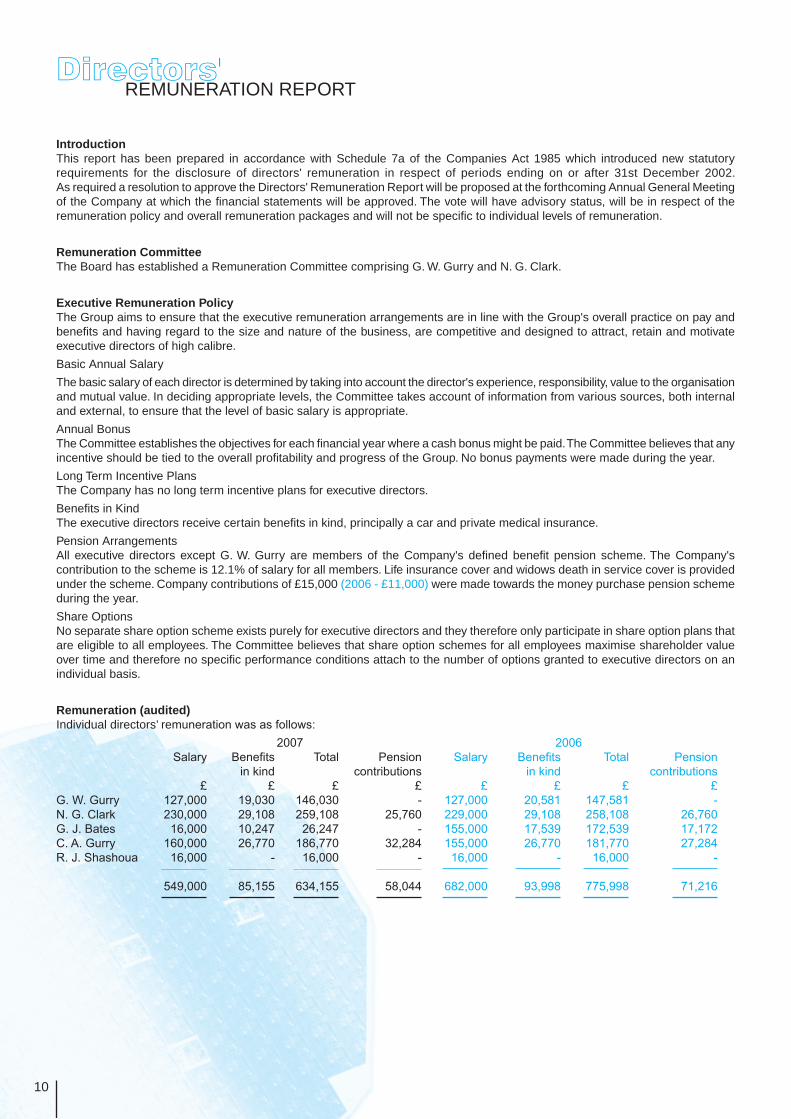
Remuneration (audited)Individual directors’ remuneration was as follows:
2007 2006 Salary Benefi ts Total Pension Salary Benefi ts Total Pension in kind contributions in kind contributions £ £ £ £ £ £ £ £
G. W. Gurry 127,000 19,030 146,030 - 127,000 20,581 147,581 -N. G. Clark 230,000 29,108 259,108 25,760 229,000 29,108 258,108 26,760G. J. Bates 16,000 10,247 26,247 - 155,000 17,539 172,539 17,172C. A. Gurry 160,000 26,770 186,770 32,284 155,000 26,770 181,770 27,284R. J. Shashoua 16,000 - 16,000 - 16,000 - 16,000 -
549,000 85,155 634,155 58,044 682,000 93,998 775,998 71,216
11
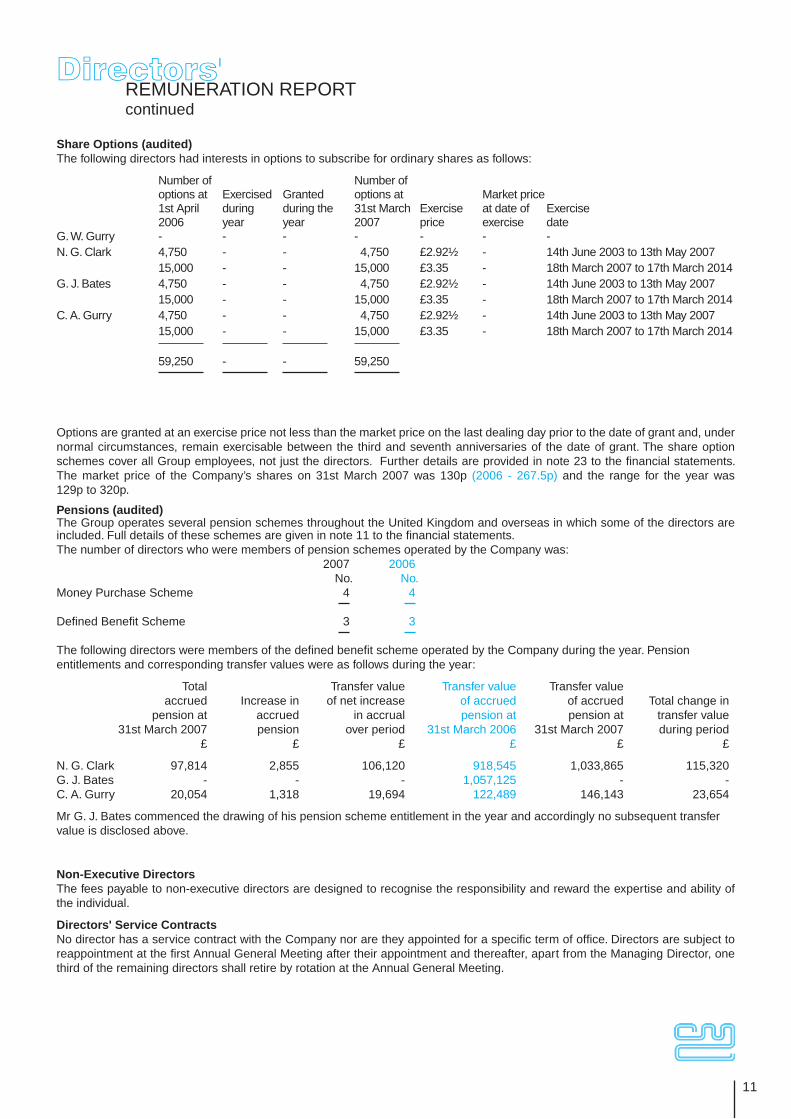
Options are granted at an exercise price not less than the market price on the last dealing day prior to the date of grant and, under normal circumstances, remain exercisable between the third and seventh anniversaries of the date of grant. The share option schemes cover all Group employees, not just the directors. Further details are provided in note 23 to the fi nancial statements.The market price of the Company’s shares on 31st March 2007 was 130p (2006 - 267.5p) and the range for the year was 129p to 320p.
Pensions (audited)The Group operates several pension schemes throughout the United Kingdom and overseas in which some of the directors are included. Full details of these schemes are given in note 11 to the fi nancial statements. The number of directors who were members of pension schemes operated by the Company was: 2007 2006 No. No.Money Purchase Scheme 4 4
Defi ned Benefi t Scheme 3 3
The following directors were members of the defi ned benefi t scheme operated by the Company during the year. Pension entitlements and corresponding transfer values were as follows during the year:
Total Transfer value Transfer value Transfer value accrued Increase in of net increase of accrued of accrued Total change in pension at accrued in accrual pension at pension at transfer value 31st March 2007 pension over period 31st March 2006 31st March 2007 during period £ £ £ £ £ £
N. G. Clark 97,814 2,855 106,120 918,545 1,033,865 115,320G. J. Bates - - - 1,057,125 - -C. A. Gurry 20,054 1,318 19,694 122,489 146,143 23,654
Mr G. J. Bates commenced the drawing of his pension scheme entitlement in the year and accordingly no subsequent transfer value is disclosed above.
Non-Executive DirectorsThe fees payable to non-executive directors are designed to recognise the responsibility and reward the expertise and ability of the individual.
Directors' Service ContractsNo director has a service contract with the Company nor are they appointed for a specifi c term of offi ce. Directors are subject to reappointment at the fi rst Annual General Meeting after their appointment and thereafter, apart from the Managing Director, one third of the remaining directors shall retire by rotation at the Annual General Meeting.
Share Options (audited)The following directors had interests in options to subscribe for ordinary shares as follows:
Number of Number of options at Exercised Granted options at Market price 1st April during during the 31st March Exercise at date of Exercise 2006 year year 2007 price exercise date G. W. Gurry - - - - - - -N. G. Clark 4,750 - - 4,750 £2.92½ - 14th June 2003 to 13th May 2007 15,000 - - 15,000 £3.35 - 18th March 2007 to 17th March 2014G. J. Bates 4,750 - - 4,750 £2.92½ - 14th June 2003 to 13th May 2007 15,000 - - 15,000 £3.35 - 18th March 2007 to 17th March 2014C. A. Gurry 4,750 - - 4,750 £2.92½ - 14th June 2003 to 13th May 2007 15,000 - - 15,000 £3.35 - 18th March 2007 to 17th March 2014
59,250 - - 59,250
Directors'REMUNERATION REPORTcontinued
12
On behalf of the Board of DirectorsN. G. ClarkDirector and Company Secretary18th June 2007
Directors'REMUNERATION REPORTcontinued
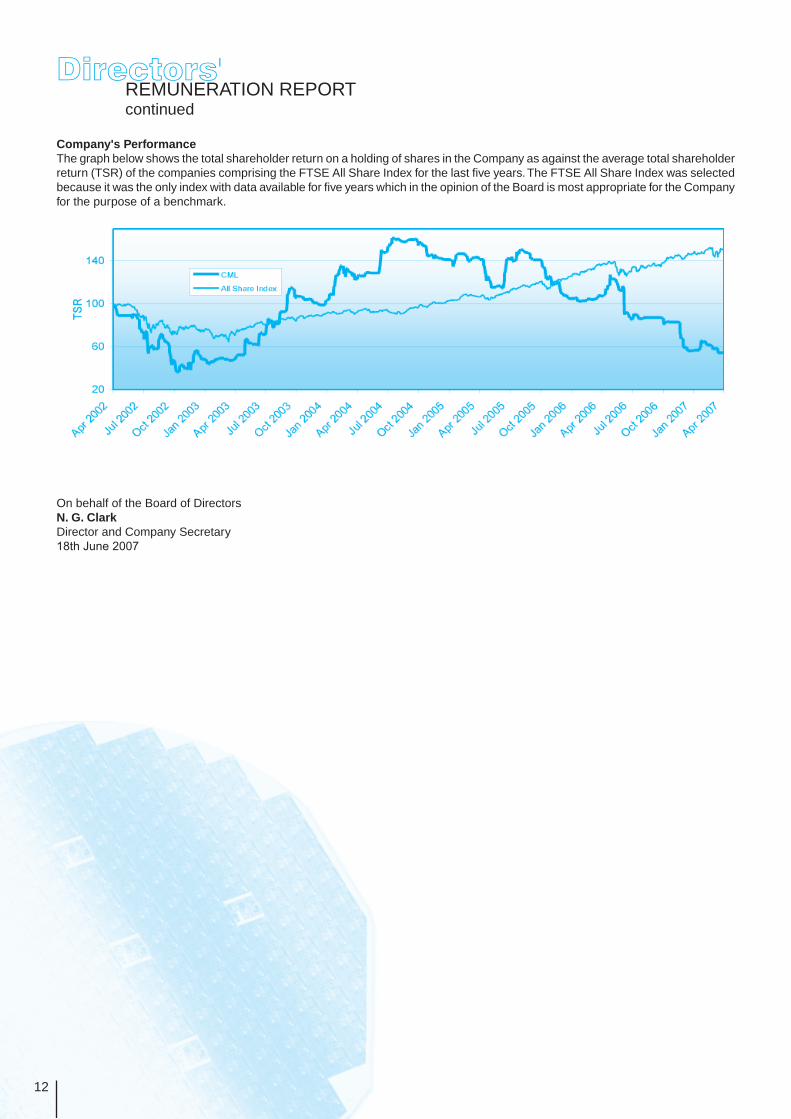
Company's PerformanceThe graph below shows the total shareholder return on a holding of shares in the Company as against the average total shareholder return (TSR) of the companies comprising the FTSE All Share Index for the last fi ve years. The FTSE All Share Index was selected because it was the only index with data available for fi ve years which in the opinion of the Board is most appropriate for the Company for the purpose of a benchmark.

13
Statement of the application of principles in the 2003 combined code (“The Code”)The Board recognises its responsibilities and the principles of good corporate governance and where appropriate it has sought to comply with "The Code" throughout the Group whilst having due regard to the fact that the company is classed as a “smaller company”. The Board confi rms that it has complied with the provisions of “The Code”, save as specifi ed below.
DirectorsThe Group is led and controlled by an effective Board which during the year comprised four executive directors and one independent non-executive director. With G. J. Bates moving to a non-executive director the Board now comprises 3 executive directors and two non-executive directors, one of whom is independent. Details of the directors can be found on page 2. Since the Board has only one independent non-executive director, formation of committees and procedures to fully comply with “The Code” has not been possible but matters which otherwise might have been delegated to sub-committees are instead considered by the whole Board.
The Group does not comply with Code Provision A.1.1 in that the Board does not have a formal schedule of matters specifi cally reserved for its decision due to the fact that the size of the Group and the close involvement by all the executive directors in all aspects of the business means this is not considered appropriate. The Group does not comply with Code Provision A.1.2 in that it has not set out the number of meetings of the Board and Remuneration Committee and the individual attendance by directors at such meetings due to the fact that the executive directors of the Board meet almost daily throughout the year on an informal basis and regularly on a formal basis. The non-executive directors attend when appropriate both the formal and informal meetings.
G. W. Gurry performs the role of both Chairman and Chief Executive and so the Group does not comply with Code Provision A.2.1 in that the same individual exercises the roles of Chairman and Chief Executive. The Board feels that due to the close involvement in all operational matters of the other executive directors, it ensures that there is an appropriate balance of power and authority.
The Group does not comply with Code Provision A.3.2 in that throughout the year the Board did not have at least two independent non-executive directors but believed that one non-executive director was appropriate bearing in mind the current size, nature and culture of the Group. The Group does not comply with Code Provision A.3.3 in that one of the non-executive directors has not been appointed as the senior independent director. R. J. Shashoua has been a non-executive director in excess of nine years. The Board considers that he remains independent because he holds a number of other independent consultancy positions.
The Group does not comply with Code Provision A.4.1 in that it does not have a nomination committee, which leads the process for Board appointments. The whole Board led by the Chief Executive considers any appointment. No appointments to the Board have been made during the year.
The Group does not think it necessary to comply with Code Provision A.5.2, which requires a formal agreed procedure for the directors to take independent professional advice at the company’s expense since all Board members have full access to the Group's advisors, and the Group's culture is to openly discuss any important issues.
The Group does not comply with Code Provision A.6.1 in that it does not consider it relevant to state in the annual report how performance evaluation of the Board, its committees and the individual directors has been conducted. The board as a whole monitors its performance by reference to the performance of the business against targets, expectations and its longer-term strategies.
The Group does not comply with Code Provision A.7.1 in that not all directors are subject to re-election every three years. It is considered adequate that one third of the Board on a rotating basis except for G. W. Gurry submit themselves for re-election at the Annual General Meeting each year.
RemunerationThe Remuneration Committee consists of the Chairman and Financial Director who are responsible for considering and approving terms of service, remuneration, bonuses, share options and other benefi ts of all directors. The Group does not comply with Code Provision B.1.1 in that there is no performance element in the remuneration package of the directors or comply with Code Provision B.2.1 in that there are no independent non-executive directors on the remuneration committee but consider that this does not affect the committee's ability having regard to the size and nature of the business and the importance of retaining and motivating management.
CorporateGOVERNANCE
14
Accountability and AuditIt is required by “The Code” that the Board, at least annually, conduct a review of the Group’s systems of internal controls and should report to the shareholders that they have done so. The Board recognises that the Group operates in highly competitive markets that can be affected by factors and events outside its control. Accordingly, a review of the material controls, including fi nancial, operational and compliance controls and risk management systems was undertaken during the year by the internal audit function. The Board, as a whole, reviews the results of the work carried out by the internal audit function and necesary actions are taken where needed. This review is not entirely in line with the guidance published by the Turnbull Committee and so the Group does not fully comply with Code Provisions C.2.1.
The Group does not comply with Code Provision C.3 in that it does not have an audit committee. The Board believes that it presents a balanced and understandable assessment of the Group’s position and prospects but due to the current size of the Group and the Board, it feels that an audit committee is inappropriate. The Financial Director is responsible for the appointment of the external auditors; reviewing the scope and results of the audit; its cost effectiveness; the independence and objectivity of the auditors and the supply of non-audit services. Additionally, the independent non-executive director carries out an independent review with the auditors.
Arrangements for staff to raise concerns about possible improprieties in matters of fi nancial reporting or other matters has been considered. However, the business has a culture of high integrity, open communication and direct access to senior management from all levels which provides an informal route for the notifi cation of such issues. Therefore a formal procedure is not considered necessary.
Relations with ShareholdersThe Finance Director and Business Development Director are the Group’s principal spokesmen with investors, fund managers, the press and other interested parties. They hold briefi ngs with Institutional Fund managers and analysts primarily following the announcement of Interim and Preliminary results. The Board also welcomes all shareholders at the Annual General Meeting where they are able to question the full Board and meet with them afterwards. Details of all briefi ngs and meetings are communicated to the full Board.
Going ConcernThe Directors have reasonable expectation that the Group and the Company have adequate resources to continue in operational existence for the foreseeable future. For this reason, they continue to adopt the going concern basis in preparing the fi nancial statements.
By order of the BoardN.G. ClarkCompany Secretary; 18th June 2007
CorporateGOVERNANCEcontinued
15
To the members of CML Microsystems PlcWe have audited the group and parent company fi nancial statements on pages 16 to 39. We have also audited the information in the Directors’ Remuneration Report that is described as having been audited. This report is made solely to the company’s members, as a body, in accordance with section 235 of the Companies Act 1985. Our audit work has been undertaken so that we might state to the company’s members those matters we are required to state to them in an auditor’s report and for no other purpose. To the fullest extent permitted by law, we do not accept or assume responsibility to anyone other than the company and the company’s members as a body, for our audit work, for this report, or for the opinions we have formed.
Respective responsibilities of directors and auditorsThe directors’ responsibilities for preparing the Annual Report, the Directors’ Remuneration Report and the fi nancial statements in accordance with applicable law and International Financial Reporting Standards (IFRSs) as adopted for use in the European Union are set out in the Statement of Directors’ Responsibilities. Our responsibility is to audit the fi nancial statements and the part of the Directors’ Remuneration Report to be audited in accordance with relevant legal and regulatory requirements and International Standards on Auditing (UK and Ireland). We report to you our opinion as to whether the fi nancial statements give a true and fair view and whether the fi nancial statements and the part of the Directors’ Remuneration Report to be audited have been properly prepared in accordance with the Companies Act 1985 and as regards to the Group fi nancial statements, Article 4 of the IAS Regulation and whether the information given in the Directors’ Report is consistent with the fi nancial statements.The information given in the Directors' Report includes that specifi c information presented in the Chairman's Statement and Business Review that is cross referenced from the Business Review section of the Directors' Report.We also report to you if, in our opinion, the company has not kept proper accounting records, if we have not received all the information and explanations we require for our audit, or if information specifi ed by law regarding directors’ remuneration and other transactions is not disclosed.We review whether the Corporate Governance Statement refl ects the company’s compliance with the nine provisions of the 2003 FRC Combined Code specifi ed for our review by the Listing Rules of the Financial Services Authority, and we report if it does not. We are not required to consider whether the board’s statements on internal control cover all risks and controls, or form an opinion on the effectiveness of the group’s corporate governance procedures or its risk and control procedures.We read other information contained in the Annual Report and consider whether it is consistent with the audited fi nancial statements. The other information comprises only the unaudited part of the Company Overview, the Business Review, the Report of the Directors, the Directors’ Remuneration Report, the Chairman’s Statement and the Corporate Governance Statement. We consider the implications for our report if we become aware of any apparent misstatements or material inconsistencies with the fi nancial statements. Our responsibilities do not extend to any other information.
Basis of audit opinionWe conducted our audit in accordance with International Standards on Auditing (UK and Ireland) issued by the Auditing Practices Board. An audit includes examination, on a test basis, of evidence relevant to the amounts and disclosures in the fi nancial statements and the part of the Directors’ Remuneration Report to be audited. It also includes an assessment of the signifi cant estimates and judgements made by the directors in the preparation of the fi nancial statements, and of whether the accounting policies are appropriate to the group’s and company’s circumstances, consistently applied and adequately disclosed.We planned and performed our audit so as to obtain all the information and explanations which we considered necessary in order to provide us with suffi cient evidence to give reasonable assurance that the fi nancial statements and the part of the Directors’ Remuneration Report to be audited are free from material misstatement, whether caused by fraud or other irregularity or error. In forming our opinion we also evaluated the overall adequacy of the presentation of information in the fi nancial statements and the part of the Directors’ Remuneration Report to be audited.
OpinionIn our opinion:
the group fi nancial statements give a true and fair view, in accordance with IFRSs as adopted by the European Union, of the state of the group’s affairs as at 31 March 2007 and of its loss for the year then ended;
the parent company fi nancial statements give a true and fair view, in accordance with IFRSs as adopted by the European Union as applied in accordance with the provisions of the Companies Act 1985, of the state of the parent company’s affairs as at 31 March 2007;
the fi nancial statements and the part of the Directors’ Remuneration Report to be audited have been properly prepared in accordance with the Companies Act 1985 and, as regards to the group fi nancial statements, Article 4 of the IAS Regulation; and
the information given in the Directors’ Report is consistent with the fi nancial statements.
BAKER TILLY UK AUDIT LLPRegistered AuditorChartered Accountants2 Bloomsbury StreetLondon WC1B 3ST
18th June 2007
•
•
•
•
ReportOF THE INDEPENDENT AUDITORS

16
Notes 2007 2006 £ £
Continuing operationsRevenue 3 17,768,437 26,332,610Cost of sales 4 (6,728,735) (10,472,523) Gross profi t 11,039,702 15,860,087
Distribution and administration costs 4 (14,985,049) (13,409,173) (3,945,347) 2,450,914 Other operating income 4 659,577 471,999 Operating (loss)/profi t before adjustments (3,285,770) 2,922,913
Share based payments 24 (76,102) (79,407) Operating (loss)/profi t after adjustments (3,361,872) 2,843,506
Revaluation of investment properties 12 - 695,000Finance costs 7 (228,062) (232,945)Finance income 7 380,710 180,300 (Loss)/profi t before taxation (3,209,224) 3,485,861
Income Tax 8 590,805 (853,332) (Loss)/profi t after taxation attributableto equity shareholders 10 (2,618,419) 2,632,529 (Loss)/earnings per shareBasic 10 (17.53)p 17.68p Diluted 10 (17.53)p 17.66p
Statement of Recognised Income and Expense £ £
(Loss)/profi t for the period (2,618,419) 2,632,529
Foreign exchange differences (346,011) 350,112Actuarial gain 11 1,063,000 222,000Income tax on actuarial gain 22 (318,900) (66,600)
Recognised losses and gains relating to the period (2,220,330) 3,138,041
GroupINCOME STATEMENTfor the year ended 31st March 2007

17
Notes 2007 2006 £ £ £ £
AssetsNon current assets Tangible assets - Property, plant and equipment 12 6,802,494 7,256,243Tangible assets - Investment property 12 2,245,000 3,845,000Intangible assets - Development costs 12 5,984,153 6,132,784Intangible assets - Goodwill on consolidation 12 3,512,305 3,512,305Deferred tax asset 22 1,716,935 1,164,870 20,260,887 21,911,202
Current assets Inventories 15 1,595,272 2,232,651 Trade receivables and prepayments 16 3,057,534 4,898,785Current tax assets 21 418,615 537,215Cash and cash equivalents 17 3,000,076 5,707,644 8,071,497 13,376,295Non current assets classifi edas held for sale - property 12 1,600,000 - 9,671,497 13,376,295 Total assets 29,932,384 35,287,497 Liabilities Current liabilities Bank loans and overdrafts 18 4,000,000 4,000,000Trade and other payables 20 2,247,879 3,297,053Current tax liabilities 21 761,027 365,124 7,008,906 7,662,177
Non current liabilities Deferred tax liabilities 22 3,127,996 3,158,575Provisions 25 29,864 147,234Retirement benefi t obligation 11 2,289,000 3,135,000 5,446,860 6,440,809 Total liabilities 12,455,766 14,102,986 Net Assets 17,476,618 21,184,511 EquityShare capital 23 747,381 744,602Convertible warrants 24 - 120,230Capital reserve 24 4,148,288 4,039,124Share based payments reserve 24 237,971 161,869Foreign exchange reserve 24 (36,285) 309,726Accumulated profi ts 24 12,379,263 15,808,960 Shareholders' equity 17,476,618 21,184,511
Approved and authorised for issue by the Board on 18th June 2007 and signed on its behalf by
G. W. Gurry
N. G. ClarkDirectors
GroupBALANCE SHEETat 31st March 2007
18
Notes Group Company
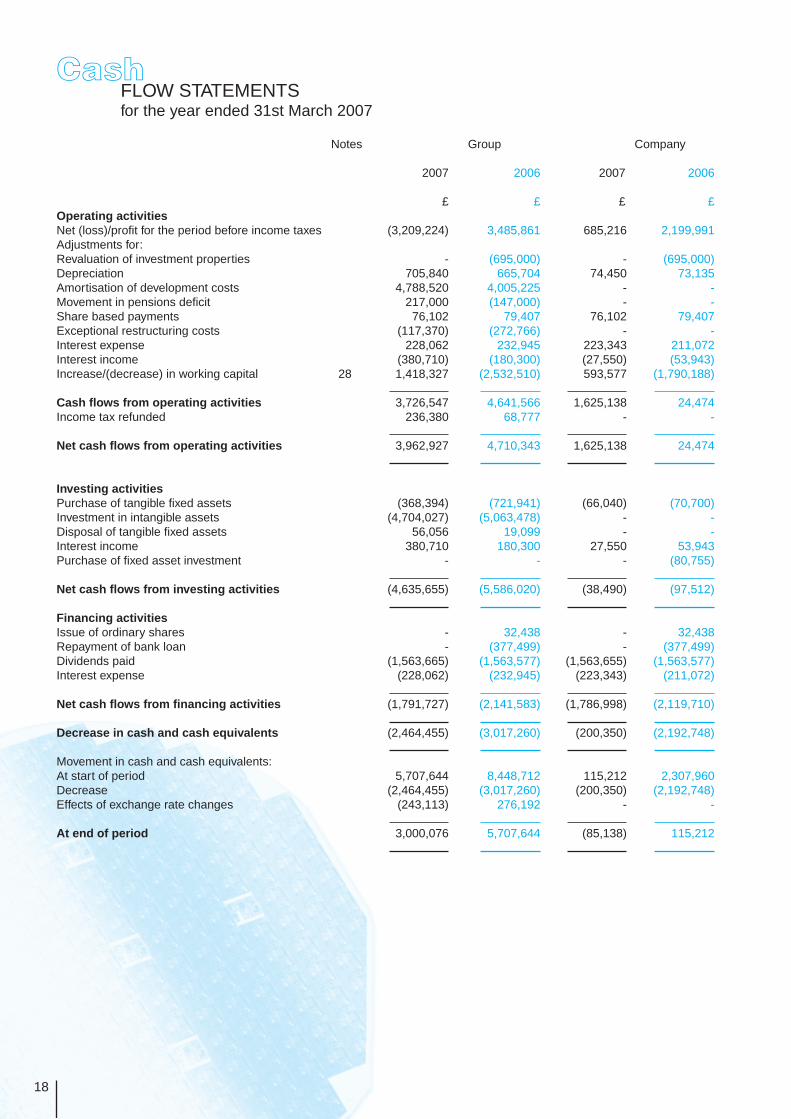
2007 2006 2007 2006 £ £ £ £Operating activities Net (loss)/profi t for the period before income taxes (3,209,224) 3,485,861 685,216 2,199,991Adjustments for:Revaluation of investment properties - (695,000) - (695,000)Depreciation 705,840 665,704 74,450 73,135Amortisation of development costs 4,788,520 4,005,225 - -Movement in pensions defi cit 217,000 (147,000) - -Share based payments 76,102 79,407 76,102 79,407Exceptional restructuring costs (117,370) (272,766) - -Interest expense 228,062 232,945 223,343 211,072Interest income (380,710) (180,300) (27,550) (53,943)Increase/(decrease) in working capital 28 1,418,327 (2,532,510) 593,577 (1,790,188) Cash fl ows from operating activities 3,726,547 4,641,566 1,625,138 24,474Income tax refunded 236,380 68,777 - - Net cash fl ows from operating activities 3,962,927 4,710,343 1,625,138 24,474
Investing activitiesPurchase of tangible fi xed assets (368,394) (721,941) (66,040) (70,700)Investment in intangible assets (4,704,027) (5,063,478) - -Disposal of tangible fi xed assets 56,056 19,099 - -Interest income 380,710 180,300 27,550 53,943Purchase of fi xed asset investment - - - (80,755) Net cash fl ows from investing activities (4,635,655) (5,586,020) (38,490) (97,512) Financing activitiesIssue of ordinary shares - 32,438 - 32,438Repayment of bank loan - (377,499) - (377,499)Dividends paid (1,563,665) (1,563,577) (1,563,655) (1,563,577)Interest expense (228,062) (232,945) (223,343) (211,072) Net cash fl ows from fi nancing activities (1,791,727) (2,141,583) (1,786,998) (2,119,710) Decrease in cash and cash equivalents (2,464,455) (3,017,260) (200,350) (2,192,748) Movement in cash and cash equivalents:At start of period 5,707,644 8,448,712 115,212 2,307,960Decrease (2,464,455) (3,017,260) (200,350) (2,192,748)Effects of exchange rate changes (243,113) 276,192 - - At end of period 3,000,076 5,707,644 (85,138) 115,212
CashFLOW STATEMENTSfor the year ended 31st March 2007

19
GroupSTATEMENT OF CHANGES IN EQUITYfor the year ended 31st March 2007
Share Convertible Capital Share Foreign Accumulated Total capital warrants reserves based exchange profi ts payments reserve £ £ £ £ £ £ £
At 1st April 2005 744,048 120,230 4,007,240 82,462 (40,386) 14,584,608 19,498,202
Shares issued 554 31,884 32,438
Foreign exchange differences 350,112 350,112
Net actuarial gainsrecognised directlyto equity 222,000 222,000
Deferred tax onactuarial gains (66,600) (66,600)
Dividends paid (1,563,577) (1,563,577)
Profi t for period 2,632,529 2,632,529
Share basedpayments 79,407 79,407
At 31st March 2006 744,602 120,230 4,039,124 161,869 309,726 15,808,960 21,184,511
Warrants converted/lapsed 2,779 (120,230) 109,164 8,287 -
Foreign exchange differences (346,011) (346,011)
Net actuarial gainsrecognised directlyto equity 1,063,000 1,063,000
Deferred tax onactuarial gains (318,900) (318,900)
Dividends paid (1,563,665) (1,563,665)
Loss for period (2,618,419) (2,618,419)
Share basedpayments 76,102 76,102
At 31st March 2007 747,381 - 4,148,288 237,971 (36,285) 12,379,263 17,476,618

20
Notes 2007 2006 £ £ £ £
AssetsNon current assetsInvestments 13 7,732,886 8,397,467Property, plant and equipment 12 7,343,300 8,951,710Deferred tax asset 22 86,594 135,155 15,162,780 17,484,332Current assetsTrade receivables and prepayments 16 - 8Cash and cash equivalents 17 - 115,212 - 115,220Non current assets classifi ed as held for sale - property 12 1,600,000 -
1,600,000 115,220 Total assets 16,762,780 17,599,552 LiabilitiesCurrent liabilitiesBank loans and overdrafts 18 4,085,138 4,000,000Trade and other payables 20 222,394 293,399Current tax liabilities 21 - - 4,307,532 4,293,399
Non current liabilitiesDeferred tax liabilities 22 1,152,542 1,116,528 Total liabilities 5,460,074 5,409,927 Net assets 11,302,706 12,189,625 EquityShare capital 23 747,381 744,602Convertible warrants 24 - 120,230Capital reserve 24 4,148,288 4,039,124Share based payments reserve 24 237,971 161,869Merger reserve 24 315,800 315,800Accumulated profi ts 24 5,853,266 6,808,000 Total shareholders' equity 11,302,706 12,189,625
Approved and authorised for issue by the Board on 18th June 2007 and signed on its behalf by
G. W. Gurry
N. G. ClarkDirectors
CompanyBALANCE SHEETat 31st March 2007

21
Share Convertible Capital Share Merger Accumulated Total capital warrants reserves based reserve profi ts payments £ £ £ £ £ £ £
At 1st April 2005 744,048 120,230 4,007,240 82,462 315,800 6,082,337 11,352,117
Shares issued 554 31,884 32,438
Dividends paid (1,563,577) (1,563,577)
Profi t for period 2,289,240 2,289,240
Share basedpayments 79,407 79,407
At 31st March 2006 744,602 120,230 4,039,124 161,869 315,800 6,808,000 12,189,625
Warrants converted/lapsed 2,779 (120,230) 109,164 8,287 -
Dividends paid (1,563,665) (1,563,665)
Profi t for period 600,644 600,644
Share basedpayments 76,102 76,102
At 31st March 2007 747,381 - 4,148,288 237,971 315,800 5,853,266 11,302,706
CompanySTATEMENT OF CHANGES IN EQUITYat 31st March 2007
22
1 ACCOUNTING POLICIESThe fi nancial statements have been prepared in accordance with applicable international Accounting Standards ("IAS") and International Financial Reporting Standards ("IFRS"). The following accounting policies have been used consistently in dealing with items which are considered material in relation to the fi nancial statements.a Basis of accounting
The fi nancial statements have been prepared under the historical cost convention with the exception of investment properties which are carried at valuation.
b Basis of consolidationThese fi nancial statements incorporate the fi nancial statements of the Company and its subsidiary undertakings using the purchase method of accounting. The results of acquired subsidiary undertakings are included from the date of acquisition. No profi t and loss account is presented for CML Microsystems Plc as provided by Section 230(3) of the Companies Act 1985. Dormant subsidiaries are not included in the consolidated fi nancial statements.
c Segmental reportingThe Group's primary reporting format is in two segments being Semi-conductor components and equipment. These individual segments are engaged in separate business sectors and are subject to different risks and returns.
d RevenueThe Group recognises revenues from the sale of semiconductor products or services when the signifi cant risks and rewards of ownership have passed to the customer. This is generally when goods have been despatched to the customer, and the revenues can be measured reliably. Revenue is measured at the fair value of the consideration received excluding discounts, rebates, Value Added Tax and other sales taxes or duties.
e Intangible assets - GoodwillGoodwill represents the excess of the cost of an acquisition over the fair value of the Group's share of the net identifi able assets of the acquired subsidiary at the date of acquisition. Historically the Group's policy for goodwill arising on acquisition of a subsidiary undertaking was to write it off directly against reserves but following the introduction of Financial Reporting Standard 10 goodwill arisng on the acquisition of a subsidiary undertaking was capitalised, classifi ed as an asset and amortised over its economic useful life. Under IFRS 1 the Group has elected to adopt the 31st March 2005 balance sheet amortised value prepared under UK GAAP for goodwill and carry out annual impairment reviews as required under IAS 38.Goodwill is reviewed annually for impairment by comparing its carrying value to the net selling price of the associated asset; any resultant loss being charged through the consolidated income statement. Net selling price is determined using a fi ve year average of historic and projected future earnings as applied to the price earnings ratio for the technology sector.
f Intangible assets – Research and developmentDevelopment expenditures that satisfi es the recognition criteria as set out in IAS 38 are shown at historical cost less accumulated amortisation since it has a defi nite useful life. In determining the period over which the carrying value of the intangible fi xed assets is amortised, the Group is required to consider the likely period over which the developed products are likely to generate economic benefi ts. Amortisation is calculated using the straight line method to allocate the cost of the development over a period of between 2 and 4 years, representing the period over which economic benefi t is derived from developed products. Research and other development expenditures that fall outside the scope of IAS 38 are charged to the income statement when incurred.
g Tangible assets - Property, plant and equipment and investment propertyAll tangible fi xed assets, other than investment properties, are stated at historical cost. Depreciation is provided on all tangible fi xed assets other than freehold land and investment properties at rates calculated to write each asset down to its estimated residual value over its expected useful life, as follows:Freehold and long leasehold premises -2% straight lineShort leasehold premises -period of the leasePlant and equipment: Fixtures and fi ttings -20% reducing balance Other equipment -20% & 25% straight lineMotor vehicles -25% straight lineInvestment properties are revalued annually by the directors and every third year by independent Chartered Surveyors on an existing use, open market basis. No depreciation is provided on freehold investment properties or on leasehold investment properties where the unexpired lease term exceeds 20 years. In accordance with IAS 40, gains and losses arising on revaluation of investment properties are shown in the Income Statement.
h Taxation The tax expense represents the sum of the tax currently payable and deferred tax.The tax currently payable is based on taxable profi t for the year. Taxable profi t differs from net profi t as reported in the income statement because it excludes items of income or expense that are taxable or deductible in other years and it further excludes items that are never taxable or deductible. The Group's liability for current tax is calculated by using tax rates that have been enacted or substantially enacted by the balance sheet date.Deferred tax is recognised in respect of temporary timing differences that have originated but not reversed at the balance sheet date where transactions or events that result in an obligation to pay more tax in the future or a right to pay less tax in the future have occured at the balance sheet date. Timing differences are differences between the group's taxable profi ts and its results as stated in the fi nancial statements that arise from the inclusion of gains and losses in tax assessments in periods different from those in which they are recognised in the financial statements.Deferred tax assets are recognised to the extent that it is regarded as more likely than not that they will be recoverable against suitable taxable profi ts in the future.Deferred tax is measured at the average tax rates that are expected to apply in the periods in which timing differences are expected to reverse, based on tax rates and laws that have been enacted or substantially enacted by the balance sheet date. Deferred tax is measured on a non-discounted basis.
NotesTO THE FINANCIAL STATEMENTS
23
i Inventories Inventories are valued on a fi rst in, fi rst out basis and are stated at the lower of cost and net realisable value. In respect of work in progress and fi nished goods, cost comprises direct materials, direct labour and a proportion of overhead expenses appropriate to the business.
j Foreign currenciesAssets and liabilities denominated in foreign currencies are translated at the rates of exchange ruling at the balance sheet date. Transactions in foreign currencies are recorded at the rates ruling at the date of the transactions. All differences are taken to the income statement. The fi nancial statements of the overseas subsidiaries are translated into sterling at the average rate of exchange for the period. Translation differences are dealt with through the Foreign Exchange reserve in shareholders' funds.The Group has decided to deem the cumulative amount of exchange differences arising on consolidation of the net investments in subsidiaries at 1st April 2004 to be zero.
k InvestmentsFixed asset investments are stated at cost less any provision for diminution in value. Investments held as current assets are stated at the lower of cost and net realisable value.
l Cash and cash equivalents Cash and cash equivalents include cash in hand, deposits held at call with banks, other short-term highly liquid investments with original maturities of three months or less, and bank overdrafts where there is a set off arrangement with the bank. Other bank overdrafts are shown within borrowings of the current liabilities on the balance sheet.
m Employee benefi ts – Pension obligationsGroup companies operate both defi ned benefi t and defi ned contribution pension schemes. The schemes are funded through payments to funds administered by trustees and these are determined by periodic actuarial calculations in respect of the defi ned benefi t pension schemes. The Group has elected to recognise all cumulative actuarial gains and losses in relation to employee defi ned benefi t schemes at the date of transition. The liability recognised in the balance sheet in respect of the defi ned pension schemes is the present value of the defi ned benefi t obligation at the balance sheet date less the fair value of the scheme assets. Independent actuaries using the projected unit method calculate the defi ned benefi t obligation annually. Actuarial gains and losses from experience adjustments and changes in actuarial assumptions are charged or credited directly to equity. For defi ned contribution schemes, contributions are recognised as an employee benefi t expense when they are due.
n Employee benefi ts – Share based paymentsThe Group has taken advantage of the transitional provisions that allows it to apply IFRS 2 to share option awards granted after 7th November 2002 that had not vested on or before 31st March 2005. Share options are valued using the Black Scholes model. This fair value is charged to the income statement over the vesting period of the share based payment scheme. The value of the charge is adjusted to refl ect expected and actual levels of options vesting.
o EU GrantsEU grants receivable to assist the Group with costs in respect of development work are credited against capitalised development costs so as to match them with the expenditure to which they relate. Other grants that are not of a capital nature are credited to the income statement as part of other operating income.
p LeasesLeases of property, plant and equipment where the Group has substantially all the risk and rewards of ownership are classifi ed as fi nance leases. Leases in which a signifi cant number of the risks and rewards of ownership are retained by the lessor are classifi ed as operating leases. Rental payments under operating leases are charged to the income statement on a straight-line basis. Rental income under operating leases are credited to the income statement on a straight-line basis.
q DividendsDividend distribution to the Company’s shareholders is recognised as a liability in the Group’s fi nancial statement in the period in which the dividends are approved by the Company’s shareholders.
r Critical accounting estimates and judgementsEstimates and judgements are continually evaluated and are based on historical experience and other factors, including expectations of future events that are believed to be reasonable under the circumstances. The Group makes estimates and assumptions concerning the future. The resulting accounting estimates and assumptions will, by defi nition, seldom equal the related actual result. The amortisation period of development costs is considered to be a critical accounting estimate and judgement; details of which are referred to in Accounting Policy, section f.
s Borrowing costBorrowing costs are recognised as an expense in the period in which they are incurred.
t Non current assets held for saleNon current assets held for sale have been valued at the lower of the carrying value or fair value less costs to sell. The reclassifi cation to current assets takes place when the assets are placed on the open market available for sale.
NotesTO THE FINANCIAL STATEMENTScontinued

24
2 SEGMENTAL ANALYSISPrimary - Business
2007 2006 Equipment Semiconductor Group Equipment Semiconductor Group Components Components £ £ £ £ £ £
Revenue Segmental sales 1,003,590 16,764,847 17,768,437 1,134,354 25,198,256 26,332,610 (Loss)/Profi tSegmental operating (loss)/profi t 101,563 (3,463,435) (3,361,872) 259,912 2,583,594 2,843,506 Net fi nance income/(expense) 152,648 (52,645)Revaluation of investment properties - 695,000Income tax 590,805 (853,332) (Loss)/Profi t after taxation (2,618,419) 2,632,529 Assets and liabilities Segmental assets 761,681 23,190,153 23,951,834 781,944 28,958,468 29,740,412 Unallocated corporate assets 5,980,550 5,547,085 Consolidated total assets 29,932,384 35,287,497
Segmental liabilities 157,735 2,120,008 2,277,743 280,471 3,163,816 3,444,287 Unallocated corporate liablities 10,178,023 10,658,699 Consolidated total liabilities 12,455,766 14,102,986 Other segmental informationTangible asset additions 619 367,775 368,394 45,965 675,976 721,941 Intangible asset additions 74,284 4,629,743 4,704,027 67,930 4,995,548 5,063,478 Depreciation 16,942 688,898 705,840 23,672 642,635 666,307 Amortisation 76,218 4,712,302 4,788,520 85,959 3,919,266 4,005,225 Secondary - Geographical UK Germany Americas Far East Total £ £ £ £ £Year ended 31st March 2006Revenue by origination 10,397,679 12,481,096 3,276,510 7,028,827 33,184,112 Inter-segmental transfers (2,934,123) (3,206,955) (710,424) - (6,851,502) Revenue to third parties 7,463,556 9,274,141 2,556,086 7,028,827 26,332,610 Tangible asset additions 173,871 459,845 4,751 83,474 721,941 Intangible asset additions 2,739,587 2,323,891 - - 5,063,478 Net assets 15,142,522 3,302,960 1,812,213 926,816 21,184,511
Year ended 31st March 2007Revenue by origination 10,415,596 4,332,175 3,464,734 4,587,538 22,800,043 Inter-segmental transfers (2,636,927) (1,892,522) (502,157) - (5,031,606) Revenue to third parties 7,778,669 2,439,653 2,962,577 4,587,538 17,768,437 Tangible asset additions 285,663 39,829 17,303 25,599 368,394 Intangible asset additions 2,542,606 2,161,421 - - 4,704,027 Net assets 13,989,279 1,331,741 1,314,572 566,292 17,201,884 Inter-segmental transfers or transactions are entered into under normal commercial terms and conditions that would also be available to unrelated third parties.
NotesTO THE FINANCIAL STATEMENTScontinued
25
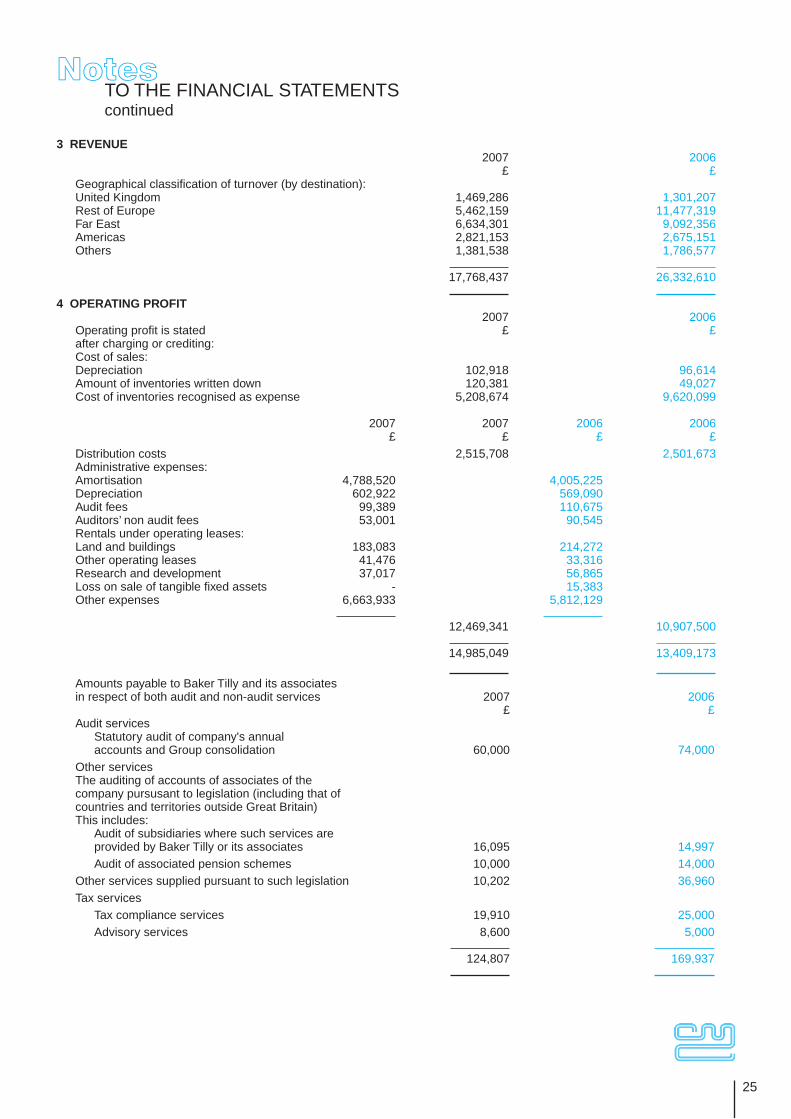
3 REVENUE 2007 2006 £ £Geographical classifi cation of turnover (by destination):United Kingdom 1,469,286 1,301,207 Rest of Europe 5,462,159 11,477,319 Far East 6,634,301 9,092,356 Americas 2,821,153 2,675,151 Others 1,381,538 1,786,577 17,768,437 26,332,610
4 OPERATING PROFIT 2007 2006
Operating profi t is stated £ £after charging or crediting:Cost of sales:Depreciation 102,918 96,614Amount of inventories written down 120,381 49,027Cost of inventories recognised as expense 5,208,674 9,620,099
2007 2007 2006 2006 £ £ £ £ Distribution costs 2,515,708 2,501,673 Administrative expenses: Amortisation 4,788,520 4,005,225 Depreciation 602,922 569,090 Audit fees 99,389 110,675 Auditors’ non audit fees 53,001 90,545 Rentals under operating leases:Land and buildings 183,083 214,272 Other operating leases 41,476 33,316Research and development 37,017 56,865 Loss on sale of tangible fi xed assets - 15,383Other expenses 6,663,933 5,812,129 12,469,341 10,907,500 14,985,049 13,409,173 Amounts payable to Baker Tilly and its associates in respect of both audit and non-audit services 2007 2006 £ £Audit services
Statutory audit of company's annualaccounts and Group consolidation 60,000 74,000
Other servicesThe auditing of accounts of associates of the company pursusant to legislation (including that of countries and territories outside Great Britain)This includes:
Audit of subsidiaries where such services are provided by Baker Tilly or its associates 16,095 14,997Audit of associated pension schemes 10,000 14,000
Other services supplied pursuant to such legislation 10,202 36,960Tax services
Tax compliance services 19,910 25,000Advisory services 8,600 5,000
124,807 169,937
NotesTO THE FINANCIAL STATEMENTScontinued
26
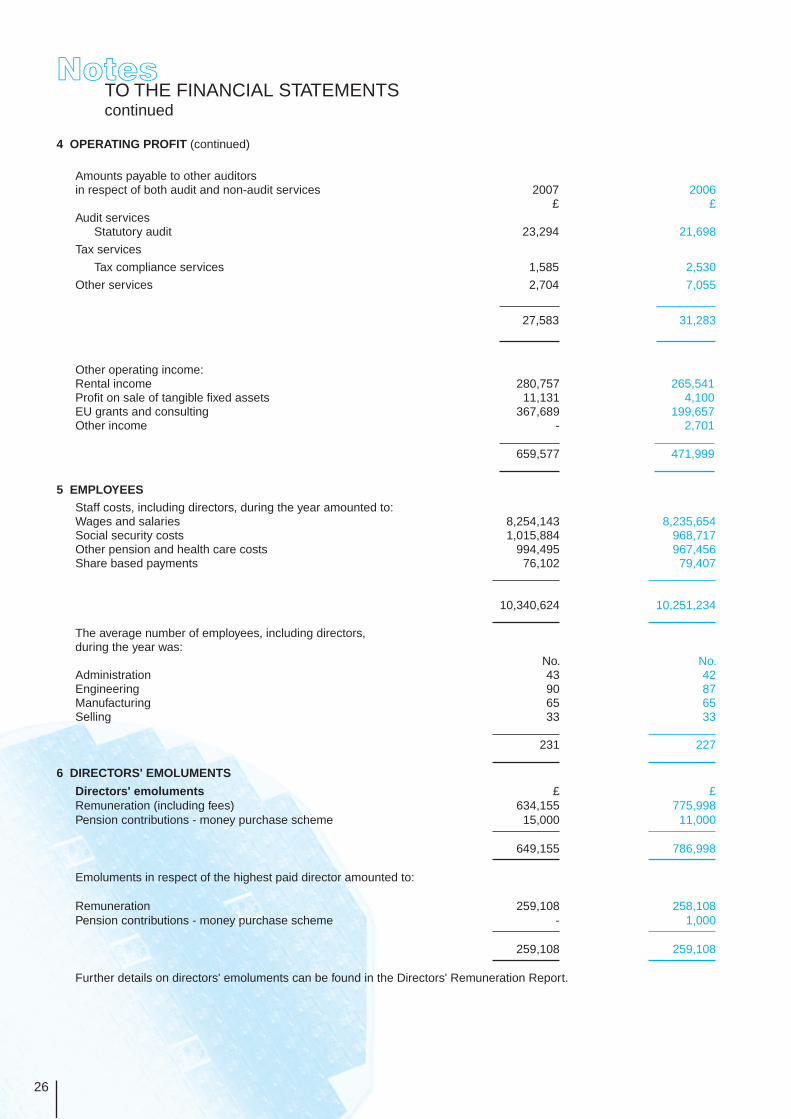
4 OPERATING PROFIT (continued)
Amounts payable to other auditors in respect of both audit and non-audit services 2007 2006 £ £Audit services
Statutory audit 23,294 21,698
Tax services
Tax compliance services 1,585 2,530
Other services 2,704 7,055
27,583 31,283
Other operating income:Rental income 280,757 265,541Profi t on sale of tangible fi xed assets 11,131 4,100 EU grants and consulting 367,689 199,657 Other income - 2,701 659,577 471,999
5 EMPLOYEES Staff costs, including directors, during the year amounted to: Wages and salaries 8,254,143 8,235,654Social security costs 1,015,884 968,717Other pension and health care costs 994,495 967,456 Share based payments 76,102 79,407
10,340,624 10,251,234 The average number of employees, including directors, during the year was: No. No.Administration 43 42Engineering 90 87Manufacturing 65 65Selling 33 33 231 227
6 DIRECTORS' EMOLUMENTS
Directors' emoluments £ £Remuneration (including fees) 634,155 775,998Pension contributions - money purchase scheme 15,000 11,000 649,155 786,998 Emoluments in respect of the highest paid director amounted to: Remuneration 259,108 258,108Pension contributions - money purchase scheme - 1,000 259,108 259,108 Further details on directors' emoluments can be found in the Directors' Remuneration Report.
NotesTO THE FINANCIAL STATEMENTScontinued
27
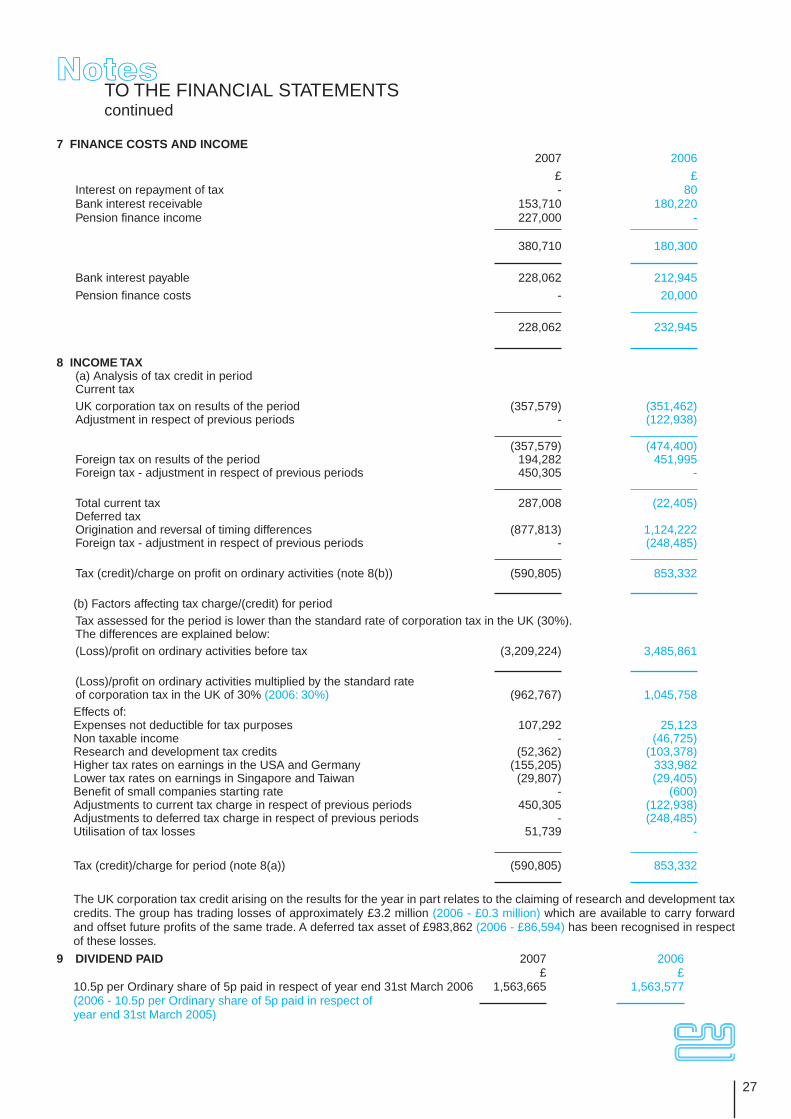
7 FINANCE COSTS AND INCOME 2007 2006
£ £Interest on repayment of tax - 80Bank interest receivable 153,710 180,220Pension fi nance income 227,000 - 380,710 180,300
Bank interest payable 228,062 212,945
Pension fi nance costs - 20,000
228,062 232,945
8 INCOME TAX (a) Analysis of tax credit in period Current taxUK corporation tax on results of the period (357,579) (351,462) Adjustment in respect of previous periods - (122,938) (357,579) (474,400)Foreign tax on results of the period 194,282 451,995Foreign tax - adjustment in respect of previous periods 450,305 - Total current tax 287,008 (22,405)Deferred taxOrigination and reversal of timing differences (877,813) 1,124,222Foreign tax - adjustment in respect of previous periods - (248,485) Tax (credit)/charge on profi t on ordinary activities (note 8(b)) (590,805) 853,332 (b) Factors affecting tax charge/(credit) for period Tax assessed for the period is lower than the standard rate of corporation tax in the UK (30%). The differences are explained below: (Loss)/profi t on ordinary activities before tax (3,209,224) 3,485,861 (Loss)/profi t on ordinary activities multiplied by the standard rateof corporation tax in the UK of 30% (2006: 30%) (962,767) 1,045,758Effects of: Expenses not deductible for tax purposes 107,292 25,123Non taxable income - (46,725)Research and development tax credits (52,362) (103,378)Higher tax rates on earnings in the USA and Germany (155,205) 333,982Lower tax rates on earnings in Singapore and Taiwan (29,807) (29,405)Benefi t of small companies starting rate - (600)Adjustments to current tax charge in respect of previous periods 450,305 (122,938)Adjustments to deferred tax charge in respect of previous periods - (248,485) Utilisation of tax losses 51,739 - Tax (credit)/charge for period (note 8(a)) (590,805) 853,332
The UK corporation tax credit arising on the results for the year in part relates to the claiming of research and development tax credits. The group has trading losses of approximately £3.2 million (2006 - £0.3 million) which are available to carry forward and offset future profi ts of the same trade. A deferred tax asset of £983,862 (2006 - £86,594) has been recognised in respect of these losses.
9 DIVIDEND PAID 2007 2006 £ £
10.5p per Ordinary share of 5p paid in respect of year end 31st March 2006 1,563,665 1,563,577(2006 - 10.5p per Ordinary share of 5p paid in respect of year end 31st March 2005)
NotesTO THE FINANCIAL STATEMENTScontinued

28
10 (LOSS)/EARNINGS PER ORDINARY SHAREThe calculation of basic and diluted earnings per share is based on the profi t attributable to ordinary shareholders, divided by the weighted average number of shares in issue during the year.
Loss Weighted Loss Profi t Weighted Earnings average per share average per share number of number of shares shares 2007 2007 2007 2006 2006 2006 £ p £ p
Basic (loss)/earnings per share (2,618,419) 14,933,733 (17.53) 2,632,529 14,892,052 17.68
Diluted (loss)/earnings per share
Basic (loss)/earnings per share (2,618,419) 14,933,733 (17.53) 2,632,529 14,892,052 17.68 Dilutive effect of share options - - 12,866 0.02
Diluted (loss)/earnings per share (2,618,419) 14,933,733 (17.53) 2,632,529 14,904,918 17.66
11 RETIREMENT BENEFIT OBLIGATIONSThe Group operates several pension schemes in the UK and the US. The majority of the Group's employees in the UK are members of a defi ned benefi t scheme and the majority of the Group's employees in the US are in a 401(k) trustee profi t sharing plan. All schemes are administrated by Trustees and are independent of the Group's fi nances.The latest triennial actuarial valuation of the defi ned benefi t scheme in the UK at 1st April 2005, using the projected unit method, disclosed assets with a market value of £9,993,000, equivalent to 85% of the accrued liabilities, after allowing for expected future increases in earnings. The main actuarial assumptions used were: Investment return 7% p.a. pre-retirement, 5% post retirement; General growth in salaries 3% p.a.; Pensions accrued prior to 6th April 1997 will increase in payment at 3.0% p.a. compound; Limited price indexation 3.0% p.a. with a minimum of 3.0%; Early leaver indexation 3% p.a. As at 1st April 2005 the Minimum Funding Requirement ("MFR") calculation showed a funding level of 129%.The scheme operated in the US is the equivalent of a money purchase scheme. The Group makes a contibution of 3% of each eligible employees salary and a matching contribution of 3% for each 1% contributed by the employee up to a maximum Group contribution of 6%.The total contributions to the schemes over the year was: 2007 2006 Pension costs £ £
UK defi ned benefi t pension cost 494,935 570,035 UK defi ned contribution pension cost 108,966 70,079 US 401(k) profi t sharing plan 110,712 118,280 714,613 758,394
The Group operates a defi ned benefi t scheme in the UK. The triennial actuarial valuation carried out as at 1st April 2005 has been updated to 31st March 2007 by a qualifi ed independent actuary. The major assumptions used by the actuary for IAS19 were (in nominal terms): 2007 2006 2005Pensionable salary growth 3.00% 3.00% 3.00%Pension escalation in payment (Limited Price Indexation with a minimum of 3%) 3.00% 3.00% 3.00%Discount rate 5.40% 4.70% 5.50%Infl ation assumption 3.30% 2.90% 2.90%
The scheme was closed to new members on 1st April 2002 and employees have the option of joining a defi ned contribution scheme. Under the projected unit method of valuation, the current service cost will increase as members approach retirement.
NotesTO THE FINANCIAL STATEMENTScontinued

29
11 RETIREMENT BENEFIT OBLIGATIONS (continued)
On the basis of the above assumptions, the amounts that have been charged to the income statement and the statement of recognised income and expense for the year to 31st March 2007 and 31st March 2006 are as follows: 2007 2006 Income statement £ £Operating profi t - current service cost (406,000) (380,000)- past service cost (587,000) - - total operating charge (993,000) (380,000) Other fi nance income - expected return on pension scheme assets 1,017,000 715,000- interest on pension scheme liabilities (790,000) (735,000) - net return 227,000 (20,000) Statement of recognised income and expense Actual return less expected return on pension scheme assets (1,018,000) 2,542,000Experience gains and losses arising on the scheme liabilities (91,000) (5,000)Changes in assumptions underlying the present value of scheme liabilities 2,172,000 (2,315,000) Net actuarial gain recognised in statement ofrecognised income and expense 1,063,000 222,000
The actual return on pension scheme assets in the year (1,000) 3,257,000
History of experience gains and losses: 2007 2006 2005Difference between expected and actual return on scheme assets: (£1,018,000) £2,542,000 (£59,000)- as a percentage of scheme assets (7%) 19% (1%)Experience gains and losses on scheme liabilities: (£91,000) (£5,000) (£372,000)- as a percentage of present value of scheme liabilities (1%) (1%) (3%)Total amount recognised in Statement of Recognised Income and Expense: £1,063,000 £222,000 (£493,000)- as a percentage of present value of scheme liabilities 6% 1% (4%)
The fair value of the assets in the scheme and the expected rates of return were:
2007 2006 2005 2004 2003 Value Value Value Value Value £ £ £ £ £Equities 8,440,000 9,703,000 6,324,000 6,016,000 4,295,000
Expected rate of return 7.75% 8.00% 8.00% 8.00% 8.00%Bonds (including Gilts) 2,998,000 1,250,000 1,115,000 1,353,000 1,315,000
Expected rate of return 5.00% 5.00% 5.00% 5.00% 5.00%Property 1,874,000 1,628,000 1,174,000 626,000 685,000
Expected rate of return 7% 7.00% 7.00% 7.00% 7.00%Cash 755,000 932,000 1,103,000 509,000 280,000
Expected rate of return 4.50% 4.75% 4.75% 4.00% 4.00% Total market value of assets 14,067,000 13,513,000 9,716,000 8,504,000 6,575,000Present value of schemeliabilities (16,356,000) (16,648,000) (13,220,000) (11,597,000) (9,795,000) Defi cit in the scheme (2,289,000) (3,135,000) (3,504,000) (3,093,000) (3,220,000)Related deferred tax asset 686,700 940,500 1,051,200 927,900 966,000 Net pension liability (1,602,300) (2,194,500) (2,452,800) (2,165,100) (2,254,000)
NotesTO THE FINANCIAL STATEMENTScontinued
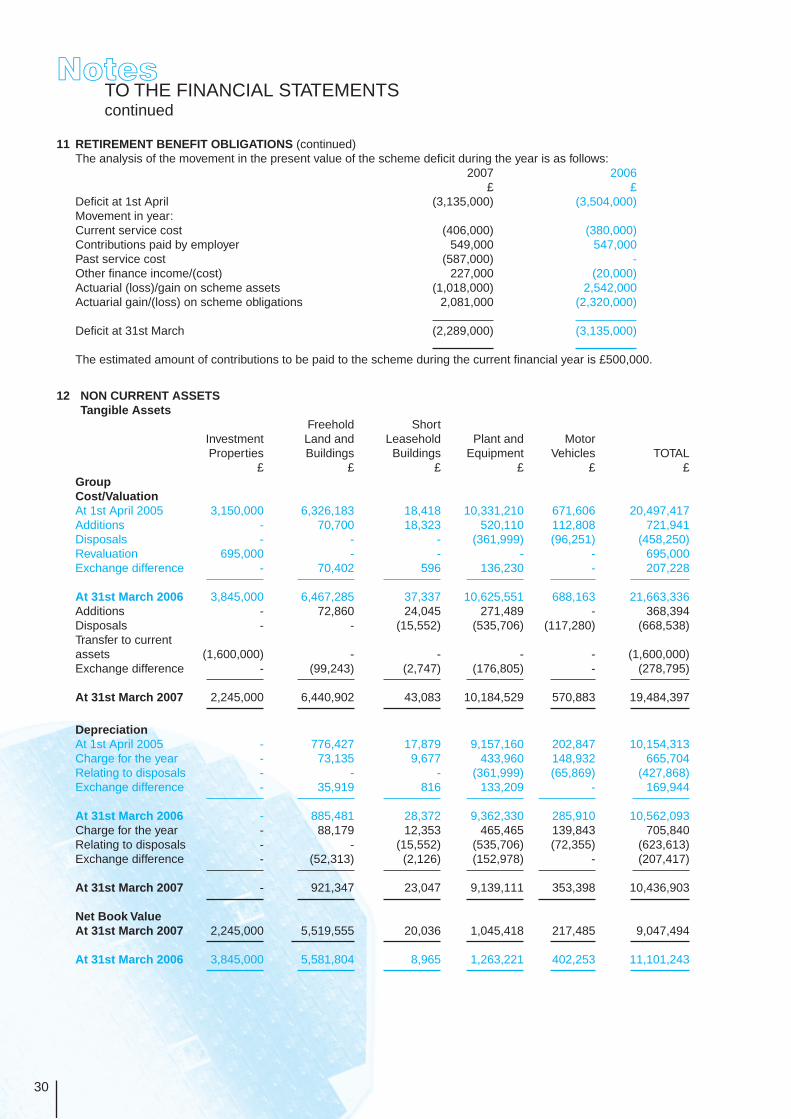
30
11 RETIREMENT BENEFIT OBLIGATIONS (continued)The analysis of the movement in the present value of the scheme defi cit during the year is as follows: 2007 2006 £ £Defi cit at 1st April (3,135,000) (3,504,000)Movement in year:Current service cost (406,000) (380,000)Contributions paid by employer 549,000 547,000Past service cost (587,000) -Other fi nance income/(cost) 227,000 (20,000)Actuarial (loss)/gain on scheme assets (1,018,000) 2,542,000Actuarial gain/(loss) on scheme obligations 2,081,000 (2,320,000) Defi cit at 31st March (2,289,000) (3,135,000) The estimated amount of contributions to be paid to the scheme during the current fi nancial year is £500,000.
12 NON CURRENT ASSETS Tangible Assets Freehold Short Investment Land and Leasehold Plant and Motor Properties Buildings Buildings Equipment Vehicles TOTAL £ £ £ £ £ £
Group Cost/Valuation At 1st April 2005 3,150,000 6,326,183 18,418 10,331,210 671,606 20,497,417 Additions - 70,700 18,323 520,110 112,808 721,941 Disposals - - - (361,999) (96,251) (458,250) Revaluation 695,000 - - - - 695,000Exchange difference - 70,402 596 136,230 - 207,228
At 31st March 2006 3,845,000 6,467,285 37,337 10,625,551 688,163 21,663,336
Additions - 72,860 24,045 271,489 - 368,394 Disposals - - (15,552) (535,706) (117,280) (668,538)Transfer to currentassets (1,600,000) - - - - (1,600,000)Exchange difference - (99,243) (2,747) (176,805) - (278,795)
At 31st March 2007 2,245,000 6,440,902 43,083 10,184,529 570,883 19,484,397
Depreciation At 1st April 2005 - 776,427 17,879 9,157,160 202,847 10,154,313 Charge for the year - 73,135 9,677 433,960 148,932 665,704 Relating to disposals - - - (361,999) (65,869) (427,868) Exchange difference - 35,919 816 133,209 - 169,944 At 31st March 2006 - 885,481 28,372 9,362,330 285,910 10,562,093Charge for the year - 88,179 12,353 465,465 139,843 705,840 Relating to disposals - - (15,552) (535,706) (72,355) (623,613) Exchange difference - (52,313) (2,126) (152,978) - (207,417) At 31st March 2007 - 921,347 23,047 9,139,111 353,398 10,436,903
Net Book ValueAt 31st March 2007 2,245,000 5,519,555 20,036 1,045,418 217,485 9,047,494
At 31st March 2006 3,845,000 5,581,804 8,965 1,263,221 402,253 11,101,243
NotesTO THE FINANCIAL STATEMENTScontinued

31
12 NON CURRENT ASSETS (continued) Freehold Investment Land and Properties Buildings TOTAL £ £ £ Company Cost/ValuationAt 1st April 2005 3,150,000 5,538,324 8,688,324Additions - 70,700 70,700Revaluation 695,000 - 695,000 At 31st March 2006 3,845,000 5,609,024 9,454,024Additions - 66,040 66,040Transfers to current assets (1,600,000) - (1,600,000) At 31st March 2007 2,245,000 5,675,064 7,920,064
Depreciation At 1st April 2005 - 429,179 429,179 Charge for the year - 73,135 73,135 At 31st March 2006 - 502,314 502,314 Charge for the year - 74,450 74,450 At 31st March 2007 - 576,764 576,764 Net Book ValueAt 31st March 2007 2,245,000 5,098,300 7,343,300
At 31st March 2006 3,845,000 5,106,710 8,951,710
Investment Properties in both the Group and Company comprise £2,245,000 (2006 - £2,245,000) of freehold land and buildings and £nil (2006 - £1,600,000) of long leasehold property.
The historical cost and accumulated depreciation of freehold and long leasehold land and buildings included within investment properties at valuation is £1,558,534 and £335,397 respectively giving a net historical cost book value of £1,223,137. The properties were professionally valued by Everett Newlyn, Chartered Surveyors and Commercial Property Consultants on an existing use, open market basis at £2,245,000 as at 31st March 2006. The directors consider this valuation to still be appropriate as at 31st March 2007.
The long leasehold property has been transferred into current assets at the carrying value of £1,600,000 as it had been placed on the open market for sale.
Intangible Assets 2007 2006 £ £ Group - Goodwill CostAt 1st April and at 31st March 3,512,305 3,512,305
The goodwill arose on the acquisition of Hyperstone AG. which was amortised under UK GAAP until 31st March 2004.
NotesTO THE FINANCIAL STATEMENTScontinued

32
12 NON CURRENT ASSETS (continued)
Group - Development costs 2007 2006 £ £CostAs at 1st April 19,145,042 14,096,050 Additions 4,704,027 5,063,478 Exchange difference (64,138) (14,486) As at 31st March 23,784,931 19,145,042 Amortisation As at 1st April 13,012,258 9,007,033Charged in the period 4,788,520 4,005,225 As at 31st March 17,800,778 13,012,258 Net book valueAs at 31st March 5,984,153 6,132,784 No EU grants have been credited to the cost of development in arriving at the net book value at the year end.
13 NON CURRENT ASSETS - INVESTMENTS Group Group Company Company 2007 2006 2007 2006 £ £ £ £
Cost of investment in subsidiary undertakings:As at 1st April - - 4,959,658 4,878,903Additions - - - 80,755 As at 31st March - - 4,959,658 4,959,658 Advances to subsidiary undertakingsAs at 1st April 2006 - - 3,437,809 1,539,557(Reduction)/Increase in advances - - (664,581) 1,898,252 As at 31st March 2007 - - 2,773,228 3,437,809
Net Book ValueAs at 31st March 2007 - - 7,732,886 8,397,467
Details of the principal subsidiary undertakings of the Company are as follows: Country of Percentage Name incorporation held HoldingCML Microsystems Inc. USA 100% Trading in USA DirectCML Microcircuits (UK) Limited England 100% Trading in England DirectCML Microcircuits (USA) Inc. USA 100% Trading in USA IndirectCML Microcircuits (Singapore) Pte Ltd Singapore 100% Trading in Singapore DirectRadio Data Technology Limited England 100% Trading in England DirectApplied Technology (UK) Limited England 100% Trading in England DirectHyperstone AG Germany 100% Trading in Germany DirectHyperstone Inc. USA 100% Trading in USA IndirectHyperstone Asia Pacifi c Limited Taiwan 100% Trading in Taiwan Direct
All of the above companies are involved in the design, manufacture and marketing of specialised electronic devices for use in the telecommunications, radio and data communications industries. The above all share the same reporting date.
NotesTO THE FINANCIAL STATEMENTScontinued
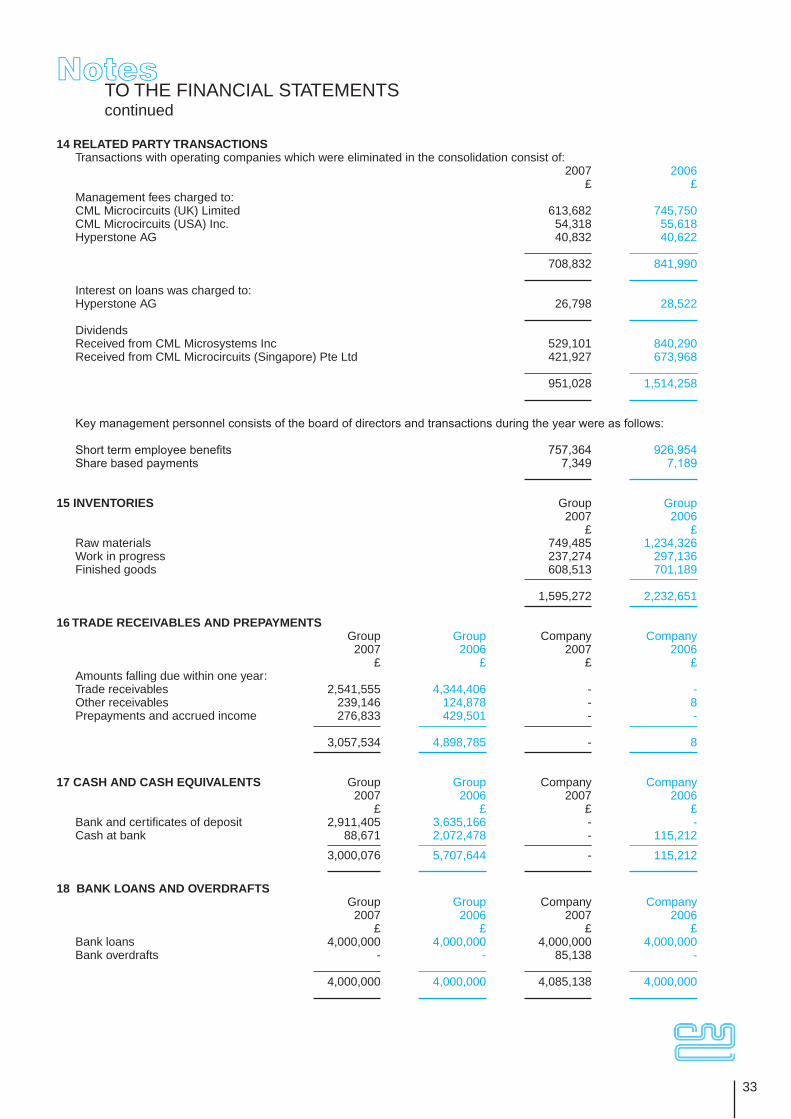
33
14 RELATED PARTY TRANSACTIONSTransactions with operating companies which were eliminated in the consolidation consist of: 2007 2006 £ £Management fees charged to:CML Microcircuits (UK) Limited 613,682 745,750 CML Microcircuits (USA) Inc. 54,318 55,618 Hyperstone AG 40,832 40,622
708,832 841,990
Interest on loans was charged to:Hyperstone AG 26,798 28,522
Dividends Received from CML Microsystems Inc 529,101 840,290Received from CML Microcircuits (Singapore) Pte Ltd 421,927 673,968
951,028 1,514,258
Key management personnel consists of the board of directors and transactions during the year were as follows:
Short term employee benefi ts 757,364 926,954Share based payments 7,349 7,189
15 INVENTORIES Group Group 2007 2006 £ £Raw materials 749,485 1,234,326 Work in progress 237,274 297,136 Finished goods 608,513 701,189
1,595,272 2,232,651
16 TRADE RECEIVABLES AND PREPAYMENTS Group Group Company Company 2007 2006 2007 2006 £ £ £ £Amounts falling due within one year: Trade receivables 2,541,555 4,344,406 - -Other receivables 239,146 124,878 - 8Prepayments and accrued income 276,833 429,501 - -
3,057,534 4,898,785 - 8
17 CASH AND CASH EQUIVALENTS Group Group Company Company 2007 2006 2007 2006 £ £ £ £Bank and certifi cates of deposit 2,911,405 3,635,166 - -Cash at bank 88,671 2,072,478 - 115,212 3,000,076 5,707,644 - 115,212
18 BANK LOANS AND OVERDRAFTS Group Group Company Company 2007 2006 2007 2006 £ £ £ £Bank loans 4,000,000 4,000,000 4,000,000 4,000,000Bank overdrafts - - 85,138 - 4,000,000 4,000,000 4,085,138 4,000,000
NotesTO THE FINANCIAL STATEMENTScontinued
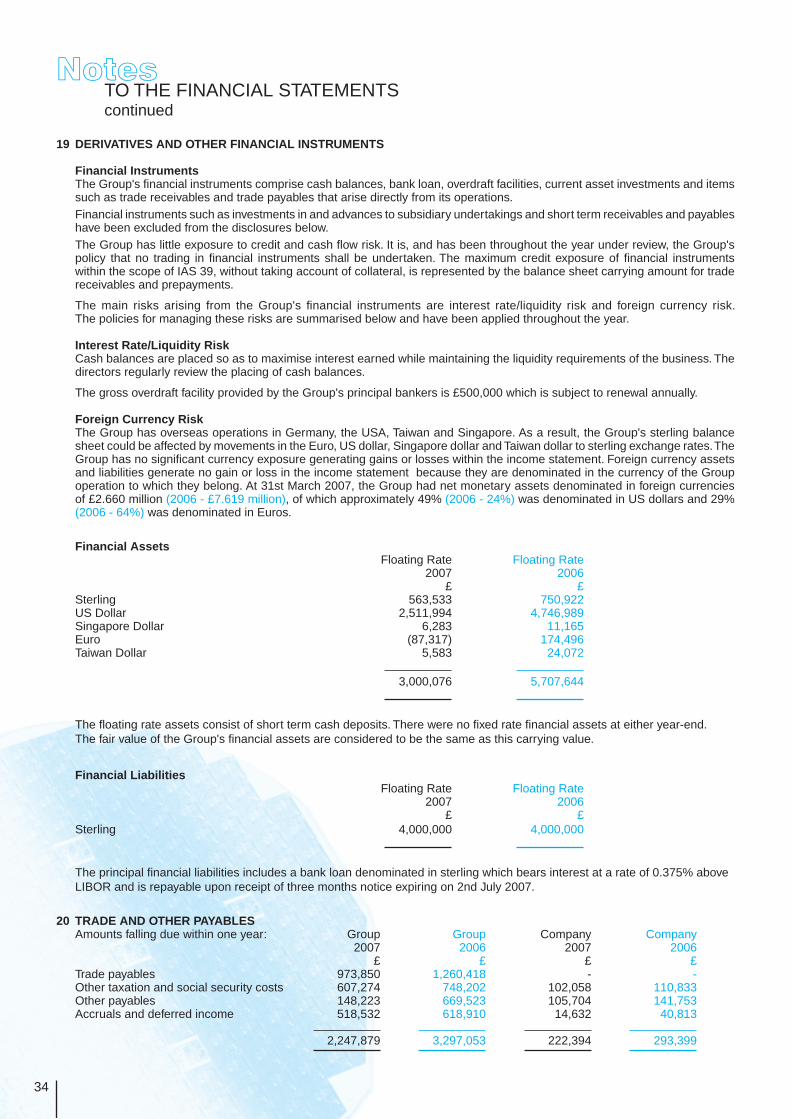
34
19 DERIVATIVES AND OTHER FINANCIAL INSTRUMENTS
Financial InstrumentsThe Group's fi nancial instruments comprise cash balances, bank loan, overdraft facilities, current asset investments and items such as trade receivables and trade payables that arise directly from its operations.Financial instruments such as investments in and advances to subsidiary undertakings and short term receivables and payables have been excluded from the disclosures below.The Group has little exposure to credit and cash fl ow risk. It is, and has been throughout the year under review, the Group's policy that no trading in fi nancial instruments shall be undertaken. The maximum credit exposure of fi nancial instruments within the scope of IAS 39, without taking account of collateral, is represented by the balance sheet carrying amount for trade receivables and prepayments.
The main risks arising from the Group's fi nancial instruments are interest rate/liquidity risk and foreign currency risk. The policies for managing these risks are summarised below and have been applied throughout the year.
Interest Rate/Liquidity RiskCash balances are placed so as to maximise interest earned while maintaining the liquidity requirements of the business. The directors regularly review the placing of cash balances.
The gross overdraft facility provided by the Group's principal bankers is £500,000 which is subject to renewal annually.
Foreign Currency RiskThe Group has overseas operations in Germany, the USA, Taiwan and Singapore. As a result, the Group's sterling balance sheet could be affected by movements in the Euro, US dollar, Singapore dollar and Taiwan dollar to sterling exchange rates. The Group has no signifi cant currency exposure generating gains or losses within the income statement. Foreign currency assets and liabilities generate no gain or loss in the income statement because they are denominated in the currency of the Group operation to which they belong. At 31st March 2007, the Group had net monetary assets denominated in foreign currencies of £2.660 million (2006 - £7.619 million), of which approximately 49% (2006 - 24%) was denominated in US dollars and 29% (2006 - 64%) was denominated in Euros.
Financial Assets Floating Rate Floating Rate 2007 2006 £ £Sterling 563,533 750,922US Dollar 2,511,994 4,746,989Singapore Dollar 6,283 11,165Euro (87,317) 174,496Taiwan Dollar 5,583 24,072 3,000,076 5,707,644
The fl oating rate assets consist of short term cash deposits. There were no fi xed rate fi nancial assets at either year-end.The fair value of the Group's fi nancial assets are considered to be the same as this carrying value.
Financial Liabilities Floating Rate Floating Rate 2007 2006 £ £Sterling 4,000,000 4,000,000
The principal fi nancial liabilities includes a bank loan denominated in sterling which bears interest at a rate of 0.375% above LIBOR and is repayable upon receipt of three months notice expiring on 2nd July 2007.
20 TRADE AND OTHER PAYABLESAmounts falling due within one year: Group Group Company Company 2007 2006 2007 2006 £ £ £ £ Trade payables 973,850 1,260,418 - -Other taxation and social security costs 607,274 748,202 102,058 110,833Other payables 148,223 669,523 105,704 141,753Accruals and deferred income 518,532 618,910 14,632 40,813 2,247,879 3,297,053 222,394 293,399
NotesTO THE FINANCIAL STATEMENTScontinued
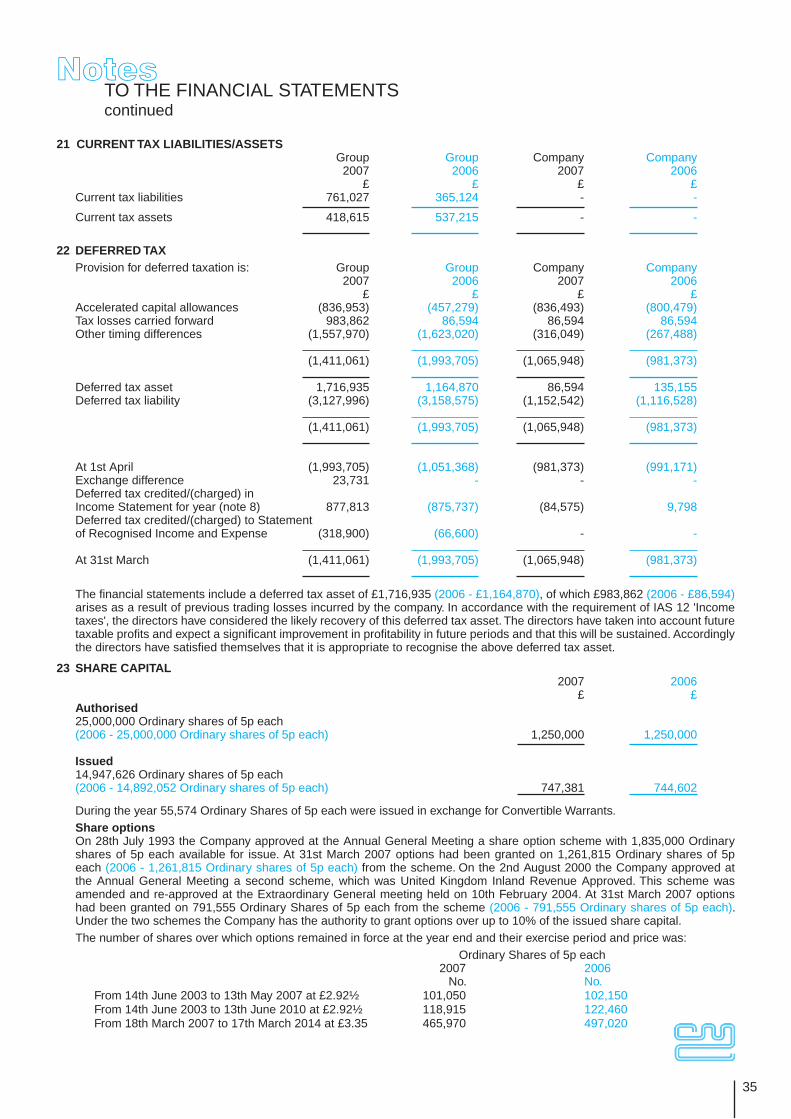
35
21 CURRENT TAX LIABILITIES/ASSETS Group Group Company Company 2007 2006 2007 2006 £ £ £ £Current tax liabilities 761,027 365,124 - - Current tax assets 418,615 537,215 - -
22 DEFERRED TAX Provision for deferred taxation is: Group Group Company Company 2007 2006 2007 2006 £ £ £ £Accelerated capital allowances (836,953) (457,279) (836,493) (800,479)Tax losses carried forward 983,862 86,594 86,594 86,594Other timing differences (1,557,970) (1,623,020) (316,049) (267,488) (1,411,061) (1,993,705) (1,065,948) (981,373) Deferred tax asset 1,716,935 1,164,870 86,594 135,155Deferred tax liability (3,127,996) (3,158,575) (1,152,542) (1,116,528) (1,411,061) (1,993,705) (1,065,948) (981,373)
At 1st April (1,993,705) (1,051,368) (981,373) (991,171)Exchange difference 23,731 - - -Deferred tax credited/(charged) in Income Statement for year (note 8) 877,813 (875,737) (84,575) 9,798Deferred tax credited/(charged) to Statementof Recognised Income and Expense (318,900) (66,600) - -
At 31st March (1,411,061) (1,993,705) (1,065,948) (981,373)
The fi nancial statements include a deferred tax asset of £1,716,935 (2006 - £1,164,870), of which £983,862 (2006 - £86,594) arises as a result of previous trading losses incurred by the company. In accordance with the requirement of IAS 12 'Income taxes', the directors have considered the likely recovery of this deferred tax asset. The directors have taken into account future taxable profi ts and expect a signifi cant improvement in profi tability in future periods and that this will be sustained. Accordingly the directors have satisfi ed themselves that it is appropriate to recognise the above deferred tax asset.
23 SHARE CAPITAL 2007 2006 £ £Authorised25,000,000 Ordinary shares of 5p each (2006 - 25,000,000 Ordinary shares of 5p each) 1,250,000 1,250,000
Issued 14,947,626 Ordinary shares of 5p each (2006 - 14,892,052 Ordinary shares of 5p each) 747,381 744,602
During the year 55,574 Ordinary Shares of 5p each were issued in exchange for Convertible Warrants. Share optionsOn 28th July 1993 the Company approved at the Annual General Meeting a share option scheme with 1,835,000 Ordinary shares of 5p each available for issue. At 31st March 2007 options had been granted on 1,261,815 Ordinary shares of 5p each (2006 - 1,261,815 Ordinary shares of 5p each) from the scheme. On the 2nd August 2000 the Company approved at the Annual General Meeting a second scheme, which was United Kingdom Inland Revenue Approved. This scheme was amended and re-approved at the Extraordinary General meeting held on 10th February 2004. At 31st March 2007 options had been granted on 791,555 Ordinary Shares of 5p each from the scheme (2006 - 791,555 Ordinary shares of 5p each). Under the two schemes the Company has the authority to grant options over up to 10% of the issued share capital.The number of shares over which options remained in force at the year end and their exercise period and price was: Ordinary Shares of 5p each 2007 2006 No. No.
From 14th June 2003 to 13th May 2007 at £2.92½ 101,050 102,150From 14th June 2003 to 13th June 2010 at £2.92½ 118,915 122,460From 18th March 2007 to 17th March 2014 at £3.35 465,970 497,020
NotesTO THE FINANCIAL STATEMENTScontinued

36
24 OTHER SHAREHOLDERS' FUNDS Group Company 2007 2006 2007 2006Convertible warrants £ £ £ £At 1st April 120,230 120,230 120,230 120,230Cancelled (8,287) - (8,287) -Converted in year (111,943) - (111,943) - At 31st March - 120,230 - 120,230 As part of the consideration to acquire Hyperstone AG, 119,363 convertible warrants were issued and are convertible into the same amount of ordinary shares of 5p each in CML Microsystems Plc. 50% of the warrants were converted on 2nd January 2005 and the remainder were converted as they were available.
Group Company 2007 2006 2007 2006 £ £ £ £Capital reserveAt 1st April 4,039,124 4,007,240 4,039,124 4,007,240Issue of Ordinary shares of 5p each 109,164 31,884 109,164 31,884 At 31st March 4,148,288 4,039,124 4,148,288 4,039,124 This reserve is a result of the premium being paid for the issue of shares over their par value.
Share based paymentsAt 1st April 161,869 82,462 161,869 82,462Charged in year 76,102 79,407 76,102 79,407
At 31st March 237,971 161,869 237,971 161,869
The Group has elected to apply the transitional provisions that allow it to apply IFRS 2 to share based payment awards granted after 7th November 2002. Therefore this applies to options granted on the 18th March 2004 which were from the share option scheme which was amended and re-approved at the Extraordinary General Meeting on 10th February 2004. Options are granted with a fi xed exercise price equal to the market price of the shares under option at the date of the grant. The contractual life of an option is 10 years. Awards under the share option scheme are for all employees throughout the Group. Options granted under the share option scheme become exercisable on the third anniversary of the grant date. Options were valued using the Black-Scholes model. The fair value per option granted and the assumptions used in the calculation are as follows:
2007 2006Grant date 18/03/04 18/03/04Share price at grant date £3.35 £3.35Exercise price £3.35 £3.35Number of employees 166 182Shares under option 465,970 497,020Vesting period (years) 3 3Expected volatility 23.40% 23.40%Option life (years) 10 10Expected life (years) 3.5 3.5Risk free rate 4.40% 4.40%Expected dividend yield 4.34% 4.34%Possibility of ceasing employment before vesting 4.50% 4.50%Fair value per option £0.51 £0.51
NotesTO THE FINANCIAL STATEMENTScontinued

37
24 OTHER SHAREHOLDERS' FUNDS (continued)
The expected volatility is based on 90 day's trading prior to the grant date. The expected life is the average expected period to exercise. The risk free rate of returns the yield to redemption on UK Gilt strips with 4 year maturity. A reconciliation of option movements over the year is shown below: Exercisable from 14th June 2003 Exercisable from 18th March 2007 2007 2006 2007 2006 No. No. No. No.Outstanding 1st April 224,610 245,035 497,020 533,820Granted - - - -Exercised - (11,090) - -Forfeited (4,645) (9,335) (31,050) (36,800)
Outstanding 31st March 219,965 224,610 465,970 497,020
Group Company 2007 2006 2007 2006 £ £ £ £Merger reserveAt 1st April and 31st March - - 315,800 315,800 This reserve relates to the acquisition in 1995 of Integrated Micro Systems Limited. In accordance with the provisions of Section 131 of the Companies Act 1985, the Company transferred to merger reserve the premium arisng on shares issued as part of the acquisition.
Foreign exchange reserveAt 1st April 309,726 (40,386) Retranslation of overseas subsidiaries (346,011) 350,112
At 31st March (36,285) 309,726
This reserve represents the foreign exchange differences arising from the retranslation of fi nancial statements of foreign subsidiaries.Accumulated Profi ts Group Company 2007 2006 2007 2006 £ £ £ £At 1st April 15,808,960 14,584,608 6,808,000 6,082,337(Loss)/Profi t for the period (2,618,419) 2,632,529 600,644 2,289,240Dividends paid (1,563,665) (1,563,577) (1,563,665) (1,563,577)Net actuarial gains 1,063,000 222,000 - -Deferred tax on actuarial gains (318,900) (66,600) - -Warrants converted/lapsed 8,287 - 8,287 - At 31st March 12,379,263 15,808,960 5,853,266 6,808,000
25 EXCEPTIONAL RESTRUCTURING COSTS £ £Provision at 1st April 147,234 420,000Provision made in year - -Costs incurred in year (117,370) (272,766) Provision at 31st March 29,864 147,234
The above provision is in respect of anticipated costs of expenditure incurred during closing down the group's operations in Rochester, Kent and relocating the business to the purpose-built facility in Maldon, Essex.
26 CAPITAL COMMITMENTS Capital commitments which have been contracted for but for which no provision has been made in these fi nancial statements are £Nil (2006 - £50,505).
NotesTO THE FINANCIAL STATEMENTScontinued
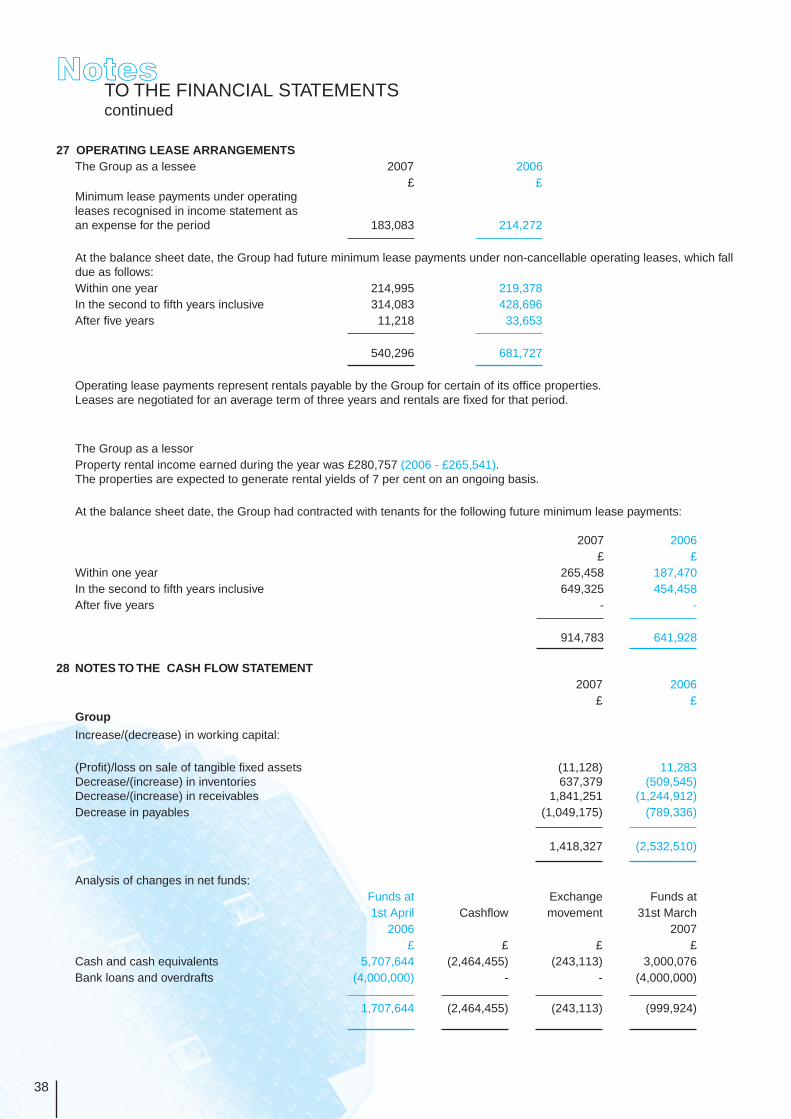
38
27 OPERATING LEASE ARRANGEMENTSThe Group as a lessee 2007 2006 £ £ Minimum lease payments under operatingleases recognised in income statement as an expense for the period 183,083 214,272
At the balance sheet date, the Group had future minimum lease payments under non-cancellable operating leases, which fall due as follows: Within one year 214,995 219,378 In the second to fi fth years inclusive 314,083 428,696After fi ve years 11,218 33,653
540,296 681,727
Operating lease payments represent rentals payable by the Group for certain of its offi ce properties. Leases are negotiated for an average term of three years and rentals are fi xed for that period.
The Group as a lessor Property rental income earned during the year was £280,757 (2006 - £265,541). The properties are expected to generate rental yields of 7 per cent on an ongoing basis.
At the balance sheet date, the Group had contracted with tenants for the following future minimum lease payments:
2007 2006 £ £Within one year 265,458 187,470In the second to fi fth years inclusive 649,325 454,458After fi ve years - -
914,783 641,928
28 NOTES TO THE CASH FLOW STATEMENT 2007 2006 £ £Group
Increase/(decrease) in working capital:
(Profi t)/loss on sale of tangible fi xed assets (11,128) 11,283 Decrease/(increase) in inventories 637,379 (509,545) Decrease/(increase) in receivables 1,841,251 (1,244,912)Decrease in payables (1,049,175) (789,336)
1,418,327 (2,532,510)
Analysis of changes in net funds: Funds at Exchange Funds at 1st April Cashfl ow movement 31st March 2006 2007 £ £ £ £Cash and cash equivalents 5,707,644 (2,464,455) (243,113) 3,000,076Bank loans and overdrafts (4,000,000) - - (4,000,000) 1,707,644 (2,464,455) (243,113) (999,924)
NotesTO THE FINANCIAL STATEMENTScontinued
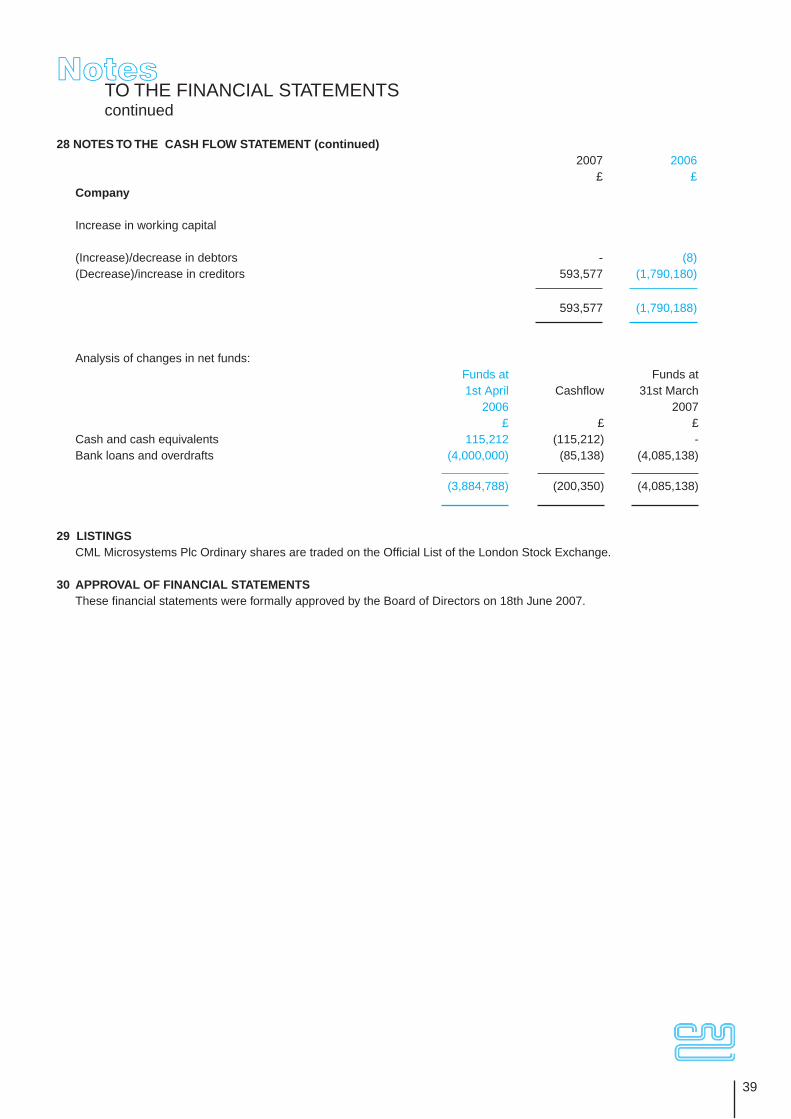
39
28 NOTES TO THE CASH FLOW STATEMENT (continued) 2007 2006 £ £Company
Increase in working capital
(Increase)/decrease in debtors - (8)(Decrease)/increase in creditors 593,577 (1,790,180)
593,577 (1,790,188)
Analysis of changes in net funds: Funds at Funds at 1st April Cashfl ow 31st March 2006 2007 £ £ £Cash and cash equivalents 115,212 (115,212) -Bank loans and overdrafts (4,000,000) (85,138) (4,085,138) (3,884,788) (200,350) (4,085,138)
29 LISTINGSCML Microsystems Plc Ordinary shares are traded on the Offi cial List of the London Stock Exchange.
30 APPROVAL OF FINANCIAL STATEMENTSThese fi nancial statements were formally approved by the Board of Directors on 18th June 2007.
NotesTO THE FINANCIAL STATEMENTScontinued

40
Notice is hereby given that the Annual General Meeting of CML Microsystems Plc will be held at Layer Marney Tower, Nr. Colchester, Essex, CO5 9US, on Wednesday 1st August 2007 at 11am to transact the following business:
ORDINARY BUSINESSOrdinary Resolutions1. To receive and adopt the Company’s fi nancial statements and the reports of the directors and auditors for the year ended 31st
March 2007.
2. To receive and approve the Directors' Remuneration Report for the year ended 31st March 2007.
3. To declare a dividend for the year ended 31st March 2007.
4. To re-elect G. J. Bates who retires from the Board by rotation.
5. To re-appoint Baker Tilly UK Audit LLP as auditors and authorise the directors to approve their remuneration.
SPECIAL BUSINESSSpecial ResolutionsTo consider, and if thought fi t, pass the following resolutions as Special Resolutions:1. To renew the authority as given in the general meeting on 27th August 1999 to the Company to make market purchases of the
Ordinary shares of 5p each in the capital of the Company as follows: That the Company be and is hereby authorised to make market purchases (within the meaning of Section 163 of the Companies
Act 1985) of the Ordinary shares of 5p each in the capital of the Company provided that:(i) the maximum number of Ordinary shares hereby authorised to be acquired is 2,145,595 shares representing approximately
15% of the current issued share capital;(ii) the minimum price which may be paid for such shares is the nominal value of 5p per share;(iii) the maximum price (excluding expenses) which the Company may pay for each such share cannot be more than the higher of:
(a) 105% of the average market value of an Ordinary share for the fi ve business days prior to the day the purchase is made;(b) the value of an Ordinary share calculated on the basis of the higher of: (1) the last independent trade of; or (2) the highest current independent bid for, any number of Ordinary shares on the trading venue where the purchase is carried out;
(iv) the authority hereby conferred shall expire on the date of the next Annual General Meeting of the Company or the date fi fteen months after the passing of this resolution (whichever shall be the earlier) unless and to the extent that such authority is renewed or extended prior to or on such date and
(v) the Company may make a contract to purchase its own shares under the authority which will or may be executed wholly or partly after the expiry of such authority and may make a purchase of its own shares in pursuance of any such contract.
2. The directors be given power under Section 95 of the Companies Act 1985 to allot equity securities (as defi ned in Section 94 of the Act) pursuant to the general authority to allot securities in accordance with Section 80 of the Act as given in the Annual General Meeting on 3rd August 2005 as if the pre-emption provisions of Section 89(1) of the Act did not apply to such allotment. The power shall be limited to the allotment of equity securities up to an aggregate nominal amount of £35,750 (representing 715,000 Ordinary Shares, being 5% of the Company’s issued share capital) and shall expire at the next Annual General Meeting of the Company or 2nd November 2007 (whichever is the sooner) unless any offer or agreement is made before expiry of this power, in which case the directors may allot securities pursuant to such offer or agreement as if the power granted by this resolution had not expired.
Oval Park By order of the BoardLangford, MALDON N.G. Clark Company SecretaryEssex CM9 6WG 18th June 2007
General Notes1. A member who is entitled to attend and vote at the Annual General Meeting is entitled to appoint a proxy to attend and vote
instead of him. A proxy need not also be a member of the Company. A proxy card is enclosed.
2. It is proposed to pay the dividend, if approved, on 3rd August 2007 to shareholders registered on 6th July 2007.
3. To be entitled to attend and vote at the Annual General Meeting (and for the purpose of determining the number of votes a member may cast), members must be entered on the Register of Members of the Company by close of business on 30th July 2007.
NoticeOF ANNUAL GENERAL MEETING

ShareholderINFORMATION
Contact Information
CML Microsystems Plc (Company Registered Number: 944010 England)Oval ParkLangfordMaldonEssexCM9 6WGEngland
Tel: +44 (0)1621 875500Fax: +44 (0)1621 875606e-mail: [email protected]: www.cmlmicroplc.com
Financial Calendar
20071st August Annual General Meeting4th August Dividend payment date (subject to approval
at Annual General Meeting)30th September Half-year end20th November Anticipated date for Interim Results
200831st March Year end17th June Anticipated date for preliminary
announcement of Year-end 2008 Results
TechMark 100 Index - for year ended 31st March 2007
CML Microsystems Plc Share Price - for year ended 31st March 2007
FTSE 100 Index - for year ended 31st March 2007

Oval Park - Langford - Maldon - Essex - CM9 6WG - England Telephone +44 (0)1621 875500 - Facsimile +44 (0)1621 875606
e-mail: [email protected] - http://www.cmlmicroplc.com