Embed Size (px)
Citation preview

Status of water use efficiency of main crops
SOLAW Background Thematic Report - TR07SO
LAW
TR
07Victor O. Sadras1, Patricio Grassini2 and Pasquale Steduto3
1 South Australian Research & Development Institute, Waite Campus, Australia
2 Department of Agronomy & Horticulture, University of Nebraska – Lincoln, United States
3 Land and Water Division, FAO, Rome, Italy


Acknowledgements
We are grateful for the support provided by the Food and Agriculture Organization of the United Nations (FAO), the Grains Research and Development Corporation of Australia, the River Murray Improvement Program, the Nebraska Corn Board, the Nebraska Soybean Board, the Agricultural Research Division of the University of Nebraska-Lincoln and Nebraska Public Power District.
Table of contents
Executive summary 7Key messages 11
1. Introduction 152. Definitions 153. Climate and plant factors affecting water productivity 164. Effects of nitrogen supply on water productivity 195. Improving water productivity: recognising trade-offs 196. Case studies 22 6.1 Wheat in southeastern Australia, Mediterranean Basin, China Loess Plateau and North American Great Plains 22 6.2 RainfedsunflowerintheWesternPampasofArgentina 24 6.3 Rice in the lower Mekong River Basin 27 6.4 Irrigated maize in the Western US Corn Belt 29 6.5 Millet in the Sahel region of Africa 337. Conclusions 368. References and data sources 37

SOLAW BACKGROUND THEMATIC REPORT - TR074
List of figures
Inverse relationship between yield per unit water supply and water supply in rice. Water supply is 1. seasonal irrigation plus effective rainfall. Inset shows the relationship between yield and water supply; linesarefittedboundaryfunctions.
Nitrogendriventrade-offbetweenwaterproductivityandnitrogenutilizationefficiencyin(a)flooded2. and (b) aerobic ‘Apo’ rice in the Philippines, and (c) rainfed and (d) irrigated maize in the United States. Water productivity is yield per unit irrigation + rainfall (a,b) or yield per unit evapotranspiration (c,d). Inall casesnitrogenutilizationefficiency isgrainyieldperunitnitrogenuptake (excluding rootN).Adapted from (82, 83).
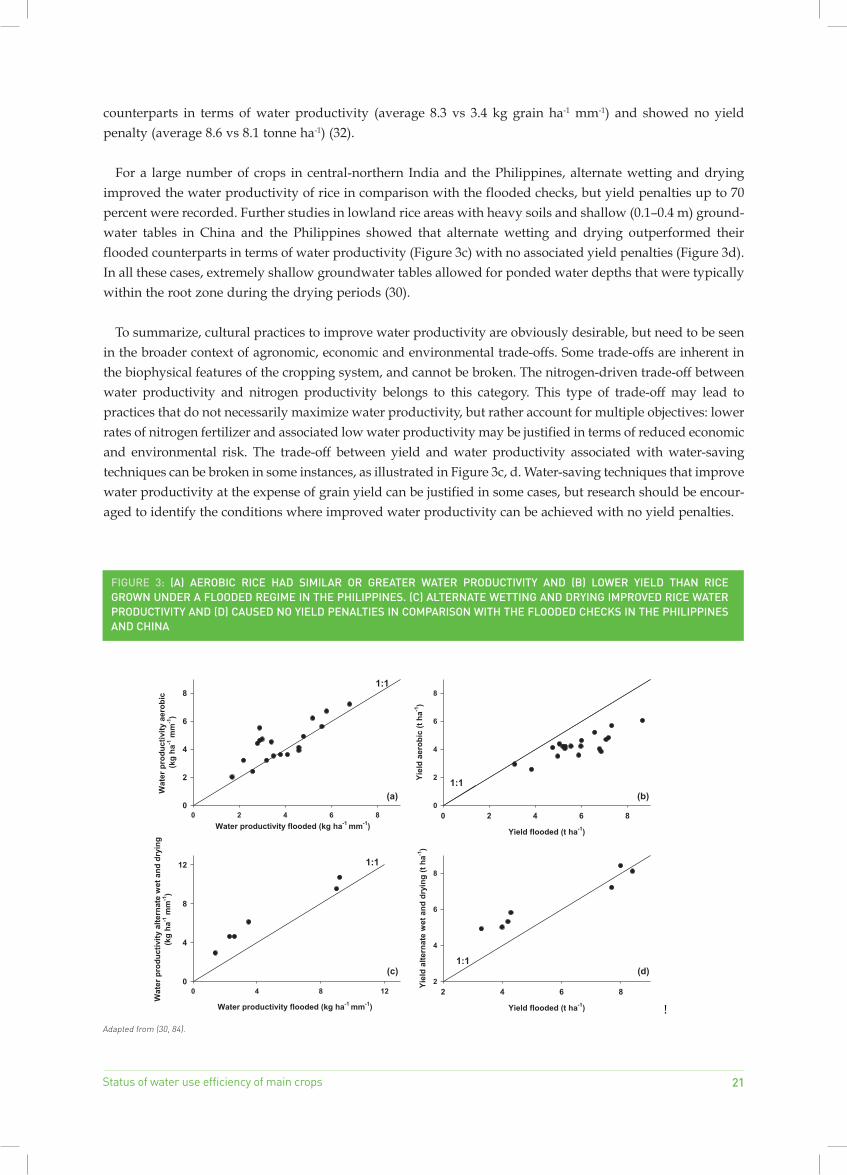
(a) Aerobic rice had similar or greater water productivity and (b) lower yield than rice grown under a 3. floodedregimeinthePhilippines.(c)Alternatewettinganddryingimprovedricewaterproductivityand(d)causednoyieldpenaltiesincomparisonwiththefloodedchecksinthePhilippinesandChina.Adapted from (30, 84).
Relationship between wheat grain yield and seasonal evapotranspiration in four mega-environments. 4. Line parameters are x-intercept = 60 mm and slope = 22 kg grain ha-1 mm-1 (adapted from (33).
(a)Relationshipbetweengrainyieldandseasonalwatersupplyinfarmers’fieldsintheWesternPampas5. (open symbols; n = 169). Data from small-plot (56 m2) fertilizer trials are also shown (closed symbols; n = 231). Water supply is available soil water at sowing plus sowing-to-maturity rainfall. (c) Relationship betweenyieldandevapotranspiration forsunflowercrops inAustralia,Lebanon,Spain,Turkey,andUnited States. Adapted from (79) and references cited therein.
Waterproductivityofsunflowercropsinresponsetofertilizer.Theresponsewascalculatedasthediffer-6. ence in yield per unit water supply between fertilized and non-fertilized crops. Fertilizer treatments were 20 kg P ha-1 (P-20), 40 kg N ha-1 (N-40), 80 kg N ha-1 (N-80), and combined N and P (N-80 + P-20). Mean yield per unit water supply of non-fertilized crops was 3.5 kg grain ha-1 mm-1. Significanceofpaired t-test for the comparison between fertilized and non-fertilized crops is shown for each treatment. Data collected from 32 site-years in the Western Pampas by Bono et al. (44).
Mekong River Basin yield per unit evapotranspiration of rice at a regional scale, in kg grain ha7. -1 mm-1. Adapted from (46)
(a) Relationship between grain yield and seasonal water supply (available soil water at sowing plus 8. sowing-to-maturity rainfall and applied irrigation) for maize crops grown under near-optimal manage-mentintheWesternUSCornBelt.Thedatabaseincludedawiderangeofenvironmentsandirrigationschedules;noneofthefieldshadobviouslimitationsduetonutrientdeficiencies,diseases,insect,weeds,orhail.(b)Farmers’irrigatedyieldsintheTri-BasinNRDasafunctionofseasonalwatersupply(+).Tri-Basincounty-levelaveragerainfedyieldsarealsoshownforcomparison(•).

Status of water use efficiency of main crops 5
Actual recommended plant populations for irrigated and rainfed maize as a function of longitude in the 9. Western US Corn Belt. At some eastern locations, symbols for irrigated and rainfed crops overlap. Data provided by Pioneer Agronomy Sciences, Pioneer Hi-Bred International, Inc. Adapted from (49).
Maize yield, irrigation, and water productivity under different combinations of irrigation system (surface 10. gravity; pivot), rotation (soybean-maize [S-M]; maize-maize [M-M]), and tillage (conservation [strip-, ridge-, or no-till]; conventional [disk]). Water productivity is the ratio between the difference between irrigatedandrainfedyield(ΔY)andtheamountofappliedirrigation.Errorbarsindicate±SE.Differ-ences(Δ)forselectedcomparisonsbetweentillagesystemsareshown.Adaptedfrom(48).
Relationship between grain yield and evapotranspiration for crops in Western Sahel; data from Egypt 11. andUnitedStatesareincludedforcomparison.Thesolidlinehasaslope=16.7kggrainha-1 mm-1 and an x-intercept = 158 mm, both derived from (54). Data from (54, 58, 85-96).
List of tables
Maximum yield per unit seasonal transpiration and examples of reported yield per unit seasonal 1. evapotranspirationformajorannualcrops.Yieldperunitseasonaltranspirationiscalculatedastheratiobetween grain yield and seasonal transpiration or the slope of boundary function relating grain yield and seasonal evapotranspiration.
Environmental and crop variables for the three categories of crops derived from Figure 5a. Category 2. 1:availablewater>630mm;Category2:watersupply≤630mmandlargeyieldgap;andCategory3:watersupply≤630mmandsmallyieldgap.Adaptedfrom(79).
Share of rice acreage, contribution of lowland rice to total rice production, lowland rice average yield 3. (2003),coefficientofvariationofrainduringthelowlandriceseason(amongprovinceswithinacountry),supplementary irrigation requirement for lowland rice, and maximum water productivity at regional (provincial) level in the lower Mekong River Basin. Adapted from (46).
Typicalpeakleafareaindex(LAI),modelledwaterandnitrogenstressindices,andmeasuredrangesof4. non-productive components of the water budget of millet crops in the Western Sahel region. Compari-son of sorghum and millet harvest index is from common locations and growing conditions in Nebraska, United States. Sources: LAI (80), water and nitrogen stress indices (57), water budget components (54), andharvestindex(58).WaterandnitrogenstressindiceswerecalculatedforTara,Niger,inaseasonwhenseasonal rainfall was 65 percent of normal; indices range from 0 (no stress) to 1 (maximum stress).

Abbreviations and glossary
oC Degree CelsiusE Soil evaporationET EvapotranspirationETo Reference evapotranspirationFAO TheFoodandAgricultureOrganizationoftheUnitedNationsha HectareICRISAT InternationalCropsResearchInstitutefortheSemi-aridTropicskg KilogramkPa Kilopascal (Pascal is a measure of force per unit area)LAI Leaf area indexMJ Mega Joulemm MillimeterN NitrogenNRD Natural Resource DistrictsP PhosphorusR&D Research and DevelopmentT TranspirationUS United StatesWP Water productivity

Status of water use efficiency of main crops 7
Executive summary
Land and water scarcity are major constraints to food production required for meeting the quantitative and qualitativeshiftsoftheworld’sdemandinthemid-twenty-firstcentury.Whereaslandandwateravailabilityareconstrainedonaglobalscale,thereareimportantregionalandcrop-specificdifferencesthatneedtobeunderstood,quantifiedandmanaged.
Thisreportassessesthewaterproductivityofthemajorgraincropsinfivecasestudiesfromenvironmen-tally, technologically and culturally diverse regions that cover the whole range from subsistence to high-tech production systems. These include: (i) rainfedwheat in theMediterranean Basin, NorthAmerican GreatPlains, China Loess Plateau and southeast Australia; (ii) rainfed sunflower in central Argentina; (iii) irrigated and rainfed rice in the lower Mekong River Basin; (iv) irrigated maize in the Western Corn Belt of the United States; and (v) rainfed millet in the Sahel region of Africa. For each case study, we outline biophysical and agronomic features of the cropping system and the approach used to quantify water productivity; we compare actual productivity against relevant benchmarks, and identify opportunities for improvement.
Twocomplementaryapproacheswereused.First,waterproductivitywascalculatedasaratio,forexamplebetween yield and water use, with corresponding units of kilograms of grain per hectare per millimetre water use (kg grain ha-1 mm-1). Second, we used the concept of boundary functions whereby yield is plotted against wateruse,andalinerepresentingthemaximumyieldthatcanbeachievedforagivenwateruseisfitted.Thisboundary function provides a benchmark, and the gaps between the boundary function and actual yield at a given water use helps identify environmental and management constraints.
Yieldperunitcropwateruseofwheatwasanalysedusingdata fromdryenvironments insoutheasternAustralia, the North American Great Plains, China Loess Plateau and the Mediterranean Basin. Average yield per unit water use was 9.9 kg grain ha-1 mm-1 for southeastern Australia, 9.8 kg grain ha-1 mm-1 for the China Loess Plateau, 8.9 kg grain ha-1 mm-1 for the northern Great Plains of North America, 7.6 kg grain ha-1 mm-1 for the Mediterranean Basin, and 5.3 kg grain ha-1 mm-1forthesouthern-centralGreatPlains.Thevariationbetween regions was largely accounted for by evaporative demand around flowering. For the pooled data, a common boundary function was derived with a slope of 22 kg grain ha-1 mm-1. Few crops, however, were close to this upper limit. After accounting for the effects of atmospheric demand, the average gap between actual and maximum yield per unit water use was 68 percent for the southern Great Plains of North America, 63 percent for the Mediterranean Basin, 56 percent for China Loess Plateau, Northern Great Plains and south-east Australia. A subset of the data comprising crops in the Mallee region of southeast Australia was used to assess putative causes of under-performing crops. Low availability of phosphorus, late sowing, and subsoil chemical constraints, including sodicity, alkalinity and salinity, all contributed to low water productivity.
Adequate nutrition could improve water productivity, but unproductive soil evaporation could still be large in well-fertilized crops. Reduced row spacing, early vigour, and good supply of nutrients can favour rapid groundcover,reducesoilevaporationandhenceincreasewaterproductivity.Thebenefitsofthesepracticesthat favour rapid use of water early in the season should be weighed against the depletion of soil–water reserves for critical stages of grain set and filling. Likewise, a trade-off needs to be considered for tillage and stubble management to increase water available in the soil and to reduce soil evaporation, as these practices could increase the probability of deep drainage. Early sowing, and a greater proportion of seasonal growth in

SOLAW BACKGROUND THEMATIC REPORT - TR078
coldwintermonths,couldenhancewaterproductivity.Therearefewoptionsfordealingwithuncertainrainsconstraining early sowing, except for good agronomy (e.g. weed control) to allow sowing with the first rain, or genetic improvement (e.g. long coleoptiles) to allow sowing into subsurface moisture before rain. Often there are trade-offs between the yield benefits of early sowing and frost risk.
Yield per unit water supply was compiled for rainfed sunflower in commercial farms of the westernPampas, a region that comprises approximately 4.5 million ha of cropland area in semi-arid central Argentina. Thiscasestudywasselectedasanexampleofahigh-tech,rainfedcroppingsystem.Averageon-farmwaterproductivity ranged from 1.1 to 8.0 kg grain ha-1 mm-1. A boundary function, with a slope of 9.0 kg grain ha-1 mm-1,delimitedthemaximumyieldovertherangeofwatersupply.Thisboundaryfunctionwasalsosuitablefor analysing the water productivity of rainfed and irrigated sunflower grown in other semi-arid environ-ments including the Mediterranean Basin, the Great Plains of North America and eastern Australia. Although crops were grown under good management practices, there was a common, sizeable gap between actual yield andtheboundaryfunctionforagivenwateruse.Thegapswereassociatedwithhighsoilevaporation,highvapour pressure deficit and untimely water supply during the growing cycle in relation to critical crop stages. Nutrient availability and its interaction with soil water at sowing is perhaps the most important leverage point for increasing yield and water productivity. Other factors, such as diseases, weeds and lodging also require attention.
YieldperunitwateruseofriceinthelowerMekongRiverBasinwasanalysedataprovincialscale.TheMekong River Basin comprises 795 000 km2 and 65 million inhabitants across six countries, that is China and MyanmarintheUpperMekongandLaos,Thailand,Cambodia,andVietnaminthelowerMekong,thefocusof thisanalysis.Vietnamhas twocontrastingregions in theBasin, theCentralHighlandsandtheMekongdelta. Agriculture is the most important activity in the lower Mekong and accounts for 80–90 percent of the waterextractedfromtheriver.ThereisadrycroppingseasonfromNovembertoAprilandawetseasonfromMay to October. While maize, cassava and sugar cane are the main upland crops, rice is the predominant crop in the basin, and lowland rainfed rice grown in the wet season accounts for at least half of total rice produc-tion. Between 1993 and 2003, maximum yield per unit water use was 3.0 kg grain ha-1 mm-1forThailand,3.3kg grain ha-1 mm-1 for Cambodia, 5.8 kg grain ha-1 mm-1 for Laos and 7.7 kg grain ha-1 mm-1forVietnam.Thesecompare with a benchmark of 22 kg grain ha-1 mm-1.
Trends of increasingwater productivity over this short-time serieswere observed inLaos andboth theMekongdeltaandCentralHighlandregionsofVietnam.Owingtothelargeshareoflowlandriceinthesecropping systems, increasing the water productivity of rice would increase the water productivity of the whole basin. Main opportunities for improvement include using high-yielding varieties, increasing application of fertilizer, herbicides and pesticides and supplementary irrigation. High-value upland crops such as coffee, vegetables and peanuts outperform rice in terms of economic return per millimetre of water use. Increasing the share of these high-value upland crops may increase farm income per unit of water use.
YieldperunitwatersupplyofirrigatedcommercialmaizecropsinthewesternUSCornBeltwasanalysedtohighlightfeaturesofahigh-input,irrigatedcroppingsystem.TheWesternUSCornBeltcomprisesabout7.3 million ha cropped to maize. Irrigated maize represents 43 percent of the total maize area, 70 percent of the total irrigated cropland in the region, and accounts for 58 percent of the total annual maize production of 60 million tonnes in the Western Corn Belt. Surface and sprinkler irrigation systems are in a 1:4 ratio of irrigated land area. Grain yield averaged 13 tonnes ha-1 and ranged between 9.5 to 17.2 tonnes ha-1.Totalwatersupplyduring the growing season comprised available soil water at sowing, sowing-to-maturity rainfall, and applied

Status of water use efficiency of main crops 9
irrigation in a 25:45:30 ratio. Average applied irrigation ranged from 213 to 347 mm across seasons. Water productivity of irrigated crops ranged from 8.2 to 19.4 kg mm-1 ha-1 (average: 14 kg mm-1 ha-1). Excess irrigation was identified in almost half of the fields where crops exceeded the apparent 900 mm threshold required to maximizeyield.Yieldperunitirrigationrangedfrom44to77kggrainha-1 mm-1 under pivot and from 28 to 42 kg grain ha-1 mm-1undergravity.Yieldperunitwatersupplyofirrigatedmaizecanbeimprovedthroughchanges to the irrigation system, irrigation management or both.
Irrigation schedules based on real-time crop requirements, soil water monitoring, and short-term forecasts appear to be sound options for increasing water productivity in current irrigated maize fields in the Western US Corn Belt. Comparison of actual and attainable yield under current management practices indicated that farmers are operating at 10–20 percent below maximum productivity. While fine-tuning current management practices (e.g. plant population density, hybrid maturity, rotation) may lead to a limited increase in yield and water productivity (< 10 percent), better management of irrigation water appears to be the most feasible way to increase water productivity. Fields under pivot, conservation tillage and maize-soybean rotation have characteristically higher yield per unit irrigation.
Yieldperunitwaterusewascompiledformillet in thewesternSahelregionofAfricaasanexampleofalow-inputcroppingsystem.TheSahelisaneast-west,3millionkm2 semi-arid transition belt between the Sahara dessert and the wooded Sudanian savannah. Drought, high temperature and low soil fertility are major constraints to crop production in the region. Annual rainfall varies between 200 and 600 mm, with coefficients of variation between 15 and 30 percent. Millet is commonly grown in low fertility, sandy upland soils, which are often prone to crusting. It is grown on its own or intercropped, and residues provide valuable fodder in systemswherecropandanimalproductionarehighlyintegrated.Variablecombinationsofsoilevaporation,runoff and deep drainage comprise a significant unproductive component of the crop water budget.
We collected millet grain yield and water-use data from published sources, mostly from the West African SahelgenerallyassociatedwiththeInternationalCropsResearchInstitutefortheSemi-aridTropics(ICRISAT).Data from Egypt, a more favourable African environment, and the United States, to represent higher-input cropping systems, were included in the analysis for comparison. For a collection of 58 crops in the Sahel, millet yield per unit water use averaged 3 kg grain ha-1 mm-1. A boundary function with a slope of 16.7 kg grain ha-1 mm-1capturedtheupperlimitofwaterproductivityforSahelianmilletcrops.Thisboundaryfunctionalsoapplied to the more favourable environments of Egypt and North America. Most millet crops under Sahelian conditions were well below this boundary function.
Environmental, management and plant-related factors contributed to the low water productivity of millet in the Sahel. Low soil fertility and sparsely sown crops mean ground cover is typically low, i.e. peak leaf area indicesarenormallybelow1,orbelow2inmoreintensivesystems.Thisinturnfavoursunproductivesoilevaporation. Sandy soils, which are prone to crusting, favour episodic runoff and deep drainage. Indeed, a series of experimental and modelling studies converge to conclude that production in these environments is not necessarily limited by water but rather by agronomy and inputs, as there is often residual water in the soil at maturity, large unproductive losses of water are common, and nutrient stress is often more severe than water stress.
Improving water productivity of millet in dry, hot environments of Africa would require higher inputs, chiefly large fertilizer doses that need to be considered in the context of risk, trade-offs, and social, economic and infrastructure barriers for the shift to higher input agriculture. Likewise, the low harvest index of millet

SOLAW BACKGROUND THEMATIC REPORT - TR0710
that contributes to its low water productivity needs to be considered in the context of a trade-off between grain production and valuable crop residues. For example, some popular landrace millet varieties in India are over 3 m tall, and are valued for the large amount of fodder they provide, even though grain yields are relatively low.
Improvement in grain yield and water productivity arise from breeding for superior varieties, better agronomic practices and the important, but often overlooked, synergy between breeding and agronomy. Long-term enhancement of yield potential with no substantial change in crop water uptake has increased the water productivity of most grain crops. Further genetic improvement in water productivity, i.e. ‘more crop per drop’ can contribute to improvement in yield. More likely gains, however, would derive from management practices that improved the capacity of crops to capture water.
Thereisanobviousneedforagronomicsolutionstoclosethecommonandoftenlargegapbetweenactualand attainable yield per unit of water use demonstrated for all five case studies in this report. Whereas genetic and agronomic solutions are not mutually exclusive, it has been argued that agronomic practices to narrow the gap between attainable and actual yield per unit water use are a more effective investment of scarce R&D funds, particularly for smallholder farmers. Moreover, the practices required to close this gap are already known for many crops and cropping systems; solutions in these cases involve efforts to provide extension, education and policy development to remove barriers to adoption of such practices.
Theparticularpracticesrequiredtoclosethegapbetweenattainableandactualyieldperunitwateruseare specific for a given crop and cropping system, but some elements seem to be widespread such as timely sowing, effective control of weeds, arthropod pests and diseases and adequate fertilization. As a rule for winter crops, the earliest sowing compatible with frost risk would maximize grain yield and water productiv-ity in association with favourable temperature, radiation and humidity. For crops with broad thermal adapta-tion such as chickpea and sunflower, massive improvement in water productivity results from shifting the growing season from spring-summer to autumn-winter, provided diseases and weeds are properly managed. Nutrient availability, particularly nitrogen and phosphorus, are critical to high yield and water productivity.
Trade-offsbetweenwaterproductivityandnutrientuseefficiencyneedtobeconsideredbecausemaximiz-ing water productivity in some farming systems may require nitrogen rates that are too costly, too risky or environmentallyunsound.Thisisparticularlyimportantwithhighfertilizer-to-grainpriceratio,inenviron-ments prone to nitrogen leaching, or where biophysical, social, economic or infrastructure factors constrain the use of fertilizer. Likewise, trade-offs between yield and water productivity, which are mediated by amount and method of water supply are common. All these trade-offs need to be considered, as the aim of improving water productivity on its own is not necessarily the best pathway to sustainability involving specific produc-tion, environmental and social targets.

Status of water use efficiency of main crops 11
Key messages
ThereisaneedtoclosethecommonandoftenlargegapbetweenactualandattainableyieldperunitI. water consumption.
Land and water scarcity are major constraints to the production of food required to meet the quanti-1. tativeandqualitativeshiftsoftheworld’sfooddemandinthemid-twenty-firstcentury.Thescarcityof these resources is further worsened by climate change. Whereas land and water availability are constrained on a global scale, there are important regional and crop-specific differences that need to be investigated, quantified, and managed. Any increase in productivity of one of these two resources will reflect positively on the productivity increase of the other.
Improvements in grain yield and crop water productivity arise from breeding for superior variet-2. ies, from better agronomic and water management practices and from the important, but often overlooked, synergy between breeding and agronomy. While further genetic enhancement can contribute in the medium- and long-term, on-farm best management practices will provide the most immediate and effective way to increase crop water productivity.
Whereas genetic and agronomic solutions are not mutually exclusive, it has been argued that 3. agronomic practices to narrow the gap between attainable and actual yield per unit water use is a more effective investment of scarce financial resources, particularly for smallholder farmers. Moreover, the practices required to close this gap are already known for many crops and cropping systems; solutions in these cases involve efforts to modernize services to farmers (e.g. irrigation delivery systems, extension, etc.) and policy and institutional development to remove the barriers to their adoption.
It must be fully recognized and appreciated that beyond water management, non-water related II. agronomic practices also play important roles in increasing crop water productivity.
While the particular practices required to close the gap between attainable and actual yield per unit 4. waterusearespecifictoagivencropandcroppingsystem,somearecommontomostcases.Theseare timely sowing, on-farm water management including operation and maintenance of water delivery systems for irrigated agriculture, effective control of weeds, arthropod pests and diseases and adequate fertilization.
Trade-offsbetweenwaterproductivityandnutrientrequirementsneedtobeconsideredcarefully:5. maximizing water productivity in some farming systems may require nitrogen rates that are too costly,toorisky,orenvironmentallyunsound.Thisisparticularlyimportantwithhighfertilizer-to-grain price ratio, in environments prone to nitrogen leaching, or where biophysical, social, economic or infrastructure factors constrain the use of fertilizer. Likewise, trade-offs between yield and water productivitythataremediatedbyamountandmethodofwatersupplyarecommon.These,andallother trade-offs need to be considered, as the aim of improving water productivity on its own is not necessarily the best pathway to sustainability as this involves specific production, environment and social targets.

SOLAW BACKGROUND THEMATIC REPORT - TR0712
Beyond physical crop–water productivity, there is much scope for increasing the ‘value’ per unit of III. water used in agriculture by designing and managing agricultural water for multiple uses.
Strategies for increasing the net value of water consumed in agriculture include: increasing yield, 6. reallocating water from low to higher valued uses, lowering the costs of inputs, increasing health benefits and the value of ecological services of agriculture, decreasing social, health and environ-mental costs.
Thescopeforimprovingcrop–waterproductivityvariesbetweenregions,alongthevaluechainfromIV.producer to consumer, and has a nexus with trades.
Thereareareasoftheworldthatalreadyexhibithighphysicalcropwaterproductivity,withlimited7. prospectsforimprovementsusingcurrenttechnology.Thisisthecaseinmanyofthemostproduc-tiveareasoftheworld,suchastheLowerYellowRiverBasin,orinmostofEurope,NorthAmericaandAustralia.Theareaswiththehighestpotentialgainsaresub-SaharanAfricaandpartsofSouth-,Southeast- and Central Asia.
Thereissignificant‘waste’alongthevaluechainfromproducertoconsumer.Thepost-harvesting8. losses (from transport, to conservation, to processing, to packaging, to distribution, etc.) can be relevant insofar as reducing them would already allow a significant increase in water productivity when measured on the basis of production actually reaching consumers. In developing countries, produce waste is close to the beginning of the producer-consumer path, while in developed countries produce waste is close to the end.
While trade is driven by economic and political reasons at the global level, gains in water produc-9. tivity can be achieved by growing crops in places with high water availability and trading them to places with lower water availability.
Thereisacrucialneedtocreateorderintheterminologyanddefinitionsassociatedwith‘efficiency’V.and ‘productivity’ of water use. As scope, diagnosis and objectives of water ‘accounting’ and expected ‘saving’ may be largely misleading.
Thetermefficiencyiswidelyusedbyirrigationspecialiststoexpresstheratiobetweenwateravail-10. ableatdifferentpointsinthesystem.Thus‘conveyanceefficiency’relateswaterdeliveredfromachannel or system of channels to the water diverted into the channel (the excess going to spills, leakage and evaporation from the water surface). Similarly, ‘field application efficiency’ relates water delivered to the plant root zone to the total water delivered to the field (the excess typically going to runoff, percolation below the root zone, or evaporation from the wetted soil surface). Efficiency is a dimensionless ratio and its theoretical limits are between 0 and 1, or between 0 and 100 if expressed as a percentage.
Agronomically,efficiencyisusuallydefinedasaratioofoutput-to-input.Thisdefinitiondoesnot11. scale in the 0-1 range. When evaluating agricultural production systems from the viewpoint of water use, the term water use efficiency refers to production per unit of water used, with units such as kg grain/ha per mm or kg/m3 or US$/m3. However the literature is full of examples where these ‘efficiency’ terms (especially the latter) are misused, or used without clear definition.

Status of water use efficiency of main crops 13
Recently, various analysts have proposed revised terminology that entirely avoids the word 12. ‘efficiency’, thus using (i) hydrologically-based terminology (consumed and unconsumed fraction, recoverable and non-recoverable return flows) for the analysis of resource use, and (ii) productivity terms to describe the effectiveness of the system in using water to produce crops.
Theproposedrevisionsinterminologyarebasedonthreeseparateconsiderations:13.
First, the engineering concept of efficiency is entirely appropriate and valid when designing irriga- -tion systems, estimating potentially irrigable areas for a given cropping pattern, and planning releases to meet field-level demands, but is misleading when water competition and scarcity beyond the boundaries of a project are under consideration (and this is increasingly the case as demand for water increases). The engineering concept of efficiency does not distinguish betweenwater thatis consumed through transpiration and evaporation and water that simply passes, unconsumed, through the system and may (or may not) be recoverable elsewhere for reuse.
Second, when water is scarce and interventions are proposed to improve availability, it is critically -important to have terminology that is consistent across sectors; so that interventions are evaluated on a common basis. For example, most interventions to improve catchment status will involve increases in consumptive use and reductions in runoff volume (albeit that the rate of runoff may be reduced and spread more usefully over time). Investments in low-flow showers and the like reduce the water used in these activities, but since consumption is close to zero the actual savings in water are minimal. Most observers, when told that irrigation efficiency can be improved from 40 to 80 percent would expect consumption to fall, and more water to be available for other uses, just as wouldhappenifthethermalefficiencyofaboilerwasdramaticallyimproved.Thisisnotthecasefor irrigation and terminology based on consumption avoids this confusion. Of course there are situations when improvements in ‘efficiency’ are highly beneficial – when in-stream flows between offtake and drainage return points are improved; where underlying aquifers are saline, reductions in percolation are real water savings that allow increased consumptive use elsewhere.
Third,bydistinguishingclearlybetweenhydrologyandproductionaspectsofwatersystems,far -more clarity is possible in describing the impacts of proposed interventions.
Water productivity, in its broader sense, defines the ratio of the net benefits from crop, forestry, 14. fishery, livestock and mixed agricultural systems to the amount of water consumed to produce those benefits. We can distinguish a physical water productivity, defined as the ratio of mass of product to the amount of water consumed (‘more crop per drop’), and economic water productivity, defined as the ‘value’ derived per unit of water used. In this case the ‘value’ can refer to economic return or to nutrition, or more broadly to any other economic and social benefit (e.g. jobs, welfare, environ-ment, etc.).
TheimpactofsavingmeasuresmustbecarefullyassessedthroughtheapplicationofprovenscientificVI.principles of hydrology, irrigation technology, energy balances and crop physiology that define and constrain the options available.
Theobjectivesofanywaterconservationprogrammeneedtoberigorouslyspecifiedowingtothe15. several implications and trades-off (e.g. water vs energy or vs cost savings).

SOLAW BACKGROUND THEMATIC REPORT - TR0714
While society may have the incentive to increase water productivity, agricultural producers may not. VII.The adoption ofmeasures to improvewater productivity, either operational, technological or infra-structural, will therefore require an enabling policy and an institutional environment that aligns the incentives of producers, resource managers and society.
Status of water use efficiency of main crops 15
1. Introduction
Land and water scarcity are major constraints to the production of food required to meet the quantitative and qualitativeshiftsoftheworld’sdemandinthemid-twenty-firstcentury.Whereaslandandwateravailabilityareconstrainedonaglobalscale,thereareimportantregionalandcrop-specificdifferencesthatneedtobeunderstood,quantified,andmanaged.Inthiscontext,theaimofthisreportistoprovideanassessmentofwaterproductivityusingfivecasestudiesthatcovermajorgraincrops,andabroadtechnologicalrangefromsubsistence to high-tech production systems.
For readers less familiar with crop sciences, this report opens with definitions, and an overview of biophysi-calandagronomicaspectsofwaterproductivityandrelatedconcepts.Trade-offsbetweenwaterproductivityand nitrogen use efficiency and between water productivity and grain yield are briefly discussed to highlight the need to consider water productivity in the relevant agronomic, economic and environmental contexts.
Five case studies have been identified to present a broad spectrum of cropping systems with different climateandsoils,differentcropswithdifferentnutritionalvalueanddifferent levelsof inputs.Thesecasestudies attempt to capture the peculiarities of some of the most relevant food-production regions worldwide, coupledwiththeavailabilityofhigh-qualitydata.Theyinclude:(i)wheatintheMediterraneanBasin,NorthAmerican Great Plains, China Loess Plateau and southeast Australia; (ii) sunflower in central Argentina; (iii) rice in the lower Mekong River Basin; (iv) maize in the Western Corn Belt of the United States; and (v) millet in the Sahel region of Africa. For each case study, we outline biophysical and agronomic features of the cropping system and the approach used to quantify water productivity; we compare actual productivities against relevant benchmarks, and identify opportunities for improvement.
In the closing section of the report, common elements to these five contrasting cropping systems are identi-fied and general opportunities for further improvement of water productivity are proposed. Importantly, trade-offs are emphasized, as the aim of improving water productivity on its own is not necessarily the best pathway to sustainability involving specific production, environmental and social targets.
2. Definitions
Inagriculture,efficiencyistherelationshipbetweenoutputandinputcalculatedasaratio(output/input)orastheslopeofthefunctionalrelationship(Δoutput/Δinput).Relevantoutputsincludecropproductionmeasuredas total biomass, grain yield, or particular yield components such as oil, protein or kilocalories. Depending on the application, production can be expressed as mass (kg ha-1), energy (MJ ha-1) or monetary units (US$ ha-1). Inputsincludewater,nutrients,radiation,fossilenergy,labourandcapital.Whereastheparticulardefinitionofefficiencyuseddependsontheapplicationanddataavailability,themultitudeofpossiblecombinationsofoutputsandinputsmakesexplicitdefinitionshighlyrecommendable.
In the context of water resources, efficiency of water use was originally used from the viewpoint of engineering and irrigation. For example, the ratio between output and input is used to account for conveyance

SOLAW BACKGROUND THEMATIC REPORT - TR0716
efficiency from the water abstraction point to the scheme or application efficiency in the field. Such expression isdimensionless,asbothoutputandinputarewatervolumes,andrangesfrom0to1.TheFoodandAgricul-ture Organization of the United Nations (FAO) has therefore proposed to reserve ‘efficiency’ for engineering applications and ‘water productivity’ for agricultural ratios such as yield per unit evapotranspiration or yield per unit water supply (see Key Messages for further references).
3. Climate and plant factors affecting water productivity
Agronomically,waterproductivity(WP)isdefinedintermsofcropgrainyieldandseasonalevapotranspira-tion, and is conveniently disaggregated in the following components (1)
(1)
whereWPB/Tisshootbiomassperunitseasonalcroptranspiration,Tiscroptranspiration,Eisevaporationfromthesoilsurfaceorfromthepondedwaterlayerinfloodedrice,andHIisharvestindex.Thisexpressionis useful to understand drivers, constraints and opportunities for improvement of water productivity. With reference to equation (1), here we briefly describe the effects of climate factors with emphasis on evaporative demand of the atmosphere and rainfall patterns, and summarize the main plant factors influencing water productivity.
Evaporative demand of the atmosphereTheevaporativedemandof theatmosphere is substantiallydrivenby thevapourpressuredeficitandnetradiation.Thebiologicalrootsoftheinverserelationshipbetweenbiomassperunittranspirationandvapourpressuredeficit arewell established (2).Under isothermal conditionsof theatmosphere (i.e.no change intemperature with height above the crop), the evaporative demand of the atmosphere is essentially driven by netradiation,acircumstanceindicatedasequilibriumevaporation.Thevariabilityinspaceandtimeofthedominantdriversofevaporativedemandhaveleadtosuggesttheuseofreferenceevapotranspiration(ETo)asabetternormalizationfactorthanvapourpressuredeficit(6aand6b).
An important agronomic corollary considering the space and time variability of the evaporative demand is that early sowing of annual crops, when vapour pressure deficit and evaporative demand are typically lower, favours biomass production per unit transpiration, and this often translates to yield per unit evapo-transpiration as illustrated for barley in North America (3) and wheat in Australia (7). Water productivity was increased substantially by shifting from spring to winter sowing of chickpea and sunflower in Mediterranean environments (8, 9). Hence, locations, seasons and sowing dates conducive to low evaporative demand of the atmosphere often enhance yield per unit evapotranspiration.
Rainfall patternAmount,season,sizeandtimingofrainfalleventsallaffectwaterproductivity.Therelationshipbetweenyield and water supply typically conforms to the law of diminishing returns, hence the decline in water

Status of water use efficiency of main crops 17
FiGure 1: inVerSe relatiOnShiP between yield Per unit water SuPPly and water SuPPly in rice. water SuPPly iS SeaSOnal irriGatiOn PluS eFFectiVe rainFall. inSet ShOwS the relatiOnShiP between yield and water SuPPly; lineS are Fitted bOundary FunctiOnS
productivity with increasing water supply, as illustrated in Figure 1. In addition to the inherent decline in water productivity with increasing water supply, excess water can have deleterious effects such as yield and quality reduction associated with waterlogging, favourable conditions for diseases, and leaching of nutrients and agrochemicals.
For a given amount of rainfall, the season has important implications. In general, crops grown on stored soil waterhavealowerE/Tratio(Equation1)thatfavoursyieldperunitevapotranspirationincomparisonwithcrops that rely on in-season rainfall. For a given amount and seasonality of rainfall, dominance of small events increases unproductive soil evaporation whereas dominance of large events favours unproductive runoff and deep drainage (10). For example, modelled median soil evaporation of wheat in eastern Australia ranges from 172 mm in environments where crops rely on in-season rainfall dominated by small rainfall events to 70 mm for crops that rely on stored soil water and large rainfall events (11).
Timingofrainfallaffectswaterproductivitybyprimarilyaffectinggrainsetandsizeandharvest index.Theproportionality between water productivity and harvest index (equation 1) has been demonstrated for rice, maize, sorghum, wheat, sunflower and cotton (12). Critical developmental windows, when crop yield is more sensitive to stress, are broadly from late stem elongation to early post-flowering in wheat, from early stem elongation to flower-ing in barley, two weeks before full heading in rice, from initial bloom to the beginning of seed filling in soybean, from floral initiation to 20 days after flowering in sunflower, the active period of ear elongation in maize, and from the beginning of flowering to the beginning of seed fill for the last seed-bearing node in field peas. Hence, rainfall or irrigation events at this species-specific critical window of grain yield determination generally improve harvest index, yield and yield per unit evapotranspiration. Exceptions to the positive effect of rain during this critical stage could arise if rainfall is associated with persistent low radiation and conditions favouring diseases.
Adapted from (81).

SOLAW BACKGROUND THEMATIC REPORT - TR0718
Other climate factorsVapourpressuredeficit increasesexponentiallywith temperature;hencehigh temperature, andassociatedhighvapourpressuredeficit,wouldreducebiomassperunittranspirationandyieldperunitseasonalevapo-transpiration. High temperature accelerates plant development and this effect is particularly important in the species-specificcriticalwindowwhengrainnumberandpotentialgrainsizearedetermined(13).Grainnumberofannualcropsisindeedproportionaltoaphotothermalquotientdefinedastheratiobetweeninterceptedradiation and temperature (14, 15). High photothermal quotient favours harvest index and hence higher yield per unit seasonal evapotranspiration. Short, untimely episodes of extreme temperatures, i.e. frost or heat in the window of grain set and potential grain size determination, can reduce harvest index and yield with little impact on water use, hence decreasing yield per unit seasonal evapotranspiration.
Plant factorsThemetabolicpathwayofphotosynthesis (C4vsC3)andcrop-specificseedcompositionare thetwomostimportantplantfactorsaffectingyieldperunitseasonalevapotranspiration.Thetrade-offbetweenleafphoto-synthesisandwaterlossisinherentlyhigherinC4crops.ThisdifferenceisreflectedinthehigheryieldperunitseasonaltranspirationofmaizeandsorghumcomparedwiththeirC3counterparts(Table1).Millet,aC4crop, has biomass per unit transpiration similar to sorghum but its low harvest index leads to yield per unit evapotranspiration closer to that of C3 crops, as discussed in Section 6.5.
Theconversionefficiencyofsugarintograinrankscereals>pulses>oilseeds.Thisreflectsthedifferencesin energy content of the seed: 1 g of starch (dominant component of cereal grain) requires 1.2 g of raw sugar, 1 g of protein as in pulses requires 1.62 g of sugar and 1 g of fat as in oilseeds requires 2.7 g of sugar. A plant can therefore produce twice as much starch as fat using the same amount of raw sugar from photosynthesis. Thispartiallyexplainsthelargedifferenceinwaterproductivityofcereal,oilseedandpulsecrops(Table1).
crop yield: transpiration(kg grain ha-1 mm-1 )
yield: evapotranspiration(kg grain ha-1 mm-1)
irrigated dryland
cereals
Maize (C4) 30–37 11–32 6–23
Sorghum (C4) 20–30 3–22 5–21
Millet (C4) 17 1–12
Wheat (C3) 20–22 6–17 5–10
Rice (C3) 15–22 7–11 2–8
Oilseeds & pulses
Soybean 8–9 6–9 6–10
Sunflower 7–9 4–9 3–5
Cotton 9 (seed) 4–9 (seed)1–3 (lint)
Winter oilseeds (Brassica spp) 12–15 1–8
Winter pulses (faba bean, chickpea, lentil, lupin) 9–20 3–8 2–16
Source: maize: section 6.4 in this report; grain sorghum (60-65), millet: Section 6.5 in this report; wheat: section 6.1 in this report and (66)], rice: section 6.3 in this report and (66), soybean (67-69), sunflower: section 6.2 in this report, cotton (66), winter oilseeds (70-72), winter pulses (8, 73-78).
table 1: MaxiMuM yield Per unit SeaSOnal tranSPiratiOn and exaMPleS OF rePOrted yield Per unit SeaSOnal eVaPOtranSPiratiOn FOr MajOr annual crOPS. yield Per unit SeaSOnal tranSPiratiOn iS calculated aS the ratiO between Grain yield and SeaSOnal tranSPiratiOn Or the SlOPe OF bOundary FunctiOn relatinG Grain yield and SeaSOnal eVaPOtranSPiratiOn

Status of water use efficiency of main crops 19
4. Effects of nitrogen supply on water productivity
Nitrogendeficit reducesyieldperunitevapotranspirationbypotentiallyaffectingall threecomponents inequation1,i.e.biomassperunittranspiration,E/TandHI.Firstly,nitrogendeficiencyreducesphotosynthe-sis; hence biomass per unit transpiration is reduced. Brueck (16) compiled the response of biomass per unit transpirationtonitrogensupplyforallmajorcropspecies.Secondly,nitrogendeficiencyreducescanopysizeandincreasestheE/Tratio.Cooperet al. (1) demonstrated the improvement in yield per unit evapotranspira-tion associated with nitrogen and phosphorous fertilization in low-fertility soils of west Asia and north Africa, andemphasizedthereductioninE/T.Thirdly,nitrogendeficiencycouldreduceharvestindex.
Ensuring adequate nitrogen supply is therefore critical for high yield per unit evapotranspiration. However, there is a nitrogen-driven trade-off between water productivity and efficiency of nitrogen use that needs to be considered, as outlined in the following section.
5. Improving water productivity: recognizing trade-offs
Breeding and management practices to improve water productivity can involve important trade-offs. For example, breeding to improve short-term leaf carbon assimilation per unit transpiration may lead to selec-tion for traits associated with reduced water uptake, with the net effect of reducing yield under drought (20). Thegenotype-driventrade-offbetweenleafcarbonassimilationperunittranspirationandtolerancetohightemperature is well established in wheat, cotton, rice and grapevine. In this section, we present two examples oftrade-offs:betweenefficiencyintheuseofwaterandnitrogen,asrelatedtonitrogensupply,andbetweenwater productivity and yield of rice, as related to water regime.
Nitrogen-driven trade-off between water productivity and efficiency of nitrogen useOn the one hand, high water productivity requires adequate nitrogen supply (Section 4). On the other hand, the relationship between yield and nitrogen supply conforms to the law of diminishing returns, and therefore nitrogenuseefficiencydeclineswithincreasingnitrogensupply.Theeffectofindividualinputssuchaswaterand nitrogen on the carbon, water and nitrogen budgets of crops thus determines a nitrogen-driven trade-off betweenwaterproductivityandnitrogenuseefficiency.ThisisillustratedforbothaerobicandfloodedriceinthePhilippines (Figure 2ab) and rainfed and irrigated maize in the United States (Figure 2cd). Empirical evidence forthenitrogen-driventrade-offbetweenwaterproductivityandnitrogenuseefficiencyatleafandcroplevelscan also be found for wheat (21), maize (22) and perennial grasses in semi-arid grasslands of China (23).
TherainfallpatternofMediterraneanclimatesimposesaninherentriskontheuseoffertilizerwhich,associ-ated with low fertility soils, often results in a nitrogen imposed ceiling for water productivity (24, 25). Indeed, water and nitrogen co-limit wheat yield in Mediterranean type environments of eastern Australia (26) and northeastern Spain (27). In Mediterranean climates of West Asia and North Africa, the constraint to using fertilizer is imposed by uncertain rainfall compounded by infrastructure, social and economic factors (28),

SOLAW BACKGROUND THEMATIC REPORT - TR0720
which are common to many farming systems in temperate and tropical Asia (29).
In conclusion, maximizing water productivity in some farming systems may require nitrogen rates that are toocostly,tooriskyorenvironmentallyunsound.Thisisparticularlyimportantwithhighfertilizer-to-grainprice ratio, in environments prone to nitrogen leaching, or where biophysical, social, economic or infrastruc-ture factors limit the use of fertilizer.
Water-regime driven trade-off between rice yield and water productivityBouman et al. (30) and Farooq et al. (31) comprehensively reviewed the water productivity of rice. About 90percentoftheworld’sriceisproducedinirrigatedorrainfedlowlandfields(paddies).Lowlandriceneedsto account for land preparation requirements, seepage, percolation, evaporation and transpiration. Combined seepage and percolation, for example, range from 1–5 mm d-1 in heavy clay soils to a massive 25–30 mm d-1 in sandy and sandy-loam soils (30). In a context of water scarcity, water-saving technologies are being explored to reduce water use and improve water productivity, including aerobic rice and alternate wetting and drying. Theprincipleunderlyingthesetechniquesistheincreaseinwaterproductivityassociatedwithreducedwaterinput (Figure 1). However, water-saving techniques can also reduce grain yield.
Comparison of rice crops grown under aerobic (as for sustainable rice intensification) and flooded condi-tions in tropical environments of the Philippines (14 oN) showed a substantial increase in water productivity (Figure 3a) at the expense of grain yield (Figure 3b). In relation to the flooded regime, aerobic culture increased average water productivity from 5.7 to 7.4 kg grain ha-1 mm-1 and reduced yield from 6.4 to 5.7 tonnes ha-1. In contrast, aerobic rice crops in temperate environments of Japan (34–35o N) outperformed their flooded
FiGure 2: nitrOGen driVen trade-OFF between water PrOductiVity and nitrOGen utilizatiOn eFFiciency in (a) FlOOded and (b) aerObic ‘aPO’ rice in the PhiliPPineS, and (c) rainFed and (d) irriGated Maize in the united StateS. water PrOductiVity iS yield Per unit irriGatiOn + rainFall (a, b) Or yield Per unit eVaPOtranSPiratiOn (c, d). in all caSeS nitrOGen uSe eFFiciency iS Grain yield Per unit nitrOGen uPtake (excludinG rOOt n)
0 50 100 15015
20
25
30
40
50
60
70
80
0 50 100 15015
20
25
30
40
50
60
70
80
Wat
er p
rodu
ctiv
ity (k
g ha
-1 m
m-1
)
0
2
4
6
50
55
60
65
WP
NUE
Fertiliser rate (kg N ha-1)
0 1500
2
4
6
55
60
65
(a) flooded rice
(b) aerobic rice
(c) rainfed maize
(d) irrigated maize
WP
NUE
WP
NUE
WP
NUE
Nitrogen utilisation efficiency (kg kgN
-1)
Adapted from (82, 83).
Status of water use efficiency of main crops 21
counterparts in terms of water productivity (average 8.3 vs 3.4 kg grain ha-1 mm-1) and showed no yield penalty (average 8.6 vs 8.1 tonne ha-1) (32).
For a large number of crops in central-northern India and the Philippines, alternate wetting and drying improved the water productivity of rice in comparison with the flooded checks, but yield penalties up to 70 percent were recorded. Further studies in lowland rice areas with heavy soils and shallow (0.1–0.4 m) ground-water tables in China and the Philippines showed that alternate wetting and drying outperformed their flooded counterparts in terms of water productivity (Figure 3c) with no associated yield penalties (Figure 3d). In all these cases, extremely shallow groundwater tables allowed for ponded water depths that were typically within the root zone during the drying periods (30).
Tosummarize,culturalpracticestoimprovewaterproductivityareobviouslydesirable,butneedtobeseenin the broader context of agronomic, economic and environmental trade-offs. Some trade-offs are inherent in thebiophysicalfeaturesofthecroppingsystem,andcannotbebroken.Thenitrogen-driventrade-offbetweenwater productivity and nitrogen productivity belongs to this category. This type of trade-off may lead topractices that do not necessarily maximize water productivity, but rather account for multiple objectives: lower rates of nitrogen fertilizer and associated low water productivity may be justified in terms of reduced economic and environmental risk. The trade-off between yield andwater productivity associatedwithwater-savingtechniques can be broken in some instances, as illustrated in Figure 3c, d. Water-saving techniques that improve water productivity at the expense of grain yield can be justified in some cases, but research should be encour-aged to identify the conditions where improved water productivity can be achieved with no yield penalties.
FiGure 3: (a) aerObic rice had SiMilar Or Greater water PrOductiVity and (b) lOwer yield than rice GrOwn under a FlOOded reGiMe in the PhiliPPineS. (c) alternate wettinG and dryinG iMPrOVed rice water PrOductiVity and (d) cauSed nO yield PenaltieS in cOMPariSOn with the FlOOded checkS in the PhiliPPineS and china
Yield flooded (t ha-1)
0 2 4 6 8
Yiel
d ae
robi
c (t
ha-1
)
0
2
4
6
8
0 2 4 6 8
Wat
er p
rodu
ctiv
ity a
erob
ic
(kg
ha-1
mm
-1)
0
2
4
6
8
Water productivity flooded (kg ha-1 mm-1)
1:1
1:1
(b)(a)
Water productivity flooded (kg ha-1 mm-1)
0 4 8 12
Wat
er p
rodu
ctiv
ity a
ltern
ate
wet
and
dry
ing
(kg
ha-1
mm
-1)
0
4
8
12 1:1
(c)
Yield flooded (t ha-1)
2 4 6 8
Yiel
d al
tern
ate
wet
and
dry
ing
(t ha
-1)
2
4
6
8
1:1(d)
!Adapted from (30, 84).

SOLAW BACKGROUND THEMATIC REPORT - TR0722
6. Case studies
Here we present five case studies from environmentally, technologically and culturally diverse regionscovering the whole range from subsistence to high-tech production cropping systems. Case studies are: (i) wheat in the Mediterranean Basin, North American Great Plains, China Loess Plateau and southeast Australia; (ii)sunflowerincentralArgentina;(iii)riceinthelowerMekongRiverBasin;(iv)maizeintheWesternCornBelt of the United States; and (v) millet in the Sahel region of Africa. For each case study, we outline biophysi-cal and agronomic features of the cropping system and the approach used to quantify water productivity; we compareactualefficienciesagainstrelevantbenchmarks,andidentifyopportunitiesforimprovement.
6.1 wheat in southeastern australia, Mediterranean basin, china loess Plateau and north american Great Plains
Biophysical and cropping featuresThisstudycoveredlow-rainfallenvironmentsinfourregions:southeasternAustralia,MediterraneanBasin,China Loess Plateau and North American Great Plains. Wheat is the major grain crop in Australia. In the southeastern environments focused on here, soils have poor water-holding capacity that is associated with either coarse texture or chemical constraints to root proliferation. Soils with low water-holding capacity and precipitation concentrated in winter frequently lead to terminal drought. Likewise, a dry, hot summer alter-nating with a humid and temperate winter is the trademark of cropping systems in the Mediterranean Basin. Storedsoilwaterisusuallyinsufficienttomeetatmosphericdemandtowardsmaturity,andcropsgrowundertypicalconditionsofterminaldrought.TheLoessPlateauinthenorthwestofChinaisavastsemi-aridareawith annual precipitation from 300 to 600 mm. Rainfed winter wheat, the main crop in the region, is sown in late September and harvested in early July.
Available water is the most important factor limiting grain production, as active growth and the most critical periods of yield determination are out-of-phase with the peak of precipitation between July and September.TheGreatPlainsofNorthAmericaarerecognizedfortheirfertileMollisolsoilsandwheatproduc-tion in typical wheat-fallow rotations, which is currently shifting to more intensive cropping. Uncertain and highly variable precipitation is a major feature of the northern Great Plains. For southeastern Australian and Mediterranean locations, the critical periods of flowering, grain set and grain filling coincide with declining precipitation and increasing reference evapotranspiration. For the plains of North America and the Loess plateau in China, these critical periods occur under increasing precipitation that is, nonetheless, insufficient to match the dramatic increase in reference evapotranspiration.
ApproachSadras and Angus (33) compiled a data set including grain yield and seasonal evapotranspiration for 679 crops in low-rainfall environments in four regions: southeastern Australia (n = 364), North American Great Plains (n = 129), China Loess Plateau (n = 31), and Mediterranean Basin (n = 155). Evapotranspiration was generally calculated as rainfall plus change in soil–water content between sowing and harvest; drainage and runoff terms in water balances were neglected in most cases. Frequency distributions of yield per unit evapotrans-piration were calculated and a scatter plot of yield versus evapotranspiration was compared against a linear model with x-intercept = 60 mm and slope = 22 kg grain ha-1 mm-1. Notwithstanding the large variation in soils, climate and farming systems within each region, they provide a sound basis for comparisons.

Status of water use efficiency of main crops 23
Toanalysetheinfluenceofevaporativedemandonyieldperunitevapotranspiration,however,theNorthAmerican Great Plains were divided into Northern and Southern and Central regions. Of the 679 crops analysed, 57 percent were grown in well managed experimental plots; the remaining were from growers’ fields.Themajorityofcropsatthefarmscale(96percent)werefromsouthernAustralia.Theconditionsinexperimental plots are frequently more favourable for high grain yield than those in large growers’ fields. ThismeansarelativebiasinyieldandwaterproductivitywherebyAustraliancropsinthisdatasetreflectcommercial crops more closely than the crops for the other environments.
Water productivity of wheatOwing to the relatively small number of crops, caution is required in analysing the histogram for the China Loess Plateau. Average water productivity (kg grain ha-1 mm-1) was 9.9 for southeastern Australia, 9.8 for the China Loess Plateau, 8.9 for the northern Great Plains of North America, 7.6 for the Mediterranean Basin, and 5.3 for the southern-central Great Plains; the variation between regions was largely accounted for by reference evapotranspirationaroundflowering.Forthepooleddata,maximumwaterproductivitywas22kggrainha-1 mm-1 but few crops were close to this value. After accounting for the effects of reference evapotranspiration, the gap between average and maximum water productivity was 68 percent for the southern Great Plains of North America, 63 percent for the Mediterranean Basin, and 56 percent for China Loess Plateau, Northern Great Plains, and southeast Australia.
Figure 4 shows grain yield as a function of evapotranspiration for the pooled data. A boundary line with slope 22 kg grain ha-1 mm-1andx-intercept=60mmprovidedanupperlimitforallthedata.Thisboundaryfunction is similar to that proposed by French and Schultz (34, 35) for southern Australia and it seems to be a sensible reference for other dry environments. Although the slope of the line may seem arbitrary, it is interest-ing to note that the value of 20 kg grain ha-1 mm-1 originally proposed by French and Schultz in the 1980s and the value of 22 kg grain ha-1 mm-1 suggested by Angus and van Herwaarden (36) for crops in the late 1990s reflect the technology status of those years. Cultivar improvement, particularly increase in yield potential associated with greater harvest index (37, 38) and possibly increased atmospheric CO2 concentration (36).
Opportunities for improvement A subset of the data comprising crops in the Mallee region of southeast Australia was used to assess putative causes of under-performing crops. Low availability of phosphorus, late sowing, and subsoil chemical constraints, including sodicity, alkalinity and salinity, all contributed to the typically low water productivity of wheat in this environment. Adequate nutrition could improve water productivity, but rates of soil evapora-tion could still be large in well-fertilized crops (1).
Reduced row spacing, early vigour, and good supply of nutrients can favour rapid ground cover and reducesoilevaporation.Thebenefitsofpracticesthatfavourrapiduseofwaterearlyintheseasonhavetobe weighed against the depletion of soil water reserves for critical stages of grain set and filling. Likewise, a trade-off needs to be considered for tillage and stubble management aiming at increasing soil available water and reducing soil evaporation, as these practices could increase the probability of deep drainage.
Thegapbetweenactualyieldmeasuredingrowers’fieldsandtheboundaryfunctionincreasedatarateof19kggrain/haperdaydelayinsowingfrommid-April.Thereductioninwaterproductivityassociatedwith late sowing is partially related to (i) a reduction in grain set associated with lower photothermal coeffi-cient and (ii) increase in vapour pressure deficit reducing biomass per unit transpiration. In Mediterranean climates, vapour pressure deficit increases from around 0.3 kPa in winter to 1.2 kPa toward the end of spring

SOLAW BACKGROUND THEMATIC REPORT - TR0724
and summer; hence, greater proportion of seasonal growth in cold winter months could enhance water productivity. There are fewoptions for dealingwithuncertain opening rains that constrain early sowing,except for good agronomy (e.g. weed control) to allow sowing with the first rain, or genetic improvement (e.g. longcoleoptiles)toallowsowingintosubsurfacemoisturebeforerain.Thereareoftentrade-offsbetweentheyield benefits of early sowing and frost risk.
Chemical subsoil constraints are widespread in Mallee soils, and affect the gap between actual and attain-ablewaterproductivity.Themaineffectofsubsoilchemicalconstraintsonwaterproductivityismediatedbyconstraints to canopy expansion and increased soil evaporation, rather than by reduction in biomass per unit transpiration (39-41).
6.2 rainfed sunflower on the western Pampas of argentina
Biophysical and cropping features TheWesternPampasregion(33.5ºS-36.5ºS;62ºW-65ºW)comprisesarainfedcroplandareaof~4.5millionhainsemi-aridcentralArgentinawheresunflowerproductioniswidespread.ThepredominantlandscapeischaracterizedbyflattogentlyrollingcontinentalduneswhereprevalentagriculturalsoilsaresandyorloamyEnticHaplustollsandEnticHapludollswithmedium-to-lowwater-holdingcapacity.Theclimateistemperatewith some continental features.
Annual rainfall is summer-dominant and decreases from east to west. Reference crop evapotranspiration exceeds meanrainfallduringtheentiregrowingseasonexceptforthe50-dayperiodaftersowing.Thus,sunflowercropsare exposed to unavoidable water stress in most years. Stress intensity and yield depend on the stored soil water (42), which varies with early-autumn and spring rainfall and with fallow duration. Occasionally, high rainfall causes waterlogging, which coupled with higher incidence of pathogens can reduce sunflower yield in wet years (43).
FiGure 4: relatiOnShiP between wheat Grain yield and SeaSOnal eVaPOtranSPiratiOn in FOur MeGa-enVirOnMentS. line ParaMeterS are x-intercePt = 60 MM and SlOPe = 22 kG Grain ha-1 MM-1
Evapotranspiration (mm)
0 200 400 600
Yiel
d (t
ha-1
)
0
1
2
3
4
5
6 n = 691
China Loess PlateauMediterranean BasinNorth American Great PlainsSE Australia0.022 x (ET - 60)
Yie
ld p
er u
nit t
rans
pira
tion
(kg
ha-1
mm
-1)
20
25
(a)
(b)
(adapted from (33).

Status of water use efficiency of main crops 25
ApproachWe explored the relationship between grain yield and seasonal water supply using a 4-year database (1995-1998) collected on commercial farms on the Western Pampas (n = 169; paddock size range: 21-130 ha). Water produc-tivityforeachfield-yearwascalculatedasthequotientbetweengrainyieldandseasonalwatersupply,wherewater supply is initial soil water plus seasonal rainfall. Grain yield and water supply data collected from small-plot (56 m2) fertilization studies on the Western Pampas during 1996–1998 seasons by Bono et al. (44) were also included in the analysis (n = 231). Only crops grown on deep soils with no obvious physical or chemical constraintstorootingwereincluded.Yieldsarereportedatastandardmoisturecontentof11percent.
A boundary function was fitted between yield and water supply using data constrained to the range of yield responsebetween300and630mmofwatersupply.Thisboundaryfunctionwasusedto(a)benchmarkcropsin other environments, including locations in the Mediterranean Basin, the Great Plains of North America and Australiaand(b)toidentifyconstraintstocropwaterproductivityontheWesternPampas.Todothis,obser-vations were first separated into three categories: (i) crops with apparent water excess (seasonal water supply >630mm;category1);(ii)cropswithlimitingwatersupply(≤630mm)andlargeyieldgap(>10percentwithrespect to the attainable yield derived from the boundary function; category 2); (iii) crops with limiting water supplyandsmallyieldgap(≤10percent;category3).
A series of management factors, crop adversities, and physiological attributes were assessed for each crop category, including water content at sowing in the upper 0.6 m of the soil profile, total rainfall in each of three periods (‘pre-anthesis’ [sowing to15-daysprior toanthesis], ‘aroundanthesis’ [±15-daysaroundanthesis],and ‘grain filling’ [15-days post-anthesis to maturity]), percent of ground cover at anthesis, photo-thermal quotient for the 30-day period centered on anthesis, nitrogen and phosphorous deficiencies, incidence of weeds, diseases and insects, lodging and grain abortion. In a complementary analysis, data reported by Bono et al. (44) were used to assess the response of water productivity to N and P fertilization.
On-farm sunflower water productivity on the Western PampasThefittedboundaryfunctionhadaslopeof9.0kggrainha-1 mm-1, and an x-intercept of 75 mm (Figure 5a). Thisfunctiondelimitsthemaximumyieldovertherangeofwatersupply.Salientfeaturesofthisfigureare:(i)watersuppliesformanycropsweregreaterthanthemaximumexpectedcumulativeETC (630 mm) for the region; (ii) yield varied widely for a given water availability; (iii) on average, farmers’ yields were 50 percent below the boundary function; and (iv) maximum on-farm grain yields (4.9 tonnes ha-1) approached those reported for modern hybrids under potential conditions (45). Average on-farm yield per unit water supply ranged from 1.1 to 8.0 kg grain ha-1 mm-1.
The boundary function defined for theWestern Pampas provided a reasonable upper limit for rainfedand irrigated sunflower crops grown in other semi-arid environments in the Mediterranean Basin (Lebanon, Spain,Turkey), theGreatPlainsofNorthAmerica andAustralia (Figure 5c).Although cropsweregrownundergoodmanagementpractices,mostofthedatapointswerebelowtheboundaryfunction.Thegapswereassociated with high soil evaporation, high evaporative demand of the atmosphere, and untimely rainfall during the growing cycle in relation to critical crop stages.
Opportunities for improvementTable 2 summarizes environmental, management, and physiological variables for commercial sunflowercrops on the Western Pampas, grouped according to seasonal water supply and yield gaps with respect to the boundary function. Category 1 crops (seasonal water supply > 630 mm) had greater soil water content at

SOLAW BACKGROUND THEMATIC REPORT - TR0726
sowing and greater rainfall earlier in the season than crops in the remaining categories. In Category 1, frequen-cies of low topsoil phosphorus and nitrogen, and of weeds, pests, diseases and lodging were greater than for Category3crops(seasonalwatersupply≤630mm,smallyieldgap).Category3cropshadhigherinitialsoilwaterstoragethanCategory2crops(seasonalwatersupply≤630mm,largeyieldgap),butcrops inbothcategories had similar patterns of seasonal rainfall. In comparison to Category 2, Category 3 crops had much lowerfrequenciesofPandNdeficiencyinthetopsoil,lessweedincidence,higherphotothermalquotient,lessgrain abortion and higher ground cover at anthesis.
Further, Category 1 (seasonal water availability > 630 mm) crops were subdivided into two sets: those with yields within 10 percent of the boundary function for a seasonal water availability of 630 mm, and those with yields that departed from the boundary function by more than 10 percent. Interestingly, the contrasts between these two sets produced a pattern of differences between candidate yield-reducing factors that was equivalenttothecomparisonbetweenCategory2andCategory3crops.Thus,toincreasethevalueoftheboundary function as a benchmark to guide farming practice on the Western Pampas and to evaluate crop-water productivity, it would be useful to remove the apparent water excess observed in some years by treating any value of water supply > 630 mm as equal to 630 mm.
Analysis of the data by Bono et al. (44) showed average yield per unit water supply responses of 0.06 (range: -1.32 to 1.16), 0.24 (range: -0.67 to 2.14), 0.33 (range: -0.49 to 1.56) and 0.52 kg grain ha-1 mm–1 (range: -0.37 to 2.21) to fertilizer applications of 20 kg P ha-1, 40 or 80 kg N ha-1, and 20 kg P ha-1 plus 80 kg N ha-1 at sowing, respectively (Figure 6). Analysis of yield response to fertilization indicated that 75 percent of the crops were nutrient limited, of which 60 percent were limited by N or P and 40 percent were limited by both nutrients. Negative responses to fertilization in approximately 20 percent of the cases were mainly associated to low available soil water around flowering or very high rainfall during the growing season.
FiGure 5: (a) relatiOnShiP between Grain yield and SeaSOnal water SuPPly in FarMerS’ FieldS On the weStern PaMPaS (OPen SyMbOlS; n = 169). data FrOM SMall-PlOt (56 M2) Fertilizer trialS are alSO ShOwn (clOSed SyMbOlS; n = 231). water SuPPly iS aVailable SOil water at SOwinG PluS SOwinG-tO-Maturity rainFall. (c) relatiOnShiP between yield and eVaPOtranSPiratiOn FOr SunFlOwer crOPS in auStralia, lebanOn, SPain, turkey, and united StateS
0.0
1.0
2.0
3.0
4.0
5.0
0 250 500 750 1000 1250Seasonal water supply (mm)
Gra
in y
ield
(t h
a-1 )
Boundary function:slope = 9 kg ha-1 mm-1
x-intercept = 75 mm
n = 400
(a)
0 250 500 750 1000 1250Seasonal evapotranspiration (mm)
Bekaa Valley, LebanonBursa, TurkeyCordoba, SpainGreat Plains, USATatura, Australia
(c)
n = 154
Boundary function as in (a)
Adapted from (79) and references cited therein.

Status of water use efficiency of main crops 27
Tosummarize,theboundaryfunctionderivedfromthisstudydefinedanupperlimitforsunfloweryieldover the range of water supply up to 630 mm. Parameters of this boundary function, i.e. slope = 9 kg grain ha-1 mm-1 and x-intercept = 75 mm, were suitable for crops in contrasting semi-arid environments worldwide. Identification of the causes of yield gaps and, where possible, their mitigation, should lead to improved sunflower yield and water productivity. Although we cannot assign precise weightings to the factors contrib-utingtothesegaps,Figure6andTable2stronglyindicatepotentialcauses.Nutrientavailabilityanditsinter-action with soil water at sowing is perhaps the most important leverage point to increasing yield and water productivity. Other factors, such as diseases, weeds, and lodging also require attention.
6.3 rice in the lower Mekong river basin
Biophysical and cropping featuresThissectionsummarizesthestudyofMainuddinandKirby(46).TheMekongRiverBasincomprises795000km2 and 65 million inhabitants across six countries, that is China and Myanmar in the Upper Mekong and Laos,Thailand,Cambodia,andVietnaminthelowerMekong,whichisthesubjectofthisstudy.Vietnamhastwo contrasting regions in the basin, the Central Highlands and the Mekong Delta. Agriculture is the most important activity in the lower Mekong and accounts for 80-90 percent of the water extracted from the river. ThereisadrycroppingseasonfromNovembertoApril,andawetseasonfromMaytoOctober.Riceisthepredominant crop in the basin, and lowland rainfed rice grown in the wet season accounts for at least half of totalriceproduction(Table4).Maize,cassavaandsugarcanearethemainuplandcrops.
FiGure 6: water PrOductiVity OF SunFlOwer crOPS in reSPOnSe tO Fertilizer. the reSPOnSe waS calculated aS the diFFerence in yield Per unit water SuPPly between Fertilized and nOn-Fertilized crOPS. Fertilizer treatMentS were 20 kG P ha-1 (P-20), 40 kG n ha-1 (n-40), 80 kG n ha-1 (n-80), and cOMbined n and P (n-80 + P-20). Mean yield Per unit water SuPPly OF nOn-Fertilized crOPS waS 3.5 kG Grain ha-1 MM-1. SiGniFicance OF Paired t-teSt FOr the cOMPariSOn between Fertilized and nOn-Fertilized crOPS iS ShOwn FOr each treatMent.
0.0
0.2
0.4
0.6
0.8
P-20 N-40 N-80 N-80 + P-20
Fertiliser treatment
WU
E re
spon
se (k
g gr
ain
mm
-1ha
-1)
NS
p < 0.05p < 0.01
p < 0.01n = 32
0.0
0.2
0.4
0.6
0.8
P-20 N-40 N-80 N-80 + P-20
Fertiliser treatment
WU
E re
spon
se (k
g gr
ain
mm
-1ha
-1)
NS
p < 0.05p < 0.01
p < 0.01n = 32W
P re
spon
se (k
g ha
-1m
m-1
)
Fertiliser treatment
Data collected from 32 site-years on the Western Pampas by Bono et al. (44).

SOLAW BACKGROUND THEMATIC REPORT - TR0728
ApproachMainuddin and Kirby (46) combined provincial time-series of yield and modelled evapotranspiration to calcu-lateyieldperunitevapotranspirationattheregional(provincial)scale.Timeserieswere1993–2006orshorterwithin this time window. Modelled evapotranspiration was derived from monthly rainfall and reference evapotranspiration,cropcoefficients,rootingdepth,sowingtime,growingperiod,lengthofgrowingstagesand soil hydraulic properties. A range of soil types was assumed and results were averaged.
Regional water productivity of rice and short-term trendsFigure 7 maps the water productivity of rice in the lower Mekong River Basin at a provincial level between 1993 and 2003. Maximum yield per unit evapotranspiration was 3.0 kg grain ha-1 mm-1forThailand,3.3kggrain ha-1 mm-1 for Cambodia, 5.8 kg grain ha-1 mm-1 for Laos and 7.7 kg grain ha-1 mm-1forVietnam(Table3).Thesecomparetomaximumyieldperunittranspirationof22kggrainha-1 mm-1(30).TrendsofincreasingefficiencyovertheseshorttimeserieswereobservedinLaosandboththeMekongdeltaandCentralHighlandregionsofVietnam.
Opportunities for improvement Owingtothelargeshareofrice,andparticularlylowlandriceinthesecroppingsystems(Table3),increasingwater productivity of rice would increase the water productivity of the whole basin. Mainuddin and Kirby (46)outlinedthemainopportunitiesforimprovement.Theseincludeusinghigh-yieldingvarieties,increasingapplication of fertilizer, herbicides and pesticides, and supplementary irrigation. Upland crops such as coffee, vegetables and peanuts outperform rice in terms of economic return per millimetre water use. Increasing the share of these high-value upland crops, Mainuddin and Kirby (46) conclude, can increase farm income and reduce poverty with unlikely trade-offs in terms of food security in the basin.
Variable category 1 (n = 83) category 2 (n = 65) category 3 (n = 21)
Initial available soil water0-0.6m (mm) 71±3* 48±3 65±3
Pre-anthesis rainfall (mm) 309±11* 144±7 159±12
Rainfall around anthesis (mm) 135±7* 75±5 54±5
Grain-filling rainfall (mm) 70±5* 44±3 36±5
Ground cover around anthesis (%) 86±1* 79±2 91±2
Q anthesis (MJºC-1m-2) 1.41 ± 0.01* 1.39 ± 0.01 1.45 ± 0.02
Low topsoil P 30/73** 21/57 2/21
Low topsoil N 12/83** 14/63 1/21
Weed incidence 17/71** 15/56 2/14
Pest incidence 7/71** 1/52 0/14
Disease incidence 41/63** 2/50 1/14
Lodging 22/58** 2/51 0/14
Grain abortion 22/54** 11/31 0/12
* mean (±SE) for each variable; ** number of cases, expressed as a fraction of the total number of crops assessed, in which topsoil nutrient content was below to the regional threshold for yield response (N-NO3- 0-0.6 m= 50 kg ha-1; P-Bray0-0.2m= 12 mg kg-1) or crops were affected by a moderate-to-severe incidence of the adversity.
Adapted from (79).
table 2: enVirOnMental and crOP VariableS FOr the three cateGOrieS OF crOPS deriVed FrOM FiGure 5a. cateGOry 1: aVailable water > 630 MM; cateGOry 2: water SuPPly ≤ 630 MM and larGe yield GaP; and cateGOry 3: water SuPPly ≤ 630 MM and SMall yield GaP

Status of water use efficiency of main crops 29
6.4 irrigated maize in the western uS corn belt
Biophysical and cropping features TheWesternUSCornBelt(37ºN-45ºN;92ºW-105ºW)includes~7.3millionhacultivatedwithmaize(Figure11a). The landscape is undulate and predominant agricultural soils are Haplustolls andArgiustolls withmedium-to-high water holding capacity. Elevation increases westwards from 309 m in Ames to 1 384 m in Akron,atanequivalentrateof118mperdegree longitude.Theclimate iscontinentalandtemperate,and
FiGure 7: MekOnG riVer baSin yield Per unit eVaPOtranSPiratiOn OF rice at a reGiOnal Scale, in kG Grain ha-1 MM-1
country
rice acreage (fraction of annual
harvested area)
lowland rice production
(fraction of total rice production)
lowlandrice yield
(t ha-1)
cV of rain during the growing
season of lowland
rice (%)
Supplementary irrigation
requirement (fraction)
Maximum yield per unit
evapotranspiration(kg grain ha-1
mm-1)
Cambodia 0.89 0.87 2.1 17-49 0.9 3.3
Laos 0.72 0.77 3.2 21-34 0.9 5.8
Thailand 0.78 0.96 1.9 10-25 1.0 3.0
Vietnam 0.89 0.46 4.4 15-22 0.3 7.7
table 3: Share OF rice acreaGe, cOntributiOn OF lOwland rice tO tOtal rice PrOductiOn, lOwland rice aVeraGe yield (2003), cOeFFicient OF VariatiOn OF rain durinG the lOwland rice SeaSOn (aMOnG PrOVinceS within a cOuntry), SuPPleMentary irriGatiOn requireMent FOr lOwland rice, and MaxiMuM water PrOductiVity at reGiOnal (PrOVincial) leVel in the lOwer MekOnG riVer baSin
Adapted from (46).
Adapted from (46).

SOLAW BACKGROUND THEMATIC REPORT - TR0730
the frost-free period decreases from the southeast to the northwest along the altitudinal gradient. Spring and summer account for 70-80 percent of the annual precipitation. Reference evapotranspiration increases and rainfalldecreasesfromeasttowest.Variationinrainfall(CV~80percent)islargecomparedtothevariationinreferenceevapotranspiration(CV~23percent).Exceptforthefirstmonthaftersowing,cropETexceedsrainfallduringthegrowingseasonespeciallyonthewesternedgeofthelongitudinalgradient.Thus,timing,magnitude, duration and probability of water stress episodes depend on stored soil moisture that accumulates from snow melt and spring rains and, when available, irrigation water.
Irrigated maize represents 43 percent of the total maize area, 70 percent of the total irrigated cropland in the region, and accounts for 58 percent of the total annual maize production of 60 million tonnes in the Western Corn Belt (47). Surface gravity and sprinkler irrigation systems are in a 1:4 ratio of irrigated land area.
ApproachData on maize grain yield, applied irrigation, irrigation system and nitrogen fertilizer rate (n = 777) were collectedoverthreeyears(2005–2007)fromcommercialirrigatedfields(meansize:46ha)insidetheTri-BasinNaturalResourcesDistricts(NRD),oneofthe23NRDinNebraska.Waterproductivityforeachfield-yearwascalculated as the quotient between grain yield and seasonal water supply, where water supply = available soil water at sowing + sowing-to-maturity rainfall + applied irrigation.
Irrigation water productivity was calculated as the quotient between (i) grain yield and applied irrigation or(ii)betweenthedifferencebetweenirrigatedandrainfedyield(ΔY)andappliedirrigation.AccountingforyieldbenefitsofirrigationthroughΔYseekstoremovetheeffectofrainfallvariationacrossyears.Farmers’yields were compared against two benchmarks and variation of grain yield and applied irrigation were inves-tigated using data on crop management collected from a subset of 123 field-years.
ThebenchmarksrelateattainablegrainyieldandwatersupplyasdescribedinGrassiniet al. (48, 49). Briefly, modelled yield and water supply in 18 locations across the Western US Corn Belt were used to derive (i) a boundary function (slope = 27.7 kg grain ha-1 mm-1, x-intercept = 100 mm) and (ii) a mean function (slope = 19.3 kg grain ha-1 mm-1,x-intercept=100mm).Theboundaryfunctiondefinesthemaximumattainableyieldover the range of water supply, and the mean function accounts for the variability in attainable yield at a given water supply caused by year-to-year variation in solar radiation, temperature, vapour pressure deficit, and seasonal distribution of water supply.
Maize water productivity in the western corn belt Farmer’sgrainyieldintheTri-BasinNRDaveraged13tonnesha-1 and ranged between 9.5 to 17.2 tonnes ha-1. Totalwatersupplyduringthegrowingseasoncomprisedavailablesoilwateratsowing,sowing-to-maturityrainfall, and applied irrigation in a 25:45:30 ratio. Average applied irrigation ranged from 213 to 347 mm across seasons. Fertilizer rates averaged 183 kg N ha-1 and 25 kg P ha-1.
When compared to reported data on grain yield and water supply from maize crops in the Western US Corn Belt under good management, both the boundary and mean functions proved to be robust benchmarks (Figure8a).Onaverage,farmers’yieldswere20percentbelowthemeanbenchmarkfunctionalthough~4percent of the cases approached or even exceeded this benchmark (Figure 8b). Grain yield was not responsive to water supply over 900 mm; an important fraction of the total fields (55 percent) exceeded the apparent 900 mmthresholdrequiredtomaximizeyield.Theapparentwaterexcesswasweaklyrelated toavailablesoilwater at sowing and sowing-to-maturity rainfall but strongly related to applied irrigation. Water productiv-

Status of water use efficiency of main crops 31
ity of irrigated crops ranged from 8.2 to 19.4 kg mm-1 ha-1 across field-years. Average water productivity was higher in irrigated than in rainfed crops (14.0 vs 8.8 kg grain ha-1 mm-1).
Fields under pivot had higher water productivity (~13 percent) than their counterparts under gravityirrigation.Yieldperunitirrigationaveraged44,62,and77kggrainha-1 mm-1 under pivot and 28, 36, and 42 kg grain ha-1 mm-1 under gravity in 2005, 2006, and 2007, respectively. When these values were corrected by the average rainfed yield on each year (5.1, 5.2, and 7.5 tonnes ha-1), the resulting water productivity became relatively stable across years: 27, 37, and 32 kg grain ha-1 mm-1 under pivot and 18, 21, and 18 kg grain ha-1 mm-1undergravity in2005, 2006, and2007, respectively.HighΔYperunit irrigation reflectsnotonly theresponse to increasing water supply, but also differences in the agronomic management between irrigated and rainfed crops (e.g. plant population, nutrient inputs). Consequently, rainfed crops had lower attainable yield and water productivity than irrigated crops, even when water supply is not limiting, as shown in Figure 8b.
Opportunities for improvementTrendsintherecommendedplantpopulationforrainfedmaizeintheWesternUSCornBeltcloselyfollowthe east-west gradients of rainfall and reference evapotranspiration, reflectingmanagement adaptation toreduced water supply (Figure 9). Given the high probability of water stress, recommended plant populations decrease with the east-west rainfall gradient to avoid fast depletion of soil moisture during the vegetative
FiGure 8: (a) relatiOnShiP between Grain yield and SeaSOnal water SuPPly (aVailable SOil water at SOwinG PluS SOwinG-tO-Maturity rainFall and aPPlied irriGatiOn) FOr Maize crOPS GrOwn under near-OPtiMal ManaGeMent in the weStern uS cOrn belt. the databaSe included a wide ranGe OF enVirOnMentS and irriGatiOn ScheduleS; nOne OF the FieldS had ObViOuS liMitatiOnS due tO nutrient deFiciencieS, diSeaSeS, inSect, weedS, Or hail. (b) FarMerS’ irriGated yieldS in the tri-baSin nrd aS a FunctiOn OF SeaSOnal water SuPPly (+). tri-baSin cOunty-leVel aVeraGe rainFed yieldS are alSO ShOwn FOr cOMPariSOn (•).
Gra
in y
ield
(t h
a-1)
(b)
n = 777
0
6
12
15
18
0 400 800 1200 1600
3
9
n = 123
(a) RainfedIrrigated -SprinklerIrrigated -Subsurface drip irrigation
Boundary function:slope = 27.7 kg ha-1
mm-1
Mean WUE function:slope = 19.3 kg ha-1 mm-1
x-intercept = 100 mm 8
10
12
14
16
18
6
12
15
18
3
9
0
Tri-Basin NRD average rainfed yields
Seasonal water supply (mm)
-
(b)
n = 777
0
6
12
15
18
0 400 800 1200
3
9
n = 123
(a) RainfedIrrigated -SprinklerIrrigated -Subsurface drip irrigation
Boundary function:slope = 27.7 kg ha-1
mm-1
Mean WUE function:slope = 19.3 kg ha-1 mm-1
x-intercept = 100 mm 8
10
12
14
16
18
6
12
15
18
3
9
0
Tri-Basin NRD average rainfed yields
Seasonal water supply (mm)
Mean function
1600

SOLAW BACKGROUND THEMATIC REPORT - TR0732
stage, hence reducing the likelihood and intensity of stress at the most critical window of grain yield determi-nation (Section 3.2). Although lower plant populations may limit yield in years with above-to-average rainfall, field and simulation studies inWesternNebraska confirm the long-termbenefits of reducingmaizeplantpopulation as the available water supply decreases (50).
Figure 8a-b indicates that water productivity of irrigated maize can be improved by changes to the irrigation system, irrigation management or both. Whilst sprinkler and subsurface drip irrigation have higher efficien-cies than gravity systems, irrigation schedules based on real-time crop requirements, soil water monitoring, and short-term forecasts appear to be sound options to increase efficiency in current irrigated maize fields in the Western US Corn Belt. In comparison with standard farmers’ practice, scheduling irrigation on the basis of soil water content and crop requirement could reduce the irrigation rate by 35 percent with no yield penalty in eastern Nebraska (51).
ComparisonofactualandattainableyieldundercurrentpracticesindicatedthatfarmersintheTri-BasinNRD are operating at about 10–20 percent below maximum productivity (52). Fine-tuning current manage-ment practices such as plant population density, hybrid maturity, and rotation, may lead to a limited increase in yield and water productivity, in the order of 10 percent. Better management of irrigation water appears to be the most feasible way of achieving larger increases in water productivity. Data from commercial maize fields in the Tri-BasinNRD indicated the effects of irrigation system, previous crop, and tillage on yield,applied irrigation and/or water productivity (Figure 10).
Toachievethesameyield,pivotused36percentlessirrigationwaterthangravityirrigation,andconserva-tion tillage required 20 percent less irrigation water than conventional tillage. Crop residues under conser-vation tillage may diminish irrigation requirements by increasing precipitation storage efficiency and by reducing direct soil evaporation and surface runoff. So, fields under pivot and conservation tillage exhibit higherΔYperunitirrigationthantheircounterpartsundergravityandconventionaltillage.
FiGure 9: actual recOMMended Plant POPulatiOnS FOr irriGated and rainFed Maize aS a FunctiOn OF lOnGitude in the weStern uS cOrn belt. at SOMe eaStern lOcatiOnS, SyMbOlS FOr irriGated and rainFed crOPS OVerlaP. data PrOVided by PiOneer aGrOnOMy ScienceS, PiOneer hi-bred internatiOnal, inc
Adapted from (49).

Status of water use efficiency of main crops 33
Interestingly, tillage and previous crop interact on their effect on grain yield: while no difference between tillage systems were observed under soybean-maize rotation, yield under conventional tillage was higher thanunderconservationtillageundercontinuousmaize.MaximumΔYperunitirrigation(~35kggrainha-1 mm-1)andyield(~13.5tonnesha-1) were achieved in fields under pivot irrigation, conservation tillage and soybean-maize rotation.
6.5 Millet in the western Sahel region of africa
Biophysical and cropping features TheSahelisaneast-west,3millionkm2 semi-arid transition belt between the Sahara dessert and the wooded Sudanian savannah. Drought, high temperature and low soil fertility are major constraints to crop produc-tion in theregion.Annual rainfallvariesbetween200and600mm,withvariationcoefficientsbetween15
FiGure 10: Maize yield, irriGatiOn, and water PrOductiVity under diFFerent cOMbinatiOnS OF irriGatiOn SySteM (SurFace GraVity; PiVOt), rOtatiOn (SOybean-Maize [S-M]; Maize-Maize [M-M]), and tillaGe (cOnSerVatiOn [StriP-, ridGe-, Or nO-till]; cOnVentiOnal [diSk]). water PrOductiVity iS the ratiO between the diFFerence between irriGated and rainFed yield (Δy) and the aMOunt OF aPPlied irriGatiOn. errOr barS indicate ± Se. diFFerenceS (Δ) FOr Selected cOMPariSOnS between tillaGe SySteMS are ShOwn
S-M M-M S-M M-M
WP
(kg
ha-1
mm
-1)
0
10
20
30
40
Gra
in y
ield
(t h
a-1)
11
12
13
14
15
App
lied
irrig
atio
n (m
m)
0
100
200
300
400
500
Pivot Surface
= 0.5 t ha-1
= 51 mm
= 38 mm
= 46 mm
= 122 mm
= 1.0 t ha-1
Conservation tillage Conventional tillage
Adapted from (48).

SOLAW BACKGROUND THEMATIC REPORT - TR0734
and 30 percent (53). Millet is a C4 cereal that is commonly grown in low fertility, sandy upland soils, which are often prone to crusting. It is grown on its own or intercropped, and residues provide valuable fodder in systemswherecropandanimalproductionarehighlyintegrated.Variablecombinationsofsoilevaporation,runoffanddeepdrainagecompriseasignificantunproductivecomponentofthecrop-waterbudget.
ApproachWe collected millet grain yield and evapotranspiration data from published sources, mostly from the West AfricanSahelgenerallyassociatedwith ICRISAT.Data fromEgyptwere comparedagainst thehigh-inputcropping system of United States. We derived frequency distribution of yield per unit evapotranspiration and scatter-plots of yield versus evapotranspiration. A boundary function with slope = 16.7 kg grain ha-1 mm-1 and x-intercept = 158 mm was derived from studies by Rockström et al. (54) in Nigeria.
Millet water productivityFor a collection of 58 crops in the Sahel, millet yield per unit evapotranspiration averaged 3 kg grain ha-1 mm-1. Although these studies captured the local soils and climates and most of the local practices, e.g. sowing dates and plant population densities, they possibly overestimated the water productivity in farmers’ paddocks. For example, 50 percent of crops in the data set yielded more than 1 tonne ha-1, as compared to national averages for Western Sahelian countries typically below 0.7 tonnes ha-1. A boundary function with slope = 16.7 kg grain ha-1 mm-1 and x-intercept = 158 mm seemed to capture the upper limit of water productivity for Sahelian millet crops(Figure11).Thegeneralityofthisboundaryfunctionisreinforcedbyitsapplicabilitytothemorefavour-able environments of Egypt and North America (Figure 11). Most millet crops under Sahelian conditions were well below this boundary function.
Opportunities for improvementEnvironmental,managementandplant-related factors summarized inTable 4 contribute to the lowwaterproductivity of millet in the Sahel. Low soil fertility and sparsely sown crops mean ground cover is typically low,i.e.peakleafareaindicesbelow1,orbelow2inmoreintensivesystems.Thisinturnfavoursunproduc-tive soil evaporation. Sandy soils, which are prone to crusting, also favour episodic runoff and deep drainage,
FiGure 11: relatiOnShiP between Grain yield and eVaPOtranSPiratiOn FOr crOPS in weStern Sahel; data FrOM eGyPt and united StateS are included FOr cOMPariSOn. the SOlid line haS a SlOPe = 16.7 kG Grain ha-1 MM-1 and an x-intercePt = 158 MM, bOth deriVed FrOM (54)
Evapotranspiration (mm)0 200 400 600 800
Yiel
d (k
g ha
-1)
0
2000
4000
6000 Western SahelEgyptUSA
0
5
0 2 4 6 8 1 0 1 2
Fre
que
ncy
(%)
W ate r us e e ff icie n cy (kg h a -1 m m -1 )
Data from (54, 58, 85-96).

Status of water use efficiency of main crops 35
asdemonstratedindetailedwaterbudgetstudies(Table4).Indeed,aseriesofexperimentalandmodellingstudies converge to conclude that production in these environments is not necessarily limited by water but rather by agronomy and inputs, as there is often residual water in the soil at maturity (55), large unproductive lossesofwater,andnutrientstressisoftenmoreseverethanwaterstress(56,57).YieldperunittranspirationofmilletisthelowestamongC4crops(Table1).Inadirectcomparisonofsorghumandmillet,Mamanet al. (58) found both crops had similar water use and biomass production, hence similar biomass per unit evapotrans-pirationbutlargedifferencesinyieldandhenceinyieldperunitevapotranspiration.Thelowharvestindexofmilletrelativetosorghumaccountsforthisdifference(Table4).
Improving water productivity of millet in dry, hot environments of Africa would require higher inputs, chiefly large fertilizer doses that need to be considered in the context of risk and trade-offs. Likewise, the low harvest index of millet needs to be considered in the context of a trade-off between grain production and valuable crop residues. For example, some popular landrace millet varieties in India are over 3 m tall, and are valued for the large amount of fodder they provide, even though grain yields are relatively low.
crop feature Value
Peak LAI Standard crop < 1
Intensively managed crop < 2
Water stress index Emergence-end juvenile stage 0
End juvenile stage-panicle initiation 0.02
Panicle initiation - end leaf growth 0.27
End leaf growth -end panicle growth 0
End panicle growth -maturity 0
Nitrogen stress index Emergence-end juvenile stage 0.07
End juvenile stage-panicle initiation 0.04
Panicle initiation - end leaf growth 0.63
End leaf growth -end panicle growth 0.16
End panicle growth -maturity 0.03
Soil evaporation mm 158-248
Percentage of rainfall 30-50
Runoff mm 0-157
Percentage of rainfall 0-30
Drainage mm 75-328
Percentage of rainfall 15-55
Harvest index (%) Millet 23-37
Sorghum 34-45
table 4: tyPical Peak leaF area index (lai), MOdelled water and nitrOGen StreSS indiceS, and MeaSured ranGeS OF nOn-PrOductiVe cOMPOnentS OF the water budGet OF Millet crOPS in the weStern Sahel reGiOn. cOMPariSOn OF SOrGhuM and Millet harVeSt index iS FrOM cOMMOn lOcatiOnS and GrOwinG cOnditiOnS in nebraSka, united StateS.
Sources: LAI (80), water and nitrogen stress indices (57), water budget components (54), and harvest index (58). Water and nitrogen stress indices were calculated for Tara, Niger, in a season when seasonal rainfall was 65 percent of normal; indices range from 0 (no stress) to 1 (maximum stress).

SOLAW BACKGROUND THEMATIC REPORT - TR0736
7. Conclusions
Improvement in grain yield and water productivity arise from breeding for superior varieties, better agronomic practices and the important, but often overlooked, synergy between breeding and agronomy (59). Long-term enhancement of yield potential with no substantial change in crop water uptake has increased yield per unit transpiration.Table1summarizesthecurrentupper limitofyieldperunit transpirationof themaingraincrops.TheseupperlimitsreflectdifferencesbetweenC3andC4species,betweenwinterandsummercropswith their associated difference in prevailing evaporative demand of the atmosphere, and between species with dominance of starch, protein or oil in the seed. Further genetic improvement in yield per unit transpira-tion can contribute to improvement in yield and water productivity but more likely gains would derive from improving the capacity of crops to capture more water (20).
Thereisanobviousneedforagronomicsolutionstoclosethecommonandoftenlargegapbetweenactualand attainable yield per unit evapotranspiration or yield per unit water supply demonstrated for most crops and cropping systems worldwide including wheat (Figure 4), sunflower (Figure 5a), maize (Figure 8b) and pearl millet (Figure 11b). Also for rice, actual yield per unit evapotranspiration is typically well below that attainable(Figure7,Table1).
Whereas genetic and agronomic solutions are not mutually exclusive, it has been argued that agronomic practices to narrow the gap between attainable and actual yield per unit evapotranspiration is a more effec-tive investment of scarce R&D funds, particularly for smallholder farmers. Moreover, the practices required to close this gap are already known for many crops and cropping systems; solutions in these cases involve efforts to provide extension, education and policy development to remove barriers to adoption of these practices.
Thegapbetweenmaximumyieldperunit transpirationrepresenting theattainableyieldperunitwateruptake, and actual yield per unit evapotranspiration can be interpreted in two ways (Figure 4, 5ab, Figure 8b). In the vertical direction, there is a yield gap that might be reduced with better agronomy. In the horizontal direction, the gap indicates wasteful use of water, chiefly soil evaporation but also deep drainage and runoff, depending on rainfall patterns, irrigation system and scheduling and other features of the cropping system. Indeed, this type of analyses led many authors to conclude that water is not necessarily a limiting factor even inverydryenvironmentsofAfricaandAustralia.Theparticularpracticesrequiredtoclosethegapbetweenattainable and actual yield per unit evapotranspiration are specific for a given crop and cropping system, but some elements seem to be widespread: timely sowing, effective control of weeds, pests and diseases, and adequate fertilization.
As a rule for winter crops, the earliest sowing compatible with frost risk would maximize grain yield in association with high photothermal quotient and would improve yield per unit evapotranspiration by placing much of the growing cycle under conditions of lower vapour pressure deficit. For highly plastic crops such as chickpea and sunflower, massive improvement in yield per unit evapotranspiration results from shifting the growing season from spring-summer to autumn-winter, provided diseases and weeds are properly managed.
Nutrient availability, particularly nitrogen and phosphorus, are critical to high yield and water productiv-ity.Trade-offsbetweenwaterproductivityandnutrientuseefficiencyneedtobeconsidered, i.e.maximiz-
Status of water use efficiency of main crops 37
ing water productivity in some farming systems may require nitrogen fertilization rates that are too costly, too risky or environmentally unsound. Likewise, trade-offs between yield and water productivity that are mediated by amount and method of water supply are common. All these trade-offs need to be considered, as the aim of improving water productivity on its own is not necessarily the best pathway to sustainability involving specific production, environmental and social targets.
8. References and data sources
1. Cooper, P.J.M., Gregory, P.J., Tully, D. & Harris, H.C. 1987. Exp. Agr. 23, 113.
2. Tanner, C.B., Sinclair, T.R.1983.In:Limitationstoefficientwateruseincropproduction,Taylor,H.M.,Jordan,W.R.,Sinclair,T.L.(eds).ASA,CSSA,SSSA,Madison,pp.1-27.
3. Kemanian, A.R., Stöckle, C.O. & Huggins, D.R. 2005. Agric. Forest Meteorol. 130, 1.
4. Abbate, P.E. et al., 2004. Crop. Sci. 44, 474.
5. Moriana, A., Villalobos, F.J. & Fereres, E. 2002. Plant Cell Environ 25, 395.
6. Steduto, P. & Albrizio, R. 2005. Agric. Forest Meteorol. 130, 269.
7. Doyle, A.D. & Fischer, R.A. 1979. Aust. J. Agric. Res. 30, 815.
8. Oweis, T., Hachum, A. & Pala, M. 2004. Agric Water Manag. 66, 163.
9. Gimeno, V., Fernández, J. & Fereres, E. 1989. Field Crops Res. 22, 307.
10. Sadras, V.O. 2003. Aust. J. Agric. Res. 54, 341.
11. Sadras, V.O. & Rodriguez, D. 2007. Aust. J. Agric. Res. 58, 657.
12. Fereres, E. & Gonzalez-Dugo, V. 2009. In Crop physiology: applications for genetic improvement and agronomy. Sadras,V.O.,Calderini,D.F.(eds)SanDiego,UnitedStates,AcademicPress,pp.123–143.
13. Sadras, V.O. & Denison, R.F. 2009. New Phytol. 183, 565.
14. Fischer, R.A. 1985. J. agric. Sci. 105, 447.
15. Cantagallo, J.E., Chimenti, C.A. & Hall, A.J. 1997. Crop. Sci. 37, 1780.
16. Brueck, H. 2008. Journal of Plant Nutrition and Soil Science 171, 210.
17. Caviglia, O.P. & Sadras, V.O. 2001. Field Crops Res. 69, 259.
SOLAW BACKGROUND THEMATIC REPORT - TR0738
18. Zhao L.M. et al. July 2009. Exp. Agr. 45, 275.
19. van Herwaarden, A.F., Farquhar, G.D., Angus, J.F., Richards, R.A. & Howe, G.N. 1998. Aust. J. Agric. Res. 49, 1067.
20. Blum, A. 2009. Field Crops Res. 112, 119.
21. Brown, P.L. 1971. Agron. J. 63, 43.
22. Di Paolo, E. & Rinaldi, M. 2008. Field Crops Res. 105, 202.
23. Chen, S.P., Bai, Y.F., Zhang, L.X. & Han, X.G. 2005. Environ. Exp. Bot. 53, 65.
24. Sadras, V.O. & Roget, D.K. 2004. Agron. J. 96, 236.
25. Sadras, V.O. 2002. Field Crops Res. 77, 201.
26. Sadras, V.O. 2005. Aust. J. Agric. Res. 56, 1151.
27. Cossani, C.M., Savin, R. & Slafer, G.A. 2009.In:SixteenthNitrogenWorkshop.Turin,Italy,2009).
28. Ryan, J., Ibrikci, H., Sommer, R. & McNeill, A. 2009. Adv. Agron. 104, 53.
29. Sharma, R.C. 2009. In Crop physiology: applications for genetic improvement and agronomy, Sadras, V.O.,Calderini, D.F. (eds). San Diego, United States, Academic Press, pp. 99-119.
30. Bouman, B.A.M., Humphreys, E., Tuong, T.P. & Barker, R. 2006. Adv. Agron. 92, 187.
31. Farooq, M., Kobayashi, N., Wahid, A., Ito, O. & Basra, S.M.A. 2009. Adv. Agron. 101, 351.
32. Kato, Y., Okami, M. & Katsura, K. 2009. Field Crops Res. 113, 328.
33. Sadras, V.O. & Angus, J.F. 2006. Aust. J. Agric. Res. 57, 847.
34. R.J. & Schultz, J.E. 1984 Aust. J. Agric. Res. 35, 765.
35. R.J. & Schultz, J.E. 1984. Aust. J. Agric. Res. 35, 743.
36. Angus, J.F. & van Herwaarden, A.F. 2001. Agron. J. 93, 290.
37. Siddique, K.H.M., Tennant, D., Perry, M.W. & Beldford, R.K. 1990. Aust. J. Agric. Res. 41, 431.
38. Slafer, G.A., Satorre, E.H. & Andrade, F.H. 1994. In Genetic improvement of field crops, Slafer, G.A. (ed). NewYork,MarcelDekker,pp.1-68.
39. Holloway, R.E. & Alston, A.M. 1992. Aust. J. Agric. Res. 43, 987.
Status of water use efficiency of main crops 39
40. Halvorson, A.D. & Reule, C.A. 1976. Regional Saline Seep Control Symposium Proceedings. Bulletin No 1132, Montana State University (Mont.), 115.
41. Sadras, V.O., Baldock, J., Roget, D.K. & Rodriguez, D. 2003. Field Crops Res. 84, 241 (2003).
42. Mercau, J.L. et al. February 2001. Agric. Syst. 67, 83.
43. Grassini, P., Indaco, G.V., Pereira, M.L., Hall, A.J. & Trapani, N. 2007. Field Crops Res. 101, 352.
44. Bono, A. Montoya, J.C. & Babinec, F.1999.PublicaciónTécnica#48,EEAAnguil,INTA,Argentina.
45. López Pereira, M., Sadras, V.O. & Trápani, N. 1999. Field Crops Res. 65, 157.
46. M. Mainuddin, M. Kirby, Agric Water Manag 96, 1567 (2009).
47. USDA. No date. Crops, US State and county databases. United States Department of Agriculture–National Agricultural Statistics Service, 2000-2009.
48. Grassini, P., Thorburn, J., Burr, C. & Cassman, K.G. 2011. Field Crops Res. Field Crops Res. 120, 142-150.
49. Grassini, P., Yang, H.S. & Cassman, K.G. Agric. 2009. Forest Meteorol. 149, 1254.
50. Lyon, D.J., Hammer, G.L., McLean, G.B., & Blumenthal, J. M. 2003. Agron. J. 95, 884.
51. M. J. Burgert, University of Nebraska (2009).
52. Grassini, P., Yang, H., Irmak, S., Thorburn, J., Burr, C. & Cassman, K.G. 2011. Field Crops Res. 120, 133-141.
53. Rockström, J., Barron, J., Brouwer, J., Galle, S. & DeRouw, A. 1999. Soil. Sci. Am. J. 63, 1308.
54. Rockström, J., Jansson, P.E. & Barron, J. 1998. Journal of Hydrology 210, 68.
55. Payne, W.A. Wendt, C.W. & Lascano, R.J. 1 July 1990. Agron. J. 82, 813.
56. Bley, J., Van Der Ploeg, R.R., Sivakumar, M.V.K. & Allison, B.E. 1991. Soil water balance in the Sudano-Sahetian Zone. Proceedings of the Niamey Workshop, February 1991. IAHS Publ. No. 199, 571.
57. Fechter, J., Allison, B.E., Sivakumar, M.V.K., Van Der Ploeg, R.R. & Bley, J. 1991. Soil Water Balance in the Sudano-Sahetian Zone. Proceedings of the Niamey Workshop, February 1991. IAHS Publ. No. 199, 505.
58. Maman, N., Lyon, D.J., Mason, S.C., Galusha,T.D. & Higgins, R. Nov-Dec, 2003. Agron. J. 95, 1618.
59. Fischer, R.A. 2009. In Crop physiology: applications for genetic improvement and agronomy, Sadras, V.O.,

SOLAW BACKGROUND THEMATIC REPORT - TR0740
Calderini, D.F. (eds). San Diego, United States, Academic Press, pp. 23–54.
60. Farre, I. & Faci, J.M. May 2006. Agric Water Manag. 83, 135.
61. Mastrorilli, M., Katerji, N. & Rana, G. 1995. Agric Water Manag. 28, 23.
62. Stewart, B.A., Musick, J.T. & Dusek, D.A. 1983. Agron. J. 75, 629.
63. Stone, L.R., Goodrum, D.E., Jaafar, M.N. & Khan, A.H. 2001. Agron. J. 93, 1105.
64. Chaudhuri, U.N., Kanemasu, E.T. 1985. Field Crops Res. 10, 113.
65. Blum, A. 1972. Agron. J. 64, 775.
66. Zwart, S.J. & Bastiaanssen, W.G.M. 2004. Agric Water Manag. 69, 115.
67. Suyker, A.E. & Verma, S.B. 2009. Agric. Forest Meteorol. 149, 443.
68. Dardanelli, J.L., Suero, E.E., Andrade, F.H. & Andriani, J. 1991. Agronomie 11, 747.
69. Casa, R. & Lo Cascio, B. Aug. 2008. J Agron Crop Sci 194, 310.
70. Hocking, P.J., Kirkegaard, J. A., Angus, J.F., Gibson, A.H. & Koetz, E.A. 1997. Field Crops Res. 49, 107.
71. Gunasekera, C.P., French, R.J., Martin, L.D. &. Siddique, K.H.M. 2009. Crop and Pasture Science 60, 251.
72. Robertson, M. & Kierkegaard, J.A. 2005. Aust. J. Agric. Res. 56, 1373.
73. Loss, S.P., Siddique, K.H.M. & Tennant, D. 1997. Field Crops Res. 54, 153.
74. Siddique, K.H.M. & Sedgley, R.H. 1986. Aust. J. Agric. Res. 37, 599.
75. Siddique, K.H.M., Regan, K.L., Tennant, D. & Thomson, B.D. 2001. Eur. J. Agron. 15, 267.
76. Zhang, H., Pala, M., Oweis, T. & Harris, H. 2000. Aust. J. Agric. Res. 51, 295.
77. Oweis, T. 2004. Agric. Water Manag. 68, 251.
78. Oweis, T., Hachum, A. & Pala, M.A.W.M. 2005. 73, 57.
79. Grassini, P., Hall, A.J. & Mercau, J.L. 2009. Field Crops Res. 110, 251.
80. Payne, W.A. 2000. Agron. J. 92, 808.
81. Bouman, B.A.M., Tuong, T.P. 2001. Agric Water Manag. 49, 11.

Status of water use efficiency of main crops 41
82. Belder, P. et al. 2005. Plant Soil 273, 167.
83. Kim, K.I., Clay, D.E., Carlson, C.G., Clay, S.A., Trooien, T. 2008. Agron. J. 100, 551.
84. Bouman, B.A.M., Peng, S., Castañeda, A.R., Visperas, R.M. 2005. Agric Water Manag. 74, 87.
85. Anderson, R.L. & Greb, B.W. 1987. Crop Prot 6, 61.
86. Chaudhuri, U.N. & Kanemasu, E.T. 1985. Field Crops Res. 10, 113.
87. Akponikpe, P.B.I. Dr.2008.UniversitéCatholiquedeLouvain.
88. Manyame, C. 2006.TexasA&MUniversity.(Ph.D.Thesis)
89. Kassam, A.H. & Kowal, J.M. 1975. Agric. Meteorol. 15, 333.
90. Nouri, M. & Reddy, K.C. 1991. Soil Water Balance in the Sudano-Sahetian Zone (Proceedings of the Niamey Workshop, February 1991). IAHS Publ. No. 199, 421.
91. Gaber, A.M., Gaber, E.I., El-Hassanin, A.S. & El-Boraie, F.M. 2006. Second International Conference on Water Resources & Arid Environment, 1.
92. Payne, W.A. 1997. Agron. J. 89, 481.
93. Payne, W.A. 1999. Soil Sci Soc Am J. 63, 972.
94. Sivakumar, M.V.K. 1990. Agric. Forest Meteorol. 51, 321.
95. Grema, A.K. & Hess, T.M. 1994. Agric. Water Manag. 26, 169.
96. Oluwasemire, K.O., Stigter, C.J., Owonubi, J.J. & Jagtap, S.S. 2002. Agric Water Manag. 56, 207.