Embed Size (px)
Citation preview
8/13/2019 Report 2007 05 Land Degr Argentina REV Aug 2008 Productividad Degradacion
http://slidepdf.com/reader/full/report-2007-05-land-degr-argentina-rev-aug-2008-productividad-degradacion 1/56
GLADA Report 1c
Version August 2008
Land Degradation and Improvement
in Argentina
1. Identification by remote sensing
Z G Bai
D L Dent
FOOD AND AGRICULTURE ORGANIZATION OF THE UNITED NATIONS
8/13/2019 Report 2007 05 Land Degr Argentina REV Aug 2008 Productividad Degradacion
http://slidepdf.com/reader/full/report-2007-05-land-degr-argentina-rev-aug-2008-productividad-degradacion 2/56
This report has been prepared under the conditions laid down in the Letter of Agreement
FAO-ISRIC PR 35852.
Correct citation:
Bai ZG and Dent DL 2007. Land degradation and improvement in Argentina 1: Identification
by remote sensing. Report 2007/05, ISRIC – World Soil Information, Wageningen
Inquiries: C/o Director, ISRIC – World Soil Information
PO Box 353
6700 AJ Wageningen
The NetherlandsTelefax: +31-(0)317-471700
E-Mail: [email protected]
Web: www.isric.org
8/13/2019 Report 2007 05 Land Degr Argentina REV Aug 2008 Productividad Degradacion
http://slidepdf.com/reader/full/report-2007-05-land-degr-argentina-rev-aug-2008-productividad-degradacion 3/56
8/13/2019 Report 2007 05 Land Degr Argentina REV Aug 2008 Productividad Degradacion
http://slidepdf.com/reader/full/report-2007-05-land-degr-argentina-rev-aug-2008-productividad-degradacion 4/56
ii Land Degradation and Improvement in Argentina
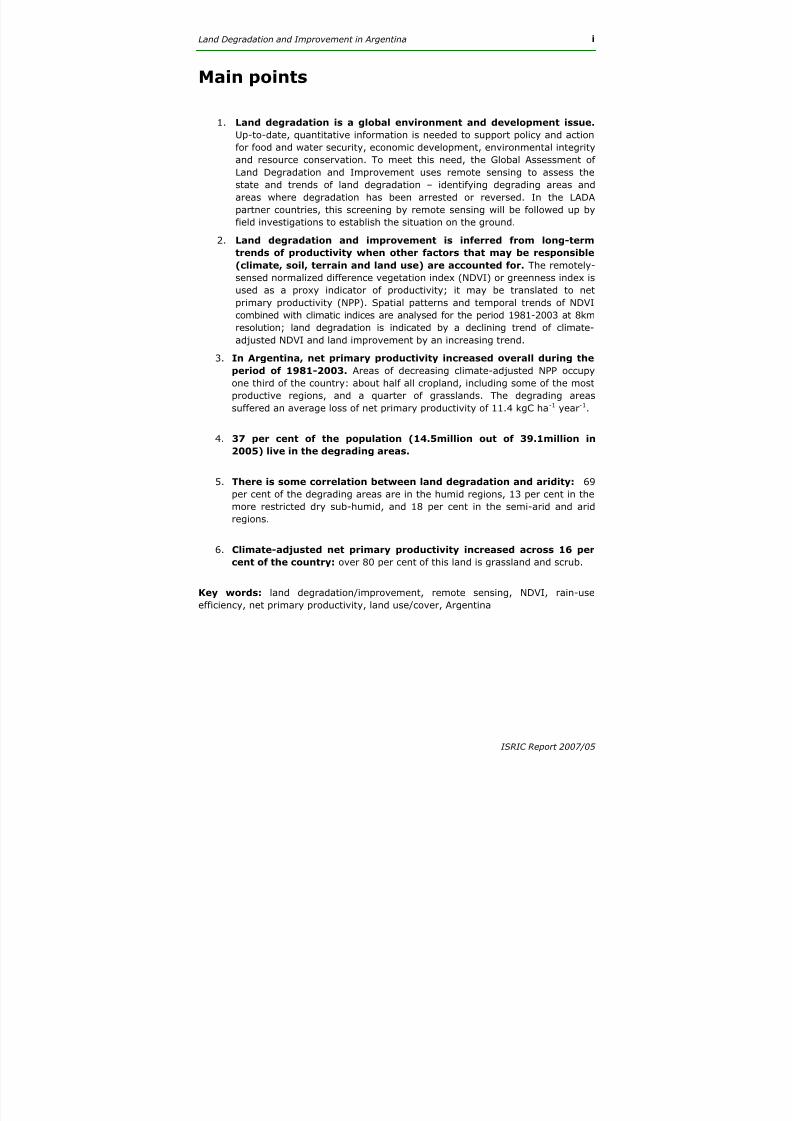
Contents
Main points..................................................................................................i
Abbreviations ............................................................................................iv
1 Introduction........................................................................................ 1
2 Context and Method ............................................................................ 3
2.1 GLADA partner country: Argentina.................................................. 3
2.2 Data............................................................................................ 4
2.2.1 NDVI and net primary productivity.......................................... 4
2.2.2 Climatic data ....................................................................... 4
2.2.3 Land cover and land use ....................................................... 4
2.2.4 Soil and terrain.................................................................... 6
2.2.5 Population, urban areas and poverty indices ............................ 6
2.2.6 Aridity index........................................................................ 6
2.2.7 RESTREND .......................................................................... 6
2.3 Analysis ....................................................................................... 6
3 Results ................................................................................................ 9
3.1 Trends in biomass productivity ........................................................ 9
3.2 Spatial patterns of biomass and rainfall ...........................................11
3.3 Rain-use efficiency .......................................................................13 3.4 RESTREND ..................................................................................15
3.5 Net primary productivity................................................................17
3.6 Land degradation .........................................................................19
3.7 Land improvement .......................................................................21
3.8 Urban areas.................................................................................22
3.9 Comparison of indicators ...............................................................22
3.10 Analysis of degrading and improving areas.......................................24
3.10.1 Association with land cover and land use................................24
3.10.2 Association with population density........................................28
3.10.3 Association with aridity ........................................................29
3.10.4 Association with poverty ......................................................29
4 What GLADA can and cannot do .........................................................31
5 Conclusions ........................................................................................33
Acknowledgements ..................................................................................34
References................................................................................................35
ISRIC Report 2007/05
8/13/2019 Report 2007 05 Land Degr Argentina REV Aug 2008 Productividad Degradacion
http://slidepdf.com/reader/full/report-2007-05-land-degr-argentina-rev-aug-2008-productividad-degradacion 5/56
Land Degradation and Improvement in Argentina iii
Appendix 1: Analytical methods ...........................................................39 Appendix 2: NDVI indicators of the land degradation/ improvement ...41
Figures
Figure 1. Main land cover types................................................................... 5 Figure 2. Spatially aggregated annual sum NDVI 1981-2003, p<0.01 ............... 9 Figure 3. Annual sum NDVI 1981-2003: mean (a) and trends (b – percentage
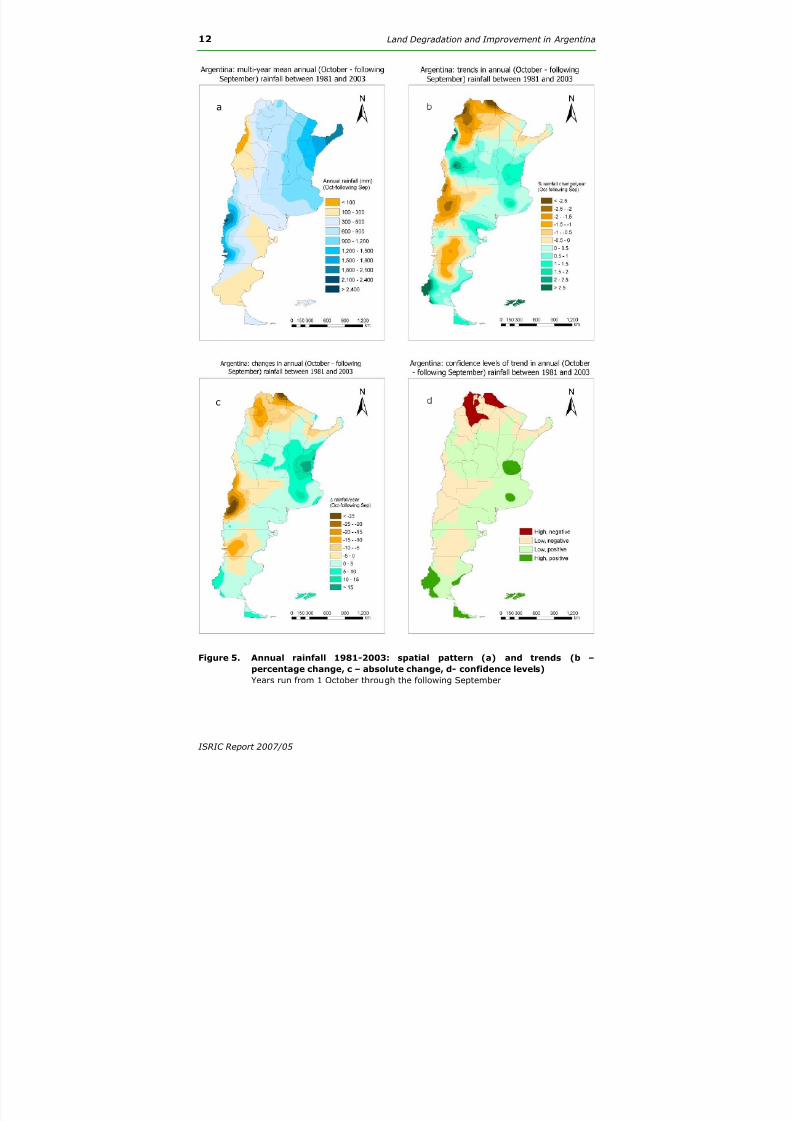
change, c – absolute change, d - confidence levels) .........................10 Figure 4. Spatially aggregated annual rainfall 1981-2003...............................11 Figure 5. Annual rainfall 1981-2003: spatial pattern (a) and trends (b –
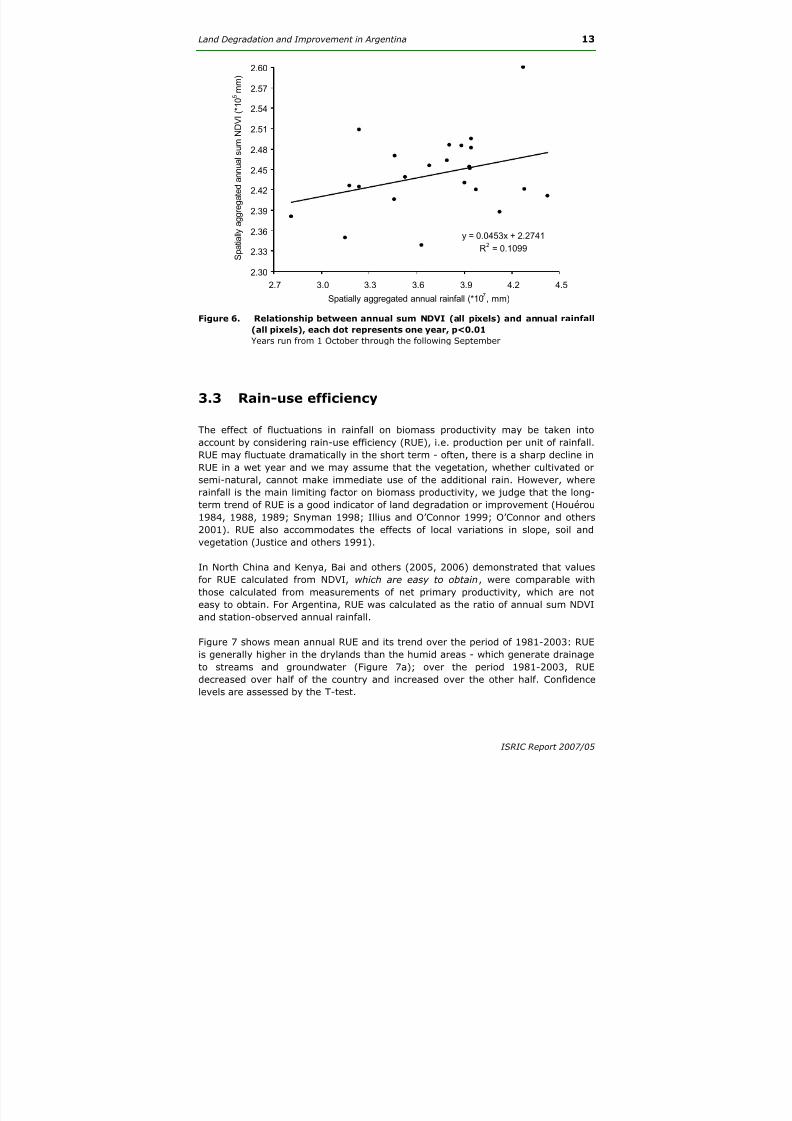
percentage change, c – absolute change, d- confidence levels)..........12 Figure 6. Relationship between annual sum NDVI (all pixels) and annual
rainfall (all pixels), each dot represents one year, p<0.01.................13 Figure 7. Rain-use efficiency 1981-2003: mean (a) and trends (b – percentage
change, c – absolute change, d - confidence levels) .........................14
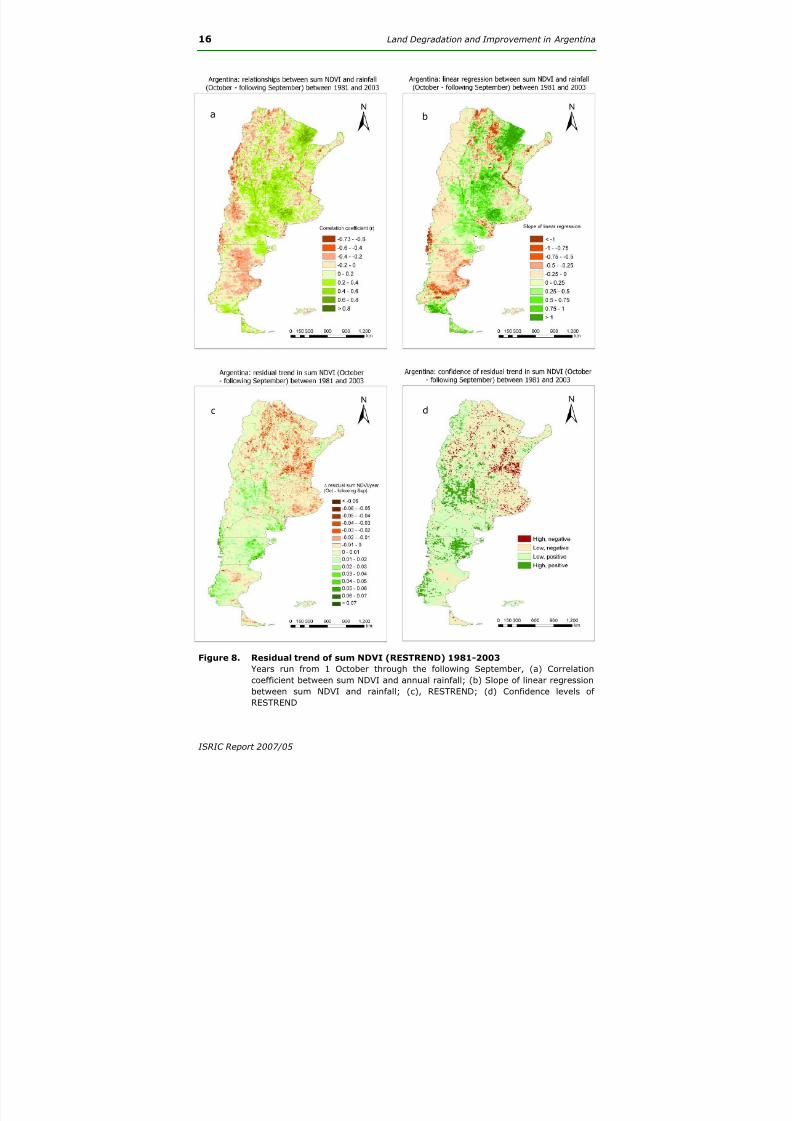
Figure 8. Residual trend of sum NDVI (RESTREND) 1981-2003 .......................16 Figure 9. Net primary productivity 1981-2003: mean (a) and trends (b, %
change; c, absolute change; d, confidence level) .............................18 Figure 10. Negative trend in RUE-adjusted annual sum NDVI, 1981-2003 ..........19 Figure 11. NPP loss in the degrading areas 1981-2003 ....................................20 Figure 12. Areas of increasing NPP, RUE and EUE, 1981-2003 ..........................21 Figure 13. NPP gain in the improving areas 1981-2003....................................22 Figure 14. Population counts affected by the land degradation..........................28 Figure 15. Relationship between population density and land degradation and
improvement..............................................................................28
Tables
Table 1. Changes in net primary productivity 1981-2003 ..............................17 Table 2. Argentina and the World: NPP loss from degrading land 1981-2003 ...20 Table 3. Comparison of trends in sum NDVI, RUE, RESTREND, and linkage to
degrading/improving lands, 1981-2003..........................................23 Table 4. Degrading and improving land by land cover...................................25 Table 5. Degrading and improving areas by land use systems (FAO 2008).......26 Table 6. Degrading/improving lands in the aggregated land use systems ........27
ISRIC Report 2007/05
8/13/2019 Report 2007 05 Land Degr Argentina REV Aug 2008 Productividad Degradacion
http://slidepdf.com/reader/full/report-2007-05-land-degr-argentina-rev-aug-2008-productividad-degradacion 6/56
iv Land Degradation and Improvement in Argentina
Abbreviations
CIESIN Center for International Earth Science Information Network,
Colombia University, Palisades, NYCoV Coefficient of Variation
CRU TS Climate Research Unit, Time Series
ENSO El Niño/Southern Oscillation
FAO Food and Agriculture Organization of the United Nations
GEF The Global Environment Facility, Washington DC
GIMMS The Global Inventory Modelling and Mapping Studies GLADA Global Assessment of Land Degradation and Improvement
GLASOD Global Assessment of Human-Induced Soil Degradation GPCC The Global Precipitation Climatology Centre, German Meteorological
Service, Offenbach
JRC European Commission Joint Research Centre, Ispra, Italy
LADA Land Degradation Assessment in Drylands
Landsat
ETM+
NASA Land Resources Satellites, Enhanced Thematic Mapper
LUS Land Use Systems, FAO
MOD17A3 MODIS 8-Day Net Primary Productivity dataset
MODIS Moderate Resolution Imaging Spectroradiometer
NASA National Aeronautics and Space Administration
NDVI Normalized Difference Vegetation Index NPP Net Primary Productivity RESTREND Residual Trend of sum NDVI
RUE Rain-Use Efficiency SOTER Soil and Terrain Database
SPOT Système Pour l’Observation de la Terre
SPSS Statistical Package for the Social Sciences Software
SRTM Shuttle Radar Topography Mission
UNCCD United Nations Convention to Combat Desertification UNCED United Nations Conference on Environment and Development
UNEP United Nations Environment Programme
VASClimO Variability Analyses of Surface Climate Observations
ISRIC Report 2007/05
8/13/2019 Report 2007 05 Land Degr Argentina REV Aug 2008 Productividad Degradacion
http://slidepdf.com/reader/full/report-2007-05-land-degr-argentina-rev-aug-2008-productividad-degradacion 7/56
Land Degradation and Improvement in Argentina 1
1 Introduction
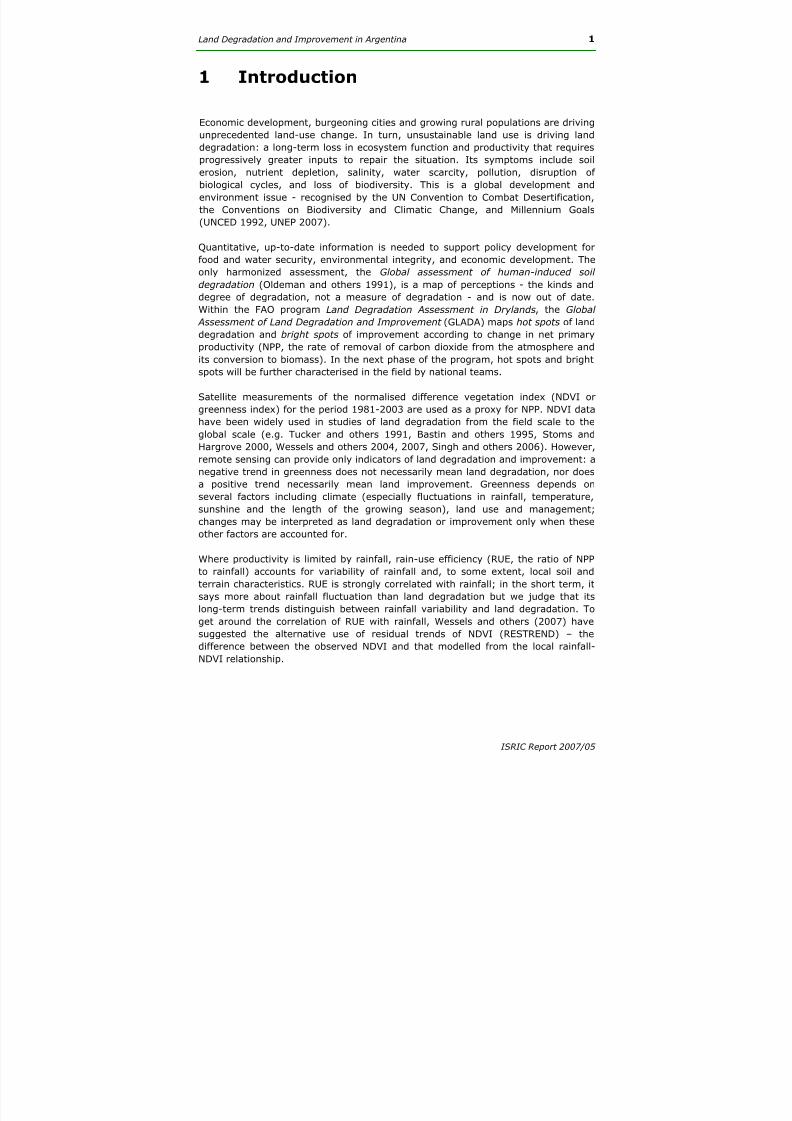
Economic development, burgeoning cities and growing rural populations are driving
unprecedented land-use change. In turn, unsustainable land use is driving landdegradation: a long-term loss in ecosystem function and productivity that requires
progressively greater inputs to repair the situation. Its symptoms include soil
erosion, nutrient depletion, salinity, water scarcity, pollution, disruption of
biological cycles, and loss of biodiversity. This is a global development and
environment issue - recognised by the UN Convention to Combat Desertification,
the Conventions on Biodiversity and Climatic Change, and Millennium Goals
(UNCED 1992, UNEP 2007).
Quantitative, up-to-date information is needed to support policy development for
food and water security, environmental integrity, and economic development. The
only harmonized assessment, the Global assessment of human-induced soildegradation (Oldeman and others 1991), is a map of perceptions - the kinds and
degree of degradation, not a measure of degradation - and is now out of date.
Within the FAO program Land Degradation Assessment in Drylands, the Global
Assessment of Land Degradation and Improvement (GLADA) maps hot spots of land
degradation and bright spots of improvement according to change in net primary
productivity (NPP, the rate of removal of carbon dioxide from the atmosphere and
its conversion to biomass). In the next phase of the program, hot spots and bright
spots will be further characterised in the field by national teams.
Satellite measurements of the normalised difference vegetation index (NDVI or
greenness index) for the period 1981-2003 are used as a proxy for NPP. NDVI data
have been widely used in studies of land degradation from the field scale to the
global scale (e.g. Tucker and others 1991, Bastin and others 1995, Stoms and
Hargrove 2000, Wessels and others 2004, 2007, Singh and others 2006). However,
remote sensing can provide only indicators of land degradation and improvement: a
negative trend in greenness does not necessarily mean land degradation, nor does
a positive trend necessarily mean land improvement. Greenness depends on
several factors including climate (especially fluctuations in rainfall, temperature,
sunshine and the length of the growing season), land use and management;
changes may be interpreted as land degradation or improvement only when these
other factors are accounted for.
Where productivity is limited by rainfall, rain-use efficiency (RUE, the ratio of NPP
to rainfall) accounts for variability of rainfall and, to some extent, local soil and
terrain characteristics. RUE is strongly correlated with rainfall; in the short term, it
says more about rainfall fluctuation than land degradation but we judge that its
long-term trends distinguish between rainfall variability and land degradation. To
get around the correlation of RUE with rainfall, Wessels and others (2007) have
suggested the alternative use of residual trends of NDVI (RESTREND) – the
difference between the observed NDVI and that modelled from the local rainfall-
NDVI relationship.
ISRIC Report 2007/05
8/13/2019 Report 2007 05 Land Degr Argentina REV Aug 2008 Productividad Degradacion
http://slidepdf.com/reader/full/report-2007-05-land-degr-argentina-rev-aug-2008-productividad-degradacion 8/56
2 Land Degradation and Improvement in Argentina
In this report, land degradation is identified by a declining trend in both NDVI and
RUE; presented as RUE-adjusted NDVI, which may be translated to NPP values that
are open to economic analysis. Comparable RESTREND values are presented as an
additional layer of information. The pattern of land degradation is further explored
by comparisons with land cover and land use, and socio-economic data.
ISRIC Report 2007/05
8/13/2019 Report 2007 05 Land Degr Argentina REV Aug 2008 Productividad Degradacion
http://slidepdf.com/reader/full/report-2007-05-land-degr-argentina-rev-aug-2008-productividad-degradacion 9/56
Land Degradation and Improvement in Argentina 3
2 Context and Method
2.1 GLADA partner country: Argentina
In Argentina, land degradation is severe and widespread, not only in drylands but
also in the most productive parts of the country. It threatens food and water
security, economic development, and natural resource conservation strategies.
Overgrazing has led to the progressive elimination of palatable species from the
high plateaux in the north to Patagonia. Woodcutting for timber, firewood, and
charcoal has depleted the woodlands; for instance in the Gran Chaco it is now
difficult to find good stands of quebracho that once grew everywhere. Soil erosion
by wind and water plagues both rangeland and cropland; it has been an intractable
problem, leading to abandonment of land, for example in NW of the country (UNEP
2007).
Spanish settlement in the 16th and 17th centuries brought woodcutting for mine
timbers and fuel, localised overgrazing and cultivation of sloping lands, and
consequent soil erosion. However, widespread land degradation dates from the
20th century. Burgeoning population, economic growth and globalisation ill-
matched with land tenure systems have combined to put further pressure on the
land.
Argentina is one of only 14 countries to have more than 1 million km 2 of dryland
(WRI 2003). Drylands cover two-thirds of the country and support 9 million people
- 30 per cent of the population (Naumann and Madariaga 2003, SAyDS 1997).
Ranching is the most extensive land use but hardly any pasture improvement hasbeen undertaken.
Extensive cropping has been accompanied by soil erosion by both water and wind.
In 1963, an estimated 16 million hectares was affected by wind erosion, most
seriously in the dry croplands in central Argentina; the situation has become worse
since then although some progress has been made in stabilizing dunes. The most
promising development has been the large-scale adoption of conservation tillage,
which increases infiltration of rain into the soil compared with conventional
ploughing; adoption rates in large farms are now better than 70 per cent although
adoption is less on small farms.
Irrigation is economically important but salinization and waterlogging affect much
of the irrigated land.
ISRIC Report 2007/05
8/13/2019 Report 2007 05 Land Degr Argentina REV Aug 2008 Productividad Degradacion
http://slidepdf.com/reader/full/report-2007-05-land-degr-argentina-rev-aug-2008-productividad-degradacion 10/56
4 Land Degradation and Improvement in Argentina
2.2 Data
N D V I a n d n e t p r i m a r y p r o d u c t iv i t y2 . 2 . 1
2 . 2 . 2
2 . 2 . 3
The NDVI data used in this study are produced by the Global Inventory Modellingand Mapping Studies (GIMMS) group from measurements made by the AVHRR
radiometer instrument on board US National Oceanic and Atmospheric
Administration satellites. The fortnightly images at 8km-spatial resolution are
corrected for calibration, view geometry, volcanic aerosols, and other effects not
related to actual vegetation change (Tucker and others 2004). These data are
compatible with those from other sensors such as MODIS, SPOT Vegetation, and
Landsat ETM+ (Tucker and others 2005, Brown and others 2006). GIMMS data
from July 1981 to December 2003 were used for this study.
To provide a measure of land degradation and improvement that is open to
economic analysis, the GIMMS NDVI time series has been translated to NPP usingMODIS (moderate-resolution imaging spectro-radiometer) data for the overlapping
period 2000-2003. MOD17A3 is a dataset of terrestrial gross and net primary
productivity, computed at 1-km resolution at an 8-day interval (Heinsch and others
2003, Running and others 2004). Though far from perfect (Plummer 2006), the
dataset has been validated in various landscapes (Fensholt and others 2004, 2006,
Gebremichael and Barros 2006, Turner and others 2003, 2006); MODIS gross and
net primary productivity are related to observed atmospheric CO2 and the inter-
annual variability associated with the ENSO phenomenon, indicating that these data
are reliable at the regional scale (Zhao and others 2005, 2006). The translation
from NDVI to NPP is approximate.
Cl i m a t i c d a t a
The VASClimO 1.1 dataset comprises the most complete monthly precipitation data
for 1951-2000. It is compiled on the basis of long, quality-controlled station
records, gridded at resolution of 0.5°, from 9 343 stations (Beck and others 2005),
about 60 in Argentina. For the period up to 2003, rainfall data are supplemented by
the GPCC full data re-analysis product (Schneider and others 2008) to provide
monthly rainfall values to match the GIMMS NDVI data. Mean annual temperature
values from the CRU TS 2.1 dataset (Mitchell and Jones 2005) of monthly, station-
observed values also gridded at 0.5o
resolution, were also used to calculate thearidity index and energy-use efficiency.
L a n d c o v e r a n d l a n d u s e
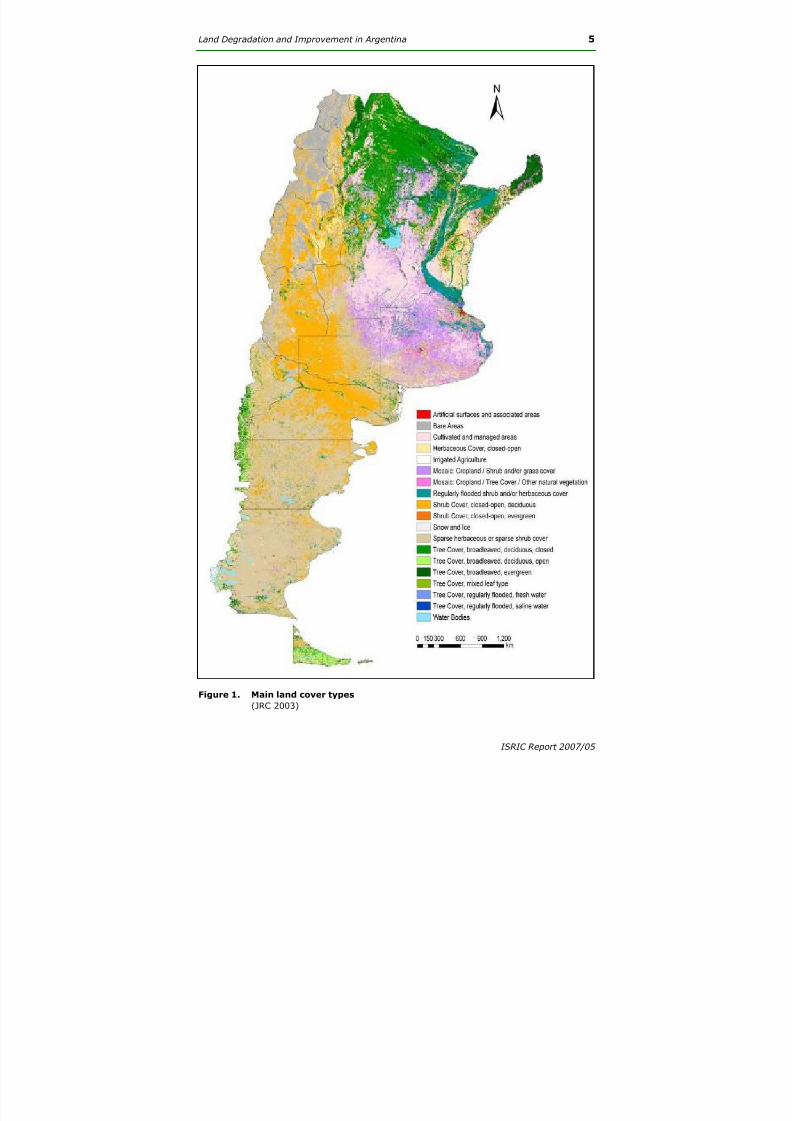
Land Cover 2000 global land cover data (JRC 2003) have been generalised for
Argentina (Figure 1) and used for preliminary comparison with NPP trends.
Likewise, land use data have been derived from Land use systems of the World
(FAO 2008).
ISRIC Report 2007/05
8/13/2019 Report 2007 05 Land Degr Argentina REV Aug 2008 Productividad Degradacion
http://slidepdf.com/reader/full/report-2007-05-land-degr-argentina-rev-aug-2008-productividad-degradacion 11/56
8/13/2019 Report 2007 05 Land Degr Argentina REV Aug 2008 Productividad Degradacion
http://slidepdf.com/reader/full/report-2007-05-land-degr-argentina-rev-aug-2008-productividad-degradacion 12/56
6 Land Degradation and Improvement in Argentina
So i l a n d t e r r a i n2 . 2 . 4
2 . 2 . 5
2 . 2 . 6
An updated soil and terrain database for Argentina at scale at 1:1M has been
prepared (Engelen and others 2008). This will be used in the next phase of
investigations for analysis of relationships between land degradation, soils and
landforms.
P o p u l a t i o n , u r b a n a r e a s a n d p o v e r t y i n d i ce s
The Global Rural-Urban Mapping Project provides data for population and urban
extent gridded at 30 arc-second resolution (CIESIN 2004); for this study, the
Urban/Rural Extents dataset is used to mask the urban area. Sub-national data for
population and, as proxies for poverty, rates of infant mortality and child
underweight status at 2.5 arc-minutes CIESIN 2005) were compared with indices of
land degradation.
A r i d i t y i n d e x
Turc’s aridity index was calculated as the formula P/PET where P is annual
precipitation in mm and ))/(9.0(/ 2 LPPPET += where L = 300 + 25T + 0.05T3
where T is mean annual temperature (Jones 1997). Precipitation was taken from
the gridded VASClimO data, mean annual temperature from CRU TS 2.1 data.
RESTREND2 . 2 . 7 Following the general procedure of Wessels and others (2007), correlation between
annual sum NDVI and annual rainfall (beginning October 1 through the following
September) was calculated for each pixel. The regression equation enables
prediction of sum NDVI according to rainfall. Residuals of sum NDVI (i.e. differences
between the observed and predicted sum NDVI) were calculated, and the trend of
these residuals was analysed by linear regression.
2.3 Analysis
Land degradation and improvement are identified by a sequence of analyses of
remotely sensed data:
1. Simple NDVI indicators: NDVI minimum, maximum, maximum-minimum,
mean, sum, standard deviation and coefficient of variation are computed for
the period October to the following September, encompassing a complete
growing season. Their trends are analysed over the 23-year period of the
GIMMS data (Appendix2).
2. Annual sum NDVI, representing the aggregated greenness over the
biological year, is chosen as the standard proxy for annual biomass
productivity. NDVI is translated to net primary productivity (NPP) by
correlation with MODIS data; trends are calculated by linear regression.
ISRIC Report 2007/05
8/13/2019 Report 2007 05 Land Degr Argentina REV Aug 2008 Productividad Degradacion
http://slidepdf.com/reader/full/report-2007-05-land-degr-argentina-rev-aug-2008-productividad-degradacion 13/56
Land Degradation and Improvement in Argentina 7
3. To distinguish between declining productivity caused by land degradation
and declining productivity caused by rainfall variability, the following
procedure was adopted;
a. Identify the areas where there is a positive relationship between
productivity and rainfall, i.e. where rainfall determines NPP;
b.
For those areas where rainfall determines productivity, RUE wasconsidered: where productivity declined but RUE increased, declining
productivity was attributed to declining rainfall and those areas were
masked;
c. For the remaining areas with a positive relationship between NDVI
and rainfall, and for all areas where there is a negative relationship
between NDVI and rainfall (humid and irrigated areas where rainfall
does not determine NPP), NDVI trend has been calculated as RUE-
adjusted NDVI;
d. Land degradation is indicated by a negative trend in RUE-adjusted
NDVI and may be quantified as RUE-adjusted NPP.
4. Residual trends of NDVI (RESTREND);
5. Energy-use efficiency – the ratio of annual sum NDVI to accumulated
temperature;
6. Stratification of the landscape according to land cover and land use, aridity
index, and calculation of the loss of NPP, e.g. for various land use types or
for all degrading areas; urban areas are masked;
7. Comparison of indices of land degradation with rural population density and
poverty.
Details of the analytical methods are given as Appendix 1. Algorithms have been
developed that enable these screening analyses to be undertaken automatically.
At the next stage of analysis, areas of land degradation and improvement identified
on the basis of NDVI indices will be characterised manually, using 30m-resolution
Landsat data, to identify the probable kinds of land degradation, and comparison
will be made with updated soil and terrain data. At the same time, the continuous
field of the index of land degradation derived from NDVI and climatic data will
enable a statistical examination of other data for which continuous spatial coverage
is not available - for instance spot measurements of soil attributes, and other social
and economic data that may reflect the drivers of land degradation, provided that
these other data are geo-located.
Finally, field examination of the identified areas of degradation and improvement
will be undertaken by national teams within the LADA program.
ISRIC Report 2007/05

8/13/2019 Report 2007 05 Land Degr Argentina REV Aug 2008 Productividad Degradacion
http://slidepdf.com/reader/full/report-2007-05-land-degr-argentina-rev-aug-2008-productividad-degradacion 14/56
8/13/2019 Report 2007 05 Land Degr Argentina REV Aug 2008 Productividad Degradacion
http://slidepdf.com/reader/full/report-2007-05-land-degr-argentina-rev-aug-2008-productividad-degradacion 15/56
Land Degradation and Improvement in Argentina 9
3 Results
The spatial patterns and temporal trends of several indicators of land degradation
and improvement are presented in Appendix 2. The main text deals withinterpretation of the annual sum NDVI data - which are taken to represent annual
green biomass productivity.
3.1 Trends in biomass productivity
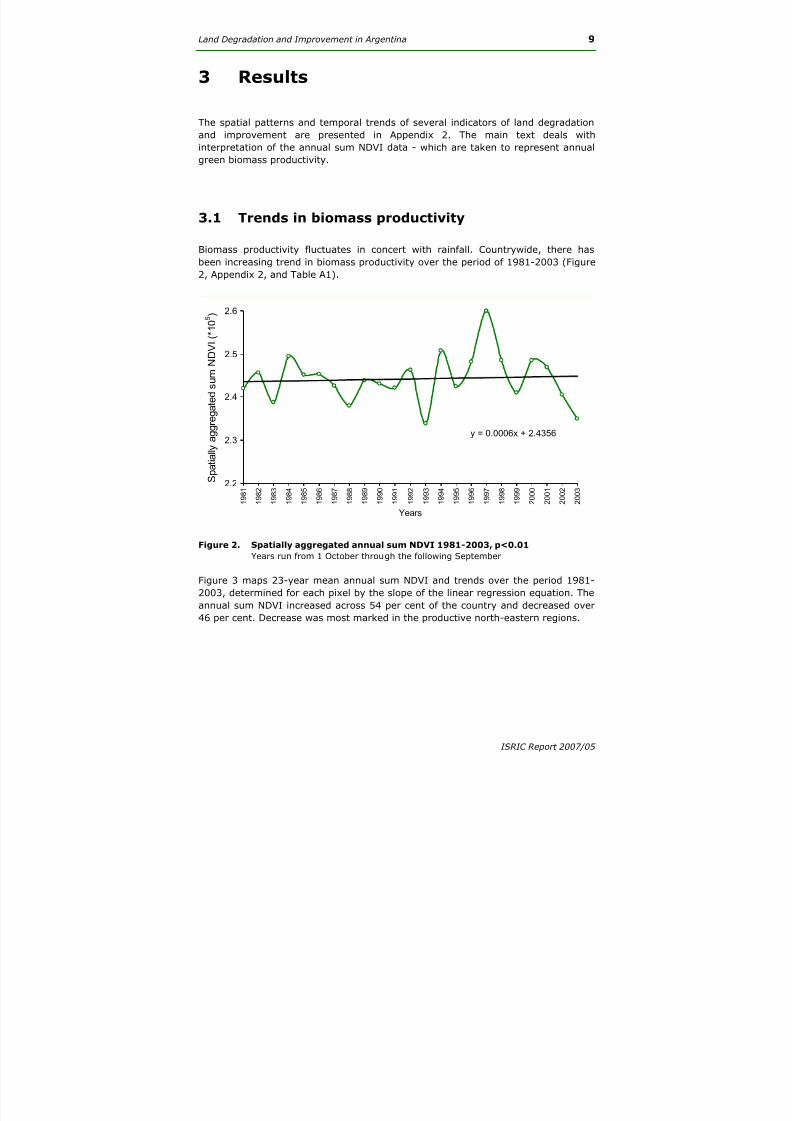
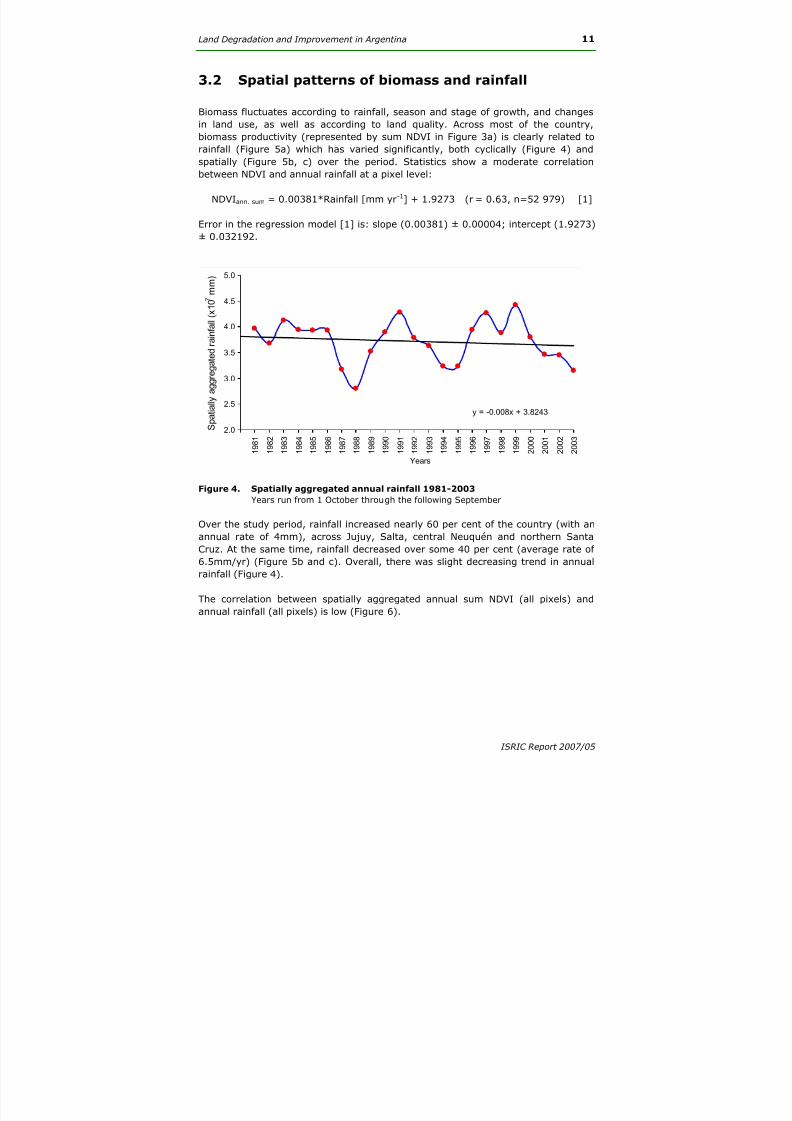
Biomass productivity fluctuates in concert with rainfall. Countrywide, there has
been increasing trend in biomass productivity over the period of 1981-2003 (Figure
2, Appendix 2, and Table A1).
y = 0.0006x + 2.4356
2.2
2.3
2.4
2.5
2.6
1 9 8 1
1 9 8 2
1 9 8 3
1 9 8 4
1 9 8 5
1 9 8 6
1 9 8 7
1 9 8 8
1 9 8 9
1 9 9 0
1 9 9 1
1 9 9 2
1 9 9 3
1 9 9 4
1 9 9 5
1 9 9 6
1 9 9 7
1 9 9 8
1 9 9 9
2 0 0 0
2 0 0 1
2 0 0 2
2 0 0 3
Years
S p a t i a l l y a g g r e g
a t e d s u m N
D V I ( * 1 0 5 )
Figure 2. Spatially aggregated annual sum NDVI 1981-2003, p<0.01
Years run from 1 October through the following September
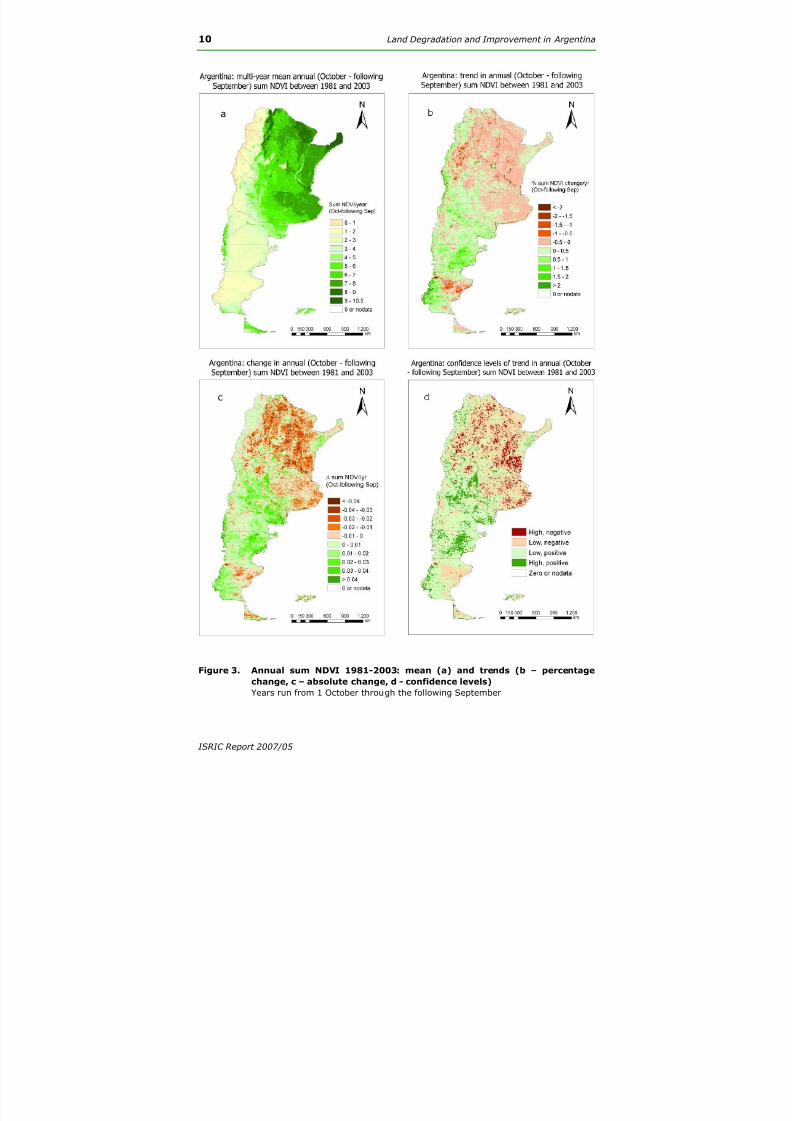
Figure 3 maps 23-year mean annual sum NDVI and trends over the period 1981-
2003, determined for each pixel by the slope of the linear regression equation. The
annual sum NDVI increased across 54 per cent of the country and decreased over
46 per cent. Decrease was most marked in the productive north-eastern regions.
ISRIC Report 2007/05
8/13/2019 Report 2007 05 Land Degr Argentina REV Aug 2008 Productividad Degradacion
http://slidepdf.com/reader/full/report-2007-05-land-degr-argentina-rev-aug-2008-productividad-degradacion 16/56
10 Land Degradation and Improvement in Argentina
c
a
Figure 3. Annual sum NDVI 1981-2003: mean (a) and trends (b – percentage
change, c – absolute change, d - confidence levels)
Years run from 1 October through the following September
ISRIC Report 2007/05
8/13/2019 Report 2007 05 Land Degr Argentina REV Aug 2008 Productividad Degradacion
http://slidepdf.com/reader/full/report-2007-05-land-degr-argentina-rev-aug-2008-productividad-degradacion 17/56
8/13/2019 Report 2007 05 Land Degr Argentina REV Aug 2008 Productividad Degradacion
http://slidepdf.com/reader/full/report-2007-05-land-degr-argentina-rev-aug-2008-productividad-degradacion 18/56
8/13/2019 Report 2007 05 Land Degr Argentina REV Aug 2008 Productividad Degradacion
http://slidepdf.com/reader/full/report-2007-05-land-degr-argentina-rev-aug-2008-productividad-degradacion 19/56
8/13/2019 Report 2007 05 Land Degr Argentina REV Aug 2008 Productividad Degradacion
http://slidepdf.com/reader/full/report-2007-05-land-degr-argentina-rev-aug-2008-productividad-degradacion 20/56
14 Land Degradation and Improvement in Argentina
dc
ba
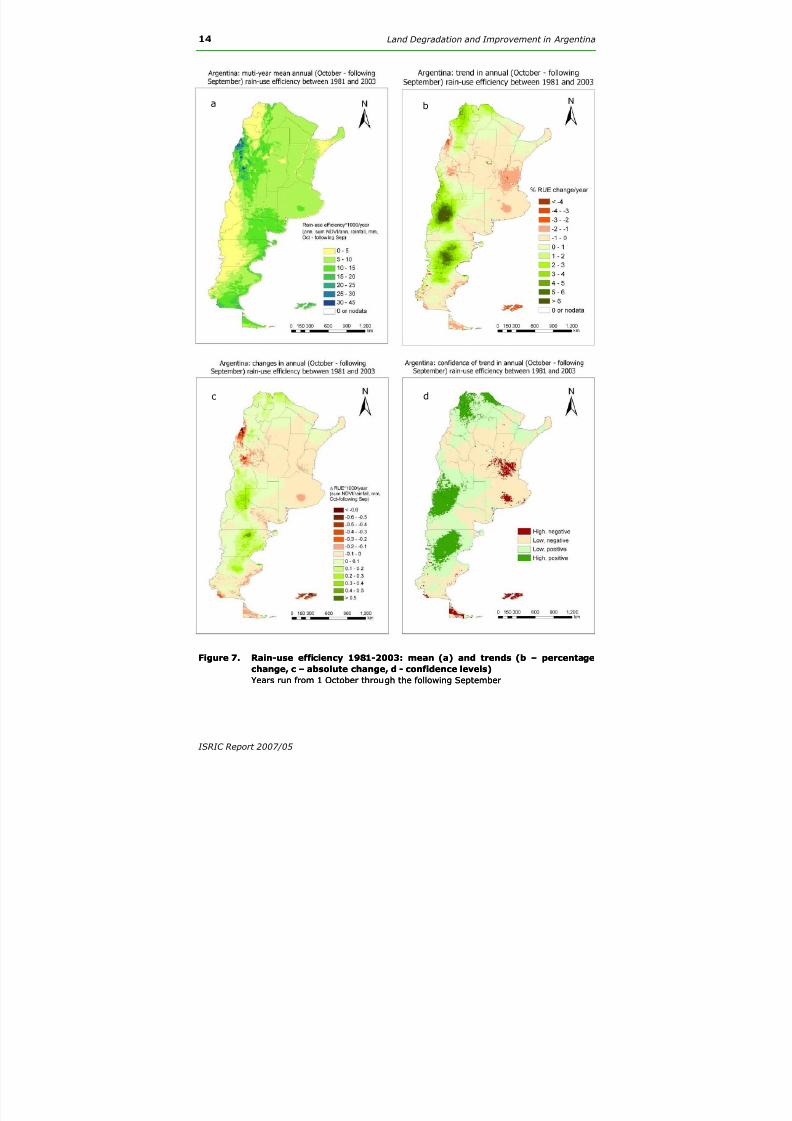
Figure 7. Rain-use efficiency 1981-2003: mean (a) and trends (b – percentage
change, c – absolute change, d - confidence levels)
Figure 7. Rain-use efficiency 1981-2003: mean (a) and trends (b – percentage
change, c – absolute change, d - confidence levels)
Years run from 1 October through the following SeptemberYears run from 1 October through the following September
ISRIC Report 2007/05
8/13/2019 Report 2007 05 Land Degr Argentina REV Aug 2008 Productividad Degradacion
http://slidepdf.com/reader/full/report-2007-05-land-degr-argentina-rev-aug-2008-productividad-degradacion 21/56
Land Degradation and Improvement in Argentina 15
Areas of declining RUE include Buenos Aires, Entre Rios, Santa Fe, Cordoba, San
Juan, Misiones, eastern La Pampa, eastern Rio Negro, NW La Rioja and SW
Catamarca; significantly, several of these are humid, highly productive areas.
3.4 RESTREND
Countrywide, there is a significant negative correlation between RUE and rainfall
(r=-0.53, n=52 979) and RUE fluctuates from year to year; used in isolation, RUE
says as much about rainfall variability as about land degradation. To avoid the
correlations between RUE and rainfall and so distinguish land degradation from the
effects of rainfall variability, Wessels and others (2007) suggest the alternative use
of residual trends (RESTREND).
Following their general procedure, we have correlated for each pixel annual sumNDVI and annual rainfall (with the year running from October 1 through the
following September to include the entire growing season). The resulting regression
equation represents the statistical association between observed sum NDVI and
rainfall (Figure 8a, b); the model predicts sum NDVI according to rainfall. Residuals
of sum NDVI (i.e. differences between the observed and predicted sum NDVI) for
each pixel were calculated, and the trend of these residuals (RESTREND) was
analysed by linear regression (Figure 8c). T-test confidence levels are shown in
Figure 8d.
RESTREND points in the same direction as RUE: a negative RESTREND may indicate
land degradation, a positive RESTREND improvement but the spatial distribution isdifferent from RUE; overall, RESTREND patterns are remarkably close to sum NDVI
but of lesser amplitude (Figure 3c), see Section 3.8.
ISRIC Report 2007/05
8/13/2019 Report 2007 05 Land Degr Argentina REV Aug 2008 Productividad Degradacion
http://slidepdf.com/reader/full/report-2007-05-land-degr-argentina-rev-aug-2008-productividad-degradacion 22/56
8/13/2019 Report 2007 05 Land Degr Argentina REV Aug 2008 Productividad Degradacion
http://slidepdf.com/reader/full/report-2007-05-land-degr-argentina-rev-aug-2008-productividad-degradacion 23/56
Land Degradation and Improvement in Argentina 17
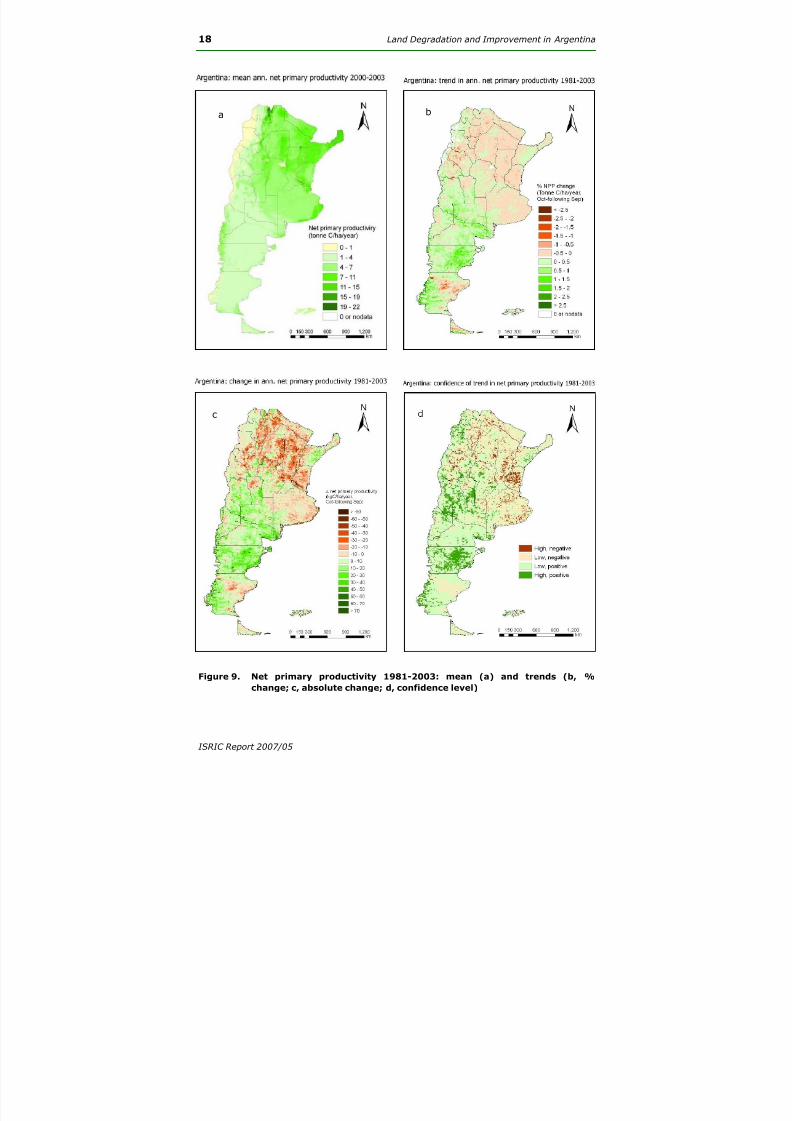
3.5 Net primary productivity
It is hard to visualise the degree of land degradation and improvement from NDVI
values. To estimate their quantitative effects, NDVI may be translated to net
primary productivity (NPP) - the rate at which vegetation fixes CO2 from theatmosphere less losses through respiration; in other words, biomass productivity –
which includes food, fibre and wood. The most accessible global NPP data are from
the MODIS model (at 1km resolution from the year 2000). Figure 9a shows four-
year (2000-2003) mean annual MODIS NPP at 1-km resolution; the pattern is
similar to the GIMMS annual sum NDVI (Figure 3a) but at finer detail.
GIMMS NDVI data were translated to NPP by correlation with MODIS 8-day NPP
values for the overlapping period: MODIS four-year annual mean NPP was re-
sampled to 8km resolution by nearest neighbour assignment; the four-year mean
annual sum NDVI over the same period (2000-2003) was then calculated.
Correlation between the two data sets is high:
NPPMOD17 [tonneC ha-1 year-1] = 0.9296 * NDVIsum + 0.24898 [2]
(r2 = 0.78, n = 51 763, P<0.001)
Where NPPMOD17 is annual net primary productivity derived from MOD17, NDVIsum is
a four-year (2000-2003) mean annual sum NDVI derived from GIMMS. Error in the
regression model [2] is: slope (0.9296) ± 0.00457; intercept (0.25898) ± 0.0238.
The high coefficient of variation (r2) indicates that MOD17A3 NPP can be reasonably
used to convert the GIMMS NDVI values to NPP.
The percentage and absolute changes in NPP are mapped in Figure 9b and c; the
confidence level (Figure 9d) refers to the T-test (Appendix 1). During the period,
NPP increased overall (Table 1).
Table 1. Changes in net primary productivity 1981-2003
Positive Negative Mean
Land area (pixels, %) 53 47
% NPP change/year (tonneC ha-1 year-1) 0.37 0.21 0.10
∆ NPP (kg C ha-1 year-1) 12.2 11.5 1.0
ISRIC Report 2007/05
8/13/2019 Report 2007 05 Land Degr Argentina REV Aug 2008 Productividad Degradacion
http://slidepdf.com/reader/full/report-2007-05-land-degr-argentina-rev-aug-2008-productividad-degradacion 24/56
18 Land Degradation and Improvement in Argentina
b
c
a
Figure 9. Net primary productivity 1981-2003: mean (a) and trends (b, %
change; c, absolute change; d, confidence level)
ISRIC Report 2007/05
8/13/2019 Report 2007 05 Land Degr Argentina REV Aug 2008 Productividad Degradacion
http://slidepdf.com/reader/full/report-2007-05-land-degr-argentina-rev-aug-2008-productividad-degradacion 25/56
Land Degradation and Improvement in Argentina 19
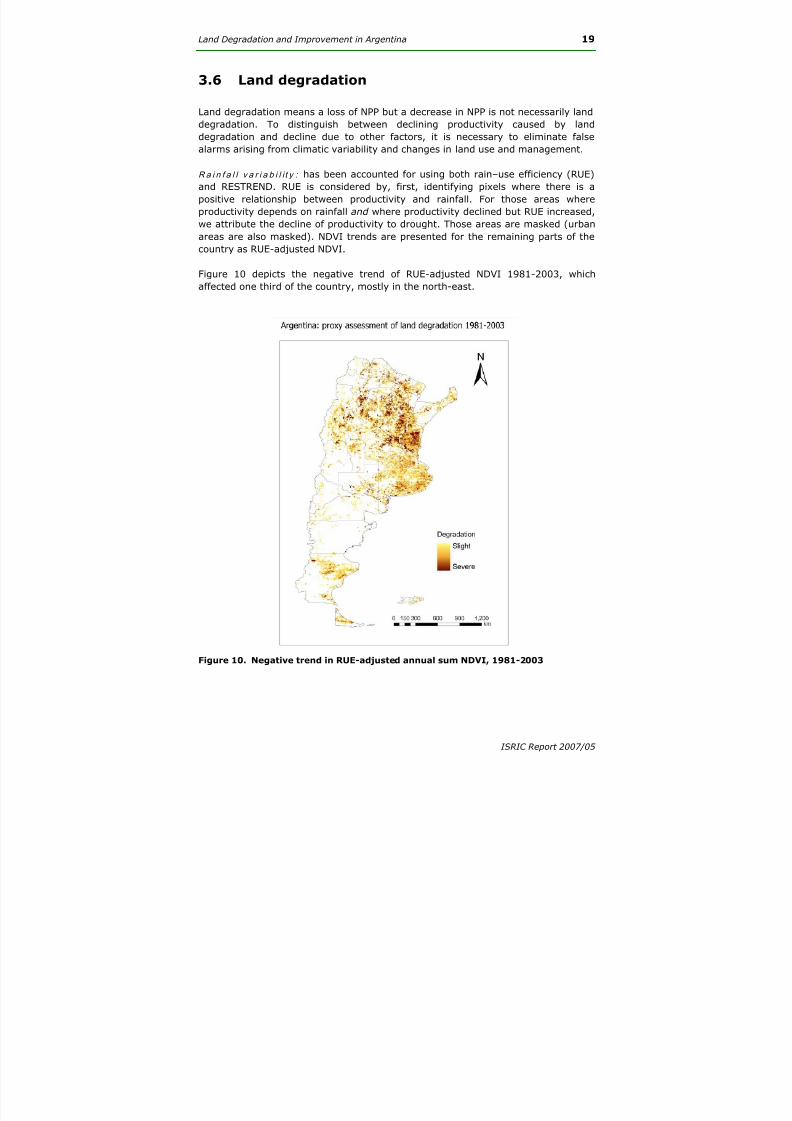
3.6 Land degradation
Land degradation means a loss of NPP but a decrease in NPP is not necessarily land
degradation. To distinguish between declining productivity caused by land
degradation and decline due to other factors, it is necessary to eliminate falsealarms arising from climatic variability and changes in land use and management.
Ra i n f a l l v a r i a b i l i t y : has been accounted for using both rain–use efficiency (RUE)
and RESTREND. RUE is considered by, first, identifying pixels where there is a
positive relationship between productivity and rainfall. For those areas where
productivity depends on rainfall and where productivity declined but RUE increased,
we attribute the decline of productivity to drought. Those areas are masked (urban
areas are also masked). NDVI trends are presented for the remaining parts of the
country as RUE-adjusted NDVI.
Figure 10 depicts the negative trend of RUE-adjusted NDVI 1981-2003, whichaffected one third of the country, mostly in the north-east.
Figure 10. Negative trend in RUE-adjusted annual sum NDVI, 1981-2003
ISRIC Report 2007/05
8/13/2019 Report 2007 05 Land Degr Argentina REV Aug 2008 Productividad Degradacion
http://slidepdf.com/reader/full/report-2007-05-land-degr-argentina-rev-aug-2008-productividad-degradacion 26/56
20 Land Degradation and Improvement in Argentina
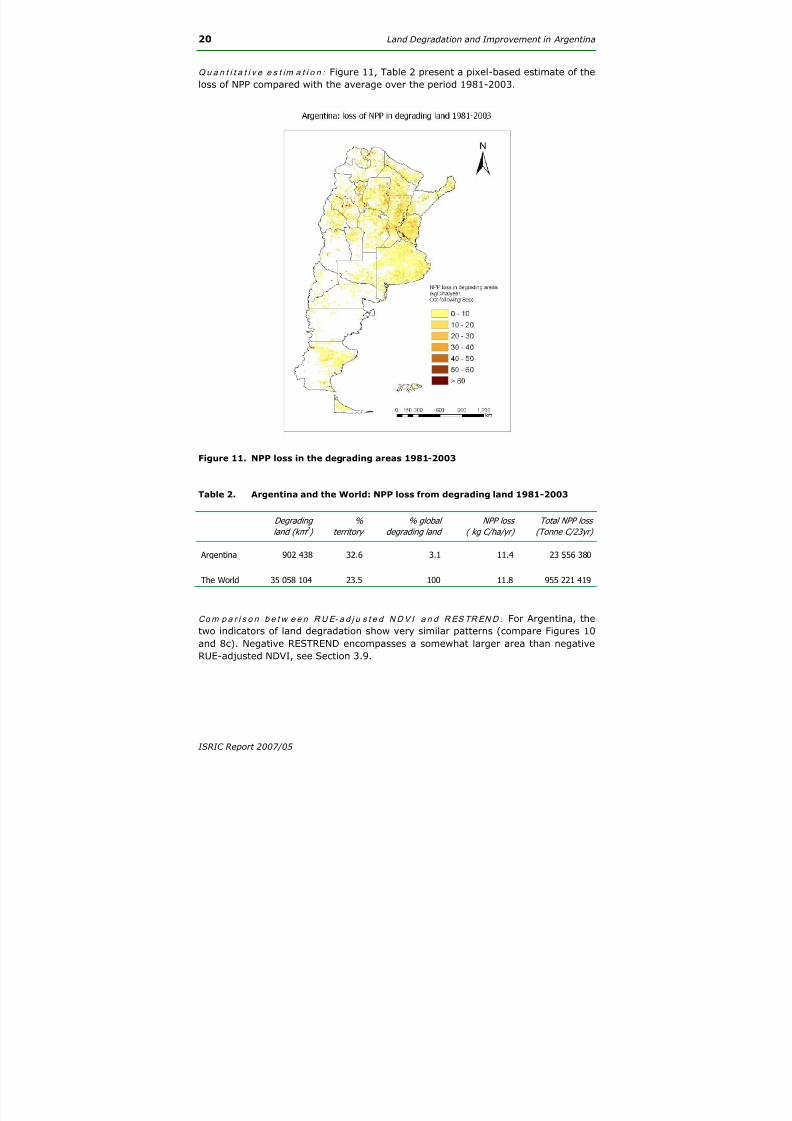
Q u a n t i t a t i v e e s t im a t i o n : Figure 11, Table 2 present a pixel-based estimate of the
loss of NPP compared with the average over the period 1981-2003.
Figure 11. NPP loss in the degrading areas 1981-2003
Table 2. Argentina and the World: NPP loss from degrading land 1981-2003
Degrading
land (km 2 )
%
territory
% global
degrading land
NPP loss
( kg C/ha/yr)
Total NPP loss
(Tonne C/23yr)
Argentina 902 438 32.6 3.1 11.4 23 556 380
The World 35 058 104 23.5 100 11.8 955 221 419
Com p a r i s o n b e t w e e n RUE- a d j u s t e d NDV I a n d RESTREND : For Argentina, the
two indicators of land degradation show very similar patterns (compare Figures 10
and 8c). Negative RESTREND encompasses a somewhat larger area than negative
RUE-adjusted NDVI, see Section 3.9.
ISRIC Report 2007/05
8/13/2019 Report 2007 05 Land Degr Argentina REV Aug 2008 Productividad Degradacion
http://slidepdf.com/reader/full/report-2007-05-land-degr-argentina-rev-aug-2008-productividad-degradacion 27/56
Land Degradation and Improvement in Argentina 21
L a n d u s e c h a n g e : As with rainfall variability, land use change may generate false
alarms about land degradation. Conversion of forest or grassland to cropland or
pasture will usually result in an immediate reduction in NDVI (and NPP) but may
well be profitable and sustainable, depending on management. Lack of consistent
time series data for land use and management precludes a generalised analysis of
land use change but this can be undertaken manually for the potential hot spots identified in this analysis.
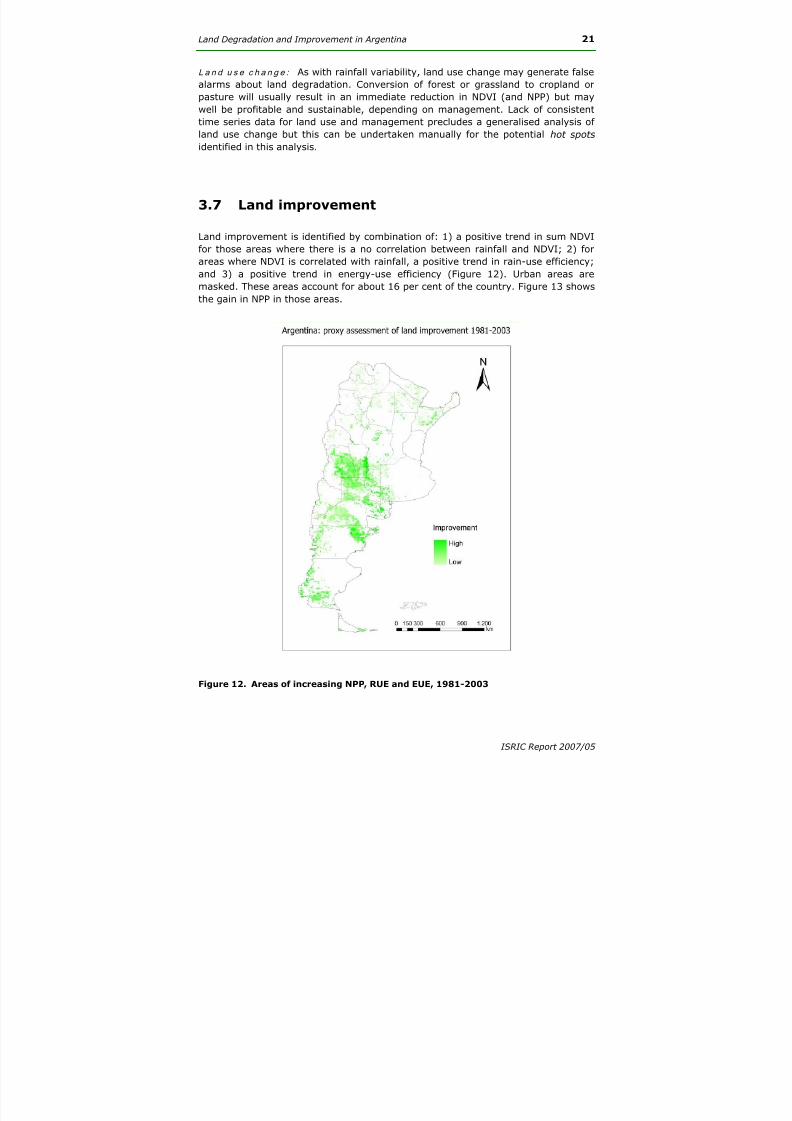
3.7 Land improvement
Land improvement is identified by combination of: 1) a positive trend in sum NDVI
for those areas where there is a no correlation between rainfall and NDVI; 2) for
areas where NDVI is correlated with rainfall, a positive trend in rain-use efficiency;
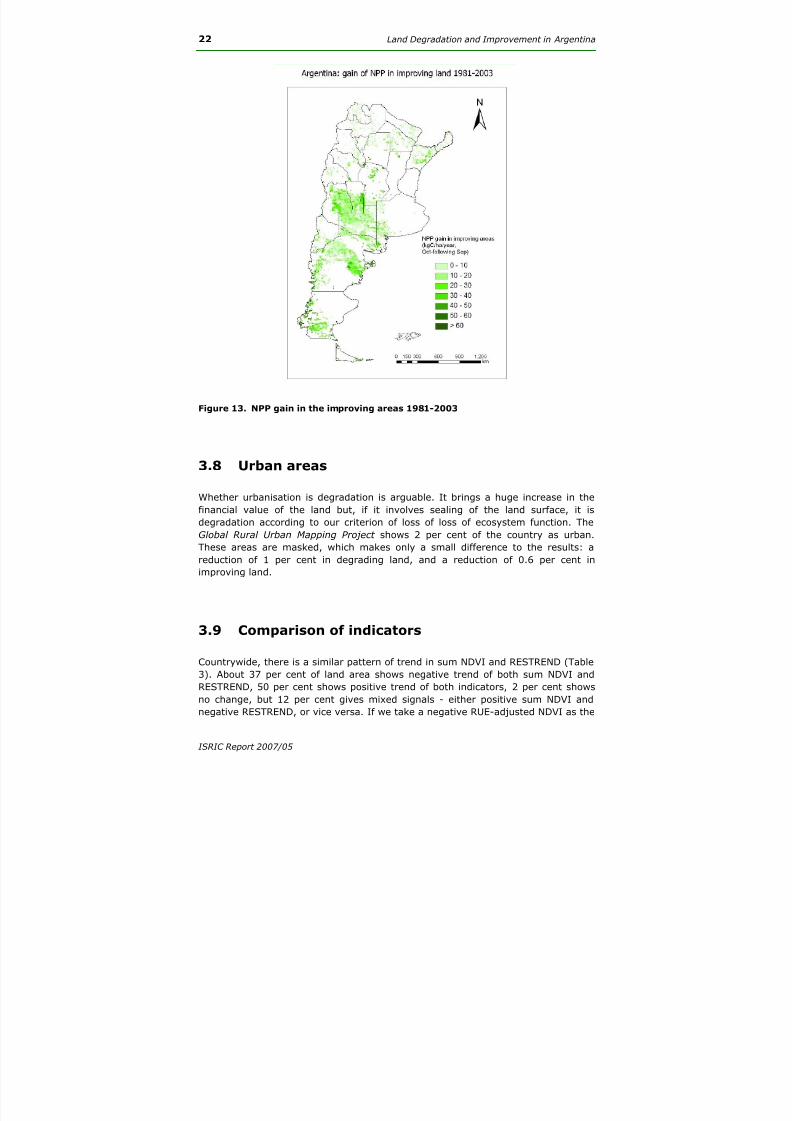
and 3) a positive trend in energy-use efficiency (Figure 12). Urban areas aremasked. These areas account for about 16 per cent of the country. Figure 13 shows
the gain in NPP in those areas.
Figure 12. Areas of increasing NPP, RUE and EUE, 1981-2003
ISRIC Report 2007/05
8/13/2019 Report 2007 05 Land Degr Argentina REV Aug 2008 Productividad Degradacion
http://slidepdf.com/reader/full/report-2007-05-land-degr-argentina-rev-aug-2008-productividad-degradacion 28/56
8/13/2019 Report 2007 05 Land Degr Argentina REV Aug 2008 Productividad Degradacion
http://slidepdf.com/reader/full/report-2007-05-land-degr-argentina-rev-aug-2008-productividad-degradacion 29/56
Land Degradation and Improvement in Argentina 23
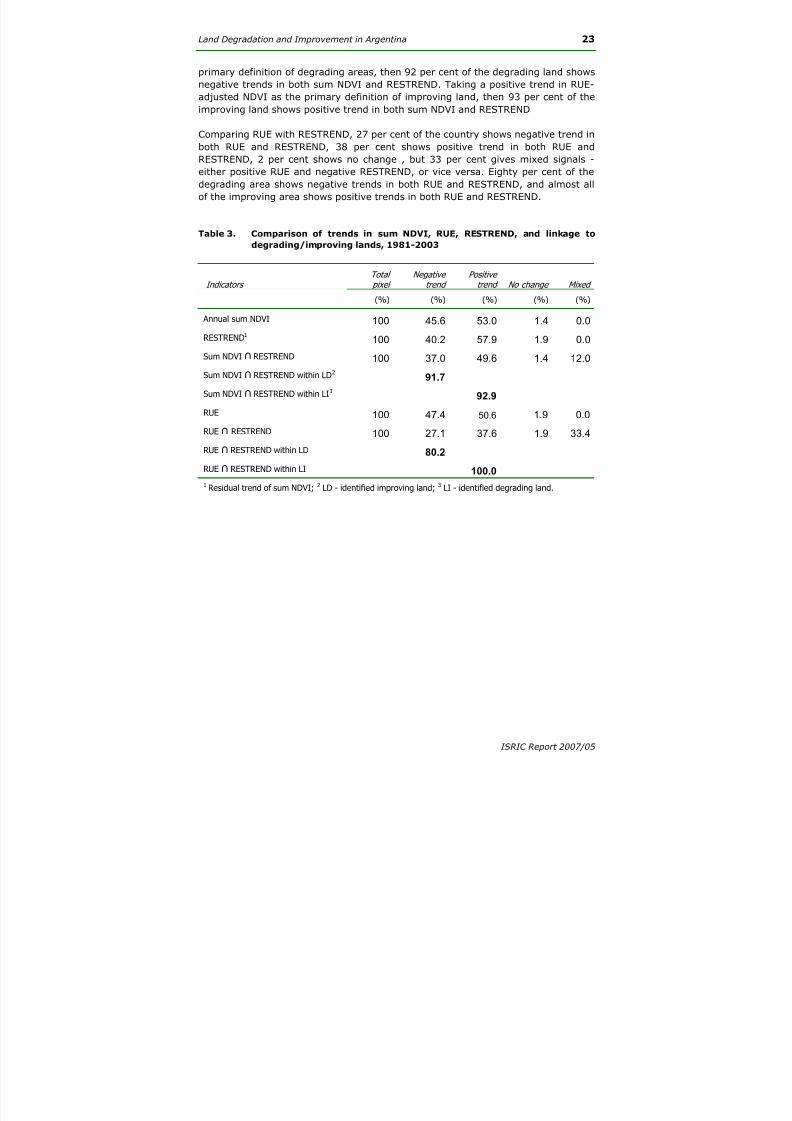
primary definition of degrading areas, then 92 per cent of the degrading land shows
negative trends in both sum NDVI and RESTREND. Taking a positive trend in RUE-
adjusted NDVI as the primary definition of improving land, then 93 per cent of the
improving land shows positive trend in both sum NDVI and RESTREND
Comparing RUE with RESTREND, 27 per cent of the country shows negative trend inboth RUE and RESTREND, 38 per cent shows positive trend in both RUE and
RESTREND, 2 per cent shows no change , but 33 per cent gives mixed signals -
either positive RUE and negative RESTREND, or vice versa. Eighty per cent of the
degrading area shows negative trends in both RUE and RESTREND, and almost all
of the improving area shows positive trends in both RUE and RESTREND.
Table 3. Comparison of trends in sum NDVI, RUE, RESTREND, and linkage to
degrading/improving lands, 1981-2003
IndicatorsTotal pixel
Negativetrend
Positivetrend No change Mixed
(%) (%) (%) (%) (%)
Annual sum NDVI 100 45.6 53.0 1.4 0.0
RESTREND1100 40.2 57.9 1.9 0.0
Sum NDVI ∩ RESTREND 100 37.0 49.6 1.4 12.0
Sum NDVI ∩ RESTREND within LD2 91.7
Sum NDVI ∩ RESTREND within LI3 92.9
RUE 100 47.4 50.6 1.9 0.0
RUE ∩ RESTREND 100 27.1 37.6 1.9 33.4
RUE ∩ RESTREND within LD 80.2
RUE ∩ RESTREND within LI 100.0
1 Residual trend of sum NDVI; 2 LD - identified improving land; 3 LI - identified degrading land.
ISRIC Report 2007/05
8/13/2019 Report 2007 05 Land Degr Argentina REV Aug 2008 Productividad Degradacion
http://slidepdf.com/reader/full/report-2007-05-land-degr-argentina-rev-aug-2008-productividad-degradacion 30/56
24 Land Degradation and Improvement in Argentina
ISRIC Report 2007/05
3 . 1 0 . 1 3.10 Analysis of degrading and improving areas
A s so c ia t i o n w i t h l a n d c o v e r a n d l a n d u s e
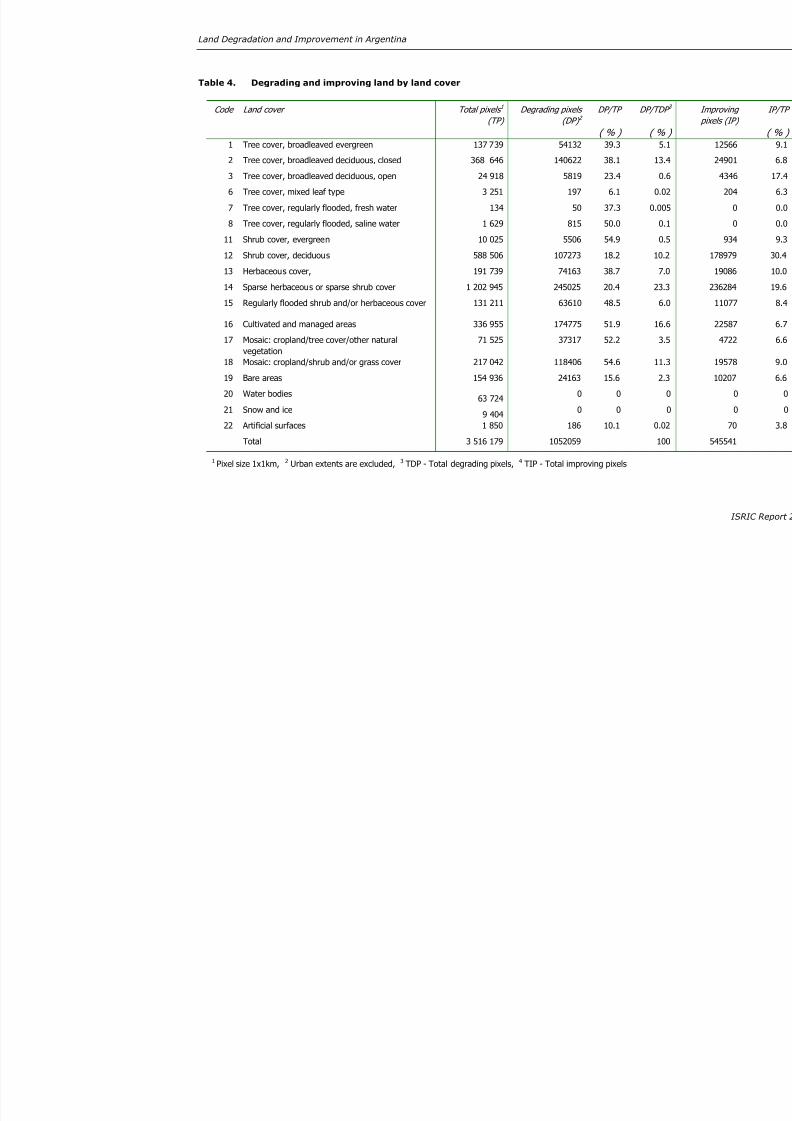
Comparing degrading and improving areas with land cover (Table 4): 17 per cent ofdegrading land is cropland and a further 15 per cent mosaic of cropland with other
land covers, so at least half of the arable is affected; 47 per cent of degrading land
is scrub and grassland; 19 per cent is forest. Over 80 per cent of the improving
land is grassland and scrub; only 4 per cent is cropland with a further 4.5 per cent
mosaic of cropland with other land cover.
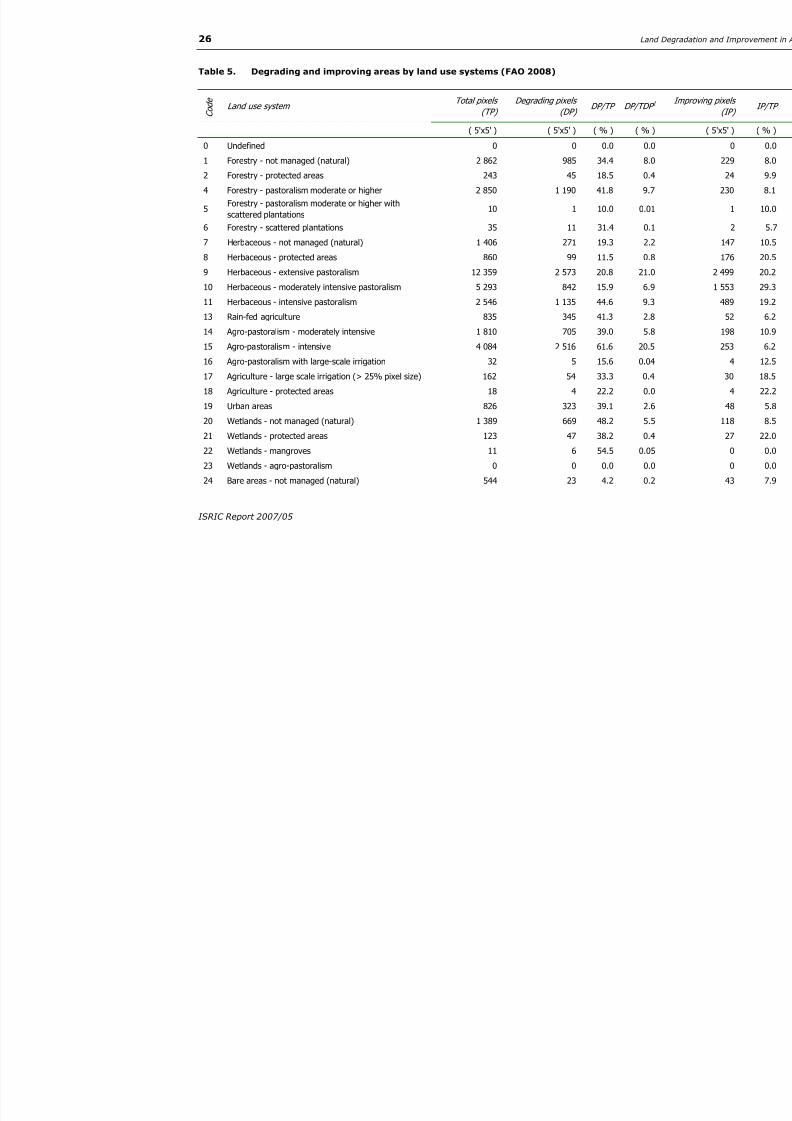
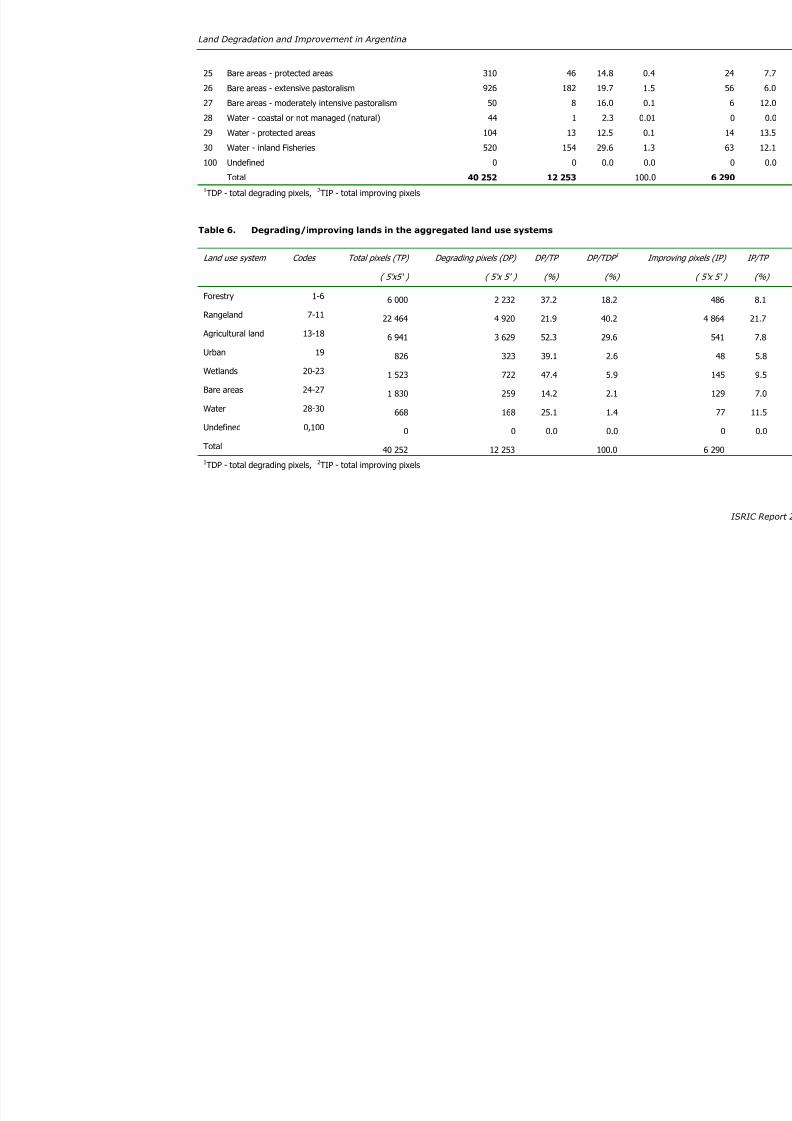
Comparing degrading areas with global land use systems (Table 5): 30 per cent is
agricultural land, 40 per cent is rangeland, and 18 per cent forestry. Most
improving land is rangeland, only 9 per cent is agricultural land and 8 per cent is
under forestry (Table 6).
8/13/2019 Report 2007 05 Land Degr Argentina REV Aug 2008 Productividad Degradacion
http://slidepdf.com/reader/full/report-2007-05-land-degr-argentina-rev-aug-2008-productividad-degradacion 31/56
Land Degradation and Improvement in Argentina
Table 4. Degrading and improving land by land cover
Code Land cover Total pixels 1
(TP)
Degrading pixels
(DP) 2
DP/TP DP/TDP 3
( % ) ( % )
1 Tree cover, broadleaved evergreen 137 739 54132 39.3 5.1
2 Tree cover, broadleaved deciduous, closed 368 646 140622 38.1 13.4
3 Tree cover, broadleaved deciduous, open 24 918 5819 23.4 0.6
6 Tree cover, mixed leaf type 3 251 197 6.1 0.02
7 Tree cover, regularly flooded, fresh water 134 50 37.3 0.005
8 Tree cover, regularly flooded, saline water 1 629 815 50.0 0.1
11 Shrub cover, evergreen 10 025 5506 54.9 0.5
12 Shrub cover, deciduous 588 506 107273 18.2 10.2
13 Herbaceous cover, 191 739 74163 38.7 7.0
14 Sparse herbaceous or sparse shrub cover 1 202 945 245025 20.4 23.3
15 Regularly flooded shrub and/or herbaceous cover 131 211 63610 48.5 6.0
16 Cultivated and managed areas 336 955 174775 51.9 16.6
17 Mosaic: cropland/tree cover/other natural
vegetation
71 525 37317 52.2 3.5
18 Mosaic: cropland/shrub and/or grass cover 217 042 118406 54.6 11.3
19 Bare areas 154 936 24163 15.6 2.3
20 Water bodies63 724
0 0 0
21 Snow and ice 9 404 0 0 022 Artificial surfaces 1 850 186 10.1 0.02
Total 3 516 179 1052059 100
1 Pixel size 1x1km, 2 Urban extents are excluded, 3 TDP - Total degrading pixels, 4 TIP - Total improving pixels
8/13/2019 Report 2007 05 Land Degr Argentina REV Aug 2008 Productividad Degradacion
http://slidepdf.com/reader/full/report-2007-05-land-degr-argentina-rev-aug-2008-productividad-degradacion 32/56
26 Land Deg
Table 5. Degrading and improving areas by land use systems (FAO 2008)
C o d e
Land use systemTotal pixels
(TP)
Degrading pixels
(DP)DP/TP DP/TDP 1
( 5'x5' ) ( 5'x5' ) ( % ) ( % )
0 Undefined 0 0 0.0 0.0
1 Forestry - not managed (natural) 2 862 985 34.4 8.0
2 Forestry - protected areas 243 45 18.5 0.4
4 Forestry - pastoralism moderate or higher 2 850 1 190 41.8 9.7
5Forestry - pastoralism moderate or higher with
scattered plantations10 1 10.0 0.01
6 Forestry - scattered plantations 35 11 0.131.4
7 Herbaceous - not managed (natural) 1 406 271 19.3 2.2
8 Herbaceous - protected areas 860 99 11.5 0.8
9 Herbaceous - extensive pastoralism 12 359 2 573 20.8 21.0 10 Herbaceous - moderately intensive pastoralism 5 293 842 15.9 6.9
11 Herbaceous - intensive pastoralism 2 546 1 135 44.6 9.3
13 Rain-fed agriculture 835 345 41.3 2.8
14 Agro-pastoralism - moderately intensive 1 810 705 39.0 5.8
15 Agro-pastoralism - intensive 4 084 2 516 61.6 20.5
16 Agro-pastoralism with large-scale irrigation 32 5 15.6 0.04
17 Agriculture - large scale irrigation (> 25% pixel size) 162 54 33.3 0.4
18 Agriculture - protected areas 18 4 22.2 0.0
19 Urban areas 826 323 39.1 2.6
20 Wetlands - not managed (natural) 1 389 669 48.2 5.5
21 Wetlands - protected areas 123 47 38.2 0.4
22 Wetlands - mangroves 11 6 54.5 0.05
23 Wetlands - agro-pastoralism 0 0 0.0 0.0
24 Bare areas - not managed (natural) 544 23 4.2 0.2
ISRIC Report 2007/05
8/13/2019 Report 2007 05 Land Degr Argentina REV Aug 2008 Productividad Degradacion
http://slidepdf.com/reader/full/report-2007-05-land-degr-argentina-rev-aug-2008-productividad-degradacion 33/56
Land Degradation and Improvement in Argentina
Land use system Codes Total pixels (TP) Degrading pixels (DP) DP/TP DP/TDP 1 Improv
( 5'x5' ) ( 5'x 5' ) (%) (%)
Forestry 1-6 6 000 2 232 37.2 18.2
Rangeland 7-11 22 464 4 920 21.9 40.2
Agricultural land 13-18 6 941 3 629 52.3 29.6
Urban 19 826 323 39.1 2.6
Wetlands 20-23 1 523 722 47.4 5.9
Bare areas 24-27 1 830 259 14.2 2.1
Water 28-30668 168 25.1 1.4
Undefined 0,100 0 0 0.0 0.0
Total 40 252 12 253 100.0
1TDP - total degrading pixels, 2TIP - total improving pixels
25 Bare areas - protected areas 310 46 14.8 0.4
26 Bare areas - extensive pastoralism 926 182 19.7 1.5
27 Bare areas - moderately intensive pastoralism 50 8 16.0 0.1
28 Water - coastal or not managed (natural) 44 1 2.3 0.01
29 Water - protected areas 104 13 12.5 0.1
30 Water - inland Fisheries 520 154 29.6 1.3
100 Undefined 0 0 0.0 0.0
Total 40 252 12 253 100.0
1TDP - total degrading pixels, 2TIP - total improving pixels
Table 6. Degrading/improving lands in the aggregated land use systems
8/13/2019 Report 2007 05 Land Degr Argentina REV Aug 2008 Productividad Degradacion
http://slidepdf.com/reader/full/report-2007-05-land-degr-argentina-rev-aug-2008-productividad-degradacion 34/56
28 Land Degradation and Improvement in Argentina
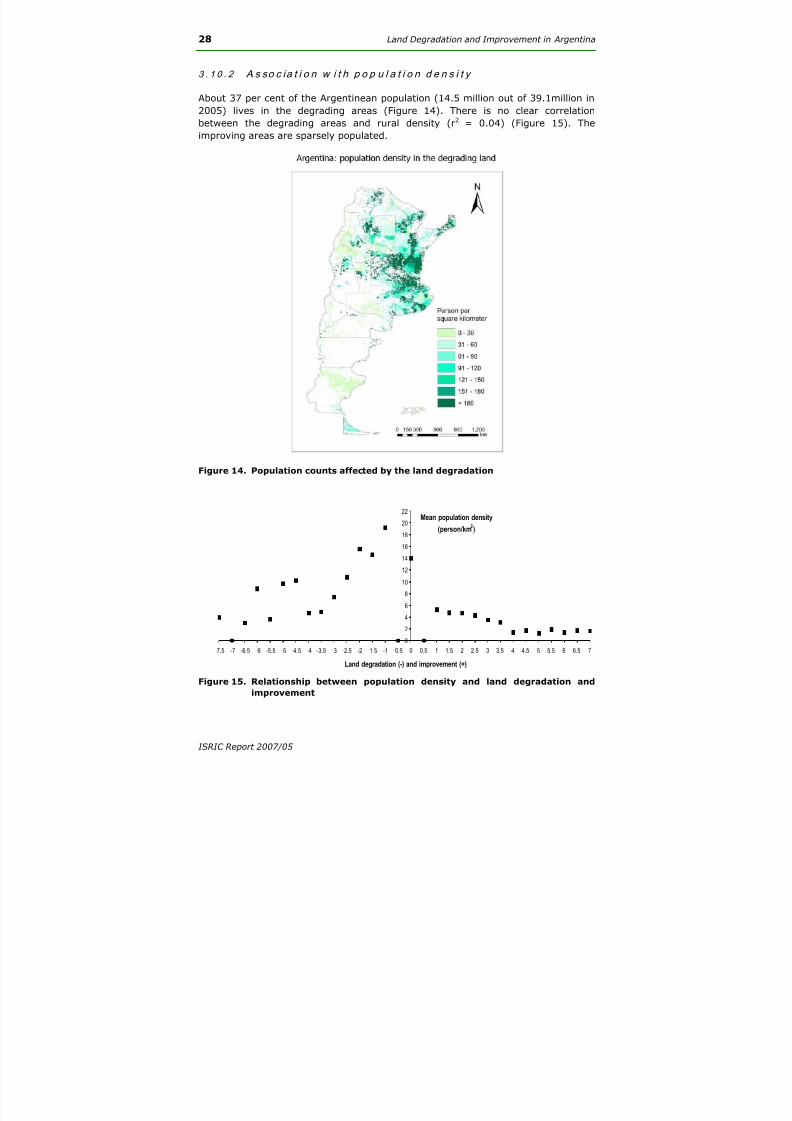
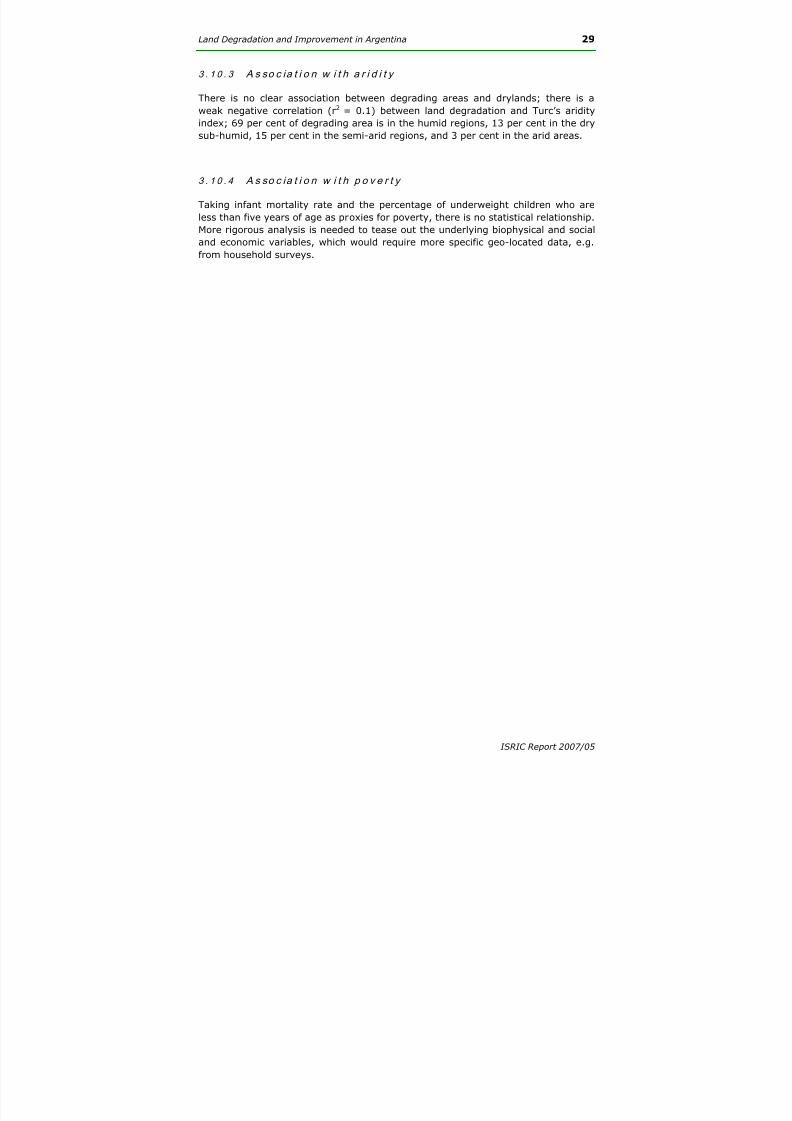
A s so c ia t i o n w i t h p o p u l a t i o n d e n s i t y3 . 1 0 . 2 About 37 per cent of the Argentinean population (14.5 million out of 39.1million in
2005) lives in the degrading areas (Figure 14). There is no clear correlation
between the degrading areas and rural density (r2 = 0.04) (Figure 15). The
improving areas are sparsely populated.
Figure 14. Population counts affected by the land degradation
0
2
4
6
8
10
12
14
16
18
20
22
-7.5 -7 -6.5 -6 -5.5 -5 -4.5 -4 -3.5 -3 -2.5 -2 -1.5 -1 -0.5 0 0.5 1 1.5 2 2.5 3 3.5 4 4.5 5 5.5 6 6.5 7
Land degradation (-) and improvement (+)
Mean population density
(person/km2)
Figure 15. Relationship between population density and land degradation and
improvement
ISRIC Report 2007/05
8/13/2019 Report 2007 05 Land Degr Argentina REV Aug 2008 Productividad Degradacion
http://slidepdf.com/reader/full/report-2007-05-land-degr-argentina-rev-aug-2008-productividad-degradacion 35/56
Land Degradation and Improvement in Argentina 29
A s so c ia t i o n w i t h a r i d i t y3 . 1 0 . 3
3 . 1 0 . 4
There is no clear association between degrading areas and drylands; there is a
weak negative correlation (r2 = 0.1) between land degradation and Turc’s aridity
index; 69 per cent of degrading area is in the humid regions, 13 per cent in the dry
sub-humid, 15 per cent in the semi-arid regions, and 3 per cent in the arid areas.
A s so c ia t i o n w i t h p o v e r t y
Taking infant mortality rate and the percentage of underweight children who are
less than five years of age as proxies for poverty, there is no statistical relationship.
More rigorous analysis is needed to tease out the underlying biophysical and social
and economic variables, which would require more specific geo-located data, e.g.
from household surveys.
ISRIC Report 2007/05

8/13/2019 Report 2007 05 Land Degr Argentina REV Aug 2008 Productividad Degradacion
http://slidepdf.com/reader/full/report-2007-05-land-degr-argentina-rev-aug-2008-productividad-degradacion 36/56
8/13/2019 Report 2007 05 Land Degr Argentina REV Aug 2008 Productividad Degradacion
http://slidepdf.com/reader/full/report-2007-05-land-degr-argentina-rev-aug-2008-productividad-degradacion 37/56
Land Degradation and Improvement in Argentina 31
4 What GLADA can and cannot do
• We have defined land degradation as a long-term loss of ecosystem function
and we use net primary productivity (NPP) as an indicator. GLADA is aninterpretation off GIMMS time series NDVI data, i.e. a measure of
greenness, which is taken as a proxy for NPP. Translation of NDVI is robust
but approximate.
• The proxy is several steps removed from recognisable symptoms of land
degradation as it is commonly understood - such as soil erosion, salinity or
nutrient depletion; the same goes for land improvement. Greenness is
determined by several factors and, to interpret it in terms of land
degradation and improvement, these other factors must be accounted for –
in particular variability of rainfall and temperature and changes I land use
and management, Rain-use efficiency (RUE, NPP per unit of rainfall)accounts for rainfall variability and, to some extent, local soil and land
characteristics. We assume that, where NPP is limited by rainfall, a declining
trend in RUE indicates land degradation. Where rainfall is not limiting, NPP is
the best indicator available. Taken together, the two indicators may provide
a more robust assessment than either used alone. Alternatively, RESTREND
points in the same direction: it shows much the same pattern as NDVI
though with lesser amplitude. Land use change is not taken into account in
this study owing to the lack of consistent time series data.
• Declining NPP, even allowing for climatic variability, may not even be
reckoned as land degradation: urban development is generally considered to
be development – although it generally means a long-term loss of
ecosystem function; land use change from forest or grassland to cropland or
rangeland is usually associated with a loss of NPP but it may or may not be
accompanied by soil erosion, compaction and nutrient depletion, and it may
well be profitable and sustainable , depending on management. Similarly,
increasing NPP means greater biological production but may reflect, for
instance, encroachment of bush or invasive species – which is not land
improvement as commonly understood.
• The coarse resolution of the GIMMS data is a limitation: an 8km pixel
integrates the signal from a wider surrounding area. Many symptoms of
even severe degradation, such as gullies, rarely extend over such a large
area; degradation must be severe indeed to be seen against the signal of
surrounding unaffected areas.
• As a quantitative estimate of land degradation, loss of NPP relative to the
average trend has been calculated for those areas where both NPP and RUE
are declining. This is likely to be a conservative estimate: where NPP is
increasing but RUE is declining, some land degradation may have begun that
is reducing NPP but is not yet reflected in declining NPP.
• By the same reasoning, RUE should be used alone for early warning of
degradation or as a herald of improvement. Where NPP is rising but RUE isdeclining, some process of degradation may be under way which will remain
ISRIC Report 2007/05
8/13/2019 Report 2007 05 Land Degr Argentina REV Aug 2008 Productividad Degradacion
http://slidepdf.com/reader/full/report-2007-05-land-degr-argentina-rev-aug-2008-productividad-degradacion 38/56
32 Land Degradation and Improvement in Argentina
undetected if we consider only those areas where both indices are declining.
The reverse also holds true: we might not recognise promising interventions
that increase RUE but have not yet brought about increasing NPP.
• GLADA presents a different picture from previous assessments of land
degradation which compounded historical degradation with what ishappening now. The data from the last 25 years indicate present trends but
tell us nothing about the historical legacy; many degraded areas have
become stable landscapes with a stubbornly low level of productivity. For
many purposes, it is more important to address present-day degradation;
much historical degradation maybe irreversible.
• Remote sensing provides only indicators of biomass productivity. The
various kinds of land degradation and improvement are not distinguished;
the patterns revealed by remote sensing should be followed up by fieldwork
to establish the actual conditions on the ground and results are provisional
until validated in the field. This is not straightforward: an 8km pixel cannot
be checked by a windscreen survey and a 23-year trend cannot be checked
by a snapshot. A rigorous procedure must be followed, as defined in the
forthcoming LADA Field Handbook. Apart from systematically and
consistently characterising the situation on the ground across a range of
scales, the field teams may validate the GLSAA interpretations by addressing
the following questions:
1. Is the biomass trend indicated by GLADA real?
2. If so, does it correspond with physical manifestations of land
degradation and improvement that are measurable on the ground?
3. If the answer to either of the above questions is no, what has caused
the observed trend?
4. Is the mismatch a question of timing of observations – where the
situation on the ground has subsequently recovered or reverted?
ISRIC Report 2007/05
8/13/2019 Report 2007 05 Land Degr Argentina REV Aug 2008 Productividad Degradacion
http://slidepdf.com/reader/full/report-2007-05-land-degr-argentina-rev-aug-2008-productividad-degradacion 39/56
8/13/2019 Report 2007 05 Land Degr Argentina REV Aug 2008 Productividad Degradacion
http://slidepdf.com/reader/full/report-2007-05-land-degr-argentina-rev-aug-2008-productividad-degradacion 40/56
34 Land Degradation and Improvement in Argentina
Acknowledgements
This work is part of the GEF/UNEP/FAO project Land Degradation Assessment in
Drylands.
We thank CJ Tucker, JE Pinzon and ME Brown for access to the GIMMS datasets; J
Grieser for providing the VASClimO precipitation data, T Fuchs for the GPCC
precipitation data, and M Salmon for providing the CRU TS climatic data; we are
indebted ME Schaepman for concept development; we thank F Nachtergaele R
Biancalani, S Prince and A Anyamba for critical comments on the draft, and local
LADA partner institutions for their collaboration, in particular, Dr Vanina Pietragalla
who sent the map of Argentina; and ISRIC colleagues GWJ van Lynden and NH
Batjes for editing, P Tempel and JRM Huting for help with data handling, G
Heuvelink for help with statistics and Y Karpes-Liem for text layout.
ISRIC Report 2007/05
8/13/2019 Report 2007 05 Land Degr Argentina REV Aug 2008 Productividad Degradacion
http://slidepdf.com/reader/full/report-2007-05-land-degr-argentina-rev-aug-2008-productividad-degradacion 41/56
Land Degradation and Improvement in Argentina 35
References
Bai ZG & Dent DL 2006 Global assessment of land degradation and improvement:
pilot study in Kenya. ISRIC Report 2006/01, WageningenBai ZG.DL Dent, L Olsson & ME Schaepman Global assessment of land degradation
and improvement 1. Identification by remote sensing. Rept 2008/1, ISRIC –
World Soil Information, Wageningen
Bai ZG, DL Dent & ME Schaepman 2005 Quantitative global assessment of land
degradation and improvement: pilot study in North China. ISRIC Report
2005/06, Wageningen
Bastin GN, G Pickup & G Pearce 1995 Utility of AVHRR data for land degradation
assessment - a case study. International Journal of Remote Sensing 16, 651-672
Beck C, J Grieser & B Rudolf 2005 A new monthly precipitation climatology for the
global land areas for the period 1951 to 2000. 181-190 in Climate Status Report
2004. German Weather Service, Offenbach
Brown ME, JE Pinzon, K Didan, JT Morisette & CJ Tucker 2006 Evaluation of the
consistency of long-term NDVI time series derived from AVHRR, SPOT-
Vegetation, SeaWIFS, MODIS and LandSAT ETM+. IEEE Transactions on
Geoscience and Remote Sensing 44, 1787-1793
CIESIN 2004 Global Rural-Urban Mapping Project: Urban/Rural Extents. Center for
International Earth Science Information Network, Columbia University Palisades,
NY http://sedac.ciesin.columbia.edu/gpw Accessed, 20 Dec 2006
CIESIN 2005. Gridded Population of the World: Future Estimates. Center for
International Earth Science Information Network, Columbia University Palisades,
NY http://sedac.ciesin.columbia.edu/gpw Accessed 15 June, 2007Engelen VWP van, JA Dijkshoorn & JRM Huting 2008 Global assessment of land
degradation and improvement 2. Soil and landform properties for SOTER units.
ISRIC Report 2008/02, Wageningen
FAO 2008 Land use systems of the World.
http://www.fao.org/geonetwork/srv/en/metadata.show. Accessed 15 June 2008
Fensholt R, I Sandholt & MS Rasmussen 2004 Evaluation of MODIS LAI, fAPAR and
the relation between fAPAR and NDVI in a semi-arid environment using in situ
measurements. Remote Sensing Environ. 91, 490–507
Fensholt R, I Sandholt, MS Rasmussen, S Stisen & A Diouf 2006 Evaluation of
satellite-based primary production modelling in the semi-arid Sahel. RemoteSensing Environ. 105, 173-188
Gebremichael M & AP Barros 2006 Evaluation of MODIS gross primary productivity
in tropical monsoon regions. Remote Sensing Environ. 100, 150–166
Heinsch FA, M Reeves, P Votava & others 2003 User's Guide: GPP and NPP
(MOD17A2/A3) Products NASA MODIS Land Algorithm Version 20, December 2,
2003. University of Montana ftp://ftp.ntsg.umt.edu/pub/MODIS/TERRA/Mosaics
Accessed 1 Dec 2006
Illius AW & TG O’Connor 1999 On the relevance of nonequilibrium concepts to arid
and semiarid grazing systems. Ecological Applications 9, 798–813
Jones JAA 1997 Global hydrology: processes, resources and environmentalmanagement Longman, Harlow
ISRIC Report 2007/05
8/13/2019 Report 2007 05 Land Degr Argentina REV Aug 2008 Productividad Degradacion
http://slidepdf.com/reader/full/report-2007-05-land-degr-argentina-rev-aug-2008-productividad-degradacion 42/56
8/13/2019 Report 2007 05 Land Degr Argentina REV Aug 2008 Productividad Degradacion
http://slidepdf.com/reader/full/report-2007-05-land-degr-argentina-rev-aug-2008-productividad-degradacion 43/56
Land Degradation and Improvement in Argentina 37
Tucker CJ, JE Pinzon, ME Brown & others 2005 An extended AVHRR 8-km NDVI
Dataset compatible with MODIS and SPOT vegetation NDVI data. International
Journal of Remote Sensing 26, 4485-4498
Turner DP, WD Ritts, WB Cohen & others 2003 Scaling gross primary production
(GPP) over boreal and deciduous forest landscapes in support of MODIS GPP
product validation. Remote Sensing Environ. 88, 256–270Turner DP, WD Ritts, WB Cohen & others 2006 Evaluation of MODIS NPP and GPP
products across multiple biomes. Remote Sensing Environ. 102, 282–292
UNCED 1992 Managing fragile ecosystems: combating desertification and drought
Agenda 21, Chapter 12 UN Conference on Environment and Development
http://wwwunorg/esa/sustdev/documents/agenda21 Accessed 5 Aug 2005
UNEP 2007 Global Environmental Outlook GEO-4, UN Environment Programme,
Nairobi
Wessels KJ, SD Prince, J Malherbe & others 2007 Can human-induced land
degradation be distinguished from the effects of rainfall variability? A case study
in South Africa. Journal of Arid Environments 68, 271-297Wessels KJ, SD Prince, PE Frost & D van Zyl 2004 Assessing the effects of human-
induced land degradation in the former homelands of northern South Africa with
a 1 km AVHRR NDVI time-series. Remote Sensing Environ. 91, 47-67
WRI 2003 World Resources 2000–2001: People and Ecosystems: The Fraying Web
of Life. World Resources Institute, UN Environment Programme, UN
Development Programme & World Bank, Washington DC
Zhao M, FA Heinsch, RR Nemani & SW Running 2005 Improvements of the MODIS
terrestrial gross and net primary production global data set. Remote Sensing of
Environment. 95, 164-176
Zhao M, SW Running & RR Nemani 2006 Sensitivity of Moderate Resolution Imaging
Spectroradiometer (MODIS) terrestrial primary production to the accuracy of
meteorological reanalyses. Journal of Geophysical Research 111, G01002,
doi:10.1029/2004JG000004
ISRIC Report 2007/05

8/13/2019 Report 2007 05 Land Degr Argentina REV Aug 2008 Productividad Degradacion
http://slidepdf.com/reader/full/report-2007-05-land-degr-argentina-rev-aug-2008-productividad-degradacion 44/56
8/13/2019 Report 2007 05 Land Degr Argentina REV Aug 2008 Productividad Degradacion
http://slidepdf.com/reader/full/report-2007-05-land-degr-argentina-rev-aug-2008-productividad-degradacion 45/56
8/13/2019 Report 2007 05 Land Degr Argentina REV Aug 2008 Productividad Degradacion
http://slidepdf.com/reader/full/report-2007-05-land-degr-argentina-rev-aug-2008-productividad-degradacion 46/56
40 Land Degradation and Improvement in Argentina
The T-test was used to arrange the slope values in classes showing strong or weak
positive or negative trends:
T = b / se(b)
Where b is the calculated slope of the regression line between the observationvalues and time and se(b) represents the standard error of b.
The class boundaries were defined for 95 per cent confidence level; trends were
labelled high if the T -values of the slope exceeded the 0.025 p-value of either tail of
the distribution; lesser T - values were labelled low .
In addition, SPSS and MS Excel were employed to analyze trends, correlations and
significances of the non-gridded variables.
Associations between land degradation/improvement and other
variables
Maps of the combined NPP and RUE index were overlaid on the other maps.
Corresponding comparative values were calculated, pixel-by-pixel and a univariate
correlation calculated.
ISRIC Report 2007/05
8/13/2019 Report 2007 05 Land Degr Argentina REV Aug 2008 Productividad Degradacion
http://slidepdf.com/reader/full/report-2007-05-land-degr-argentina-rev-aug-2008-productividad-degradacion 47/56
Land Degradation and Improvement in Argentina 41
Appendix 2: NDVI indicators of the land degradation/
improvement
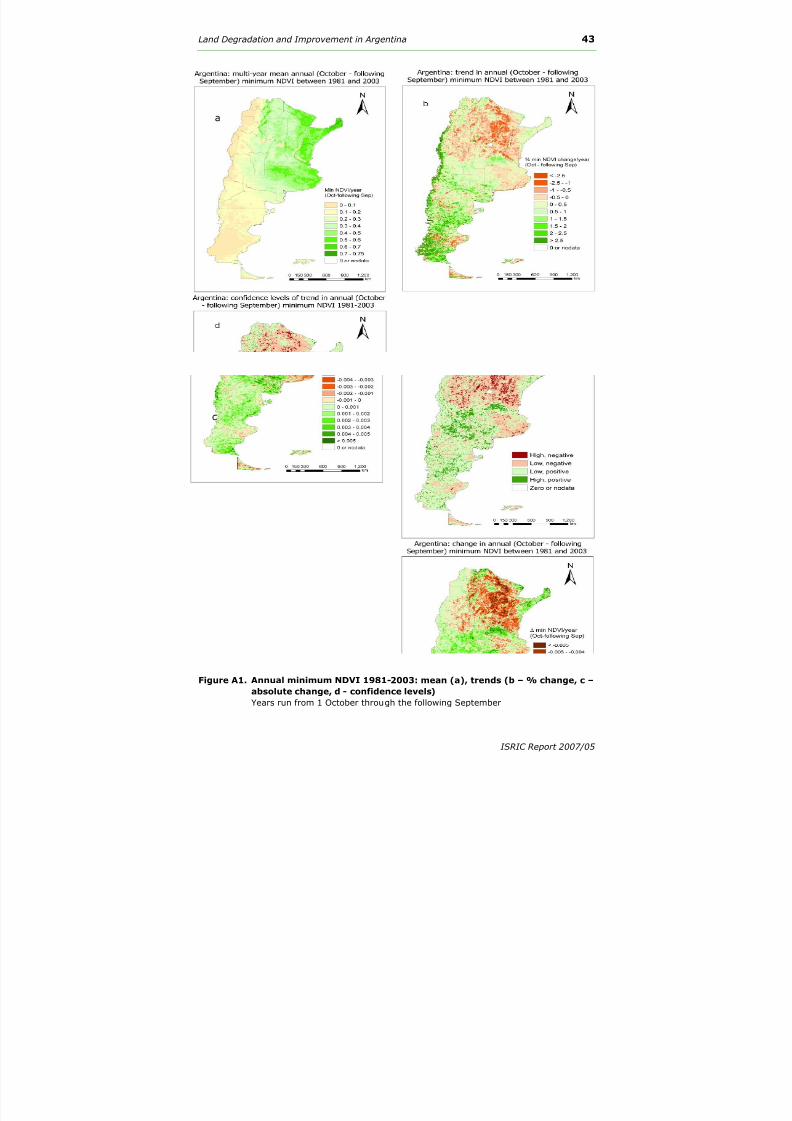
Minimum NDVI: The lowest value that occurs in any one year (annual) - which isusually at the end of the dry season. Variation in minimum NDVI may serve as a
baseline for other parameters.
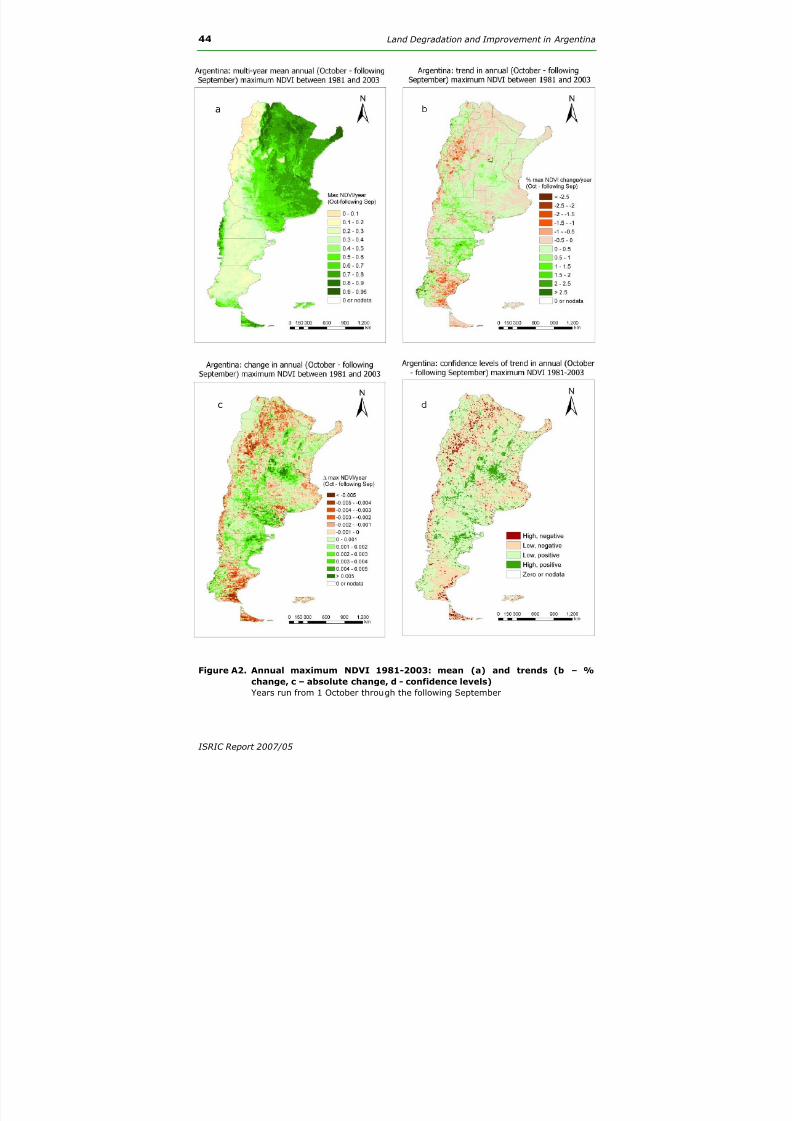
Maximum or peak NDVI: Represents the maximum green biomass. The large spatial
variations reflect the diverse landscapes and climate.
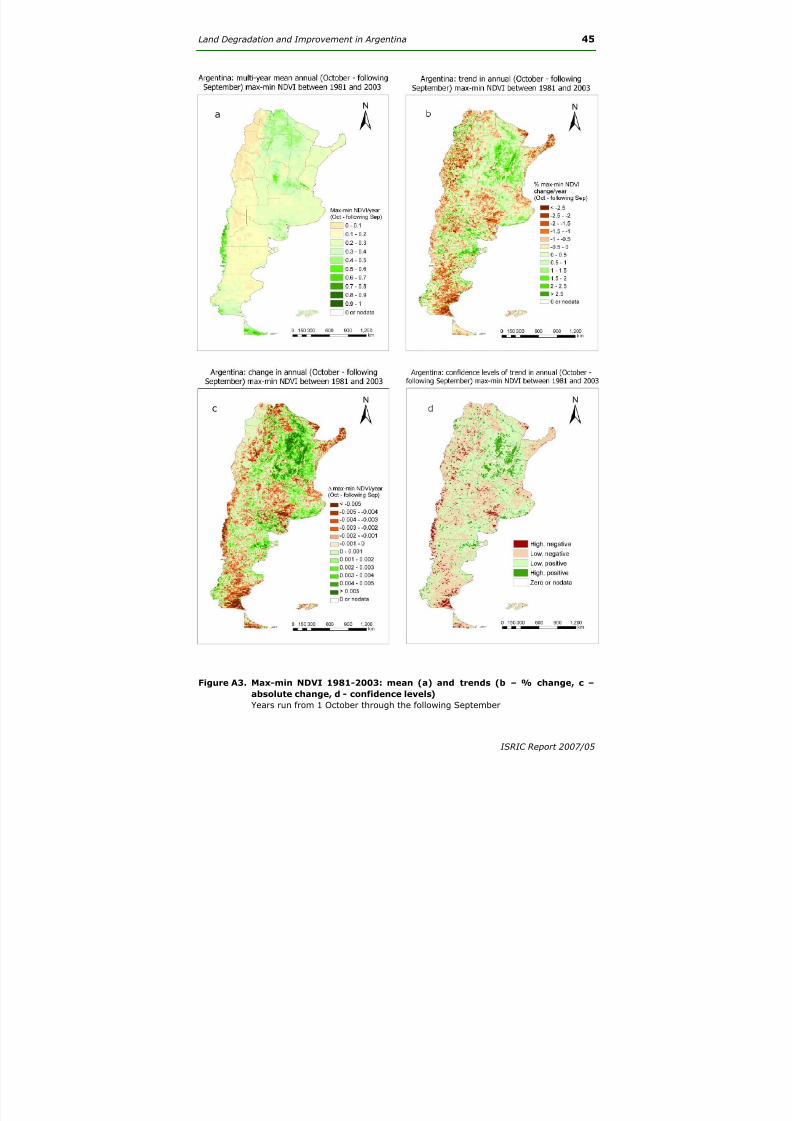
Maximum-minimum NDVI: The difference between annual maximum and minimum
NDVI reflects annual biomass productivity for areas with one, well-defined growing
season but may not be meaningful for areas with bimodal rainfall.
Sum NDVI: The sum of fortnightly NDVI values for the year most nearly aggregatesannual biomass productivity.
Standard deviation (STD): NDVI standard deviation is the root mean square
deviation of the NDVI time series values (annual) from their arithmetic mean. It is
a measure of statistical dispersion, measuring the spread of NDVI values.
Coefficient of variation (CoV): CoV can be used to compare the amount of variation
in different sets of sample data. NDVI CoV images were generated by computing for
each pixel the standard deviation (STD) of the set of individual NDVI values and
dividing this by the mean (M) of these values. This represents the dispersion of
NDVI values relative to the mean value.
Temporal trends: The long-term trends of the indicators of biological productivity
may be taken as indicators of land degradation (where the trend is declining) or
land improvement (where the trend is increasing). A positive change in the value of
a pixel-level CoV over time relates to increased dispersion of values, not increasing
NDVI; similarly, a negative CoV dispersion – which is the case over nearly the
whole country - means decreasing dispersion of NDVI around mean values, not
decreasing NDVI.
The patterns and trends of all NDVI indicators for each pixel, determined by the
slope of the linear regression equation, are depicted in Figures A1-7; their values
are summarised in Table A1. No further analyses were made for these indicators
except for the sum NDVI which is discussed in detail in the main text. It is
recommended, however, that these maps should be considered in the field
investigation - in particular the land use change during the study period (1981-
2003).
ISRIC Report 2007/05
8/13/2019 Report 2007 05 Land Degr Argentina REV Aug 2008 Productividad Degradacion
http://slidepdf.com/reader/full/report-2007-05-land-degr-argentina-rev-aug-2008-productividad-degradacion 48/56
42 Land Degradation and Improvement in Argentina
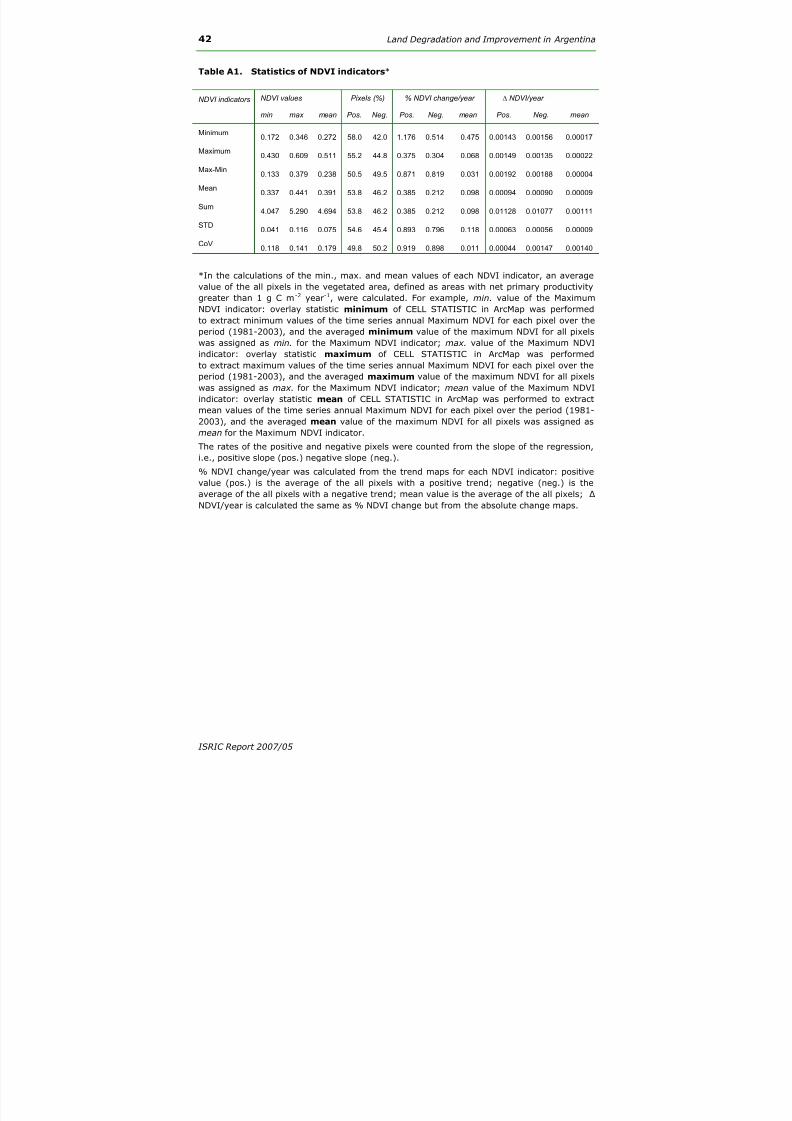
Table A1. Statistics of NDVI indicators*
NDVI indicators NDVI values Pixels (%) % NDVI change/year ∆ NDVI/year
min max mean Pos. Neg. Pos. Neg. mean Pos. Neg. mean
Minimum
0.172 0.346 0.272 58.0 42.0 1.176 0.514 0.475 0.00143 0.00156 0.00017
Maximum0.430 0.609 0.511 55.2 44.8 0.375 0.304 0.068 0.00149 0.00135 0.00022
Max-Min0.133 0.379 0.238 50.5 49.5 0.871 0.819 0.031 0.00192 0.00188 0.00004
Mean0.337 0.441 0.391 53.8 46.2 0.385 0.212 0.098 0.00094 0.00090 0.00009
Sum4.047 5.290 4.694 53.8 46.2 0.385 0.212 0.098 0.01128 0.01077 0.00111
STD0.041 0.116 0.075 54.6 45.4 0.893 0.796 0.118 0.00063 0.00056 0.00009
CoV0.118 0.141 0.179 49.8 50.2 0.919 0.898 0.011 0.00044 0.00147 0.00140
*In the calculations of the min., max. and mean values of each NDVI indicator, an averagevalue of the all pixels in the vegetated area, defined as areas with net primary productivity
greater than 1 g C m-2 year-1, were calculated. For example, min. value of the Maximum
NDVI indicator: overlay statistic minimum of CELL STATISTIC in ArcMap was performed
to extract minimum values of the time series annual Maximum NDVI for each pixel over the
period (1981-2003), and the averaged minimum value of the maximum NDVI for all pixels
was assigned as min. for the Maximum NDVI indicator; max. value of the Maximum NDVI
indicator: overlay statistic maximum of CELL STATISTIC in ArcMap was performed
to extract maximum values of the time series annual Maximum NDVI for each pixel over the
period (1981-2003), and the averaged maximum value of the maximum NDVI for all pixels
was assigned as max. for the Maximum NDVI indicator; mean value of the Maximum NDVI
indicator: overlay statistic mean of CELL STATISTIC in ArcMap was performed to extract
mean values of the time series annual Maximum NDVI for each pixel over the period (1981-
2003), and the averaged mean value of the maximum NDVI for all pixels was assigned as
mean for the Maximum NDVI indicator.
The rates of the positive and negative pixels were counted from the slope of the regression,
i.e., positive slope (pos.) negative slope (neg.).
% NDVI change/year was calculated from the trend maps for each NDVI indicator: positive
value (pos.) is the average of the all pixels with a positive trend; negative (neg.) is the
average of the all pixels with a negative trend; mean value is the average of the all pixels; ∆
NDVI/year is calculated the same as % NDVI change but from the absolute change maps.
ISRIC Report 2007/05
8/13/2019 Report 2007 05 Land Degr Argentina REV Aug 2008 Productividad Degradacion
http://slidepdf.com/reader/full/report-2007-05-land-degr-argentina-rev-aug-2008-productividad-degradacion 49/56
Land Degradation and Improvement in Argentina 43
c
a
Figure A1. Annual minimum NDVI 1981-2003: mean (a), trends (b – % change, c –
absolute change, d - confidence levels)Years run from 1 October through the following September
ISRIC Report 2007/05
8/13/2019 Report 2007 05 Land Degr Argentina REV Aug 2008 Productividad Degradacion
http://slidepdf.com/reader/full/report-2007-05-land-degr-argentina-rev-aug-2008-productividad-degradacion 50/56
44 Land Degradation and Improvement in Argentina
c
a
Figure A2. Annual maximum NDVI 1981-2003: mean (a) and trends (b – %
change, c – absolute change, d - confidence levels)
Years run from 1 October through the following September
ISRIC Report 2007/05
8/13/2019 Report 2007 05 Land Degr Argentina REV Aug 2008 Productividad Degradacion
http://slidepdf.com/reader/full/report-2007-05-land-degr-argentina-rev-aug-2008-productividad-degradacion 51/56
Land Degradation and Improvement in Argentina 45
c
a
Figure A3. Max-min NDVI 1981-2003: mean (a) and trends (b – % change, c –
absolute change, d - confidence levels)Years run from 1 October through the following September
ISRIC Report 2007/05
8/13/2019 Report 2007 05 Land Degr Argentina REV Aug 2008 Productividad Degradacion
http://slidepdf.com/reader/full/report-2007-05-land-degr-argentina-rev-aug-2008-productividad-degradacion 52/56
46 Land Degradation and Improvement in Argentina
c
a
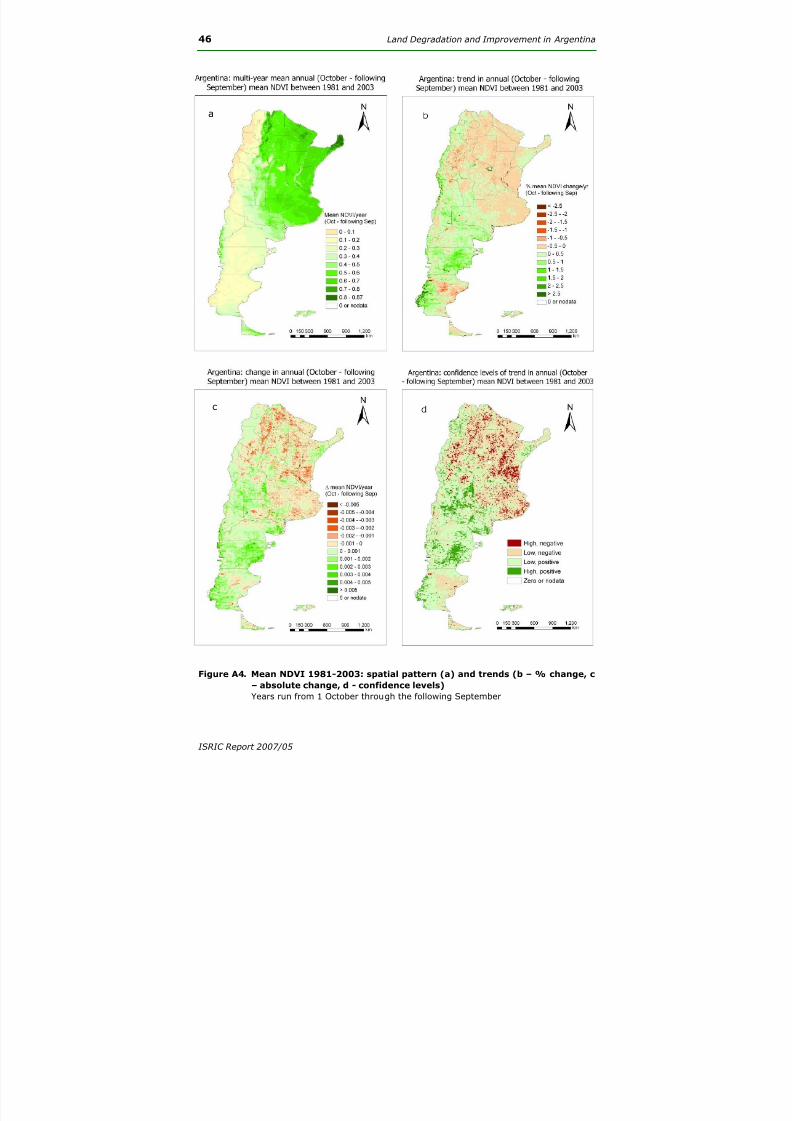
Figure A4. Mean NDVI 1981-2003: spatial pattern (a) and trends (b – % change, c
– absolute change, d - confidence levels)
Years run from 1 October through the following September
ISRIC Report 2007/05
8/13/2019 Report 2007 05 Land Degr Argentina REV Aug 2008 Productividad Degradacion
http://slidepdf.com/reader/full/report-2007-05-land-degr-argentina-rev-aug-2008-productividad-degradacion 53/56
Land Degradation and Improvement in Argentina 47
c
a
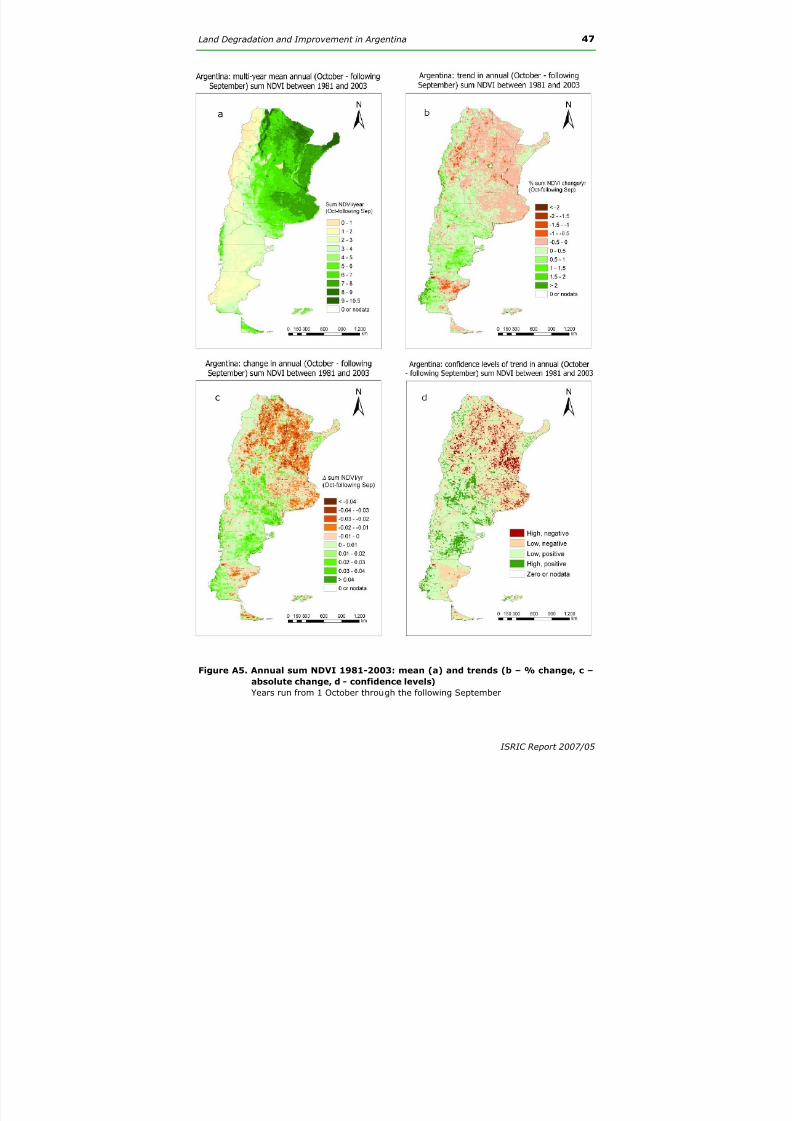
Figure A5. Annual sum NDVI 1981-2003: mean (a) and trends (b – % change, c –
absolute change, d - confidence levels)
Years run from 1 October through the following September
ISRIC Report 2007/05
8/13/2019 Report 2007 05 Land Degr Argentina REV Aug 2008 Productividad Degradacion
http://slidepdf.com/reader/full/report-2007-05-land-degr-argentina-rev-aug-2008-productividad-degradacion 54/56
48 Land Degradation and Improvement in Argentina
c
a
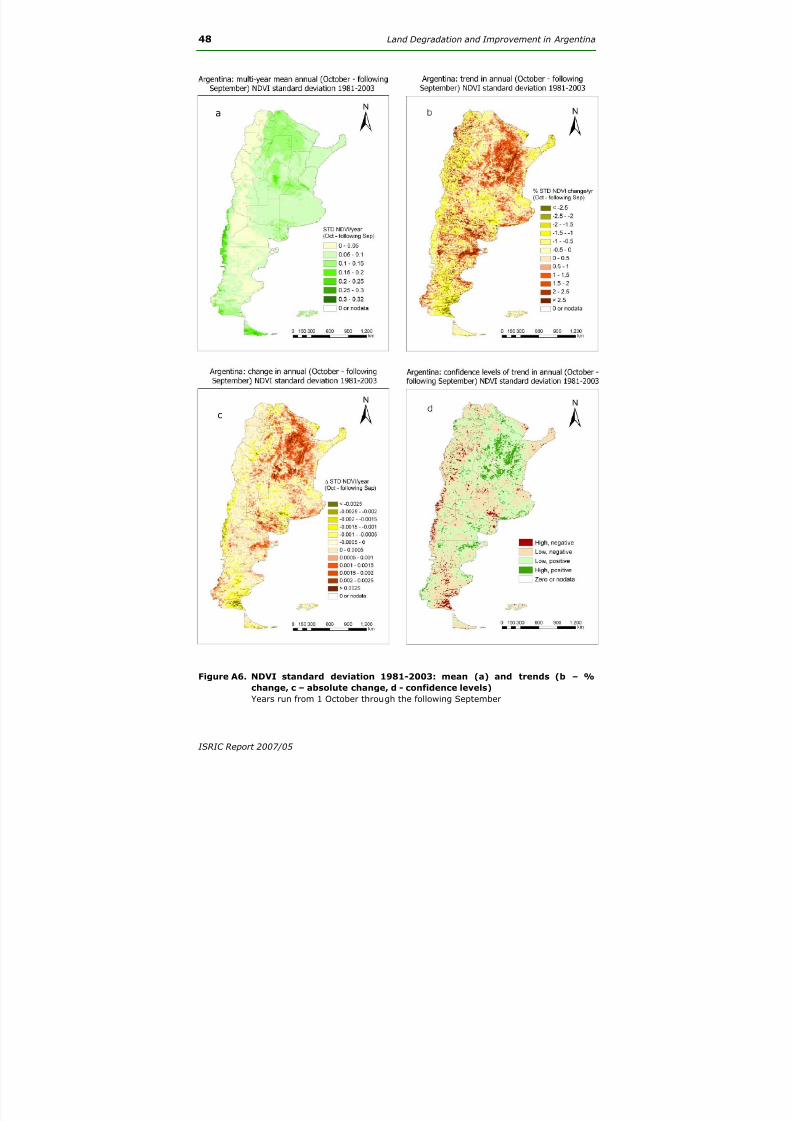
Figure A6. NDVI standard deviation 1981-2003: mean (a) and trends (b – %
change, c – absolute change, d - confidence levels)
Years run from 1 October through the following September
ISRIC Report 2007/05
8/13/2019 Report 2007 05 Land Degr Argentina REV Aug 2008 Productividad Degradacion
http://slidepdf.com/reader/full/report-2007-05-land-degr-argentina-rev-aug-2008-productividad-degradacion 55/56
Land Degradation and Improvement in Argentina 49
c
a
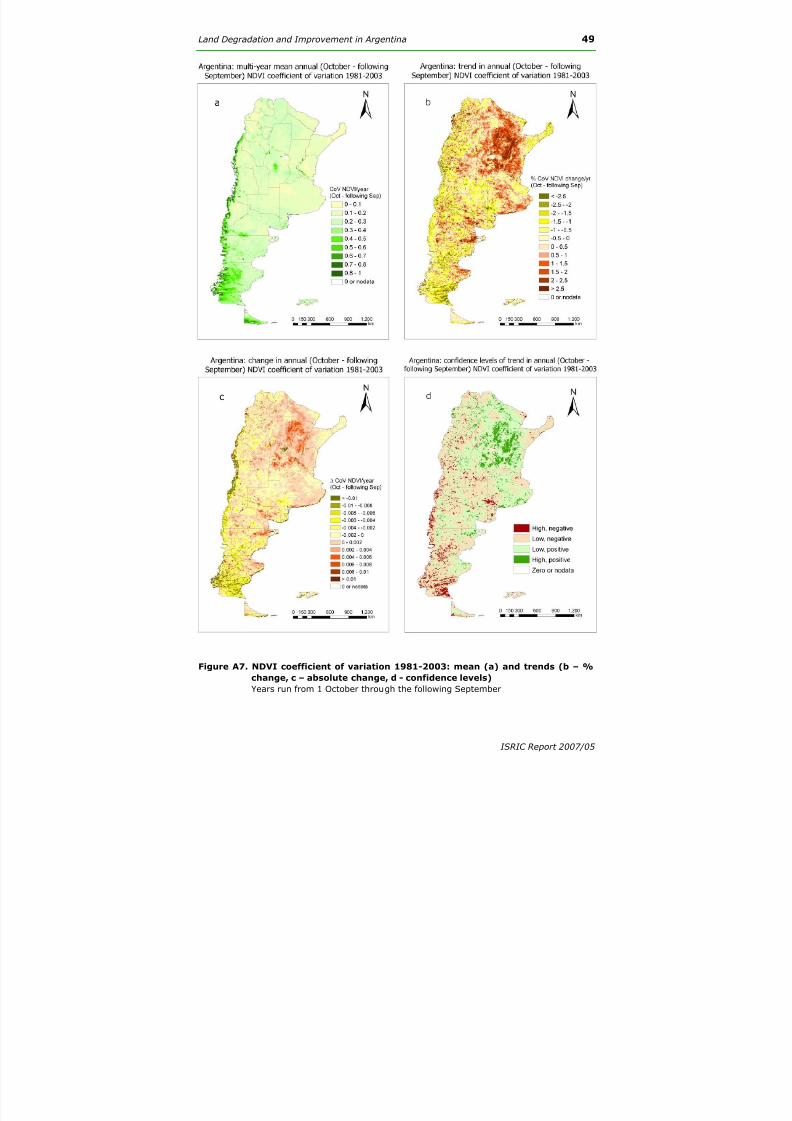
Figure A7. NDVI coefficient of variation 1981-2003: mean (a) and trends (b – %
change, c – absolute change, d - confidence levels)
Years run from 1 October through the following September
ISRIC Report 2007/05
8/13/2019 Report 2007 05 Land Degr Argentina REV Aug 2008 Productividad Degradacion
http://slidepdf.com/reader/full/report-2007-05-land-degr-argentina-rev-aug-2008-productividad-degradacion 56/56
ISRIC - World Soil Information is an independent foundation with a global mandate,
funded by the Netherlands Government. We have a strategic association with
Wageningen University and Research Centre.
Our aims: