Embed Size (px)
Citation preview

Review
Replacing Trans Fat: The Argument for Palm Oil with aCautionary Note on Interesterification
K. C. Hayes, DVM, PhD, Andrzej Pronczuk, DSc
Foster Biomedical Research Lab, Department of Biology, Brandeis University, Waltham, Massachusetts
To replace dietary trans fatty acids (TFA), two practical options exist: revert to a natural saturated fat
without cholesterol (most likely palm oil or its fractions) or move to a newer model of modified fat hardened by
interesterification (IE). This review summarizes the relative risks for cardiovascular disease inherent in these
options. Interestingly, both types of fat have been the subject of nutritional scrutiny for approximately the last
40 years, and both have positive and negative attributes. Only during that period has palm oil production
developed to the point where it has become the major edible oil in world markets, making clinical studies of it an
important objective. On the other hand, approximately 25 human studies have fed interesterified fat in one form
or another over this period, some for weeks, some as a single meal. Two types of diet designs exist. Several fed a
small amount of interesterified fat, usually incorporated within a margarine, and stayed below the radar of
biological detection of any abnormal metabolism. A few fed interesterified fat that incorporated stearic acid, as
interesterified 18:0 (IE-18:0), even comparing it to trans fat and saturated fat, as a major part of total daily
calories to assess its metabolic impact per se. These latter 5 to 6 studies clearly reveal negative biological effects
on lipoproteins, blood glucose, insulin, immune function, or liver enzymes when relatively high intake of IE-
18:0 or palmitic acid (IE-16:0) were fed in fats with sn2–saturated fatty acids. High intake of 18:0 in natural fats
can depress total lipoproteins, while IE-18:0 and IE-16:0 at high levels adversely affect lipoprotein metabolism.
Still other studies have supplied interesterified fat as a single meal or fed such fat daily only in a single snack, as
opposed to incorporating the fat into the entire fat pool consumed at all meals in association with most foods
(which is the more physiological approach and more apt to elicit effects). Even in meal studies, IE-18:0 typically
delayed fat absorption postprandially, indicating its effect on fat metabolism originating, in part, in the intestine.
Mainly 2 saturated fatty acids (18:0 or 16:0) have been interesterified to harden oils, using the 16:0 from fully
hydrogenated palm oil or 18:0 from fully hydrogenated soybean oil as the source material. It is not clear that IE-
16:0 is as problematic as IE-18:0, but IE-16:0 has been studied less. Levels between 8% energy (%E) and 12%E
from 18:0 as interesterified fat (the typical diet provides about 2%E–4%E as 18:0 from natural fats) show the most
effect. Detection of adverse effects would seem to start around 7%E–8%E as IE-18:0, but one can assume that
effects are initiated, even if undetected, at a lower intake, similar to the situation with TFA. Thus, although an
intake of 1%E to 4%E from IE-18:0 does not appear to influence lipoproteins, it is not necessarily the only system
affected. The negative effects of IE-18:0 may be alleviated or masked by dilution with other fats, especially by
adding 18:2-rich polyunsaturated oils to the diet. This is similar to the trans fat story, i.e., if a limited intake of TFA
is heavily diluted with other oils, the consumption of TFA fails to be detected as an adverse effect.
Accordingly, more research is warranted to determine the appropriateness of interesterified fat consumption,
particularly before it becomes insidiously embedded in the food supply similar to TFA and intake levels are
achieved that compromise long-term health.
Key teaching points:
N Certain food applications will continue to require solid fat products to replace TFA in the diet.
N The 2 viable sources of solid fat for applicability and cost are unmodified saturated fat (the family of palm oils) and vegetable oils
interesterified or blended with tristearin (or tripalmitin).
Address correspondence to: K. C. Hayes, Foster Biomedical Res Lab, MS029, Brandeis University, , Waltham, MA 02454. E-mail: [email protected]
Abbreviations: SFA 5 saturated fatty acids, TFA 5 trans fatty acids, IE 5 interesterification, %E 5 percent energy, CVD 5 cardiovascular disease, sn2 5 carbon 2 on
glycerol
Dr Hayes has received support for study of palm oil and its fractions in animals and serves as an ad hoc advisor to MPOC on occasion.
Journal of the American College of Nutrition, Vol. 29, No. 3, 253S–284S (2010)
Published by the American College of Nutrition
253S

N IE rearranges triglyceride structure (not unlike TFA production with partial hydrogenation) and removes or substitutes the sn2—
fatty acid with 18:0 or 16:0, which alters lipid metabolism negatively at high intakes (.7%E of interesterified fat).
N More research is recommended to establish the level of interesterified fat consumption that compromises public health.
INTERESTERIFICATION (IE) OF FAT
Background
Although unsaturated fats (especially essential fatty acids
of n6 and n3 origin) favor energy metabolism and are desirable
for health reasons [1,2], current evidence suggests that natural
saturated fats do not introduce a risk for chronic disease, such
as coronary heart disease (CHD), on their own, but rather
reflect the fact that such fats lack sufficient n6 and n3
polyunsaturated fatty acids (PUFA) [2–4]. Furthermore, certain
technical constraints in product applications require that some
fats be more plastic, less unsaturated, and more heat stable than
naturally occurring vegetable oils. Shortenings for baking, as
well as spreads or margarines for use on breads or cooked
vegetables, are examples. Trans fatty acids (TFA) were
incorporated into vegetable oils for this very reason, but
TFA are now taboo in most well-versed nutrition circles [5,6].
So what to do now with all the vegetable oils? One solution
fast becoming the norm is to fully hydrogenate an oil to make a
fully saturated hard stock, which is then interesterified with
additional vegetable oil. This replaces one or more of the
unsaturated fatty acids normally on the glycerol molecule of
the oil with a saturated fatty acid(s) (SFA) from the hard stock
to generate a new, hardened plastic fat with a higher melting
point, not unlike the TFA concept for hardened oils.
Although monounsaturated oils may be preferable as frying
oils, their supply is limited and their application comes up
short in many situations. In reality, 2 replacement possibilities
exist. One is to utilize a natural saturated fat, most likely palm
oil and its fractions because of world supply and cost, while the
other possibility would be to harden vegetable oils by the
aforementioned process of IE, incorporating either 18:0 or
16:0, to generate the degree of plasticity required. An abundant
supply of these fatty acids is made by fully hydrogenating
soybean oil or palm oil, yielding an 18:0:16:0 ratio of 85:15 for
soybean oil and 55:45 for palm oil.
The potential problem with IE, especially when randomly
applied, is the introduction of SFA as 18:0 or 16:0 into the sn2
position on the glycerol molecule, previously noted for its
potentially untoward biological impact [7], or affecting
triglyceride (TG) clearance from lipoproteins [8]. An overview
of TG structure and its general implications for metabolism is
also useful [9]. As TFA are replaced in foods, interesterified fat
has been a preferred substitute, although cause for concern can
be justified above a certain level of consumption.
Thus, the IE approach works technically, but inadequate
data exist on the biological function(s) of such substitutions
when significant intakes are achieved, as might occur with a 1-
to-1 replacement of TFA in food products. One could argue
that the impact of IE may be no different in the long term than
that of TFA. Both processes modify the basic molecular
structure of fat in a similar fashion, i.e., by altering the degree
of saturation and/or structure of the sn1,2,3 fatty acids in a
random fashion and disrupting the natural composition of the
TG molecule, typically increasing the melting point of the oil
in the process. One major difference is that IE typically results
in a SFA (18:0 or 16:0) inserted randomly at sn1, sn2, or sn3,
whereas partial hydrogenation converts a PUFA (at sn1, sn2, or
sn3) into a straight-chained fatty acid that is basically
monounsaturated (e.g., elaidic acid, t18:1).
To examine the possible effects in some detail, this review
summarizes the published reports on the human response to
various amounts and forms of interesterified fat. The main
emphasis is on the lipoprotein response, since that was the
general focus of most such studies. Each reviewed study,
including design and results, has been reduced to a single
expository figure with compacted details that are described in
the accompanying text. Thus, a written narration accompanies
each figure to summarize the published report, with a critique
of the salient design points and amplified interpretation in each
case.
It is apparent from this analysis that interesterified fats can
modulate the lipoprotein profile adversely, but the outcome
can vary depending on which SFA is incorporated into the fat
during the IE process, how much of the SFA is inserted into an
unsaturated oil, and how much of the interesterified fat is
ultimately consumed per day by individuals with presumably
varying sensitivity to an interesterified fat. Currently, these
variables are poorly understood.
These results offer additional insight and newer perspective
to a review of the topic done almost a decade ago on the
impact of IE in both animals and humans [10]. The conclusion
at that time, admittedly with fewer data for evaluation, was
somewhat more sanguine than the current findings would seem
to allow.
Figures and Supporting Text
For orientation purposes, each of the following figures is
designed to orient the reader to the key information presented
in each published report. The figure number is located in the
upper left corner. The literature reference is abbreviated,
usually in the lower right corner, along with its citation in the
text and full reference in the bibliography. The accompanying
text also highlights the major design and results of the study as
reported in the article and summarized by the graphics. The
columns in each figure depict the total blood cholesterol value
Replacing Trans Fat
254S VOL. 29, NO. 3
subdivided into cholesterol fractions transported by the 3
lipoprotein classes (VLDL indicates very-low-density lipopro-
tein, in green, a minor fraction that also carries most of the TG;
LDL, low-density-lipoprotein, the major cholesterol carrier for
humans, in red; and HDL, high-density lipoprotein, the
desirable cholesterol carrier, in orange, which usually
transports about one-fourth of the total cholesterol in humans).
Each column represents the average values reported for
total cholesterol (TC), VLDL, LDL, and HDL for the dietary
treatment under discussion, i.e., the average for all subjects fed
any given diet. The small number to the right of each column
between LDL and HDL represents the average LDL/HDL ratio
in response to that diet. Ratios above 4.0 have been associated
with a high risk for CHD, while ratios under 2.0 represent a
very low CHD risk and are most desirable. Actual cholesterol
numbers (as mg/dl) are added to each lipoprotein fraction and
final column to facilitate interpretation at a glance. An asterisk
with a number indicates statistical significance, generally
relative to the control value. A double asterisk represents
another level of significance, particularly in regard to the
biological importance of the response.
The reader is referred to the original publications for more
specific details of the response, as necessary, as this review
represents an attempt to compare the various studies on the
basis of design and general implications of the lipoprotein
response. The intent is to reduce the confusion that arises from
comparison between these studies as a collective whole, when
one may be unaware of certain design caveats within a given
study. Without this overview, interpretation is clouded by the
fact that studies often had substantially different objectives and
designs. Even though most studies included here have utilized
interesterified fat in at least one diet, some contained minimal
interesterified fat or presented it in such a way that any adverse
response would likely fall below detection, i.e., the design
failed to very rigorously test the acceptability of the
interesterified fat by avoiding upper levels of intake. This, of
course, has the advantage of making the food product appear
‘‘safe’’ but fails to consider the impact of the modified fat
when consumed at higher intakes if the interesterified fat were
present in a wide variety of foods eaten daily, as opposed to a
single product or a single meal.
Beneath each column is a condensed code that nutritionists
typically use to characterize a dietary fat as applied to
cardiovascular disease (CVD) research. The first line is the
code name for the diet; the second line indicates the percent of
the dietary calories contributed by the fat, most typically
ranging between 30% and 40% of daily energy intake (%E).
The third line denotes the overall ratio of S:M:P (saturated,
monounsaturated, polyunsaturated) fatty acids contributed by
summation of the various fatty acid molecules consumed in the
total diet on a %E basis. The fourth line represents a shorthand
(the P/S ratio) that quickly keys a nutritionist to the
cholesterol-raising potential of a dietary fat composition,
e.g., when the P/S ratio is 0.5, SFA are twice as prevalent as
PUFA, and the blood cholesterol may be high, while a P/S
ratio of 1.0 or more generally maximizes the lowering of TC
by the fat component in the diet. The typical dietary P/S ratio
in North America is currently about 0.4. If Americans could
raise it to about 1.0, major health benefits would follow
[1–3,11,12].
By applying the aforementioned codes while reading the
study summaries, the reader should gain substantial insight
concerning the relationship between the human lipoprotein
response and changes in specific classes, as well as individual
dietary fatty acids (S:M:P), and how their inclusion in
interesterified fats might affect that relationship.
TG structure represents a second important consideration
(Fig. 1). For orientation purposes, the reader should remember
that each TG molecule includes 3 fatty acids esterified to the 3
carbons in a molecule of glycerol, referred to as the sn1, sn2,
and sn3 carbons. Nature typically assigns specific fatty acids to
these carbons in natural fats and oils, depending on the plant/
animal source. Almost all fats from any natural source have
TG molecules that have more than one type of fatty acid (SFA,
monounsaturated fatty acid [MUFA], PUFA) in combination to
make the complete TG molecule. Also, usually the sn2 fatty
acid is either monounsaturated or polyunsaturated; seldom is it
saturated unless isolated from milk fat, coconut oil, or palm
kernel oil, a point with biological implications for lipoprotein
metabolism, which will be discussed later.
When interesterified fat is formed with a chemical catalyst,
the most common approach, the objective is to insert an SFA
into a vegetable oil to harden it, much like partially
hydrogenating a fat would do. The assumption has been that
since 18:0 seems neutral toward blood cholesterol when
consumed in natural fats (see following), it should be neutral
when randomly inserted into oils. Thus, it has become the SFA
of choice for IE and hardening of vegetable oils. Some have
also modified (hardened) fat by inserting 16:0 during IE.
In this review, the assumption that IE of SFA is without
effect is examined by assessing the dietary fat designs carefully
for fat composition and comparing between diets, especially
the fatty acid relationships, and assessing results as expressed
in lipoproteins. Certain global assumptions are in place in the
scientific and, by extension, in the lay community that certain
fatty acids are either problematic or healthy, based on what we
think they do to lipoprotein metabolism. This includes 12:0,
14:0, and 16:0, which are considered cholesterol-raising; 18:0
as neutral; 18:1 as neutral to cholesterol-lowering; whereas
18:2 and 18:3 are assumed to have the ability to lower
cholesterol [3,12–14]. However, this expression of fatty acid
potential is not cast in stone, as many exceptions exist,
especially when other aspects of the diet are considered,
including cholesterol intake [3,11,12].
Replacing Trans Fat
JOURNAL OF THE AMERICAN COLLEGE OF NUTRITION 255S

Replacing Trans Fat
256S VOL. 29, NO. 3

Replacing Trans Fat
JOURNAL OF THE AMERICAN COLLEGE OF NUTRITION 257S
Replacing Trans Fat
258S VOL. 29, NO. 3

Replacing Trans Fat
JOURNAL OF THE AMERICAN COLLEGE OF NUTRITION 259S

Replacing Trans Fat
260S VOL. 29, NO. 3
Replacing Trans Fat
JOURNAL OF THE AMERICAN COLLEGE OF NUTRITION 261S

Replacing Trans Fat
262S VOL. 29, NO. 3

Replacing Trans Fat
JOURNAL OF THE AMERICAN COLLEGE OF NUTRITION 263S

Replacing Trans Fat
264S VOL. 29, NO. 3
Replacing Trans Fat
JOURNAL OF THE AMERICAN COLLEGE OF NUTRITION 265S

Replacing Trans Fat
266S VOL. 29, NO. 3
Replacing Trans Fat
JOURNAL OF THE AMERICAN COLLEGE OF NUTRITION 267S

Replacing Trans Fat
268S VOL. 29, NO. 3

Replacing Trans Fat
JOURNAL OF THE AMERICAN COLLEGE OF NUTRITION 269S

STUDY SUMMARIES
Interesterified Fats
Betapol in Piglets. Because breast milk from humans and
other species contains appreciable saturated fat and SFA,
infant formulas for human infants have long been formulated
to include saturated fat. But natural milks also provide fat with
substantial sn2-SFA. For example, palmitic acid (16:0) in
human breast milk is predominantly present as sn2-16:0. Thus,
for infant formula production, palm oil was redesigned from its
natural sn1,3-16:0 to incorporate substantial sn2-16:0 by IE,
generating a milk TG structure more in keeping with human
breast milk. The effect of this restructured fat (Betapol) was
tested initially in piglets by Innis et al. in 1993 [15] (Fig. 2).
Piglets (6 per group) were fed infant formula from birth for
18 days. Formulas were based on medium-chain TG (MCT)
with 8:0+10:0, coconut oil, or palm oil (sn1,3-16:0), or on
Betapol (where the 16:0 at sn1,3 in palm oil was mainly
relocated to sn2 by IE; sn2-16:0). All these formulas were
compared to sow milk, which is also naturally structured with
sn2-16:0. Note from Fig. 2 that 11%E was provided as 18:2 in
all diets except sow milk, which only provided 5%E as 18:2.
Total fat provided 58%E for all formula diets to mimic sow
milk, which had a measurable content of palmitoleic acid
(16:1), and like all natural milks, it contained cholesterol.
Because of the higher PUFA in formulas, the P/S ratio of the
formulas was more than twice that of sow milk (0.5 vs 0.2).
Note that total SFA and MUFA were essentially constant
across all milks; only the type of SFA differed.
The results are informative. First, all the cholesterol-free
formulas induced a plasma TC response that was about half
that of the natural sow milk. Second, under conditions of their
high PUFA intake, all 4 formulas produced similar LDL/HDL
ratios, and the first 3 had comparably low TC values. Only sn2-
16:0 as Betapol raised both LDL and HDL proportionately
compared to the sn1,3-16:0 of palm oil, indicating that the
interesterified fat, with sn2-16:0 and essentially the same fatty
acid profile as the natural palm oil formula, modestly raised
plasma cholesterol in all lipoprotein fractions. The point is that
the introduction of sn2-16:0 by IE in Betapol caused the
plasma cholesterol to rise in piglets in a cholesterol-free
formula. This was exacerbated by sow milk (especially the
LDL increase relative to HDL), in part because of its lower
18:2 content and the presence of cholesterol. The cholesterol-
raising capacity of dietary cholesterol in concert with
consumption of saturated fat at low 18:2 intakes (and possibly
exacerbated by sn2-16:0, as seen here) has been discussed
Replacing Trans Fat
270S VOL. 29, NO. 3
previously [11,12,14] but is illustrated dramatically by this
example.
In addition to TG structure and sn2-SFA differences, 3
other factors likely contributed to the striking impact of dietary
fat composition on lipoproteins in this instance. First, the total
fat calories in sow milk (and replacement formulas) were high,
at 58%E, so the metabolic impact of the dietary fatty acids and
TG structure were accentuated. Second, these piglets were fed
a fixed fat source, with a constant food (and fat) composition
with every swallow. No exceptions or extraneous fat sources
were introduced, so the true impact of a specific dietary fat
composition on plasma lipids was realized by redundancy.
Third, unlike adults, growing newborns have minimal adipose
(fatty acid) reserves to mix with incoming dietary fat
(especially not 18:2n6 or essential fatty acids, in general), so
their diet represents the sole fat (fatty acid) source influencing
lipoprotein metabolism during rapid growth, amplifying the
metabolic impact of the fatty acid mixture being consumed.
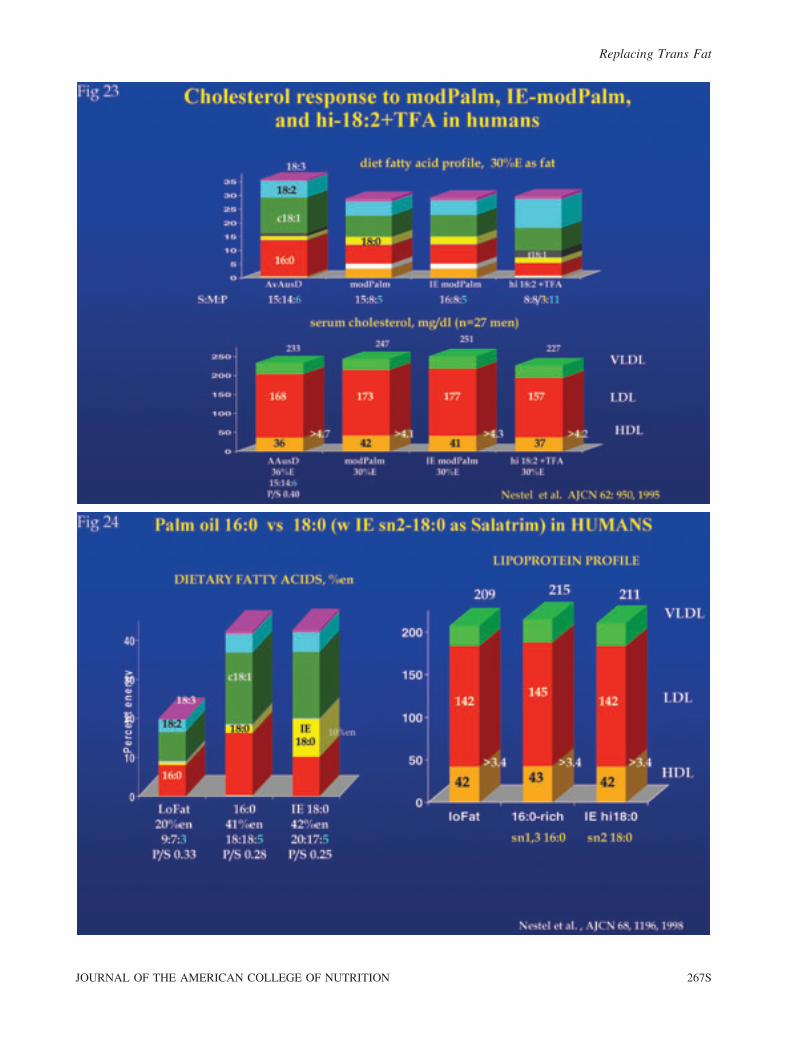
Betapol (sn2-16:0) in Human Infants. Following the
piglet study, a similar experiment was conducted in human
infants by the same lab (Fig. 3) [16]. Here, palm oil with sn1,3-
16:0 was compared again to Betapol (sn2-16:0 by IE) and
breast milk (sn2-16:0) at 46%E from fat for 3 groups (22 to 40
infants per group) in a parallel study for 3 months. Results
were somewhat similar to those in piglets. Although the TC did
not differ between the 2 formula diets, the LDL almost doubled
and HDL decreased substantially with Betapol, adversely
increasing the LDL/HDL ratio in the infants receiving this fat
formula, with its restructured TG containing sn2-16:0
compared to the same amount of natural sn1,3-16:0 in the
palm oil formula. This effect of interesterified fat in infants is
reminiscent of the LDL/HDL response associated with TFA
intake in adult humans (see later text). Human milk, with 40%
less 18:2 than formulas, coupled with its cholesterol content,
caused a striking rise in TC similar to that seen in piglets while
increasing the LDL/HDL ratio almost threefold over the palm
oil formula and 50% over the Betapol formula. It is noteworthy
that lower dietary 18:2 (6%E) plus the cholesterol in breast
milk, like sow milk in piglets, once again exacerbated the
increase in the plasma LDL/HDL ratio. This increase
presumably reflects nature’s way to insure the high level of
LDL cholesterol that is needed for rapid expansion of cell
membranes during the development of infant organs and brain,
but it would not be desirable in adults.
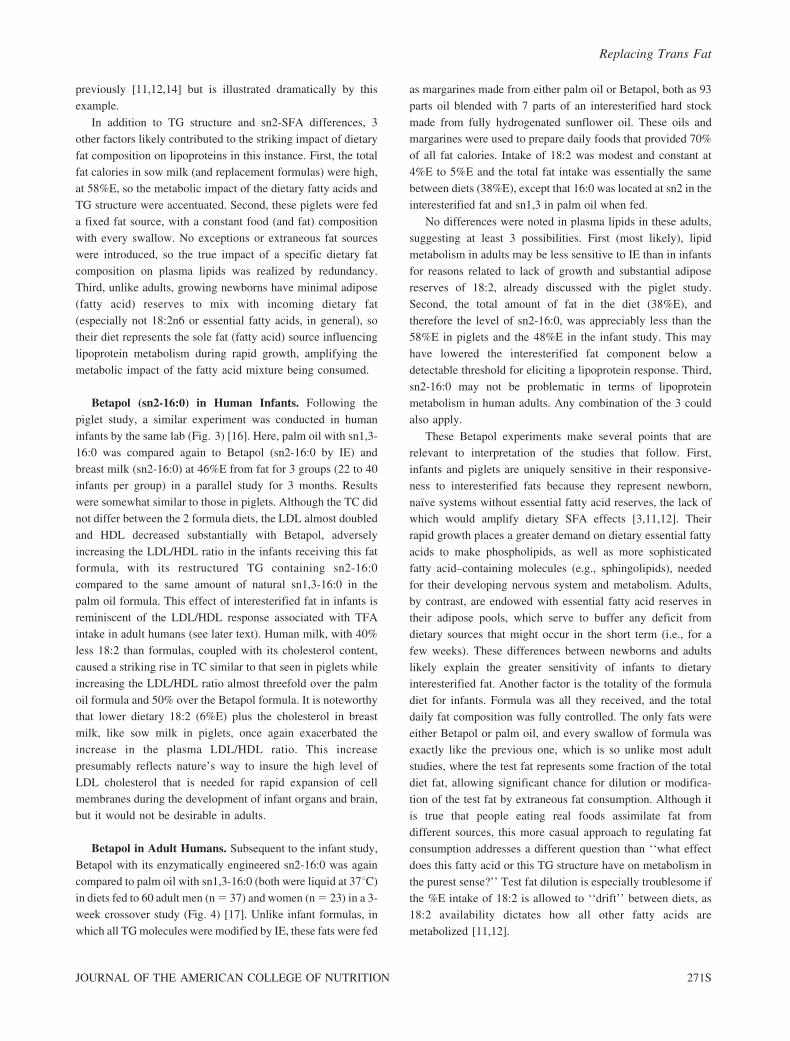
Betapol in Adult Humans. Subsequent to the infant study,
Betapol with its enzymatically engineered sn2-16:0 was again
compared to palm oil with sn1,3-16:0 (both were liquid at 37uC)
in diets fed to 60 adult men (n 5 37) and women (n 5 23) in a 3-
week crossover study (Fig. 4) [17]. Unlike infant formulas, in
which all TG molecules were modified by IE, these fats were fed
as margarines made from either palm oil or Betapol, both as 93
parts oil blended with 7 parts of an interesterified hard stock
made from fully hydrogenated sunflower oil. These oils and
margarines were used to prepare daily foods that provided 70%
of all fat calories. Intake of 18:2 was modest and constant at
4%E to 5%E and the total fat intake was essentially the same
between diets (38%E), except that 16:0 was located at sn2 in the
interesterified fat and sn1,3 in palm oil when fed.
No differences were noted in plasma lipids in these adults,
suggesting at least 3 possibilities. First (most likely), lipid
metabolism in adults may be less sensitive to IE than in infants
for reasons related to lack of growth and substantial adipose
reserves of 18:2, already discussed with the piglet study.
Second, the total amount of fat in the diet (38%E), and
therefore the level of sn2-16:0, was appreciably less than the
58%E in piglets and the 48%E in the infant study. This may
have lowered the interesterified fat component below a
detectable threshold for eliciting a lipoprotein response. Third,
sn2-16:0 may not be problematic in terms of lipoprotein
metabolism in human adults. Any combination of the 3 could
also apply.
These Betapol experiments make several points that are
relevant to interpretation of the studies that follow. First,
infants and piglets are uniquely sensitive in their responsive-
ness to interesterified fats because they represent newborn,
naı̈ve systems without essential fatty acid reserves, the lack of
which would amplify dietary SFA effects [3,11,12]. Their
rapid growth places a greater demand on dietary essential fatty
acids to make phospholipids, as well as more sophisticated
fatty acid–containing molecules (e.g., sphingolipids), needed
for their developing nervous system and metabolism. Adults,
by contrast, are endowed with essential fatty acid reserves in
their adipose pools, which serve to buffer any deficit from
dietary sources that might occur in the short term (i.e., for a
few weeks). These differences between newborns and adults
likely explain the greater sensitivity of infants to dietary
interesterified fat. Another factor is the totality of the formula
diet for infants. Formula was all they received, and the total
daily fat composition was fully controlled. The only fats were
either Betapol or palm oil, and every swallow of formula was
exactly like the previous one, which is so unlike most adult
studies, where the test fat represents some fraction of the total
diet fat, allowing significant chance for dilution or modifica-
tion of the test fat by extraneous fat consumption. Although it
is true that people eating real foods assimilate fat from
different sources, this more casual approach to regulating fat
consumption addresses a different question than ‘‘what effect
does this fatty acid or this TG structure have on metabolism in
the purest sense?’’ Test fat dilution is especially troublesome if
the %E intake of 18:2 is allowed to ‘‘drift’’ between diets, as
18:2 availability dictates how all other fatty acids are
metabolized [11,12].
Replacing Trans Fat
JOURNAL OF THE AMERICAN COLLEGE OF NUTRITION 271S
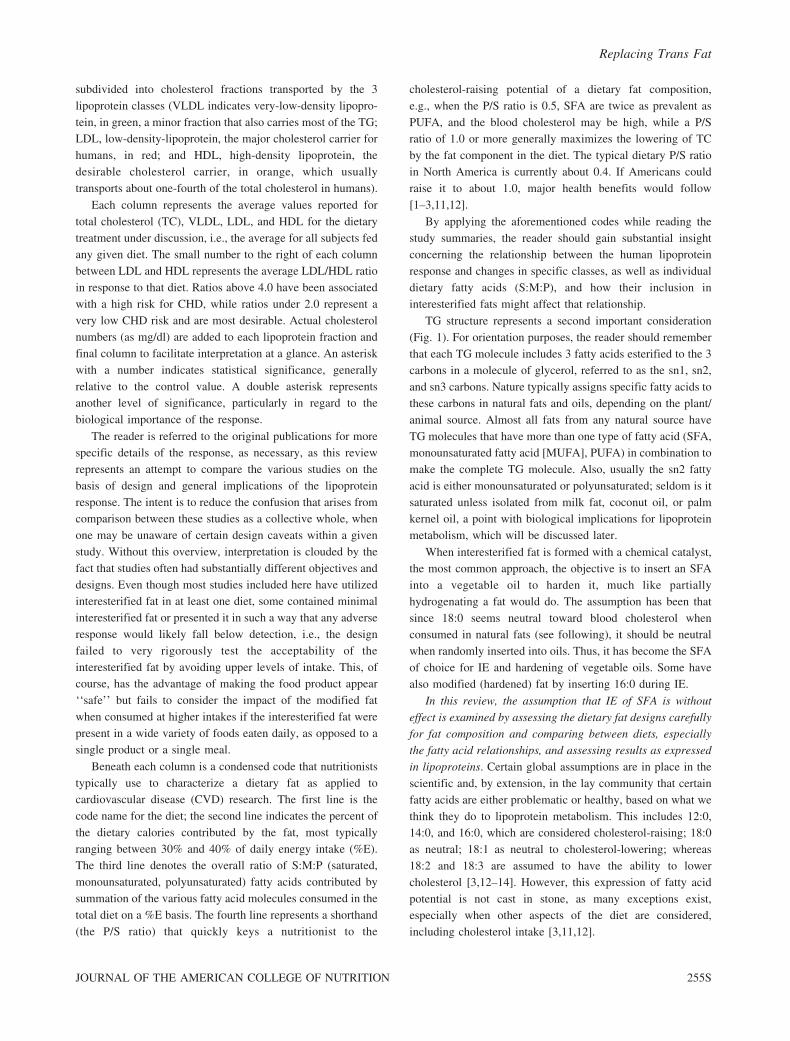
Interesterified 14:0. Two human studies focused on
interesterified fats enriched with myristic acid, with the idea
that 14:0 might be the cause of hypercholesterolemia
associated with saturated fats. The first study [18] examined
12 men, age 24 years, averaging 79 kg and 3300 kcal daily
intake. They were fed 2 diets in a crossover design for 3 weeks
each (Fig. 5). The first diet provided about 17%E as myristic
acid incorporated by IE of tri-14:0 into hi-18:1 sunflower oil,
which was compared to natural palm oil, providing 17%E as
sn1,3-16:0. Both diets had 3.5%E as 18:2, so the major
difference was sn2-14:0 vs sn1,3-16:0 in an equal 14%E
exchange of these 2 fatty acids. Test fat represented 90% of all
daily fat, but protein intake was only 11%E. Surprisingly,
neither diet raised relatively low baseline cholesterol levels in
these young men, and the TC and LDL were the same for both
diets. However, the HDL was 10% higher in sn2-14:0, so that
the LDL/HDL ratio was lower. Low protein intake may have
depressed all lipoproteins, making fatty acid effects less
detectable. The exceptionally high SFA exchange at 14%E is
somewhat unique, like the findings of McGandy et al. [19] (see
below), who also found no significant differences between IE-
14:0 and IE-16:0 in MCT at 14%E exchange, but the 18:2%E
was ,1 in that case.
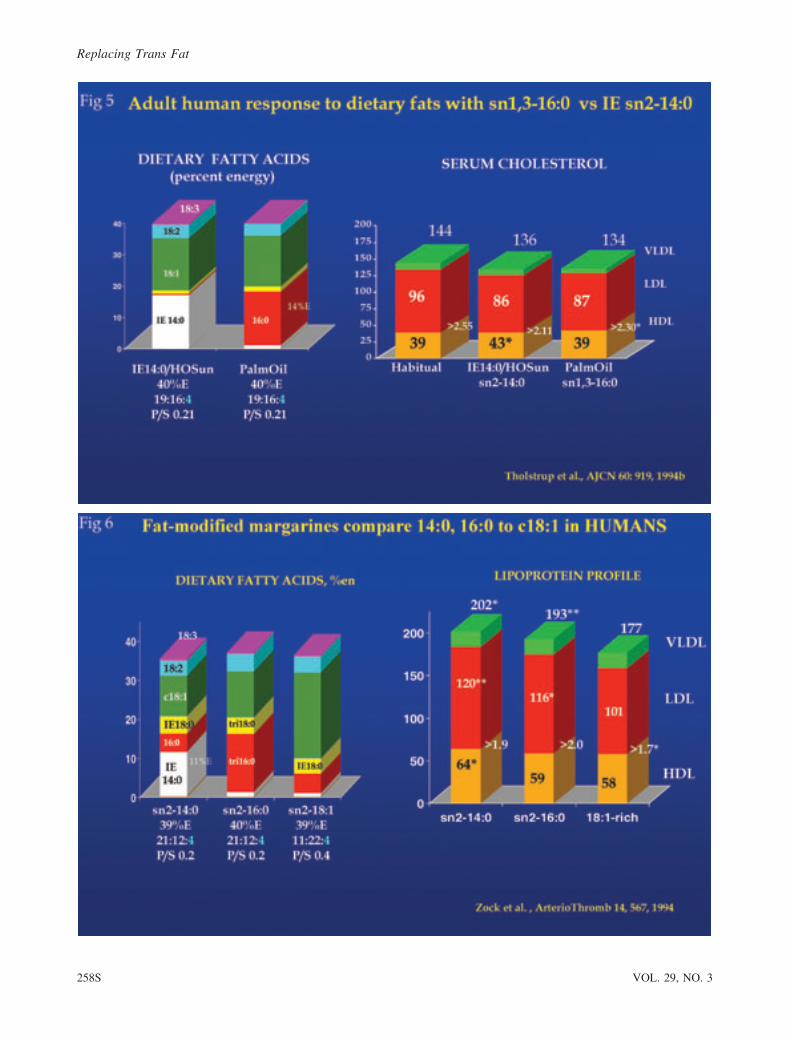
A study by Zock et al. [20] also incorporated IE-14:0 at
11%E for comparison with diets enriched with either 16:0 or
c18:1, with about 10%E exchanged among the 3 fatty acids
across diets (Fig. 6). To generate an exact substitution of 14:0
or 16:0 for c18:1, complex margarines were formulated, each
modified in some aspect. The first fat introduced 50% 14:0
(11%E) made possible by IE with pure 14:0 as the fatty acid
and a complex fractionation process to reach the desired mix of
fatty acids. The 16:0-rich fat was based on palm stearin
(naturally rich in tri-16:0) and included fully hydrogenated
sunflower blended in. Even the c18:1 fat was made with added
18:0 by IE, so some TG in all 3 fats had sn2-18:0. Thus, none
of the fats can be considered natural, and no true standard
reference was fed as a control for the 3 modified fats, as the
underlying assumption was that TG structure was unimportant
to fatty acid performance and therefore was not necessary to
control with a naturally sourced fat. The 18:2 content was held
constant at 4%E.
Results (Fig. 6) revealed that the high 14:0-enriched fat with
sn2-14:0 generated the highest TC, LDL, and HDL compared to
the most normal of the 3 fats, i.e., that rich in c18:1. The
modified 16:0-rich fat was intermediate in terms of lipoprotein
increases. However, interpretation is complicated within the
context of this review, because none of the 3 fats were naturally
sourced, and the 2 saturated fat preparations contained sizable
amounts of tri-14:0 or tri-16:0, respectively. These tri-monoacyl
molecules likely contributed to the cholesterol increases, based
on sn2-SFA independent of their 14:0 or 16:0 content. Plus,
although 14:0 represented 47% of the fatty acid in one test fat,
the test fat itself represented less than one third of total fat %E in
the diet, with about 40% of dietary fats derived from extraneous
foods. Thus, despite the implied conclusion, the report does not
contribute robustly to our understanding of the contribution
between sn2-SFA and natural fats rich in 12:0, 14:0, or 16:0 to
lipoprotein metabolism. Nonetheless, it is interesting that 14:0
in this matrix again raised HDL substantially more than the
16:0-rich fat.
Fats with Tri-SFA Blends. Another study [21] with
modified fats (Fig. 7) fed 18 premenopausal women (average
age 28 years) diets that were based on blends of saturated fats
that emphasized specific SFA, incorporated mainly as the tri-
SFA by blending, without IE. Thus, TG structure (and sn2-
SFA) was a lesser factor in the experiment and varied from
about 18%–22% of TG molecules for 16:0 and 18:0 to more
than 40% for the 14:0 diet. Subjects rotated through 3 diet
periods of 5 weeks each with diets providing 35%E–38%E as
fat in a repeated-measures design. One diet emphasized 14:0
from butter, coconut oil, and a high proportion of trimyristin. A
second was enriched with 16:0 as tripalmitin mixed with
coconut oil, butter, and lard as sources of SFA. The third diet
was rich in 18:0 from shea nut oil, tristearin, and coconut oil.
In part because of the tri-SFA admixture, the test SFA
presented in the sn2 position varied widely between diets, even
though the fat blend was not interesterified. The amount of
specific tri-SFA was appreciable at about 14%E of total energy
for the 14:0-rich diet, or slightly more than a third of total fat
calories. The 18:2 intake was constant and low at 3%E, but
followed a week with a preloading diet containing 10%E as
18:2. Dietary cholesterol was about 320 mg/d.
Results (Fig. 7) indicated that both 14:0 and 16:0 as tri-
SFA raised TC above baseline values, while the 18:0-rich diet
had no effect on TC, LDL or HDL compared to the 1-week
baseline diet that preloaded 3 times the amount of dietary 18:2
(rationale not provided, but it may have biased the minimal
response observed with any fat). The tri-14:0 diet increased
HDL, so the LDL/HDL ratio was unchanged from entry,
whereas only the tri-16:0 fat increased LDL more than HDL to
raise the LDL/HDL ratio in these women with low blood lipid
values. The 18:0 diet also excreted more SFA in feces. The
point is that sn2-18:0 when fed as a tristearin (20% of the total
18:0) can be without effect on blood lipids, even at low 18:2
intake, but after a preload diet for 1 week with 10%E as 18:2.
These rather modest differences may have occurred because
the tri-SFA were blended into other fats, limiting the sn2-SFA
incorporation that would have occurred among all TG
molecules had the entire fat blend been exposed to IE. Also,
the total SFA supplied about half of all fat calories in women
(estrogen) with very low plasma lipid values, and both factors
served as a buffer against a dietary saturated fat impact. Thus,
the target population needs to be considered when interpreting
Replacing Trans Fat
272S VOL. 29, NO. 3
the response. Practical implications are difficult to assess
because such large quantities of tri-SFA were blended into the
diet fat, unlike any natural fat humans would consume, which
also differs from using IE to distribute the SFA evenly among
TG molecules, as occurs in most fatty acid enrichment
applications. Nonetheless, it is noteworthy that 14:0 increased
HDL under these circumstances and 16:0 increased LDL.
A similar experiment was published more recently [22]. In
that study 45 subjects (18 men, 27 women) were fed the 3
different fats in 5-week rotations in a random crossover design.
Here again, blending, rather than IE, was used to compare
saturated 18:0 with monounsaturated oleic acid (c18:1) or
polyunsaturated linoleic acid (18:2) in a 7%E exchange
between these 3 fatty acids across diets (Fig. 8). All other
fatty acids remained constant, with the limitation that 2 diets
contained only 2%E as 18:2, while the 18:2-rich diet provided
this fatty acid at 9%E. The 9%E as 18:0 was derived from 29%
tri-18:0 and 34% cocoa butter in the test fat matrix, and the tri-
18:0 was incorporated by blending rather than subjecting the
entire blend to IE. The diets supplied 38%E as fat (only 34%E
accounted for by fatty acid distribution), and 60% of the fat
was derived from the experimental margarines, which
represented blends of 4 to 6 fats each.
The response of these moderately cholesterolemic subjects
was similar for all 3 diets, i.e., no changes were noted in TC,
LDL, or HDL, which is rather surprising, given the well-
documented lowering potential of 18:2. The other 2 diets may
have been unresponsive as a result of their limited 18:2
content, distorting the responses seen relative to expectations.
This was similar to Snook et al. [21], who blended tri-18:0 into
the fat rather than by IE, as those subjects also did not alter
their lipid profile from baseline (Fig. 7). However, their
subjects did show increased cholesterol when tri-SFA from
14:0 or 16:0 was ingested. It may be that the failure to
manipulate the blends by IE limited the sn2-18:0 distribution
among total fats ingested, thereby limiting the negative impact
of sn2-18:0 demonstrated in other studies, where IE was
applied.
Naturally Saturated Fats and the LDL/HDL Ratio.
Beyond experiments with Betapol and interesterified or
atypical fats with sn2-SFA (incorporated as in tri-SFA blends),
a direct comparison of natural saturated fats and their specific
SFA on the lipoprotein response is worth noting. This allows
for comparison with interesterified fats, where processing
causes some SFA to be situated unnaturally at sn2 in
potentially all of the dietary fat consumed. For example, only
a few natural fats contain SFA at sn2 in addition to sn1,3
(coconut oil, palm kernel oil, milk fat) and simultaneously
when we have a very low 18:2 content, and all 3 raise plasma
cholesterol substantially relative to all other fats. This
presumably reflects their minimal 18:2 among their TG-MS.
Thus, a second study by Tholstrup et al [23] emphasized the
difference in TG structure by simultaneously investigating 3
natural saturated fats having either sn1,2,3 endowed with 12:0,
14:0, or 16:0 (a palm kernel oil base mixed with hi-oleic
sunflower oil as a 55:45 mix), sn1,3-16:0 (palm oil), or sn1,3-
18:0 (shea nut oil), each of which was compared to the habitual
diet at entry to the study (Fig. 9). Fat supplied 40%E. The
exchange between 12:0+14:0, 16:0, and 18:0 between diets
was about 14%E, and the test fat was 90% of the total fat
ingested, meaning that the other dietary components were very
low in fat. These other components also supplied only 10%E as
protein, which may have biased results somewhat. Total
amounts of SFA and MUFA were about the same between
diets; only the quality (chain length) of the SFA differed, along
with the location of the SFA on the fat molecule. However, the
palm oil–based fat provided 50%–80% more 18:2 than the
other 2 test fats, but all provided less than 4%E from 18:2, and
the 14:0-rich and 18:0-rich diets were sufficiently low in
PUFA to possibly have biased results also. The addition of a
PUFA-rich fat to ensure equal PUFA across all 3 diets would
have facilitated interpretation. The 15 young men were rotated
through 3 diet periods of 3 weeks each.
Not surprisingly, like studies by Ng et al. [24] and Sundram
et al. [25], which examined coconut oil or various palm oil
products, the palm kernel oil–high-oleic sunflower oil fat, with
the lowest P/S ratio and with many of its TG molecules having
all 3 fatty acids as SFA, caused TC to rise the most, followed
by the fat that was rich in sn1,3-16:0. Despite its low 18:2 and
P/S ratio, the shea nut oil with sn1,3-18:0 actually produced
the lowest TC, lowering both LDL and HDL substantially
(Fig. 9). It is not obvious why this extraordinary decline
occurred, but the low protein and low 18:2 intakes may have
played a role, plus the fact that fats with unusually high 18:0 and
low 18:2 seem to depress overall lipid absorption (not measured
here) and metabolism. This result with shea nut oil is a good
example of why 18:0 in natural fats is not considered
cholesterol-raising. With the natural sn1,3-18:0 configuration
in shea nut oil or cocoa butter [26], neither TC nor LDL is
raised, but high intakes of sn1,3-18:0 can depress HDL [27], as
observed here and similar to interesterified fats enriched in sn2-
18:0 (see following). These data also demonstrate that natural
fats having sn2-SFA (e.g., palm kernel oil) raise LDL and HDL,
i.e., both lipoproteins increase simultaneously when consuming
such fats, especially at lower 18:2 intakes, as seen here.
Fig. 10 illustrates 2 of the original studies describing the
plasma lipoprotein response to diets comparing coconut oil or
various palm oils, either alone or mixed with other oils and fed
as typical Asian dishes in a native population. Ng et al. [24]
compared coconut oil with palm olein and corn oil as natural
oils, i.e., 2 natural saturated fats versus a highly unsaturated
oil, and found that coconut induced the highest TC, LDL, and
HDL, with the response to palm olein intermediate between
Replacing Trans Fat
JOURNAL OF THE AMERICAN COLLEGE OF NUTRITION 273S
much lower values for corn oil. The LDL/HDL ratio did not
change from the study’s onset with coconut oil, but it was
decreased progressively by palm olein and corn oil as the %E
of 18:2 increased. Note that this ratio following corn oil was
even lower than that for shea nut oil in the Tholstrup et al.
study [23] (Fig. 9).
A second similar study [25] fed subjects a 16:0-rich fat
based on a blend of natural saturated fats such as palm stearin,
palm oil, palm kernel oil, and corn oil. This was compared, in a
crossover design of 4 weeks each, to a second 12:0+14:0-rich
blend of coconut oil, palm kernel oil, and canola oil, which
produced an exact exchange of 12:0+14:0 for 16:0+18:0 of
about 4%E. The 18:2 was low at 3.5%E for both fats. The
results (Fig. 10) indicated a modest decrease in TC, LDL, and
HDL with the 16:0+18:0 blend that did not alter the LDL/HDL
ratio. The cholesterol-raising capacity of the 12:0+14:0-rich fat
was consistent with earlier publications on coconut oil and
butterfat. Results emphasize the higher HDL with 12:0+14:0,
but LDL also increased with that fat, as is customary with
natural saturated fats at a low 18:2 intake.
Revisiting the Initial IE Study
Studies such as Zock et al. [20] and Tholstrup et al. [23]
raise the issue of which SFA (in a saturated fat) is most
responsible for inducing hypercholesterolemia. This question
indirectly led to one of the earliest studies of interesterified fats
in humans [19]. These investigators were among the first to
suspect that individual fatty acids were important in plasma
cholesterol regulation; they reasoned that this could be tested
by simply incorporating more than normal amounts of a single
SFA into another fat, thereby enriching an otherwise non-
cholesterolemic oil with SFA ranging from 10:0 to 18:0. Their
results were prophetic regarding the possible use of inter-
esterified fats for general application to foods. However, it is
fair to say that their enrichment of an oil with a given SFA did
not anticipate the impact of TG structure on lipoprotein
metabolism but rather addressed the simple notion that
superabundance of a single SFA would reveal which SFA
was exerting the predominant effect on plasma cholesterol.
For these studies, a stable population of 21 men (about
50 years old) with an average body mass index of about 24 was
studied for a 4-year period in an institutional setting. In this case,
subjects consumed a series of 26 fat preparations sequentially in
whole diets during 4-week periods for 1.5 years to assess
specific fatty acid effects on serum cholesterol. All foods were
prepared in conjunction with the house chef, and specially made
fats (Procter & Gamble Co.) were incorporated into the diet to
determine whether all SFA were equally cholesterol-raising,
when each was added separately in excess to a specific fat or oil.
Addition of the SFA took 2 forms: IE of a blend of 75 parts
natural oils (olive or safflower) with 25 parts tri-SFA (e.g., tri-
12:0, tri-14:0, tri-16:0) or fully hydrogenated soybean oil that
generated tri-18:0+16:0 containing an 85:15 ratio of 18:0 to
16:0. As additional fat sources, MCT containing only 10:0 on
the glycerol molecule were interesterified with the various tri-
SFA in a 60:40 ratio in another dietary series, whereas in another
dietary challenge, butterfat (rich in SFA from 2:0 to 18:0) was
simply blended with the tri-18:0 in a 80:20 ratio. Since butter
already had a high proportion of its TG-MS as tri-SFA, it
rendered the IE procedure less unique or necessary. Thus, the
other fat blends were chemically interesterified to randomize the
SFA among the sn1, 2, or 3 positions in conjunction with the
natural unsaturated fatty acids present in the original fat. These
interesterified fats were then incorporated into regular foods as
shortening to provide menus that allowed 38%E from total fat,
approximately 80% of which was provided by the test fats and
the rest of which came from the foods in the menus. The natural
fats and oils themselves were also fed for comparison with their
SFA-enriched variations.
Substitutions with additional interesterified fats were more
subtle and complex and are not detailed here, as our main
concern is simply whether IE makes a difference on blood lipids
and whether one can detect a difference in the influence of an
SFA. Once interesterified, the whole diet was analyzed for fat
and its individual fatty acid content, which was highly prescient
for that era. Again, there was no attempt to control the dietary fat
design for TG structure in these pioneering studies.
Although the study predated the modern era of lipoprotein
profile analysis, the data generated do allow us to retrospec-
tively approximate values for LDL, HDL, and VLDL, in part
because each subject was his own control and all samples were
processed in a similar manner throughout the series of diet
changes. This was also possible because the total serum
cholesterol was provided along with the beta-lipoprotein
fraction, an estimate of LDL based on acetate electrophoresis
in the early days of lipoprotein analysis. In addition, the serum
TG can be used to calculate VLDL with the Friedwald
equation (total TG/5 5 VLDL). The HDL was then calculated
as the difference between TC minus LDL+VLDL. Another
limitation was the fact that the 19 men finally included had
their values reported as the mean, group TC response to a fat,
rather than as individuals, so statistical analysis is not possible.
Also, the 19 men were divided into 2 groups, so the data
sometimes represent the mean for the 2 groups when they
consumed the same fat or a subpopulation of only 9 or 10 when
only 1 group received the specific fat in question. Despite these
limitations, the fact that each man served as his own control
throughout all diet rotations makes the data revealing and
clearly indicates interesterified fats as potential modulators of
serum cholesterol in humans when consumed in significant
amounts.
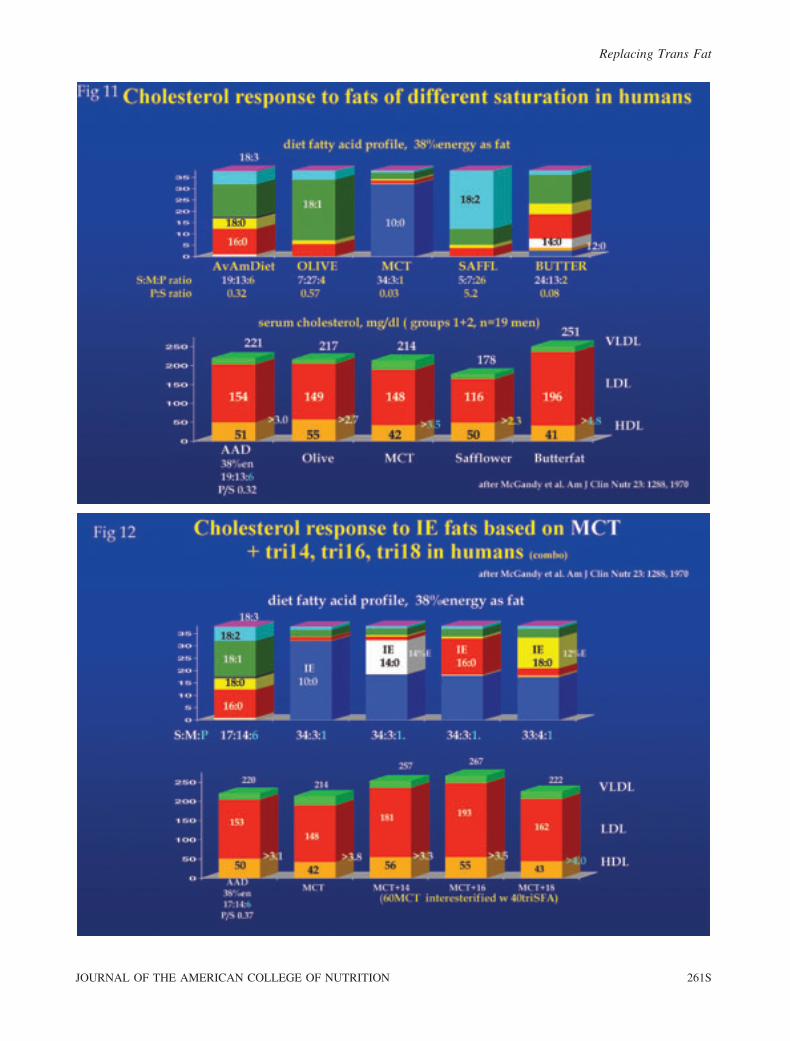
The first data from this study (Fig. 11) compare the
lipoprotein response of these men to each of 3 natural fats
versus their habitual diet and MCT. Note that the men were
Replacing Trans Fat
274S VOL. 29, NO. 3
moderately cholesterolemic (about 220 mg/dl) at the outset.
The safflower oil diet, which included an inordinate amount of
18:2 and had the highest P/S ratio, lowered cholesterol the
most and produced the lowest LDL/HDL ratio of all fats
because LDL declined appreciably. Also note that butter, with
essentially no 18:2 and the worst dietary P/S ratio (like MCT),
was the only natural fat to raise cholesterol above baseline
levels, which is represented by the ‘‘average American diet.’’
Note, too, that a large monounsaturated fat intake (cis18:1)
during olive oil consumption had no impact and that MCT
without appreciable 18:2 had no effect on TC but decreased
HDL substantially, in the manner of a high-carbohydrate (CHO)
diet. This raised the LDL/HDL ratio intermediate to butter,
which increased the ratio by raising LDL without raising HDL.
Since MCT absorb rapidly and go directly to the liver via the
portal vein like CHO, this might suggest that HDL in humans
may depend more on fat absorption and gut production of HDL
(apolipoproteins in chylomicrons) than on hepatic production
from CHO (as VLDL). Dietary cholesterol was constant at
325 mg/day, so it may have interacted with SFA to adversely
influence lipoprotein metabolism [12,14]. None of these results
with individual natural fats are surprising, and all generally have
been noted by others [3,24,25]. However, a novel observation
for the time was the impact of the specific SFA interesterified
into these base oils/fats.
MCT. In the MCT oil series (Fig. 12) the IE of SFA as
either tri-14:0, tri-16:0, or tri-18:0 (at a 60:40 ratio of MCT to
tri-SFA) inserted 14%E into the MCT diet in the form of the
selected SFA. This had an adverse influence in all cases
compared to MCT alone, at least for TC, i.e., when 18:2 intake
was very low (1%E). However, whereas 14:0 and 16:0 caused
major increases in both LDL and HDL, IE of tri-18:0 into
MCT increased LDL without increasing HDL, so this fat
actually resulted in the highest LDL/HDL ratio. The point is
that increasing the longer-chain SFA content of an 18:1- and
18:2-deficient oil (MCT) by IE to replace an equivalent
amount of 10:0 (at 14%E in the diet) raised TC by exerting a
variable effect on LDL and HDL, which in turn had either
positive or negative effects on the LDL/HDL ratio in these
adult men. Furthermore, the data indicate that longer-chain
SFA (14:0 to 18:0) are responsible for increasing LDL when
inserted into a non-cholesterolemic saturated fat (MCT with
tri-10:0); additionally, the data indicate that only 14:0 and 16:0
also increase HDL. This presumably occurred because IE
processing caused many of the TG molecules to have 14:0 or
16:0 at sn2. Apparently, IE-14:0 exerted the most favorable
influence (as previously emphasized), but IE-16:0 had a
favorable outcome for HDL as well.
Olive Oil. When olive oil was subjected to the same IE
process by inserting LC-SFA ranging from 12:0–18:0 in a
75:25 ratio of oil to tri-SFA, the final sum for 12:0, 14:0, 16:0,
and 18:0 combined represented about 14%E, but the olive oil
also quadrupled the 18:2 to 4%E compared to 1%E in MCT
preparations (Fig. 13). In this series, each specific interester-
ified SFA replaced about 8%E for cis18:1 in the olive oil. In
the lipoprotein response, the benefit of cis18:1 (MUFA) and
additional 18:2 (PUFA) over 10:0 in MCT is noticeable
because, although the TC and LDL responses to olive oil were
similar to MCT, the HDL increased and LDL/HDL ratio
decreased substantially. Again, the insertion of 14:0 into olive
oil induced the best response, raising HDL appreciably while
generating the lowest LDL/HDL ratio, including comparison
with olive oil alone. IE with both 16:0 and 18:0 generated the
highest LDL/HDL ratios, although the 18:0 insertion was an
improvement over that seen following its IE into MCT, and 12:0
insertion was intermediate between olive oil alone and olive oil
after IE with 14:0. Thus, feeding an oil with cis18:1 (and modest
18:2) as the main fatty acids improved results compared to the
MCT oil in terms of the LDL/HDL ratio, but only the random
insertion of 14:0 was an improvement over olive oil itself, at
least when considering the lipoprotein response and LDL/HDL
ratio.
Safflower Oil. Similar to the olive oil effect, a 75:25 blend
of polyunsaturated safflower oil interesterified with tri-SFA
resulted in the replacement of many 18:2 fatty acids with about
8%E from the individual SFA in question (Fig. 14). In this
case, none of the LC-SFA inserted by IE proved advantageous
because none improved the LDL/HDL ratio compared to
safflower oil alone. With abundant 18:2 present, IE-18:0
caused an increase in HDL but also caused an increase in LDL.
Thus, TC rose, but the LDL/HDL ratio was unchanged relative
to safflower oil alone. Inserting 16:0 was least desirable.
Butterfat. When butterfat was the stock fat (Fig. 15), the
addition of tri-18:0 (in an 80:20 blend) was without effect, but
butterfat caused a major decrease in HDL and major increases
in LDL and TC over entry levels, so that the LDL/HDL ratio
increased by approximately 65%. The other tri-SFA were not
fed as a blend with butter, presumably because butter is already
enriched with 12:0, 14:0, and 16:0, many in the sn2 position.
Thus, it is apparent that butterfat on its own (with the most sn2
SFA and minimal PUFA) increased CVD risk about 65% over
entry values based on the rise in TC/HDL ratio (see Lewington
et al. [28]).
The point is that all 3 tri-SFA esterified into the various oils
had a distinctive effect on LDL and HDL. With the exception
of 14:0, which seemed to have the capacity to preferentially
increase HDL, IE of SFA into natural oils or as a mixture of tri-
18:0 with butter had a negative impact, especially on the LDL/
HDL ratio. In contrast to 14:0, the main effect of added 18:0 at
about 12%E intake was to decrease HDL, whereas 16:0 tended
Replacing Trans Fat
JOURNAL OF THE AMERICAN COLLEGE OF NUTRITION 275S
to increase LDL. Also, 18:0 appeared closest to 16:0 in raising
LDL, and both seemed less desirable than either 12:0 or 14:0.
The trend induced by feeding an interesterified oil containing an
inserted SFA (random IE generating about one third sn2 as SFA)
was consistent, irrespective of the background fat used for IE or
its degree of unsaturation, i.e., whether it was saturated (10:0 as
in MCT), monounsaturated (18:1 as in olive oil), or polyunsat-
urated (18:2 as in safflower oil) fat receiving the inserted SFA.
Other points are noteworthy. In comparison to olive oil
alone, it would seem better (in terms of HDL and the LDL/
HDL ratio), to have 75 parts olive oil interesterified with 25
parts tri-14:0, and to a lesser extent tri-12:0, but not IE with tri-
16:0 or tri-18:0. This was not the case for safflower oil,
however, presumably because its high 18:2 content prevented
the increase in HDL that was observed by inserting 14:0 into
the high 18:1 content of olive oil.
Trans Fat vs Interesterified Fat
The urgency for replacing trans fat in the diet has been
reviewed recently [5,6], but the initiative began with the
observation that TFA had a negative impact on the lipoprotein
profile [29], a point that had been overlooked in the early days of
trans fat introduction. In the 1960s the significance of
lipoproteins in CVD was not fully appreciated, and TC was the
standard used to assess the impact of dietary fat on blood lipids.
One of the initial studies to examine this issue further with
lipoproteins as a focus [30] fed 56 normolipemic subjects a full
menu diet in which the fat was altered to incorporate high levels
of either linoleic acid, stearic acid, or TFA (as elaidic acid from
partial hydrogenation). About 8%E as each specific fatty acid
was exchanged between diets in a crossover design, such that all
subjects received all 3 diets (Fig. 16). All other fatty acids were
maintained at a constant level, with PUFA representing about
4%E in 2 of the diets and 12%E in the third. These
normolipemic subjects varied considerably in their individual
responses, but collectively the IE-18:0 diet depressed HDL
significantly to a point that was intermediate between 18:2 and
trans-18:1, with the latter inducing the greatest rise in LDL and
the greatest depression in HDL. The point is that partial
hydrogenation with TFA formation or full hydrogenation and
random insertion of 18:0 by IE negatively impacted LDL and
HDL, as well as the LDL/HDL ratio, not unlike McGandy et al.
[19]. Trans-18:1 also raised triglyceride levels.
Aro et al. [31] conducted a similar study but compared a
saturated fat (from dairy fat, mostly butter) with either TFA or
IE-18:0 (as a 9%E exchange) (Fig. 17). The study included 80
subjects (31 men and 49 women), with all 80 consuming the
saturated fat diet initially for 5 weeks before dividing into 2
groups of 40 to consume either the diet with 18:1 or IE-18:0.
Total fat provided was 33%E, with 3%E from polyunsaturated
fat. Both the TFA and IE-18:0 decreased TC relative to the
saturated dairy fat during the run-in period, but trans fat
decreased HDL by about 17%, while IE-18:0 caused an 8%
decrease in HDL. With trans-18:1 the LDL/HDL ratio
increased 20%, as did the apolipoprotein B/apolipoprotein
A1 ratio, while the atherogenic lipoprotein (a) (Lp[a])
increased by about 30%. Lp(a) increased by 10% with IE-
18:0. In many respects these results are comparable to those
cited earlier, indicating that high IE-18:0 intake can depress
HDL and raise Lp(a), although somewhat less than TFA.
Again, it would appear that distributing sn2-18:0 across all
TG molecules in dietary fat by IE is more detrimental than
incorporating the 18:0 as tri-18:0 by blending [21,22]. The
latter approach would concentrate the 18:0 in fewer molecules,
with two thirds at sn1,3, and seemingly reduce the negative
impact of 18:0 on metabolism. This point seems to have been
overlooked in a recent review on stearic acid [26], where meta-
analysis simply assessed total 18:0 intake without separating
responses based on whether the 18:0 was derived from natural
fats, tri-18:0 blended into other fats, or incorporated as IE-18:0
to convert many TG molecules to sn2-18:0. One can make the
point that, in fact, distortion of lipoprotein metabolism is
minimal when 18:0 is consumed in natural fats as sn1,3-18:0
but becomes progressively more evident as sn2-18:0 is
consumed either as tri-18:0 or more widely distributed among
all TG at sn2-18:0 by IE.
One of the best study designs and executions of a clinical
comparison between fats incorporating TFA, IE-18:0, and
natural saturated fats (SFA) in humans was conducted by Judd
et al. [32] (Fig. 18). Six dietary fat compositions were
compared in 50 men, each receiving all 6 diets during 5-week
rotations for 8 months. The fats were specially prepared by
industrial partners to ensure quality control for testing specific
fatty acid effects of interest, based on their practical
application in food products. Thus, the study compared a
CHO diet (i.e., asking whether less fat would be better) that
provided only 30%E from fat by replacing 8%E as c18:1 from
fat with CHO. This diet was tested against 5 other diets that
provided 38%E as fat. In each of the 5 higher-fat diets, the
CHO was replaced by 8%E as fat that targeted a specific fatty
acid. This was achieved by using specific fat compositions
based on special fat blends that isolated the impact of the
individual fatty acid in question. The first fat diet incorporated
MUFA-rich cis18:1 at 18%E; the second inserted 8%E as
trans-18:1 (via partially hydrogenated soybean oil) to replace
some cis18:1; the third had 4%E as TFA + 4%E from IE-18:0
(interesterified from fully hydrogenated soybean oil) to replace
some cis18:1; the fourth fat diet replaced 8%E as IE-18:0 for
some cis18:1; and the final fat diet substituted 8%E as SFA for
some cis18:1, using all natural saturated fats that included a
blend of palm stearin, coconut oil, cocoa butter, and butterfat. All
diets were adjusted by blending in the proper amount of canola or
corn oil to provide 4%E as 18:2n6 across all diets, representing
Replacing Trans Fat
276S VOL. 29, NO. 3

an excellent reference amount of 18:2 intake [11,12], and unlike
other studies [21–23] in which it was low or varied widely
between diets, while other fatty acids were being compared.
Because of the exemplary dietary fatty acid control, the
total SFA, total MUFA, and total PUFA intake was similar
across diets, so that the final P/S ratios for diets were
comparable, with slightly lower ratios for the last 2 fats as TFA
were removed and replaced by SFA. Thus, in the final analysis,
8%E as CHO, TFA alone, TFA + IE-18:0, IE-18:0 alone, or
natural 12:0+14:0+16:0, were substituted for an equal amount
of cis18:1 (control fat), while all other fatty acids were held
constant. All diets were consumed under cafeteria supervision
or on weekends with take-home meals previously prepared and
portioned according to need. The crossover design and
execution of the study were remarkable for their detail
involving regular whole-food diets and comparison between
fatty acids in clinical studies of this duration.
Plasma lipids and lipoproteins revealed that the CHO and
cis18:1 diets were similar, generating the lowest total choles-
terol and best LDL/HDL ratios (Fig. 18). Interestingly, the
natural SFA diet produced a LDL/HDL ratio equal to that of the
first 2 diets, even though total TC was elevated. The ratio was
the same because the increase in LDL was matched by an
increase in HDL (consistent with the impact of fats rich in 14:0;
see earlier text). By contrast, the other 3 fats containing TFA or
IE-18:0 all raised TC similar to the SFA diet, but unlike the
natural SFA or cis18:1, all 3 of these exchanges adversely
affected the LDL/HDL ratio by raising LDL and reducing HDL.
The trans fat was most offensive, with IE-18:0 being somewhat
less, and the mix of the 2 being intermediate in terms of the final
LDL/HDL ratio. Even though HDL decreased only slightly
during the IE-18:0 intake, a trend for IE-18:0 to raise the LDL/
HDL ratio was apparent and similar to other studies of IE-18:0.
In addition, publication of additional data from the same
study revealed that TFA and IE adversely impacted certain
aspects of immune cell function and inflammatory markers
[33]. The point is that both types of restructured fats, whether
as TFA insertion into the TG by partial hydrogenation of an oil
or 18:0 insertion by IE, impacted lipoprotein metabolism
adversely in normal subjects fed under highly controlled
conditions of fat composition while ingesting whole foods.
These data support several other reports on IE-18:0
described earlier [19,30,31] and earlier Betapol studies in
neonates with IE-16:0 [15,16], indicating that modification of
TG-MS by IE with different SFA can have an adverse impact.
In effect, both TFA and IE-18:0 can alter lipoprotein
metabolism when all fatty acid intakes are accounted for and
specific fatty acid exchanges are precisely executed between
diets. Again, unlike the propensity for an HDL-depressing
influence of 18:0, the presence of 14:0, and possibly 16:0, in
natural saturated fats fed here raised HDL along with LDL, as
noted earlier [23–25].
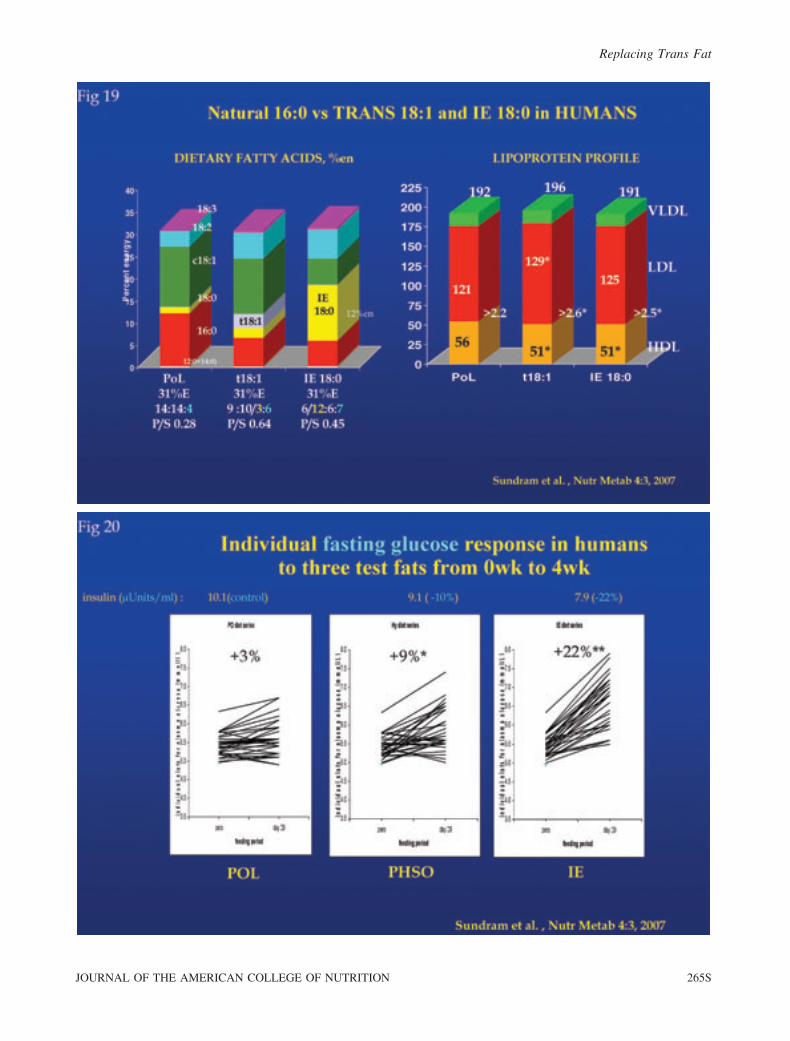
In a report by Sundram et al. [34], both a trans-rich and an
interesterified fat (as IE-8:0) were compared to an unmodified
saturated fat for their relative impact on blood lipids and plasma
glucose. Each fat had melting characteristics, plasticity, and solid
fat content suitable for use as hard stock in margarine and other
solid fat formulations. Unlike the studies supplying only modest
amounts of margarine as test fats (see later text), these modified
fats were fed directly as the entire test fat and were not diluted by
additional fat other than that present in low-fat foods in the diet.
Thirty human volunteers were fed complete, whole-food diets
during 4-week periods, where the total fat (,31% daily energy,
.80% from the test fats) and fatty acid composition were tightly
controlled. A crossover design was used with 3 randomly
assigned diet rotations and repeated-measures analysis. One test
fat rotation was based on natural palm olein (POL) and provided
12.0%E as palmitic acid (16:0); a second contained trans-rich,
partially hydrogenated soybean oil (PHSO) and provided 3.2%E
as TFA plus 6.5%E as 16:0; while the third fat was interesterified
with 18:0 to provide 12.5%E as stearic acid (IE-18:0). After
4 weeks, the plasma lipoproteins, fatty acid profile, and fasting
glucose and insulin were assessed. In addition, at 2 weeks into
each 4-week period, an 8-hour postprandial challenge was
initiated in a subset of 19 subjects who consumed a breakfast
containing 53 g of the test fat.
After 4 weeks, both PHSO and the interesterified fats
significantly elevated both the LDL/HDL ratio (Fig. 19) and
fasting blood glucose, the latter by about 20% in the
interesterified fat group relative to POL. Fasting 4-week
insulin was 10% lower after PHSO (p . 0.05) and 22% lower
after IE (p , 0.001) compared to POL, an unmodified
saturated fat. For the postprandial study, the glucose
incremental area under the curve (AUC) following the IE-
18:0 meal was 40% greater than after either of the other meals
(p , 0.001) and was linked to relatively depressed insulin and
C-peptide secretion (p , 0.05) (Fig. 20).
As in previous studies [30–32], where the test fats
represented a high percentage of the total fat, both PHSO
and IE-18:0 fats altered the metabolism of lipoproteins relative
to an unmodified saturated fat when fed under identical
circumstances, as in these humans. Criticism of these findings
[35] suggested that results were simply an effect of differences
in fat saturation between diets, not an effect of IE. However,
the design examined 3 types of fat containing roughly equal
approximations for both total SFA+TFA (12%E–18%E) and
PUFA (3.5%E–7%E). Not only was the fatty acid exchange of
interest, but the structure of TG was a consideration as well,
because both partial hydrogenation and IE modify the
molecular structure of TG.
TG structure repeatedly surfaced as the most logical
explanation for the observed results, as differences in fat
saturation between diets did not adequately account for the
findings. First, although the IE-18:0 diet provided more total
Replacing Trans Fat
JOURNAL OF THE AMERICAN COLLEGE OF NUTRITION 277S
SFA than POL or PHSO, most of this was as 18:0, which is
often deemed to be neutral or even cholesterol-lowering
[11,23,26]. If the latter is true, then 18:0 should not be counted
as an SFA, thereby eliminating the argument that LDL was
higher during interesterified fat intake because it contained
more SFA. Also, palmitic acid, described as the most
cholesterol-raising fatty acid [36], was much greater in the
POL diet, yet it produced the lowest LDL and highest HDL. It
has also been pointed out that the effects of natural fats rich in
stearic acid on the serum lipoprotein profile may differ from
the effects of 18:0 in synthetic fats [22] in an 18:0 vs 18:2 vs
18:1 comparison. Thus, application of usual fatty acid
associations with responses in the LDL/HDL ratio are suspect
at best under conditions of interesterified fat consumption.
Furthermore, the interesterified fat diet had twice the amount
of PUFA as the POL diet, which by most counts and regression
analyses would clearly favor LDL lowering by the interester-
ified diet [4,11,12,14]. Thus, if interesterified fats and TFA
appear similar in their metabolic outcomes yet differ from
POL, and if differences in dietary fatty acid saturation/
unsaturation do not apply, it seems most likely that IE with
18:0, and TG structure in general, was the issue in the cited
study, rather than fatty acid saturation.
Finally and more importantly, a focus on lipoproteins and
fat saturation misses the real message in the report, i.e.,
modifying TG structure by IE or partial hydrogenation is
seemingly able to alter glucose and insulin metabolism in a
surprisingly short period relative to a natural saturated fat.
Altered glucose metabolism may be most dramatic after TG
restructuring, as observed with the interesterified fat fed here.
Further evaluation seems warranted because interesterified fats
continue to raise questions about atypical outcomes, whether in
the interpretation of a regression analysis involving 18:0 and
the lipoprotein response [22] in 18:0 vs 18:2 vs 18:1 or the
plasma glucose/insulin outcomes reported in the Sundram et al.
study [34]. With more clinical studies it should be possible to
determine at what level interesterified fats alter metabolism,
thereby allaying concerns that will continue in the absence of
such studies.
Other Interesterified Specialty Fats: Caprenin and
SALATRIM
In another study [37], a modified specialty fat, Caprenin,
was developed based on MCT (8:0+10:0) that was randomly
interesterified with behenic acid (22:0) along the lines of
McGandy et al. [19]. This novel fat with IE-18:0 was similar in
concept to SALATRIM fats, containing TG molecules made
by interesterifying 18:0 and short-chain fatty acids (2C and 3C)
[38]. In the case of Caprenin, the assumption was that the long-
chain saturated fatty acids (22:0) would both harden the MCT
oil and not be absorbed well, thus rendering it a reduced-
calorie fat, similar to SALATRIM. The influence of this fat on
blood lipids was examined in 2 studies in which Caprenin was
compared to natural saturated fats for 6 weeks. The first
incorporated Caprenin at 11%E in one diet and compared it to
a highly saturated fat based on a palm kernel oil/palm oil
blend, presumably of comparable plasticity. Fat supplied
36%E in the first study of 17 men and 17 women, and it
incorporated a lower intake of 18:2 at 4.5%E and higher
Caprenin (11%E) than the second study. Neither the natural
palm kernel oil + palm oil blend nor Caprenin induced a
change in TC from baseline during the 6-week study period,
but Caprenin caused a significant (25%) rise in the LDL/HDL
ratio compared to the natural fat blend, which was rich in
12:0+14:0, by raising LDL and decreasing HDL (Fig. 21).
The second study had only 7 participants per group after the
greatest responders to fat were selected from the first study.
Some important fatty acid changes were also incorporated into
the design of study 2 that reduced the negative response to
Caprenin seen in study 1. Specifically, the fatty acid profile
was altered by decreasing Caprenin to only 8%E (30%
decrease) while increasing 18:2 to 8%E (60% increase). This
dual fatty acid adjustment in the diet of these hyperresponder
subjects resulted in Caprenin having no significant effect from
baseline over the 6-week study period: TC, LDL, and HDL all
declined slightly, while the LDL/HDL ratio rose slightly
because the HDL decline was proportionately greater than that
for LDL. Butterfat fed as the control fat in study 2 actually
improved lipoproteins relative to Caprenin, in the sense that
TC and LDL decreased slightly, while HDL was actually
higher, so the LDL/HDL ratio was lower, even with less 18:2
intake in the butter group (Fig. 21).
In essence, 22:0 randomly inserted into a TG with MCT,
similar to 18:0 and TFA in other studies [19,30–32,34], produced
an unfavorable result on the LDL/HDL ratio. This unfavorable
influence was improved somewhat by decreasing the Caprenin
load and increasing the protective intake of dietary 18:2.
Collectively, these studies indicate that random insertion of a
long-chain SFA (in this case 22:0) including the sn2 position can
adversely impact lipoprotein metabolism and the LDL/HDL ratio.
SALATRIM itself has been studied extensively [38]. In a 7-
day clinical trial it provided about 70% of the fat at 25 mg/
kcal/d, i.e., with IE-18:0 representing about 12%E. The acute
response was compared to entry values and a group of subjects
who consumed fully hydrogenated coconut oil (which would
have all sn-SFA) for blood lipids. Unfortunately, no natural fat
control was represented, so baseline lipids were the de facto
control. The blood lipid response was not remarkable, except
that the coconut oil raised lipids about 20% from baseline,
while SALATRIM did nothing. It was noteworthy that liver
enzymes for hepatocyte integrity were elevated significantly
by SALATRIM from control values but remained within the
clinically normal range. A longer study of 3 to 4 weeks might
have been more revealing.
Replacing Trans Fat
278S VOL. 29, NO. 3

A general thought is that using lipoproteins as an endpoint
of the metabolism of interesterified fats or TFA may be
relatively insensitive and not necessarily indicative of what has
transpired in other cell membrane functions. Lipoproteins are
easy to sample and eventually reveal an effect, but they may be
an obtuse measure. Also it seems possible that 8%E as
interesterified SFA may be required to detect a lipoprotein
response, so lesser amounts go undetected, but not necessarily
without biological effect in systems other than lipoprotein
metabolism. It is likely that we do not usually measure the best
system. How much, and which, interesterified SFA is required
to initiate a response still remains to be delineated.
Spreads with Interesterified Fat or TFA
Although spreads and margarines are logical delivery
modes in tests for interesterified fat function, by themselves
they may result in low intakes of interesterified fat relative to
the entire daily fat intake as other dietary fats dilute their
relative abundance. For example, one of the first studies using
dietary margarines containing interesterified fats examined the
use of an interesterified hard stock blended with soybean oil
(58:42 ratio) and 20% water to make the final margarine [39].
The interesterified hard stock itself was a blend of saturated
fats (36% coconut oil, 33% palm oil, 22% palm stearin, and
9% partially hydrogenated canola oil) prior to IE to form the
first hard stock. The original blend of 4 fats was also mixed
with soybean oil in a 58:42 ratio to serve as a second,
noninteresterified hard stock for comparison. The final
margarines thus contained considerable 18:2 from soybean
oil (26% wt/wt), such that the percentage of sn2 in all TG
occupied by 18:2 (35%) was equal for both margarines, and
only sn2-16:0 was doubled (to 18% of the TG molecules) in
the fat exposed to IE, while sn2-18:1 decreased by a roughly
equivalent 8%E. Those were the only appreciable differences
in the margarines. In fact, IE-18:0 was not a factor in this
study, occupying only 4% of the sn2 fatty acids in the
interesterified margarine and 2% in the control. These
margarines were fed as part of a carefully executed whole
diet program, such that the hard stock portions (as opposed to
specific interesterified fatty acids in other studies included
here) of the margarines represented either 4%E or 8%E when
fed to different sets of men and women (7 to 8 per group; 60
subjects total) in a parallel design for 3 weeks. The 2 types of
hard stock margarines were then fed in a crossover series for 3-
week periods to the respective groups. The actual dietary 18:0
provided by the hard stock never exceeded 0.5%E.
Many cardiovascular and general physiological parameters
were measured without incident or differences in any
parameter, including blood lipids (Fig. 22). Serum fatty acids
revealed no changes between groups, and TC (190–220 mg/dl),
LDL (120–140 mg/dl), and HDL (50–60 mg/dl) were the same.
In fact, not one statistically significant difference was found in
the entire study!
Two points are relevant here. First, the amount of IE hard
stock fat at 4%E and 8%E (consumed as part of the margarine)
was a relatively small subportion of the total dietary fat content
at 34%E, which included about 5%E–6%E as PUFA in the
total dietary fat profile of 16:11:5 for S:M:P. Second, although
IE served to increase the sn2-SFA content at the expense of
cis18:1, the increase occurred only in a small increment of sn2-
16:0, contributing only 1.5%E in the final diet, while sn2-18:0
contributed less than 0.5%E. Thus, the low challenge with IE-
sn2 SFA would not be expected to affect the physiology here.
Other than the infant studies with Betapol, or adults with high
intakes of sn2-16:0 as interesterified fats [20,21], other studies
using sn2-16:0 have failed to show an effect with low intake of
IE-16:0, suggesting the possibility that IE that moves 16:0 to
sn2 is not as deleterious as sn2-18:0 or longer-chain SFA, at
least in adults. More studies are needed with different intakes
of sn2-16:0 to confirm this, as the infant formula data would
indicate that it may have a negative effect at some level of
intake in adults.
Australian Margarines. A similar study with a crossover
design compared 3 experimental stick margarines composed of
special fats against a typical Australian fat blend in 27 men,
average age of 49 years, for 3-week periods (Fig. 23) [40].
However, the so-called control margarine (modified palm oils)
was atypical in itself, because it did not contain all natural fats
but rather a blend of 35% fully hydrogenated palm kernel oil,
40% palm olein, 20% sunflower oil, and 5% palm stearin.
Even though it had not been subjected to IE, more than 40% of
the fat molecules in this ‘‘control’’ saturated fat blend would
have sn2-SFA, resulting from modification by full hydroge-
nation of palm kernel oil, coupled with the tri-16:0 in the TG
solids from palm stearin. Accordingly, this fat and its related
data represent a questionable normal standard for comparison
of an IE effect, because the same fat blend following IE (IE
modPalm) had about the same degree of sn2-SFA (47%),
although the main effect of IE was to increase the sn2-16:0
threefold. The third test fat (hi18:2+TFA) included a blend that
incorporated partially hydrogenated soybean oil and partially
hydrogenated cottonseed oil to supply 3%E as TFA in the diet,
but this fat contained only half the total SFA and more than
twice the 18:2%E of the other 2 margarines. Test fats provided
about 62% of all fat consumed. Thus, the study was not a
reliable test of fatty acid exchanges or TG structure per se, but
rather represented a comparison of 2 novel hard-stick
margarines against a more conventional one having a modest
content of dietary TFA and appreciable PUFA.
Not surprisingly, the diet with modest TFA, low SFA, and
high PUFA performed the best; but because no true ‘‘reference
standard fat’’ or fatty acid profile was included, the
Replacing Trans Fat
JOURNAL OF THE AMERICAN COLLEGE OF NUTRITION 279S
comparison does not represent a TFA exchange for equivalent
SFA or c18:1. Therefore, the true effect of TFA or
interesterified SFA was not tested by the other diet designs.
The same can be said for the interesterified fat because it, too,
was compared to the atypical control saturated fat, which had
almost as much sn2-SFA as the interesterified fat but favored
16:0. And although IE of the control saturated fat (IE
modPalm) did not produce a measurable change in TC, the
shift to slightly increased LDL and slightly decreased HDL
with an increase in the LDL/HDL ratio was nonetheless
consistent with tendencies observed in other studies cited
earlier that more rigorously tested IE-18:0 ingestion (Fig. 23).
The higher HDL observed following both the ‘‘control,’’
modPalm, and IE modPalm fats than with either of the other 2
test margarines may reflect the greater content of 12:0+14:0 in
control and interesterified fats, as suggested by earlier studies
[19,20,23–25,36], all of which described a propensity for fats
containing 14:0 to raise HDL. Thus, this margarine comparison
tested neither an IE nor a TFA effect in the true sense, even
though all margarines resulted in slight improvement of the
LDL/HDL ratio relative to the native Australian diet.
Salatrim Margarine (IE-18:0) Acts Like sn1,3-16:0. A
second study from the same Australian group [41] examined
15 middle-aged men and women to compare a palm oil–based
margarine rich in 16:0, as a natural TG source, with an
interesterified margarine containing 18:0 randomly interester-
ified with short-chain fatty acids (SCFA) in the form of
SALATRIM (Fig. 24). These 2 diets were compared to a low-
fat (hi-CHO) diet containing only half the fat (20%E) of the
other 2 diets (at 40%E), where the test fats reportedly
represented more than 60% of the total fat intake. The fatty
acid profile of the 2 high-fat diets was similar, except that the
8%E as IE-18:0 in SALATRIM was substituted for the sn1,3-
16:0 in the palm oil diet. The high-CHO diet had about half
(3%E) of the 18:2 content in the high-fat diets (5%E).
Surprisingly, and contrary to most published results, all 3 diets
produced the same plasma lipid results after 5 weeks in a
crossover design. In fact, TC, LDL, and HDL were identical for
all 3 diets, leading to 3 possible conclusions: (1) total fat intake
(i.e., 20%E or 40%E) made no difference in this case; (2) IE-
18:0 was not any better than sn1,3-16:0 at lowering cholesterol
(unlike Tholstrup et al. [23] or McGandy et al. [19], where 16:0
appeared to raise TC relative to 18:0); or (3) both 16:0 and 18:0
were as cholesterol-neutral as CHO. When considered against
the cholesterol-lowering effect of shea nut oil [23], this result
might suggest that randomizing 18:0 with SCFA, including sn2-
18:0, is not as favorable and cholesterol-neutral as natural fats
rich in 18:0 with sn1,3-18:0 (shea nut oil).
Thus, one could conclude that neither IE-18:0 from
SALATRIM nor 16:0 from palm olein could be considered
cholesterol-raising relative to CHO, contrary to general
findings [14,32] and reports such as Tholstrup et al. [23]. Or,
one might conclude that IE-18:0 in SALATRIM is less
detrimental than might be expected from other reports on IE-
18:0 associated with long-chain fatty acids [30–32,35]. One
potential limitation is that the test fats herein represented a
lower percentage of the total daily fat (60%E) than several
other studies, and thus had their effect diminished by other fats
in the diet. For example, compare this to Tholstrup et al. [23]
and Sundram et al. [34], where the test fat made up .80% of
total dietary fat. The outcome can differ and interpretation can
suffer when extraneous dietary fat intake is left to chance. The
blood lipids in these subjects at entry were normal, too, making
it more difficult to elicit differences [12].
Postprandial Effect of Fatty Acid Types from aSingle Meal
Meal-Fed Tests of Fats and Postprandial Lipids. Other
studies have attempted to compare fat (fatty acid) effects,
including interesterified fats, by feeding a single meal on the
assumption that postprandial absorption and metabolism of
chylomicrons would reveal the main disturbances in fat
utilization attributable to TG-MS of specific fatty acids fed
in the meal (see Karupaiah and Sundram [8] for review).
Acute Meal Effects of IE-18:0. The possibility that
differences in dietary fat (fatty acids) might be detected in
lipid metabolism immediately following a single meal was
tested in the United Kingdom in a series of studies that
considered TG structure as well as specific dietary fatty acids
with 18C chain length. It is obviously easier to execute a
postprandial experiment of 6 to 8 hours than a long-term diet
plan, and the assumption was that the postprandial lipemic
response might provide data to predict lipoprotein modifica-
tions that occur after much longer periods. The latter
experiment requires that the test fat be incorporated into the
entire diet for several weeks, but it also provides a longer time
for lipoprotein response to adjust to any given dietary fat,
which takes into account the capacity of adipose reserves to
contribute to dietary fatty acid imbalances that might occur.
In the first study [42], the test breakfast was a milkshake
that incorporated fat along with polydextrose and sucrose as
carriers and a source of CHO energy. Six variations in the
breakfast meal fat composition were compared: CHO and
MCT (the latter with 8:0+10:0, which behaves much like CHO
rather than fat); 16:0 from palm oil; IE-18:0 from fully
hydrogenated sunflower oil IE into hi18:1-sunflower oil; trans-
18:1 from partially hydrogenated sunflower oil; and cis18:1
from regular hi-cis18:1 sunflower oil mixed with MCT. The 5
fat meals contained 90 g of fat (65%E as fat in the meal) while
the low-fat, CHO meal had 10 g of fat (7%E). The high-fat
meals used fat blends to exchange about 25%E between 16:0,
Replacing Trans Fat
280S VOL. 29, NO. 3

trans-18:1, cis18:1, IE-18:0, and MCT (8:0+10:0). The 18:2
intake was constant at 6%E for all high-fat meals but less than
1%E for CHO. Following the challenge breakfast, the
postprandial lipemia (AUC for plasma TG) was determined
over 7 hours, with a low-fat lunch provided at the 3-hour point.
Among the results for the 11 male and 5 female subjects
(average age 25 years), it was interesting that the AUC for TG
in the young female participants (presumably reflecting a
depressed rate of fat absorption) was less than half that of the
young male subjects for each of the diets. And, as one might
expect with minimal intestinal fat absorption, CHO had no
impact on raising the postprandial plasma TG level, with MCT
being only slightly more triglyceridemic than CHO (Fig. 25;
males). This difference most likely reflected the presence of
added sunflower oil in the MCT challenge meal and lack of
18:1 and 18:2 (and other long-chain fatty acids) in the CHO
meal. The IE-18:0 meal also depressed the AUC by about 50%,
as did 16:0 (25% depression), relative to the cis18:1 control
fat. The responses to cis18:1 and trans-18:1 were not
significantly different; both generated normal TG-AUC
profiles.
Thus, in this postprandial model, the IE-18:0 induced
atypical delayed fat absorption compared to an unsaturated fat
as cis18:1, or even natural sn1,3-16:0, for that matter. The
reader should bear in mind that this was an exceptional level of
fat intake (90 g/meal) and presumably pushed the limits of fat
absorption, especially for the women, where the large fat load
for body size appeared to reduce stomach emptying and
decreased the fat absorption rate by about 50% relative to the
men. The observed differences in postprandial absorption rate
of an oil interesterified with 18:0 likely reflects the gut
mucosal cell function and a compensatory adjustment in
metabolism related to the previous meal and its fat content. But
the apparent failure to absorb all the IE-18:0 in the
postprandial period exposes certain caveats and questions the
relevance of meals containing various fats to long-term
lipoprotein effects.
In a second postprandial experiment, Sanders et al.
compared another IE-18:0 fat discussed earlier (SALATRIM)
to natural cocoa butter and hi-18:1 sunflower oil [43]. Older
men and women (50 years on average) were challenged with
50 g of fat (a much smaller dose than in the previous study
[42]) in a meal of a muffin and a milkshake to assess
postprandial lipemia as before. Again the IE-18:0 (16%E, one
third as sn2-18:0) as SALATRIM with its SCFA (2:0–3:0)
produced less than half the TG-AUC at 6 hours compared to
either cis18:1 or sn1,3-18:0 (11%E) from natural cocoa butter.
The cis18:1 diet was unique because it caused the plasma HDL
to rise after 6 hours, while HDL declined after the cocoa butter
meal. The sn2-18:0 provided by SALATRIM did not alter the
postprandial plasma HDL level. Thus, because fat absorption
after delivery of the sn1,3-18:0 in cocoa butter was greater than
that following a larger mass of sn2-18:0 delivered in
SALATRIM, both TG structure and fatty acid saturation
affected the nature of the postprandial absorption and
metabolism of fats in this study. No difference was noted
between sexes in these older subjects given a much smaller fat
load, which suggests that either postmenopausal women are
more like men than young women in their fat absorption or that
the fat load was not so large as to delay absorption in these
women (Fig. 26). The point is that IE-18:0 in SALATRIM, as
in the first Sanders study [42] with IE-18:0 in a conventional
oil, depressed TG-AUC when replacing cis18:1, while natural
16:0+18:0 as sn1,3-18:0 in cocoa butter was similar to cis18:1
regarding the TG-AUC.
To further address the issue using this type of postprandial
challenge, a third Sanders study subsequently explored the
impact of interesterified fat in more detail [44]. They fed either
regular cocoa butter (as earlier) or interesterified cocoa butter
to 17 young men, again using a breakfast milkshake and a
muffin to provide 50 g of fat in a single meal. The fatty acid
profiles of the 2 meals were identical, but the natural cocoa
butter had mostly 18:1 at sn2 and 18:0 at sn1,3, while the
interesterified version randomized about half the sn2-18:1
present in the natural fat with sn2-18:0. A low-fat lunch was
again provided 3 hours into the postprandial period. Under
these circumstances in men, no effect was noted on plasma TC
or HDL up to 6 hours postprandially, but the AUC for TG
(chylomicrons + remnants pool) was again significantly
depressed by the interesterified fat (like SALATRIM earlier),
including a transient increase in TG following lunch. The HDL
response after 6 hours was identical and unaffected over time
for both fats (Fig. 27). Thus, again, one can conclude that IE
with sn2-18:0, compared to a natural fatty acid profile and a
TG-MS having sn1,3-18:0, appeared to depress fat absorption
during the 6 hours following a meal but had no effect on
postprandial lipoproteins, unlike the long-term response, where
HDL tends to be depressed. Note well that the test fats
represented the only fat consumed (somewhat akin to the
infant formula studies) and were given in one meal, mixing
their fatty acids with those in the mucosal cells, etc. These TG-
AUC data showing reduced TG absorption during sn2-18:0
studies are in agreement with the perturbed lipoprotein profiles
noted when fats containing IE-18:0 are fed for several weeks
[30–32,34].
IE of 18:0 vs 16:0 at sn1,3. A fourth study of IE from the
Sanders group was conducted in 16 young men [45] and served
to confuse the issue (Fig. 28). Two separate but related
experiments examined the effect of stearic acid location on the
TG molecule, using a different natural source of 18:0, shea nut
oil. In the first experiment, 14%E as fat was provided to
normolipemic subjects as either a shea nut oil/sunflower oil
blend (53% 18:0) in either native TG form (SOS) or after
Replacing Trans Fat
JOURNAL OF THE AMERICAN COLLEGE OF NUTRITION 281S

random IE (SSO, SOS, OSS) in a crossover design of 3 weeks
each. Thus, the exchange compared the same fatty acid profile,
either as natural shea nut oil with sn1,3-18:0, or as the
interesterified fat with significant sn2-18:0. These 2 fats were
compared to a ‘‘low-18:0’’ British diet that was presumably
rich in 16:0+18:1 (fatty acid profile not provided). Once fed
this background diet, subjects then consumed 2 muffins daily
to provide 30 g extra fat from the shea nut oil/sunflower oil
blend, causing the daily fat intake to increase from 66 g/d to
96 g/d when the muffins were added. Both before and after the
3-week feeding trials with muffins, subjects fasted overnight,
then were challenged with a breakfast meal of a muffin and a
milkshake that contained 50 g of the test fat. Blood lipids were
then followed postprandially for 8 hours.
Fasting plasma lipids, including glucose and insulin
responses, were compared at the end of the 3-week test
periods. No differences were found in the fasting blood lipid
profile or glucose/insulin parameters as a function of the 3-
week treatments. Like Nestel et al [40], who compared sn1,3-
16:0 with interesterified sn2-18:0 in margarines, the lack of
effect probably reflected test fat dilution by extraneous dietary
fat during the 3-week crossover periods and the low percentage
of test fats (30%) provided by the muffins. Once again, one is
led to believe that 16:0+18:1 (from the run-in diet) was no
more or less cholesterol-raising than 18:0 presented either as a
natural fat having 18:0 at sn1,3 or as 18:0-IE at sn2 after IE.
Such data are contrary to most studies, where 18:0 in natural
fat proved neutral and IE-18:0 exerted a negative impact on the
LDL/HDL ratio. In more revealing studies by others, the test
fats provided a greater percentage of total fat, suggesting that
the test fats herein provided either an insufficient mass or were
offered in an atypical fashion (muffin snacks outside meals?)
that precluded the fats being detected as unusual.
Surprisingly, the randomized (interesterified) oil appeared
to produce a greater postprandial lipemia than natural shea nut
oil (not significant), which is in contrast to all previous results
of Sanders et al. (the authors were also puzzled). This is the
only such report in the literature indicating this surprising
effect for IE-18:0. But this may have been biased by only
reporting the lipemias after correcting for the initial postpran-
dial lipemia prior to the 3-week feeding trial (initial unadjusted
data not presented). It is possible that the 3-week exposure to
the test fat biased the second postprandial trial at its
conclusion, which could happen if the gut mucosa absorbing
interesterified fat was still loaded with TG containing IE-18:0
that then flushed postprandially after the meal challenge,
making the IE-18:0 fat seem more lipemic.
A follow-up second experiment in that report simply fed 2
test meals (50 g fat) to fasting subjects; one meal had native
shea nut oil and the second had hi-18:1 sunflower oil. The
question was whether native shea nut oil with sn1,3-18:0
would differ from sn1,3-18:1 in sunflower oil. The more
liquid, hi-18:1 sunflower oil caused a greater postprandial
lipemia, as expected, in keeping with studies on the relative
rate of absorption for different unsaturated fats, rendering the
findings in the first experiment even more confusing.
Again, the point is that one can feed a small percentage of
daily fat as a bolus (muffins) and see no change if an ample
amount of nontest fat dilutes the test fat (or fatty acid) or if the
previous meal fat is stored in the mucosal cells and mixes with
the meal fat. On the other hand, one can feed a large
percentage of test fat that is included in every bite of the food
consumed daily to enhance the chance of observing a true
effect. Another caveat here is that only 30 g of test fat was fed
daily in the 3-week clinical test, and it was provided as 2
servings with 15 g fat each in muffins (timing of muffins not
designated), so the absorption and metabolism of test fat might
have been independent of the other fat metabolized during the
day, i.e., 2 separate mini-metabolisms possibly operative,
unlike other studies [17,31,32,34] or tests with infant formulas
[15,16], where the fat in each bite of food all day long was the
same as that in the previous bite. The latter type of design is
more conducive to discerning how a specific fatty acid behaves
in a relatively fixed pool of other dietary fatty acids. This issue
becomes very complex when comparing both fatty acids and
TG structure, because the appropriate designs are more
demanding for testing hypotheses around this more compli-
cated relationship. Higher standards of fat delivery and overall
composition are required than is possible in meal studies,
which are by nature transient events.
The authors remark that the main physical difference
between the 3 fats tested was their solid fat content (melting
point profile), with the randomized fat being the worst (highest
melting point), native fat intermediate, and sunflower oil the
lowest (at 0% at room temperature). They argue that fats with
high melting points absorbed more slowly. Thus it was
counterintuitive that the randomized shea nut oil, with the
highest solid content, should absorb more readily than native
shea nut oil, contrary to previously published data from that
lab. Thus, the entire data set around postprandial studies and
their interpretation is suspect in terms of relevant physiology to
long-term lipoprotein metabolism.
Several questions emerge concerning the relevance of these
postprandial studies, i.e., it is unclear what is being measured.
Is prolonged absorption of a fat (presumably related to fat
solids) good or bad if the apparent effect is lower postprandial
triglycerides? Since no fat was lost in feces, all the fat was
absorbing eventually, just not as fast as typical fats and
undetected during the postprandial window observed. Are the
50-g test loads of fat practical and a useful predictor of fat
metabolism, in general, or is 50 g too high for a single dose?
After all, 50 g represents the total fat calories for the entire day
in a woman on modest fat intake and even two thirds of the usual
total daily fat intake for these men. If one is trying to evaluate
Replacing Trans Fat
282S VOL. 29, NO. 3
randomized 18:0 for its typical metabolic impact, perhaps 2 or 3
levels of intake are required, both in the challenge dose of a meal
(25 g and 50 g) as well as in the daily muffin intake (2, 3, or 4
muffins per day?). Where does the lipid processing become
depressed or otherwise altered, and if extended over time, is it
detrimental to lipid metabolism in general?
An additional postprandial study [46] fed 15 young men a
breakfast meal containing 75 g fat (representing 40% of the
calories in the meal) after an overnight fast (Fig. 29). Six fats
(3 interesterified) were tested with this model, without major
effects on the postprandial lipoprotein profile. As in the
Sanders et al. studies, one end point was the rate of TG
absorption, measured as the TG peak at 4 hours after the meal
(Fig. 29). The first 2 diets was based on IE of tri-14:0+tri-16:0
into hi-18:1 sunflower oil; a second represented tri-16:0
interesterified into sunflower oil; a third provided interester-
ified fat from tri-18:0 into sunflower oil; TFA was inserted in a
fourth diet; and the final 2 diets provided an 18:2-rich or c18:1-
rich fat. Fat absorption was depressed only by the IE-18:0 diet,
and to a lesser extent by IE-16:0–rich fat. As with most other
studies, the interesterified fats with either 16:0 or 18:0 seemed
to reduce the rate of fat absorption compared to other fatty
acids, such as cis18:1 or even trans-18:1 and cis18:2, following
a meal.
CONCLUSION
IE of fat with sn2-18:0 (and to a lesser extent tristearin
blended into a fat) exerts a negative influence on lipoprotein
metabolism at high intakes and has been shown to affect glucose
and insulin metabolism, immune function, and liver enzymes in
isolated situations as well. Two tablespoons of an interesterified
margarine will not be detected as harmful, particularly if the fat
includes significant polyunsaturated oil. Any problem will arise
(as with trans fats) if IE becomes the process of choice for
hardening oils and is consumed in many foods throughout the
day (for example, if it fully replaces TFA in food processing).
By comparison, when a solid fat is required, the application of
an unmodified saturated fat, such as palm oil, palm olein, or
possibly even palm kernel oil or coconut oil, would seem
preferable to interesterified fat based on the long-term biological
implications. Because palm stearin contains a significant
amount of tri-palmitin, with sn2-16:0, that fraction should be
utilized sparingly until its impact can be further clarified.
REFERENCES
1. Oh K, Hu FB, Manson JE, Stampfer MJ, Willett WC: Dietary fat
intake and risk of coronary heart disease in women: 20 years of
follow-up of the nurses’ health study. Am J Epidemiol 161:672–
679, 2005.
2. Mozaffarian D, Micha R, Wallace S: Effects on coronary heart
disease of increasing polyunsaturated fat in place of saturated fat: a
systematic review and meta-analysis of randomized controlled
trials. PLoS Med 7:e1000252, 2010.
3. Khosla P, Sundram K: Effects of dietary fatty acid consumption on
plasma cholesterol. Prog Lipid Res 35:93–132, 1996.
4. Siri-Tarino PW, Sun Q, Hu FB, Krauss RM: Meta-analysis of
prospective cohort studies evaluating the association of saturated
fat with cardiovascular disease. Am J Clin Nutr 91:535–546, 2010.
5. Mozaffarian D, Katan MB, Ascherio A, Stampfer MJ, Willett WC:
Trans fatty acids and cardiovascular disease. N Engl J Med
354:1601–1613, 2006.
6. Remig V, Franklin B, Margolis S, Kostas G, Nece T, Street JC:
Trans fats in America: a review of their use, consumption, health
implications, and regulation. J Am Diet Assoc 110:585–592, 2010.
7. Hayes KC: Synthetic and modified glycerides: effects on plasma
lipids. Curr Opin Lipidol 12:55–60, 2001.
8. Karupaiah T, Sundram K: Effects of stereospecific positioning of
fatty acids in triacylglycerol structures in native and randomized
fats: a review of their nutritional implications. Nutr Metab (Lond)
4:16, 2007.
9. Mu H, Porsgaard T: The metabolism of structured triacylglycerols.
Prog Lipid Res 44:430–448, 2005.
10. Hunter JE: Studies on effects of dietary fatty acids as related to
their position on triglycerides. Lipids 36:655–668, 2001.
11. Hayes KC, Khosla P: Dietary fatty acid thresholds and
cholesterolemia. FASEB J 6:2600–2607, 1992.
12. Hayes KC: Saturated fats and blood lipids: new slant on an old
story. Can J Cardiol 11 Suppl G:39G–46G, 1995.
13. Mensink RP: Effects of the individual saturated fatty acids on
serum lipids and lipoprotein concentrations. Am J Clin Nutr
57:711S–714S, 1993.
14. Hayes KC: Dietary fatty acids, cholesterol, and the lipoprotein
profile. Br J Nutr 84:397–399, 2000.
15. Innis SM, Quinlan P, Diersen-Schade D: Saturated fatty acid chain
length and positional distribution in infant formula: effects on
growth and plasma lipids and ketones in piglets. Am J Clin Nutr
57:382–390, 1993.
16. Nelson CM, Innis SM: Plasma lipoprotein fatty acids are altered
by the positional distribution of fatty acids in infant formula
triacylglycerols and human milk. Am J Clin Nutr 70:62–69, 1999.
17. Zock PL, de Vries JH, de Fouw NJ, Katan MB: Positional
distribution of fatty acids in dietary triglycerides: effects on fasting
blood lipoprotein concentrations in humans. Am J Clin Nutr
61:48–55, 1995.
18. Tholstrup T, Marckmann P, Jespersen J, Vessby B, Jart A,
Sandstrom B: Effect on blood lipids, coagulation, and fibrinolysis
of a fat high in myristic acid and a fat high in palmitic acid. Am J
Clin Nutr 60:919–925, 1994.
19. McGandy R, Hegsted D, Myers M: Use of semisynthetic fats in
determining effects of specific dietary fatty acids on serum lipids
in man. Am J Clin Nutr 23:1288–1298, 1970.
20. Zock PL, de Vries JH, Katan MB: Impact of myristic acid versus
palmitic acid on serum lipid and lipoprotein levels in healthy
women and men. Arterioscler Thromb 14:567–575, 1994.
21. Snook JT, Park S, Williams G, Tsai YH, Lee N: Effect of synthetic
triglycerides of myristic, palmitic, and stearic acid on serum
lipoprotein metabolism. Eur J Clin Nutr 53:597–605, 1999.
Replacing Trans Fat
JOURNAL OF THE AMERICAN COLLEGE OF NUTRITION 283S
22. Thijssen MA, Mensink RP: Small differences in the effects of
stearic acid, oleic acid, and linoleic acid on the serum lipoprotein
profile of humans. Am J Clin Nutr 82:510–516, 2005.
23. Tholstrup T, Marckmann P, Jespersen J, Sandstrom B: Fat high in
stearic acid favorably affects blood lipids and factor VII coagulant
activity in comparison with fats high in palmitic acid or high in
myristic and lauric acids. Am J Clin Nutr 59:371–377, 1994.
24. Ng TK, Hassan K, Lim JB, Lye MS, Ishak R: Nonhypercholester-
olemic effects of a palm-oil diet in Malaysian volunteers. Am J
Clin Nutr 53:1015S–1020S, 1991.
25. Sundram K, Hayes KC, Siru OH: Dietary palmitic acid results in
lower serum cholesterol than does a lauric-myristic acid
combination in normolipemic humans. Am J Clin Nutr 59:841–
846, 1994.
26. Hunter JE, Zhang J, Kris-Etherton PM: Cardiovascular disease risk
of dietary stearic acid compared with trans, other saturated, and
unsaturated fatty acids: a systematic review. Am J Clin Nutr
91:46–63, 2009.
27. Dougherty RM, Allman MA, Iacono JM: Effects of diets
containing high or low amounts of stearic acid on plasma
lipoprotein fractions and fecal fatty acid excretion of men. Am J
Clin Nutr 61:1120–1128, 1995.
28. Lewington S, Whitlock G, Clarke R, Sherliker P, Emberson J,
Halsey J, Qizilbash N, Peto R, Collins R: Blood cholesterol and
vascular mortality by age, sex, and blood pressure: a meta-analysis
of individual data from 61 prospective studies with 55,000
vascular deaths. Lancet 370:1829–1839, 2007.
29. Mensink RP, Katan MB: Effect of dietary trans fatty acids on high-
density and low-density lipoprotein cholesterol levels in healthy
subjects. N Engl J Med 323:439–445, 1990.
30. Zock PL, Katan MB: Hydrogenation alternatives: effects of trans
fatty acids and stearic acid versus linoleic acid on serum lipids and
lipoproteins in humans. J Lipid Res 33:399–410, 1992.
31. Aro A, Jauhiainen M, Partanen R, Salminen I, Mutanen M: Stearic
acid, trans fatty acids, and dairy fat: effects on serum and
lipoprotein lipids, apolipoproteins, lipoprotein(a), and lipid
transfer proteins in healthy subjects. Am J Clin Nutr 65:1419–
1426, 1997.
32. Judd JT, Baer DJ, Clevidence BA, Kris-Etherton P, Muesing RA,
Iwane M: Dietary cis and trans monounsaturated and saturated FA
and plasma lipids and lipoproteins in men. Lipids 37:123–131, 2002.
33. Baer DJ, Judd JT, Clevidence BA, Tracy RP: Dietary fatty acids
affect plasma markers of inflammation in healthy men fed
controlled diets: a randomized crossover study. Am J Clin Nutr
79:969–973, 2004.
34. Sundram K, Karupaiah T, Hayes KC: Stearic acid-rich interester-
ified fat and trans-rich fat raise the LDL/HDL ratio and plasma
glucose relative to palm olein in humans. Nutr Metab (Lond) 4:3,
2007.
35. Sundram K, Karupaiah T, Hayes KC: Reply to Destaillats,
interesterified fats to replace trans fat. Nutr Metab (Lond) 4:13,
2007.
36. Mensink RP, Zock PL, Kester AD, Katan MB: Effects of dietary
fatty acids and carbohydrates on the ratio of serum total to HDL
cholesterol and on serum lipids and apolipoproteins: a meta-analysis
of 60 controlled trials. Am J Clin Nutr 77:1146–1155, 2003.
37. Wardlaw GM, Snook JT, Park S, Patel PK, Pendley FC, Lee MS,
Jandacek RJ: Relative effects on serum lipids and apolipoproteins
of a caprenin-rich diet compared with diets rich in palm oil/palm-
kernel oil or butter. Am J Clin Nutr 61:535–542, 1995.
38. Finley J, Leveille G, Dixon R, Walchak C, Sourby J, Smith R,
Francis K, Otterburn M: Clinical assessment of SALATRIM, a
reduced-calorie triacylglycerol. J Agric Food Chem 42:581–596,
1994.
39. Meijer GW, Weststrate JA: Interesterification of fats in margarine:
effect on blood lipids, blood enzymes, and hemostasis parameters.
Eur J Clin Nutr 51:527–534, 1997.
40. Nestel PJ, Noakes M, Belling GB, McArthur R, Clifton PM: Effect
on plasma lipids of interesterifying a mix of edible oils. Am J Clin
Nutr 62:950–955, 1995.
41. Nestel PJ, Pomeroy S, Kay S, Sasahara T, Yamashita T: Effect of a
stearic acid-rich, structured triacylglycerol on plasma lipid
concentrations. Am J Clin Nutr 68:1196–1201, 1998.
42. Sanders TA, de Grassi T, Miller GJ, Morrissey JH: Influence of
fatty acid chain length and cis/trans isomerization on postprandial
lipemia and factor VII in healthy subjects (postprandial lipids and
factor VII). Atherosclerosis 149:413–420, 2000.
43. Sanders TA, Oakley FR, Cooper JA, Miller GJ: Influence of a
stearic acid-rich structured triacylglycerol on postprandial lipemia,
factor VII concentrations, and fibrinolytic activity in healthy
subjects. Am J Clin Nutr 73:715–721, 2001.
44. Sanders TA, Berry SE, Miller GJ: Influence of triacylglycerol
structure on the postprandial response of factor VII to stearic acid-
rich fats. Am J Clin Nutr 77:777–782, 2003.
45. Berry SE, Miller GJ, Sanders TA: The solid fat content of stearic
acid-rich fats determines their postprandial effects. Am J Clin Nutr
85:1486–1494, 2007.
46. Tholstrup T, Sandstrom B, Bysted A, Holmer G: Effect of 6
dietary fatty acids on the postprandial lipid profile, plasma fatty
acids, lipoprotein lipase, and cholesterol ester transfer activities in
healthy young men. Am J Clin Nutr 73:198–208, 2001.
Received May 4, 2010.
Replacing Trans Fat
284S VOL. 29, NO. 3


![CartemotoneigeSagLac2014-15 [Unlocked by ] sentier lac st-jean.pdf · 6.6 trans-quÉbec 83 trans-quÉbec 93 trans-quÉbec 93 trans-quÉbec 93 trans-quÉbec 93 trans-quÉbec 93 trans-quÉbec](https://img.pdfslide.us/doc/110x75/5b2cb5eb7f8b9ac06e8b5a01/cartemotoneigesaglac2014-15-unlocked-by-sentier-lac-st-jeanpdf-66-trans-quebec.jpg)