Embed Size (px)
Citation preview

REPAIR OF IMPACT-DAMAGED PRESTRESSED BRIDGE GIRDERS USING
STRAND SPLICES AND FIBER-REINFORCED POLYMER
Justin A. Liesen
Thesis submitted to the faculty of the Virginia Polytechnic Institute and State
University in partial fulfillment of the requirements for the degree of
MASTER OF SCIENCE
In
CIVIL ENGINEERING
Thomas E. Cousins, Chair
Carin L. Roberts-Wollmann
Ioannis Koutromanos
May 11, 2015
Blacksburg, Virginia
Keywords: Prestressed concrete repair, flexural tests, FRP, Strand Splices

REPAIR OF IMPACT-DAMAGED PRESTRESSED BRIDGE GIRDERS USING
STRAND SPLICES AND FIBER-REINFORCED POLYMER
Justin A. Liesen
ABSTRACT
This study is part of a VDOT sponsored project focusing on repair techniques for impact
damaged prestressed bridge girders. The investigation included evaluation of the repair
installation and flexural strength of four AASHTO Type III girders that were intentionally
damaged and repaired. In addition, nonlinear finite element modeling was used to aid in the
development of design protocols for each repair method. This report discusses two of the three
repair techniques. Three Master of Science students report on the project results: Justin Liesen,
Mark Jones, and Michael Gangi. Liesen and Jones (2015) had responsibility for the installation
and testing of the repaired girders and Gangi (2015) performed the finite element modeling of
the girders.
Three repair methods were identified for experimental investigation: strand splice,
bonded FRP, and FRCM. During this investigation the repair methods were evaluated by
conducting six flexural tests on four AASHTO Type III girders. Flexural tests were conducted
instead of shear tests because typical impact damage from overheight vehicles occurs around the
mid-span and flexural strength dominated region of bridge girders. The cracking and failure
moments for each test were evaluated and compared to predictions of the girder’s behavior using
AASHTO calculations, a moment-curvature diagram, and non-linear finite element modeling.
All photographs by author unless otherwise noted, 2015.

iii
Table of Contents
ABSTRACT....................................................................................................................................ii
Table of Contents............................................................................................................ ................iii
List of Figures.................................................................................................................................vi
List of Tables................................................................................................................................xiii
Abbreviations................................................................................................................................xvi
CHAPTER I: Introduction...................................................................................................... .........1
1.1: Background...............................................................................................................................1
1.2: Purpose and Scope...................................................................................................... .............4
1.3: Thesis Organization..................................................................................................... .............5
CHAPTER II: Review of Literature................................................................................................6
2.1: Use of Prestressed Concrete for Bridges..................................................................................6
2.2: Damage Classification..............................................................................................................7
2.3: Repair Techniques................................................................................................................. .10
2.3.1: Strand Splice........................................................................................................................13
2.3.2: Fiber Reinforced Polymer (FRP) ........................................................................................18
2.3.3: Additional Techniques.........................................................................................................24
2.4: Summary.................................................................................................................................25
CHAPTER III: Experimental Testing Methods.............................................................................27
3.1: Materials Testing....................................................................................................... .............34
3.2: Instrumentation Types............................................................................................................41
3.3: Test Procedures.......................................................................................................................42
3.3.1: Test 1 – Control Test...........................................................................................................42

iv
3.3.2: Test 2 – Girder with Eight Severed/Re-tensioned Strands..................................................49
3.3.3: Test 3 – FRP Repaired Girder with Four Severed Strands..................................................58
3.3.4: Test 4 – Girder with Four Severed/Re-tensioned Strands...................................................72
CHAPTER IV: Results and Discussion.........................................................................................82
4.1: Introduction............................................................................................................ .................82
4.2: Material Properties..................................................................................................................82
4.2.1: Girder Concrete....................................................................................................................82
4.2.2: Tstrata IRC Repair Concrete................................................................................................83
4.2.3: Girder Reinforcement..........................................................................................................84
4.2.4: Prestressing Strand...............................................................................................................85
4.2.5: V-Wrap C400 FRP Repair System Materials......................................................................87
4.2.6: Grabb-It Splice Chuck.........................................................................................................88
4.3: Analytical Modeling...............................................................................................................91
4.3.1: Calculations Based on AASHTO Guidelines......................................................................91
4.3.2: Moment-Curvature Based on Strain Compatibility.............................................................93
4.3.3: Non-Linear Finite Element..................................................................................................97
4.4: Laboratory Tests.....................................................................................................................98
4.4.1: Test Results Overview.........................................................................................................98
4.4.2: Test 1 – Control Test.........................................................................................................100
4.4.3: Test 2 – Girder with Eight Severed/Re-tensioned Strands................................................104
4.4.4: Test 3 – FRP Repaired Girder with Four Severed Strands................................................108
4.4.5: Test 4 – Girder with Four Severed/Re-tensioned Strands.................................................112
4.6: Data Analysis........................................................................................................................118

v
4.6.1: Strand Splice Repair..........................................................................................................120
4.6.2: FRP Repair.........................................................................................................................122
4.6.3: Analysis Methods..............................................................................................................124
CHAPTER V: Conclusions and Recommendations....................................................................128
5.1: Conclusions...........................................................................................................................128
5.2: Recommendations.................................................................................................................130
References....................................................................................................................................132
APPENDIX A: Arcadia Bridge Blueprints..................................................................................137
APPENDIX B: AASHTO Calculations.......................................................................................148
APPENDIX C: Strain-Compatibility Moment-Curvature Calculations......................................154
APPENDIX D: FRP Repair Calculations....................................................................................166
APPENDIX E: Applied Moment Calculations............................................................................183
APPENDIX F: Shear Calculations..............................................................................................184
APPENDIX G: Curvature-Ductility Calculations.......................................................................186
APPENDIX H: Specimen Preparation for Strand Splice and FRP Repairs................................187
APPENDIX I: Installation of Strand Splices...............................................................................189
APPENDIX J: Fiber Reinforced Polymer Repair Procedures.....................................................190
vi
List of Figures
Figure 1. Overheight Impacts as Reported by State Adapted From Agrawal, A. K., Xu, X., &
Chen, Z. (2013, January 15). Strikes on Low Clearance Bridges by Over-Height Trucks in New
York State. Retrieved December 05, 2014, from United States Department of Transportation:
http://www.rita.dot.gov/utc/publications/spotlight/2013_01/html/spotlight_0113.html, Used
under fair use, 2015..........................................................................................................................2
Figure 2. Typical AASHTO Type III Girder Cross Section Tested................................................4
Figure 3. Percent of Bridges Built Annually Aktan, A. E., Culmo, M. P., Frangopol, D. M.,
French, C. W., Rabbat, B. G., Sanders, D. H., . . . Woods, S. W. (1994). Concrete Bridges.
Washington D.C.: Transportation Research Board: Committee on Concrete Bridges. Retrieved
December 8, 2014, Used under fair use, 2015.................................................................................7
Figure 4. Splice Chuck Installation................................................................................................16
Figure 5. Four Splice Chucks.........................................................................................................17
Figure 6. Eight Splice Chucks................................................................................................ .......17
Figure 7. Carbon Fiber Stress Strain Curve Wipf, T. J., Klaiber, F. W., Rhodes, J. D., &
Kempers, B. J. (2004b). Effective Structural Concrete Repair: Repair of Impact Damaged
Prestressed Concrete Beams with Carbon Fiber Reinforced Polymer (CFRP). Iowa State
University, Department of Civil, Construction, and Environmental Engineering. Ames: Iowa
Department of Transportation. Retrieved December 12, 2014, Used under fair use, 2015...........19
Figure 8. Fiber Reinforced Polymer Saturation Process................................................................23
Figure 9. Fiber Reinforced Polymer Installation Process..............................................................23
Figure 10. Fiber Reinforced Polymer Installed Over Damaged Section.......................................24
Figure 11. Girder Cross Section from Bridge Plans......................................................................28
vii
Figure 12. Typical AASHTO Type III Girder Cross Section Tested............................................29
Figure 13. Shear Reinforcement Spacing for No 5 Reinforcing Bars...........................................30
Figure 14. Test 1 Set-up.................................................................................................................31
Figure 15. Test 2 Set-up.................................................................................................................32
Figure 16. Test 3, Iteration 1 Set-up..............................................................................................32
Figure 17. Test 3, Iteration 2 Set-up..............................................................................................32
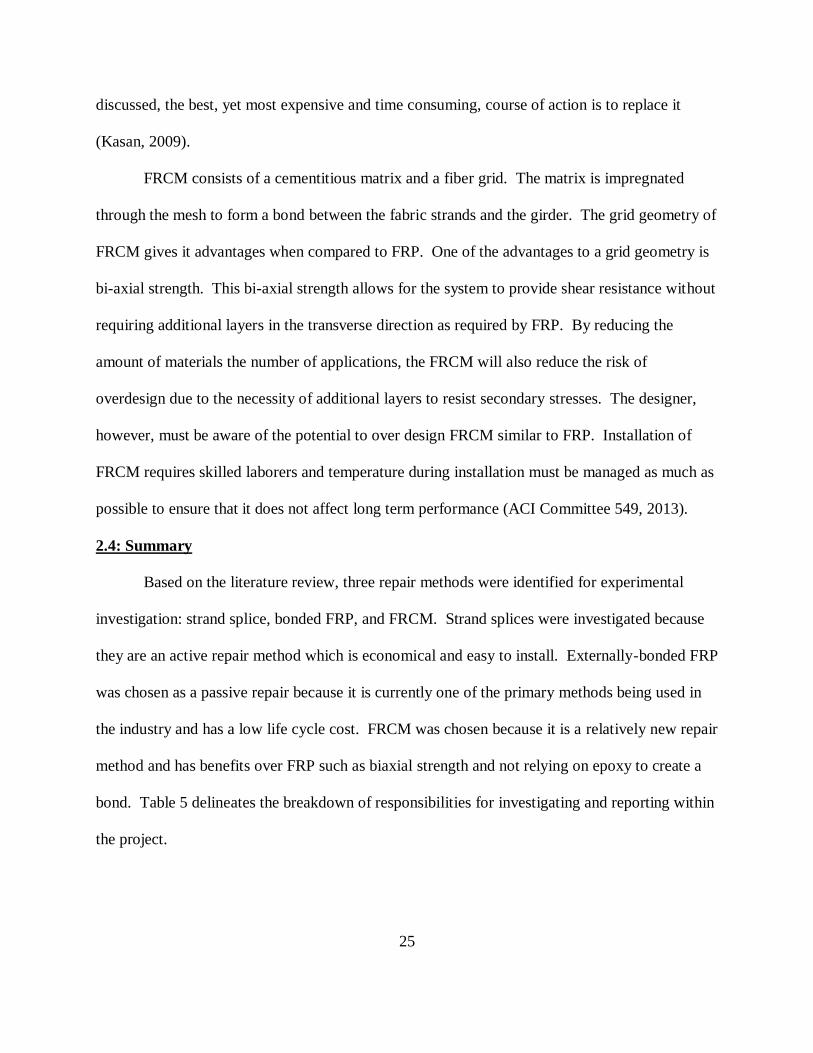
Figure 18. Test 4, Iteration 1 Set-up..............................................................................................33
Figure 19. Test 4, Iteration 2 Set-up..............................................................................................33
Figure 20. Test 5 Set-up.................................................................................................................33
Figure 21. Test 6 Set-up.................................................................................................................34
Figure 22. Concrete Core Removal (Photo used with permission of Mark Jones, 2015)..............36
Figure 23. Prestress Strand Tensile Test........................................................................................38
Figure 24. Extensometer Attached to Strand (Photo taken by Mark Jones, used under fair use
2015)..............................................................................................................................................39
Figure 25. Cutting of Strands (Photo taken by Mark Jones, used under fair use 2015)................40
Figure 26. Extensometer Location on Strand (Photo taken by Mark Jones, used under fair use
2015)..............................................................................................................................................40
Figure 27. Nominal Moment Capacity versus Calculated Failure Moment for Test 1..................44
Figure 28. Nominal Shear Capacity versus Calculated Shear for Test 1.......................................44
Figure 29. Pin Bearing (Photo taken by Mark Jones, used under fair use 2015)...........................45
Figure 30. Roller Bearing (Photo taken by Mark Jones, used under fair use 2015)......................46
Figure 31. Frame to Prevent Tipping.............................................................................................46

viii
Figure 32. Control Test Loading System (Photo taken by Mark Jones, used under fair use
2015)..............................................................................................................................................47
Figure 33. Test 1 Set-up and Instrumentation Plan........................................................................48
Figure 34. Wire Pots below Load Point to Measure Deflection (Photo taken by Mark Jones, used
under fair use 2015).......................................................................................................................48
Figure 35. Girder B Damage Location..........................................................................................50
Figure 36. Girder B Cross Section through Damaged Area with Severed Strand Locations
Shown............................................................................................................................................50
Figure 37. Nominal Moment Capacity versus Calculated Failure Moment for Test 2..................52
Figure 38. Nominal Shear Capacity versus Applied Shear for Test 2...........................................52
Figure 39. Roller Bearing (Photo taken by Mark Jones, used under fair use 2015)......................53
Figure 40. Pin Bearing (Photo taken by Mark Jones, used under fair use 2015)...........................54
Figure 41. Test 2 Loading System (Photo taken by Mark Jones, used under fair use 2015).........54
Figure 42. Test 2 Set-up.................................................................................................................55
Figure 43. Test 2 Set-up and Instrumentation Plan........................................................................56
Figure 44. Wire Pot 1 at 14.5 Ft from Roller (Photo taken by Mark Jones, used under fair use
2015)..............................................................................................................................................56
Figure 45. Strain Profile Instrumentation Set-up (Photo taken by Mark Jones, used under fair use
2015)..............................................................................................................................................57
Figure 46. LVDT at Repair Interface.............................................................................................57
Figure 47. Girder C Damage Locations.........................................................................................59
Figure 48. Girder C Cross Section through Damaged Area with Severed Strand Locations
Shown............................................................................................................................. ...............59

ix
Figure 49. Nominal Moment Capacity versus Calculated Failure Moment for Test 3, Iteration 1
........................................................................................................................................................61
Figure 50. Nominal Shear Capacity versus Calculated Shear for Test 3, Iteration 1....................61
Figure 51. Nominal Moment Capacity versus Calculated Failure Moment for Test 3, Iteration 2
........................................................................................................................................................62
Figure 52. Nominal Shear Capacity versus Calculated Shear for Test 3, Iteration 2....................62
Figure 53. Test 3 Set-up.................................................................................................................64
Figure 54. Test 3, Iteration 1 Pin Location (Photo taken by Mark Jones, used under fair use
2015)..............................................................................................................................................64
Figure 55. Test 3, Iteration 2 Pin Location (Photo taken by Mark Jones, used under fair use
2015)..............................................................................................................................................65
Figure 56. Test 3 Roller Location (Photo taken by Mark Jones, used under fair use 2015).........65
Figure 57. Test 3 Load Point..........................................................................................................66
Figure 58. Test 3, Iteration 1 Test and Instrumentation Set-up.....................................................67
Figure 59. Test 3, Iteration 2 Test and Instrumentation Set-up.....................................................67
Figure 60. Strain Transducers on Damaged/Repaired Side of Girder (Photo taken by Ioannis
Koutromanos, used under fair use 2015).......................................................................................68
Figure 61. Strain Transducers on Undamaged Side of Girder.......................................................68
Figure 62. LVDT at FRP and Concrete Interface..........................................................................69
Figure 63. Shear Cracking in Midspan Region during Iteration 1 (Photo taken by Ioannis
Koutromanos, used under fair use 2015).......................................................................................70
Figure 64. Cracking Near Peak Load for Iteration 1 (Photo taken by Ioannis Koutromanos, used
under fair use 2015).......................................................................................................................71
x
Figure 65. Brace for Actuator (Photo taken by Mark Jones, used under fair use 2015)................72
Figure 66. Nominal Moment Capacity versus Calculated Failure Moment for Test 4, Iteration 1
........................................................................................................................................................74
Figure 67. Nominal Shear Capacity versus Calculated Shear for Test 4, Iteration 1....................74
Figure 68. Nominal Moment Capacity versus Calculated Failure Moment for Test 4, Iteration 2
........................................................................................................................................................75
Figure 69. Nominal Shear Capacity versus Calculated Shear for Test 4, Iteration 2....................75
Figure 70. Test 4, Iteration 1 Roller Location (Photo taken by Mark Jones, used under fair use
2015)..............................................................................................................................................77
Figure 71. Test 4, Iteration 2 Roller Location (Photo taken by Mark Jones, used under fair use
2015)..............................................................................................................................................77
Figure 72. Test 4 Pin Location (Photo taken by Mark Jones, used under fair use 2015)..............78
Figure 73. Test 4, Iteration 1 Set-up and Instrumentation Plan.....................................................79
Figure 74. Test 4, Iteration 2 Set-up and Instrumentation Plan.....................................................79
Figure 75. Damage on Girder near Strain Transducer Location (Photo taken by Ioannis
Koutromanos, used under fair use 2015).......................................................................................80
Figure 76. Strain Transducer Set-up Below Load Point................................................................80
Figure 77. Girder Concrete Tensile Test........................................................................................83
Figure 78. Reinforcing Bar Stress Strain Relationship..................................................................85
Figure 79. Prestress Tensile Test Strand Rupture (Photo taken by Mark Jones, used under fair use
2015)..............................................................................................................................................86
Figure 80. Strand Splice Torque-Tension Relationship.................................................................90
xi
Figure 81. Prestress Steel Stress - Strain Relationship Gangi, M. (2015). Nonlinear Beam
Modeling of the Repair of Impact-Damaged Prestressed Bridge Girders. Virginia Polytechnic
and State University, Department of Civil and Environmental Engineering. Blacksburg: Virginia
Center for Transportation Innovation and Research, Used under fair use, 2015...........................95
Figure 82. Calculated Moment-Curvature Behavior.....................................................................96
Figure 83. Test 1 Moment Deflection Behavior..........................................................................102
Figure 84. Test 1 Moment-Curvature Relationship.....................................................................104
Figure 85. Test 2 Moment Deflection Behavior..........................................................................105
Figure 86. Flexural Cracks in Patch Concrete near Failed Strand Splice (Photo taken by Ioannis
Koutromanos, used under fair use 2015).....................................................................................106
Figure 87. Test 2 Moment-Curvature Relationship.....................................................................108
Figure 88. Test 2 Failed Splice and Ruptured Strand (Photo taken by Mark Jones, used under fair
use 2015)......................................................................................................................................107
Figure 89. Test 3 Moment Deflection Behavior..........................................................................109
Figure 90. Test 3 Moment-Curvature Relationship.....................................................................111
Figure 91. Crack Propagation from FRP into Web (Photo taken by Ioannis Koutromanos, used
under fair use 2015).....................................................................................................................112
Figure 92. Test 4, Iteration 1 Moment Deflection Behavior........................................................113
Figure 93. Test 4, Iteration 2 Moment Deflection Behavior........................................................114
Figure 94. Test 4 Moment-Curvature Relationship.....................................................................115
Figure 95. Cracking Pattern at Load Point at Final Load for Iteration 1 (Photo taken by Ioannis
Koutromanos, used under fair use 2015).....................................................................................116

xii
Figure 96. Cracking Patterns near Maximum Applied Load (Photo taken by Ioannis
Koutromanos, used under fair use 2015).....................................................................................117
Figure 97. Flexural Compression Failure in the Deck (Photo taken by Ioannis Koutromanos, used
under fair use 2015).....................................................................................................................118
Figure 98. Strand Splice Strength Regenerated Trend Lines.......................................................122
Figure 99. Nominal to Tested Ratio.............................................................................................126
Figure 100. Arcadia Bridge Blueprint Page 1..............................................................................137
Figure 101. Arcadia Bridge Blueprint Page 2..............................................................................138
Figure 102. Arcadia Bridge Blueprint Page 3..............................................................................139
Figure 103. Arcadia Bridge Blueprint Page 4..............................................................................140
Figure 104. Arcadia Bridge Blueprint Page 5..............................................................................141
Figure 105. Arcadia Bridge Blueprint Page 6..............................................................................142
Figure 106. Arcadia Bridge Blueprint Page 7..............................................................................143
Figure 107. Arcadia Bridge Blueprint Page 8..............................................................................144
Figure 108. Arcadia Bridge Blueprint Page 9..............................................................................145
Figure 109. Arcadia Bridge Blueprint Page 10............................................................................146
Figure 110. Arcadia Bridge Blueprint Page 11............................................................................147

xiii
List of Tables
Table 1. Damage Classifications Harries, K. A., Kasan, J., Miller, R., & Brinkman, R. (2012).
Updated Research for Collision Damage and Repair of Prestressed Concrete Beams. NCHRP
Project 20-07, Task 307, University of Pittsburgh, Department of Civil Engineering, Pittsburgh.
Retrieved December 10, 2014, Used under fair use, 2015..............................................................9
Table 2. Summary of Repair Techniques Harries, K. A., Kasan, J., & Aktas, C. (2009). Repair
Methods for Prestressed Girder Bridges. University of Pittsburgh, Department of Civil and
Environmental Engineering. Harrisburg: Commonwelth of Pennsylvania Department of
Transportation, Used under fair use 2015......................................................................................13
Table 3. Suggested Installation Torque Prestress Supply Incorporated. (2010). Grabb-It Cable
Splice. Retrieved December 12, 2014, from Prestress Supply:
http://www.prestresssupply.com/Products/StrandRepair/GRABBITCableSplice.aspx, Used under
fair use 2015................................................................................................................ ...................14
Table 4. Recommended FRP Repair Based on Maximum Number of Damaged Strands Harries,
K. A., Kasan, J., Miller, R., & Brinkman, R. (2012). Updated Research for Collision Damage
and Repair of Prestressed Concrete Beams. NCHRP Project 20-07, Task 307, University of
Pittsburgh, Department of Civil Engineering, Pittsburgh. Retrieved December 10, 2014, Used
under fair use 2015.........................................................................................................................20
Table 5. Project Scope Responsibilities and Summary.................................................................26
Table 6. Testing Schedule and Summary......................................................................................31
Table 7. Girder and Deck Concrete Compressive Strength...........................................................82
Table 8. Girder Concrete Tensile Strength....................................................................................83
Table 9. Repair Concrete Compressive Strength...........................................................................84

xiv
Table 10. Reinforcing Bar Failure Tensile Strength......................................................................84
Table 11. Prestress Strand Strength...................................................................................... .........86
Table 12. Effective Prestress Force.............................................................................................. .87
Table 13. FRP Tensile Test Results...............................................................................................88
Table 14. Strand Splice Chuck Torque Test Results.....................................................................89
Table 15. Spliced Strand Tension Test..........................................................................................90
Table 16. AASHTO Mn Calculation Summary.............................................................................93
Table 17. Moment-Curvature Calculation Summary.....................................................................96
Table 18. Finite Element Analysis Results....................................................................................99
Table 19. Girder Self-Weight Moments........................................................................................99
Table 20. Nominal and Failure Moment Summary.....................................................................100
Table 21. Cracking Moment Test Results Summary...................................................................100
Table 22. Experimental and Calculated Cracking and Nominal Moment Capacities for Test 1
......................................................................................................................................................103
Table 23. Experimental and Calculated Cracking and Nominal Moment Capacities for Test 2
......................................................................................................................................................105
Table 24. Experimental and Calculated Cracking and Nominal Moment Capacities for Test 3
…………………………………………………………………………………………………..110
Table 25. Experimental and Calculated Cracking and Nominal Moment Capacities for Test 4
…………………………………………………………………………………………………..114
Table 26. Nominal versus Tested Strength Regained..................................................................119
Table 27. Cracking versus Tested Strength Regained.................................................................119
Table 28. Curvature-Ductility Comparison.................................................................................120

xv
Table 29. Ratio of Predicted to Measured Moment Capacity......................................................125
Table 30. AASHTO Design Nominal Moment Calculations With and Without Deck...............127
Table 31. Material Test Averages................................................................................................128
Table 32. Test 1 AASHTO Calculations.....................................................................................150
Table 33. Test 2 AASHTO Calculations.....................................................................................151
Table 34. Test 3 AASHTO Calculations.....................................................................................152
Table 35. Test 4 AASHTO Calculations.....................................................................................153
Table 36. Test 1 Moment-Curvature Calculations.......................................................................154
Table 37. Test 2 Moment-Curvature Calculations.......................................................................157
Table 38. Test 3 Moment-Curvature Calculations.......................................................................160
Table 39. Test 4 Moment-Curvature Calculations.......................................................................163

xvi
Abbreviations
CFRP – Carbon Fiber Reinforced Polymer
FRCM – Fabric Reinforced Cementitious Matrix
FRP – Fiber Reinforced Polymer
NCHRP – National Cooperative Highway Research Program
ksi – Kips per Square Inch
in – inch
ft – foot
lb – pound
k-ft – kip-feet
NSM CFRP – Near Surface Mounted Carbon Fiber Reinforced Polymer
PT-CFRP – Post-Tensioned Carbon Fiber Reinforced Polymer
EB-CFRP – Externally Bonded Carbon Fiber Reinforced Polymer
bPT-CFRP – Bonded Post-Tensioned Carbon Fiber Reinforced Polymer
uPT-CFRP – Unbonded Post-Tensioned Carbon Fiber Reinforced Polymer
LVDT – Linear Variable Differential Transformers
MLVDT – Mini Linear Variable Differential Transformers
BDI – Bridge Diagnostics Incorporated
VDOT – Virginia Department of Transportation
ASTM – American Society for Testing and Materials
Tstrata IRC – Tstrata Infuseable Rapid Cure Restoration Material

1
CHAPTER I: Introduction
1.1: Background
Prestressed concrete bridge girders are a common type of structure for short to medium
span highway bridges (Taly, 2015). According to a report published by Transportation for
America, 11% of bridges in the United States are classified as deficient; for example, they
require “significant maintenance, rehabilitation, or replacement” (Davis & Goldberg, 2013).
Each year in the United States, an average of 25 to 35 bridges are damaged by overheight vehicle
collisions in each state (ElSaftey, Graeff, & Fallaha, 2014). In a poll conducted by Agrawal and
Chen (2013), the state of Virginia reported 41 bridges damaged from overheight vehicle impacts
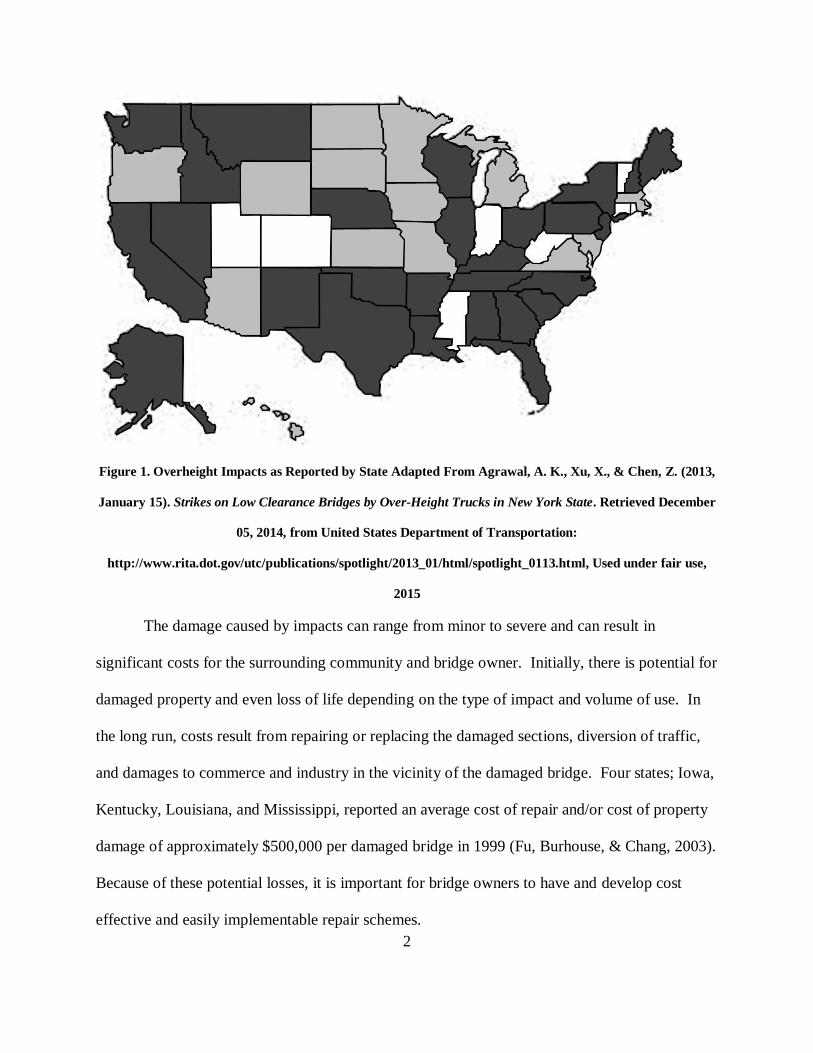
from 2005 to 2008. Figure 1 shows the number of reported impacts by state based on a response
to the same poll. The majority of the states that responded, highlighted in dark grey, admitted
that the damage of bridges from impact is a major problem (Agrawal, Xu, & Chen, 2013).
2
Figure 1. Overheight Impacts as Reported by State Adapted From Agrawal, A. K., Xu, X., & Chen, Z. (2013,
January 15). Strikes on Low Clearance Bridges by Over-Height Trucks in New York State. Retrieved December
05, 2014, from United States Department of Transportation:
http://www.rita.dot.gov/utc/publications/spotlight/2013_01/html/spotlight_0113.html, Used under fair use,
2015
The damage caused by impacts can range from minor to severe and can result in
significant costs for the surrounding community and bridge owner. Initially, there is potential for
damaged property and even loss of life depending on the type of impact and volume of use. In
the long run, costs result from repairing or replacing the damaged sections, diversion of traffic,
and damages to commerce and industry in the vicinity of the damaged bridge. Four states; Iowa,
Kentucky, Louisiana, and Mississippi, reported an average cost of repair and/or cost of property
damage of approximately $500,000 per damaged bridge in 1999 (Fu, Burhouse, & Chang, 2003).
Because of these potential losses, it is important for bridge owners to have and develop cost
effective and easily implementable repair schemes.

3
According to a report from The Transportation Research Board Committee on Concrete
Bridges published in 1994, prestressed bridges made up more than 50% of all bridges in the
United States. In addition, they predicted that the “application of prestressing to bridges has
grown rapidly and steadily” (Aktan, et al., 1994). As research is conducted in making concrete
lighter and stronger, the application of prestress to bridges extends the span capability of bridges
of up to 800 ft for segmental concrete bridges (Aktan, et al., 1994). With the increasing number
of prestress bridges in the United States, the probability of these bridges being impacted by
overheight vehicles increases.
The application of prestress that allows bridges to span greater lengths poses a more
complex problem when the girders are damaged than when a steel girder or non-prestressed
girder bridge is damaged. Damage that causes strands to become exposed makes them
susceptible to corrosion similar to mild steel reinforcement. Furthermore, strand exposure or
damage can change the capacity of the girder by reducing the effective prestress force in the
girder. Severed strands continue to provide flexural resistance in areas that are undamaged,
however, the capacity of the damaged section is reduced. Therefore, it is important to accurately
assess and sufficiently repair damaged members to restore the original strength. If that strength
cannot be restored, the bridge may be posted or replaced. Some of the current techniques used to
repair prestressed bridge girders include strand splices and Fiber Reinforced Polymer (FRP).
Other techniques include Steel Jacketing, External Post Tensioning, Fabric Reinforced
Cementitious Matrix (FRCM) and Replacement (Kasan, 2009).
This research project is intended to evaluate the efficiency of each of three repair
methods for impact damaged bridges. Through a review of previous applications and research of
these repair techniques, the most promising three will be included in a testing program. Test

4
girders for evaluation of the repair methods have been provided by the Virginia Department of
Transportation (VDOT). The girders are from an Interstate-81 overpass near Arcadia, Virginia
damaged by an overheight vehicle. The bridge plans are provided in APPENDIX A: Arcadia
Bridge Blueprints. Due to the damage from this and previous impacts, VDOT determined the
bridge needed to be replaced. The four AASHTO Type III prestressed girders, pictured in Figure
2, were provided to Virginia Tech to test repair techniques.
22.00"
45.00"
7.00"
8.75"
16.00"
7.50"
19.00"
7.00"
4.50"
Deck
Variable
Figure 2. Typical AASHTO Type III Girder Cross Section Tested
1.2: Purpose and Scope
This study is part of a VDOT sponsored project focusing on repair techniques for impact
damaged prestressed bridge girders. The investigation included evaluation of the repair
installation and flexural strength of four AASHTO Type III girders that were intentionally

5
damaged and repaired. In addition, nonlinear finite element modeling was used to aid in the
development of design protocols for each repair method. This report discusses two of the three
repair techniques. Three Master of Science students report on the project results: Justin Liesen,
Mark Jones, and Michael Gangi. Liesen and Jones (2015) had responsibility for the installation
and testing of the repaired girders and Gangi (2015) performed the finite element modeling of
the girders. The investigation will include testing and analysis and will result in the development
of installation and design strength calculation protocols.
1.3: Thesis Organization
CHAPTER II: Review of Literature of this thesis reviews the literature associated with
constructing prestressed bridges, damages to prestressed bridges, and repair techniques for
damaged prestressed bridges. CHAPTER III: Methods discusses the methods, set-up and
procedures followed for each test. CHAPTER IV: Results and Discussion discusses the results
of each test. CHAPTER V: Conclusions and Recommendations reviews and compares the results
of the tests and proposes recommendations for use and further research.

6
CHAPTER II: Review of Literature
2.1: Use of Prestressed Concrete for Bridges
“Prestressing can be defined in general terms as the preloading of a structure, before
application of the service loads, so as to improve its performance in specific ways” (Nilson,
1987). It is used to control the stress in the structural member; allowing the designer to limit
cracking and offset deflections under service loads. In prestressed bridge construction, a girder
is designed with a prestress force that offsets the stress and deflections caused by the self-weight
and superimposed dead, prestress, and live loads (Nilson, 1987).
Eugene Freyssinet, a French engineer, “introduced a system for prestressing using
wedge-anchored high strength steel cables” (Nilson, 1987), in 1940 that allowed long span
bridges to be built with relatively small depths. “The application of prestressing to bridges has
grown rapidly and steadily, beginning in 1949 with high-strength steel wires in the Walnut Lane
Bridge in Philadelphia, Pennsylvania” (Aktan, et al., 1994). The application of a preload
allowed designers to offset the deflection, reduce materials required, increase the span lengths,
and accelerate the construction timeline through the use of precast and segmental construction
techniques. Because of these advantages, the popularity of using prestressing in the construction
of bridges has increased. Since the construction of the Walnut Lane Bridge, the percent of
prestressed concrete bridges built each year has risen from 0% to 50% of all bridges built in the
United States. Figure 3 shows the steady increase of use of prestressed members in bridge
construction between 1950 and 1994 as compared to steel and non-prestressed concrete as the
primary material. With improvements in ultra-high and very-high performance concrete with
higher compressive strengths and lighter-weight materials, the life-cycle costs of prestressed

7
concrete bridges continues to decrease, increasing its popularity as a construction technique
(Aktan, et al., 1994).
Figure 3. Percent of Bridges Built Annually Aktan, A. E., Culmo, M. P., Frangopol, D. M., French, C. W.,
Rabbat, B. G., Sanders, D. H., . . . Woods, S. W. (1994). Concrete Bridges. Washington D.C.: Transportation
Research Board: Committee on Concrete Bridges. Retrieved December 8, 2014, Used under fair use, 2015
2.2: Damage Classification
As the percent of prestressed bridges continues to rise, the likelihood of damage due to
impact from overheight vehicles increases. Upon impact, a bridge can sustain damages that can
be classified as minor, moderate, or severe (Harries, Kasan, Miller, & Brinkman, 2012).
“Shallow spalls, nicks and cracks, scrapes and some efflorescence, rust or water stains” (Kasan,
2009) are typical with minor damage. Repairs to girders with minor damage are for aesthetic or
8
preventative purposes. “Larger cracks and sufficient spalling or loss of concrete to expose
strands” (Kasan, 2009) is typical of moderate damage. Repairs to girders with moderate damage
are for prevention of further deterioration. Kasan (2009) separated the classification of severe
damage into two categories, Severe I and Severe II. “Severe I damage requires structural repair
that can be affected using a non-prestressed/post-tensioned method” (Kasan, 2009). Repair to a
member with severe I damage is done to restore design strength. “Severe II damage requires
structural repairs involving replacement of prestressing force through new prestress or post-
tensioning” (Kasan, 2009). Repair to a member with severe II damage is done to restore a
service limit state. If an element must be replaced because damage is too extensive and repair is
not practical, it is classified as severe III (Kasan, 2009). Table 1 is a summary of the severe
damage classifications and repair philosophies based on the determined damages.

9
Table 1. Damage Classifications Harries, K. A., Kasan, J., Miller, R., & Brinkman, R. (2012). Updated
Research for Collision Damage and Repair of Prestressed Concrete Beams. NCHRP Project 20-07, Task 307,
University of Pittsburgh, Department of Civil Engineering, Pittsburgh. Retrieved December 10, 2014, Used
under fair use, 2015

10
2.3: Repair Techniques
In 1980, Shanafelt and Horn conducted research for The National Cooperative Highway
Research Program (NCHRP) in which they investigated 11 different repair techniques to include
external post-tensioning, steel jacketing, strand splicing, combinations of these methods, and
replacement. Their results were published in NCHRP Report 226 along with an initial damage
classification system. The report suggested standards for inspection and repair of damaged
prestressed bridge girders to include proper techniques, tools, and forms (Harries, et. al., 2012).
Subsequent research into repair techniques have built on and expanded the research reported in
NCHRP Report 226.
Strand splices are one of the cheapest and easiest methods to design and install for
repairing damaged prestressed girders. They can restore most of the strength and some of the
prestress force lost due to the damage. The size and stiffness of the splice must be considered to
ensure that proper positioning and cover are given and to account for any unintended
eccentricities. In addition, the advertised minimum strength of a strand splice is 85% of the
nominal strength of the strands it is joining. This must be considered as it will create a potential
critical failure point (Kasan, 2009).
Fiber reinforced polymers (FRP) provide a wide array of options for repair, but the
designer must consider the unique material properties of the different types of fabrics along with
the specific repair method they choose. In addition, the installation process requires skilled
laborers and the adhesive used to bond the system to the girder must be protected from the
environment to prevent deterioration from ultraviolet rays and fire (Kasan, 2009).
External post-tensioning is designed similar to an unbonded post-tensioned girder and
can restore prestress as well as strength and serviceability. The process is simple, but the design

11
must consider the force transfer to the girder and any eccentricity created by the addition of
loads. Also, after the system is installed, it needs to be protected from the environment to
prevent corrosion (Harries, et. al., 2012).
Steel Jacketing not only increases the strength through its own material properties, but it
also provides confinement for the concrete that it encases. The jacket can be designed to fit
around the outside of the girder, but the designer must consider how to anchor the jacket and
transfer shear forces between the jacket and the girder. Installation of the jacket may require
field welding to close the encasement and grouting is often required along the entire girder for
environmental protection and for aesthetics to offset size differences (Harries, et. al., 2012).
Fabric-Reinforced Cementitious Matrix (FRCM) is a “cement based matrix reinforced
with dry fibers in the form of open single or multiple meshes” (ACI Committee 549, 2013). The
matrix bonds to the member and provides reinforcement. The dry fabric mesh has a primary and
secondary orientation which allows it to provide bi-axial tensile strength and gives it some shear
resistance. However, the installation procedure requires a specified temperature range and a
specialized professional. Since it is relatively new in comparison to some of the other
techniques, finding someone with installation experience may prove difficult. In addition, there
is a longer cure process for the cementitious matrix than epoxy. If the matrix is not given the
proper cure time or temperatures are not within range, a good bond between the fabric and the
substrate may not form. Without a proper bond, the repair will not function properly (ACI
Committee 549, 2013).
Replacement is typically seen as the safest and surest way to handle a damaged girder.
By replacing a girder, any realized or unrealized damage that may affecting performance later is
fixed, however it is the most expensive and time consuming. According to a study conducted for

12
the Washington Department of Transportation, most girder replacements cost between $500,000
and $1,000,000 depending on the size and scope (average of around $8,000 per foot of girder
replaced) and took approximately one to two months to complete the replacement (Brice, 2013).
Ultimately, any repair method, or combination of repair methods is going to be more cost
and time effective than replacing a damaged girder. In addition, if designed appropriately, the
repaired section may outperform the original design capacity of the girder. Each type of repair
has its advantages and disadvantages as indicated in Table 2. These advantages and
disadvantages should be considered carefully based on the specific situation of the damaged
girder. The specifics of each type of repair is discussed in further detain in subsequent sections.
The repairs presented in Table 2 include replacement, steel jacketing, strand splicing, post
tensioned steel, post tensioned CFRP, prestressed CFRP, near surface mounted (NSM) CFRP,
CFRP fabrics, and preformed CFRP strips. If any aspect of a repair is under question, it is
always best to exercise caution and replace the damaged girder.

13
Table 2. Summary of Repair Techniques Harries, K. A., Kasan, J., & Aktas, C. (2009). Repair Methods for
Prestressed Girder Bridges. University of Pittsburgh, Department of Civil and Environmental Engineering.
Harrisburg: Commonwelth of Pennsylvania Department of Transportation, Used under fair use 2015
In the next three sections, this report presents in depth information about strand splices
and fiber reinforced polymer (FRP) repair methods and summarizes some of the additional
techniques presented in NCHRP Report 226 and the research inspired by Report 226.
2.3.1: Strand Splice
In the event that one or more strands are severed on a damaged prestressed girder, the
severed ends can be reconnected using a strand splice or splice chuck. The re-connected strand
14
can then be stressed to reintroduce some or all of the force that was initially in the strand using
one of three methods. The bridge can be preloaded introducing a negative moment, or upward
camber, and after the strands are connected and the load removed, tension is induced. Another
option is to heat the strand to cause strand elongation before the splice is connected. Once the
strand cools, it shrinks and tension is introduced. The final technique is to use a wrench to
torque the strand splice chuck and induce tension. As introducing a negative moment is not an
option in most cases and strand heating may change the material properties of the strands,
torqueing the turnbuckle on the splice chuck is the most common way to induce tension into the
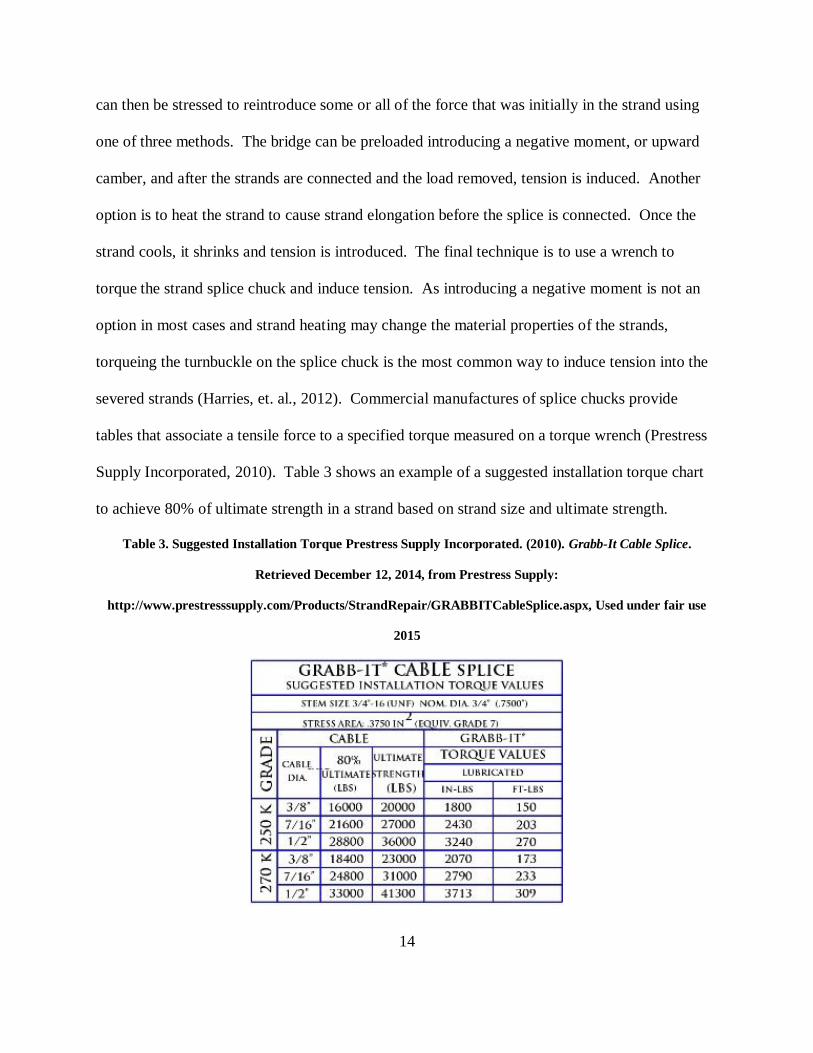
severed strands (Harries, et. al., 2012). Commercial manufactures of splice chucks provide
tables that associate a tensile force to a specified torque measured on a torque wrench (Prestress
Supply Incorporated, 2010). Table 3 shows an example of a suggested installation torque chart
to achieve 80% of ultimate strength in a strand based on strand size and ultimate strength.
Table 3. Suggested Installation Torque Prestress Supply Incorporated. (2010). Grabb-It Cable Splice.
Retrieved December 12, 2014, from Prestress Supply:
http://www.prestresssupply.com/Products/StrandRepair/GRABBITCableSplice.aspx, Used under fair use
2015

15
Installing strand splices is relatively quick and simple in comparison to other techniques.
The concrete is removed around the damaged section and severed strands to provide room for the
splice chuck. The area is then sand blasted and pressure washed to provide good patch concrete
bond and to prevent the substrate from drawing moisture from the patch concrete during curing.
If a preload negative moment is to be used, it is applied to shorten the strand length. The chucks
are positioned in order to ensure that their weak points do not overlap, using additional strand
extensions with wedges if necessary, then the turnbuckle is tightened to a specific torque, or a
turn-of-the-nut method is used to apply the desired stress in the strands. The negative moment is
then removed and a positive moment preload is applied and the patch material placed. After the
concrete has had time to cure, the positive moment is removed. The result of the repair with the
preloading is a spliced strand in tension with a concrete patch that is compressed (Zobel, Jirsa,
Fowler, & Carrasquillo, 1997).
Depending on the size of the damage, the entire process takes a well-trained crew about
one to three days from set-up until the patch has cured. Each splice chuck takes about 15
minutes to position and tightened to the desired tension. In addition, the cost of each splice
chuck is roughly $50-$100 (Prestress Supply Incorporated, 2010). When using more than one
strand splice, it is important to stagger the placement of the splice chucks so that a weakened
point in the girder is not created. The large size of the splice chuck may require the removal of
additional strands causing further reduction in the initial prestress force. The larger size and
stiffness of the splice chuck can also cause unintended eccentricities and reduce the clear cover
on exterior strands (Wipf, Klaiber, Rhodes, & Kempers, 2004b). Even with these issues, because
of low cost and quick instillation time, strand splices are often used in conjunction with other
repair techniques (Harries, et. al., 2012). Figure 4 shows a splice chuck being tightened with a
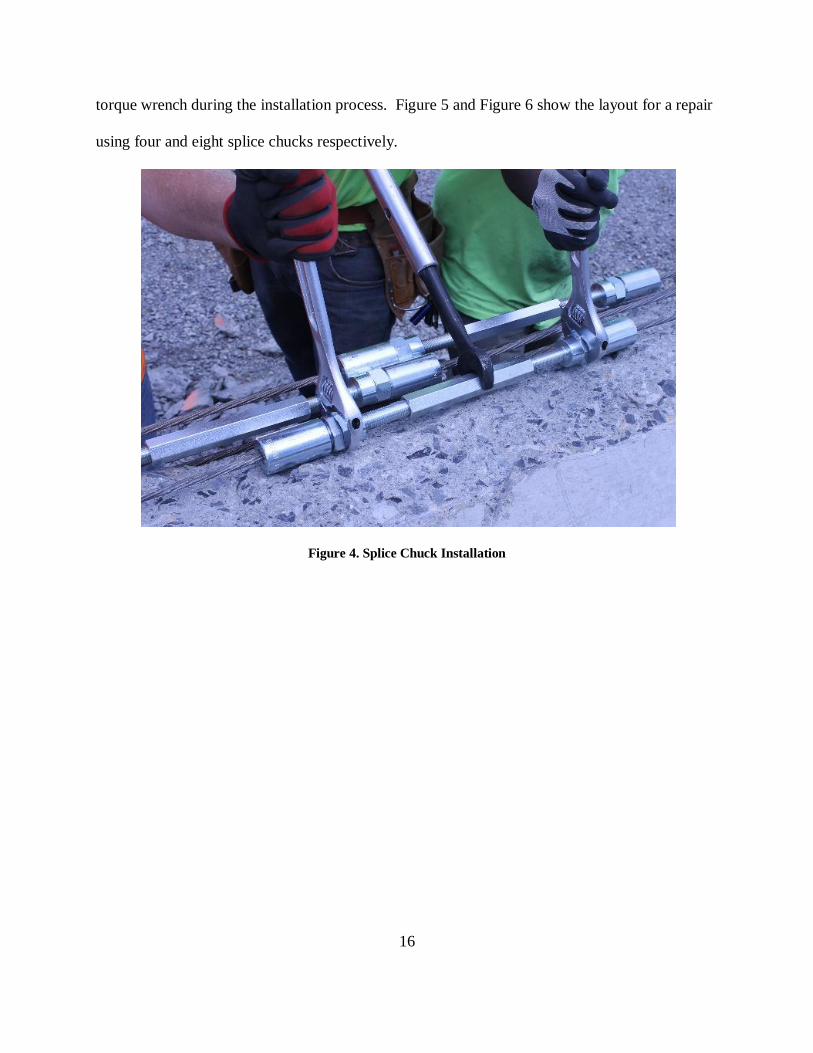
16
torque wrench during the installation process. Figure 5 and Figure 6 show the layout for a repair
using four and eight splice chucks respectively.
Figure 4. Splice Chuck Installation

17
Figure 5. Four Splice Chucks
Figure 6. Eight Splice Chucks

18
2.3.2: Fiber Reinforced Polymer (FRP)
Fiber reinforced polymer (FRP) is a polymer matrix high performance fibers inside of it.
The fibers can be made from aramid, carbon, glass, high performance steel, or a hybrid of these
materials (Harries, et. al., 2012). Carbon fiber reinforced polymer (CFRP) laid as a
unidirectional fabric is one of the most common forms of FRP and is supplied in large rolls of
fabric. The CFRP system is composed of primer, putty, saturant, carbon fiber sheets, and a
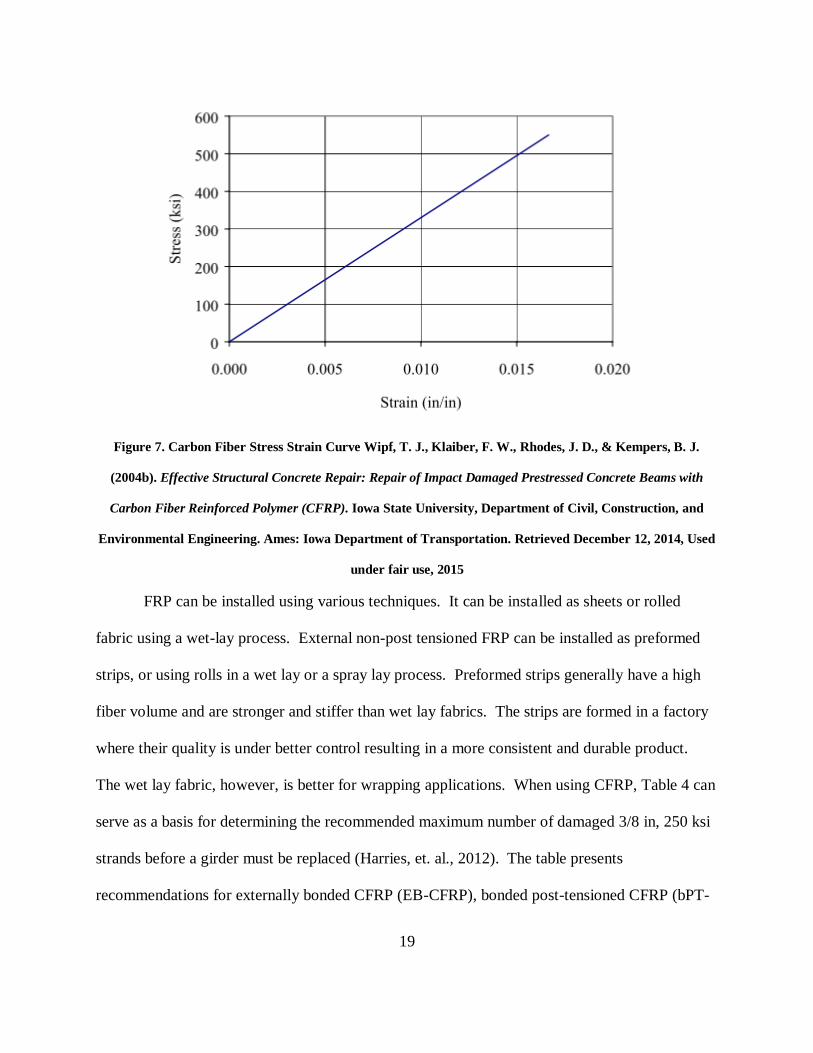
protective topcoat (Wipf, et. al., 2004b). Carbon fiber reinforced polymer has a tensile stress
capacity about 1.5 times prestressing strands and a Young’s modulus of 75% of that of steel
(Harries, et. al., 2012). This is evident in the stress-strain relationship for carbon fiber shown in
Figure 7 (Wipf, et. al., 2004b). These properties allow carbon fiber to reach a much higher strain
than steel, but it does not have the plastic behavior or strain hardening characteristics associated
with steel (Harries, et. al., 2012).
19
Figure 7. Carbon Fiber Stress Strain Curve Wipf, T. J., Klaiber, F. W., Rhodes, J. D., & Kempers, B. J.
(2004b). Effective Structural Concrete Repair: Repair of Impact Damaged Prestressed Concrete Beams with
Carbon Fiber Reinforced Polymer (CFRP). Iowa State University, Department of Civil, Construction, and
Environmental Engineering. Ames: Iowa Department of Transportation. Retrieved December 12, 2014, Used
under fair use, 2015
FRP can be installed using various techniques. It can be installed as sheets or rolled
fabric using a wet-lay process. External non-post tensioned FRP can be installed as preformed
strips, or using rolls in a wet lay or a spray lay process. Preformed strips generally have a high
fiber volume and are stronger and stiffer than wet lay fabrics. The strips are formed in a factory
where their quality is under better control resulting in a more consistent and durable product.
The wet lay fabric, however, is better for wrapping applications. When using CFRP, Table 4 can
serve as a basis for determining the recommended maximum number of damaged 3/8 in, 250 ksi
strands before a girder must be replaced (Harries, et. al., 2012). The table presents
recommendations for externally bonded CFRP (EB-CFRP), bonded post-tensioned CFRP (bPT-

20
CFRP), unbonded post-tensioned CFRP (uPT-CFRP), and near surface mounted CFRP (NSM-
CFRP). For example, in this project, an AASHTO Type III girder with 3/8 in, 250 ksi strands,
using externally bonded CFRP, can have a maximum of eight damaged strands as indicated
before a different repair technique should be selected or the girder replaced.
Table 4. Recommended FRP Repair Based on Maximum Number of Damaged Strands Harries, K. A., Kasan,
J., Miller, R., & Brinkman, R. (2012). Updated Research for Collision Damage and Repair of Prestressed
Concrete Beams. NCHRP Project 20-07, Task 307, University of Pittsburgh, Department of Civil Engineering,
Pittsburgh. Retrieved December 10, 2014, Used under fair use 2015
FRP strips can be used to return some of the lost prestress through either pre-tensioning
or post-tensioning the FRP strips. In order to install prestressed FRP, the material is stressed,
21
bonded to the concrete, and the stress is released once the epoxy has cured. Unbonded post-
tensioned FRP transfers force through mechanical anchors that stress the material and lock it in
place once the desired load is achieved. Bonded post-tensioned FRP is installed and stressed in
the same way as unbonded post-tensioned FRP, but it is then bonded to the girder. This method
reduces some of the adhesive creep since the adhesive system is not under stress (Harries, et. al.,
2012).
Installing wet lay FRP takes longer than splice chucks because the concrete used to patch
the damaged section must have time to cure before the primer and epoxy can be applied to it.
Also, it is quite common to use strand splices in addition to the FRP. FRP repair is still
relatively fast in comparison to replacing the entire girder. In order to install the FRP, first, the
concrete is removed in the damaged section. The area is then sand blasted and pressure washed
to provide a good surface for the patch concrete to bond with and to prevent the substrate from
drawing moisture from the patch concrete during curing. If there are severed strands and splice
chucks are to be used, they are installed as previously described. If a preload positive moment is
to be used, it is applied and the patch material placed. After the concrete has had time to cure,
the positive moment is removed. Next, the surface of the patch and the surface of the solid
concrete of the original girder along the length required for the FRP is sanded to provide a rough
surface for the epoxy to bond with. The epoxy is mixed creating a liquid saturant and a putty. A
primer coat of saturant is applied to the girder, then a coat of putty is applied. The sheets of FRP
are cut to length, soaked in the saturant and run through a roller to ensure that the liquid has
penetrated all of the fibers. It is then spread over the first layer of putty and any air pockets or
inconsistencies are worked out.
22
If more layers are required, the putty is spread across the outside of the FRP sheet and the
process is repeated. The final layer of FRP is laid perpendicular to the direction of the sheets to
provide confinement and strength in the transverse direction. The direction of the sheets can be
alternated by layer if additional strength is needed in either direction. After the last layer of
sheets is applied, a final layer of putty is spread across the fabric sheets in order to provide some
protection and ensure a good bond (Zobel, et. al., 1997). Depending on the size of the damage,
the entire process takes a well-trained crew about one week from set-up until the epoxy has
cured.
While using FRP has many advantages, there are some things that the designer must
consider. The epoxy is susceptible to ultraviolet and fire damage and must be protected in some
fashion. The material properties of the various types of FRP are different than steel and need to
be considered as they will change the behavior of the girder from its original design. While the
strength of the FRP is greater than with steel, it is stiffer and lacks the plastic behavior which can
result in a more sudden failure mode. If too much material is used, the result may be a
compressive failure rather than a tension failure. Also, it takes a specially trained crew to install
the system. If it is not installed correctly, there is potential for the epoxy to set incorrectly
resulting in an insufficient bond which may cause the material to “un-zip” from the girder (Wipf,
et. al., 2004b). Figure 8 shows the saturation process for a wet lay-up FRP strip, Figure 9 shows
an externally bonded wet-lay FRP being installed, and Figure 10 shows the final product.
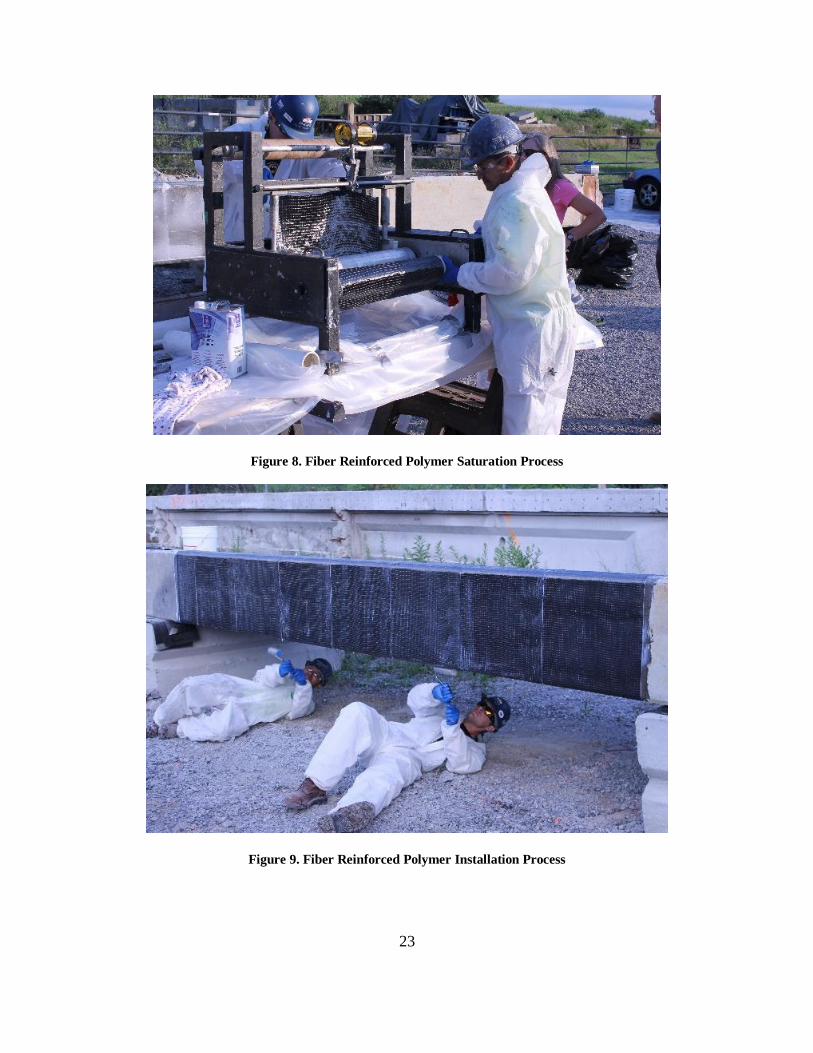
23
Figure 8. Fiber Reinforced Polymer Saturation Process
Figure 9. Fiber Reinforced Polymer Installation Process

24
Figure 10. Fiber Reinforced Polymer Installed Over Damaged Section
2.3.3: Additional Techniques
Most of the techniques for repair presented in NCHRP Report 226 by Shanafelt and Horn
(1980) made use of a vertical preload to restore precompression to patch materials and reduce
tensile stresses during live loads. Preloads are introduced as either a positive or a negative
moment and are most effective in systems that have a smaller dead-to-live load ratio. External
post-tensioning used steel rods, strands, or bars anchored to the exterior of the girder, which can
be tensioned to induce a stress to the cross section. The design of these systems is fairly simple
and similar to the design of an unbonded post tensioned system; however, the designer needs to
consider the eccentricity of the externally applied forces. Steel jacketing is a method that
involves encasing the girder with steel plates that act as a jacket for the girder to restore it to its
original capacity (Harries, et. al., 2012). In the event that a damaged girder is assessed as a
category severe III, or sufficient capacity cannot be obtained through any of the repair techniques
25
discussed, the best, yet most expensive and time consuming, course of action is to replace it
(Kasan, 2009).
FRCM consists of a cementitious matrix and a fiber grid. The matrix is impregnated
through the mesh to form a bond between the fabric strands and the girder. The grid geometry of
FRCM gives it advantages when compared to FRP. One of the advantages to a grid geometry is
bi-axial strength. This bi-axial strength allows for the system to provide shear resistance without
requiring additional layers in the transverse direction as required by FRP. By reducing the
amount of materials the number of applications, the FRCM will also reduce the risk of
overdesign due to the necessity of additional layers to resist secondary stresses. The designer,
however, must be aware of the potential to over design FRCM similar to FRP. Installation of
FRCM requires skilled laborers and temperature during installation must be managed as much as
possible to ensure that it does not affect long term performance (ACI Committee 549, 2013).
2.4: Summary
Based on the literature review, three repair methods were identified for experimental
investigation: strand splice, bonded FRP, and FRCM. Strand splices were investigated because
they are an active repair method which is economical and easy to install. Externally-bonded FRP
was chosen as a passive repair because it is currently one of the primary methods being used in
the industry and has a low life cycle cost. FRCM was chosen because it is a relatively new repair
method and has benefits over FRP such as biaxial strength and not relying on epoxy to create a
bond. Table 5 delineates the breakdown of responsibilities for investigating and reporting within
the project.

26
Table 5. Project Scope Responsibilities and Summary
Girder Test Description Investigator # Severed Strands
A 1 Control Test Mark Jones, Justin Liesen
0
B 2 8-Strand Spliced Mark Jones,
Justin Liesen 8
C
3 4-Strands Severed
with FRP Justin Liesen 4
4 4-Strand Spliced Mark Jones,
Justin Liesen 4
D
5 4-Strands Severed
with FRCM Mark Jones 4
6 4-Strand Spliced
with FRCM Mark Jones 4

27
CHAPTER III: Experimental Testing Methods
During this investigation three repair methods were evaluated by conducting six flexural
tests on four AASHTO Type III girders. Flexural tests were conducted instead of shear tests
because typical impact damage from overheight vehicles occurs around the mid-span and
flexural strength dominated region of bridge girders. Figure 11 shows the cross section of the
girder from the VDOT design drawings. Section A-A is a typical support cross section and
section B-B is a typical section between strand harping points. Figure 12 shows a cross section
of the AASHTO Type III girder with a section of deck as tested. The deck width varied across
the length of the girder and varied between tests. The variation in the deck width resulted when
the girder and deck sections were removed from the bridge by saw cutting through the deck
along the edge of the prestressed girder top flange. The approximate deck width for girder A
was 16 in and was 11 in for girders B and C.

28
Figure 11. Girder Cross Section from Bridge Plans

29
22.00"
45.00"
7.00"
8.75"
16.00"
7.50"
19.00"
7.00"
4.50"
Saw Cut Deck
Variable
Figure 12. Typical AASHTO Type III Girder Cross Section Tested
The shear reinforcement spacing of No 5 bars in the girder, shown in Figure 13, was
analyzed during the set-up of each test in order to evaluate potential failure modes. The shear
reinforcement type and spacing was identical in each of the test girders. The intent was to
achieve a flexural failure in each test. The first test was a flexural test of a 44 ft long unrepaired
section of Girder A to establish a baseline for comparison with the subsequent tests. The second
test was a flexural test on a 60 ft girder, Girder B, which was damaged and repaired at midspan
using the strand splice method. The third and fourth tests were flexural tests on one 60 ft girder,
Girder C, which was damaged and repaired at the third points. This was done to maximize the
number of tests conducted with the finite number of specimens. For this girder, the two repair
techniques implemented were strand splice and Fiber Reinforced Polymer (FRP). The fourth and

30
fifth tests were flexural tests on one 60 ft girder, Girder D, which was damaged and repaired at
the third points also. For this girder, the two repair techniques implemented were Fabric
Reinforced Cementitious Matrix (FRCM) independently and FRCM in conjunction with strand
splice.
58'
8 @ 6"6 @ 9"10 @ 12"5 @ 21"
4.00'4.50'10.00'8.75'
8 @ 6"
4.00'
6 @ 9"
4.50'
10 @ 12"
10.00'
5 @ 21"
8.75' 3.50'
0 @ 42"
Figure 13. Shear Reinforcement Spacing for No 5 Reinforcing Bars
Table 6 delineates the testing schedule for this project, identifies the researcher
responsible for investigating and reporting on each test, and summarizes the set-up. Tests one
through four will be discussed in this report. Tests five and six are discussed by Jones (2015).
Figure 14, Figure 15, Figure 17, Figure 18, Figure 19, Figure 20, Figure 21, and Figure 22 show
the layouts for each test. Also shown in these figures is the instrumentation used which is
discussed in subsequent sections.

31
Table 6. Testing Schedule and Summary
Girder Test Description Investigator
#
Severed
Strands
Span
Length
(ft)
Distance
to Load
Point 1
(ft)
Distance
to Load
Point 2
(ft)
A 1 Control Test Mark Jones,
Justin Liesen 0 35 12.5 16.5
B 2 8-Strand Spliced Mark Jones,
Justin Liesen 8 58 25 33
C
3,
Iteration 1 4-Strands Severed
with FRP Justin Liesen 4
48 17 21
3,
Iteration 2 53 17 21
4,
Iteration 1 4-Strand Spliced
Mark Jones,
Justin Liesen 4
58 37 41
4,
Iteration 2 50 29 33
D
5 4-Strands Severed
with FRCM Mark Jones 4 52 31 35
6 4-Strand Spliced
with FRCM Mark Jones 4 52 17 21
35.00'44.00'
8 @ 6"6 @ 9"10 @ 12"5 @ 21"
4.00'4.50'10.00'8.75'
10 @ 12"
4.46'
5 @ 21"
8.75' 3.50'
0 @ 42"
Wire Pot
26.25'
LVDT
14.5'
Strain Transducers
14.5'
Wire Pot
17.5'
Wire Pot
16.5'Wire Pot
12.5'
Load Cell
14.5'
BDI
49"
41"
LVDT
2"
LVDT
2"
Figure 14. Test 1 Set-up

32
58'
Wire Pot
43.5'
Wire Pot
29'
Wire Pot
14.5'
Load Cell
29'
LVDT
29'
Strain Transducers
29'
LVDT
24'LVDT
34'
BDI
49"
41"
BDI
49"
41"
LVDT
2"
LVDT
2"
BDI
6"
BDI
6"
8 @ 6"6 @ 9"10 @ 12"5 @ 21"
4.00'4.50'10.00'8.75'
8 @ 6"
4.00'
6 @ 9"
4.50'
10 @ 12"
10.00'
5 @ 21"
8.75' 3.50'
0 @ 42"
8 - Spliced Strands
Figure 15. Test 2 Set-up
48.00'
8 @ 6"6 @ 9"10 @ 12"5 @ 21"
4.00'4.50'10.00'8.75'
8 @ 6"
4.00'
6 @ 9"
4.50'
10 @ 12"
10.00'
5 @ 21"
8.75' 3.50'
0 @ 42"
Load Cell
19'
Wire Pot
33.5'
Wire Pot
19'
Wire Pot
8.5'
MLVDT
19'
Strain Transducers
19'
LVDT
12.25'
LVDT
27.25'
BDI
49"
41"
BDI
49"
41"
MLVDT
2"
MLVDT
2"
BDI
6"
BDI
6"
4 - Spliced Strands 4 - Severed Strands with FRP
Figure 16. Test 3, Iteration 1 Set-up
53.00'
8 @ 6"6 @ 9"10 @ 12"5 @ 21"
4.00'4.50'10.00'8.75'
8 @ 6"
4.00'
6 @ 9"
4.50'
10 @ 12"
10.00'
5 @ 21"
8.75' 3.50'
0 @ 42"
Load Cell
19'
Wire Pot
33.5'
Wire Pot
19'
Wire Pot
8.5'
MLVDT
19'
Strain Transducers
19'
LVDT
12.25'
LVDT
27.25'
BDI
49"
41"
BDI
49"
41"
MLVDT
2"
MLVDT
2"
BDI
6"
BDI
6"
4 - Spliced Strands 4 - Severed Strands with FRP
Figure 17. Test 3, Iteration 2 Set-up
33
58.00'
8 @ 6"6 @ 9"10 @ 12"5 @ 21"
4.00'4.50'10.00'8.75'
8 @ 6"
4.00'
6 @ 9"
4.50'
10 @ 12"
10.00'
5 @ 21"
8.75' 3.50'
0 @ 42"
Load Cell
39'
Wire Pot
39'
MLVDT
39'
Strain Transducers
39'
LVDT
33.5'
LVDT
43.5'
Wire Pot
48.5'
Wire Pot
19.5'
BDI
49"
41"
BDI
49"
41"
MLVDT
2"
MLVDT
2"
BDI
4"
BDI
6"
4 - Spliced Strands 4 - Severed Strands with FRP
Figure 18. Test 4, Iteration 1 Set-up
50.00'
8 @ 6"6 @ 9"10 @ 12"5 @ 21"
4.00'4.50'10.00'8.75'
8 @ 6"
4.00'
6 @ 9"
4.50'
10 @ 12"
10.00'
5 @ 21"
8.75' 3.50'
0 @ 42"
Load Cell
31'
Wire Pot
31'
MLVDT
31'
Strain Transducers
31'
LVDT
25.5'
LVDT
35.5'
Wire Pot
40.5'
Wire Pot
11.5'
BDI
49"
41"
BDI
49"
41"
MLVDT
2"
MLVDT
2"
BDI
4"
BDI
6"
4 - Spliced Strands 4 - Severed Strands with FRP
Figure 19. Test 4, Iteration 2 Set-up
52.00'
8 @ 6"6 @ 9"10 @ 12"5 @ 21"
4.00'4.50'10.00'8.75'
8 @ 6"
4.00'
6 @ 9"
4.50'
10 @ 12"
10.00'
5 @ 21"
8.75' 3.50'
0 @ 42"
Load Cell
33'
Wire Pot
33'
Strain Transducers
31' and 33'
LVDT
25.5'LVDT
40.5'
Wire Pot
42.5'
Wire Pot
16.5'
BDI
51.5"
39"
BDI
51.5"
39"
BDI
2"BDI
2"
BDI
51.5"
BDI
51.5"
BDI
2"BDI
2"
Cross Section
at 33'
Cross Section
at 31'
52.00'
8 @ 6"6 @ 9"10 @ 12"5 @ 21"
4.00'4.50'10.00'8.75'
8 @ 6"
4.00'
6 @ 9"
4.50'
10 @ 12"
10.00'
5 @ 21"
8.75' 3.50'
0 @ 42"
Load Cell
19'
Wire Pot
19'
Strain Transducers
19' and 21'
LVDT
26.5'LVDT
11.5'
Wire Pot
35.5'
Wire Pot
9.5'
BDI
51.5"
39"
BDI
51.5"
39"
BDI
2"BDI
2"
BDI
51.5"
BDI
51.5"
BDI
2"BDI
2"
Cross Section
at 19'
Cross Section
at 21'
4 - Severed Strands with FRCM 4 - Spliced Strands with FRCM
4 - Severed Strands with FRCM 4 - Spliced Strands with FRCM
Figure 20. Test 5 Set-up

34
52.00'
8 @ 6"6 @ 9"10 @ 12"5 @ 21"
4.00'4.50'10.00'8.75'
8 @ 6"
4.00'
6 @ 9"
4.50'
10 @ 12"
10.00'
5 @ 21"
8.75' 3.50'
0 @ 42"
Load Cell
33'
Wire Pot
33'
Strain Transducers
31' and 33'
LVDT
25.5'LVDT
40.5'
Wire Pot
42.5'
Wire Pot
16.5'
BDI
51.5"
39"
BDI
51.5"
39"
BDI
2"BDI
2"
BDI
51.5"
BDI
51.5"
BDI
2"BDI
2"
Cross Section
at 33'
Cross Section
at 31'
52.00'
8 @ 6"6 @ 9"10 @ 12"5 @ 21"
4.00'4.50'10.00'8.75'
8 @ 6"
4.00'
6 @ 9"
4.50'
10 @ 12"
10.00'
5 @ 21"
8.75' 3.50'
0 @ 42"
Load Cell
19'
Wire Pot
19'
Strain Transducers
19' and 21'
LVDT
26.5'LVDT
11.5'
Wire Pot
35.5'
Wire Pot
9.5'
BDI
51.5"
39"
BDI
51.5"
39"
BDI
2"BDI
2"
BDI
51.5"
BDI
51.5"
BDI
2"BDI
2"
Cross Section
at 19'
Cross Section
at 21'
4 - Severed Strands with FRCM 4 - Spliced Strands with FRCM
4 - Severed Strands with FRCM 4 - Spliced Strands with FRCM
Figure 21. Test 6 Set-up
Girders B, C, and D were intentionally damaged in order to simulate the damage caused
by overheight vehicle impact. The girders were laid on their sides and struck with a hydraulic
hammer attached to a backhoe. After a representative section of concrete was removed several
prestressing strands were severed.
After the girders were damaged, Structural Technologies provided personnel, materials,
and expertise to repair the damaged locations. Structural Technologies is a member of Structural
Group that specializes in the repair of damaged structures (Structural Group Incorporated, 2015).
Girder B was a strand splice repair on eight severed strands and was used in Test 2. A strand
splice repair was done on one end of Girder C on four severed strands and used in Test 3. On the
other end of Girder C, a FRP repair was done with four severed strands and used in Test 4. Once
the repairs were complete, the girders were set up for flexural tests to determine the effective
strength regenerated by the repairs in comparison to the initial strength of the undamaged girder.
3.1: Materials Testing
In order to accurately predict the experiment results and determine the contributing
factors to the failure modes, material tests were conducted for the concrete in the girder, the
concrete in the deck, the girder reinforcement, and the repair materials. Repair materials include
the Grabb-it Strand Splice system (Prestress Supply Incorporated, 2010), the Tstrata Infuseable
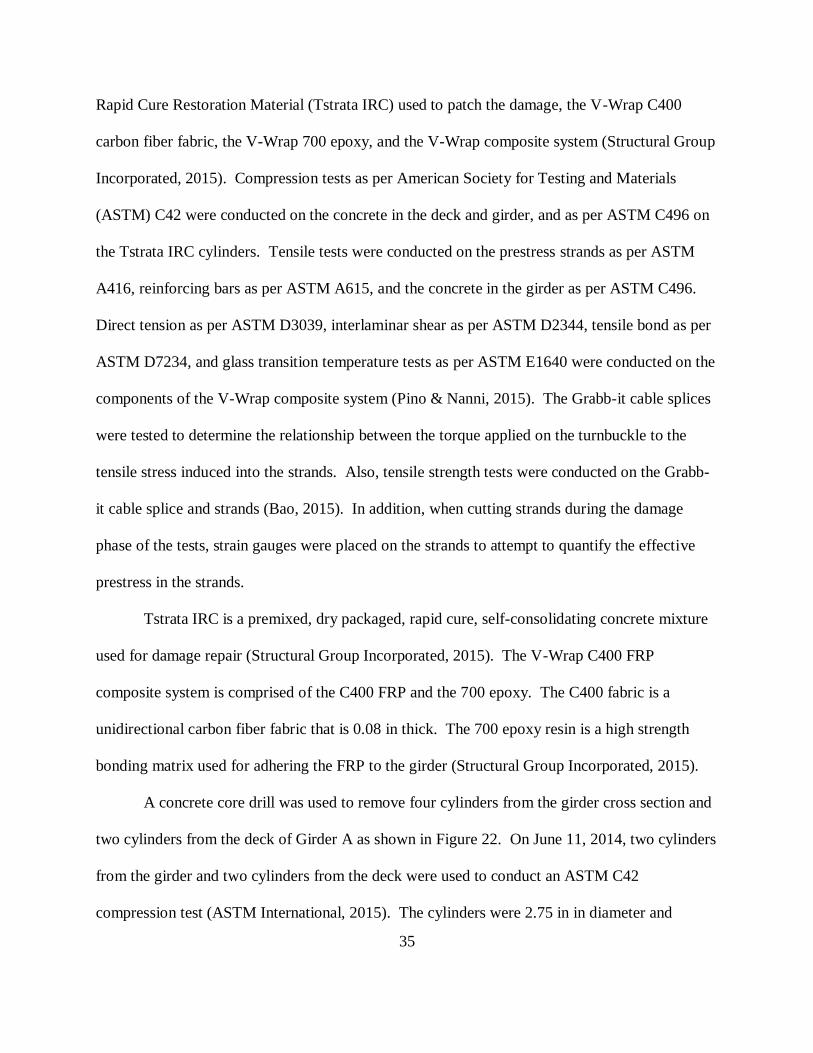
35
Rapid Cure Restoration Material (Tstrata IRC) used to patch the damage, the V-Wrap C400
carbon fiber fabric, the V-Wrap 700 epoxy, and the V-Wrap composite system (Structural Group
Incorporated, 2015). Compression tests as per American Society for Testing and Materials
(ASTM) C42 were conducted on the concrete in the deck and girder, and as per ASTM C496 on
the Tstrata IRC cylinders. Tensile tests were conducted on the prestress strands as per ASTM
A416, reinforcing bars as per ASTM A615, and the concrete in the girder as per ASTM C496.
Direct tension as per ASTM D3039, interlaminar shear as per ASTM D2344, tensile bond as per
ASTM D7234, and glass transition temperature tests as per ASTM E1640 were conducted on the
components of the V-Wrap composite system (Pino & Nanni, 2015). The Grabb-it cable splices
were tested to determine the relationship between the torque applied on the turnbuckle to the
tensile stress induced into the strands. Also, tensile strength tests were conducted on the Grabb-
it cable splice and strands (Bao, 2015). In addition, when cutting strands during the damage
phase of the tests, strain gauges were placed on the strands to attempt to quantify the effective
prestress in the strands.
Tstrata IRC is a premixed, dry packaged, rapid cure, self-consolidating concrete mixture
used for damage repair (Structural Group Incorporated, 2015). The V-Wrap C400 FRP
composite system is comprised of the C400 FRP and the 700 epoxy. The C400 fabric is a
unidirectional carbon fiber fabric that is 0.08 in thick. The 700 epoxy resin is a high strength
bonding matrix used for adhering the FRP to the girder (Structural Group Incorporated, 2015).
A concrete core drill was used to remove four cylinders from the girder cross section and
two cylinders from the deck of Girder A as shown in Figure 22. On June 11, 2014, two cylinders
from the girder and two cylinders from the deck were used to conduct an ASTM C42
compression test (ASTM International, 2015). The cylinders were 2.75 in in diameter and

36
approximately 6 in long. The other two cylinders from the girder were used to conduct an
ASTM C496 splitting tensile test (ASTM International, 2015).
Figure 22. Concrete Core Removal (Photo used with permission of Mark Jones, 2015)
During the repair of the damaged sections on July 16, 2014, six cylinders with a 4 in
diameter were made from the Tstrata IRC repair concrete for compressive strength testing using
the ASTM C39 compression test. On July 17, 2014, two cylinders were tested for their 24 hour
compressive strength. On July 18, 2014, two cylinders were tested for their 48 hour compressive
strength. On July 23, 1014, two cylinders were tested for their 7 day compressive strength.

37
Two sections of No 4 reinforcing bar approximately 3 ft long were removed from Girder
A. Load was applied at a rate of 0.05 in per minute for the first 4 minutes and increased to 0.5 in
per minute until the bars ruptured after a total of 8 minutes. The test was conducted on two
separate pieces of reinforcement.
To determine the material properties of the prestressing steel, two 4 ft long pieces of
prestressing strands were extracted from Girder A. The strands were prepared for testing
following the procedures developed by Salomon (2014) and Loflin (2008). Copper tubing was
used to pad the strands to mitigate the potential for a premature failure from a stress riser caused
by the grips. The tubing had an interior diameter of 0.5 in. It was cut in half lengthwise and cut
into approximately 10 in long sections. The sections were sand blasted to create a rough surface
for the best condition to bond with the epoxy. The epoxy mix was made from West System
105A epoxy resin, West System 205 epoxy hardener, and 120 Aluminum Oxide Grit with a ratio
of 5 fluid ounces of grit to 5 squirts each from the manufacturer provided pump of the epoxy
resin and hardener. The epoxy and grit mixture was poured into each half of the copper tubing
and each end of the strand was sandwiched between the tubing halves. The tubing was held
together with clamps and the epoxy was allowed to dry for a minimum of 24 hours. The strands
were placed in the SATEC universal machine and the hydraulic V-grips were used to grip the
copper tubing on either end of the strand as shown in Figure 23. Data was recorded using the
SATEC internal extensometer, the internal load cell, an external wire pot attached to the bottom
of the SATEC loading platform, and an external extensometer placed on the strand. The tension
test results indicate that the strands are grade 250 ksi (Nilson, 1987).

38
Figure 23. Prestress Strand Tensile Test
In order to determine the effective prestress in the strands, an extensometer was attached
to the strands on Girder D as shown in Figure 24. The extensometer was used to measure the
change in length of the strands when cut. The strands were cut with an electric grinder and steel
cutting blade as shown in Figure 25. The extensometer was positioned on the strand more than 6
in from the location of the cut depending on the amount of damage around the strand as shown in

39
Figure 26. This distance was chosen to minimize the effects of temperature change during the
cutting process. Six strands were cut with an extensometer attached to them. Based on these
values, it can be determined that the extensometer slipped on the second, third, fourth, and sixth
strands. The stress for the second, third, and sixth strands were past the yield stress and indicate
that the elastic assumption associated with the stress-strain relationship is not valid. The fourth
strand’s stress indicated that it was in compression. In these cases, acknowledging the vibrations
caused by the grinder while cutting the strands and the violent shortening of the strand as each
wire was cut, the most likely cause of the variation was due to slipping of the instrumentation
during testing. When averaging the first and fifth strands, the effective prestress force was 132
ksi.
Figure 24. Extensometer Attached to Strand (Photo taken by Mark Jones, used under fair use 2015)
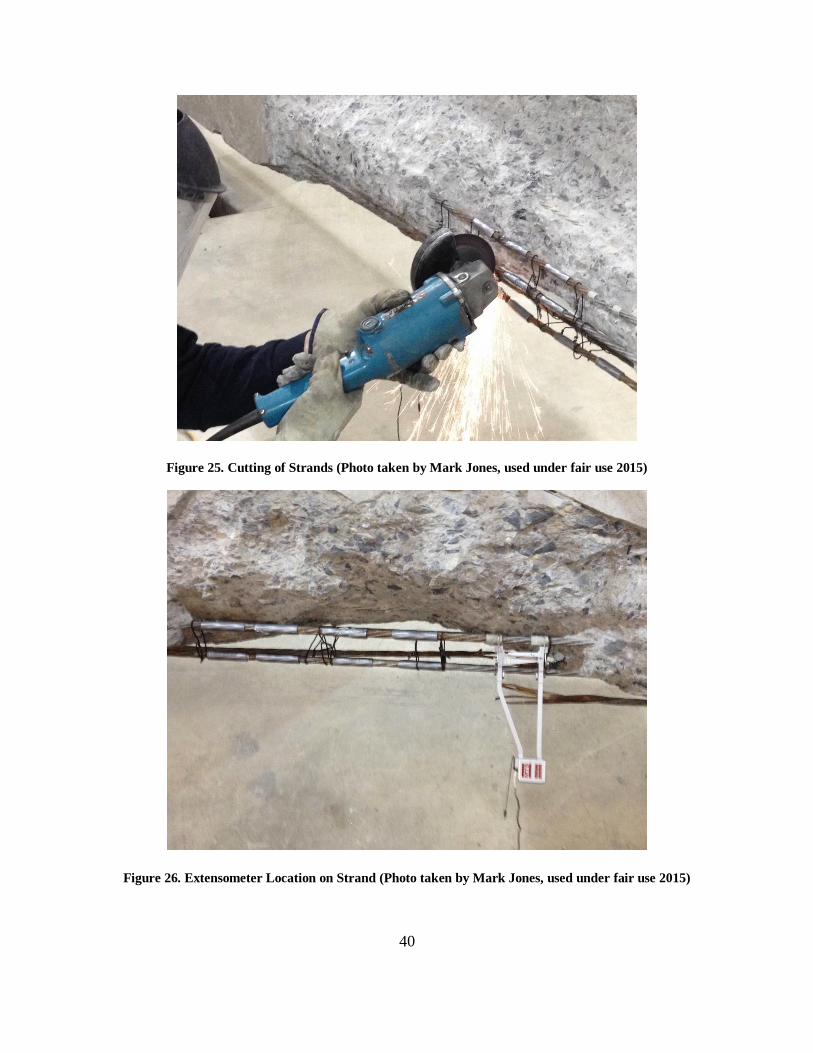
40
Figure 25. Cutting of Strands (Photo taken by Mark Jones, used under fair use 2015)
Figure 26. Extensometer Location on Strand (Photo taken by Mark Jones, used under fair use 2015)
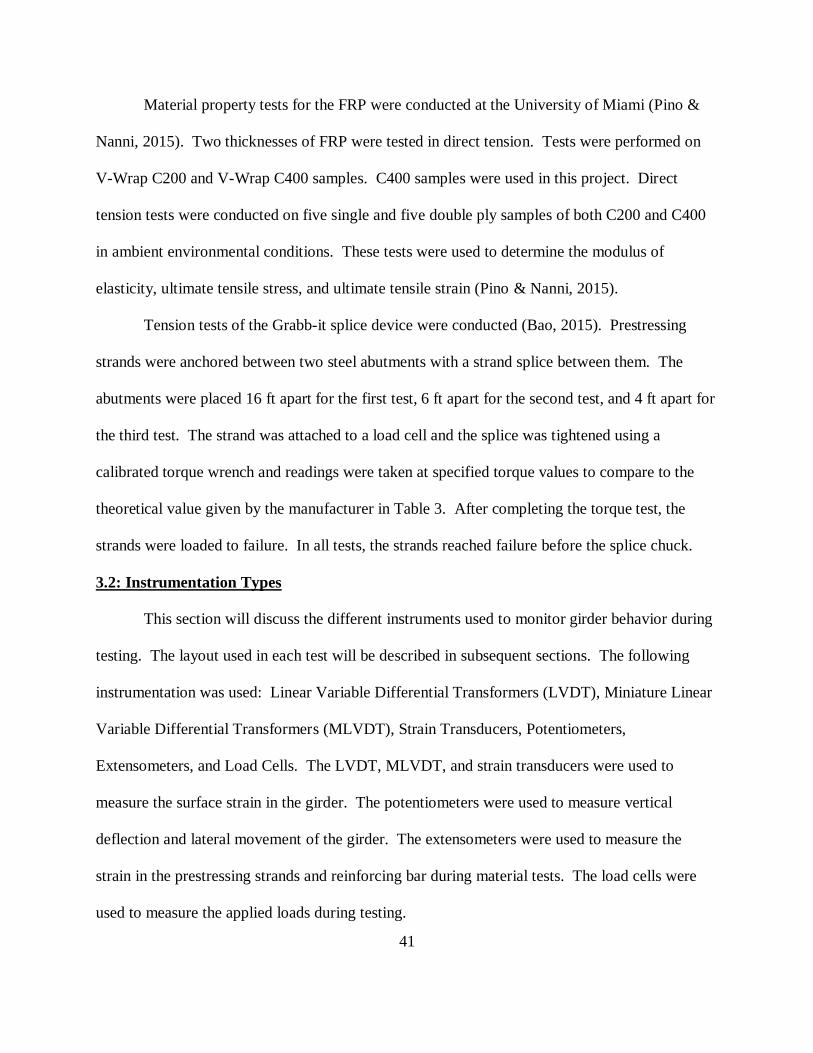
41
Material property tests for the FRP were conducted at the University of Miami (Pino &
Nanni, 2015). Two thicknesses of FRP were tested in direct tension. Tests were performed on
V-Wrap C200 and V-Wrap C400 samples. C400 samples were used in this project. Direct
tension tests were conducted on five single and five double ply samples of both C200 and C400
in ambient environmental conditions. These tests were used to determine the modulus of
elasticity, ultimate tensile stress, and ultimate tensile strain (Pino & Nanni, 2015).
Tension tests of the Grabb-it splice device were conducted (Bao, 2015). Prestressing
strands were anchored between two steel abutments with a strand splice between them. The
abutments were placed 16 ft apart for the first test, 6 ft apart for the second test, and 4 ft apart for
the third test. The strand was attached to a load cell and the splice was tightened using a
calibrated torque wrench and readings were taken at specified torque values to compare to the
theoretical value given by the manufacturer in Table 3. After completing the torque test, the
strands were loaded to failure. In all tests, the strands reached failure before the splice chuck.
3.2: Instrumentation Types
This section will discuss the different instruments used to monitor girder behavior during
testing. The layout used in each test will be described in subsequent sections. The following
instrumentation was used: Linear Variable Differential Transformers (LVDT), Miniature Linear
Variable Differential Transformers (MLVDT), Strain Transducers, Potentiometers,
Extensometers, and Load Cells. The LVDT, MLVDT, and strain transducers were used to
measure the surface strain in the girder. The potentiometers were used to measure vertical
deflection and lateral movement of the girder. The extensometers were used to measure the
strain in the prestressing strands and reinforcing bar during material tests. The load cells were
used to measure the applied loads during testing.

42
Linear Variable Differential Transformers were used to measure the concrete surface
strain in the girders. They were calibrated to 0.001 in and zeroed prior to each test.
Mini Linear Variable Differential Transformers are a shorter version of the LVDT and
were used to measure the concrete surface strain in the girders. They were calibrated to 0.001 in
and zeroed prior to each test.
Strain transducers were used to measure length changes. The changes in length were
used to calculate strain in the girder. They were calibrated to 0.001 in and zeroed prior to each
test.
Potentiometers were used to measure vertical deflection and lateral movement of the
girders. They were calibrated to 0.001 in and zeroed prior to each test. Potentiometers were also
used to determine changes in length when conducting material tests on prestressing strands and
reinforcing bars.
An extensometer was used to measure length during material tests on prestressing
strands, reinforcing bars, and when determining effective prestress. It was calibrated to 0.001 in
and zeroed prior to each test.
A load cell was used to measure the applied load to the girder. It was calibrated to 1000
lb and zeroed prior to each test. Load cells were also used to measure applied loads in material
tests.
3.3: Test Procedures
3.3.1: Test 1 – Control Test
Girder A had significant collision damage and sustained additional damage during
removal and transportation from the bridge site to the laboratory. Due to this damage, a 16 ft
section broke off and was used to provide samples for concrete, reinforcing bar, and strand

43
materials testing. The remaining 44 ft section of the girder was used as a control to determine
the unrepaired girder flexural strength. The supports were located to create a 35 ft span length
which avoided damaged areas near the girder’s end. In addition, the load points were not at
midspan, rather they were set at 12.5 and 16.5 ft from one support. This was done to minimize
the potential of a shear failure and maximize the potential for a flexural failure based on the
layout of the shear reinforcement and the strand harping point.
In order to develop the plan for the test set-up and decrease the probability of a shear
failure while ensuring the desired flexural failure, the girder nominal moment and shear
capacities were determined using provisions of AASHTO LRFD Bridge Design Specification
(American Association of State Highway and Transportation Officials, 2012) and the girder
material properties (Jones, 2015). The nominal moment capacity of this girder at the points of
load application was 2940 k-ft. This corresponds to a calculated load of 348 kips. Figure 27
shows the nominal moment capacity of the tested section of Girder A and the maximum
calculated moment resulting from a load of 348 kips. Figure 28 shows the absolute values of the
nominal shear capacity of Girder A and the maximum shear force resulting from a load of 348
kips. As shown in Figure 28, the maximum shear force is close to, but less than, the nominal
shear capacity at about 13 ft and around 18 ft from the left support. Other loading arrangements
were investigated, however this loading arrangement was chosen to minimize the potential for a
shear failure since the desired failure mode was flexural (Jones, 2015).

44
Figure 27. Nominal Moment Capacity versus Calculated Failure Moment for Test 1
Figure 28. Nominal Shear Capacity versus Calculated Shear for Test 1
0
500
1000
1500
2000
2500
3000
3500
0 5 10 15 20 25 30 35 40
Mo
men
t, k
-ft
Length along girder, ft
Nominal Moment Capacity Calculated Failure Moment
0
50
100
150
200
250
300
350
400
450
0 5 10 15 20 25 30 35 40
Fo
rce,
kip
s
Length along girder, ft
Nominal Shear Capacity Calculated Shear Force at Failure

45
Test 1 was a flexural test of a 44 ft section of Girder A with a 35 ft simple span length.
The section was supported on two W21x101 steel sections with a pin bearing on one steel section
and a roller bearing on the other. The original sole bearing plate on the girder was placed on top
of the roller bearing while rubber pads were used between the pin bearing and the bottom flange
of the girder. Figure 29 and Figure 30 show the set-up of the pin and roller bearings. Two
frames were used to prevent the girder from tipping from lateral deflection during the test.
Figure 31 shows one side of a frame. A third frame was used to hold a 400 kip hydraulic
actuator above the load points. The actuator exerted a force on a 6 ft long steel spreader beam
resting on two neoprene and steel laminate bearings. The load points were chosen to create a
constant moment region in the area that a flexural failure was desired. Figure 32 shows the
loading system set-up with the actuator, spreader beam, load frame, and laminate bearings.
Figure 29. Pin Bearing (Photo taken by Mark Jones, used under fair use 2015)
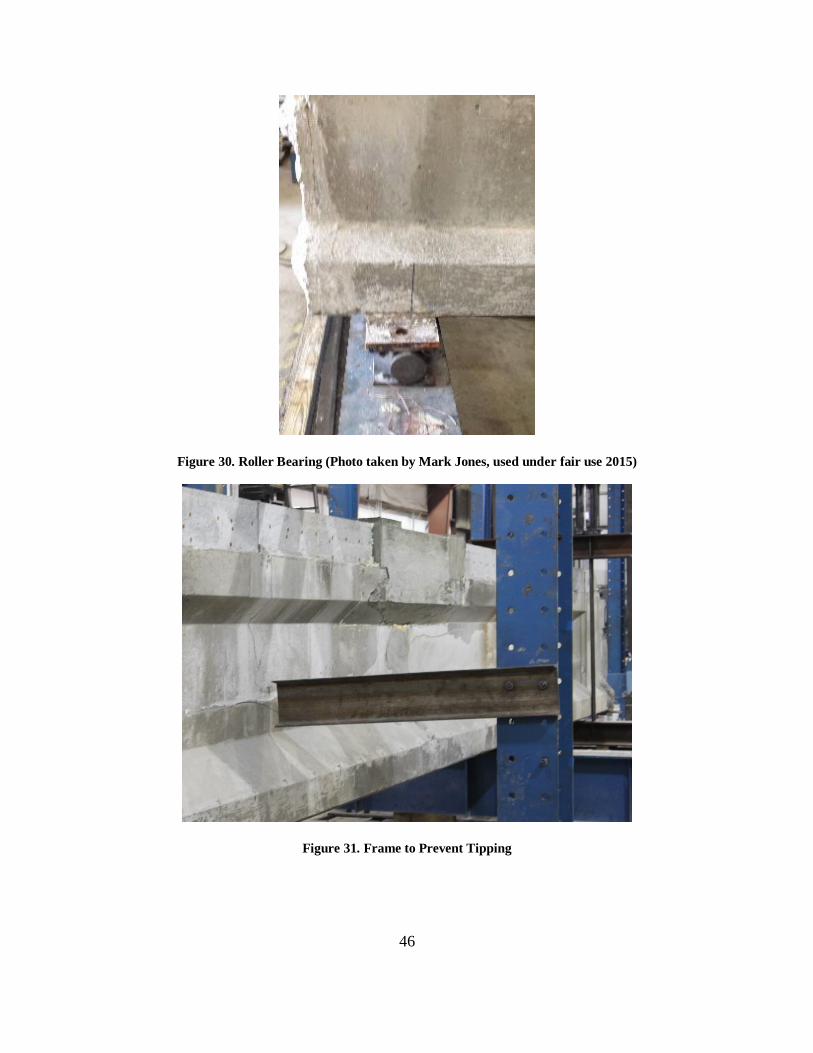
46
Figure 30. Roller Bearing (Photo taken by Mark Jones, used under fair use 2015)
Figure 31. Frame to Prevent Tipping
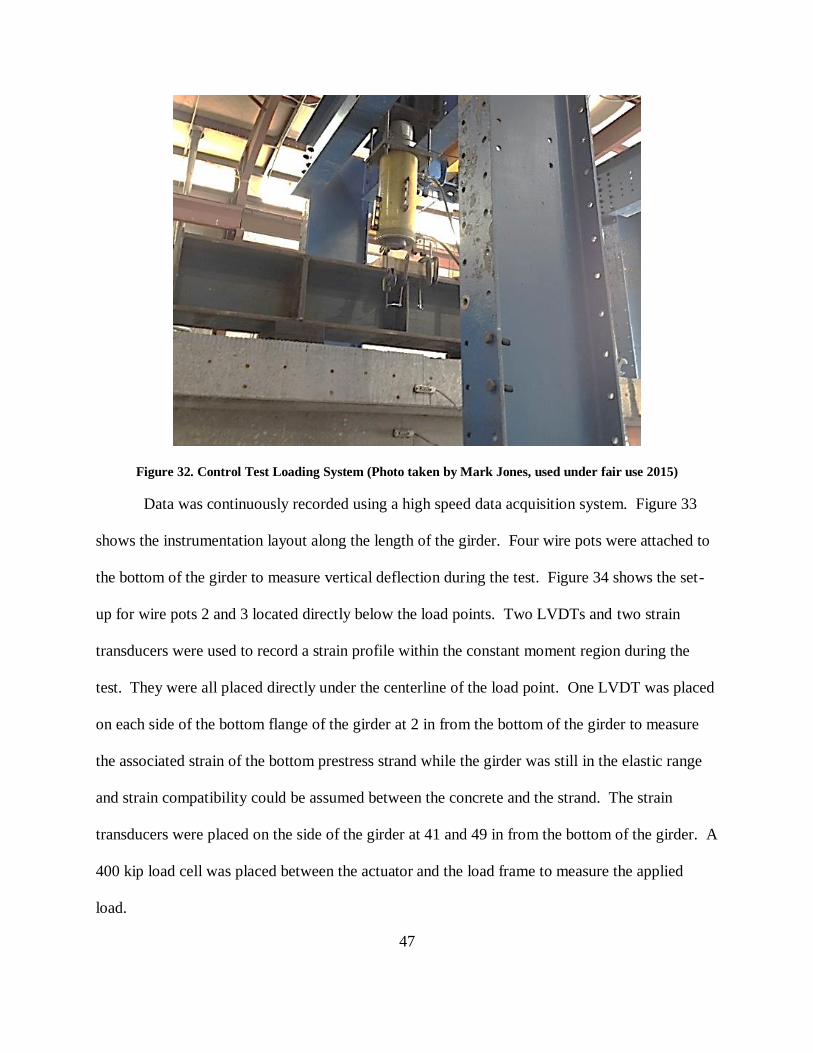
47
Figure 32. Control Test Loading System (Photo taken by Mark Jones, used under fair use 2015)
Data was continuously recorded using a high speed data acquisition system. Figure 33
shows the instrumentation layout along the length of the girder. Four wire pots were attached to
the bottom of the girder to measure vertical deflection during the test. Figure 34 shows the set-
up for wire pots 2 and 3 located directly below the load points. Two LVDTs and two strain
transducers were used to record a strain profile within the constant moment region during the
test. They were all placed directly under the centerline of the load point. One LVDT was placed
on each side of the bottom flange of the girder at 2 in from the bottom of the girder to measure
the associated strain of the bottom prestress strand while the girder was still in the elastic range
and strain compatibility could be assumed between the concrete and the strand. The strain
transducers were placed on the side of the girder at 41 and 49 in from the bottom of the girder. A
400 kip load cell was placed between the actuator and the load frame to measure the applied
load.

48
35.00'44.00'
8 @ 6"6 @ 9"10 @ 12"5 @ 21"
4.00'4.50'10.00'8.75'
10 @ 12"
4.46'
5 @ 21"
8.75' 3.50'
0 @ 42"
Wire Pot
26.25'
LVDT
14.5'
Strain Transducers
14.5'
Wire Pot
17.5'
Wire Pot
16.5'Wire Pot
12.5'
Load Cell
14.5'
BDI
49"
41"
LVDT
2"
LVDT
2"
Figure 33. Test 1 Set-up and Instrumentation Plan
Figure 34. Wire Pots below Load Point to Measure Deflection (Photo taken by Mark Jones, used under fair
use 2015)
The girder was tested on May 27, 2014 up to a load of 353 kips and a deflection of 1.43
in. Initially, the rate of loading was managed to ensure there were not effects from sudden or
impact loading. The load was held at approximately 20 kip increments to allow the girder to
settle under the load before it was inspected. At each pause, the girder was inspected and cracks

49
were highlighted and marked. This pace of loading was used from 0 to 280 kips of total load.
After 280 kips (for safety reasons), the strain transducers were removed and inspection ceased.
The hydraulic pump malfunctioned at 353 kips and a second test was conducted on June 2, 2014
after the pump was replaced. During the second test, the girder was re-loaded. The test was
conducted in a similar manner. The load was increased at 50 kip increments from 0 to 250 kips.
The rate of increase was reduced to 20 kips until the load reached 401 kips and was stopped
because it exceeded the design capacity of the test frame.
3.3.2: Test 2 – Girder with Eight Severed/Re-tensioned Strands
Girder B was a 60 ft long girder that was damaged for 4 ft on either side of midspan. Of
the 48 prestressing strands in the bottom flange of the girder, eight were intentionally severed
during damaging. The location of the damage is shown in Figure 35. The locations of the
strands that were severed are shown in Figure 36. Eight ft was chosen as the length for the
damage on Girder B based on data from the YRC Freight Company indicating the average width
of a semi-trailer as approximately 8 ft (YRC Worldwide, 2015).
Wipf, Klaiber, Rhodes, and Kempers (2004a) reported that some departments of
transportation replace a girder if any strand is damaged from the impact of overheight vehicles.
Other departments of transportation reported that a prestressed girder is replaced when 10% of
strands were damaged. The maximum number of damaged prestress strands allowed to be
repaired by any state before the damaged girder would be replaced was 25%. In addition, based
on results in Table 4, eight damaged strands on an AASHTO Type III girder is the maximum
number of strands to efficiently repair using externally bonded FRP (Harries, et. al., 2012).
Considering this information, damaging 17% of strands or eight strands was chosen. Subsequent
girders were inflicted with less damage so the data from tests could be scaled to compare results.
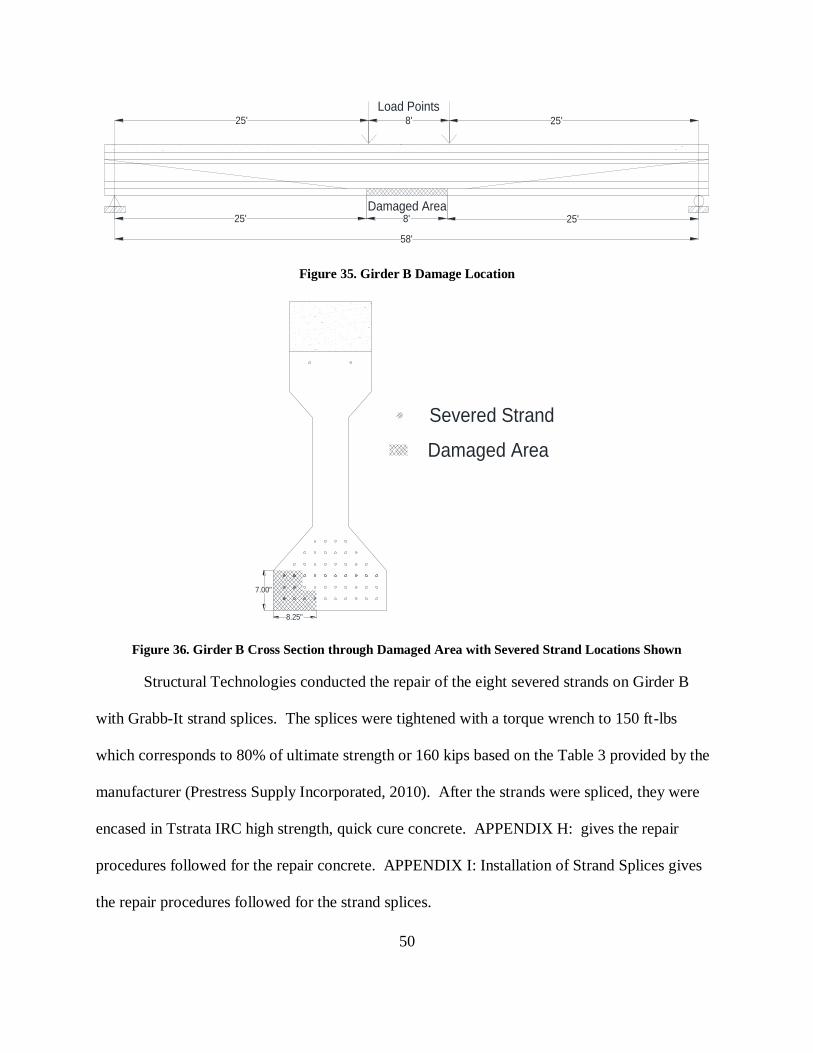
50
58'
8'25' 25'
25'8'25'
Load Points
Damaged Area
Figure 35. Girder B Damage Location
Severed Strand
Damaged Area
8.25"
7.00"
Figure 36. Girder B Cross Section through Damaged Area with Severed Strand Locations Shown
Structural Technologies conducted the repair of the eight severed strands on Girder B
with Grabb-It strand splices. The splices were tightened with a torque wrench to 150 ft-lbs
which corresponds to 80% of ultimate strength or 160 kips based on the Table 3 provided by the
manufacturer (Prestress Supply Incorporated, 2010). After the strands were spliced, they were
encased in Tstrata IRC high strength, quick cure concrete. APPENDIX H: gives the repair
procedures followed for the repair concrete. APPENDIX I: Installation of Strand Splices gives
the repair procedures followed for the strand splices.

51
In order to develop the plan for the test set-up and decrease the probability of a shear
failure while ensuring the desired flexural failure, the girder nominal moment and shear
capacities were determined using the provisions of AASHTO LRFD Bridge Design
Specifications (American Association of State Highway and Transportation Officials, 2012) and
the tested girder material properties (Jones, 2015). The nominal moment capacity of this girder
at the points of load application was 2620 k-ft. This corresponds to a load of 176 kips. Figure
37 shows the nominal moment capacity of Girder B and the maximum calculated moment
resulting from a load of 176 kips. Figure 38 shows the absolute values of the nominal shear
capacity of Girder B and the maximum calculated shear force resulting from a load of 176 kips.
Other loading arrangements were investigated, however this loading arrangement was chosen to
minimize the potential for a shear failure since the desired failure mode was flexural (Jones,
2015).
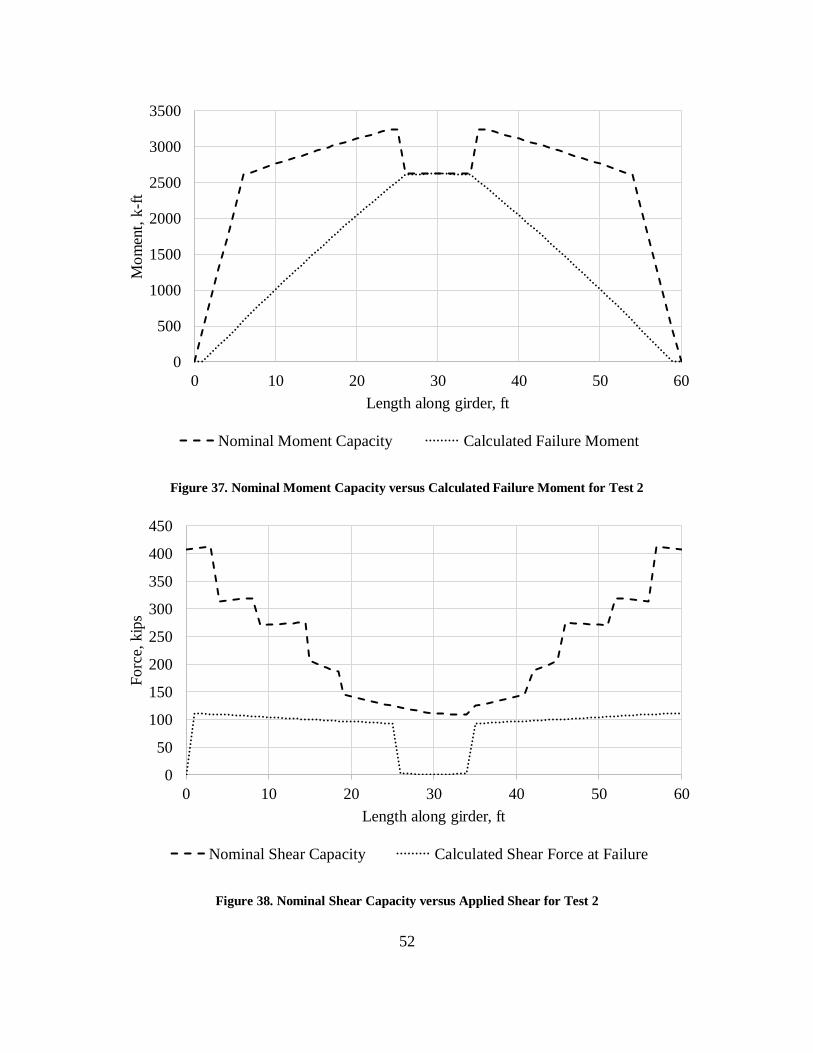
52
Figure 37. Nominal Moment Capacity versus Calculated Failure Moment for Test 2
Figure 38. Nominal Shear Capacity versus Applied Shear for Test 2
0
500
1000
1500
2000
2500
3000
3500
0 10 20 30 40 50 60
Mo
men
t, k
-ft
Length along girder, ft
Nominal Moment Capacity Calculated Failure Moment
0
50
100
150
200
250
300
350
400
450
0 10 20 30 40 50 60
Fo
rce,
kip
s
Length along girder, ft
Nominal Shear Capacity Calculated Shear Force at Failure
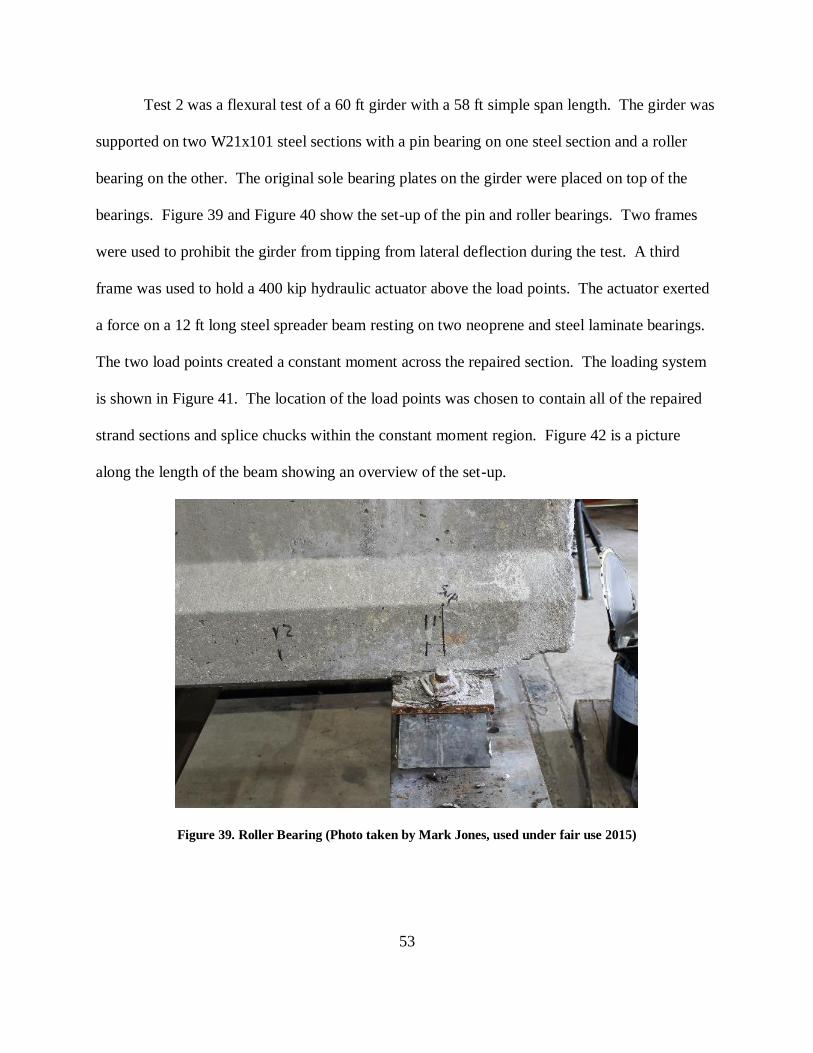
53
Test 2 was a flexural test of a 60 ft girder with a 58 ft simple span length. The girder was
supported on two W21x101 steel sections with a pin bearing on one steel section and a roller
bearing on the other. The original sole bearing plates on the girder were placed on top of the
bearings. Figure 39 and Figure 40 show the set-up of the pin and roller bearings. Two frames
were used to prohibit the girder from tipping from lateral deflection during the test. A third
frame was used to hold a 400 kip hydraulic actuator above the load points. The actuator exerted
a force on a 12 ft long steel spreader beam resting on two neoprene and steel laminate bearings.
The two load points created a constant moment across the repaired section. The loading system
is shown in Figure 41. The location of the load points was chosen to contain all of the repaired
strand sections and splice chucks within the constant moment region. Figure 42 is a picture
along the length of the beam showing an overview of the set-up.
Figure 39. Roller Bearing (Photo taken by Mark Jones, used under fair use 2015)
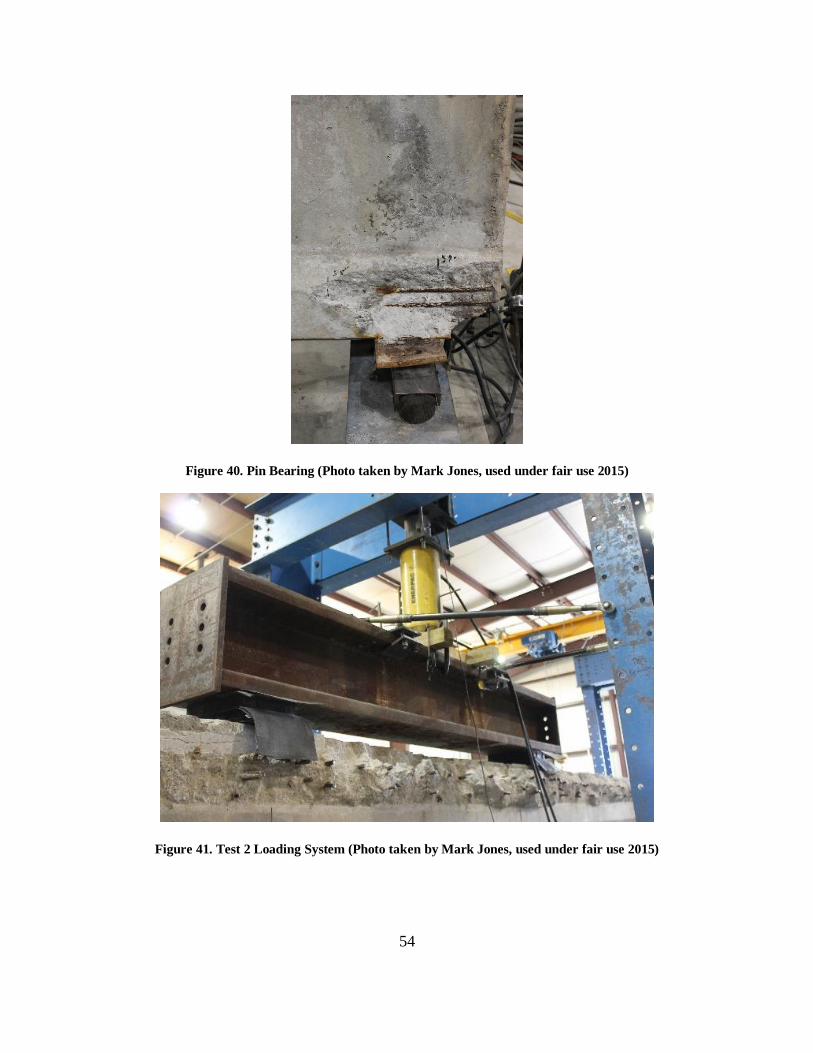
54
Figure 40. Pin Bearing (Photo taken by Mark Jones, used under fair use 2015)
Figure 41. Test 2 Loading System (Photo taken by Mark Jones, used under fair use 2015)
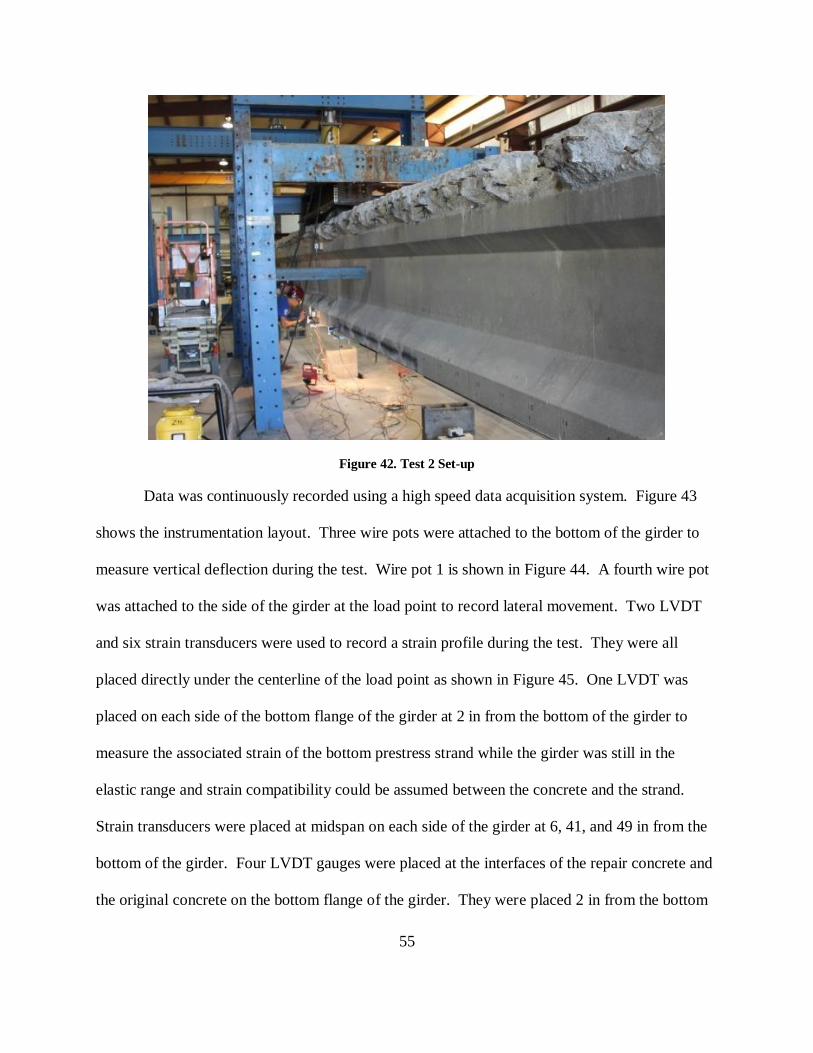
55
Figure 42. Test 2 Set-up
Data was continuously recorded using a high speed data acquisition system. Figure 43
shows the instrumentation layout. Three wire pots were attached to the bottom of the girder to
measure vertical deflection during the test. Wire pot 1 is shown in Figure 44. A fourth wire pot
was attached to the side of the girder at the load point to record lateral movement. Two LVDT
and six strain transducers were used to record a strain profile during the test. They were all
placed directly under the centerline of the load point as shown in Figure 45. One LVDT was
placed on each side of the bottom flange of the girder at 2 in from the bottom of the girder to
measure the associated strain of the bottom prestress strand while the girder was still in the
elastic range and strain compatibility could be assumed between the concrete and the strand.
Strain transducers were placed at midspan on each side of the girder at 6, 41, and 49 in from the
bottom of the girder. Four LVDT gauges were placed at the interfaces of the repair concrete and
the original concrete on the bottom flange of the girder. They were placed 2 in from the bottom
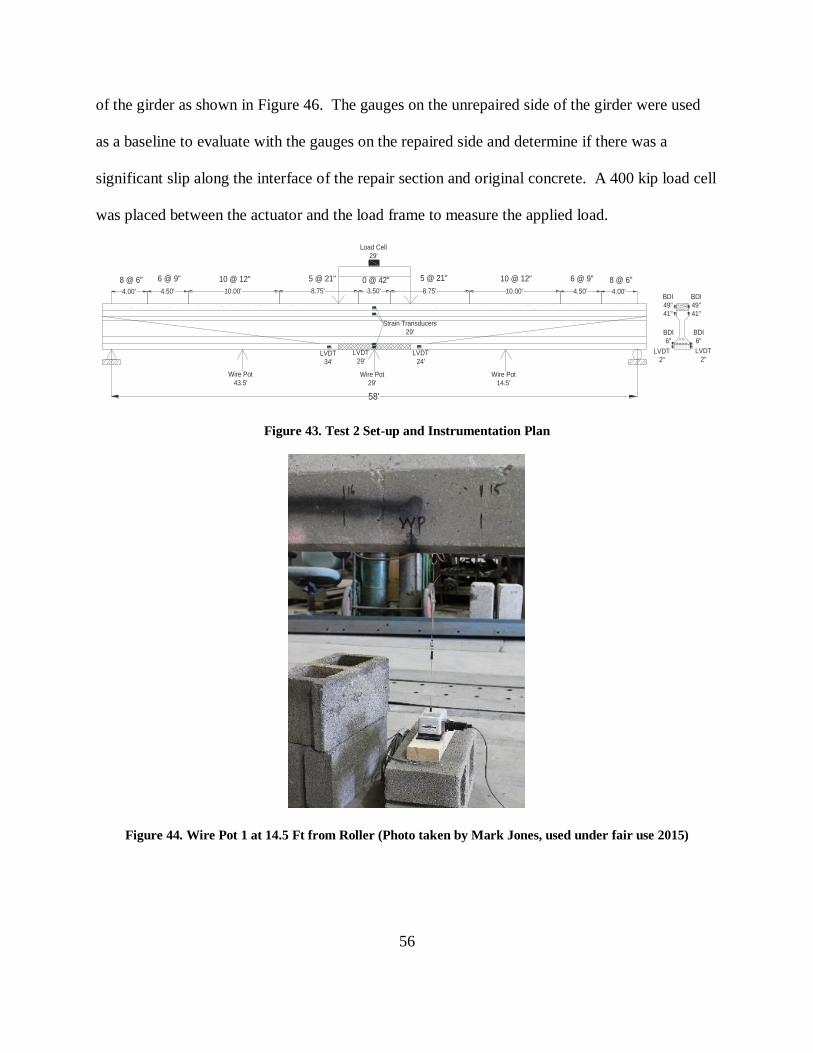
56
of the girder as shown in Figure 46. The gauges on the unrepaired side of the girder were used
as a baseline to evaluate with the gauges on the repaired side and determine if there was a
significant slip along the interface of the repair section and original concrete. A 400 kip load cell
was placed between the actuator and the load frame to measure the applied load.
58'
Wire Pot
43.5'
Wire Pot
29'
Wire Pot
14.5'
Load Cell
29'
LVDT
29'
Strain Transducers
29'
LVDT
24'LVDT
34'
BDI
49"
41"
BDI
49"
41"
LVDT
2"
LVDT
2"
BDI
6"
BDI
6"
8 @ 6"6 @ 9"10 @ 12"5 @ 21"
4.00'4.50'10.00'8.75'
8 @ 6"
4.00'
6 @ 9"
4.50'
10 @ 12"
10.00'
5 @ 21"
8.75' 3.50'
0 @ 42"
Figure 43. Test 2 Set-up and Instrumentation Plan
Figure 44. Wire Pot 1 at 14.5 Ft from Roller (Photo taken by Mark Jones, used under fair use 2015)
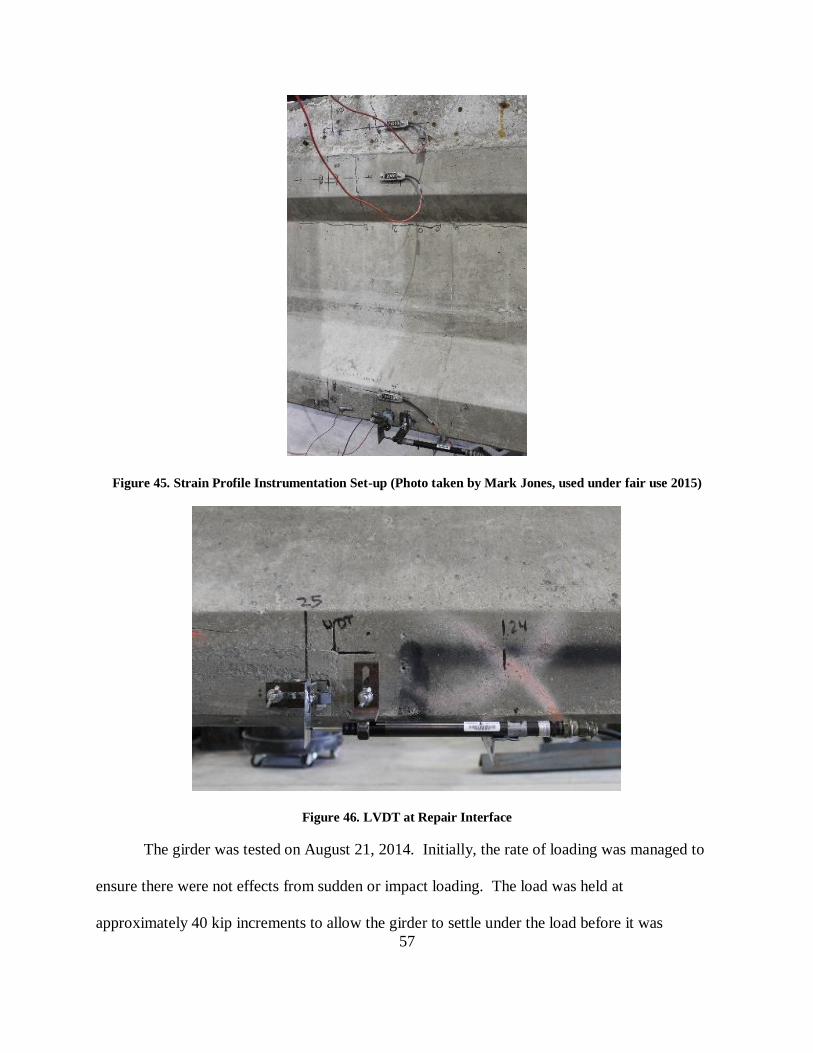
57
Figure 45. Strain Profile Instrumentation Set-up (Photo taken by Mark Jones, used under fair use 2015)
Figure 46. LVDT at Repair Interface
The girder was tested on August 21, 2014. Initially, the rate of loading was managed to
ensure there were not effects from sudden or impact loading. The load was held at
approximately 40 kip increments to allow the girder to settle under the load before it was

58
inspected. At each pause, the girder was inspected and cracks were highlighted and marked.
This pace of loading was used from 0 to 100 kips of total load. The load increment between
pauses for inspection was decreased to 20 kips from 100 to 160 kips of total load. The load
increment was then decreased to 10 kips from 160 to 195 kips of total load. After 170 kips (for
safety reasons), the strain transducers were removed and close-up inspection and marking of
cracks ceased. The load was increased to 195 kips and 3.39 in of deflection when one of the
prestressing strands failed. The load fell to 191 kips and was increased again to 193 kips when a
second strand failed causing the load to fall to 184 kips. At this point, the test was determined to
be a flexural tension failure.
3.3.3: Test 3 – FRP Repaired Girder with Four Severed Strands
For test 3, Girder C, a 60 ft girder, was damaged for 2 ft on either side of both third
points. Of the 48 prestressing strands in the bottom flange of the girder, four were intentionally
severed at each location during damaging. Four feet was chosen as the length for damage to
allow Girder C to be damaged in two locations as shown in Figure 47. The two damage
locations allowed two repair techniques to be tested on the same girder without one repair
influencing the other repair’s test results. In addition to reducing the length of damage, the
number of severed prestressing strands was reduced to four strands. Figure 48 shows the
locations of the strands that were severed during the damaging process.

59
58.00'
17.00' 4.00' 17.00'4.00'
Damaged Area Damaged Area16.00'
Test 3
Load
Points
Test 4
Load
Points
Figure 47. Girder C Damage Locations
Severed Strand
Damaged Area
5.50"
7.00"
Figure 48. Girder C Cross Section through Damaged Area with Severed Strand Locations Shown
Structural Technologies conducted the repair of the damaged location on Girder C for
Test 3 with Tstrata IRC as a patch and V-Wrap C400 FRP composite. V-Wrap C400 FRP is a
0.08 in thick fabric with V-Wrap 700 ambient cure epoxy resin provided by Structural
Technologies (International Code Council Evaluation Service, 2014). After the concrete patch
was placed and allowed to cure, the FRP was installed. APPENDIX H: Common Repair
Procedures gives the repair procedures followed for the repair concrete. APPENDIX J: Fiber

60
Reinforced Polymer Repair Procedures gives the repair procedures followed for the FRP
application.
Two iterations of Test 3 were conducted. During the first iteration, flexural cracking was
observed in vicinity of the second repair to be tested during Test 4. In addition, shear cracking
was observed in the midspan region where there is no shear reinforcement. In order to ensure
that Test 4’s results were not adversely affected, test iteration one was stopped until after Test 4
was completed. At that time, test iteration two was conducted. In order to develop the plan for
the test set-up and decrease the probability of a shear failure while ensuring the desired flexural
failure, the girder nominal moment and shear capacities were determined using the provisions of
AASHTO LRFD Bridge Design Specifications (American Association of State Highway and
Transportation Officials, 2012) and the tested girder material properties (Jones, 2015).
The nominal moment capacity of this girder at the points of load application was 3410 k-
ft. This corresponds to a load of 293 kips for iteration 1 and 268 kips for iteration 2. Figure 49
shows the nominal moment capacity of Girder C and the maximum calculated moment resulting
from a load of 293 kips. Figure 51 shows the nominal moment capacity of Girder C and the
maximum calculated moment resulting from a load of 268 kips. Figure 50 shows the absolute
values of the nominal shear capacity of Girder B and the maximum calculated shear force
resulting from a load of 293 kips. Figure 52 shows the absolute values of the nominal shear
capacity of Girder B and the maximum calculated shear force resulting from a load of 268 kips.
Other loading arrangements were investigated, however this loading arrangement was chosen to
minimize the potential for a shear failure since the desired failure mode was flexural (Jones,
2015).

61
Figure 49. Nominal Moment Capacity versus Calculated Failure Moment for Test 3, Iteration 1
Figure 50. Nominal Shear Capacity versus Calculated Shear for Test 3, Iteration 1
0
500
1000
1500
2000
2500
3000
3500
4000
0 10 20 30 40 50
Mo
men
t, k
-ft
Length along girder, ft
Nominal Moment Capacity Calculated Failure Moment
0
50
100
150
200
250
300
350
400
450
0 10 20 30 40 50
Fo
rce,
kip
s
Length along girder, ft
Nominal Shear Capacity Calculated Shear Force at Failure
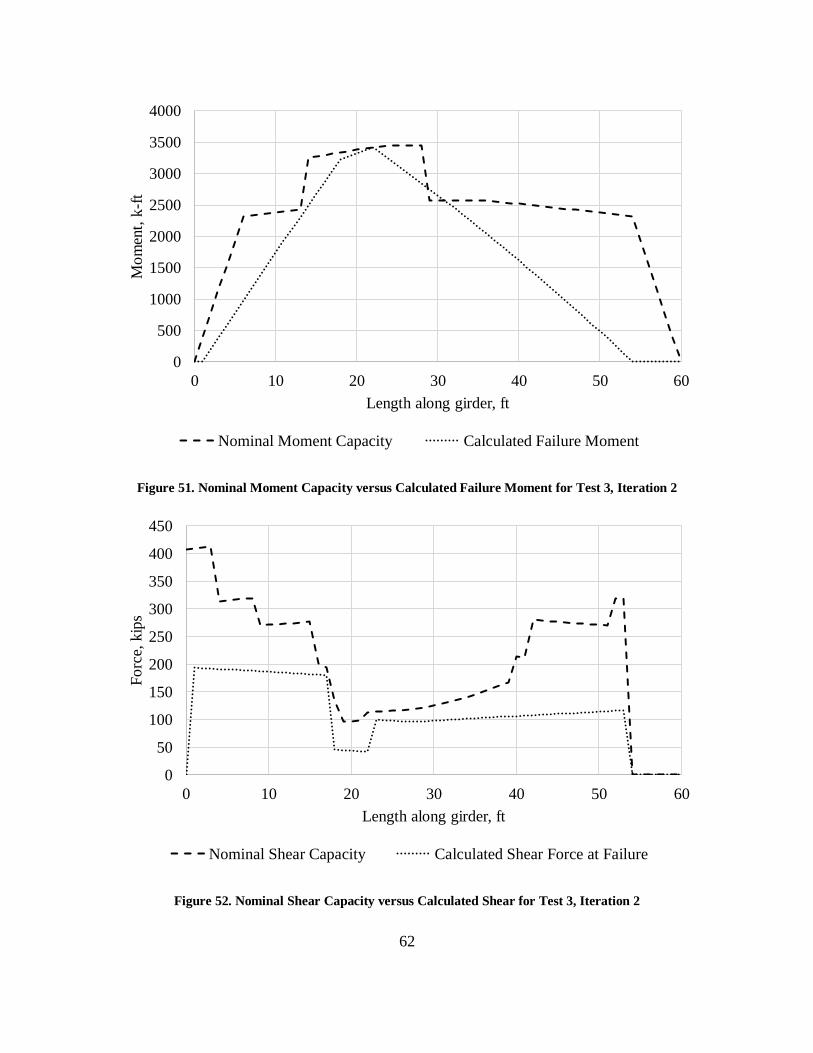
62
Figure 51. Nominal Moment Capacity versus Calculated Failure Moment for Test 3, Iteration 2
Figure 52. Nominal Shear Capacity versus Calculated Shear for Test 3, Iteration 2
0
500
1000
1500
2000
2500
3000
3500
4000
0 10 20 30 40 50 60
Mo
men
t, k
-ft
Length along girder, ft
Nominal Moment Capacity Calculated Failure Moment
0
50
100
150
200
250
300
350
400
450
0 10 20 30 40 50 60
Fo
rce,
kip
s
Length along girder, ft
Nominal Shear Capacity Calculated Shear Force at Failure

63
Test 3 was a flexural test of a 60 ft girder with a 48 ft simple span length for the first
iteration and a 53 ft simple span length for the second iteration. The girder was supported on
two W21x101 steel sections with a pin bearing placed on one steel section and a roller bearing
placed on the other. The original sole bearing plate on one end of the girder was placed on top of
the roller bearing while rubber pads were used between the pin bearing and the bottom flange of
the girder. The span length was extended for the second iteration to reduce shear force in the
midspan region of the girder where there is less shear reinforcement. Figure 53 shows the test
set-up along the length of the girder. Figure 54 shows the pin for the first iteration. Figure 55
shows the pin location for the second iteration. Figure 56 shows the roller location for both
iterations. Two frames were used to prohibit the girder from tipping from lateral deflection
during the test. A third frame was used to hold a 400 kip hydraulic actuator above the load
points. The actuator exerted a force on a 6 ft long steel spreader beam resting on two neoprene
and steel laminate bearings that translated the load into a constant moment region between two
load points. The load points were chosen so all of the severed strand sections within the constant
moment region. The set-up of the loading system is shown in Figure 57.
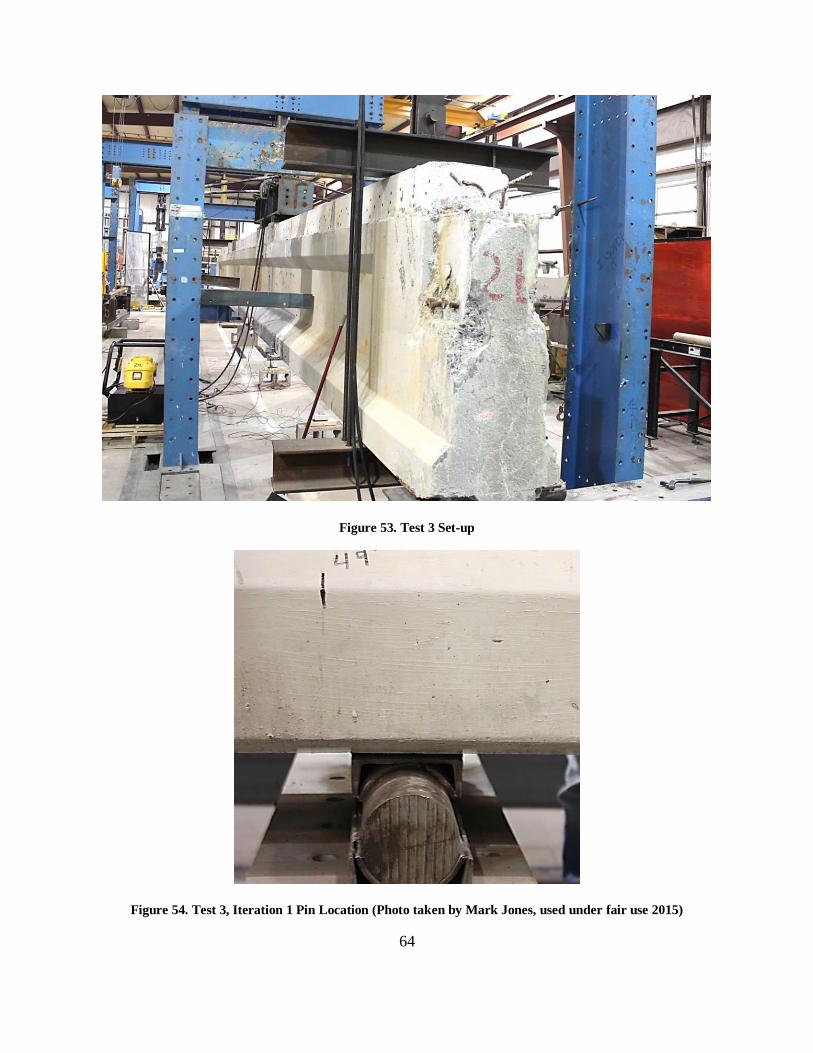
64
Figure 53. Test 3 Set-up
Figure 54. Test 3, Iteration 1 Pin Location (Photo taken by Mark Jones, used under fair use 2015)
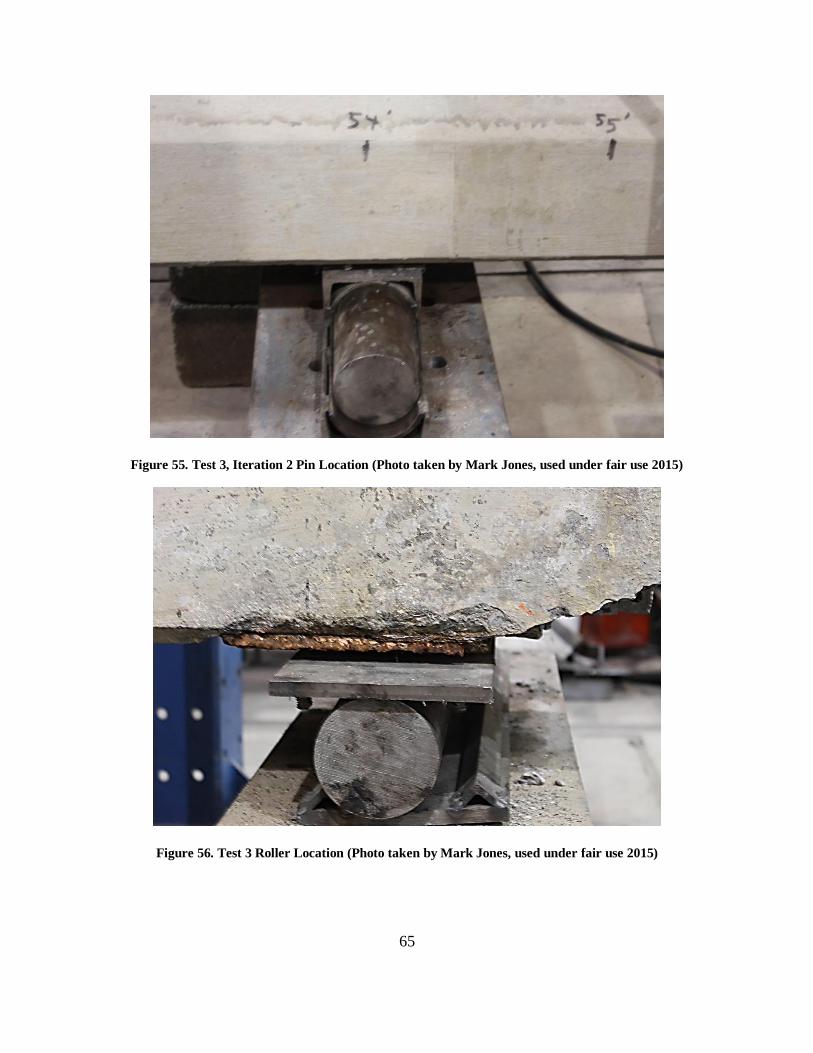
65
Figure 55. Test 3, Iteration 2 Pin Location (Photo taken by Mark Jones, used under fair use 2015)
Figure 56. Test 3 Roller Location (Photo taken by Mark Jones, used under fair use 2015)

66
Figure 57. Test 3 Load Point
Data was continuously recorded using a high speed data acquisition system. Figure 58
shows the instrumentation layout along the length of the girder for the first iteration and Figure
59 shows the instrumentation layout along the length of the girder for the second iteration. Three
wire pots were attached to the bottom of the girder to measure vertical deflection during the test.
A fourth wire pot was attached to the side of the girder at the load point to measure any lateral
movement. Two MLVDTs and six strain transducers were used to record a strain profile during
the test. They were all placed directly under the centerline of the load point. One MLVDT was
placed on either side of the bottom flange for the girder at 2 in from the bottom to try to measure
the associated strain of the bottom prestress strand while the girder was still in the elastic range
and strain compatibility could be assumed between the concrete and the strand. The strain
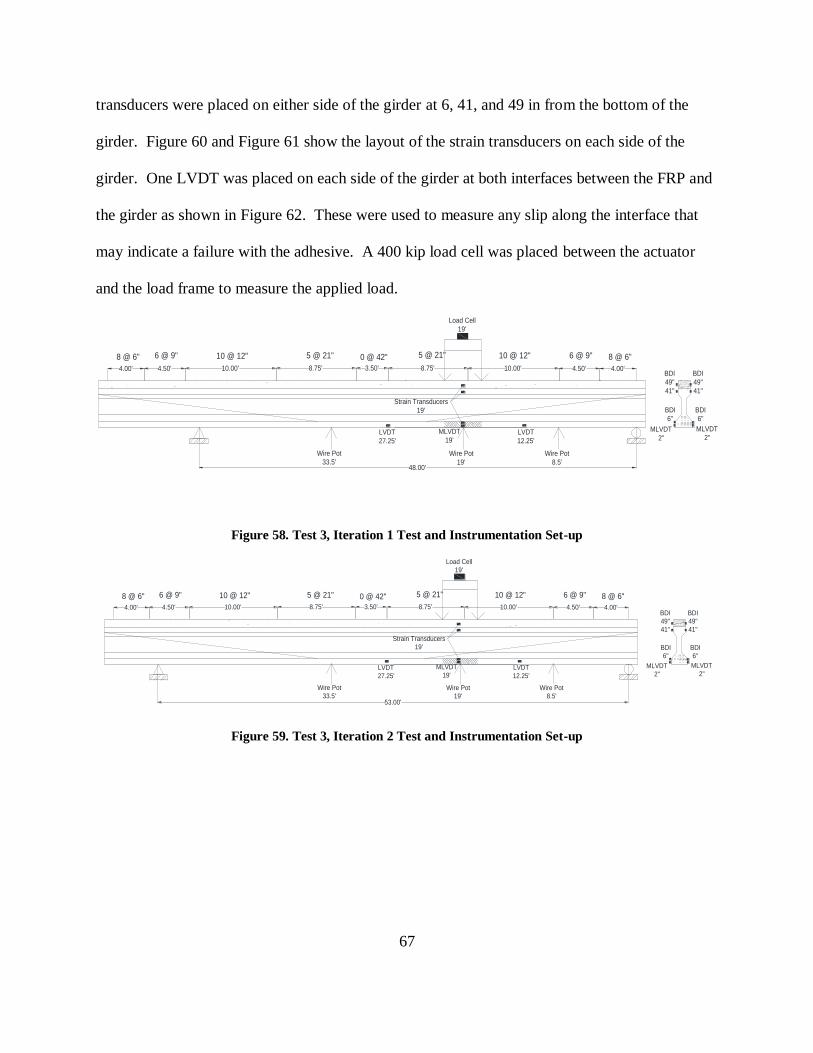
67
transducers were placed on either side of the girder at 6, 41, and 49 in from the bottom of the
girder. Figure 60 and Figure 61 show the layout of the strain transducers on each side of the
girder. One LVDT was placed on each side of the girder at both interfaces between the FRP and
the girder as shown in Figure 62. These were used to measure any slip along the interface that
may indicate a failure with the adhesive. A 400 kip load cell was placed between the actuator
and the load frame to measure the applied load.
48.00'
8 @ 6"6 @ 9"10 @ 12"5 @ 21"
4.00'4.50'10.00'8.75'
8 @ 6"
4.00'
6 @ 9"
4.50'
10 @ 12"
10.00'
5 @ 21"
8.75' 3.50'
0 @ 42"
Load Cell
19'
Wire Pot
33.5'
Wire Pot
19'
Wire Pot
8.5'
MLVDT
19'
Strain Transducers
19'
LVDT
12.25'
LVDT
27.25'
BDI
49"
41"
BDI
49"
41"
MLVDT
2"
MLVDT
2"
BDI
6"
BDI
6"
Figure 58. Test 3, Iteration 1 Test and Instrumentation Set-up
53.00'
8 @ 6"6 @ 9"10 @ 12"5 @ 21"
4.00'4.50'10.00'8.75'
8 @ 6"
4.00'
6 @ 9"
4.50'
10 @ 12"
10.00'
5 @ 21"
8.75' 3.50'
0 @ 42"
Load Cell
19'
Wire Pot
33.5'
Wire Pot
19'
Wire Pot
8.5'
MLVDT
19'
Strain Transducers
19'
LVDT
12.25'
LVDT
27.25'
BDI
49"
41"
BDI
49"
41"
MLVDT
2"
MLVDT
2"
BDI
6"
BDI
6"
Figure 59. Test 3, Iteration 2 Test and Instrumentation Set-up

68
Figure 60. Strain Transducers on Damaged/Repaired Side of Girder (Photo taken by Ioannis Koutromanos,
used under fair use 2015)
Figure 61. Strain Transducers on Undamaged Side of Girder
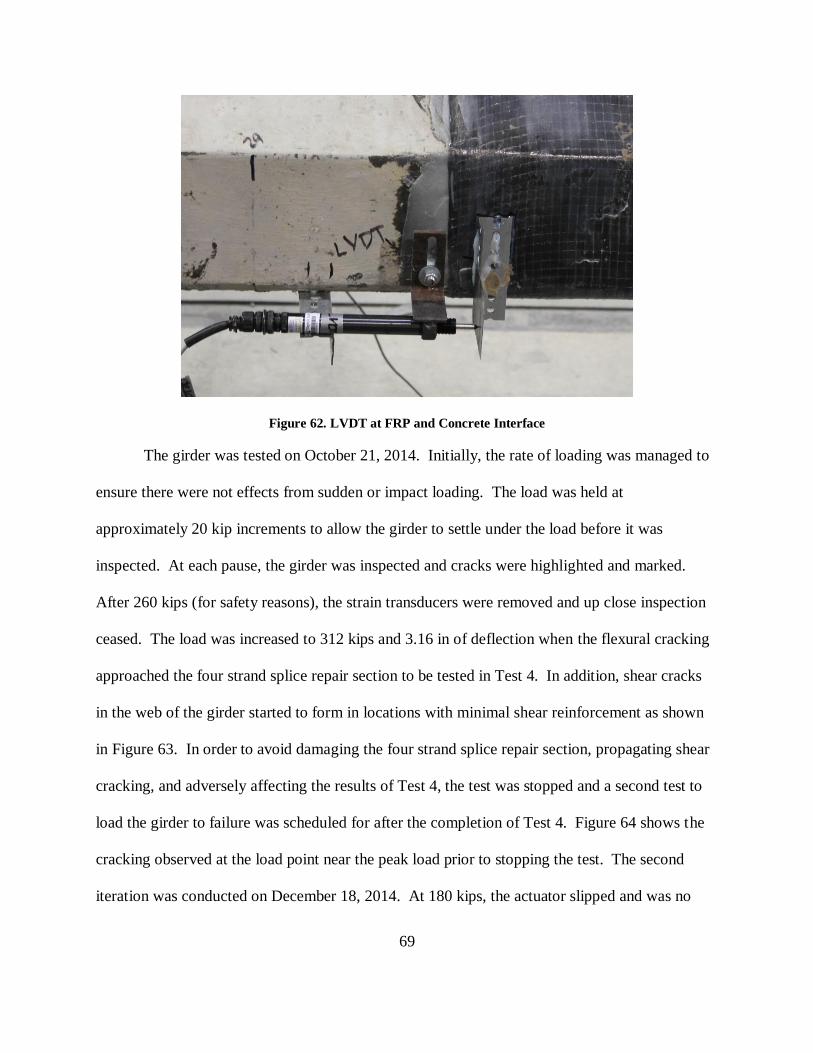
69
Figure 62. LVDT at FRP and Concrete Interface
The girder was tested on October 21, 2014. Initially, the rate of loading was managed to
ensure there were not effects from sudden or impact loading. The load was held at
approximately 20 kip increments to allow the girder to settle under the load before it was
inspected. At each pause, the girder was inspected and cracks were highlighted and marked.
After 260 kips (for safety reasons), the strain transducers were removed and up close inspection
ceased. The load was increased to 312 kips and 3.16 in of deflection when the flexural cracking
approached the four strand splice repair section to be tested in Test 4. In addition, shear cracks
in the web of the girder started to form in locations with minimal shear reinforcement as shown
in Figure 63. In order to avoid damaging the four strand splice repair section, propagating shear
cracking, and adversely affecting the results of Test 4, the test was stopped and a second test to
load the girder to failure was scheduled for after the completion of Test 4. Figure 64 shows the
cracking observed at the load point near the peak load prior to stopping the test. The second
iteration was conducted on December 18, 2014. At 180 kips, the actuator slipped and was no

70
longer exerting a consistent vertical force on the girder. A frame to hold the actuator level used
in the second iteration of Test 4 was used to try to keep the actuator from slipping. The frame is
shown in Figure 65. After the third attempt to load the girder to failure, the concrete in the
constant moment region between the load points showed evidence indicating a flexural
compression failure similar to Test 4 and the test was determined to be complete.
Figure 63. Shear Cracking in Midspan Region during Iteration 1 (Photo taken by Ioannis Koutromanos, used
under fair use 2015)

71
Figure 64. Cracking Near Peak Load for Iteration 1 (Photo taken by Ioannis Koutromanos, used under fair
use 2015)
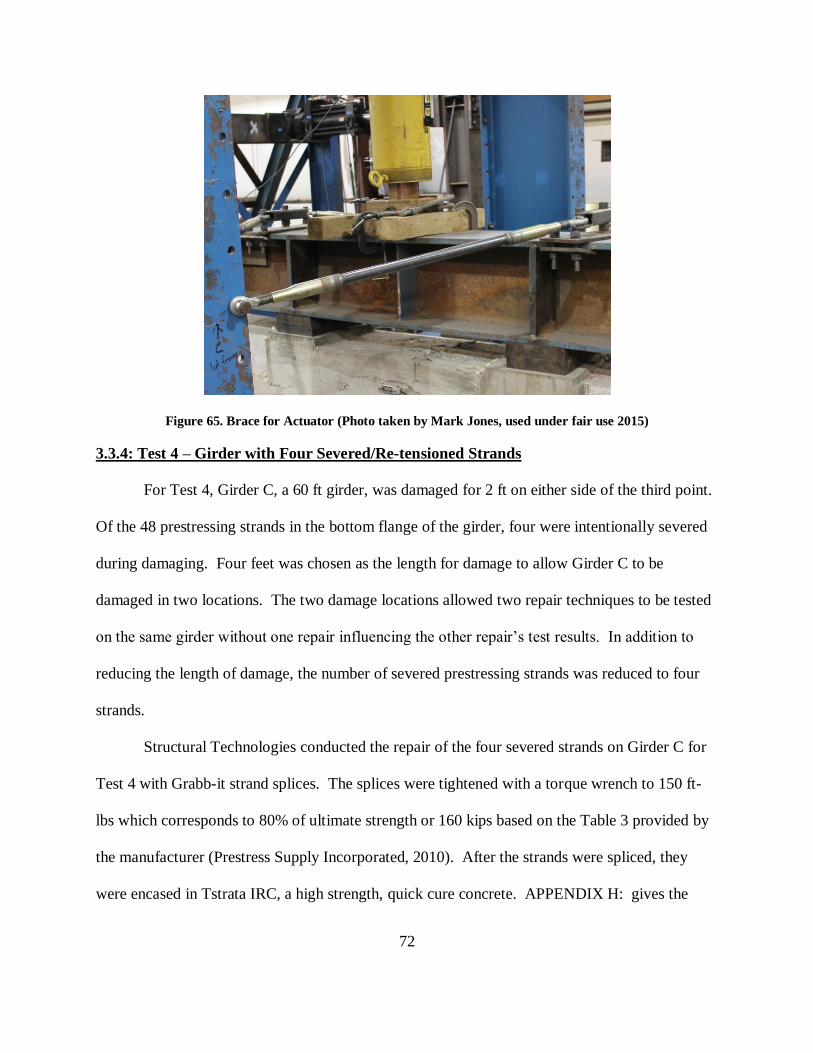
72
Figure 65. Brace for Actuator (Photo taken by Mark Jones, used under fair use 2015)
3.3.4: Test 4 – Girder with Four Severed/Re-tensioned Strands
For Test 4, Girder C, a 60 ft girder, was damaged for 2 ft on either side of the third point.
Of the 48 prestressing strands in the bottom flange of the girder, four were intentionally severed
during damaging. Four feet was chosen as the length for damage to allow Girder C to be
damaged in two locations. The two damage locations allowed two repair techniques to be tested
on the same girder without one repair influencing the other repair’s test results. In addition to
reducing the length of damage, the number of severed prestressing strands was reduced to four
strands.
Structural Technologies conducted the repair of the four severed strands on Girder C for
Test 4 with Grabb-it strand splices. The splices were tightened with a torque wrench to 150 ft-
lbs which corresponds to 80% of ultimate strength or 160 kips based on the Table 3 provided by
the manufacturer (Prestress Supply Incorporated, 2010). After the strands were spliced, they
were encased in Tstrata IRC, a high strength, quick cure concrete. APPENDIX H: gives the

73
repair procedures followed for the repair concrete. APPENDIX I: Installation of Strand Splices
gives the repair procedures followed for the strand splices.
Two iterations of Test 4 were conducted. During the first iteration, the actuator slipped
longitudinally in relation to the girder. For the second iteration, the span length was decreased to
reduce the curvature of the beam at the load point and reduce the potential of the actuator
slipping. In order to develop the plan for the test set-up and decrease the probability of a shear
failure while ensuring the desired flexural failure, the girder nominal moment and shear
capacities were determined using the provisions of AASHTO LRFD Bridge Design
Specifications (American Association of State Highway and Transportation Officials, 2012) and
the tested girder material properties (Jones, 2015).
The nominal moment capacity of this girder at the points of load application was 2660 k-
ft. This corresponds to a load of 187 kips for iteration 1 and 216 kips for iteration 2. Figure 66
shows the nominal moment capacity of Girder C and the maximum calculated moment resulting
from a load of 187 kips for iteration 1. Figure 68 shows the nominal moment capacity of Girder
C and the maximum calculated moment resulting from a load of 216 kips. Figure 67 shows the
absolute values of the nominal shear capacity of Girder B and the maximum calculated shear
force resulting from a load of 187 kips. Figure 69 shows the absolute values of the nominal
shear capacity of Girder B and the maximum calculated shear force resulting from a load of 216
kips. Other loading arrangements were investigated, however this loading arrangement was
chosen to minimize the potential for a shear failure since the desired failure mode was flexural.
In addition, it minimized the potential for slipping from the actuator (Jones, 2015).

74
Figure 66. Nominal Moment Capacity versus Calculated Failure Moment for Test 4, Iteration 1
Figure 67. Nominal Shear Capacity versus Calculated Shear for Test 4, Iteration 1
0
500
1000
1500
2000
2500
3000
0 10 20 30 40 50 60
Mo
men
t, k
-ft
Length along girder, ft
Nominal Moment Capacity Calculated Failure Moment
0
50
100
150
200
250
300
350
400
450
0 10 20 30 40 50 60
Fo
rce,
kip
s
Length along girder, ft
Nominal Shear Capacity Calculated Shear Force at Failure
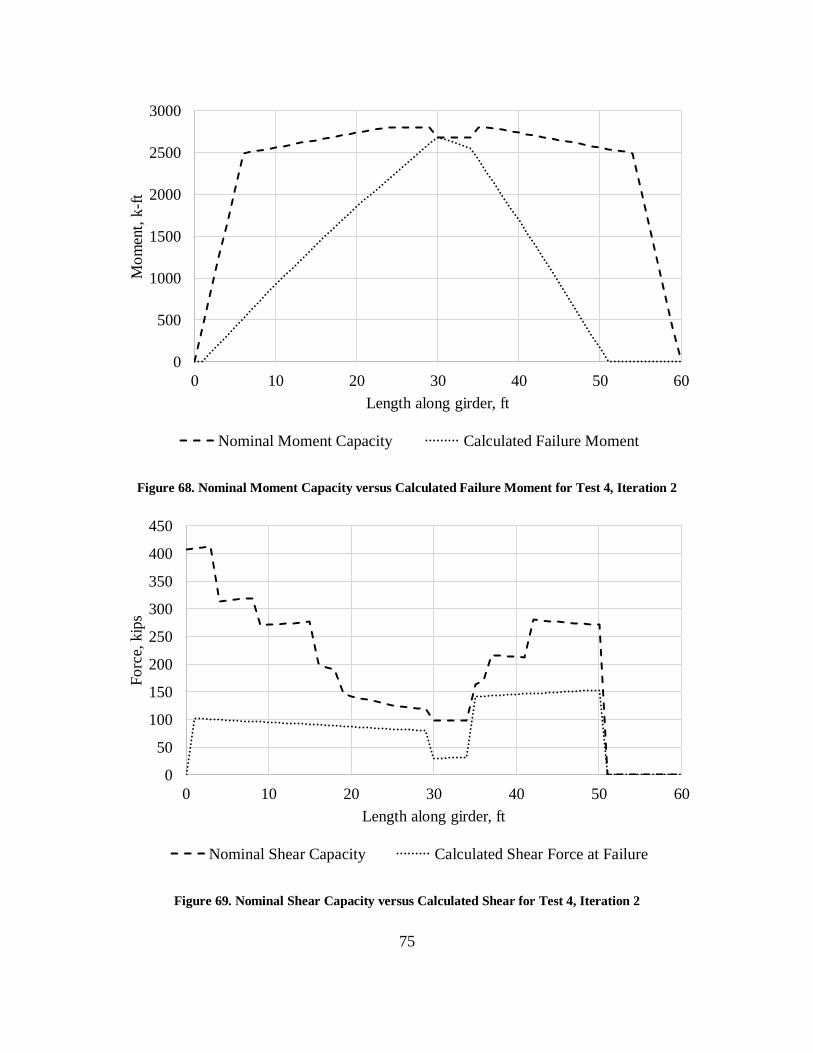
75
Figure 68. Nominal Moment Capacity versus Calculated Failure Moment for Test 4, Iteration 2
Figure 69. Nominal Shear Capacity versus Calculated Shear for Test 4, Iteration 2
0
500
1000
1500
2000
2500
3000
0 10 20 30 40 50 60
Mo
men
t, k
-ft
Length along girder, ft
Nominal Moment Capacity Calculated Failure Moment
0
50
100
150
200
250
300
350
400
450
0 10 20 30 40 50 60
Fo
rce,
kip
s
Length along girder, ft
Nominal Shear Capacity Calculated Shear Force at Failure

76
Test 4 was a flexural test of a 60 ft girder conducted in two iterations with a 58 ft simple
span length for the first iteration and a 50 ft simple span length for the second iteration. The
girder was supported on two W21x101 steel sections with a pin bearing placed on one steel
section and a roller bearing placed on the other. The original sole bearing plates on the girder
were placed on top of the bearings for the first iteration. For the second iteration, rubber pads
were placed between the roller bearing and the bottom of the girder. Figure 70 shows the
location of the roller for the first iteration. Figure 71 shows the location of the roller for the
second iteration. Figure 72 shows the location of the pin for both iterations. Two frames were
used to prohibit the girder from tipping from lateral deflection during the test. A third frame was
used to hold a 400 kip hydraulic actuator above the load points. The actuator exerted a force on
a 6 ft long steel spreader beam that translated the load into a constant moment region between
the two load points. The load points were chosen so all of the repaired strand sections and splice
chucks within the constant moment region. During this iteration, the curvature of the girder
caused the actuator to appear that it would slip out of plumb. In order to reduce the impact of the
curvature, the span length was decreased from 58 ft to 50 ft for the second iteration by moving
the roller bearing 8 ft closer to the pin.

77
Figure 70. Test 4, Iteration 1 Roller Location (Photo taken by Mark Jones, used under fair use 2015)
Figure 71. Test 4, Iteration 2 Roller Location (Photo taken by Mark Jones, used under fair use 2015)

78
Figure 72. Test 4 Pin Location (Photo taken by Mark Jones, used under fair use 2015)
Data was continuously recorded using a high speed data acquisition system. Figure 73
shows the instrumentation layout for the first iteration. Figure 74 shows the instrumentation
layout for the second iteration. Three wire pots were attached to the bottom of the girder to
measure vertical deflection during the test. A fourth wire pot was attached to the side of the
girder at the load point to measure any lateral movement. Two MLVDTs and six strain
transducers were used to record a strain profile during the test. They were all placed directly
under the centerline of the load point. One MLVDT was placed on either side of the bottom
flange of the girder at 2 in from the bottom to try to measure the associated strain of the bottom
prestress strand while the girder was still in the elastic range and strain compatibility could be
assumed between the concrete and the strand. The strain transducers were placed on either side
of the girder at 41 and 49 in from the bottom of the girder. One strain transducer was placed at 6
in from the bottom of the girder on the near side of the girder and one was placed at 4 in from the
bottom of the girder. These were offset due to damage to the surface of the girder that did not
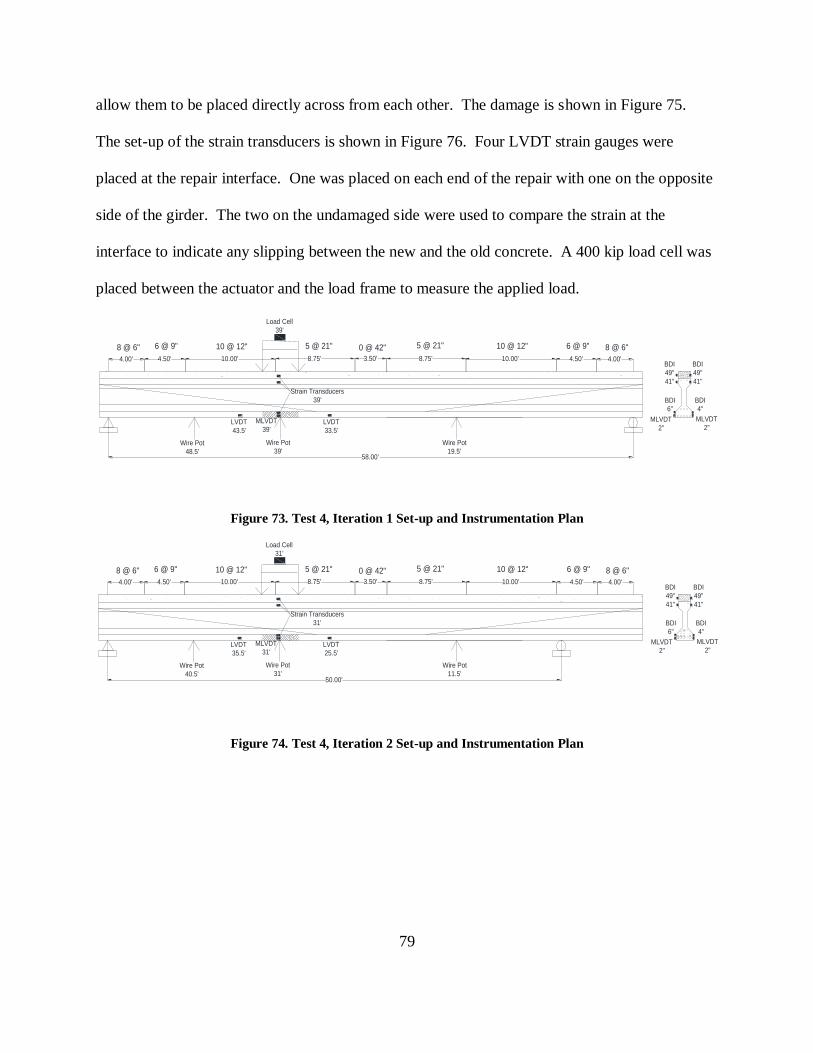
79
allow them to be placed directly across from each other. The damage is shown in Figure 75.
The set-up of the strain transducers is shown in Figure 76. Four LVDT strain gauges were
placed at the repair interface. One was placed on each end of the repair with one on the opposite
side of the girder. The two on the undamaged side were used to compare the strain at the
interface to indicate any slipping between the new and the old concrete. A 400 kip load cell was
placed between the actuator and the load frame to measure the applied load.
58.00'
8 @ 6"6 @ 9"10 @ 12"5 @ 21"
4.00'4.50'10.00'8.75'
8 @ 6"
4.00'
6 @ 9"
4.50'
10 @ 12"
10.00'
5 @ 21"
8.75' 3.50'
0 @ 42"
Load Cell
39'
Wire Pot
39'
MLVDT
39'
Strain Transducers
39'
LVDT
33.5'
LVDT
43.5'
Wire Pot
48.5'
Wire Pot
19.5'
BDI
49"
41"
BDI
49"
41"
MLVDT
2"
MLVDT
2"
BDI
4"
BDI
6"
Figure 73. Test 4, Iteration 1 Set-up and Instrumentation Plan
50.00'
8 @ 6"6 @ 9"10 @ 12"5 @ 21"
4.00'4.50'10.00'8.75'
8 @ 6"
4.00'
6 @ 9"
4.50'
10 @ 12"
10.00'
5 @ 21"
8.75' 3.50'
0 @ 42"
Load Cell
31'
Wire Pot
31'
MLVDT
31'
Strain Transducers
31'
LVDT
25.5'
LVDT
35.5'
Wire Pot
40.5'
Wire Pot
11.5'
BDI
49"
41"
BDI
49"
41"
MLVDT
2"
MLVDT
2"
BDI
4"
BDI
6"
Figure 74. Test 4, Iteration 2 Set-up and Instrumentation Plan

80
Figure 75. Damage on Girder near Strain Transducer Location (Photo taken by Ioannis Koutromanos, used
under fair use 2015)
Figure 76. Strain Transducer Set-up Below Load Point
81
The girder was tested on 20 November 2014. Initially, the rate of loading was managed
to ensure there were not effects from sudden or impact loading. The load was held at
approximately 25 kip increments to allow the girder to settle under the load before it was
inspected. At each pause, the girder was inspected and cracks were highlighted and marked.
This pace of loading was used from 0 to 100 kips of total load. The load increment between
pauses for inspection was decreased to 20 kips from 100 to 180 kips of total load. After 200 kips
(for safety reasons), close visual inspection and marking of cracks ceased. The load increment
between pauses was decreased to 10 kips. During pauses, inspections were made from a safe
distance to see if there were any early indications of failure or safety issues. The load was
increased to 241 kips and 4.12 in of deflection when the actuator appeared as though it would
slip out of plumb with the girder. The span length was decreased to reduce the curvature of the
beam when loaded. In addition, a frame was constructed to hold the piston in place so it would
continue to impose a downward force throughout the test. A second test was conducted on 25
November 2014. The load was increased at 50 kip increments until it reached 200 kips of total
load. It was then increased at 10 kip increments to allow for visual inspection of the actuator for
signs of slip. At 265 kips, the concrete in the constant moment region between the load points
crushed resulting in a flexural compression failure.

82
CHAPTER IV: Results and Discussion
4.1: Introduction
This section compares the tested and calculated data from the reported tests. The
cracking and failure moments for each test are evaluated and compared to predictions of the
girder’s behavior using AASHTO calculations, a moment-curvature diagram, and non-linear
finite element modeling. In addition, it looks at how well the strand splices and FRP repairs to
restore the girders strength is investigated.
4.2: Material Properties
4.2.1: Girder Concrete
Table 7 summarizes the failure loads, compressive strengths, and average compressive
strength of the cores collected from the girder and the deck. Table 8 summarizes the failure
loads, tensile strength, and average tensile strength of the cores collected from the girder. The
average compressive strength in the girder was 6,650 psi, which is greater than 5,000 psi as
required by the bridge plans which are provided in APPENDIX A: Arcadia Bridge Blueprints.
The average compressive strength in the deck was 6,020 psi, which is greater than the typical
required bridge deck concrete compressive strength of 4,000 psi. The average tensile strength
was 424 psi. Figure 77 shows the concrete core sample after the tensile splitting test.
Table 7. Girder and Deck Concrete Compressive Strength
Sample Cylinder # Load (lbs) Diameter (in) Area (in2) Strength (psi) Average (psi)
Girder 1 39,000 2.75 5.94 6570
6650 2 40,000 2.75 5.94 6730
Deck 3 35,000 2.75 5.94 5890
6020 4 36,500 2.75 5.94 6150

83
Table 8. Girder Concrete Tensile Strength
Cylinder # Load (lbs) Diameter (in) Length (in) Strength
(psi)
Average
(psi)
5 7,500 2.75 4.50 386 424
6 10,000 2.75 5.00 463
Figure 77. Girder Concrete Tensile Test
4.2.2: Tstrata IRC Repair Concrete
Table 9 summarizes the failure loads, compressive strength, and average compressive
strength for the cylinders collected from the repair concrete. The average compressive strength
at 24 hours was 4,060 psi, which does not meet the advertised design strength of 4500 psi
(Structural Group Incorporated, 2015). The average compressive strength was 5,730 psi at 48
hours. The design strength for 48 hours was not advertised. The average compressive strength

84
was 6,250 psi at 7 days, which does not meet the advertised design strength of 7700 psi
(Structural Group Incorporated, 2015).
Table 9. Repair Concrete Compressive Strength
Cylinder #
Test
Age
(days)
Load
(kips)
Diameter
(in)
Area
(in2)
Strength
(psi)
Average
(psi)
Design
(psi)
1 24 hr
45 4 12.6 3580 4060 4500
2 57 4 12.6 4540
3 48 hr
69 4 12.6 5490 5730 -
4 75 4 12.6 5970
5 7 day
82 4 12.6 6530 6250 7700
6 75 4 12.6 5970
4.2.3: Girder Reinforcement
Table 10 summarizes the failure loads, tensile strengths, and average tensile strength of
the reinforcing steel samples collected from the girder. The average tensile strength was 78.5
ksi. The average failure tensile strength is consistent with grade 40 reinforcing steel (Nilson,
1987). Figure 78 shows the stress strain relationships for both tests.
Table 10. Reinforcing Bar Failure Tensile Strength
Bar # Load
(kips)
Diameter
(in)
Area
(in2)
Yield
(ksi)
Average
Yield
(ksi)
Strength (ksi)
Average
Strength
(ksi)
1 16,000 0.5 0.20 52.3 49.3
81.4 78.5
2 14,900 0.5 0.20 46.2 75.6

85
Figure 78. Reinforcing Bar Stress Strain Relationship
4.2.4: Prestressing Strand
Table 11 summarizes the failure loads, tensile strengths, and average tensile strength of
the prestressing strand samples collected from the girder. The average tensile strength was 262
ksi. The average tensile strength indicates 250 grade prestressing strands (Nilson, 1987) which is
consistent with the bridge plans shown in APPENDIX A: Arcadia Bridge Blueprints. Figure 79
shows the failure of the prestress strand with one wire rupturing. Figure 81 shows the stress
strain relationship from the prestress strand tensile tests and the bilinear approximation used
during analytical analysis.
0
10
20
30
40
50
60
70
80
90
0 0.05 0.1 0.15 0.2 0.25 0.3
Str
ess
(ksi
)
Strain (in/in)
Bar #1 Bar #2

86
Table 11. Prestress Strand Strength
Strand # Load (lbs) Diameter
(in)
Area
(in2)
Yield
(ksi)
Average
Yield
(ksi)
Strength (ksi)
Average
Strength
(ksi)
1 20,500 0.375 0.08 218 214
257 262
2 21,400 0.375 0.08 210 267
Figure 79. Prestress Tensile Test Strand Rupture (Photo taken by Mark Jones, used under fair use 2015)
Table 12 summarizes the initial length, change in length, strain, and effective prestress
force for each strand from the effective prestress tests. As discussed, the results of the second,
third, fourth, and sixths strands indicate that the extensometer slipped. When averaging only the
first and fifth strands, the effective prestress force was 132 ksi. Using AASHTO equation
5.9.5.3-1 to estimate time-dependent losses, the approximate effective prestress force after losses
is 143 ksi. The calculated result of 132 ksi is within 8 % of the stress calculated using the
AASHTO approximation.
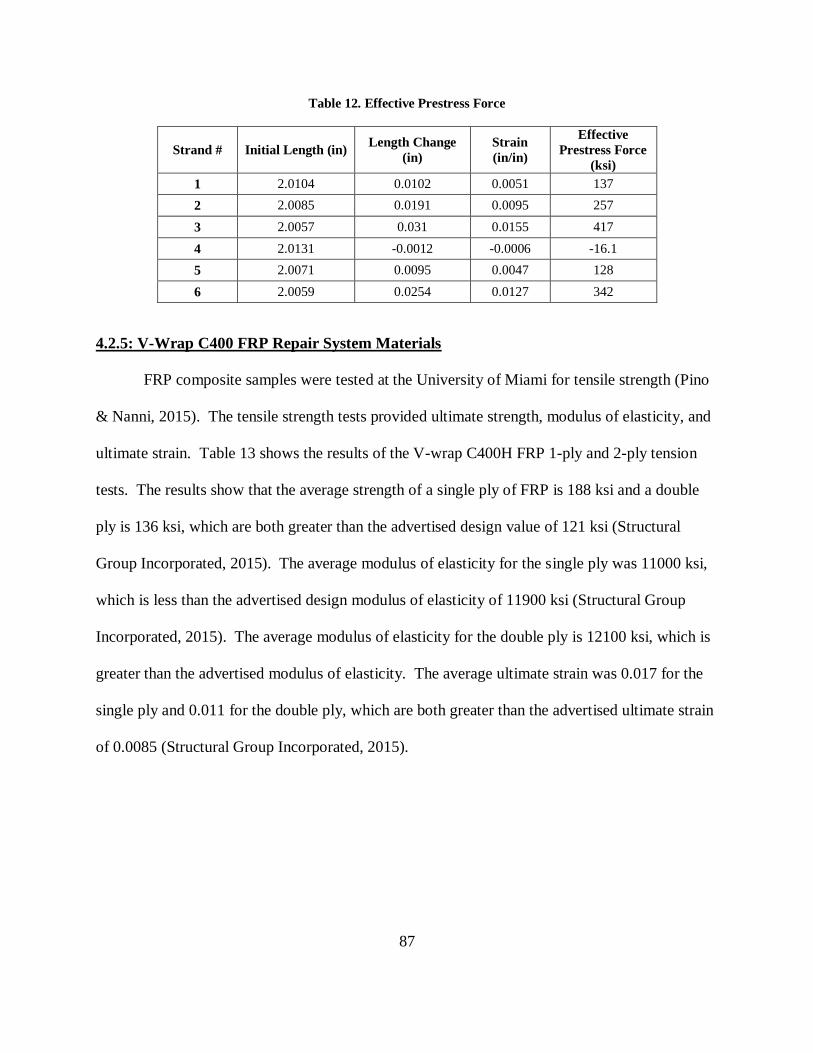
87
Table 12. Effective Prestress Force
Strand # Initial Length (in) Length Change
(in)
Strain
(in/in)
Effective
Prestress Force
(ksi)
1 2.0104 0.0102 0.0051 137
2 2.0085 0.0191 0.0095 257
3 2.0057 0.031 0.0155 417
4 2.0131 -0.0012 -0.0006 -16.1
5 2.0071 0.0095 0.0047 128
6 2.0059 0.0254 0.0127 342
4.2.5: V-Wrap C400 FRP Repair System Materials
FRP composite samples were tested at the University of Miami for tensile strength (Pino
& Nanni, 2015). The tensile strength tests provided ultimate strength, modulus of elasticity, and
ultimate strain. Table 13 shows the results of the V-wrap C400H FRP 1-ply and 2-ply tension
tests. The results show that the average strength of a single ply of FRP is 188 ksi and a double
ply is 136 ksi, which are both greater than the advertised design value of 121 ksi (Structural
Group Incorporated, 2015). The average modulus of elasticity for the single ply was 11000 ksi,
which is less than the advertised design modulus of elasticity of 11900 ksi (Structural Group
Incorporated, 2015). The average modulus of elasticity for the double ply is 12100 ksi, which is
greater than the advertised modulus of elasticity. The average ultimate strain was 0.017 for the
single ply and 0.011 for the double ply, which are both greater than the advertised ultimate strain
of 0.0085 (Structural Group Incorporated, 2015).
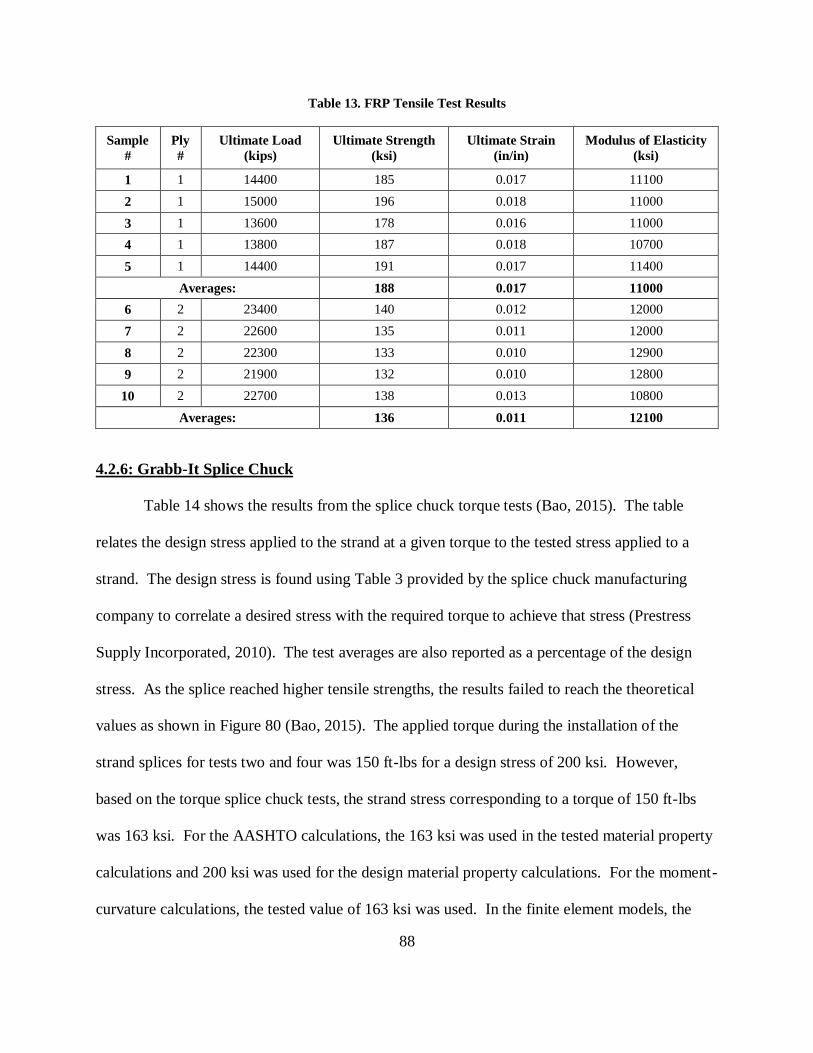
88
Table 13. FRP Tensile Test Results
Sample
#
Ply
#
Ultimate Load
(kips)
Ultimate Strength
(ksi)
Ultimate Strain
(in/in)
Modulus of Elasticity
(ksi)
1 1 14400 185 0.017 11100
2 1 15000 196 0.018 11000
3 1 13600 178 0.016 11000
4 1 13800 187 0.018 10700
5 1 14400 191 0.017 11400
Averages: 188 0.017 11000
6 2 23400 140 0.012 12000
7 2 22600 135 0.011 12000
8 2 22300 133 0.010 12900
9 2 21900 132 0.010 12800
10 2 22700 138 0.013 10800
Averages: 136 0.011 12100
4.2.6: Grabb-It Splice Chuck
Table 14 shows the results from the splice chuck torque tests (Bao, 2015). The table
relates the design stress applied to the strand at a given torque to the tested stress applied to a
strand. The design stress is found using Table 3 provided by the splice chuck manufacturing
company to correlate a desired stress with the required torque to achieve that stress (Prestress
Supply Incorporated, 2010). The test averages are also reported as a percentage of the design
stress. As the splice reached higher tensile strengths, the results failed to reach the theoretical
values as shown in Figure 80 (Bao, 2015). The applied torque during the installation of the
strand splices for tests two and four was 150 ft-lbs for a design stress of 200 ksi. However,
based on the torque splice chuck tests, the strand stress corresponding to a torque of 150 ft-lbs
was 163 ksi. For the AASHTO calculations, the 163 ksi was used in the tested material property
calculations and 200 ksi was used for the design material property calculations. For the moment-
curvature calculations, the tested value of 163 ksi was used. In the finite element models, the

89
design value of 200 ksi was used. The AASHTO calculations were completed with both values
to compare the nominal moment using design values to the tested moment in the event actual
material properties cannot be determined through testing. In addition, the calculations were done
with the tested values to compare the accuracy of the equations to the tested values. Table 15
shows the results from the tensile tests on the spliced strand. In all three test, the strands failed
prior to the splice chuck. In addition, the strand used for these tests was 270 grade prestressing
strands while the strands tested in the girder were 250 grade. Based on these results, the strands
should fail in tension before the splice chuck (Bao, 2015). The effective stress provided by the
splice chuck as tested is lower than the design stress. The lower stress would lower the cracking
moment and allow cracks to form earlier which could increase the potential for corrosion.
Table 14. Strand Splice Chuck Torque Test Results
Torque
(ft-lbs)
Test 1
(ksi)
Test 2
(ksi)
Test 3
(ksi)
Average
(ksi)
Design
(ksi)
% Average
Tested vs.
Design
40 57 69 78 68 54 127
50 68 87 86 80 67 120
75 87 101 110 99 101 99
100 114 126 130 123 134 92
125 130 144 145 140 168 83
150 145 172 171 163 200 81

90
Figure 80. Strand Splice Torque-Tension Relationship
Table 15. Spliced Strand Tension Test
Test # Load (lbs)
Length
Chuck-to-Chuck
(ft)
Stress
(ksi) Failure
1 23300 16 291 Strand Fracture
2 22800 6 285 Strand Fracture
3 24000 4 299 Strand Fracture
Average: 23300 292
0
50
100
150
200
250
0 20 40 60 80 100 120 140 160
Str
and
Str
ess
(ksi
)
Applied Torque (ft-lbs)
Test 1 Test 2 Test 3 Average Design
App
lied
To
rqu
e
Design Stress at Applied Torque
Average Tested Stress at Applied Torque
150
163
200
91
4.3: Analytical Modeling
4.3.1: Calculations Based on AASHTO Guidelines
This method for calculated nominal moment capacity of prestressed concrete bridge
girders presented in AASHTO (American Association of State Highway and Transportation
Officials, 2012) uses equilibrium across the girder cross section to determine the neutral axis
depth and the resulting forces in the concrete and in the strands. The force in the strands is
assumed to act at a single location at the strand centroid and is calculated using AASHTO
equation 5.7.3.1.1-1. The compression force in the concrete was determined using a rectangular
approximation of the stress distribution. Once the neutral axis was determined, the nominal
moment was calculated using AASHTO equation 5.7.3.2.2-1. The cracking moment was
calculated using AASHTO equation 5.7.3.3.2-1. Table 16 summarizes the cracking and nominal
moments. The equations used in the AASHTO nominal and cracking moments are found in
APPENDIX B: AASHTO Calculations.
The design values given in the original bridge plans of 5,000 psi for the concrete in the
girder and 4,000 psi for the concrete in the deck were used to calculate the design nominal
moment capacity. In addition, the nominal moment capacity was calculated based on tested
material properties of 6650 psi for the concrete in the girder and 6020 psi for the concrete in the
deck. The tensile strength of the concrete in the girder used for calculations was the tested value
of 424 psi. To calculate the effective prestress force, the results of the effective prestress tests
one and five were averaged based on the inconclusive results obtained from the other tests. This
gave an effective prstress force of 132 ksi. The tested average of 163 ksi was used to predict the
effective prestress restored by the strand splice. The prestressing ultimate strength for
calculations was based on the tested ultimate strength of 262 ksi. The values for the FRP
92
composite system used in the calculations were based on the tested values for double ply samples
of 12100 ksi for the modulus of elasticity, 0.011 in/in as the ultimate strain, and 136 ksi as the
ultimate strength.
In order to simulate the damage to the girder for tests two, three, and four, the total area
of prestress strands was reduced by the number of severed strands associated with that test at the
damaged area of the girder. This reduced the effective prestress force where the strands had
been severed. Next, to simulate the repair, the effective strengths were added back in as an
additional tensile force. For the strand splices (tests two and four), the ultimate and yield stresses
in the spliced strands were calculated as a weighted average. During strand splice testing, the
strands failed prior to the splice chucks, therefore, the calculations using tested properties
assumed 100% of the ultimate and yield stresses of 262 ksi and 242 ksi. For the design values,
the ultimate stress was approximated at 90%, or 225ksi, based on manufacturing tables as
presented in Table 3 (Prestress Supply Incorporated, 2010).
For Test 3, the FRP was modeled as additional tensile reinforcement. In order to
determine the neutral axis, the tested ultimate stress for 2-ply of 136 ksi was used in the tested
material properties calculations and design ultimate stress of 121 ksi was used in the design
material properties calculations. In order to calculate the effective force in the FRP at failure, the
strain in the fabric was calculated by relating it proportionally to the additional strain in the
prestressing strand at failure and the neutral axis. The initial strain in the strand was calculated
to be 0.00489 in the moment-curvature calculations and was subtracted from the yield strain of
0.01 to calculate the change in strain in the FRP. The tested modulus of elasticity of 12,100 ksi
was used to determine the stress in the fabric and the tensile force in the tested calculations and

93
the design modulus of 11,900 ksi was used in the design calculations. Example calculations are
presented in APPENDIX B: AASHTO Calculations.
Table 16. AASHTO Mn Calculation Summary
Test Description # Severed
Strands
L
(ft)
Design Material Properties Tested Material Properties
Mcr,AASHTO
(k-ft)
Mn,AASHTO
(k-ft)
Mcr,AASHTO
(k-ft)
Mn,AASHTO
(k-ft)
1 Control Test 0 35 1780 2720 1770 3260
2 8-Strand
Spliced 8 58 181 2380 181 3060
3,
Iteration 1 4-Severed
Strands
with FRP
4
48
201 2960 201 3540 3,
Iteration 2 53
4,
Iteration 1 4-Strand
Spliced 4
58
189 2350 189 3030 4,
Iteration 2 50
4.3.2: Moment-Curvature Based on Strain Compatibility
In order to predict the complete load cycle, a moment-curvature analysis of each girder
was performed (Michael, 2010). The analysis included six points: no applied moment,
decompression of concrete around strand, first flexural cracking, top concrete fiber strain of
0.0015 in/in, prestress strand yield strain of 0.009 in/in, and top concrete fiber strain of 0.003
in/in. The failure mode assumed for each scenario was concrete crushing. The strand tensile
stress strain behavior used in these calculations is given in Figure 81. The idealized stress-strain
diagram was developed by Gangi (2015) and used in the finite element modeling as a bilinear
approximation of the stress-strain results obtained during the prestress strand tests (Gangi, 2015).
For the concrete stress versus strain relationship, the modified Hognestad model was used
(Hognestad, 1956). Asymmetrical bending was not considered in these calculations. Biaxial
bending analysis determined that the strand centroid moved laterally 1.6 in when eight strands
94
were severed and 0.77 in when four strands were severed. In addition, each strand provided
approximately two percent of the prestress force and when compared to the overall load, the load
from the individual strands was relatively small. The nominal capacity of the girders when
accounting for biaxial bending changed from 2390 k-ft to 2260 k-ft for the eight strand splice
which is a difference of less than 6%. Because of the relatively small change in nominal
capacity between the uniaxial and biaxial loading cases, biaxial bending was not considered.
Example moment-curvature calculations are found in APPENDIX C: Strain-
Compatibility Moment-Curvature Calculations. The nominal moment capacity was calculated
based on tested material properties of 6650 psi for the concrete in the girder and 6020 psi for the
concrete in the deck. The tensile strength of the concrete in the girder used for calculations was
the tested value of 424 psi. To calculate the effective prestress force, the results of the effective
prestress tests one and five were averaged based on the inconclusive results obtained from the
other tests. This gave an effective prstress force of 132 ksi. The tested average of 163 ksi was
used to predict the effective prestress restored by the strand splice. The prestressing ultimate
strength for calculations was based on the tested ultimate strength of 262 ksi. The values for the
FRP composite system used in the calculations was based on the tested values for double ply
samples of 12100 ksi for the modulus of elasticity, 0.011 in/in as the ultimate strain, and 136 ksi
as the ultimate strength.
Table 17 summarizes the results of the nominal moment calculated using moment-
curvature. It shows the moments for the damaged and repaired girders for each test. Included are
the moments at decompression, cracking, a strain in the concrete top fiber of 0.0015, a yield
strain in the strands of 0.009 in/in, and a compressive failure strain in the concrete top fiber of
0.003 in/in. Also presented is the percent of nominal strength when compared to the control test.

95
Figure 82 shows the moment-curvature behavior for Test 1, the damaged girders, and the
repaired girders. Also, the maximum nominal moments based on the moment-curvature
calculations are labeled.
Figure 81. Prestress Steel Stress - Strain Relationship Gangi, M. (2015). Nonlinear Beam Modeling of the
Repair of Impact-Damaged Prestressed Bridge Girders. Virginia Polytechnic and State University,
Department of Civil and Environmental Engineering. Blacksburg: Virginia Center for Transportation
Innovation and Research, Used under fair use, 2015
0
50
100
150
200
250
300
0.000 0.010 0.020 0.030 0.040 0.050 0.060
Str
ess
(ksi
)
Strain (in/in)
Test 1 Test 2 Bi-Linear Approximation

96
Table 17. Moment-Curvature Calculation Summary
Test Description # Severed
Strands
Mdecomp,mφ
(k-ft)
Mcr,mφ
(k-ft)
M0.0015,mφ
(k-ft)
My,mφ
(k-ft)
Mn,mφ
(k-ft)
% of Mn
Control
1 Control Test 0 1660 1770 2880 3270 3350 -
2 8-Strand
Splice
Damage 8
1350 1510 2290 2750 2820 84
Repair 1620 137* 2510 3220 3270 97
3 4-Strand
FRP
Damage 4
1480 1610 2440 2950 3000 90
Repair 1480 132* 2880 3460 3580 107
4 4-Strand
Splice
Damage 4
1480 1610 2440 2950 3000 90
Repair 1620 118* 2470 3170 3220 96
*First Cracking Occured in the Repair Section
Figure 82. Calculated Moment-Curvature Behavior
Calculations for the repaired girders were made by adding the repaired sections as an
additional force acting on the girder cross section and using strain compatibility to determine the
stress in the repair. First, the strength of the damage girder was calculated by reducing the
3353
2820
3267
3001
3583
3220
0
500
1000
1500
2000
2500
3000
3500
4000
-50 0 50 100 150 200 250
Mo
men
t (k
-ft)
Curvature (με/in)
Test 1 (Control) Test 2 (Damaged)
Test 2 (Repaired) Tests 3 and 4 (Damaged)
Test 3 (Repaired) Test 4 (Repaired)
97
effective prestressing force by the number of severed strands. Next, the repairs were added back
in as an additional force. The manufacturing tables were used to determine the amount of
effective stress to add from the strand splices. The force from the strand splices was added at the
centroid of the prestressing strands. The FRP was added as an additional force at the centroid of
the fabric repair and strain compatibility was used to calculate the effective force provided by the
fabric at each point along the moment-curvature diagram.
The cracking moment for the repaired section was calculated for the repair concrete. The
cracking moment in these locations is much lower than in the original concrete because the patch
was not precompressed by the prestressing strands. This is important for serviceability because
cracking in the repair can allow moisture to reach the repaired strands and can cause corrosion
and deterioration.
4.3.3: Non-Linear Finite Element
OpenSees was used to build a non-linear finite element model of the girder (Gangi,
2015). The two dimensional model of the girder was built using beam elements that could be
analyzed in two dimensions rather than three dimensional elements. This is possible because of
the relative length of the girder when compared to its height and width. Also, the load is applied
along the axis perpendicular to the length allowing a two dimensional analysis.
The deck width of 16 in and thickness of 8.75 in were assumed to be constant along the
length of the girders for all models. A compressive strength of 5 ksi was used for both the girder
and deck concrete. The stress-strain relationship of the concrete was approximated using a
Hognestad model with a peak compressive strength of 6.65 ksi for the girder and 6.02 ksi for the
deck. The tensile strength was assumed to be 10% of the compressive strength, or 0.665 ksi for
the girder and 0.602 ksi for the deck. The prestress strands were modeled as having an ultimate
98
strength of 250 ksi and an initial strain of 0.00519 which corresponded to an effective prestress
of 140 ksi. The stress-strain relationship used for the prestressing strand model as shown in
Figure 81 is the bilinear approximation of the tested stress-strain relationship for the prestressing
strands. The FRP was modeled with the design modulus of elasticity of 10,700 ksi, a debonding
strain of 0.00517, and a design rupture strain of 0.014.
Simulations were run for the undamaged, damaged and repaired girder for each repair
method. The finite element simulations for Test 2 and Test 4 considered in this report assumed
90% of the ultimate strength, or 225 ksi, was restored by the strand splices and that the repired
section of concrete remained bonded to the original concrete in the girder. Table 18 shows the
maximum nominal moment capacities determined by the finite element modeling (Gangi, 2015).
Also in Table 18 is the percentage of predicted strength regenerated when compared to the
nominal moment from the control test and the failure mode used in each finite element model as
prescribed by AASHTO. The girder failed in flexure with a concrete compressive strain in the
top fiber of the deck of 0.003 in/in for test 1, test 3, and test 4. The simulation was also run with
a FRP debonding failure in test 3 at a strain of 0.0052 in/in as per ACI provisions. Test 2 had a
flexural tension failure in which a spliced strand ruptured at a stress of 225 ksi or 90% of the
ultimate strength (Gangi, 2015).

99
Table 18. Finite Element Analysis Results
Test Tested
Repair
# Severed
Strands
Mn,FE
(k-ft)
% of
MnControl Failure Mode
1 Control
Test 0 3190 - Concrete Crush at 0.003 in/in
2 8-Strand
Splice 8 2750 86 Spliced Strand Rupture at 225 ksi
3 4-Strand
FRP 4 3870 121
Concrete Crush at 0.003 in/in
FRP Debond at 0.0052 in/in
4, Iteration 1 4-Strand
Splice 4
2910 91 Concrete Crush at 0.003 in/in
4, Iteration 2 2910 91
4.4: Laboratory Tests
4.4.1: Test Results Overview
As previously discussed, the width of the deck varied from Girder A to Girders B and C.
This variance caused a variation in the self-weight. Table 19 shows the different deck widths,
the self-weight from the deck and girder as a distributed load, and the applied moment from just
the self-weight at the point of the maximum applied moment. Table 20 summarizes the results
of the girder flexural tests. Included in the table are number of damaged strands, span length,
calculated nominal moment capacities (Mn,AASHTO, Mn,mφ, Mn,FE), and failure moment
(Ma,fail) of the tests covered in this report. Table 21 summarizes the results of the tests and the
calculated cracking moments.
Table 19. Girder Self-Weight Moments
Girder Test Description Deck Width
(in)
Self-Weight
(k/ft)
Self-Weight
Moment (k-ft)
A 1 Control Test 16 0.729 111
B 2 8-Strand Spliced 11 0.684 282
C 3 4-Strands Severed with FRP 11 0.684 194
4 4-Strand Spliced 11 0.684 265
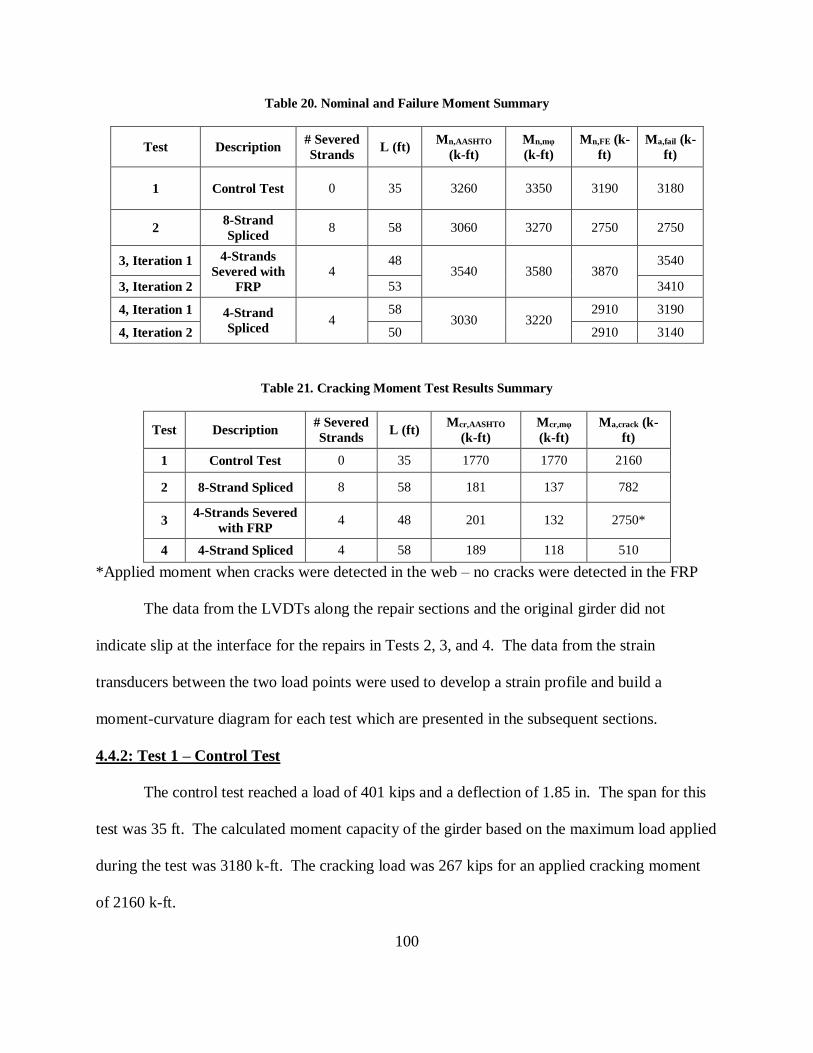
100
Table 20. Nominal and Failure Moment Summary
Test Description # Severed
Strands L (ft)
Mn,AASHTO
(k-ft)
Mn,mφ
(k-ft)
Mn,FE (k-
ft)
Ma,fail (k-
ft)
1 Control Test 0 35 3260 3350 3190 3180
2 8-Strand
Spliced 8 58 3060 3270 2750 2750
3, Iteration 1 4-Strands
Severed with
FRP
4 48
3540 3580 3870 3540
3, Iteration 2 53 3410
4, Iteration 1 4-Strand
Spliced 4
58 3030 3220
2910 3190
4, Iteration 2 50 2910 3140
Table 21. Cracking Moment Test Results Summary
Test Description # Severed
Strands L (ft)
Mcr,AASHTO
(k-ft)
Mcr,mφ
(k-ft)
Ma,crack (k-
ft)
1 Control Test 0 35 1770 1770 2160
2 8-Strand Spliced 8 58 181 137 782
3 4-Strands Severed
with FRP 4 48 201 132 2750*
4 4-Strand Spliced 4 58 189 118 510
*Applied moment when cracks were detected in the web – no cracks were detected in the FRP
The data from the LVDTs along the repair sections and the original girder did not
indicate slip at the interface for the repairs in Tests 2, 3, and 4. The data from the strain
transducers between the two load points were used to develop a strain profile and build a
moment-curvature diagram for each test which are presented in the subsequent sections.
4.4.2: Test 1 – Control Test
The control test reached a load of 401 kips and a deflection of 1.85 in. The span for this
test was 35 ft. The calculated moment capacity of the girder based on the maximum load applied
during the test was 3180 k-ft. The cracking load was 267 kips for an applied cracking moment
of 2160 k-ft.

101
The control test did not reach failure because the actuator reached its maximum capacity
before the girder failed. Cracking was observed along the bottom flange and in the web. Crack
patterns between the load points were consistent with impending flexural or shear failures, but
were more indicative of a flexural failure. Non-linear finite element failure analysis predicted a
flexural failure (concrete crushing) at a total load of 403 kips with a deflection of 1.81 in (Gangi,
2015). Figure 83 compares the calculated moments versus deflection curves with the measured
moment versus deflection curve for test 1. The test closely resembled the finite element
predictions. The flattened response curve of the second trial shows the loss of elasticity after the
girder was loaded beyond the elastic range during the first trial. The moment versus defection
response shows plastic behavior as the girder approached its nominal moment.
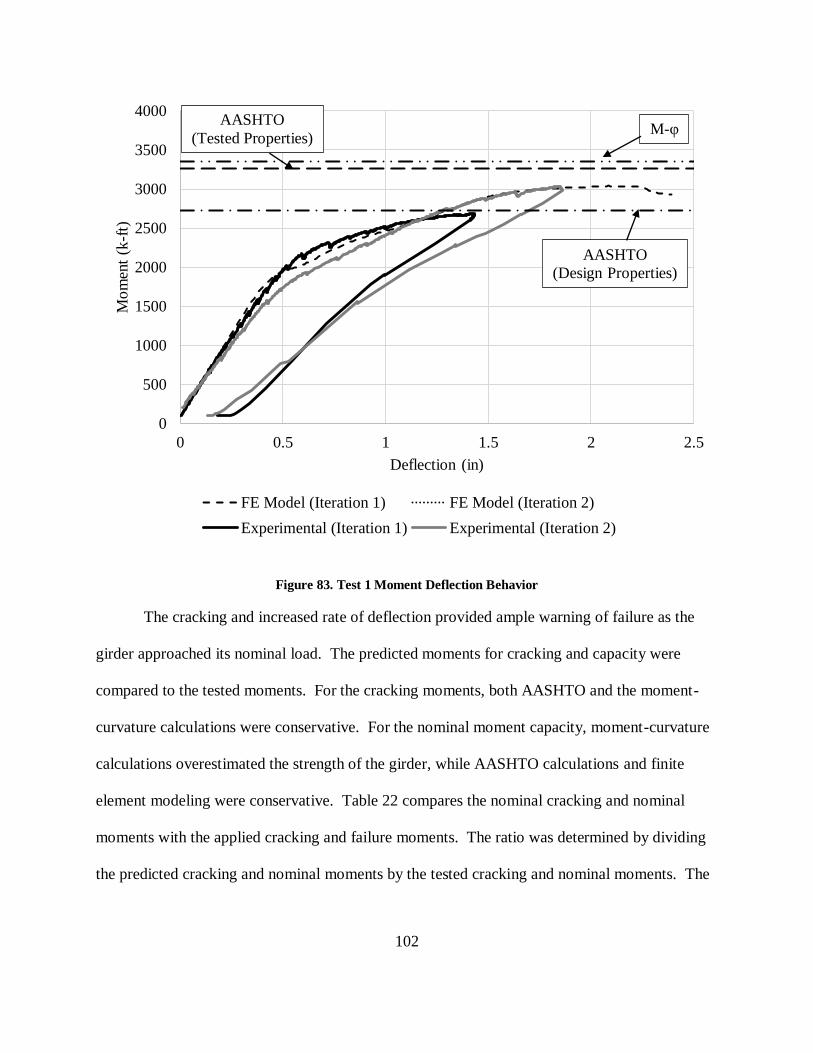
102
Figure 83. Test 1 Moment Deflection Behavior
The cracking and increased rate of deflection provided ample warning of failure as the
girder approached its nominal load. The predicted moments for cracking and capacity were
compared to the tested moments. For the cracking moments, both AASHTO and the moment-
curvature calculations were conservative. For the nominal moment capacity, moment-curvature
calculations overestimated the strength of the girder, while AASHTO calculations and finite
element modeling were conservative. Table 22 compares the nominal cracking and nominal
moments with the applied cracking and failure moments. The ratio was determined by dividing
the predicted cracking and nominal moments by the tested cracking and nominal moments. The
0
500
1000
1500
2000
2500
3000
3500
4000
0 0.5 1 1.5 2 2.5
Mo
men
t (k
-ft)
Deflection (in)
FE Model (Iteration 1) FE Model (Iteration 2)
Experimental (Iteration 1) Experimental (Iteration 2)
AASHTO
(Design Properties)
M-φ AASHTO
(Tested Properties)

103
nominal moment calculated from this test and the failure mode were used as a basis for
comparison between an undamaged girder and the damaged girders in subsequent tests.
Table 22. Experimental and Calculated Cracking and Nominal Moment Capacities for Test 1
Cracking Moment (k-ft) Nominal Moment (k-ft) Mcr Ratio Mn Ratio
Tested 2160 3180 - -
AASHTO (Tested Properties) 1770 3260 0.82 1.02
AASHTO (Design Properties) 1780 2720 0.82 0.86
Moment-Curvature 1700 3350 0.79 1.05
Finite Element - 3190 - 1.00
Figure 84 shows the predicted moment-curvature relationship and the experimental
moment-curvature relationship calculated using the measurements from the strain gauges at 41
and 2 in from the bottom of the girder during Test 1. The strain profile graphed using the data
from the strain gauges was not linear. Upon inspection, the neutral axis graph between the 41 in
gauge and the 2 in gauge was consistent with the neutral axis calculated during the moment-
curvature calculations. The incompatibility indicated by the gauge on the deck at 49 in could be
a result of slipping between the deck and the girder due to non-composite behavior. Therefore,
the curvature was calculated using the gauges in the top and bottom flanges. The
instrumentation was removed prior to the ultimate moment, therefore the full relationship is not
presented. The portion that is presented gives a representation to which the moment-curvature
relationships of subsequent tests is compared.
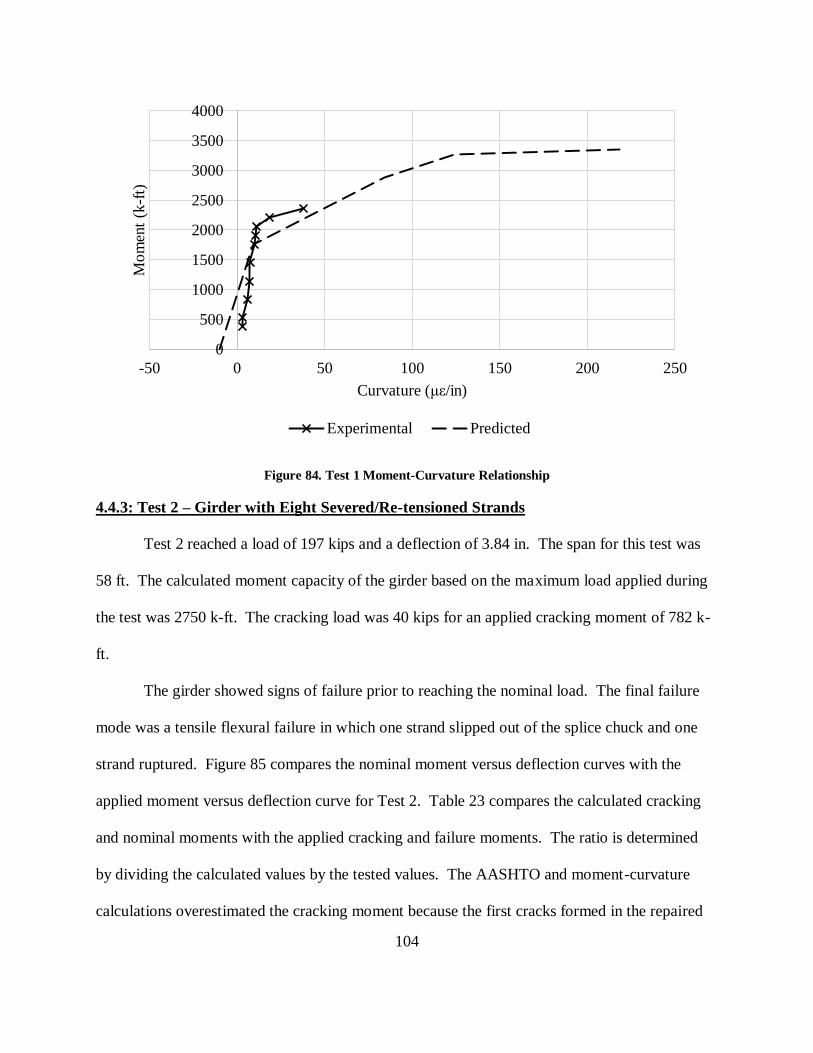
104
Figure 84. Test 1 Moment-Curvature Relationship
4.4.3: Test 2 – Girder with Eight Severed/Re-tensioned Strands
Test 2 reached a load of 197 kips and a deflection of 3.84 in. The span for this test was
58 ft. The calculated moment capacity of the girder based on the maximum load applied during
the test was 2750 k-ft. The cracking load was 40 kips for an applied cracking moment of 782 k-
ft.
The girder showed signs of failure prior to reaching the nominal load. The final failure
mode was a tensile flexural failure in which one strand slipped out of the splice chuck and one
strand ruptured. Figure 85 compares the nominal moment versus deflection curves with the
applied moment versus deflection curve for Test 2. Table 23 compares the calculated cracking
and nominal moments with the applied cracking and failure moments. The ratio is determined
by dividing the calculated values by the tested values. The AASHTO and moment-curvature
calculations overestimated the cracking moment because the first cracks formed in the repaired
0
500
1000
1500
2000
2500
3000
3500
4000
-50 0 50 100 150 200 250
Mo
men
t (k
-ft)
Curvature (με/in)
Experimental Predicted

105
section where the concrete was not compressed from the prestressing strands. The AASHTO
and moment-curvature calculations overestimated the nominal capacity of the girder while the
finite element model was accurate in its prediction of the failure moment.
Figure 85. Test 2 Moment Deflection Behavior
Table 23. Experimental and Calculated Cracking and Nominal Moment Capacities for Test 2
Cracking Moment (k-ft) Nominal Moment (k-ft) Mcr Ratio Mn Ratio
Tested 782 2750 - -
AASHTO (Tested Properties) 181 3060 0.23 1.11
AASHTO (Design Properties) 181 2380 0.23 0.87
Moment-Curvature 137 3270 0.18 1.19
Finite Element - 2750 - 1.00
0
500
1000
1500
2000
2500
3000
3500
0 1 2 3 4 5
Mo
men
t (k
-ft)
Deflection (in)
FE Model Experimental

106
As the moment increased, cracking consistent with a flexural failure was observed along
the bottom flange as shown in Figure 86. Figure 85 illustrates plastic behavior consistent with a
flexural failure as the girder approached its nominal capacity. The cracking and deflection
provided ample warning of the girder’s failure. Figure 87 shows the predicted moment-curvature
relationship and the moment-curvature relationship calculated using the measurements from the
strain gauges at 41 and 2 in from the bottom of the girder. The strain profile graphed using the
data from the strain gauges was not linear. Upon inspection, the neutral axis graph between the
41 in gauge and the 2 in gauge was consistent with the neutral axis calculated during the
moment-curvature calculations. The incompatibility indicated by the gauge on the deck at 49 in
could be a result of slipping between the deck and the girder due to non-composite behavior.
Therefore, the curvature was calculated using the gauges in the top and bottom flanges. The
graph of the tested moment-curvature relationship did not provide conclusive results.
Figure 86. Flexural Cracks in Patch Concrete near Failed Strand Splice (Photo taken by Ioannis
Koutromanos, used under fair use 2015)
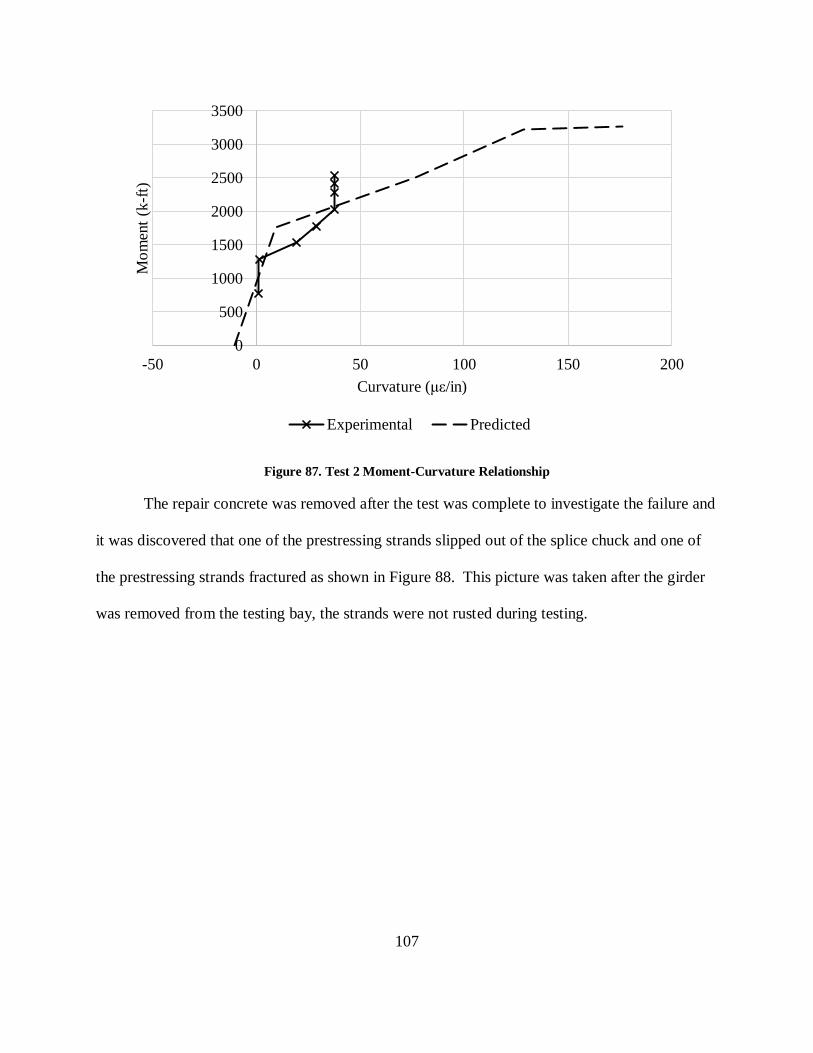
107
Figure 87. Test 2 Moment-Curvature Relationship
The repair concrete was removed after the test was complete to investigate the failure and
it was discovered that one of the prestressing strands slipped out of the splice chuck and one of
the prestressing strands fractured as shown in Figure 88. This picture was taken after the girder
was removed from the testing bay, the strands were not rusted during testing.
0
500
1000
1500
2000
2500
3000
3500
-50 0 50 100 150 200
Mo
men
t (k
-ft)
Curvature (με/in)
Experimental Predicted
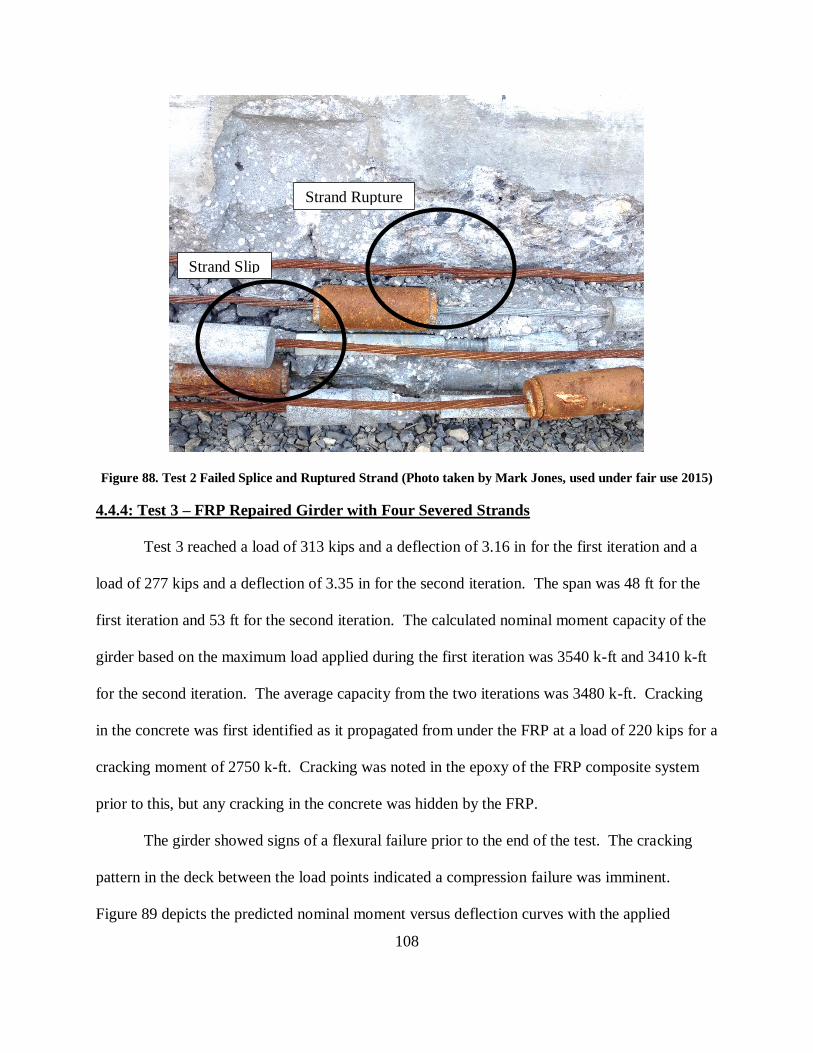
108
Figure 88. Test 2 Failed Splice and Ruptured Strand (Photo taken by Mark Jones, used under fair use 2015)
4.4.4: Test 3 – FRP Repaired Girder with Four Severed Strands
Test 3 reached a load of 313 kips and a deflection of 3.16 in for the first iteration and a
load of 277 kips and a deflection of 3.35 in for the second iteration. The span was 48 ft for the
first iteration and 53 ft for the second iteration. The calculated nominal moment capacity of the
girder based on the maximum load applied during the first iteration was 3540 k-ft and 3410 k-ft
for the second iteration. The average capacity from the two iterations was 3480 k-ft. Cracking
in the concrete was first identified as it propagated from under the FRP at a load of 220 kips for a
cracking moment of 2750 k-ft. Cracking was noted in the epoxy of the FRP composite system
prior to this, but any cracking in the concrete was hidden by the FRP.
The girder showed signs of a flexural failure prior to the end of the test. The cracking
pattern in the deck between the load points indicated a compression failure was imminent.
Figure 89 depicts the predicted nominal moment versus deflection curves with the applied
Strand Slip
Strand Rupture
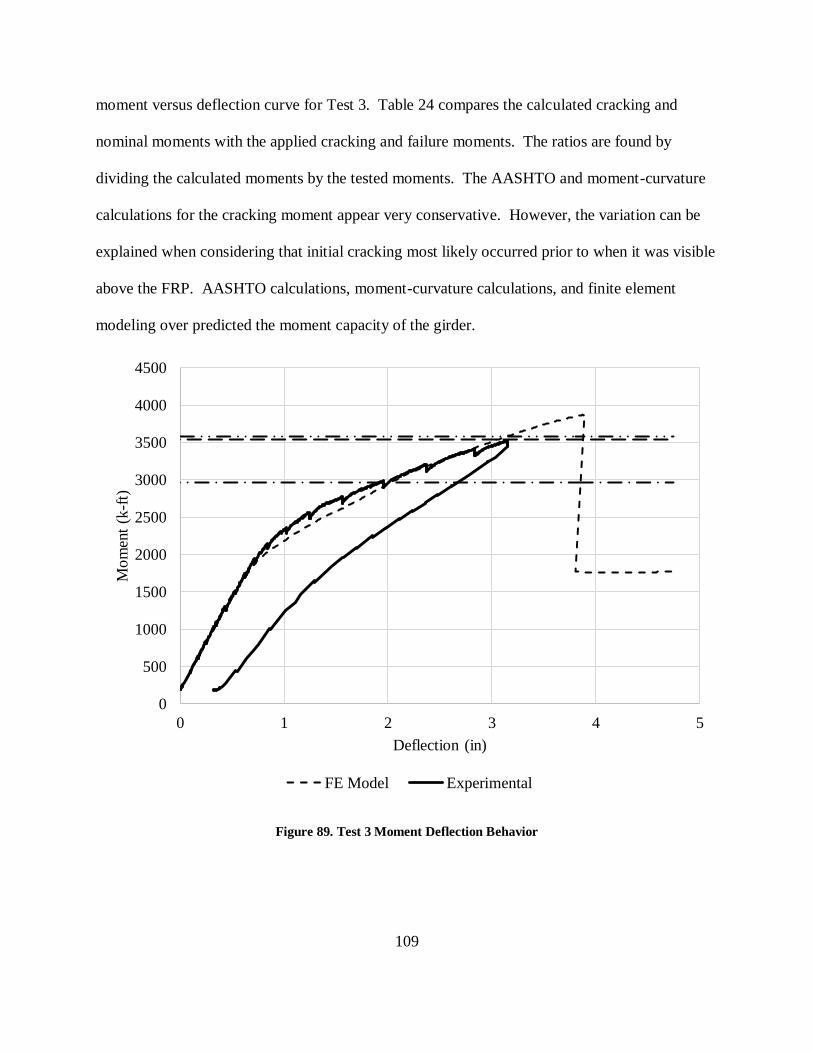
109
moment versus deflection curve for Test 3. Table 24 compares the calculated cracking and
nominal moments with the applied cracking and failure moments. The ratios are found by
dividing the calculated moments by the tested moments. The AASHTO and moment-curvature
calculations for the cracking moment appear very conservative. However, the variation can be
explained when considering that initial cracking most likely occurred prior to when it was visible
above the FRP. AASHTO calculations, moment-curvature calculations, and finite element
modeling over predicted the moment capacity of the girder.
Figure 89. Test 3 Moment Deflection Behavior
0
500
1000
1500
2000
2500
3000
3500
4000
4500
0 1 2 3 4 5
Mo
men
t (k
-ft)
Deflection (in)
FE Model Experimental
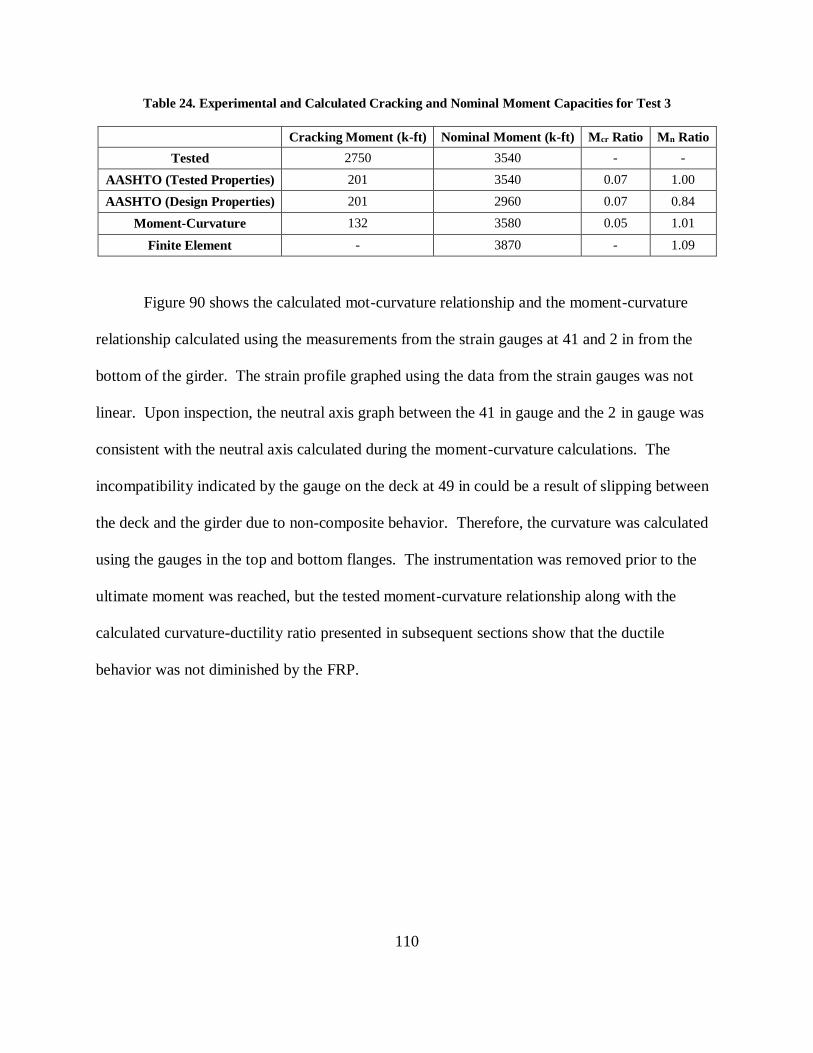
110
Table 24. Experimental and Calculated Cracking and Nominal Moment Capacities for Test 3
Cracking Moment (k-ft) Nominal Moment (k-ft) Mcr Ratio Mn Ratio
Tested 2750 3540 - -
AASHTO (Tested Properties) 201 3540 0.07 1.00
AASHTO (Design Properties) 201 2960 0.07 0.84
Moment-Curvature 132 3580 0.05 1.01
Finite Element - 3870 - 1.09
Figure 90 shows the calculated mot-curvature relationship and the moment-curvature
relationship calculated using the measurements from the strain gauges at 41 and 2 in from the
bottom of the girder. The strain profile graphed using the data from the strain gauges was not
linear. Upon inspection, the neutral axis graph between the 41 in gauge and the 2 in gauge was
consistent with the neutral axis calculated during the moment-curvature calculations. The
incompatibility indicated by the gauge on the deck at 49 in could be a result of slipping between
the deck and the girder due to non-composite behavior. Therefore, the curvature was calculated
using the gauges in the top and bottom flanges. The instrumentation was removed prior to the
ultimate moment was reached, but the tested moment-curvature relationship along with the
calculated curvature-ductility ratio presented in subsequent sections show that the ductile
behavior was not diminished by the FRP.

111
Figure 90. Test 3 Moment-Curvature Relationship
The epoxy bonding the FRP to the bottom flange of the girder cracked throughout the
loading process. As the load approached the nominal capacity of the girder, the cracking
propagated from the epoxy into the web of the girder as shown in Figure 91. Cracking
developed at the end of the repair section along the interface between the epoxy and the concrete,
however, it did not indicate a bond failure between the FRP and the substrate. Cracking in the
concrete in the deck was indicative of a compression failure. In addition, the shallow slope of
the load deflection curve and the reduced plastic behavior illustrated in Figure 89 is associated
with a more brittle and sudden compression failure. The cracking in the epoxy provided a visual
and auditory warning as the girder approached its nominal capacity. In addition, the cracks
propagated into the web providing additional warning prior to the failure.
0
500
1000
1500
2000
2500
3000
3500
4000
-50 0 50 100 150 200
Mo
men
t (k
-ft)
Curvature (με/in)
Experimental Predicted

112
Figure 91. Crack Propagation from FRP into Web (Photo taken by Ioannis Koutromanos, used under fair use
2015)
4.4.5: Test 4 – Girder with Four Severed/Re-tensioned Strands
Test 4 reached a load of 241 kips and a deflection of 4.12 in for the first iteration and a
load of 266 kips and a deflection of 3.61 in for the second iteration. The span was 58 ft for the
first iteration and 50 ft for the second iteration. The calculated moment capacity of the girder
based on the maximum load applied during the first iteration was 3190 k-ft. The moment
capacity for the second iteration was 3140 k-ft. The average capacity from the two iterations
was 3170 k-ft. Cracking was noted at an applied load of approximately 20 kips for a cracking
moment of 510 k-ft.
The girder failed in compression when the concrete in the deck between the load points
crushed. Figure 92 compares the predicted nominal moment versus deflection curves with the
measured applied moment versus deflection curve for iteration 1 of Test 4. Figure 93 compares
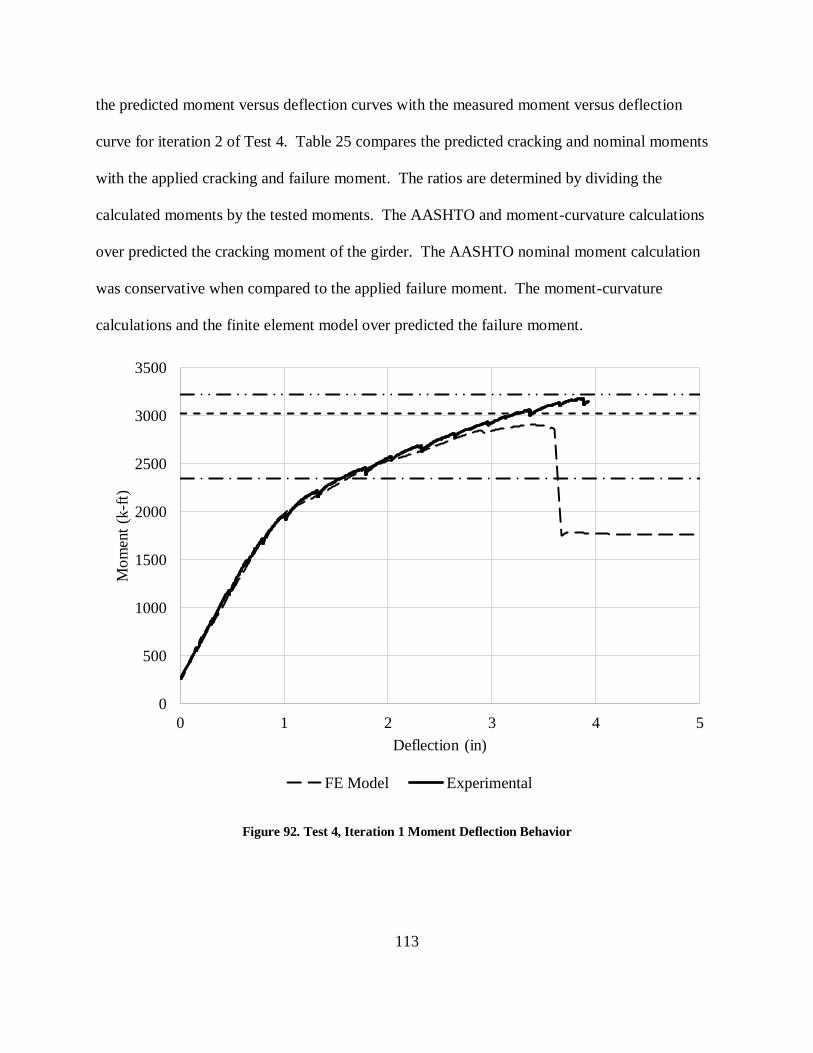
113
the predicted moment versus deflection curves with the measured moment versus deflection
curve for iteration 2 of Test 4. Table 25 compares the predicted cracking and nominal moments
with the applied cracking and failure moment. The ratios are determined by dividing the
calculated moments by the tested moments. The AASHTO and moment-curvature calculations
over predicted the cracking moment of the girder. The AASHTO nominal moment calculation
was conservative when compared to the applied failure moment. The moment-curvature
calculations and the finite element model over predicted the failure moment.
Figure 92. Test 4, Iteration 1 Moment Deflection Behavior
0
500
1000
1500
2000
2500
3000
3500
0 1 2 3 4 5
Mo
men
t (k
-ft)
Deflection (in)
FE Model Experimental
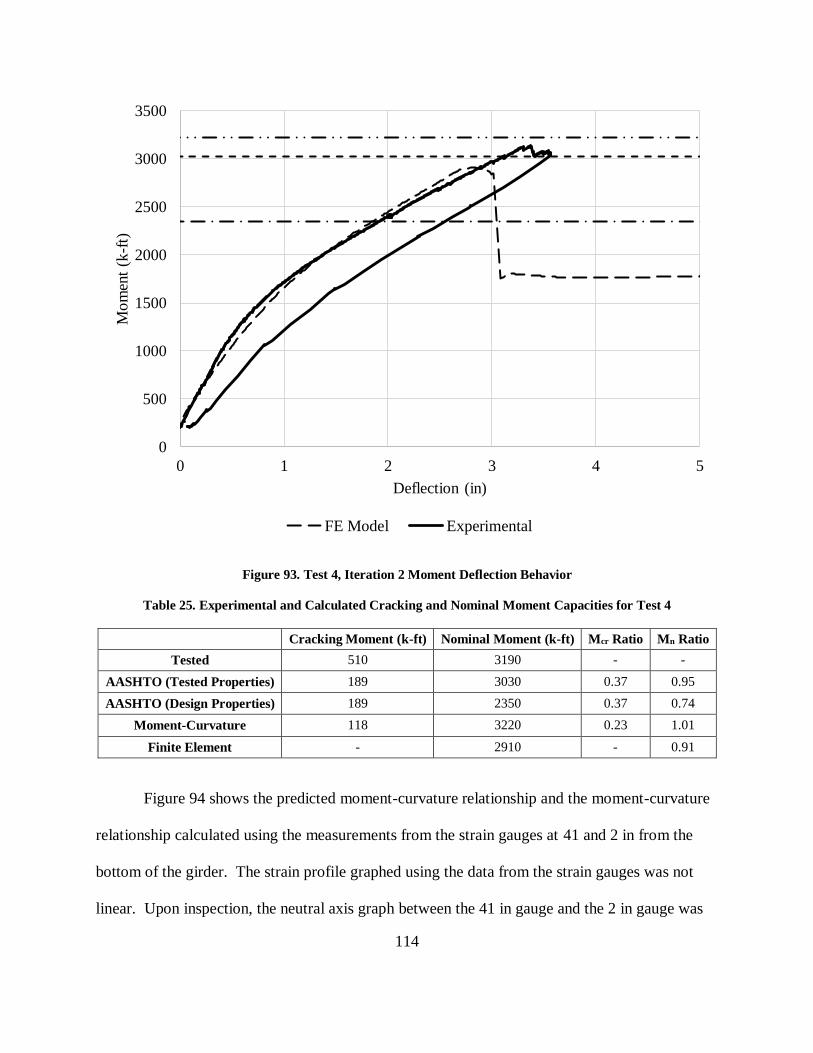
114
Figure 93. Test 4, Iteration 2 Moment Deflection Behavior
Table 25. Experimental and Calculated Cracking and Nominal Moment Capacities for Test 4
Cracking Moment (k-ft) Nominal Moment (k-ft) Mcr Ratio Mn Ratio
Tested 510 3190 - -
AASHTO (Tested Properties) 189 3030 0.37 0.95
AASHTO (Design Properties) 189 2350 0.37 0.74
Moment-Curvature 118 3220 0.23 1.01
Finite Element - 2910 - 0.91
Figure 94 shows the predicted moment-curvature relationship and the moment-curvature
relationship calculated using the measurements from the strain gauges at 41 and 2 in from the
bottom of the girder. The strain profile graphed using the data from the strain gauges was not
linear. Upon inspection, the neutral axis graph between the 41 in gauge and the 2 in gauge was
0
500
1000
1500
2000
2500
3000
3500
0 1 2 3 4 5
Mo
men
t (k
-ft)
Deflection (in)
FE Model Experimental
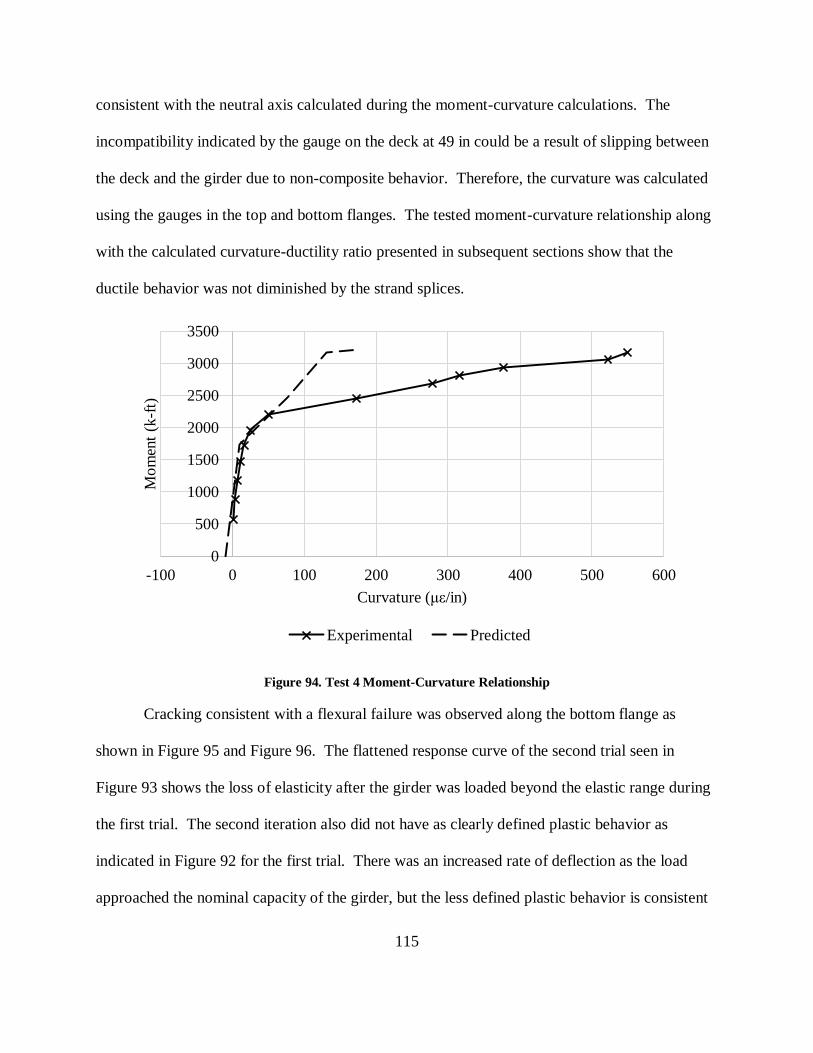
115
consistent with the neutral axis calculated during the moment-curvature calculations. The
incompatibility indicated by the gauge on the deck at 49 in could be a result of slipping between
the deck and the girder due to non-composite behavior. Therefore, the curvature was calculated
using the gauges in the top and bottom flanges. The tested moment-curvature relationship along
with the calculated curvature-ductility ratio presented in subsequent sections show that the
ductile behavior was not diminished by the strand splices.
Figure 94. Test 4 Moment-Curvature Relationship
Cracking consistent with a flexural failure was observed along the bottom flange as
shown in Figure 95 and Figure 96. The flattened response curve of the second trial seen in
Figure 93 shows the loss of elasticity after the girder was loaded beyond the elastic range during
the first trial. The second iteration also did not have as clearly defined plastic behavior as
indicated in Figure 92 for the first trial. There was an increased rate of deflection as the load
approached the nominal capacity of the girder, but the less defined plastic behavior is consistent
0
500
1000
1500
2000
2500
3000
3500
-100 0 100 200 300 400 500 600
Mo
men
t (k
-ft)
Curvature (με/in)
Experimental Predicted
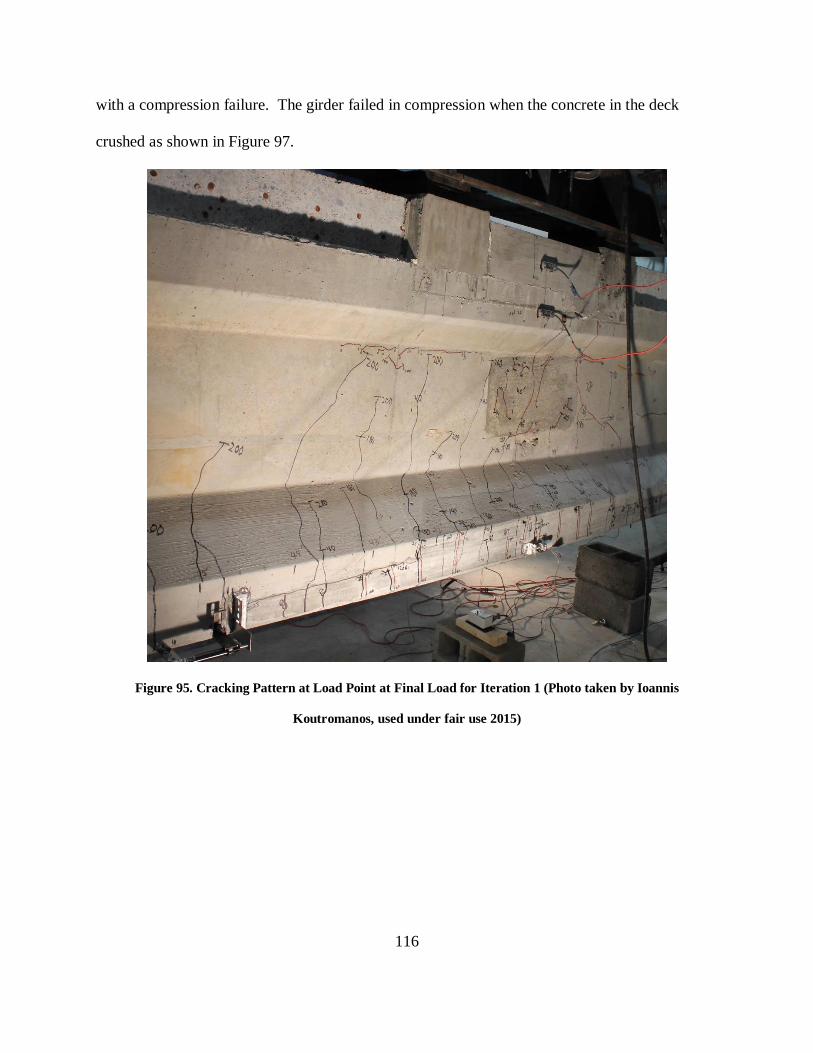
116
with a compression failure. The girder failed in compression when the concrete in the deck
crushed as shown in Figure 97.
Figure 95. Cracking Pattern at Load Point at Final Load for Iteration 1 (Photo taken by Ioannis
Koutromanos, used under fair use 2015)
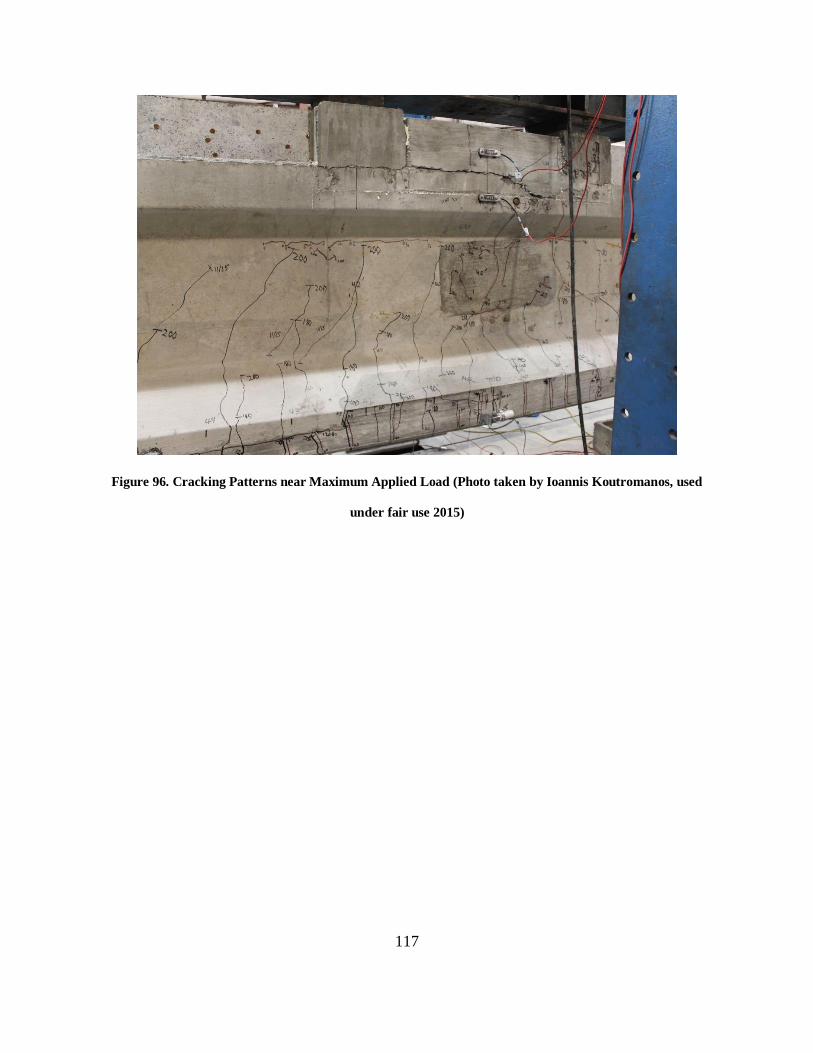
117
Figure 96. Cracking Patterns near Maximum Applied Load (Photo taken by Ioannis Koutromanos, used
under fair use 2015)
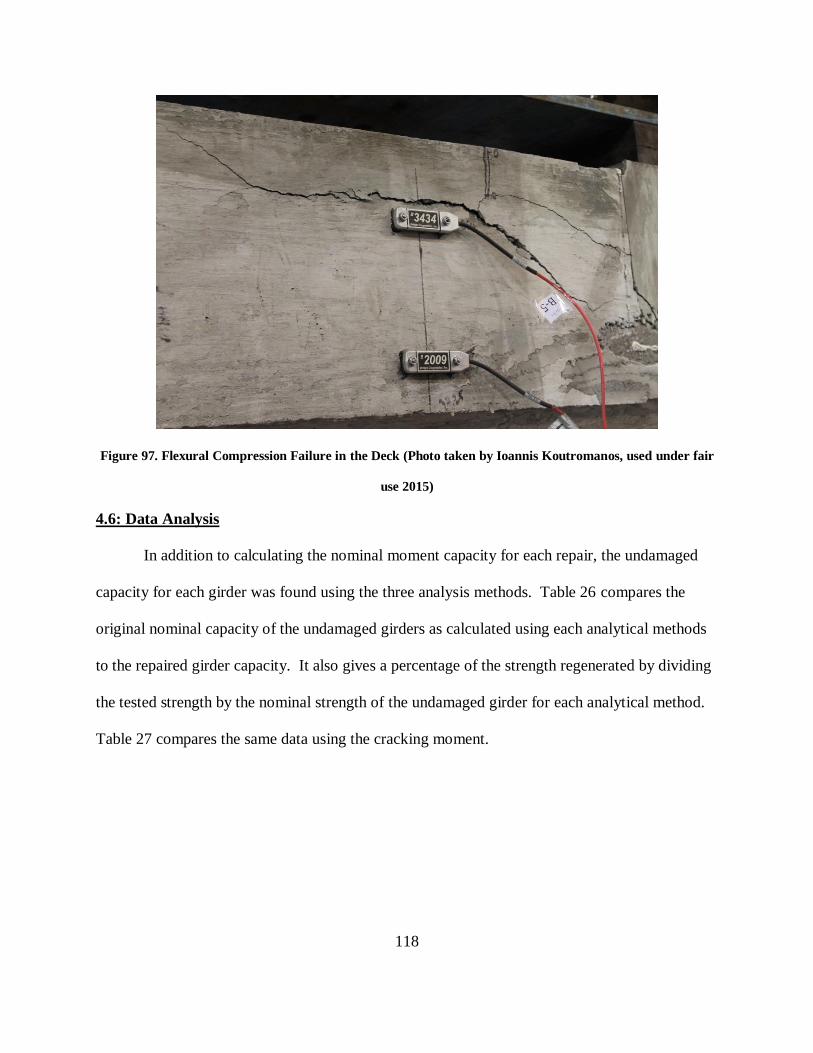
118
Figure 97. Flexural Compression Failure in the Deck (Photo taken by Ioannis Koutromanos, used under fair
use 2015)
4.6: Data Analysis
In addition to calculating the nominal moment capacity for each repair, the undamaged
capacity for each girder was found using the three analysis methods. Table 26 compares the
original nominal capacity of the undamaged girders as calculated using each analytical methods
to the repaired girder capacity. It also gives a percentage of the strength regenerated by dividing
the tested strength by the nominal strength of the undamaged girder for each analytical method.
Table 27 compares the same data using the cracking moment.

119
Table 26. Nominal versus Tested Strength Regained
Test Description
#
Severed
Strands
Tested Undamaged Mn (k-ft) Strength Regained (%)
Ma,fail
(k-ft) Mn,AASHTO Mn,mφ MnFE AASHTO mφ FE Tested
1 Control
Test 0 3180 3260 3350 3190 N/A N/A N/A N/A
2 8-Strand
Spliced 8 2750 3060 3270 2930 90 84 94 86
3
4-Strands
Severed
with FRP
4 3540 3030 3220 3030 111 110 117 111
4 4-Strand
Spliced 4 3190 3030 3220 2990 105 99 108 100
Table 27. Cracking versus Tested Strength Regained
Test Description
#
Severed
Strands
Tested Undamaged Mcr (k-ft) Strength Regained (%)
Mcr,fail
(k-ft) Mcr,AASHTO Mcr,mφ AASHTO mφ Tested
1 Control
Test 0 2160 1770 1770 N/A N/A N/A
2 8-Strand
Splice 8 782* 1610 1760 31 28 36
3
4-Strands
Severed
with FRP
4 2750 1610 1610 146 146 127
4 4-Strand
Splice 4 510* 1590 1730 91 84 24
* Cracking observed in the repaired section
As shown in the previous sections, the moment-curvature relationship was calculated
using the data from the strain transducers and using a strain compatibility relationship. As
previously discussed, the strain transducers were removed prior to the ultimate moment for
safety reasons. In addition, the strain in the strands was not measured directly and it is difficult
to determine the point when the strands yielded. Also, because of the small cracking moment in
the repaired section of the concrete for Tests 2 and 4, a curvature-ductility ratio was not able to
be determined using the tested data. From the calculated moment-curvature relationships, a
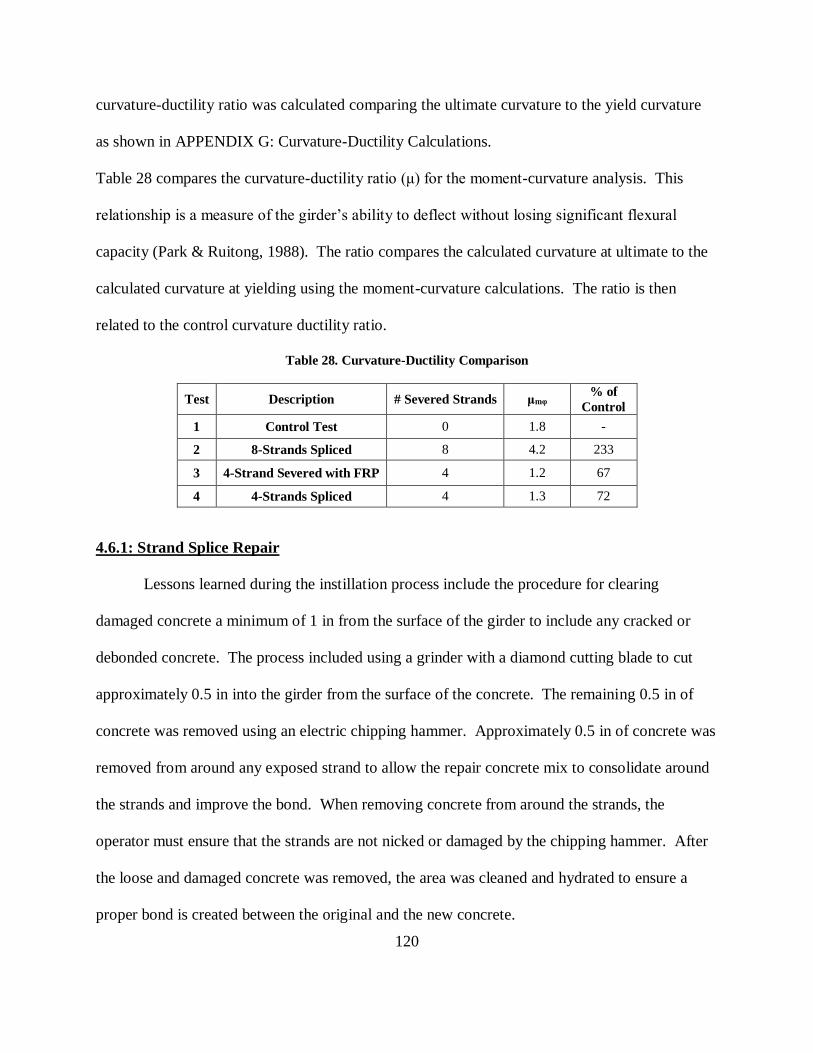
120
curvature-ductility ratio was calculated comparing the ultimate curvature to the yield curvature
as shown in APPENDIX G: Curvature-Ductility Calculations.
Table 28 compares the curvature-ductility ratio (μ) for the moment-curvature analysis. This
relationship is a measure of the girder’s ability to deflect without losing significant flexural
capacity (Park & Ruitong, 1988). The ratio compares the calculated curvature at ultimate to the
calculated curvature at yielding using the moment-curvature calculations. The ratio is then
related to the control curvature ductility ratio.
Table 28. Curvature-Ductility Comparison
Test Description # Severed Strands μmφ % of
Control
1 Control Test 0 1.8 -
2 8-Strands Spliced 8 4.2 233
3 4-Strand Severed with FRP 4 1.2 67
4 4-Strands Spliced 4 1.3 72
4.6.1: Strand Splice Repair
Lessons learned during the instillation process include the procedure for clearing
damaged concrete a minimum of 1 in from the surface of the girder to include any cracked or
debonded concrete. The process included using a grinder with a diamond cutting blade to cut
approximately 0.5 in into the girder from the surface of the concrete. The remaining 0.5 in of
concrete was removed using an electric chipping hammer. Approximately 0.5 in of concrete was
removed from around any exposed strand to allow the repair concrete mix to consolidate around
the strands and improve the bond. When removing concrete from around the strands, the
operator must ensure that the strands are not nicked or damaged by the chipping hammer. After
the loose and damaged concrete was removed, the area was cleaned and hydrated to ensure a
proper bond is created between the original and the new concrete.

121
Figure 98 shows second order polynomial trends for the percent of original strength
regained by the strand splice repair method as tested. There is an inverse relationship between
the number of damaged strands and the percent of predicted capacity that was regenerated.
Based on these trends and interpolating between results, it can be seen that strand splices are able
to regenerate approximately 90% of strength for four to six damaged strands or 80% of strength
for seven to nine damaged strands. These approximations include all three analysis methods and
the percent is also a function of which method is used to calculate the original strength of the
girder. The predictions are also limited to AASHTO Type III girders with impacted severed
strands and a deck that is the width of the top flange of the girder. In addition, there were only
two data points to interpolate the predictions.
When compared to the nominal capacity of the girder calculated using the design material
strengths and the AASHTO equations, the strand splices restored 96% of the design nominal
moment capacity of the original girder for the repair of four severed strands. The strand splices
restored 81% of the AASHTO design nominal moment capacity of the original girder for the
repair of eight severed strands.
Based on load requirements, selecting strand splices as the primary repair method may be
feasible as long as the number of damaged strands is a low percentage of the total number of
strands. If the number of damaged strands is greater than which can be restored through strand
splices alone, another repair method should be considered with strand splices as a supplementary
option. Strand splices can be installed quickly and provide relatively early repair strength
resulting in decreased down time for the structure. When installing the strand splices, if a
negative moment can be applied and removed after the installation is complete, it may allow the
splice to reintroduce a larger percent of the effective prestress force than was lost when the
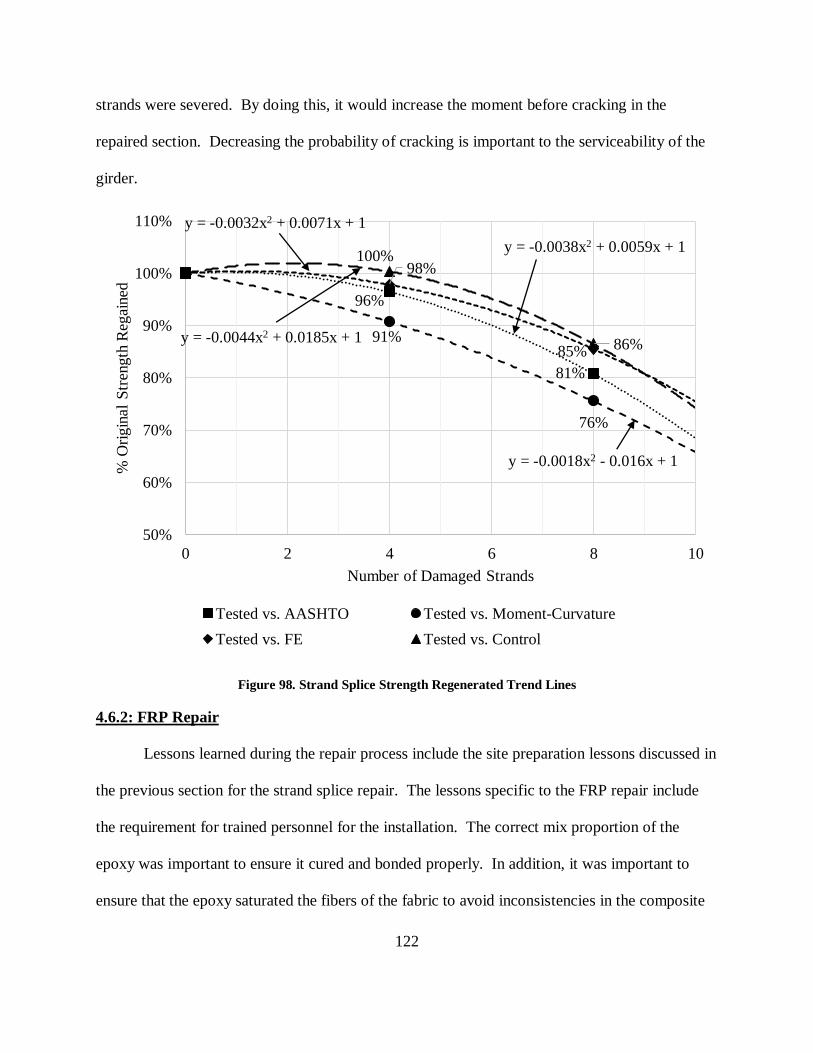
122
strands were severed. By doing this, it would increase the moment before cracking in the
repaired section. Decreasing the probability of cracking is important to the serviceability of the
girder.
Figure 98. Strand Splice Strength Regenerated Trend Lines
4.6.2: FRP Repair
Lessons learned during the repair process include the site preparation lessons discussed in
the previous section for the strand splice repair. The lessons specific to the FRP repair include
the requirement for trained personnel for the installation. The correct mix proportion of the
epoxy was important to ensure it cured and bonded properly. In addition, it was important to
ensure that the epoxy saturated the fibers of the fabric to avoid inconsistencies in the composite
96%
81%
91%
76%
98%
85%
100%
86%
y = -0.0038x2 + 0.0059x + 1
y = -0.0018x2 - 0.016x + 1
y = -0.0032x2 + 0.0071x + 1
y = -0.0044x2 + 0.0185x + 1
50%
60%
70%
80%
90%
100%
110%
0 2 4 6 8 10
% O
rigin
al
Str
eng
th R
egai
ned
Number of Damaged Strands
Tested vs. AASHTO Tested vs. Moment-Curvature
Tested vs. FE Tested vs. Control
123
matrix. The consistency of the repair was tested at 24 hrs to using hammer to check for
inconsistent sounds that would indicate improper bonding. In order to reduce the potential of
debonding of the FRP from shear stresses at the interface, the repair should be installed along the
entire length of the girder.
The analysis methods were able to predict the strength of the repair within 10% of the
actual repair. When compared to the AASHTO calculations, the ratio of calculated to tested
moment was 1.00. When compared to the moment-curvature calculations, the ratio of calculated
to tested moment was 1.01. When compared to the finite element model, the ratio of calculated
to tested moment was 1.09.
Table 4 gives a guide for the type of FRP repair method that is best for an associated
maximum number of damaged strands (Harries, et. al., 2012). It indicates that the maximum
number of damaged strands for externally bonded FRP on an AASHTO Type III girder is eight.
The results of this project, as shown in Table 24, validated that when four strands are severed,
properly designed and installed externally bonded FRP can restore 110% of the original girder
strength and is a sufficient repair technique. Designers of repairs must take into account that the
relationship between stress and strain for FRP does not have the same plastic behavior that is
associated with steel which in turn diminishes the plastic behavior of the girder. The warning
associated with a tensile flexural failure on an overloaded girder is reduced when FRP is used
instead of steel.
Based on Test 3, however there was still enough capacity in the undamaged strands to
provide sufficient warning through increased deflection as the girder approached failure. This
deflection and the cracked epoxy provided sufficient warning of the failure load. However, the
concrete in the deck of the girder showed signs of crushing similar to the compression failure in
124
Test 4 which can be a sudden failure. In addition, cracking in the concrete in the bottom flange
was hidden by the FRP until the cracks propagated into the web. Applying FRP to the exterior
of the girder is a way to increase serviceability by containing the evidence of cracking. It is
important to consider the potential of creating the conditions for a sudden failure when designing
an FRP repair and ensure that it is not overdesigned. FRP does not restore any of the prestress
lost by the severed strands. Therefore, supplementing the FRP repair with the relatively
inexpensive strand splices would allow the designer to regain some of the force lost by the
severed strands. Another option is to load the girder during the repair. If a positive moment is
introduced while the repair concrete patch is being placed, it will compress when the moment is
removed. This will assist in increasing the cracking moment and reducing serviceability
problems.
The installation of FRP is more intensive than the installation of strand splices. It
requires skilled labor that is trained in the handling of the materials. In addition, the concrete in
the repair patch must be allowed to cure long enough to allow the epoxy to develop a sufficient
bond. When compared to strand splices, the increased down time for the structure must be
considered.
4.6.3: Analysis Methods
Several analysis methods were employed for the tests, including AASHTO equations,
moment-curvature analysis using strain compatibility, and finite element modeling. Table 29
compares the results of each analysis tool to predict the cracking and failure moments. This
table indicates the ratio of calculated moment to applied moment. In addition, it shows the
average ratio and standard deviation for each method. The analytical models did not accurately
predict the cracking moment. Both models used to predict the cracking moment had a standard

125
deviation greater than 0.30. AASHTO calculations and finite element modeling were able to
predict the nominal failure moment capacity on average to about one percent difference. The
finite element and AASHTO standard deviations were 0.07 and based on the results of these
tests, they were the most accurate method to predict results. The repair methods were all able to
restore more than the calculated nominal moment using the design material properties with the
AASHTO equations with a standard deviation of 0.06. Figure 99 shows a plot of the ratio of the
nominal moment calculated using each analytical method investigated to the tested failure
moment from each test. As can be seen on the chart, the AASHTO with tested material
properties, AASHTO with design material properties, and finite element methods are more
accurate than the moment-curvature. The AASHTO calculations and the finite element method
under predicted the strength of the final design. When compared to the AASHTO predictions
using the design material properties, all repair tests were able to exceed the design nominal
moment capacity.
Table 29. Ratio of Predicted to Measured Moment Capacity
Cracking Moment Predictions Failure Moment Capacity Predictions
AASHTO
Design AASHTO
Moment-
Curvature
AASHTO
Design AASHTO
Moment-
Curvature
Finite
Element
Test 1 0.82 0.82 0.86 0.86 1.02 1.05 1.00
Test 2 0.23 0.23 0.18 0.87 1.11 1.19 1.00
Test 3 0.07 0.07 0.05 0.84 1.00 1.01 1.09
Test 4 0.37 0.37 0.23 0.74 0.95 1.01 0.91
Average 0.37 0.37 0.33 0.83 1.02 1.07 1.00
Standard
Deviation 0.32 0.32 0.36 0.06 0.07 0.08 0.07
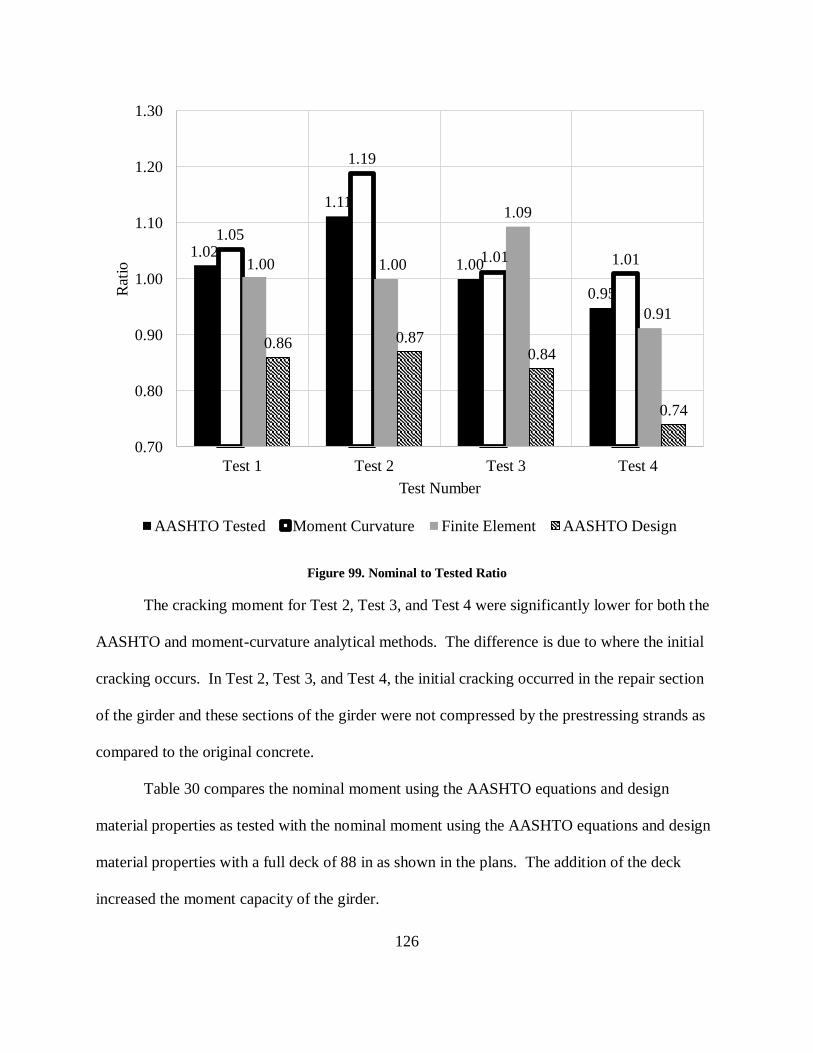
126
Figure 99. Nominal to Tested Ratio
The cracking moment for Test 2, Test 3, and Test 4 were significantly lower for both the
AASHTO and moment-curvature analytical methods. The difference is due to where the initial
cracking occurs. In Test 2, Test 3, and Test 4, the initial cracking occurred in the repair section
of the girder and these sections of the girder were not compressed by the prestressing strands as
compared to the original concrete.
Table 30 compares the nominal moment using the AASHTO equations and design
material properties as tested with the nominal moment using the AASHTO equations and design
material properties with a full deck of 88 in as shown in the plans. The addition of the deck
increased the moment capacity of the girder.
1.02
1.11
1.00
0.95
1.05
1.19
1.01 1.011.00 1.00
1.09
0.91
0.86 0.870.84
0.74
0.70
0.80
0.90
1.00
1.10
1.20
1.30
Test 1 Test 2 Test 3 Test 4
Rat
io
Test Number
AASHTO Tested Moment Curvature Finite Element AASHTO Design
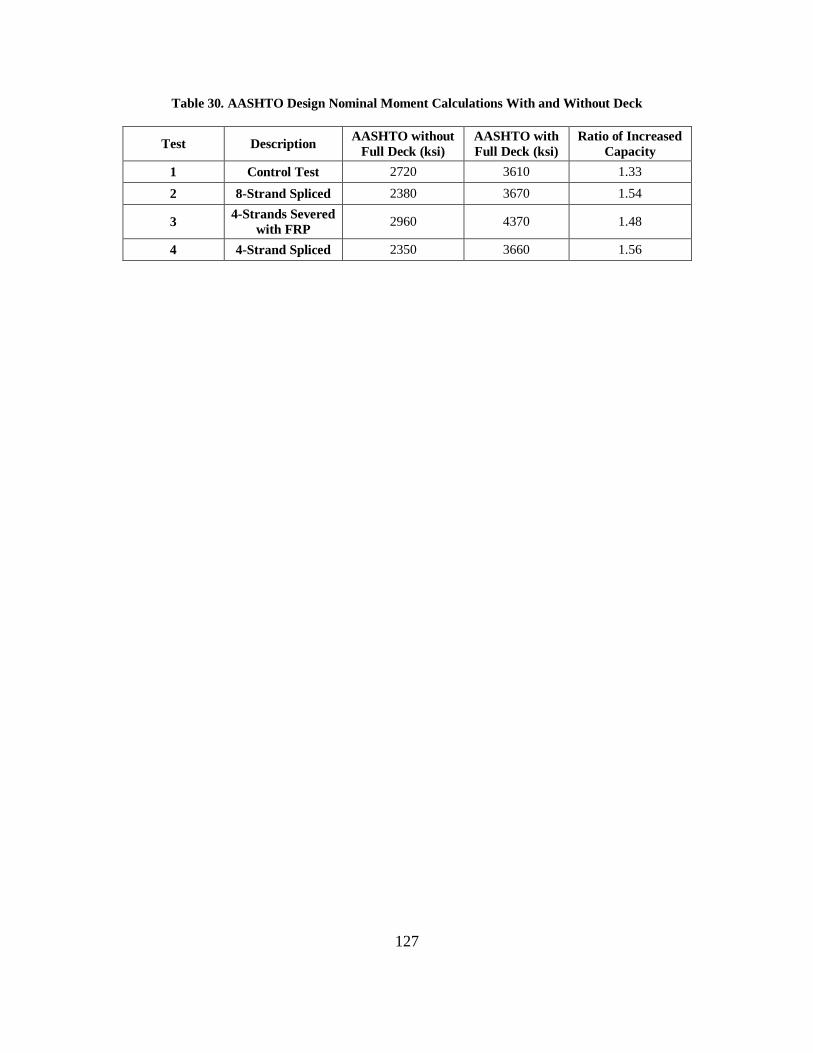
127
Table 30. AASHTO Design Nominal Moment Calculations With and Without Deck
Test Description AASHTO without
Full Deck (ksi)
AASHTO with
Full Deck (ksi)
Ratio of Increased
Capacity
1 Control Test 2720 3610 1.33
2 8-Strand Spliced 2380 3670 1.54
3 4-Strands Severed
with FRP 2960 4370 1.48
4 4-Strand Spliced 2350 3660 1.56
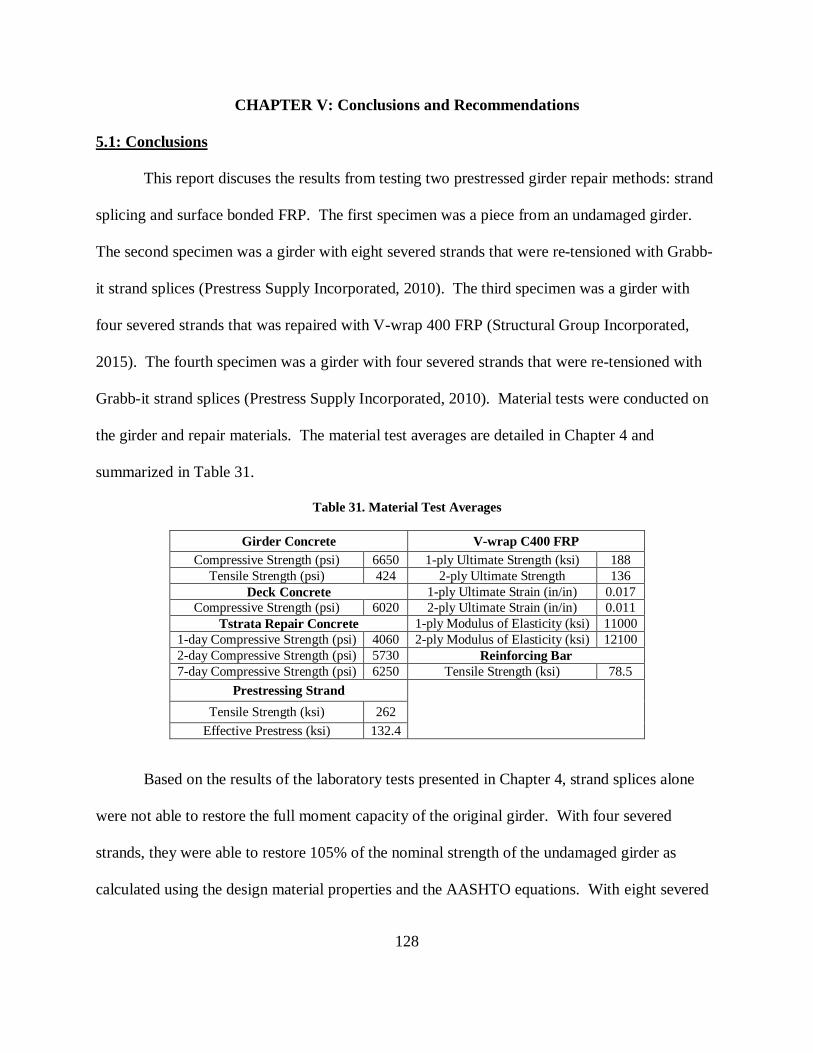
128
CHAPTER V: Conclusions and Recommendations
5.1: Conclusions
This report discuses the results from testing two prestressed girder repair methods: strand
splicing and surface bonded FRP. The first specimen was a piece from an undamaged girder.
The second specimen was a girder with eight severed strands that were re-tensioned with Grabb-
it strand splices (Prestress Supply Incorporated, 2010). The third specimen was a girder with
four severed strands that was repaired with V-wrap 400 FRP (Structural Group Incorporated,
2015). The fourth specimen was a girder with four severed strands that were re-tensioned with
Grabb-it strand splices (Prestress Supply Incorporated, 2010). Material tests were conducted on
the girder and repair materials. The material test averages are detailed in Chapter 4 and
summarized in Table 31.
Table 31. Material Test Averages
Girder Concrete V-wrap C400 FRP
Compressive Strength (psi) 6650 1-ply Ultimate Strength (ksi) 188
Tensile Strength (psi) 424 2-ply Ultimate Strength 136
Deck Concrete 1-ply Ultimate Strain (in/in) 0.017
Compressive Strength (psi) 6020 2-ply Ultimate Strain (in/in) 0.011
Tstrata Repair Concrete 1-ply Modulus of Elasticity (ksi) 11000
1-day Compressive Strength (psi) 4060 2-ply Modulus of Elasticity (ksi) 12100
2-day Compressive Strength (psi) 5730 Reinforcing Bar
7-day Compressive Strength (psi) 6250 Tensile Strength (ksi) 78.5
Prestressing Strand
Tensile Strength (ksi) 262
Effective Prestress (ksi) 132.4
Based on the results of the laboratory tests presented in Chapter 4, strand splices alone
were not able to restore the full moment capacity of the original girder. With four severed
strands, they were able to restore 105% of the nominal strength of the undamaged girder as
calculated using the design material properties and the AASHTO equations. With eight severed

129
strands, they were only able to restore 88% of the average nominal strength of the undamaged
girder as calculated using the design material properties and the AASHTO equations. Therefore,
strand splices alone are only a valid repair method when a low percentage of strands are
damaged. In the event that more strength is required, FRP is a better primary restoration system.
As a passive repair, the FRP did not restore the original prestress to the strands, but when paired
with the strand splice, or applying moments during the repair, this could be remedied. In
addition, the linear stress-strain relationship of FRP did not significantly change the behavior of
the girder as a whole when only four strands were severed. The remaining strands provided
enough ductility to allow the girder to deflect at higher loads.
The analytical modeling consisted of AASHTO calculations, strain compatibility
calculations, and non-linear finite element modeling. The AASHTO calculations had an average
ratio of nominal to applied failure moments of 1.02 with a standard deviation of 0.07. The
moment-curvature calculations had an average ratio of nominal to applied failure moments of
1.07 with a standard deviation of 0.08. The non-linear finite element models had an average
ratio of nominal to applied failure moments of 1.00 with a standard deviation of 0.07. When
predicting the cracking moment, the AASHTO average ratio was 1.20 with a standard deviation
of 0.65 and moment-curvature average ratio was 1.26 with a standard deviation of 0.75. Based
on these results, the AASHTO and finite element models were the best way to predict failure
while neither of the methods accurately predicted cracking.
In this project, the girders were removed from the bridge and tested individually. In
reality, a bridge is comprised of more than one girder. In addition to the results from this project,
there are many other variables that much be considered when choosing a repair technique. A
girder that is damaged in place would have a much larger deck to help provide a larger

130
compression surface area. This would reduce the possibility of the compression failure observed
for the third and fourth specimen. A loss in camber or a change in sweep from the impact that
may cause unnecessary shear and torsion stress should be considered. Other considerations
include whether or not additional girders were damaged in the impact. In the event that multiple
girders are damaged, the ratio of damaged to undamaged strands in an individual girder as well
as the ratio of damaged to undamaged strands in the overall bridge should be considered.
5.2: Recommendations
Recommendations for immediate implementation:
1) Ensure areas in need of repair are prepared appropriately to allow proper bonding
a. Remove loose and damaged concrete
b. Clear approximately 0.5 in around strands that are exposed
c. Ensure strands are not damaged during concrete removal
d. Clean and hydrate surface
2) Load bridge during repair to reduce the probability of cracking by inducing positive
and negative moments to increase the effective prestress restored and provide
precompression in the repair material
3) Install FRP along the full length of the girder to reduce the potential for a debonding
failure and increase the transfer between the matrix and the substrate
Recommendations for further research into the repair methods of impact damaged
prestressed bridge girders include:
1) Replicate overloading and traffic patterns with cyclic loads to determine fatigue
failure modes and approximate life-span.

131
2) Research into the asymmetrical effects of loading due to loads not directly above the
girder would give some insight into how the girder reacts differently when strands are
cut and change the centroid of the prestressing strands.
3) Research the maximum amount of damage for a girder with an FRP repair to retain
ductility from the undamaged strands before failure.
4) Compare results from unstressed externally bonded FRP to pretensioned FRP repairs
to determine the capacity of FRP to restore the effective prestressing force in the
girder.
5) Investigate the effects of repair techniques on different girder cross sections.

132
References
ACI Committee 549. (2013). Guide to Design and Construction of Extenally Bonded Fabric-
Reinforced Cementitious Matrix (FRCM) Systems for Repair and Strengthing Concrete
and Masonry Structures. Farmington Hills: American Concrete Institute.
Agrawal, A. K., Xu, X., & Chen, Z. (2013, January 15). Strikes on Low Clearance Bridges by
Over-Height Trucks in New York State. Retrieved December 05, 2014, from United
States Department of Transportation:
http://www.rita.dot.gov/utc/publications/spotlight/2013_01/html/spotlight_0113.html
Aktan, A. E., Culmo, M. P., Frangopol, D. M., French, C. W., Rabbat, B. G., Sanders, D. H., . . .
Woods, S. W. (1994). Concrete Bridges. Washington D.C.: Transportation Research
Board: Committee on Concrete Bridges. Retrieved December 8, 2014
American Association of State Highway and Transportation Officials. (2012). AASHTO LRFD
Bridge Design Specifications, Customary US Units (6th ed.). Washington DC: American
Association of State Highway and Transportation Officials (AASHTO).
ASTM International. (2015). ASTM Standards and Publications. Retrieved May 2, 2015, from
ASTM International: http://www.astm.org/Standards.htm
Bao, B. (2015). Grabb-It Cable Splice Chuck Tensile Test. Virginia Polytechnic Institute and
State University, Civil and Environmental Engineering, Blacksburg.
Brice, R. (2013). Precast-Prestressed Concrete Girders Damaged by Over-Height Load Impacts.
Olympia: Washington State Department of Transportation. Retrieved December 13, 2014
Davis, S. L., & Goldberg, D. (2013, June 19). The Fix We're In For: The State of Our Nation's
Bridges 2013. Retrieved December 4, 2014, from Transportation for America:
http://t4america.org/docs/bridgereport2013/2013BridgeReport.pdf

133
ElSaftey, A., Graeff, M. K., & Fallaha, S. (2014, March). Behavior of Laterally Damaged
Prestressed Concrete Bridge Girders Repaired with CFRP Laminates Under Static and
Fatigue Loading. International Journal of Concrete Structures and Materials, VIII(1),
43-59. Retrieved December 7, 2014
Fu, C. C., Burhouse, J. R., & Chang, G.-L. (2003). Study of Overheight Vehicle Collisions with
Highway Bridges. University of Maryland, Department of Civil & Environmental
Engineering. College Park: Transportation Research Board of the National Academies.
Retrieved December 7, 2014
Gangi, M. (2015). Nonlinear Beam Modeling of the Repair of Impact-Damaged Prestressed
Bridge Girders. Virginia Polytechnic and State University, Department of Civil and
Environmental Engineering. Blacksburg: Virginia Center for Transportation Innovation
and Research.
Harries, K. A., Kasan, J., & Aktas, C. (2009). Repair Methods for Prestressed Girder Bridges.
University of Pittsburgh, Department of Civil and Environmental Engineering.
Harrisburg: Commonwelth of Pennsylvania Department of Transportation.
Harries, K. A., Kasan, J., Miller, R., & Brinkman, R. (2012). Updated Research for Collision
Damage and Repair of Prestressed Concrete Beams. NCHRP Project 20-07, Task 307,
University of Pittsburgh, Department of Civil Engineering, Pittsburgh. Retrieved
December 10, 2014
Hognestad, E. (1956). Ultimate Strength of Reinforced Concrete in American Design Practice.
Research and Development Laboratories. London: Portland Cement Association.
International Code Council Evaluation Service. (2014). ICC-ES Evaluation Report - V-Wrap
Fiber-Reinforced Polymer Composite System. Hanover: Structural Technologies, LLC.

134
Jones, M. (2015). Repair Techniques of Impact Damaged Prestressed Bridge Girders Using
Strand Splice and Fiber Reinforced Cementitious Matrix. Virginia Polytechnic Institute
and State University, Department of Civil and Environmental Engineering. Blacksburg:
Virginia Center for Transportation Innovation and Research.
Kasan, J. L. (2009). Structural Repair of Prestressed Concrete Bridge Girders. University of
Pittsburgh, Department of Civil and Environmental Engineering . Pittsburgh: Swanson
School of Engineering. Retrieved December 7, 2014
Loflin, B. J. (2008). Bond and Material Properties of Grade 270 and Grade 300 Prestressing
Strands. Virginia Polytechnic Institute and State University, Department of Civil and
Environmental Engineering. Blacksburg: Virginia Transportation Research Council.
Michael, A. (2010, August 2). Moment-Curvature: Bonded Tendons. Retrieved May 5, 2015,
from Frederick University, Department of Civil Engineering ACES 480 Class Notes:
http://staff.fit.ac.cy/eng.ma/Aces480notes/Prestressed_Moment_Curvature.pdf
Nanni, A., Huang, P. C., & Tumialan, J. G. (2001). Strengthening of Impact Damaged Bridge
Girder Using FRP Laminates. University of Missouri - Rolla, Center for Infrastructure
Engineering Studies, Rolla.
Nilson, A. H. (1987). Design of Prestressed Concrete (2nd ed.). New York, New York, United
States: John Wiley & Sons.
Park, R., & Ruitong, D. (1988, March 1). Ductility of Doubly Reinforced Concrete Beam
Sections. American Concrete Institute Structural Journal, 85(2), 217-225.
doi:10.14359/2760

135
Pino, V., & Nanni, A. (2015). Repair of Damaged Prestressed Concrete Girder with Fabric
Reinforced Cementitious Matrix and Fiber Reinforced Polymer Composites. University
of Miami, College of Engineering, Gables.
Prestress Supply Incorporated. (2010). Grabb-It Cable Splice. Retrieved December 12, 2014,
from Prestress Supply:
http://www.prestresssupply.com/Products/StrandRepair/GRABBITCableSplice.aspx
Rasheed, H. A. (2015). Strengthening Design of Reinforced Concrete with FRP. (E. J. Barbero,
Ed.) Boca Raton, Florida, United States of America: CRC Press.
Salomon, A. L. (2014, July 23). Tension Testing. Blacksburg, Virginia, United States of
America.
Structural Group Incorporated. (2015). Structural Technologies. Retrieved May 1, 2015, from
Structural Technologies, A Structural Group Company:
http://www.structuraltechnologies.com
Taly, N. (2015). Highway Bridge Superstructure Engineering: LRFD Approaches to Design and
Analysis. Boca Raton, Florida, United States of America: CRC Press.
Wipf, T. J., Klaiber, F. W., Rhodes, J. D., & Kempers, B. J. (2004a). Effective Structural
Concrete Repair. Iowa State University of Science and Technology, Department of Civil,
Construction and Environmental Engineering. Ames: Iowa Department of Transpotation.
Wipf, T. J., Klaiber, F. W., Rhodes, J. D., & Kempers, B. J. (2004b). Effective Structural
Concrete Repair: Repair of Impact Damaged Prestressed Concrete Beams with Carbon
Fiber Reinforced Polymer (CFRP). Iowa State University, Department of Civil,
Construction, and Environmental Engineering. Ames: Iowa Department of
Transportation. Retrieved December 12, 2014

136
YRC Worldwide. (2015). Trailer Dimensions. (WordPress.com) Retrieved February 8, 2015,
from YRC Freight: http://yrc.com/trailer-dimensions/
Zobel, R. S., Jirsa, J. O., Fowler, D. W., & Carrasquillo, R. L. (1997). Evaluation and Repair of
Impact-Damaged Prestressed Concrete Bridge Girders. The University of Texas at
Austin, Center for Transportatio Research. Austin: Texas Department of Transportation.
Retrieved December 12, 2014
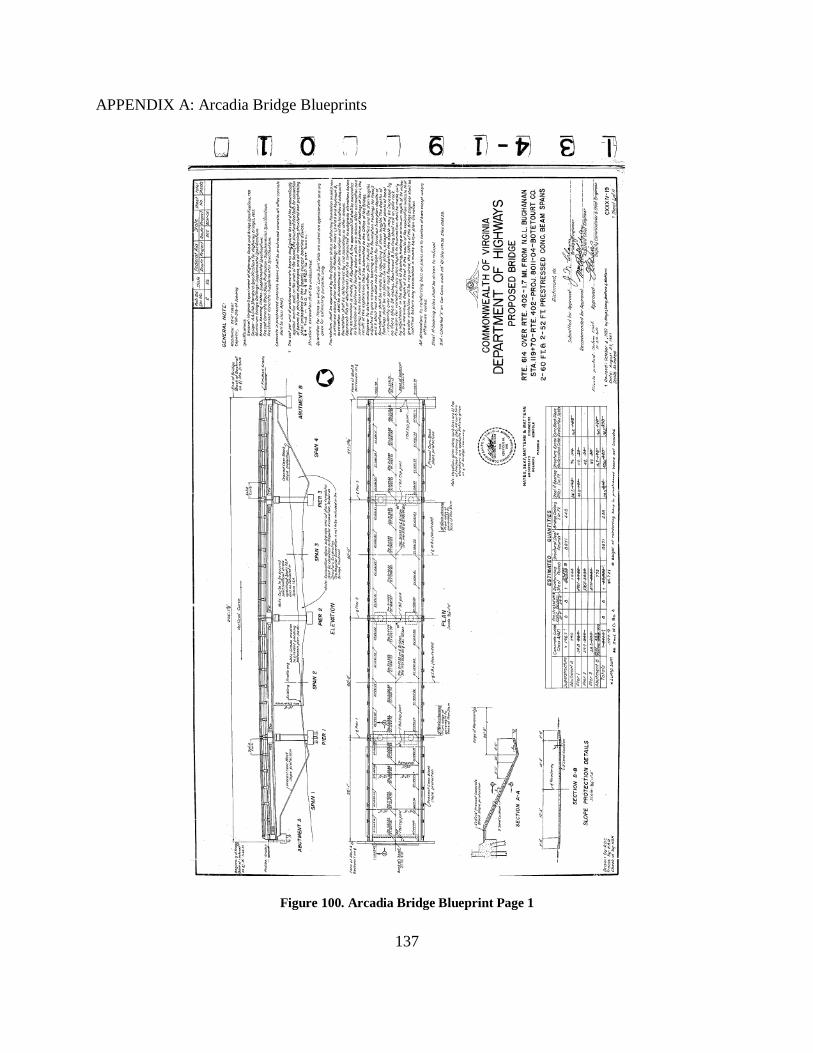
137
APPENDIX A: Arcadia Bridge Blueprints
Figure 100. Arcadia Bridge Blueprint Page 1

138
Figure 101. Arcadia Bridge Blueprint Page 2

139
Figure 102. Arcadia Bridge Blueprint Page 3
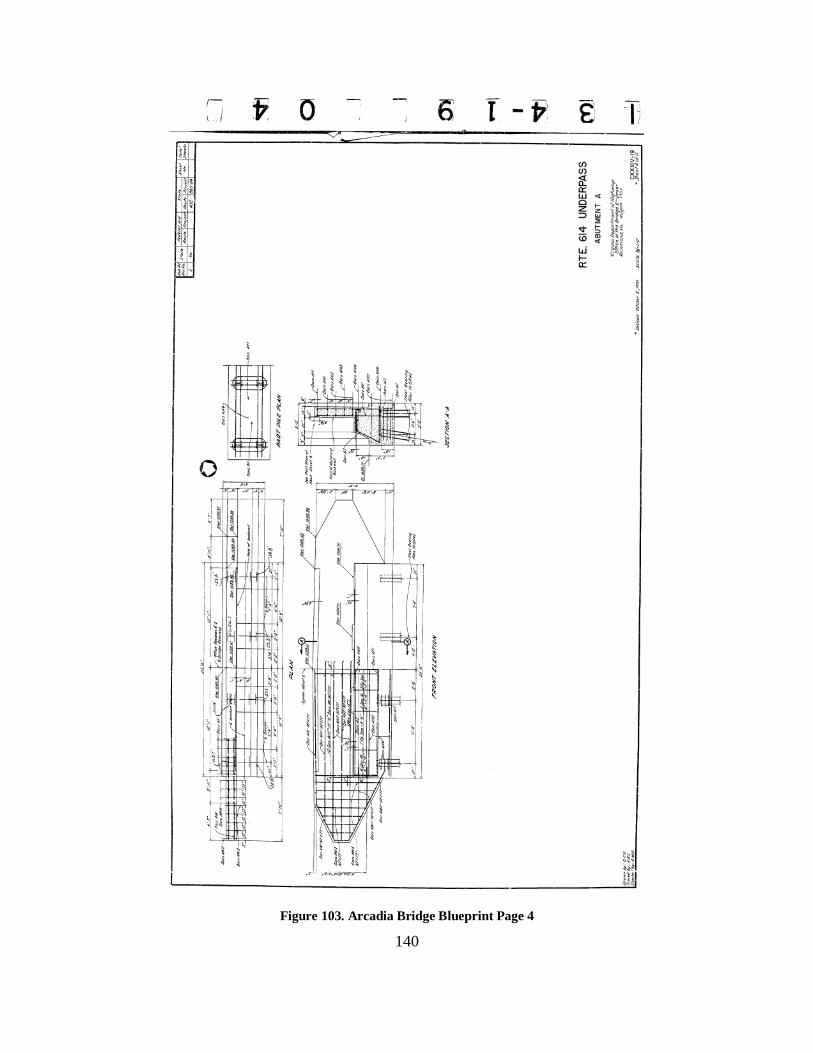
140
Figure 103. Arcadia Bridge Blueprint Page 4
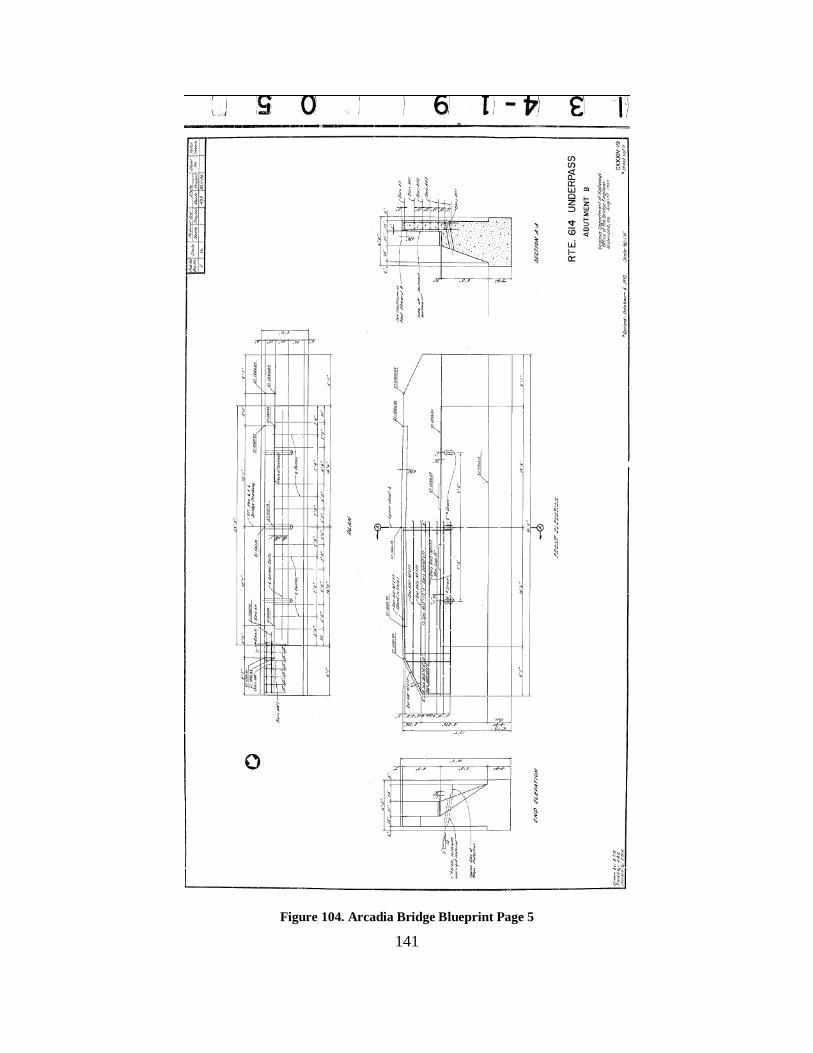
141
Figure 104. Arcadia Bridge Blueprint Page 5

142
Figure 105. Arcadia Bridge Blueprint Page 6
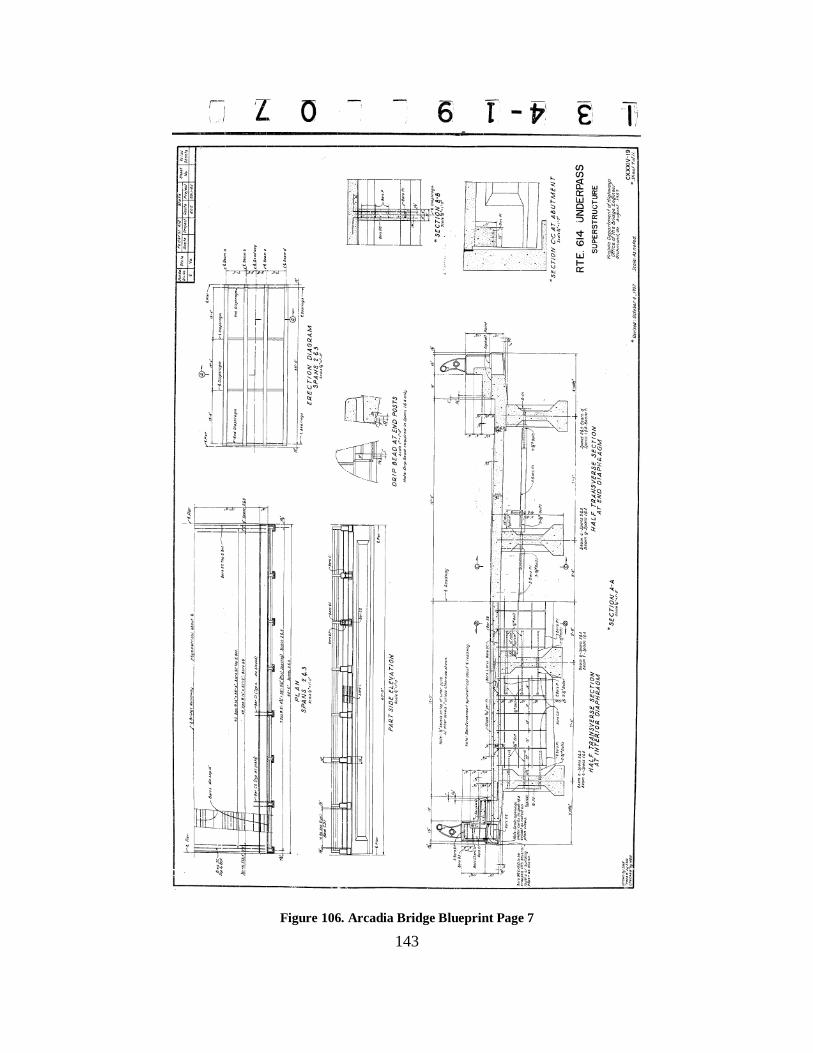
143
Figure 106. Arcadia Bridge Blueprint Page 7
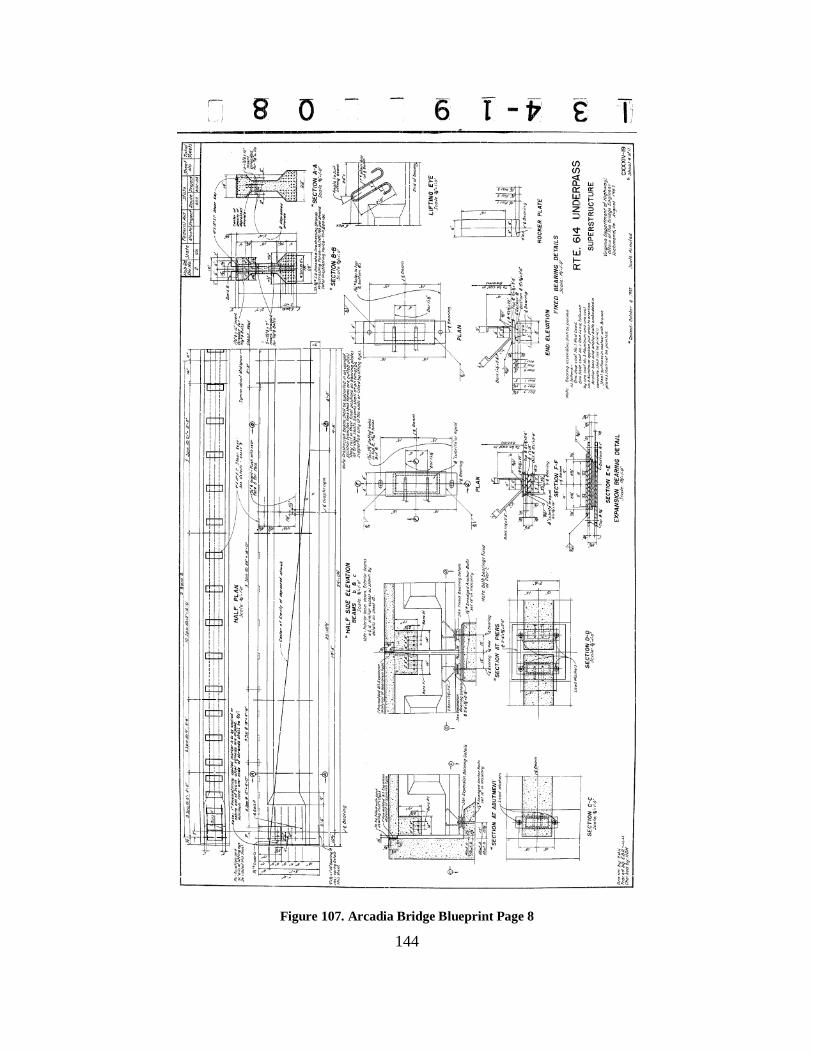
144
Figure 107. Arcadia Bridge Blueprint Page 8
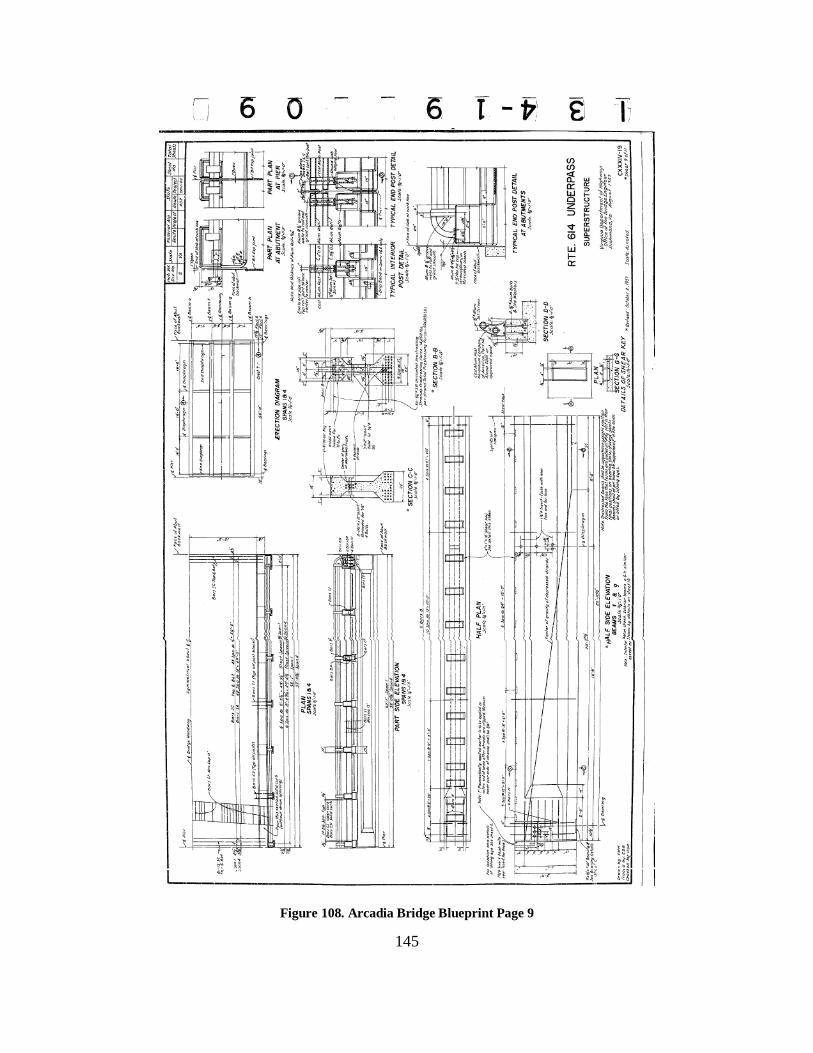
145
Figure 108. Arcadia Bridge Blueprint Page 9
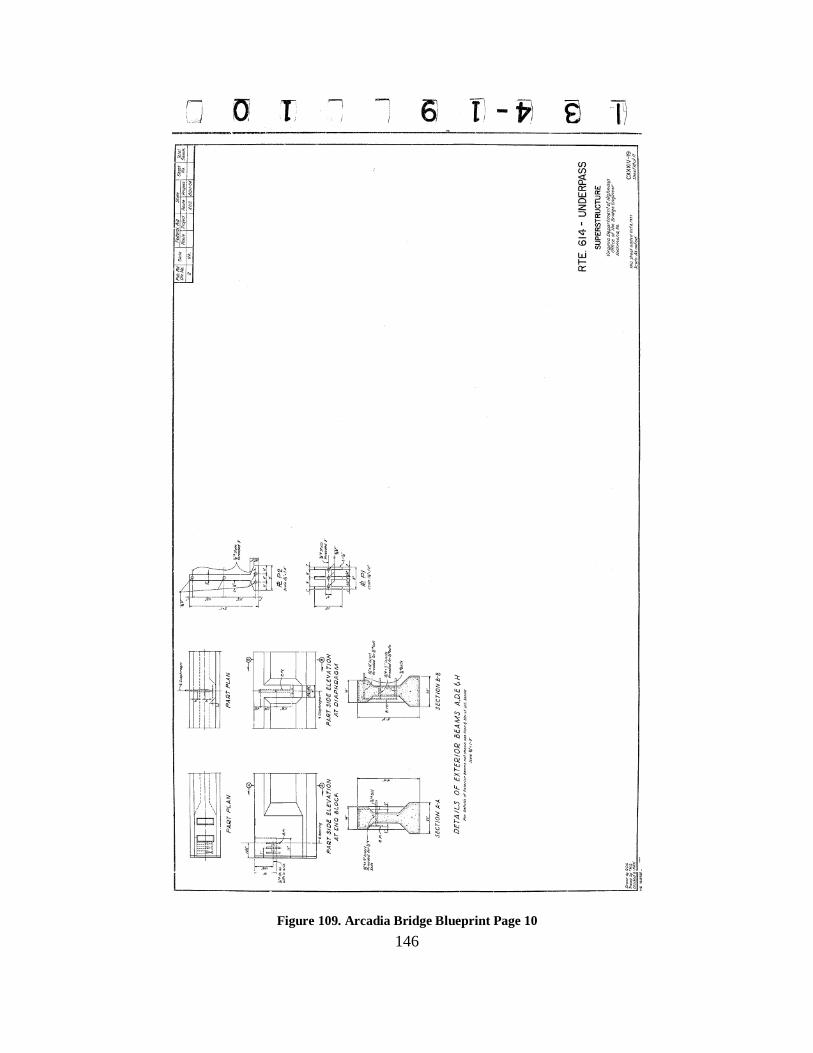
146
Figure 109. Arcadia Bridge Blueprint Page 10
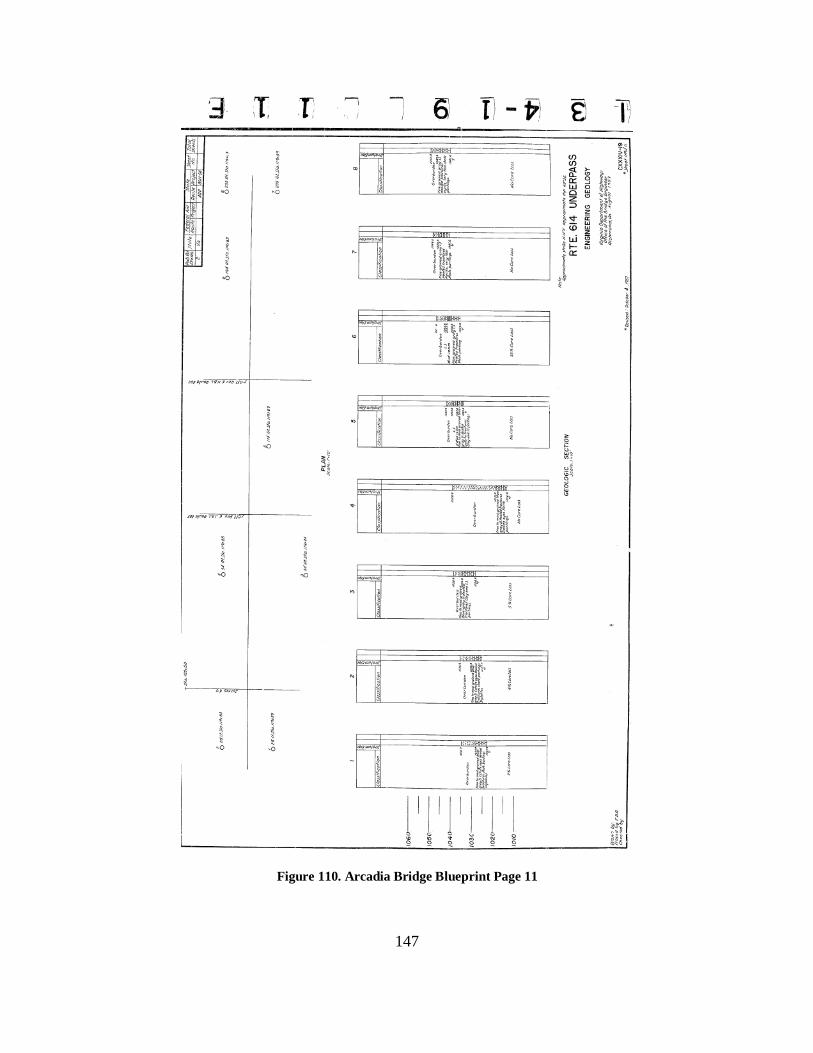
147
Figure 110. Arcadia Bridge Blueprint Page 11
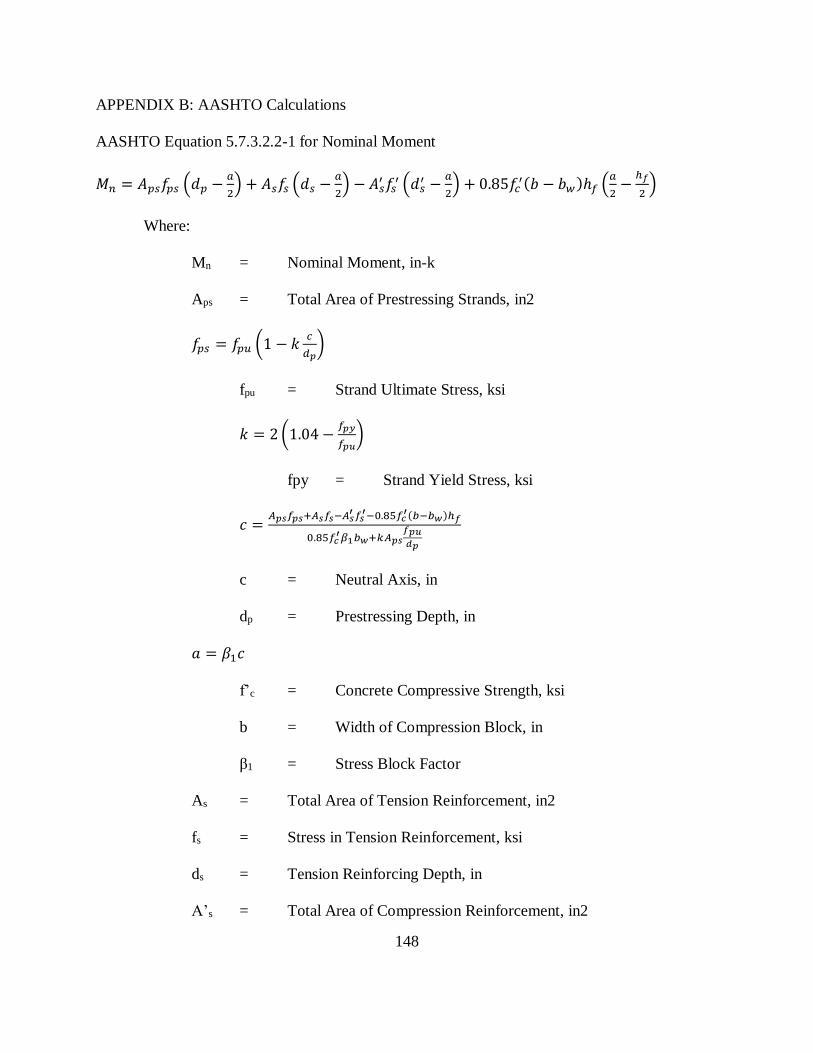
148
APPENDIX B: AASHTO Calculations
AASHTO Equation 5.7.3.2.2-1 for Nominal Moment
𝑀𝑛 = 𝐴𝑝𝑠𝑓𝑝𝑠 (𝑑𝑝 −𝑎
2) + 𝐴𝑠𝑓𝑠 (𝑑𝑠 −
𝑎
2) − 𝐴𝑠
′ 𝑓𝑠′ (𝑑𝑠
′ −𝑎
2) + 0.85𝑓𝑐
′(𝑏 − 𝑏𝑤)ℎ𝑓 (𝑎
2−
ℎ𝑓
2)
Where:
Mn = Nominal Moment, in-k
Aps = Total Area of Prestressing Strands, in2
𝑓𝑝𝑠 = 𝑓𝑝𝑢 (1 − 𝑘𝑐
𝑑𝑝)
fpu = Strand Ultimate Stress, ksi
𝑘 = 2 (1.04 −𝑓𝑝𝑦
𝑓𝑝𝑢)
fpy = Strand Yield Stress, ksi
𝑐 =𝐴𝑝𝑠𝑓𝑝𝑠+𝐴𝑠𝑓𝑠−𝐴𝑠
′ 𝑓𝑠′−0.85𝑓𝑐
′(𝑏−𝑏𝑤)ℎ𝑓
0.85𝑓𝑐′𝛽1𝑏𝑤+𝑘𝐴𝑝𝑠
𝑓𝑝𝑢
𝑑𝑝
c = Neutral Axis, in
dp = Prestressing Depth, in
𝑎 = 𝛽1𝑐
f’c = Concrete Compressive Strength, ksi
b = Width of Compression Block, in
β1 = Stress Block Factor
As = Total Area of Tension Reinforcement, in2
fs = Stress in Tension Reinforcement, ksi
ds = Tension Reinforcing Depth, in
A’s = Total Area of Compression Reinforcement, in2

149
f’s = Stress in Compression Reinforcement, ksi
d’s = Compression Reinforcing Depth, in
bw = Web Width, in
hf = Compression Flange Depth, in
AASHTO Equation 5.7.3.3.2-1 for Cracking Moment
𝑀𝑐𝑟 = 𝛾3 [(𝛾1𝑓𝑟 + 𝛾2𝑓𝑐𝑝𝑒)𝑆𝑐 − 𝑀𝑑𝑛𝑐 (𝑆𝑐
𝑆𝑛𝑐− 1)]
Where:
Sc = Composite Tensile Section Modulus, in3
fr = Concrete Modulus of Rupture, ksi
fcpe = Compressive Stress from Prestress, ksi
Mdnc = Unfactored Dead Load Moment on Non-Composite Section, in-k
Snc = Non-Composite Tensile Section Modulus, in3
γ1 = Flexural Cracking Variability Factor = 1.6
γ2 = Prestress Variability Factor = 1.1
γ3 = Reinforcement Ratio of Yield to Tensile Strength = 1.0

150
Table 32. Test 1 AASHTO Calculations
Tested Properties Design Properties
Concrete Properties Concrete Properties
Girder Concrete Strength, f'c 6650 psi Girder Concrete Strength, f'c 5000 psi
Deck Concrete Strength, f'c 6020 psi Deck Concrete Strength, f'c 4000 psi
Deck Height, hd 8.75 in Deck Height, hd 8.75 in
Top Flange Height, htf 7 in Top Flange Height, htf 7 in
Deck Width, bd 16 in Deck Width, bd 16 in
Top Flange Width, btf 16 in Top Flange Width, btf 16 in
Web Width, bw 7 in
Steel Properties
# Strands 50 ea Steel Properties
Strand Diameter, Ds 0.375 in # Strands 50 ea
Area of Strand, As (each) 0.08 in2 Strand Diameter, Ds 0.375 in
Total Strand Area, Aps 4 in2 Area of Strand, As (each) 0.08 in2
Ultimate Stress, fpu (ε=.06) 262 ksi Total Strand Area, Aps 4 in2
Yield Stress, fpy (ε=.009) 242 ksi Ultimate Stress, fpu (ε=.06) 250 ksi
Yield Stress, fpy (ε=.009) 210 ksi
AASHTO Calculations
k 0.233 AASHTO Calculations
β1, deck 0.75 k 0.4
dp 46.4 in β1, deck 0.85
c 15.7 in dp 46.4 in
a 11.8 in c 18.0 in
fps 241 ksi a 15.3 in
Mn 39099 in-k fps 211 ksi
3258 k-ft Mn 32655 in-k
2721 k-ft

151
Table 33. Test 2 AASHTO Calculations
Tested Properties Design Properties
Concrete Properties Concrete Properties
Girder Concrete Strength, f'c 6650 psi Girder Concrete Strength, f'c 5000 psi
Deck Concrete Strength, f'c 6020 psi Deck Concrete Strength, f'c 4000 psi
Deck Height, hd 8.75 in Deck Height, hd 8.75 in
Top Flange Height, htf 7 in Top Flange Height, htf 7 in
Deck Width, bd 11 in Deck Width, bd 11 in
Top Flange Width, btf 16 in Top Flange Width, btf 16 in
Web Width, bw 7 in Web Width, bw 7 in
Steel Properties Steel Properties
# Strands 42 ea # Strands 42 ea
Strand Diameter, Ds 0.375 in Strand Diameter, Ds 0.375 In
Area of Strand, As (each) 0.08 in2 Area of Strand, As (each) 0.08 in2
Total Strand Area, Aps 3 in2 Total Strand Area, Aps 3 in2
Ultimate Stress, fpu (ε=.06) 262 Ksi Ultimate Stress, fpu (ε=.06) 250 Ksi
Yield Stress, fpy (ε=.009) 242 Ksi Yield Stress, fpy (ε=.009) 210 Ksi
# Splices 8 # Splices 8
Total Strand Splice Area 0.64 in2 Total Strand Splice Area 0.64 in2
Splice Ultimate Stress, fpu 262 ksi Splice Ultimate Stress, fpu 225 ksi
Splice Yield Stress, fpy 242 ksi Splice Yield Stress, fpy 210 ksi
Average Ultimate Stress 262 ksi Average Ultimate Stress 246 ksi
Average Yield Stress 242 ksi Average Yield Stress 210 ksi
AASHTO Calculations AASHTO Calculations
k 0.233 k 0.373
β1, deck 0.75 β1, deck 0.85
dp 47.7 in dp 47.7 in
c 22.7 in c 27.6 in
a 17.0 in a 23.4 in
fps 233 ksi fps 193 ksi
Mn 36691 in-k Mn 28576 in-k
3058 k-ft 2381 k-ft
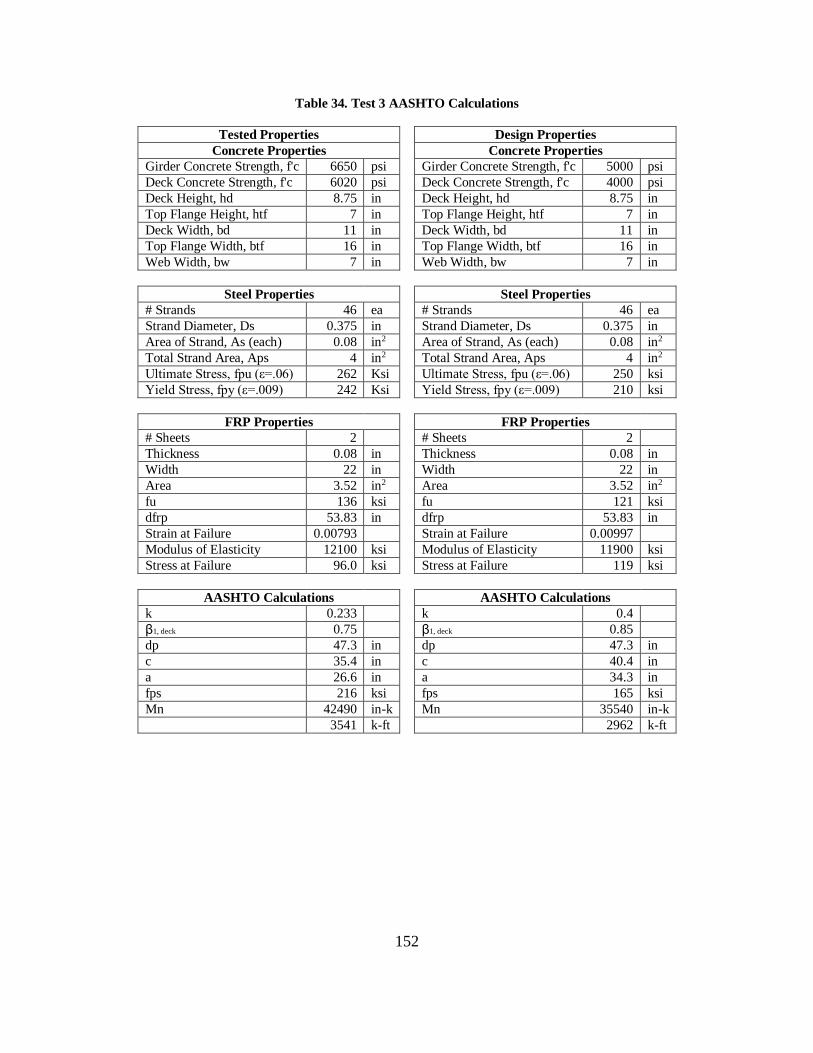
152
Table 34. Test 3 AASHTO Calculations
Tested Properties Design Properties
Concrete Properties Concrete Properties
Girder Concrete Strength, f'c 6650 psi Girder Concrete Strength, f'c 5000 psi
Deck Concrete Strength, f'c 6020 psi Deck Concrete Strength, f'c 4000 psi
Deck Height, hd 8.75 in Deck Height, hd 8.75 in
Top Flange Height, htf 7 in Top Flange Height, htf 7 in
Deck Width, bd 11 in Deck Width, bd 11 in
Top Flange Width, btf 16 in Top Flange Width, btf 16 in
Web Width, bw 7 in Web Width, bw 7 in
Steel Properties Steel Properties
# Strands 46 ea # Strands 46 ea
Strand Diameter, Ds 0.375 in Strand Diameter, Ds 0.375 in
Area of Strand, As (each) 0.08 in2 Area of Strand, As (each) 0.08 in2
Total Strand Area, Aps 4 in2 Total Strand Area, Aps 4 in2
Ultimate Stress, fpu (ε=.06) 262 Ksi Ultimate Stress, fpu (ε=.06) 250 ksi
Yield Stress, fpy (ε=.009) 242 Ksi Yield Stress, fpy (ε=.009) 210 ksi
FRP Properties FRP Properties
# Sheets 2 # Sheets 2
Thickness 0.08 in Thickness 0.08 in
Width 22 in Width 22 in
Area 3.52 in2 Area 3.52 in2
fu 136 ksi fu 121 ksi
dfrp 53.83 in dfrp 53.83 in
Strain at Failure 0.00793 Strain at Failure 0.00997
Modulus of Elasticity 12100 ksi Modulus of Elasticity 11900 ksi
Stress at Failure 96.0 ksi Stress at Failure 119 ksi
AASHTO Calculations AASHTO Calculations
k 0.233 k 0.4
β1, deck 0.75 β1, deck 0.85
dp 47.3 in dp 47.3 in
c 35.4 in c 40.4 in
a 26.6 in a 34.3 in
fps 216 ksi fps 165 ksi
Mn 42490 in-k Mn 35540 in-k
3541 k-ft 2962 k-ft
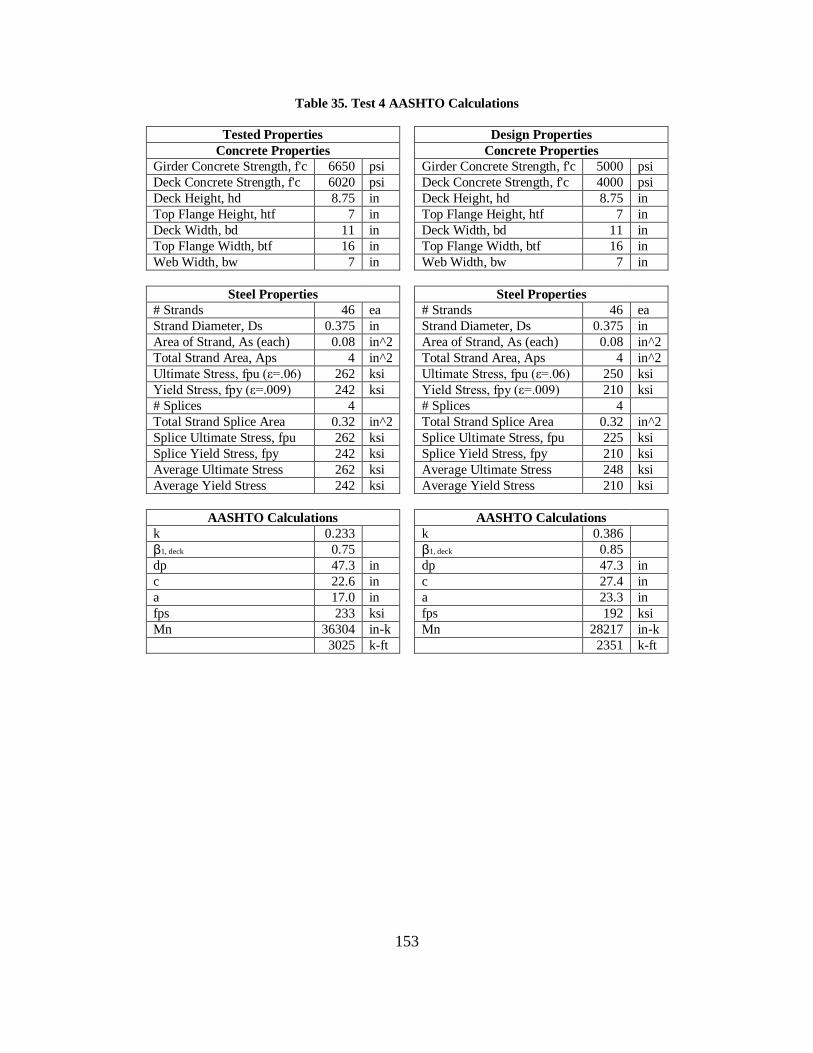
153
Table 35. Test 4 AASHTO Calculations
Tested Properties Design Properties
Concrete Properties Concrete Properties
Girder Concrete Strength, f'c 6650 psi Girder Concrete Strength, f'c 5000 psi
Deck Concrete Strength, f'c 6020 psi Deck Concrete Strength, f'c 4000 psi
Deck Height, hd 8.75 in Deck Height, hd 8.75 in
Top Flange Height, htf 7 in Top Flange Height, htf 7 in
Deck Width, bd 11 in Deck Width, bd 11 in
Top Flange Width, btf 16 in Top Flange Width, btf 16 in
Web Width, bw 7 in Web Width, bw 7 in
Steel Properties Steel Properties
# Strands 46 ea # Strands 46 ea
Strand Diameter, Ds 0.375 in Strand Diameter, Ds 0.375 in
Area of Strand, As (each) 0.08 in^2 Area of Strand, As (each) 0.08 in^2
Total Strand Area, Aps 4 in^2 Total Strand Area, Aps 4 in^2
Ultimate Stress, fpu (ε=.06) 262 ksi Ultimate Stress, fpu (ε=.06) 250 ksi
Yield Stress, fpy (ε=.009) 242 ksi Yield Stress, fpy (ε=.009) 210 ksi
# Splices 4 # Splices 4
Total Strand Splice Area 0.32 in^2 Total Strand Splice Area 0.32 in^2
Splice Ultimate Stress, fpu 262 ksi Splice Ultimate Stress, fpu 225 ksi
Splice Yield Stress, fpy 242 ksi Splice Yield Stress, fpy 210 ksi
Average Ultimate Stress 262 ksi Average Ultimate Stress 248 ksi
Average Yield Stress 242 ksi Average Yield Stress 210 ksi
AASHTO Calculations AASHTO Calculations
k 0.233 k 0.386
β1, deck 0.75 β1, deck 0.85
dp 47.3 in dp 47.3 in
c 22.6 in c 27.4 in
a 17.0 in a 23.3 in
fps 233 ksi fps 192 ksi
Mn 36304 in-k Mn 28217 in-k
3025 k-ft 2351 k-ft

154
APPENDIX C: Strain-Compatibility Moment-Curvature Calculations
The following tables show the properties used to determine the moment-curvature
relationships using strain-compatibility for each test.
Table 36. Test 1 Moment-Curvature Calculations
Concrete Properties Steel Properties
Girder Concrete
Strength, f'c 6650 psi Web Area, Aw 133 in2 # Strands 50 ea
Deck Concrete
Strength, f'c 6020 psi
Bottom Haunch Area,
Abh 109 in2
Strand Diameter,
Ds 0.375 in
Modular Ratio, n 0.905
Bottom Flange Area,
Abf 154 in2 Area of Strand, As 0.08 in2
Deck Height, hd 8.75 in Total Girder Area, Ag 396 in2
Total Strand Area,
Aps 4 in2
Top Flange Height, htf 7 in Deck Transformed Area, Adt 127 in2 Strand COG, cgps 7.15 in
Top Haunch Height,
hth 4.5 in
Composite Area
Transformed, Act 522 in2
Depth of Strands,
dps 46.6 in
Web Height, hw 19 in
Deck Moment of
Inertia, Id 893 in4 Ultimate Stress, fpu 250 ksi
Bottom Haunch Height,
hbh 7.5 in
Deck Transformed
Moment of Inertia, Idt 809 in4 Ultimate Strain, ε 0.06
Bottom Flange Height,
hbf 7 in
Girder Moment of
Inertia, Ig 125165 in4
Modulus of
Elasticity, Eps 27000 ksi
Girder Height, hg 45 in
Total Moment of
Inertia, I 207157 in4
Effective Prestress,
fpe 132 ksi
Total Height, h 53.8 in
Deck Center of
Gravity, yg 49.4 in Yield Stress, fpy 242 ksi
Deck Width, bd 16 in
Girder Center of
Gravity, yg 20.3 in Yield Strain, ε 0.009
Transformed Deck
Width, btd 14.5 in
Composite Center of
Gravity, yc 27.3 in fp (ε=.015) 246 ksi
Top Flange Width, btf 16 in
Transformed Top to
COG, ctt 26.4 in ε (fp=246.18) 0.015
Top Haunch Width, bth 4.5 in
Transformed Bottom
to COG, ctb 27.3 in fp (ε=.009) 242 ksi
Web Width, bw 7 in Girder Modulus of Elasticity, Ecg 4648 ksi ε (fp=241.91) 0.009
Bottom Haunch Width,
bbh 7.5 in Ultimate Strain, εcu 0.003
Effective Prestress
Force, Pe 528 k
Bottom Flange Width,
bbf 22 in 0.5f'c 3325 psi Eccentricity, e 20.2 in
Deck Area, Ad 140 in2 Strain, ε (3.3 ksi) 0.000715
Top Flange Area, Atf 112 in2 0.5f'c 3325 psi
Top Haunch Area, Ath 51.8 in2 ∆ 0 psi
ε0 0.00244

155
No applied Moment Prestress Decompression
Top Fiber Stress Decompression Stress in Straind, fps 144 ksi
Pe/A -1.01 ksi Decompression Force, Pdecomp 576 k
Peectop/I 1.36 ksi Top Fiber Stress
ft 0.349 ksi Pe/A -1.10 ksi
Bottom Fiber Stress Peectop/I 1.48 ksi
Pe/A -1.01 ksi ft 0.38 ksi
Peecbott/I -1.41 ksi Bottom Fiber Stress
fb -2.42 ksi Pe/A -1.10 ksi
Curvature Peecbott/I -1.53 ksi
Top Fiber Strain, εt 0.000075 fb -2.64 ksi
75 με Curvature
Bottom Fiber Strain, εb -0.000520 Neutral Axis Depth, c 6.77 in
-520 με Required Steel Stress, fps 2.24 ksi
Neutral Axis Depth, c 6.77 in Additional Top Stress, ft2 3.05 ksi
Curvature, Φ -0.0000111 ε/in Additional Bottom Stress, fb2 3.05 ksi
-11.1 με/in Second Neutral Axis Depth, c2 26.9 in
Steel Strain Increase,
ε2 0.000441 Top Fiber Stress, ft 2.67 ksi
441 με Bottom Fiber Stress, fb 0.409 ksi
Prestress Steel Strain,
ε1 0.00489 Top Fiber Strain, εt 0.000573
4889 με Curvature, Φ 0.0000123 ε/in
Total Steel Strain,
ε1+ε2 0.00533 12.3 με/in
5330 με Moment, M 22926457 in-lbs
Moment, M 0 in-lbs 1911 k-ft
0 k-ft
Cracking Stress
Cracking Stress, fr 0.424 ksi
Bottom Fiber Stress at Decompression,
fb 0.409 ksi
Additional Stress to Crack, fbadd 0.0150 ksi
Additional Moment to Crack, Madd 113750 in-k
Curvature
Top Fiber Stress, ft 2.68 ksi
Bottom Fiber Stress, fb 0.424 ksi
Top Fiber Strain, εt 0.000577
Bottom Fiber Strain, εb 0.0000912
Curvature, Φ 0.0000124 ε/in
12.4 με/in
Moment, M 23040206 in-lbs
1920 k-ft

156
Strand Strain is 0.009 Top Fiber Strain is 0.0015 Top Fiber Strain is 0.003
Strand
Strain, εs 0.009
Top Fiber
Strain, εt 0.0015
Top Fiber
Strain, εt 0.003
Stress in
Strand, fps 242 ksi
Neutral Axis
Depth, c 17.8 in
Neutral Axis
Depth, c 13.7 in
Tensile
Force, T 968 k Curvature, Φ 0.0000843 ε/in Curvature, Φ 0.000219 ε/in
Neutral Axis
Depth, c 16.3 in 84.3 με/in 219 με/in
Top Fiber
Strain, εt 0.00197
Compression
Force, Cc1 836982 lbs
Compression
Force, Cc1 959280 lbs
Curvature, Φ 0.000121 ε/in
Compression
Force, Cc2 25483 lbs
Compression
Force, Cc2 19040 lbs
121 με/in Compression Force, Cc3 1905 lbs
Compression Force, Cc3 0 lbs
Compression
Force, Cc1 927570 lbs
Compression
Force, Cc 860560 lbs
Compression
Force, Cc 978320 lbs
Compression
Force, Cc2 24963 lbs 861 k 978 k
Compression
Force, Cc3 55.4 lbs
Compatible
Steel Strain,
εcomp 0.00243
Compatible
Steel Strain,
εcomp 0.00718
Compression
Force, Cc 952478 lbs
Incompatible
Steel Strain,
εic 0.00533
Incompatible
Steel Strain,
εic 0.00533
952 k
Steel Strain,
εps 0.00776
Steel Strain,
εps 0.0125
Equilibrium 15.2 lbs fps 215 fps 245
xbar 1 10.4 in
Tensile
Force, T 861 kips
Tensile
Force, T 978 kips
xbar 2 4.95 in Equilibrium 0 lbs Equilibrium 0 lbs
xbar 3 0.369 in xbar 1 11.5 in xbar 1 8.36 in
Moment, M1 37718847 in-lbs xbar 2 5.94 in xbar 2 3.25 in
Moment, M2 879761 in-lbs xbar 3 1.36 xbar 3 -1.36
Moment, M3 1699 in-lbs Moment, M1 33720486 in-lbs Moment, M1 39551404 in-lbs
Moment, M 38596909 in-lbs Moment, M2 885495 in-lbs Moment, M2 687678 in-lbs
3216 k-ft Moment, M3 57456 Moment, M3 0
Moment, M 34548525 in-lbs Moment, M 40239081 in-lbs
2879 k-ft 3353 k-ft

157
Table 37. Test 2 Moment-Curvature Calculations
Concrete Properties Steel Properties
Girder Concrete
Strength, f'c 6650 psi Deck Area, Ad 96.3 in2 # Strands 42 ea
Deck Concrete
Strength, f'c 6020 psi
Top Flange Area,
Atf 112 in2 # Repaired Strands 8 ea
Modular Ratio, n 0.905
Top Haunch Area,
Ath 51.8 in2
Strand Diameter,
Ds 0.375 in
Deck Height, hd 8.75 in Web Area, Aw 133 in2
Area of Strand, As
(each) 0.08 in2
Top Flange Height, htf 7 in
Bottom Haunch Area, Abh 109 in2
Undamaged Strand Area 3.36
Top Haunch
Height, hth 4.5 in
Bottom Flange
Area, Abf 154 in2
Repaired Strand
Area 0.64
Web Height, hw 19 in
Total Girder Area,
Ag 0 in2
Total Strand Area,
Aps (total) 4 in2
Bottom Haunch
Height, hbh 7.5 in
Deck Transformed
Area, Adt 87.1 in2
Strand Center of
Gravity, cgps 6.08 In
Bottom Flange
Height, hbf 7 in
Composite
Transformed Area,
Act 87 in2
Depth of Strands,
dps 47.7 In
Girder Height, hg 45 in
Deck Moment of
Inertia, Id 614 in4
Ultimate Stress,
fpu 250 Ksi
Total Height, h 53.8 in
Deck Transformed
Moment of Inertia,
Idt 556 in4 Ultimate Strain, ε 0.06
Deck Width, bd 11 in
Girder Moment of
Inertia, Ig 125165 in4
Modulus of
Elasticity, Eps 27000 ksi
Transformed
Deck Width, btd 9.96 in
Total Moment of
Inertia, I 125721 in4
Effective
Prestress, fpe 132 ksi
Top Flange Width, btf 16 in
Deck Center of Gravity, yg 49.4 in Yield Stress, fpy 242 ksi
Top Haunch
Width, bth 4.5 in
Girder Center of
Gravity, yg 20.3 in Yield Strain, ε 0.009
Web Width, bw 7 in
Composite Center of
Gravity, yc 49.4 in fp (ε=.015) 246 ksi
Bottom Haunch
Width, bbh 7.5 in
Transformed Top to
COG, ctt 4.4 in ε (fp=246.18) 0.015
Bottom Flange
Width, bbf 22 in
Transformed
Bottom to COG, ctb 49.4 in fp (ε=.009) 242 ksi
Girder Modulus of
Elasticity, Ecg 4648 ksi ε (fp=241.91) 0.009
Ultimate Strain, εcu 0.003
Undamaged
Prestress Force 444 k
0.5f'c 3325 psi
Repaired Prestress
Force 67.6 k
Strain, ε (3.3 ksi) 0.000715
Effective Prestress
Force, Pe 511 k
0.5f'c 3325 psi Eccentricity, e 43.3 in
∆ 0 psi
ε0 0.00244

158
No applied Moment Prestress Decompression
Top Fiber Stress Decompression Stress in Straind, fps 210 ksi
Pe/A -5.87 ksi Decompression Force, Pdecomp 841 k
Peectop/I 0.77 ksi Top Fiber Stress
ft -5.10 ksi Pe/A -9.66 ksi
Bottom Fiber Stress Peectop/I 1.27 ksi
Pe/A -5.87 ksi ft -8.39 ksi
Peecbott/I -8.69 ksi Bottom Fiber Stress
fb -14.6 ksi Pe/A -9.66 ksi
Curvature Peecbott/I -14.3 ksi
Top Fiber Strain, εt -0.00110 fb -24.0 ksi
-1096 με Curvature
Bottom Fiber Strain, εb -0.00313 Neutral Axis Depth, c -29.0 in
-3132 με Required Steel Stress, fps 22.2 ksi
Neutral Axis Depth, c -29.0 in Additional Top Stress, ft2 28.7 ksi
Curvature, Φ -0.0000379 ε/in Additional Bottom Stress, fb2 28.7 ksi
-37.9 με/in Second Neutral Axis Depth, c2 26.9 in
Steel Strain Increase,
ε2 0.00290 Top Fiber Stress, ft 37.1 ksi
2901 με Bottom Fiber Stress, fb 4.73 ksi
Prestress Steel Strain,
ε1 0.00489 Top Fiber Strain, εt 0.00798
4889 με Curvature, Φ 0.000167 ε/in
Total Steel Strain,
ε1+ε2 0.00779 167 με/in
7790 με Moment, M 64465816 in-lbs
Moment, M 0 in-lbs 5372 k-ft
0 k-ft
Cracking Stress
Cracking Stress, fr 0.424 ksi
Bottom Fiber Stress at Decompression,
fb 4.73 ksi
Additional Stress to Crack, fbadd -4.31 ksi
Additional Moment to Crack, Madd -10962298 in-k
Curvature
Top Fiber Stress, ft 32.8 ksi
Bottom Fiber Stress, fb 0.424 ksi
Top Fiber Strain, εt 0.00705
Bottom Fiber Strain, εb 0.0000912
Curvature, Φ 0.000133 ε/in
133 με/in
Moment, M 53503518 in-lbs
4459 k-ft
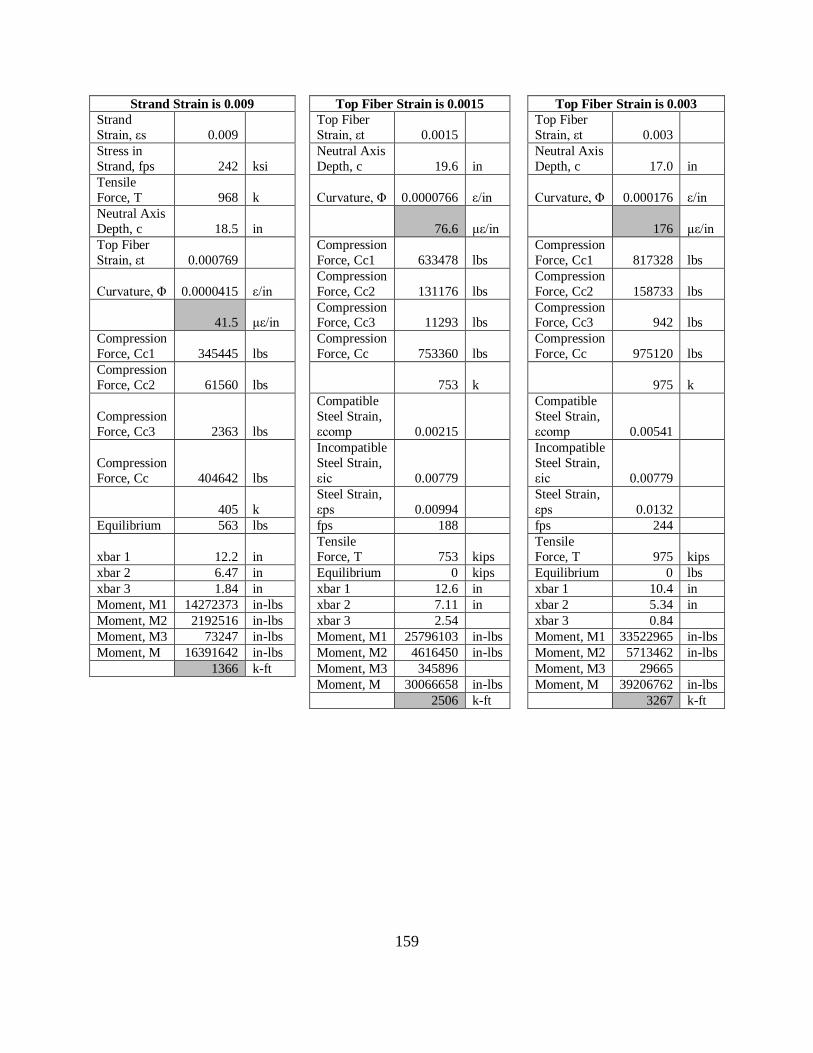
159
Strand Strain is 0.009 Top Fiber Strain is 0.0015 Top Fiber Strain is 0.003
Strand
Strain, εs 0.009
Top Fiber
Strain, εt 0.0015
Top Fiber
Strain, εt 0.003
Stress in
Strand, fps 242 ksi
Neutral Axis
Depth, c 19.6 in
Neutral Axis
Depth, c 17.0 in
Tensile
Force, T 968 k Curvature, Φ 0.0000766 ε/in Curvature, Φ 0.000176 ε/in
Neutral Axis
Depth, c 18.5 in 76.6 με/in 176 με/in
Top Fiber
Strain, εt 0.000769
Compression
Force, Cc1 633478 lbs
Compression
Force, Cc1 817328 lbs
Curvature, Φ 0.0000415 ε/in
Compression
Force, Cc2 131176 lbs
Compression
Force, Cc2 158733 lbs
41.5 με/in Compression Force, Cc3 11293 lbs
Compression Force, Cc3 942 lbs
Compression
Force, Cc1 345445 lbs
Compression
Force, Cc 753360 lbs
Compression
Force, Cc 975120 lbs
Compression
Force, Cc2 61560 lbs 753 k 975 k
Compression
Force, Cc3 2363 lbs
Compatible
Steel Strain,
εcomp 0.00215
Compatible
Steel Strain,
εcomp 0.00541
Compression
Force, Cc 404642 lbs
Incompatible
Steel Strain,
εic 0.00779
Incompatible
Steel Strain,
εic 0.00779
405 k
Steel Strain,
εps 0.00994
Steel Strain,
εps 0.0132
Equilibrium 563 lbs fps 188 fps 244
xbar 1 12.2 in
Tensile
Force, T 753 kips
Tensile
Force, T 975 kips
xbar 2 6.47 in Equilibrium 0 kips Equilibrium 0 lbs
xbar 3 1.84 in xbar 1 12.6 in xbar 1 10.4 in
Moment, M1 14272373 in-lbs xbar 2 7.11 in xbar 2 5.34 in
Moment, M2 2192516 in-lbs xbar 3 2.54 xbar 3 0.84
Moment, M3 73247 in-lbs Moment, M1 25796103 in-lbs Moment, M1 33522965 in-lbs
Moment, M 16391642 in-lbs Moment, M2 4616450 in-lbs Moment, M2 5713462 in-lbs
1366 k-ft Moment, M3 345896 Moment, M3 29665
Moment, M 30066658 in-lbs Moment, M 39206762 in-lbs
2506 k-ft 3267 k-ft

160
Table 38. Test 3 Moment-Curvature Calculations
Concrete Properties Steel Properties
Girder Concrete
Strength, f'c 6650 psi Deck Area, Ad 96.3 in2 # Strands 46 ea
Deck Concrete
Strength, f'c 6020 psi Top Flange Area, Atf 112 in2 Strand Diameter, Ds 0.375 in
Modular Ratio, n 0.905 Top Haunch Area, Ath 51.8 in2
Area of Strand, As
(each) 0.08 in2
Deck Height, hd 8.75 in Web Area, Aw 133 in2
Total Strand Area,
Aps 3.68 in2
Top Flange Height, htf 7 in
Bottom Haunch Area, Abh 109 in2
Strand Center of Gravity, cgps 6.66 In
Top Haunch
Height, hth 4.5 in
Bottom Flange Area,
Abf 154 in2
Depth of Strands,
dps 47.1 in
Web Height, hw 19 in Total Girder Area, Ag 560 in2 Ultimate Stress, fpu 250 ksi
Bottom Haunch
Height, hbh 7.5 in
Deck Transformed
Area, Adt 87.1 in2 Ultimate Strain, ε 0.06
Bottom Flange
Height, hbf 7 in
Total Composite
Transformed Area, Act 647 in2
Modulus of
Elasticity, Eps 27000 ksi
Girder Height, hg 45 in
Deck Moment of
Inertia, Id 614 in4
Effective Prestress,
fpe 132 ksi
Total Height, h 53.8 in
Deck Transformed
Moment of Inertia, Idt 556 in4 Yield Stress, fpy 242 ksi
Deck Width, bd 11 in
Girder Moment of
Inertia, Ig 125165 in4 Yield Strain, ε 0.009
Transformed Deck
Width, btd 9.96 in
Total Moment of
Inertia, I 189479 in4 fp (ε=.015) 246 ksi
Top Flange Width,
btf 16 in
Deck Center of
Gravity, yg 49.4 in ε (fp=246.18) 0.015
Top Haunch Width,
bth 4.5 in
Girder Center of
Gravity, yg 20.3 in fp (ε=.009) 242 ksi
Web Width, bw 7 in
Composite Center of
Gravity, yc 24.2 in ε (fp=241.91) 0.009
Bottom Haunch Width, bbh 7.5 in
Transformed Top to Center of Gravity, ctt 29.5 in
Effective Prestress Force, Pe 486 k
Bottom Flange
Width, bbf 22 in
Transformed Bottom to
COG, ctb 24.2 in Eccentricity, e 17.5 in
Girder Modulus of
Elasticity, Ecg 4648 ksi
Ultimate Strain, εcu 0.003 FRP Properties
0.5f'c 3325 psi Grade 400
Strain, ε (3.3 ksi) 0.000715 Width 22 in
0.5f'c 3325 psi Thickness 0.08 in
∆ 0 psi # of Layers 2.00
ε0 0.00244 Area of FRP, As 1.76 in2
Total FRP Area,
Aps 3.52 in2
FRP COG, cgps -0.08 in
Depth of FRP, dps 53.8 in
Modulus of
Elasticity, Eps 10720 ksi
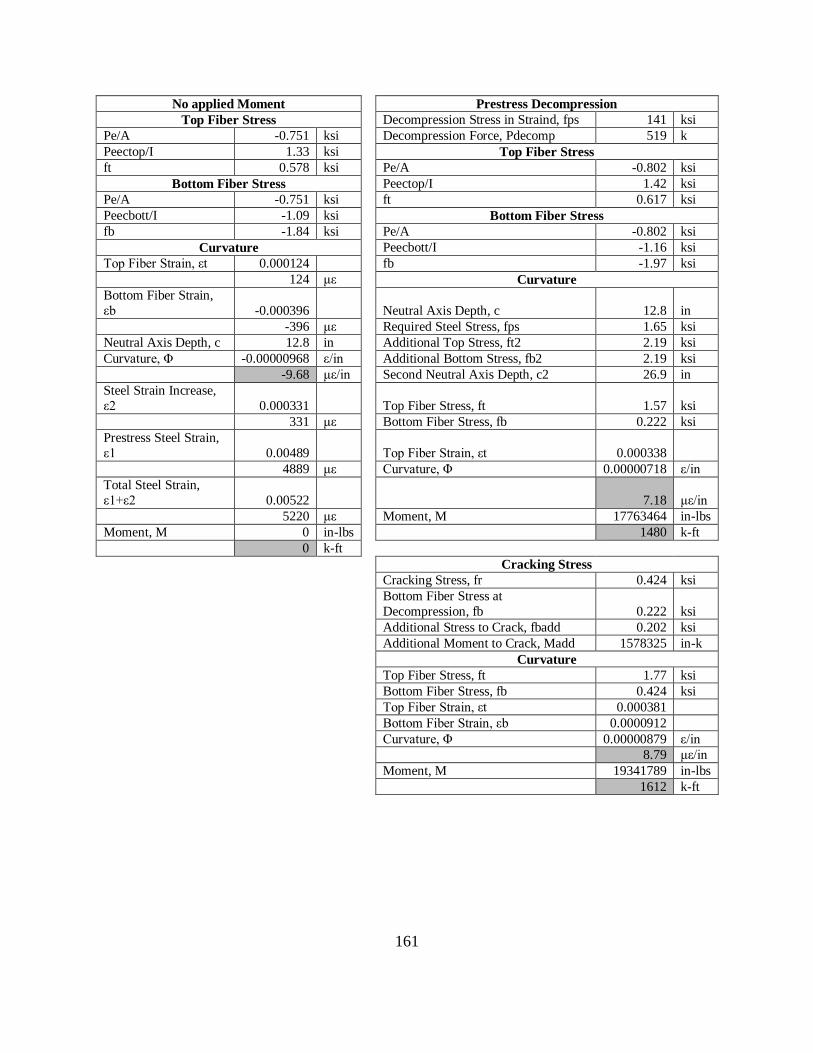
161
No applied Moment Prestress Decompression
Top Fiber Stress Decompression Stress in Straind, fps 141 ksi
Pe/A -0.751 ksi Decompression Force, Pdecomp 519 k
Peectop/I 1.33 ksi Top Fiber Stress
ft 0.578 ksi Pe/A -0.802 ksi
Bottom Fiber Stress Peectop/I 1.42 ksi
Pe/A -0.751 ksi ft 0.617 ksi
Peecbott/I -1.09 ksi Bottom Fiber Stress
fb -1.84 ksi Pe/A -0.802 ksi
Curvature Peecbott/I -1.16 ksi
Top Fiber Strain, εt 0.000124 fb -1.97 ksi
124 με Curvature
Bottom Fiber Strain,
εb -0.000396 Neutral Axis Depth, c 12.8 in
-396 με Required Steel Stress, fps 1.65 ksi
Neutral Axis Depth, c 12.8 in Additional Top Stress, ft2 2.19 ksi
Curvature, Φ -0.00000968 ε/in Additional Bottom Stress, fb2 2.19 ksi
-9.68 με/in Second Neutral Axis Depth, c2 26.9 in
Steel Strain Increase,
ε2 0.000331 Top Fiber Stress, ft 1.57 ksi
331 με Bottom Fiber Stress, fb 0.222 ksi
Prestress Steel Strain,
ε1 0.00489 Top Fiber Strain, εt 0.000338
4889 με Curvature, Φ 0.00000718 ε/in
Total Steel Strain,
ε1+ε2 0.00522 7.18 με/in
5220 με Moment, M 17763464 in-lbs
Moment, M 0 in-lbs 1480 k-ft
0 k-ft
Cracking Stress
Cracking Stress, fr 0.424 ksi
Bottom Fiber Stress at
Decompression, fb 0.222 ksi
Additional Stress to Crack, fbadd 0.202 ksi
Additional Moment to Crack, Madd 1578325 in-k
Curvature
Top Fiber Stress, ft 1.77 ksi
Bottom Fiber Stress, fb 0.424 ksi
Top Fiber Strain, εt 0.000381
Bottom Fiber Strain, εb 0.0000912
Curvature, Φ 0.00000879 ε/in
8.79 με/in
Moment, M 19341789 in-lbs
1612 k-ft
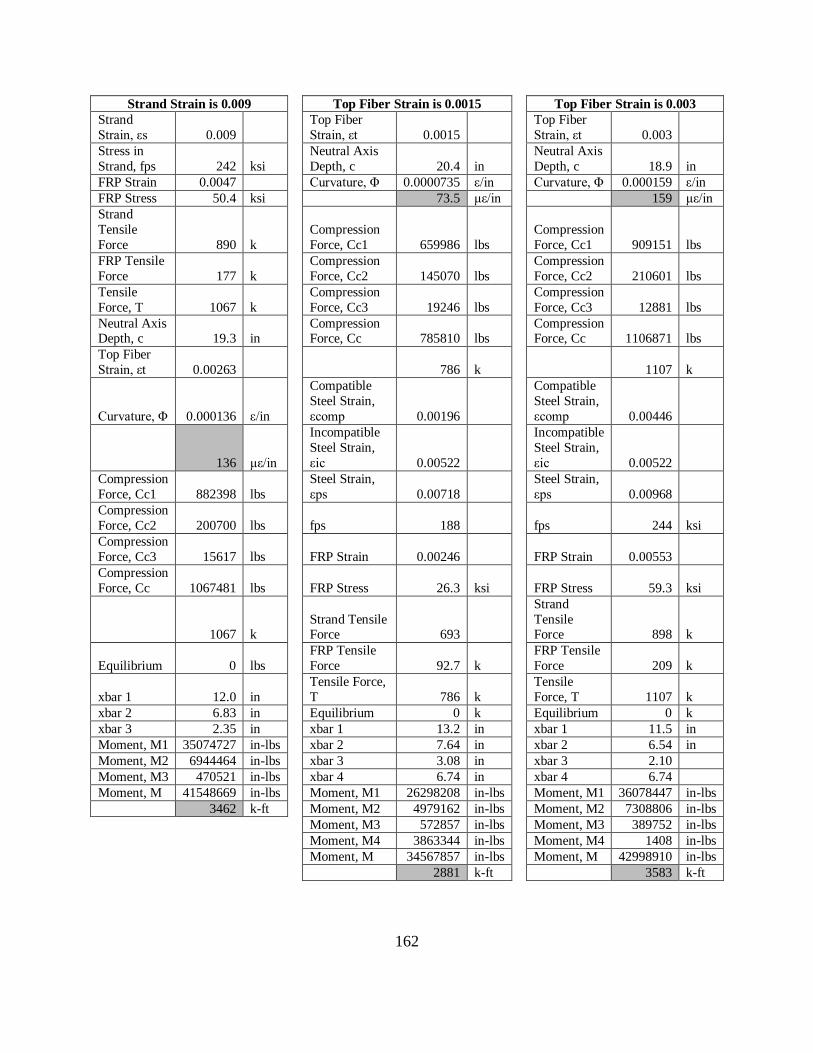
162
Strand Strain is 0.009 Top Fiber Strain is 0.0015 Top Fiber Strain is 0.003
Strand
Strain, εs 0.009
Top Fiber
Strain, εt 0.0015
Top Fiber
Strain, εt 0.003
Stress in
Strand, fps 242 ksi
Neutral Axis
Depth, c 20.4 in
Neutral Axis
Depth, c 18.9 in
FRP Strain 0.0047 Curvature, Φ 0.0000735 ε/in Curvature, Φ 0.000159 ε/in
FRP Stress 50.4 ksi 73.5 με/in 159 με/in
Strand
Tensile
Force 890 k
Compression
Force, Cc1 659986 lbs
Compression
Force, Cc1 909151 lbs
FRP Tensile
Force 177 k
Compression
Force, Cc2 145070 lbs
Compression
Force, Cc2 210601 lbs
Tensile
Force, T 1067 k
Compression
Force, Cc3 19246 lbs
Compression
Force, Cc3 12881 lbs
Neutral Axis Depth, c 19.3 in
Compression Force, Cc 785810 lbs
Compression Force, Cc 1106871 lbs
Top Fiber
Strain, εt 0.00263 786 k 1107 k
Curvature, Φ 0.000136 ε/in
Compatible
Steel Strain,
εcomp 0.00196
Compatible
Steel Strain,
εcomp 0.00446
136 με/in
Incompatible
Steel Strain,
εic 0.00522
Incompatible
Steel Strain,
εic 0.00522
Compression
Force, Cc1 882398 lbs
Steel Strain,
εps 0.00718
Steel Strain,
εps 0.00968
Compression
Force, Cc2 200700 lbs fps 188 fps 244 ksi
Compression
Force, Cc3 15617 lbs FRP Strain 0.00246 FRP Strain 0.00553
Compression
Force, Cc 1067481 lbs FRP Stress 26.3 ksi FRP Stress 59.3 ksi
1067 k Strand Tensile Force 693
Strand
Tensile Force 898 k
Equilibrium 0 lbs
FRP Tensile
Force 92.7 k
FRP Tensile
Force 209 k
xbar 1 12.0 in
Tensile Force,
T 786 k
Tensile
Force, T 1107 k
xbar 2 6.83 in Equilibrium 0 k Equilibrium 0 k
xbar 3 2.35 in xbar 1 13.2 in xbar 1 11.5 in
Moment, M1 35074727 in-lbs xbar 2 7.64 in xbar 2 6.54 in
Moment, M2 6944464 in-lbs xbar 3 3.08 in xbar 3 2.10
Moment, M3 470521 in-lbs xbar 4 6.74 in xbar 4 6.74
Moment, M 41548669 in-lbs Moment, M1 26298208 in-lbs Moment, M1 36078447 in-lbs
3462 k-ft Moment, M2 4979162 in-lbs Moment, M2 7308806 in-lbs
Moment, M3 572857 in-lbs Moment, M3 389752 in-lbs
Moment, M4 3863344 in-lbs Moment, M4 1408 in-lbs
Moment, M 34567857 in-lbs Moment, M 42998910 in-lbs
2881 k-ft 3583 k-ft

163
Table 39. Test 4 Moment-Curvature Calculations
Concrete Properties Steel Properties
Girder Concrete
Strength, f'c 6650 psi Deck Area, Ad 96.3 in2 # Strands 46 ea
Deck Concrete
Strength, f'c 6020 psi
Top Flange Area,
Atf 112 in2 # Repaired Strands 4 ea
Modular Ratio, n 0.905
Top Haunch Area,
Ath 51.8 in2
Strand Diameter,
Ds 0.375 in
Deck Height, hd 8.75 in Web Area, Aw 133 in2 Area of Strand, As 0.08 in2
Top Flange
Height, htf 7 in
Bottom Haunch
Area, Abh 109 in2
Undamaged
Strand Area 3.68
Top Haunch Height, hth 4.5 in
Bottom Flange Area, Abf 154 in2
Repaired Strand Area 0.32
Web Height, hw 19 in
Total Girder Area,
Ag 560 in2
Total Strand Area,
Aps 4 in2
Bottom Haunch
Height, hbh 7.5 in
Deck Transformed
Area, Adt 87.1 in2
Strand Center of
Gravity, cgps 6.66 in
Bottom Flange
Height, hbf 7 in
Total Composite
Transformed Area,
Act 647 in2
Depth of Strands,
dps 47.1 in
Girder Height, hg 45 in
Deck Moment of
Inertia, Id 614 in4
Ultimate Stress,
fpu 250 ksi
Total Height, h 53.8 in
Deck Transformed
Moment of Inertia,
Idt 556 in4 Ultimate Strain, ε 0.06
Deck Width, bd 11 in
Girder Moment of
Inertia, Ig 125165 in4
Modulus of
Elasticity, Eps 27000 ksi
Transformed
Deck Width, btd 9.96 in
Total Moment of
Inertia, I 189479 in4
Effective
Prestress, fpe 132 ksi
Top Flange
Width, btf 16 in
Deck Center of
Gravity, yg 49.4 in Yield Stress, fpy 242 ksi
Top Haunch Width, bth 4.5 in
Girder Center of Gravity, yg 20.3 in Yield Strain, ε 0.009
Web Width, bw 7 in
Composite Center of
Gravity, yc 24.2 in fp (ε=.015) 246 ksi
Bottom Haunch
Width, bbh 7.5 in
Transformed Top to
COG, ctt 29.5 in ε (fp=246.18) 0.015
Bottom Flange
Width, bbf 22 in
Transformed
Bottom to COG, ctb 24.2 in fp (ε=.009) 242 ksi
Girder Modulus of
Elasticity, Ecg 4648 ksi ε (fp=241.91) 0.009
Ultimate Strain, εcu 0.003
Undamaged
Prestress Force 486 k
0.5f'c 3325 psi
Repaired Prestress
Force 33.8 k
Strain, ε (3.3 ksi) 0.000715
Effective Prestress
Force, Pe 520 k
0.5f'c 3325 psi Eccentricity, e 17.5 in
∆ 0 psi
ε0 0.00244

164
No applied Moment Prestress Decompression
Top Fiber Stress Decompression Stress in Straind, fps 142 ksi
Pe/A -0.803 ksi Decompression Force, Pdecomp 566 k
Peectop/I 1.42 ksi Top Fiber Stress
ft 0.618 ksi Pe/A -0.876 ksi
Bottom Fiber Stress Peectop/I 1.55 ksi
Pe/A -0.803 ksi ft 0.673 ksi
Peecbott/I -1.17 ksi Bottom Fiber Stress
fb -1.97 ksi Pe/A -0.876 ksi
Curvature Peecbott/I -1.27 ksi
Top Fiber Strain, εt 0.000133 fb -2.15 ksi
133 με Curvature
Bottom Fiber Strain, εb -0.000424 Neutral Axis Depth, c 12.8 in
-424 με Required Steel Stress, fps 1.80 ksi
Neutral Axis Depth, c 12.8 in Additional Top Stress, ft2 2.39 ksi
Curvature, Φ -0.0000104 ε/in Additional Bottom Stress, fb2 2.39 ksi
-10.4 με/in Second Neutral Axis Depth, c2 26.9 in
Steel Strain Increase,
ε2 0.000355 Top Fiber Stress, ft 1.71 ksi
355 με Bottom Fiber Stress, fb 0.243 ksi
Prestress Steel Strain,
ε1 0.00489 Top Fiber Strain, εt 0.000369
4889 με Curvature, Φ 0.00000784 ε/in
Total Steel Strain,
ε1+ε2 0.00524 7.84 με/in
5243 με Moment, M 19393397 in-lbs
Moment, M 0 in-lbs 1616 k-ft
0 k-ft
Cracking Stress
Cracking Stress, fr 0.424 ksi
Bottom Fiber Stress at Decompression,
fb 0.243 ksi
Additional Stress to Crack, fbadd 0.181 ksi
Additional Moment to Crack, Madd 1418690 in-k
Curvature
Top Fiber Stress, ft 1.90 ksi
Bottom Fiber Stress, fb 0.424 ksi
Top Fiber Strain, εt 0.000408
Bottom Fiber Strain, εb 0.0000912
Curvature, Φ 0.00000929 ε/in
9.29 με/in
Moment, M 20812086 in-lbs
1734 k-ft

165
Strand Strain is 0.009 Top Fiber Strain is 0.0015 Top Fiber Strain is 0.003
Strand
Strain, εs 0.009
Top Fiber
Strain, εt 0.0015
Top Fiber
Strain, εt 0.003
Stress in
Strand, fps 242 ksi
Neutral Axis
Depth, c 19.6 in
Neutral Axis
Depth, c 17.0 in
Tensile
Force, T 968 k Curvature, Φ
0.000076
6 ε/in Curvature, Φ 0.000176 ε/in
Neutral Axis
Depth, c 18.4 in 76.6 με/in 176 με/in
Top Fiber
Strain, εt 0.00241
Compressio
n Force, Cc1 633478 lbs
Compressio
n Force, Cc1 817328 lbs
Curvature, Φ 0.000131 ε/in
Compressio
n Force, Cc2 131176 lbs
Compressio
n Force, Cc2 158733 lbs
131 με/in Compression Force, Cc3 11293 lbs
Compression Force, Cc3 942 lbs
Compressio
n Force, Cc1 807639 lbs
Compressio
n Force, Cc 753360 lbs
Compressio
n Force, Cc 975120 lbs
Compressio
n Force, Cc2 166399 lbs 753 k 975 k
Compressio
n Force, Cc3 6398 lbs
Compatible
Steel Strain,
εcomp 0.00211
Compatible
Steel Strain,
εcomp 0.0053
Compressio
n Force, Cc 967640 lbs
Incompatibl
e Steel
Strain, εic 0.00524
Incompatibl
e Steel
Strain, εic 0.00524
968 k
Steel Strain,
εps 0.00735
Steel Strain,
εps 0.0105
Equilibrium 0 lbs fps 188 fps 244
xbar 1 11.5 in
Tensile
Force, T 753 k
Tensile
Force, T 975 k
xbar 2 6.27 in Equilibrium 0 k Equilibrium 0 lbs
xbar 3 1.76 in xbar 1 12.6 in xbar 1 10.4 in
Moment,
M1
3246409
9
in-
lbs xbar 2 7.11 in xbar 2 5.34 in
Moment,
M2 5815265
in-
lbs xbar 3 2.54 xbar 3 0.84
Moment, M3 194754
in-lbs
Moment, M1 25426152
in-lbs
Moment, M1
33045645
in-lbs
Moment, M
3808461
0
in-
lbs
Moment,
M2 4539843
in-
lbs
Moment,
M2 5620762
in-
lbs
3174 k-ft
Moment,
M3 339300
Moment,
M3 29115
Moment, M 29626695
in-
lbs Moment, M
3863729
2
in-
lbs
2469 k-ft 3220 k-ft
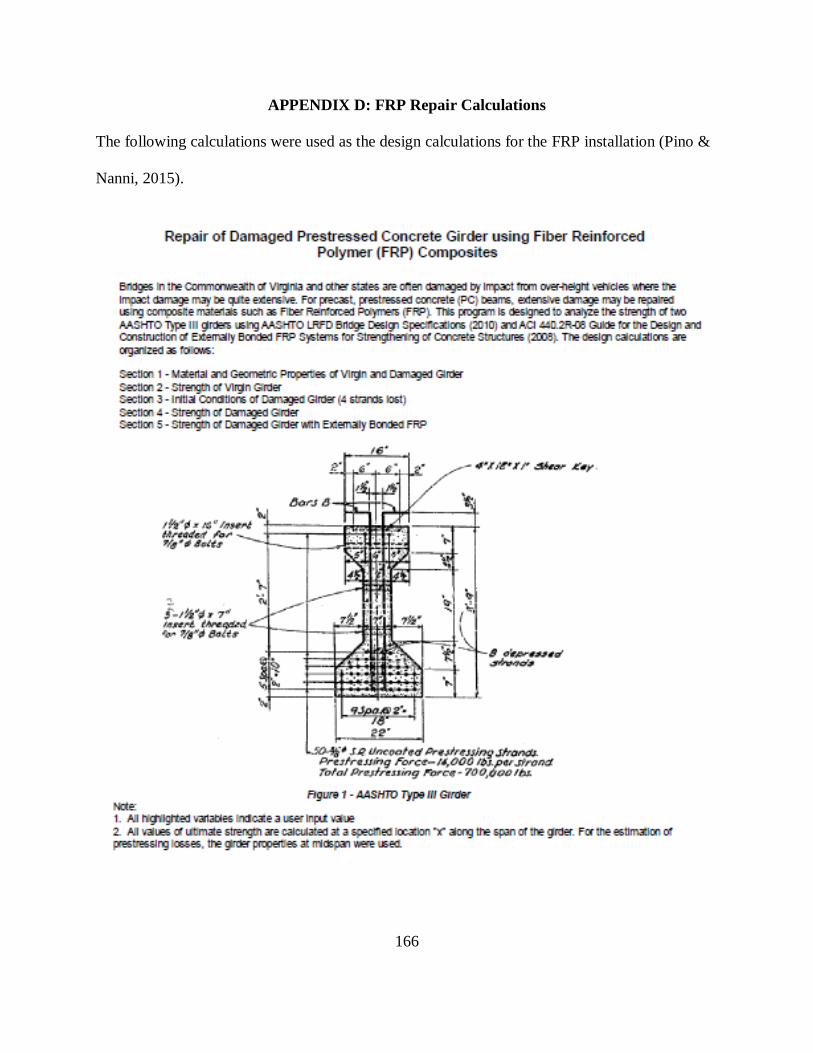
166
APPENDIX D: FRP Repair Calculations
The following calculations were used as the design calculations for the FRP installation (Pino &
Nanni, 2015).
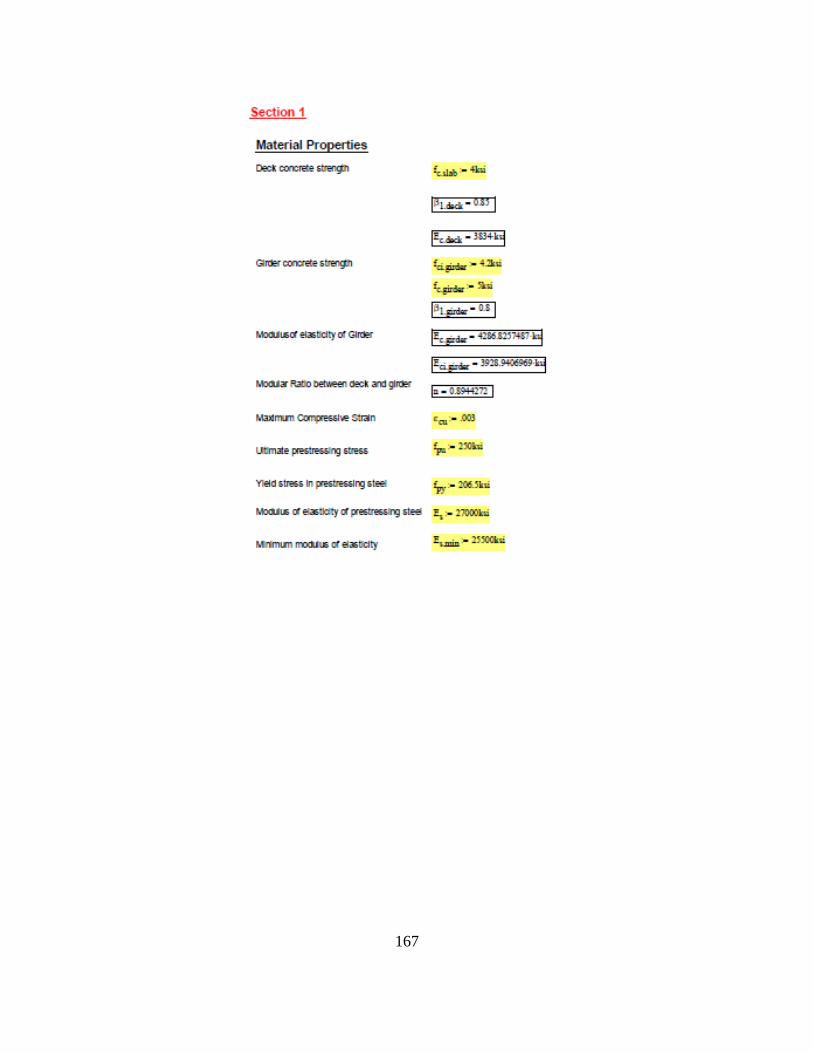
167

168
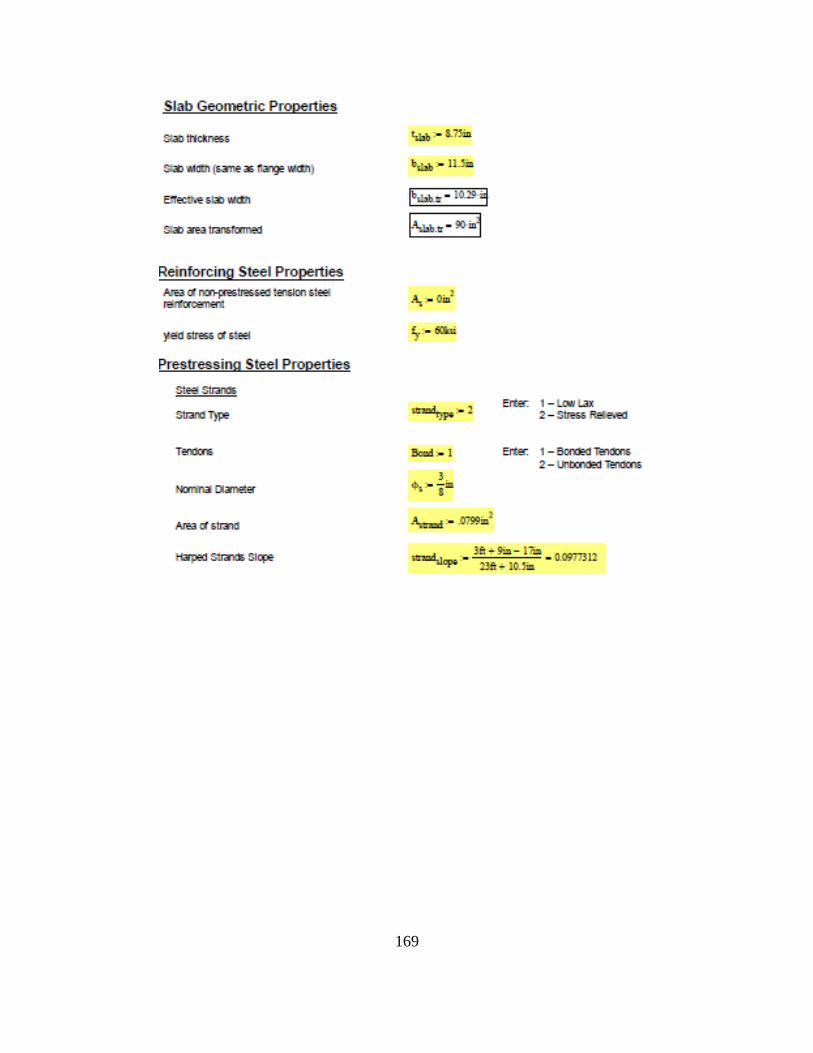
169
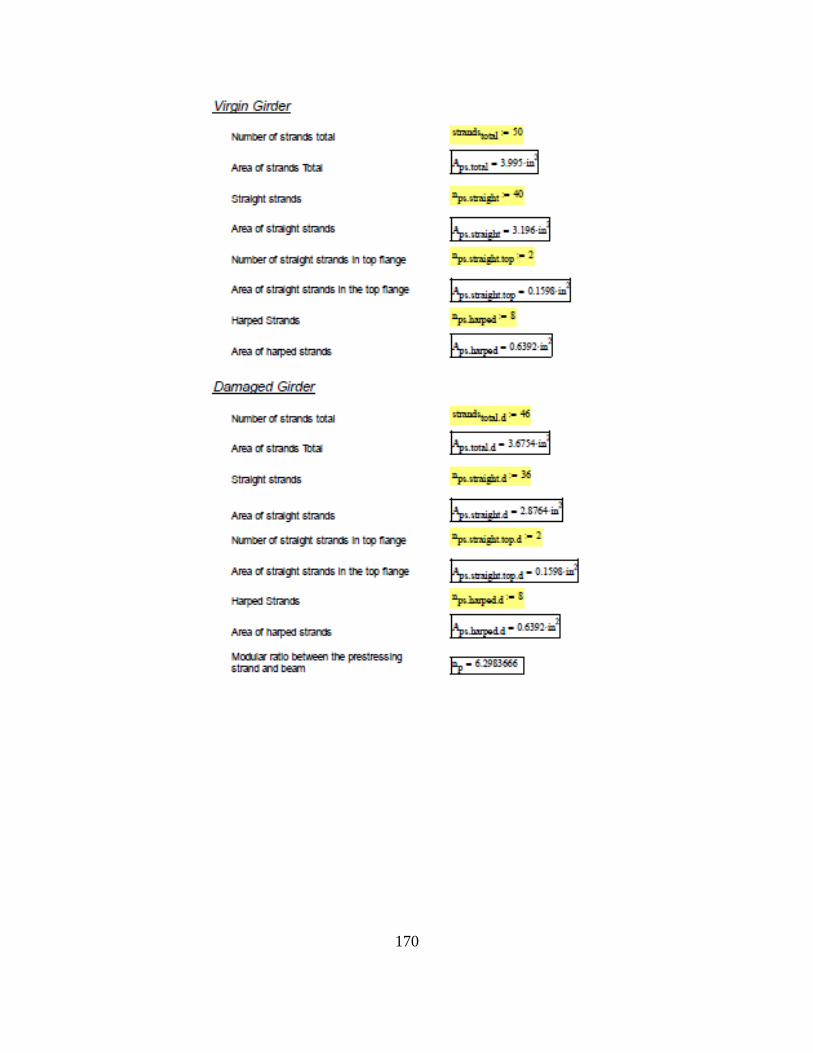
170
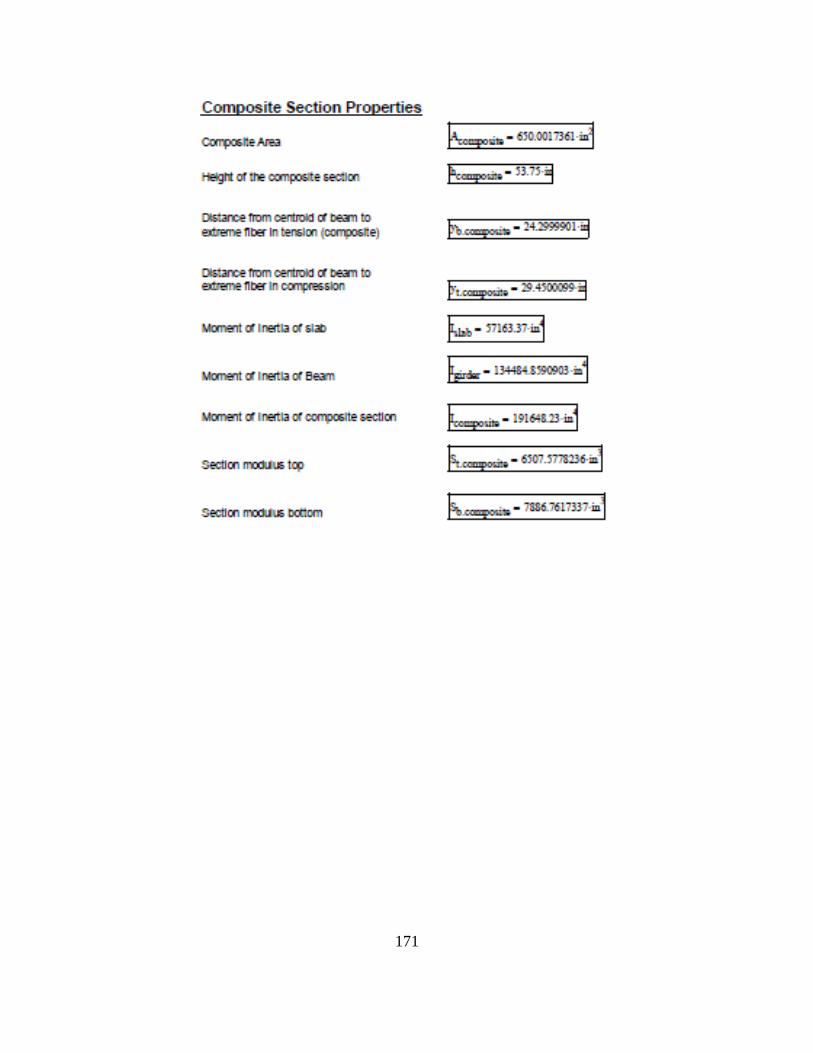
171

172
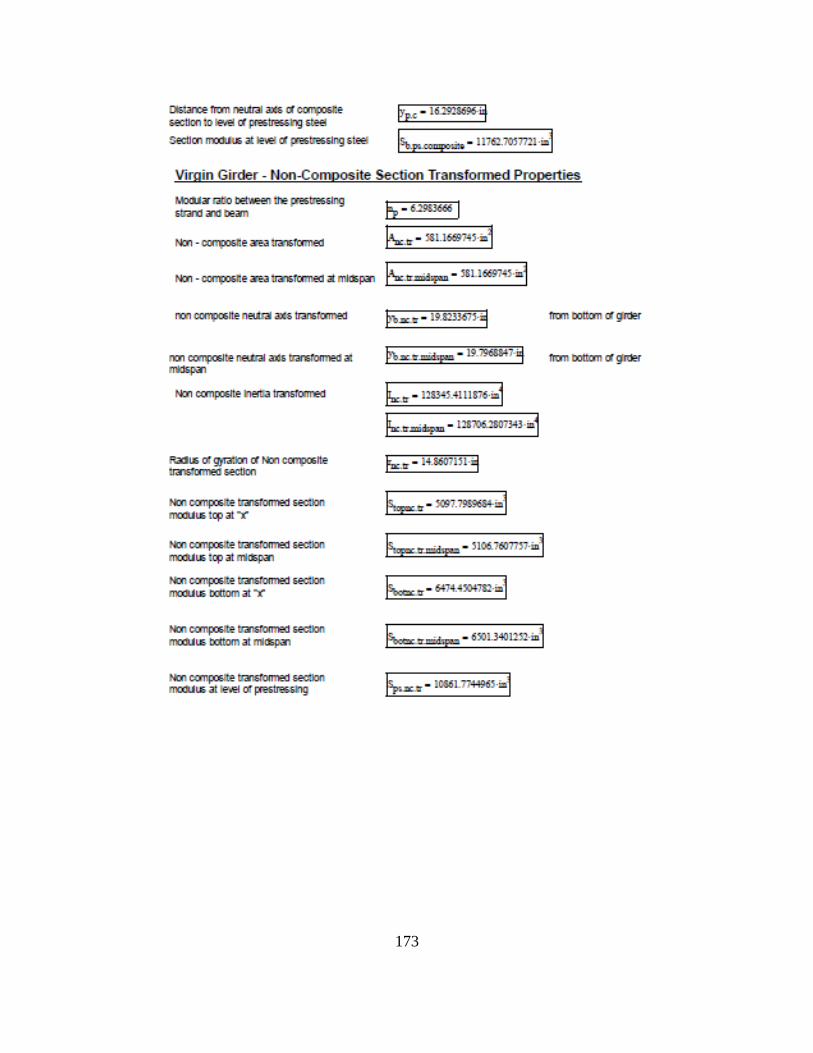
173

174

175
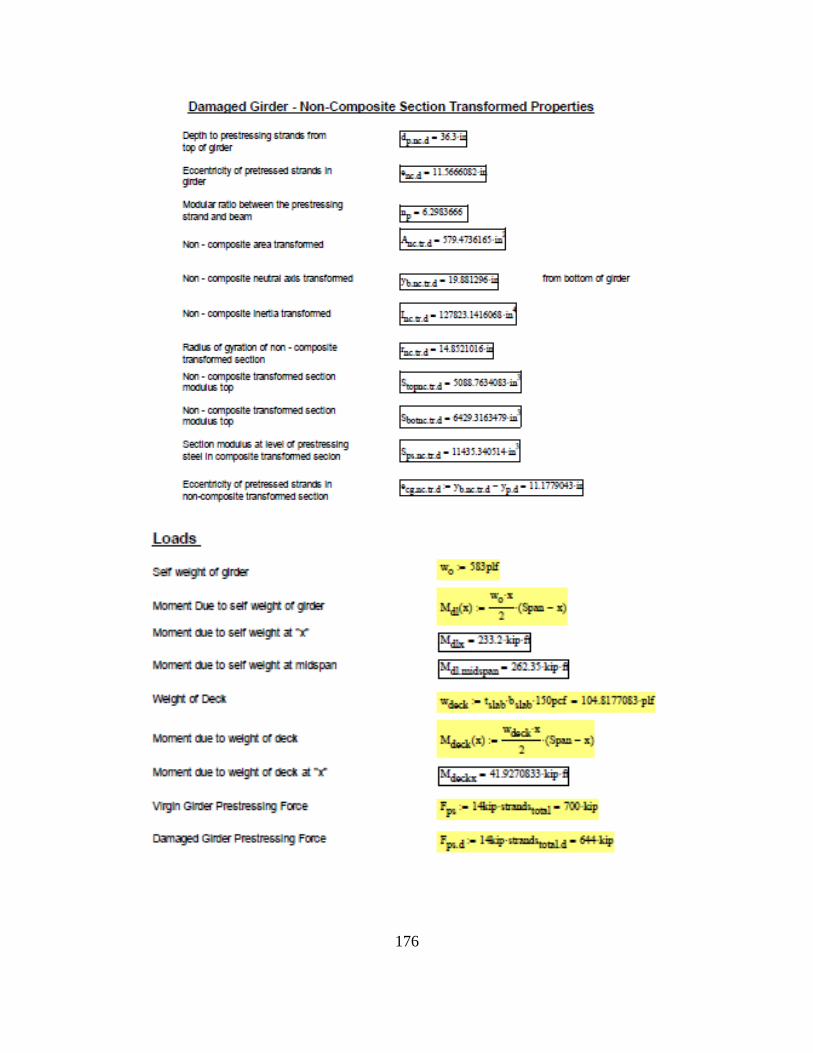
176
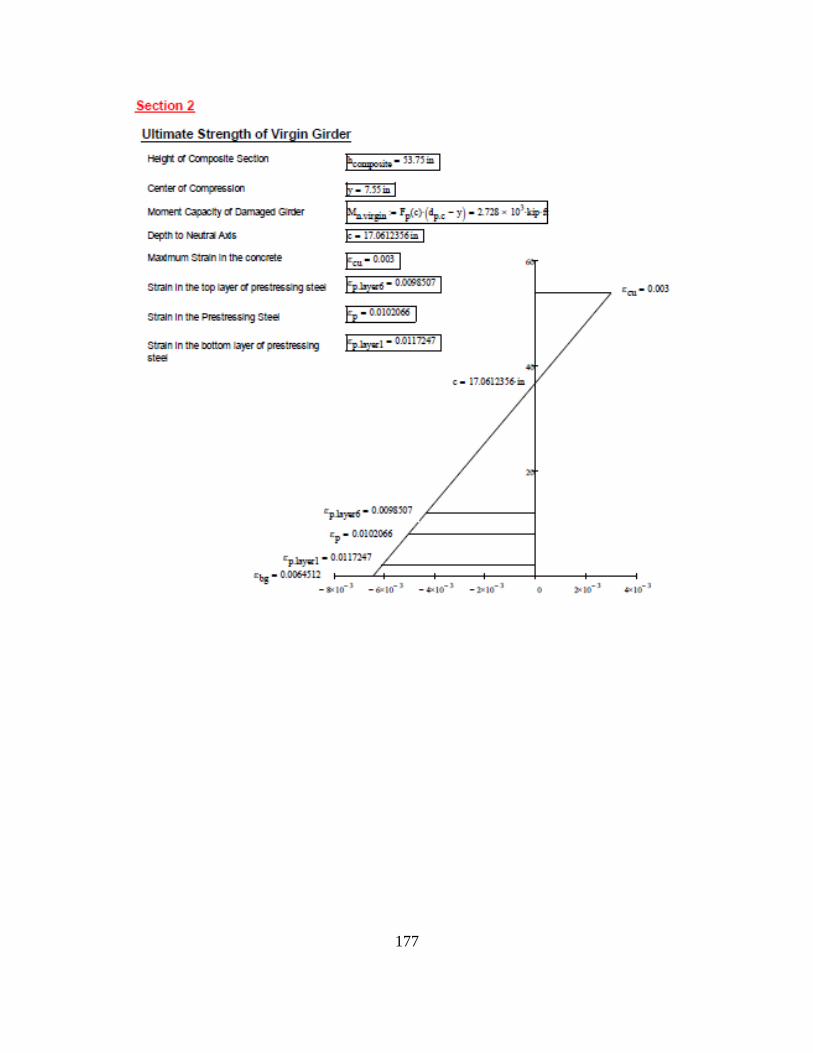
177
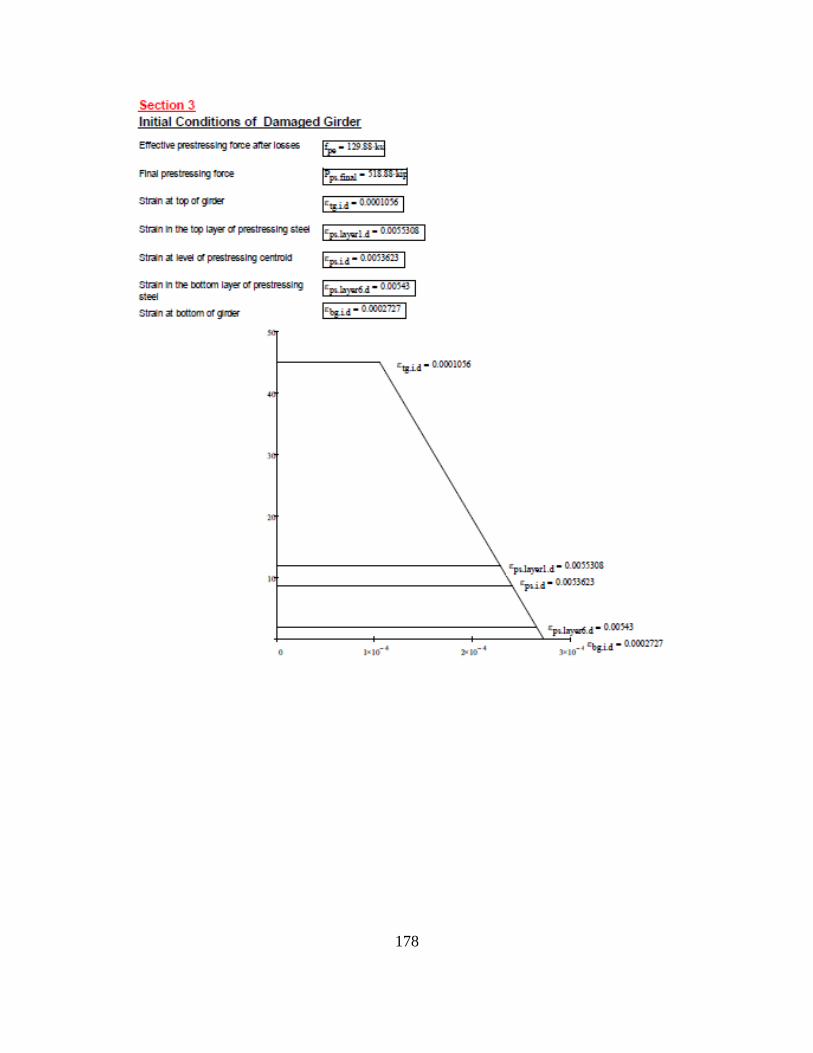
178
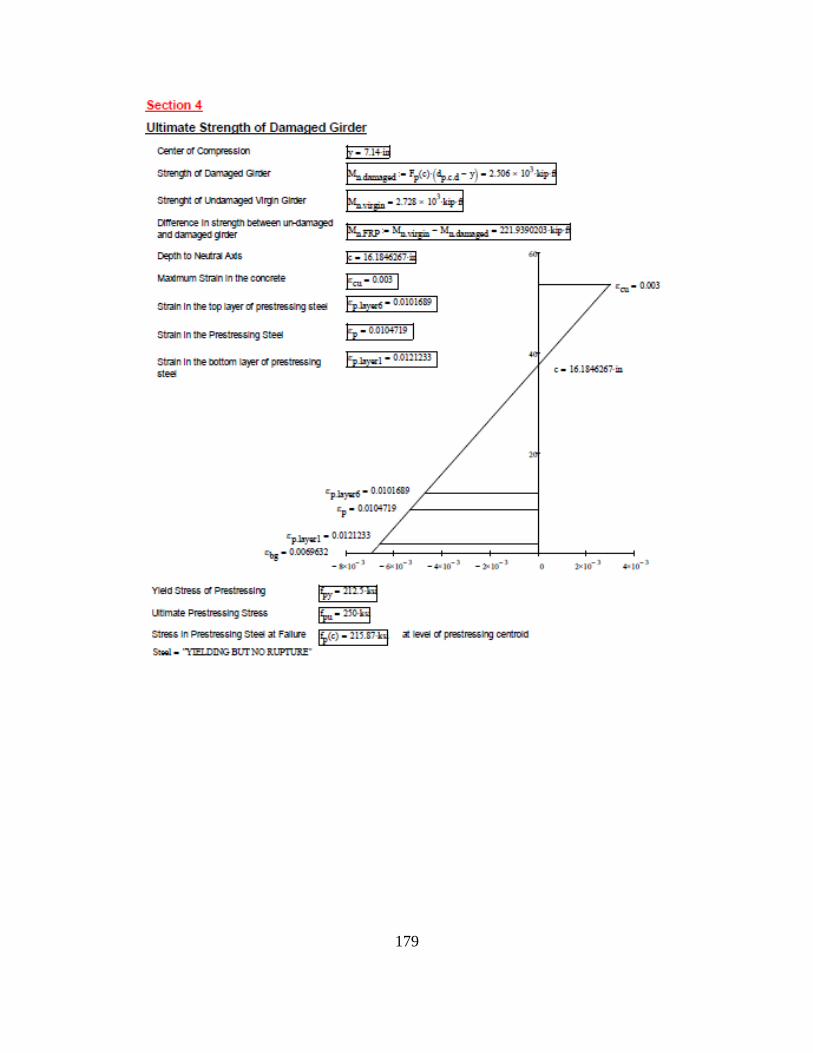
179
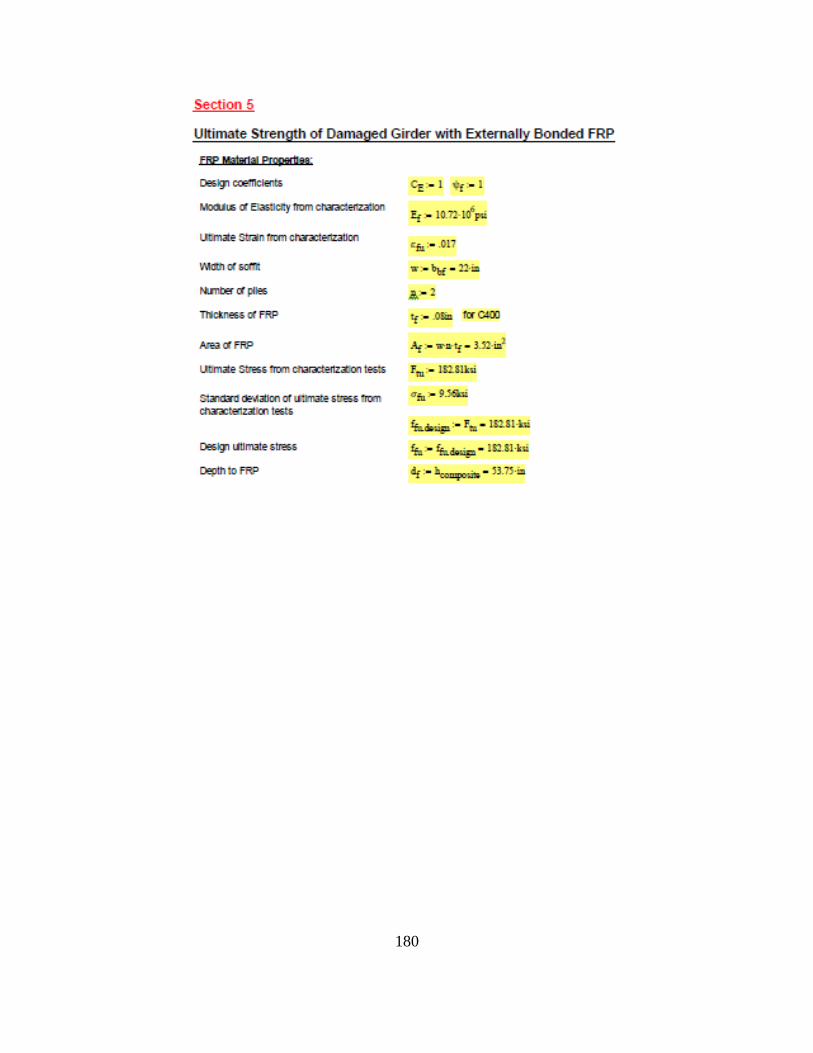
180
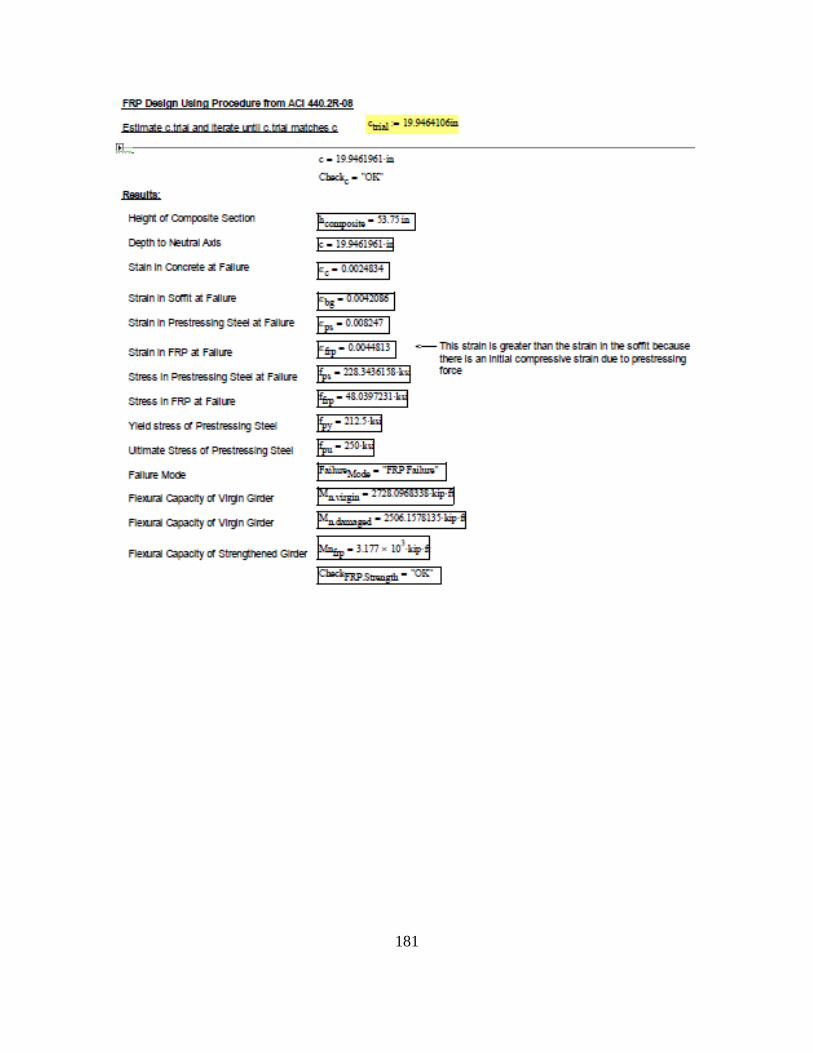
181
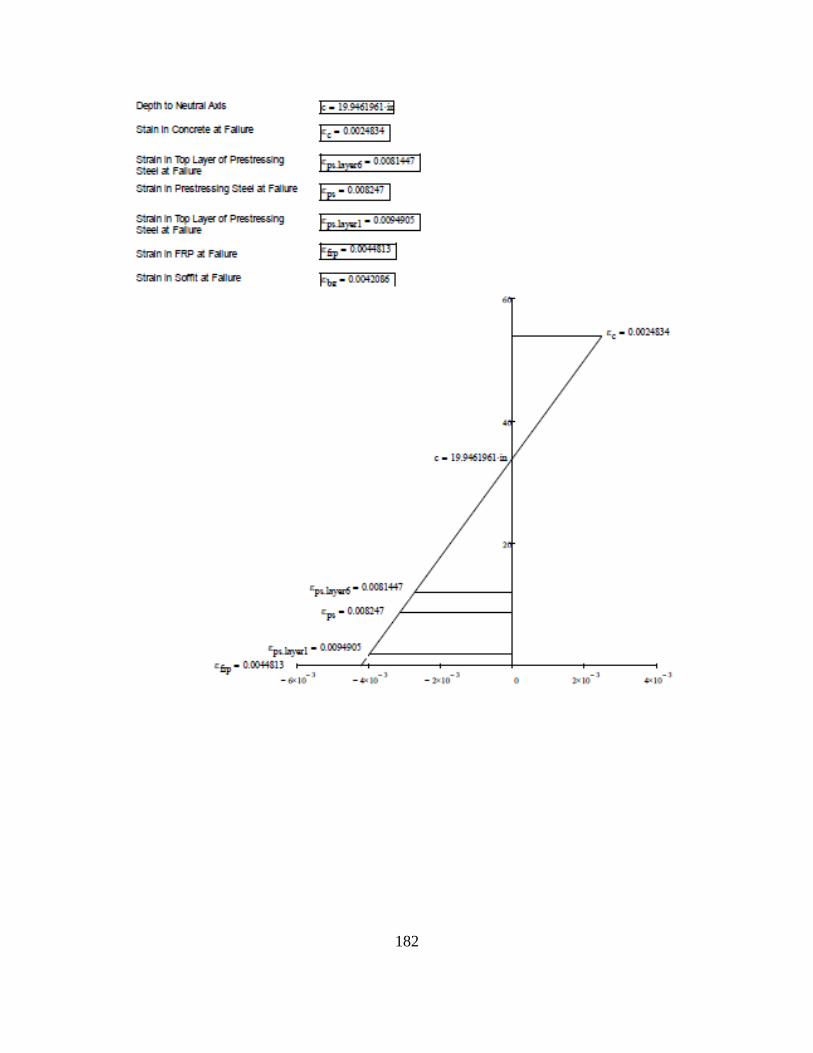
182

183
APPENDIX E: Applied Moment Calculations
𝑴𝒂,𝒎𝒂𝒙 = (𝑷𝒂,𝒎𝒂𝒙
𝒍(𝒍 − 𝒂 + 𝒃)) 𝒂 +
𝒘𝟎 ∗ 𝒂
𝟐(𝒍 − 𝒂)
With:
Ma,max = Failure Moment, k-ft
Pa,max = Applied Load at Each Point (1/2 Failure Load), kips
l = Span Length, ft
a = Longer Distance from Bearing to Load Point, ft
b = Shorter Distance from Bearing to Load Point, ft
w0 = Self-Weight, k/ft
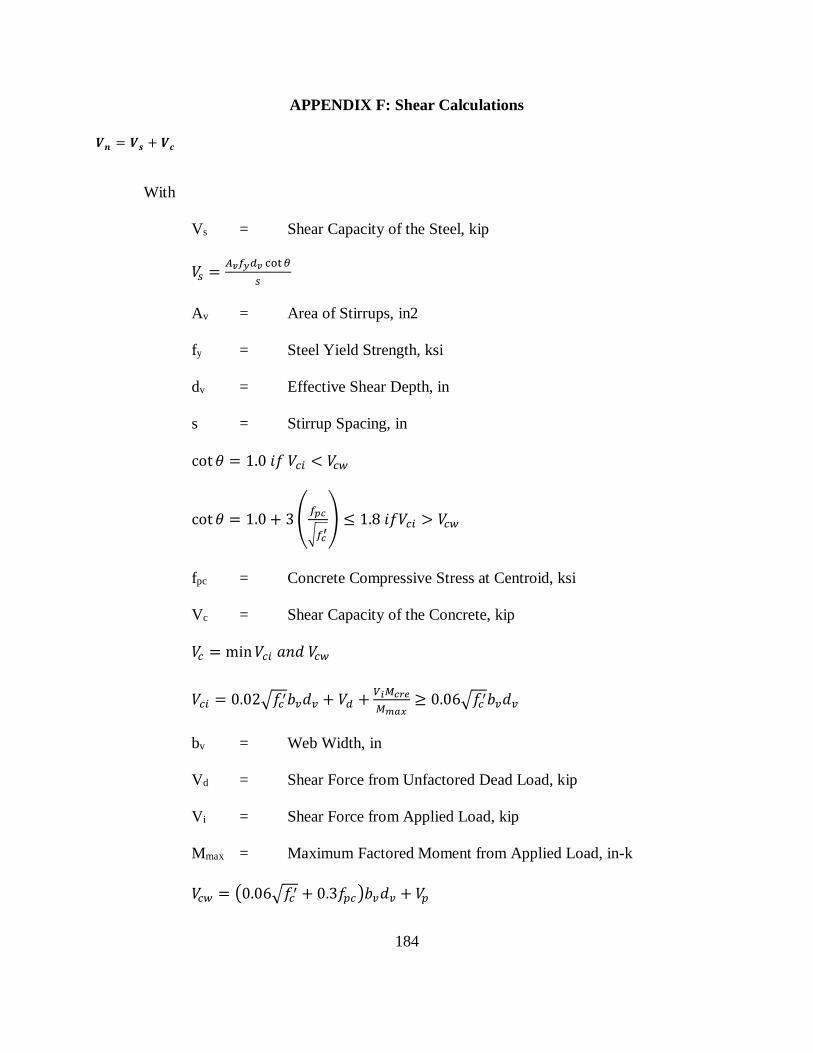
184
APPENDIX F: Shear Calculations
𝑽𝒏 = 𝑽𝒔 + 𝑽𝒄
With
Vs = Shear Capacity of the Steel, kip
𝑉𝑠 =𝐴𝑣𝑓𝑦𝑑𝑣 cot 𝜃
𝑠
Av = Area of Stirrups, in2
fy = Steel Yield Strength, ksi
dv = Effective Shear Depth, in
s = Stirrup Spacing, in
cot 𝜃 = 1.0 𝑖𝑓 𝑉𝑐𝑖 < 𝑉𝑐𝑤
cot 𝜃 = 1.0 + 3 (𝑓𝑝𝑐
√𝑓𝑐′) ≤ 1.8 𝑖𝑓𝑉𝑐𝑖 > 𝑉𝑐𝑤
fpc = Concrete Compressive Stress at Centroid, ksi
Vc = Shear Capacity of the Concrete, kip
𝑉𝑐 = min 𝑉𝑐𝑖 𝑎𝑛𝑑 𝑉𝑐𝑤
𝑉𝑐𝑖 = 0.02√𝑓𝑐′𝑏𝑣𝑑𝑣 + 𝑉𝑑 +
𝑉𝑖𝑀𝑐𝑟𝑒
𝑀𝑚𝑎𝑥≥ 0.06√𝑓𝑐
′𝑏𝑣𝑑𝑣
bv = Web Width, in
Vd = Shear Force from Unfactored Dead Load, kip
Vi = Shear Force from Applied Load, kip
Mmax = Maximum Factored Moment from Applied Load, in-k
𝑉𝑐𝑤 = (0.06√𝑓𝑐′ + 0.3𝑓𝑝𝑐)𝑏𝑣𝑑𝑣 + 𝑉𝑝

185
Vp = Shear Force from Prestress, kip
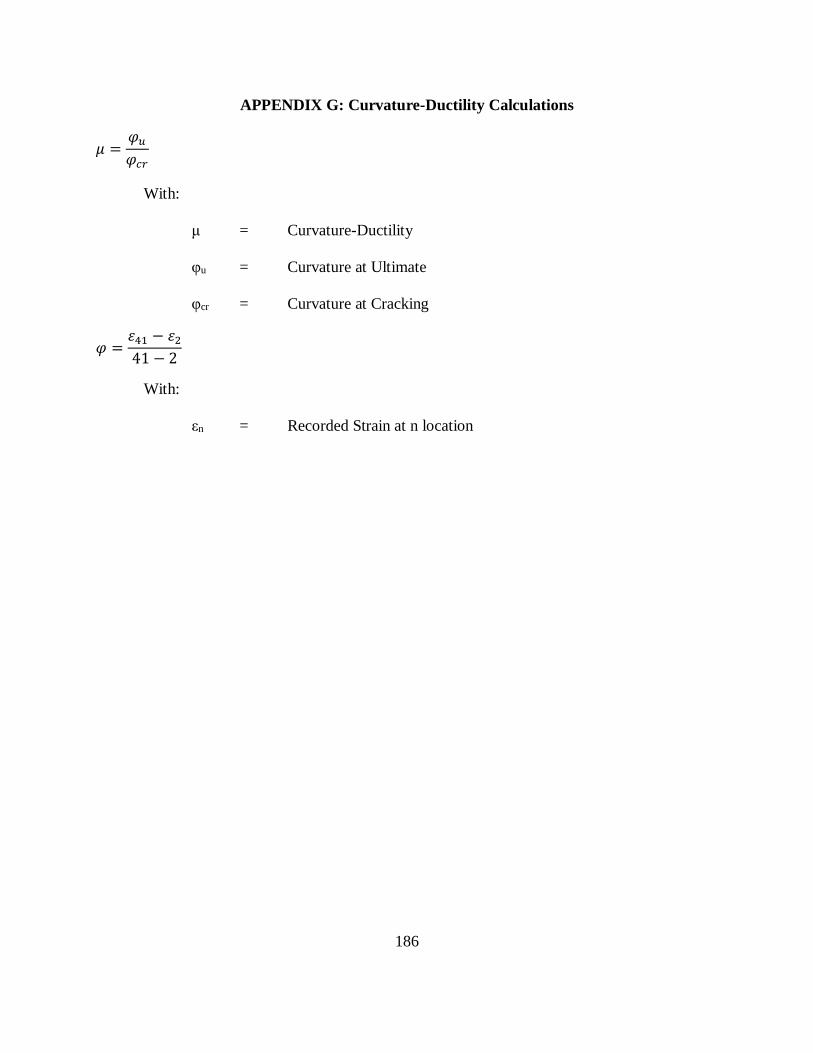
186
APPENDIX G: Curvature-Ductility Calculations
𝜇 =𝜑𝑢
𝜑𝑐𝑟
With:
μ = Curvature-Ductility
φu = Curvature at Ultimate
φcr = Curvature at Cracking
𝜑 =𝜀41 − 𝜀2
41 − 2
With:
εn = Recorded Strain at n location

187
APPENDIX H: Specimen Preparation for Strand Splice and FRP Repairs
The procedures in the following section were adapted from observations during the repair
process conducted by Structural Technologies (Structural Group Incorporated, 2015). Specifics
may vary based on manufacturer specific requirements.
Areas requiring concrete removal were identified by visual inspection and a hammer tap test.
The hammer tap test produced a hollow sound for areas that were cracked or delaminated. Any
area that was determined to be affected by the damaged was marked for removal. In addition, a
perimeter of approximately 1 in around damaged areas was marked for removal (Rasheed, 2015).
In order to remove the damaged section, the area was marked to eliminate any sharp or inside
corners. Inside corners are corners that cause increased stress concentrations by coming to a
point in the direction of the repair.
A grinder with a diamond concrete blade was used to make a 0.5 in saw cut around the perimeter
of the damaged area.
An electric chipping gun was used to remove an additional 0.5 in depth of concrete for a
minimum of 1 in depth of concrete removed from the damaged area.
The damaged area surrounding the strands was cleared and the concrete was removed to a
diameter of 0.5 in from around any exposed strand to allow sufficient room for aggregate to
consolidate around the strands and bond with the original concrete. Special care was taken when
operating the electric chipping gun around prestressing strands to ensure the strands were not
damaged further during the excavation process.
In addition to clearing 0.5 in diameter around exposed strands, concrete around any severed
strands was be cleared 24 in from the cut in both directions along the length of the strand. This

188
was done to provide sufficient room for the splice chucks and to provide room for the new
concrete to bond with the strand.
In corners and along the outside edges of the damaged section, reinforcement bars or prestressing
strands were exposed and a 0.5 in diameter was cleared around them to provide sufficient
materials to create a bond with the new concrete.
After all the damaged concrete was removed, any excess debris was cleaned with an air hose.
Then, the repair section was sand blasted to remove any corrosion on the strands and to open the
concrete. Next, a pressure washer was used to remove any more debris and to hydrate the
original concrete in preparation for the repair concrete to be placed.
For Tests 2 and 4, the Grabb-in Cable Splice was installed. The procedures followed for their
installation are described in APPENDIX I: Strand Splice Repair Procedures.
After the site was prepared and strand splices installed, the formwork was built and erected in
preparation for the concrete placement.
The Tstrata IRC was a self-consolidating proportioned concrete mix that was used as the
concrete in the patch. It is an early high strength mix used to minimize the time between
placement and further repairs or use (Structural Group Incorporated, 2015).
The concrete was allowed to cure for 24 hr before the formwork was removed and the finishing
work completed. For Test 3, detailed finishing work is discussed in APPENDIX J: Fiber
Reinforced Polymer Repair Procedures.
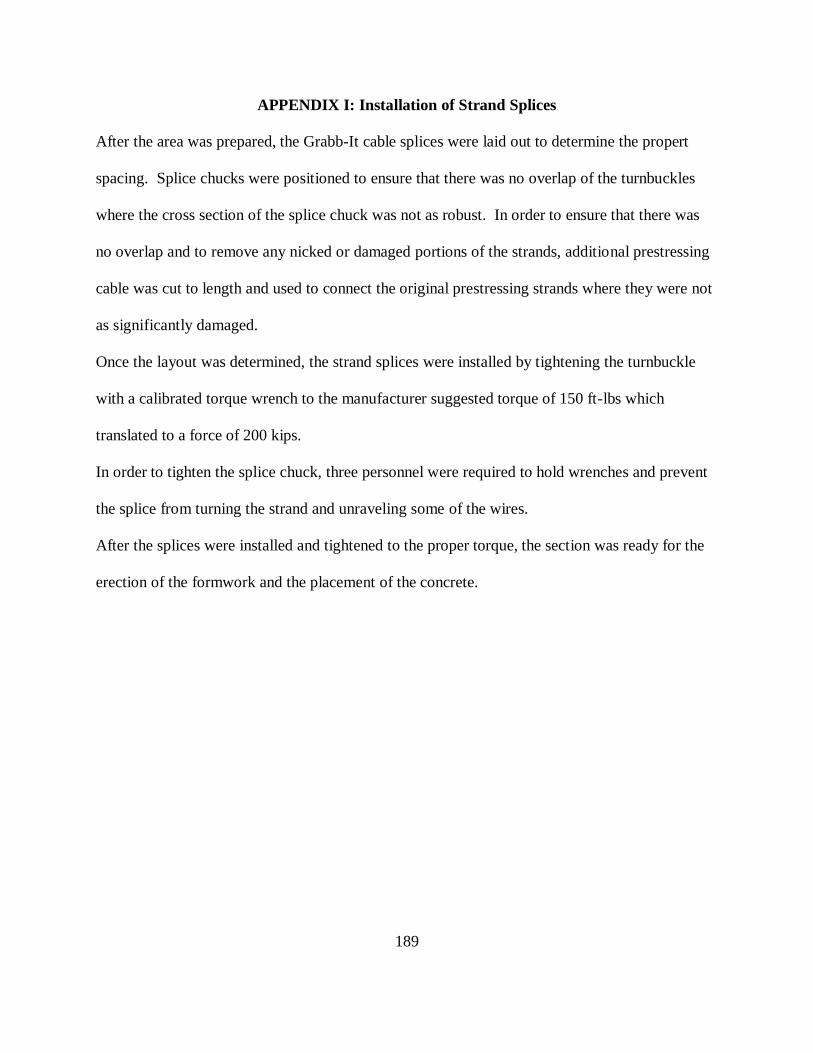
189
APPENDIX I: Installation of Strand Splices
After the area was prepared, the Grabb-It cable splices were laid out to determine the propert
spacing. Splice chucks were positioned to ensure that there was no overlap of the turnbuckles
where the cross section of the splice chuck was not as robust. In order to ensure that there was
no overlap and to remove any nicked or damaged portions of the strands, additional prestressing
cable was cut to length and used to connect the original prestressing strands where they were not
as significantly damaged.
Once the layout was determined, the strand splices were installed by tightening the turnbuckle
with a calibrated torque wrench to the manufacturer suggested torque of 150 ft-lbs which
translated to a force of 200 kips.
In order to tighten the splice chuck, three personnel were required to hold wrenches and prevent
the splice from turning the strand and unraveling some of the wires.
After the splices were installed and tightened to the proper torque, the section was ready for the
erection of the formwork and the placement of the concrete.
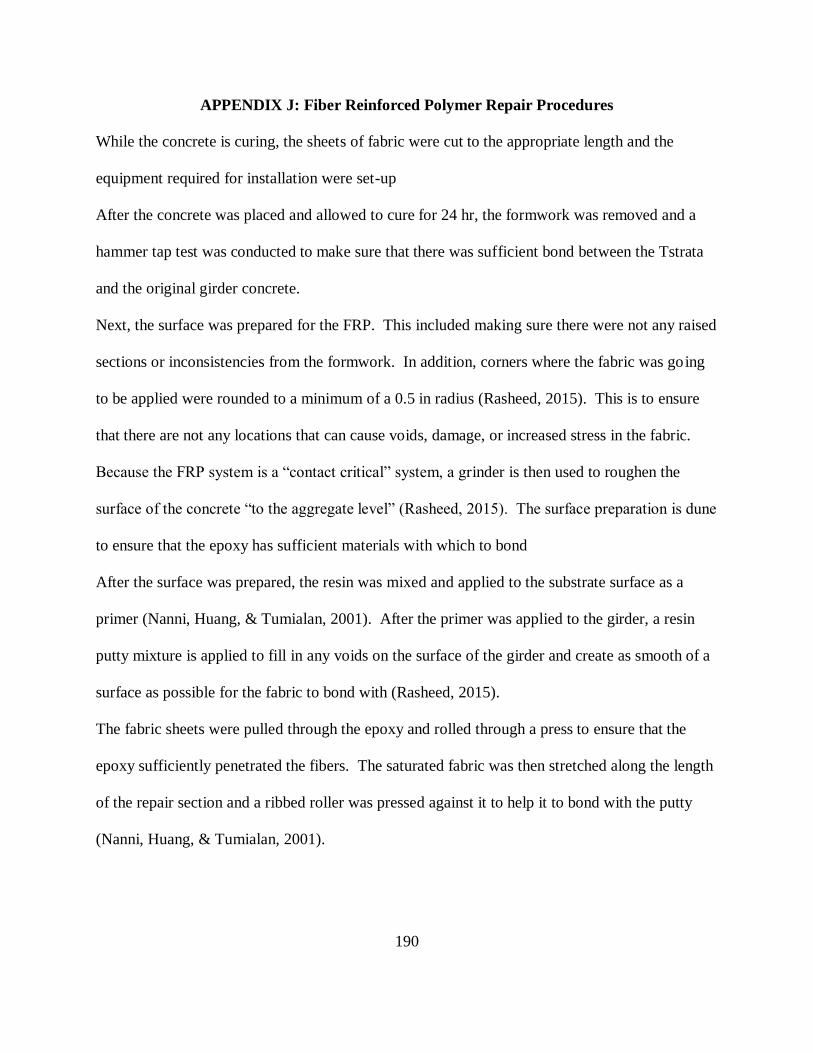
190
APPENDIX J: Fiber Reinforced Polymer Repair Procedures
While the concrete is curing, the sheets of fabric were cut to the appropriate length and the
equipment required for installation were set-up
After the concrete was placed and allowed to cure for 24 hr, the formwork was removed and a
hammer tap test was conducted to make sure that there was sufficient bond between the Tstrata
and the original girder concrete.
Next, the surface was prepared for the FRP. This included making sure there were not any raised
sections or inconsistencies from the formwork. In addition, corners where the fabric was going
to be applied were rounded to a minimum of a 0.5 in radius (Rasheed, 2015). This is to ensure
that there are not any locations that can cause voids, damage, or increased stress in the fabric.
Because the FRP system is a “contact critical” system, a grinder is then used to roughen the
surface of the concrete “to the aggregate level” (Rasheed, 2015). The surface preparation is dune
to ensure that the epoxy has sufficient materials with which to bond
After the surface was prepared, the resin was mixed and applied to the substrate surface as a
primer (Nanni, Huang, & Tumialan, 2001). After the primer was applied to the girder, a resin
putty mixture is applied to fill in any voids on the surface of the girder and create as smooth of a
surface as possible for the fabric to bond with (Rasheed, 2015).
The fabric sheets were pulled through the epoxy and rolled through a press to ensure that the
epoxy sufficiently penetrated the fibers. The saturated fabric was then stretched along the length
of the repair section and a ribbed roller was pressed against it to help it to bond with the putty
(Nanni, Huang, & Tumialan, 2001).

191
After the first layer of fabric was installed, an additional layer of putty was spread across the
sheet and the second layer of fabric was saturated, pressed, and rolled onto the bottom of the
girder.
A third layer of putty was applied and FRP sheets were saturated and installed in the transverse
direction to provide confinement and help resist out of plane stresses that the longitudinal sheets
would not resist.
After the transverse sheets were applied, a final layer of putty was spread across them and
leveled to provide a clean and smooth outer surface that was free of abnormalities.
The resin was then allowed to cure for 24 hr. The cure time for the resin is temperature
dependent and after the 24 hr period was over, it was tested using a hammer tap test (Rasheed,
2015).