Embed Size (px)
DESCRIPTION
RENTS HAVE BEEN RISING, NOT FALLING, IN THE POSTWAR PERIOD. Theodore M. Crone and Leonard I. Nakamura Federal Reserve Bank of Philadelphia, and Richard Voith, Econsult Corporation Discussed by RJG, NBER, July 18, 2006. What Has Happened in the Past 1152 Days?. - PowerPoint PPT Presentation
Citation preview

RENTS HAVE BEEN RENTS HAVE BEEN RISING, NOT FALLING, IN RISING, NOT FALLING, IN THE POSTWAR PERIODTHE POSTWAR PERIOD
Theodore M. Crone and Leonard I. NakamuraTheodore M. Crone and Leonard I. NakamuraFederal Reserve Bank of Philadelphia, andFederal Reserve Bank of Philadelphia, and
Richard Voith, Econsult CorporationRichard Voith, Econsult Corporation
Discussed by RJG, NBER, July 18, 2006Discussed by RJG, NBER, July 18, 2006

What Has Happened in What Has Happened in the Past 1152 Days?the Past 1152 Days?
Intense Policy and Journalistic Interest in Alleged Intense Policy and Journalistic Interest in Alleged Flaws in CPI/BEA Treatment of Owner-Occupied Flaws in CPI/BEA Treatment of Owner-Occupied HousingHousing
Partly Inspired by CNV’s 2003 Version, I’m Now Partly Inspired by CNV’s 2003 Version, I’m Now Involved with a Paper on the Topic, hereafter GvGInvolved with a Paper on the Topic, hereafter GvG
Fortunately, this is a Blessed Marriage, for two Fortunately, this is a Blessed Marriage, for two Different Research Approaches come up with the Different Research Approaches come up with the same Answer on the History of CPI Bias back to same Answer on the History of CPI Bias back to 1940 (!)1940 (!)
This Topic is the This Topic is the BIG BANANA BIG BANANA of CPI Bias Research, of CPI Bias Research, nothing else comparesnothing else compares And nothing compares to Leonard Nakamura and the CNV And nothing compares to Leonard Nakamura and the CNV
Trio as the leading producers of research on this topicTrio as the leading producers of research on this topic

Broader Context for InterestBroader Context for Interestin this Line of Researchin this Line of Research
The Media Have Been Full of Criticisms of The Media Have Been Full of Criticisms of the CPI for Housingthe CPI for Housing First Issue, Recent Possible BiasFirst Issue, Recent Possible Bias Focus of this paper, Historical BiasFocus of this paper, Historical Bias
The Current Debate is Not What this Paper The Current Debate is Not What this Paper is About, but a few comments anywayis About, but a few comments anyway Low Interest Rates, Boom Housing Prices, Slump Low Interest Rates, Boom Housing Prices, Slump
of Rent Inflation rate, alleged Downward Biasof Rent Inflation rate, alleged Downward Bias Reverse when Interest Rates are HighReverse when Interest Rates are High Can’t Measure Housing Prices directly as long as Can’t Measure Housing Prices directly as long as
capital gains are not part of GDPcapital gains are not part of GDP

Identifying the AcronymsIdentifying the Acronyms CNV = Crone, Nakamura, and VoithCNV = Crone, Nakamura, and Voith
Two important papers presented at Two important papers presented at conferences in 2002, early 2003, including conferences in 2002, early 2003, including Bosworth-Triplett workshop in May, 2003Bosworth-Triplett workshop in May, 2003
One paper, this one, on nonresponse biasOne paper, this one, on nonresponse bias The other was on AHS rental shelter hedonicsThe other was on AHS rental shelter hedonics
I learned what was possible from themI learned what was possible from them GvG = Gordon and vanGoethem, GvG = Gordon and vanGoethem,
forthcoming CRIW on 100 years of CPI forthcoming CRIW on 100 years of CPI rental shelter biasrental shelter bias Given at Bethesda Zvi conference Sept 2003Given at Bethesda Zvi conference Sept 2003
Bottom line is to Ratify Triplett 1971 paper, Bottom line is to Ratify Triplett 1971 paper, the bias can go either waythe bias can go either way

Bias differs across products,Bias differs across products,and it may change over timeand it may change over time
Hulten-Bruegel paradoxHulten-Bruegel paradox Nordhaus’ suggestion, extend a 1.4% annual price index Nordhaus’ suggestion, extend a 1.4% annual price index
bias back two centuriesbias back two centuries Hulten’s response, extended back to Williamsburg 1800, Hulten’s response, extended back to Williamsburg 1800,
only 2 lb of potatoes per day, nothing for shelter or apparelonly 2 lb of potatoes per day, nothing for shelter or apparel Extend back to Bruegel, who died in 1569Extend back to Bruegel, who died in 1569
¼ lb of potatoes vs. those prosperous-looking Dutchmen¼ lb of potatoes vs. those prosperous-looking Dutchmen Resolution? Resolution?
Bias in durable goods (and Nordhaus for light) can’t be applied Bias in durable goods (and Nordhaus for light) can’t be applied to necessities (food, apparel, shelter)to necessities (food, apparel, shelter)
OR, OR, bias in necessities changed over timebias in necessities changed over time
Boskin Report:Boskin Report: only 95-96, bias could have been higher or only 95-96, bias could have been higher or lower (or opposite sign?) at any point in the pastlower (or opposite sign?) at any point in the past
BLS fixed downward bias for apparel and rents in late 80s, BLS fixed downward bias for apparel and rents in late 80s, so before 1985 upward bias must be smallerso before 1985 upward bias must be smaller

Prima Facie Prima Facie Case that the CPI for Case that the CPI for Shelter is Biased Downwards, just Shelter is Biased Downwards, just
Browse the Browse the Historical StatisticsHistorical Statistics How I got into this topic long before the GvG How I got into this topic long before the GvG
paperpaper Change over long historical periodsChange over long historical periods
CPI for Shelter 1999/1925 = 5.1CPI for Shelter 1999/1925 = 5.1 Median Price of Existing HousesMedian Price of Existing Houses
Historical StatisticsHistorical Statistics, Washington DC, 1925, $7,809, Washington DC, 1925, $7,809 Statistical Abstract, Statistical Abstract, Washington DC, 1999, $176,000Washington DC, 1999, $176,000 Ratio = 22.5, not 5.1Ratio = 22.5, not 5.1
OK, OK, rent vs. ownership price including landrent vs. ownership price including land But CPI for shelter is used to proxy for home ownership But CPI for shelter is used to proxy for home ownership
priceprice Tenants pay for the land, not just the structureTenants pay for the land, not just the structure

Another ExampleAnother Example Historical Statistics, Historical Statistics, 19221922
Residential Wealth $71.3 billionResidential Wealth $71.3 billion Structures $51.1 billionStructures $51.1 billion Land $20.2 billionLand $20.2 billion
Number of housing units 19.5 million (why so Number of housing units 19.5 million (why so few?)few?)
Value per Unit = $3,656Value per Unit = $3,656 Statistical AbstractStatistical Abstract for 1999 for 1999
Net Residential Capital Stock $9,405 billionNet Residential Capital Stock $9,405 billion Number of units 115 millionNumber of units 115 million Value per Unit = $81,800Value per Unit = $81,800
Ratio 1999/1925 = 22.1 not 5.1Ratio 1999/1925 = 22.1 not 5.1 Could that difference Could that difference ALLALL be quality change? be quality change?

Common Starting Place, Common Starting Place, Difference CPI vs. Gross RentsDifference CPI vs. Gross Rents
-3.5
-3.0
-2.5
-2.0
-1.5
-1.0
-0.5
0.0
0.5
1905 1915 1925 1935 1945 1955 1965 1975 1985 1995 2005
GBW Mean Rent
Brown Budget Study
Weston Mean Rent Census Mean Rent
AHS Mean Rent

To Interpret CNV’s Basic Result, To Interpret CNV’s Basic Result, You must know in advanceYou must know in advance
Over the entire 1914-1985 period, CPI Over the entire 1914-1985 period, CPI rental housing inflation is 2 percent rental housing inflation is 2 percent slower than the AAGR of gross rentslower than the AAGR of gross rent
So we have three stylized possibilities, So we have three stylized possibilities, or anything in between (annual rates)or anything in between (annual rates) 0% quality change and 2% downward bias0% quality change and 2% downward bias 1% quality change and 1% downward bias1% quality change and 1% downward bias 2% quality change and no CPI bias at all2% quality change and no CPI bias at all

This Research is Superb This Research is Superb by Explaining by Explaining WHYWHY CPI was biased CPI was biased CNV in 2003 had already identified tenant non-CNV in 2003 had already identified tenant non-
response bias as a key ingredient in downward response bias as a key ingredient in downward CPI bias for rental shelter, roughly 1940-85CPI bias for rental shelter, roughly 1940-85 BLS (Randolph, 1988) had already identified aging biasBLS (Randolph, 1988) had already identified aging bias
BLS fixed aging bias based on Randolph’s work BLS fixed aging bias based on Randolph’s work and in several stages has fixed the tenant non-and in several stages has fixed the tenant non-response biasresponse bias
As a landlord, let me tell you about tenant non-As a landlord, let me tell you about tenant non-response biasresponse bias Annual lease, rent held fixed for a minimum of 12 Annual lease, rent held fixed for a minimum of 12
monthsmonths I don’t tend to raise rents for a given tenant, only I don’t tend to raise rents for a given tenant, only
between tenants (tenant duration = 2 years)between tenants (tenant duration = 2 years)


CNV PaperCNV Paper
Real Addition to Our KnowledgeReal Addition to Our Knowledge Terrific History of CPI Methodology since Terrific History of CPI Methodology since
19421942 Ingenious parameterized model of non-Ingenious parameterized model of non-
response bias by decade after 1942response bias by decade after 1942 I’ve tried to replicate their results and it’s I’ve tried to replicate their results and it’s
all 100% convincingall 100% convincing Many thanks to Leonard for his slides, but Many thanks to Leonard for his slides, but
they look better in color with the scale in they look better in color with the scale in the backgroundthe background

Did tenant rent inflation continue at the same rate after 1985—or did it slow down?
Comparison between survey data and BLS rent data Annual growth rates, percent
Census of Housing or American Housing Survey, median rent
CPI, tenant rents
1940 to 1985
5.8% 3.4 %
1985 to 2001
3.5 % 3.4 %
Actual rents paid decelerated by 2 percent!
Actual rents paid decelerated by 2 percent!
CPI rental inflation was unchanged
CPI rental inflation was unchanged

Point of Departure: Point of Departure: Two Problems with CPI for RentTwo Problems with CPI for Rent
Aging bias (Randolph, 1988)Aging bias (Randolph, 1988) As rental units age, they deteriorate (or As rental units age, they deteriorate (or
possibly become obsolete)possibly become obsolete) Nonresponse bias (CNV work)Nonresponse bias (CNV work)
Rental turnover is correlated with Rental turnover is correlated with rental price increasesrental price increases
Rental price collection was hampered Rental price collection was hampered by turnoverby turnover
New tenants’ rent increases were often not New tenants’ rent increases were often not recordedrecorded
Vacant units are considered out of sampleVacant units are considered out of sample
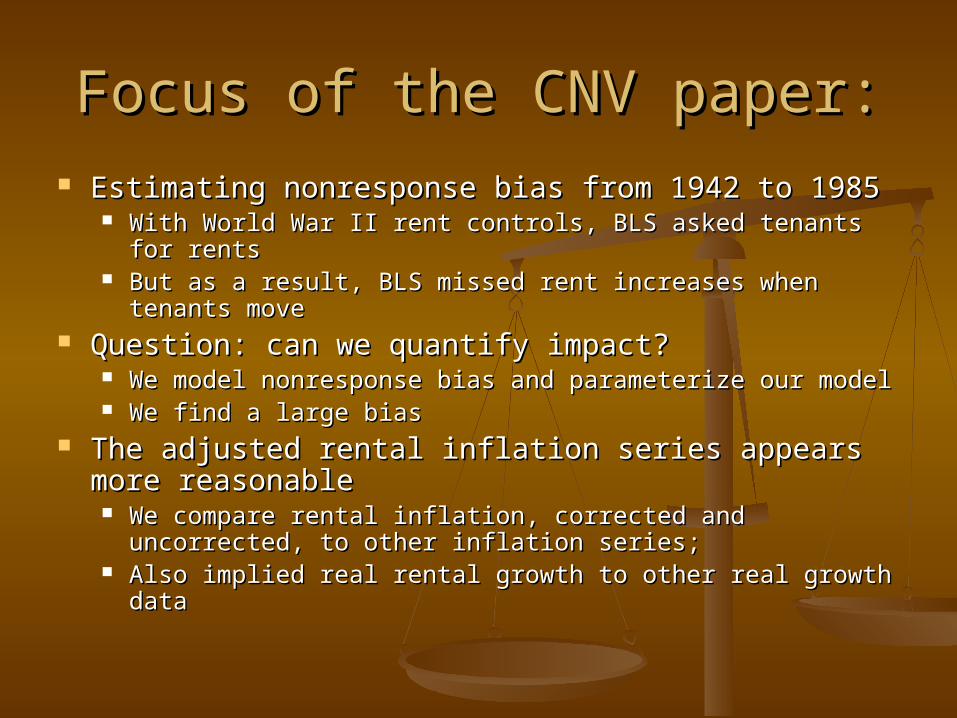
Focus of the CNV paper:Focus of the CNV paper: Estimating nonresponse bias from 1942 to 1985Estimating nonresponse bias from 1942 to 1985
With World War II rent controls, BLS asked tenants for With World War II rent controls, BLS asked tenants for rentsrents
But as a result, BLS missed rent increases when tenants But as a result, BLS missed rent increases when tenants movemove
Question: can we quantify impact?Question: can we quantify impact? We model nonresponse bias and parameterize our modelWe model nonresponse bias and parameterize our model We find a large bias We find a large bias
The adjusted rental inflation series appears more The adjusted rental inflation series appears more reasonablereasonable We compare rental inflation, corrected and uncorrected, We compare rental inflation, corrected and uncorrected,
to other inflation series; to other inflation series; Also implied real rental growth to other real growth dataAlso implied real rental growth to other real growth data

Measuring inflationMeasuring inflation
Most of CPI is based on posted prices:Most of CPI is based on posted prices: BLS inspectors go into department store or BLS inspectors go into department store or
supermarket or airline reservation systemsupermarket or airline reservation system See how the posted price compares to the same See how the posted price compares to the same
item priced in previous monthitem priced in previous month
Rents are based on transactions price:Rents are based on transactions price: Go to tenant (or landlord, rental manager) Go to tenant (or landlord, rental manager)
and ask what price is currently being paid at and ask what price is currently being paid at same unit compared to six months agosame unit compared to six months ago
Vacancy is considered a missing observationVacancy is considered a missing observation

Problem with asking Problem with asking tenanttenant Rents are generally increased annuallyRents are generally increased annually If tenants are asked rents semiannually, half If tenants are asked rents semiannually, half
the time tenant reports zero increasethe time tenant reports zero increase in practice, these zeros were overweighted in practice, these zeros were overweighted
because:because: When the rent went up, it was often missed due When the rent went up, it was often missed due
to turnover (34 % annual rate) either the to turnover (34 % annual rate) either the apartment becameapartment became vacant vacant oror
a new relationship must be established with a new relationship must be established with the new tenant or else the rental increase is the new tenant or else the rental increase is not recordednot recorded
When tenants left, rent went up more than for When tenants left, rent went up more than for tenants who stayed (Genosove)tenants who stayed (Genosove)

From 1953 to 1995, the BLS From 1953 to 1995, the BLS corrected nonresponse in five stepscorrected nonresponse in five steps Less frequent collection of prices (from quarterly Less frequent collection of prices (from quarterly
to semiannually) in 1953to semiannually) in 1953 Replacement of mail surveys in 1964 by personal Replacement of mail surveys in 1964 by personal
visits and telephone interviews visits and telephone interviews Major change in methodology in 1978 that Major change in methodology in 1978 that
eliminated nonresponse except vacancy eliminated nonresponse except vacancy nonresponse nonresponse Introduced a downward one-month recall bias to the Introduced a downward one-month recall bias to the
calculation.calculation. Imputations for vacancy nonresponse that had Imputations for vacancy nonresponse that had
the effect of eliminating much of one-month recall the effect of eliminating much of one-month recall bias in 1985bias in 1985
Elimination of one-month recall bias in 1995Elimination of one-month recall bias in 1995

Quantifying size of biasQuantifying size of bias
Parameterize model with data from Parameterize model with data from AHS and BLS publicationsAHS and BLS publications
Detailed BLS microdata (from 1988 Detailed BLS microdata (from 1988 to 1992) used to check most to 1992) used to check most parametersparameters but not probability of nonresponse but not probability of nonresponse

Here are the key Here are the key parameters in the modelparameters in the model
Turnover(change of tenant or vacancy), Turnover(change of tenant or vacancy), ρρ= .344 (AHS data)= .344 (AHS data)
Higher inflation rate for new tenant, b=.33 Higher inflation rate for new tenant, b=.33 (From BLS study, Rivers and Summers)(From BLS study, Rivers and Summers)
Monthly probability of rent increase Monthly probability of rent increase θθ = = 1/121/12
Number of months between pricing n=6Number of months between pricing n=6 Relative rate of data collection for movers Relative rate of data collection for movers
compared to continuing tenants: qcompared to continuing tenants: qMM/q/qCC =0.2 before 1978=0.2 before 1978 this is hard to imputethis is hard to impute but we know qbut we know qMM/q/qCC < .8 due to vacancy < .8 due to vacancy

Formula for rental inflation to correct for nonresponse, 1942-77
• true rate of rent inflation πt
• = true rent inflation for continuing tenants times adjustment for higher inflation at turnover units
• = factors accounting for rate of nonresponse
times measured inflation
(1 )(1 (1 ))
(1 )1 (1 (1 ))
M
mCt Ct t
M
C
qb n
qb
qb
q
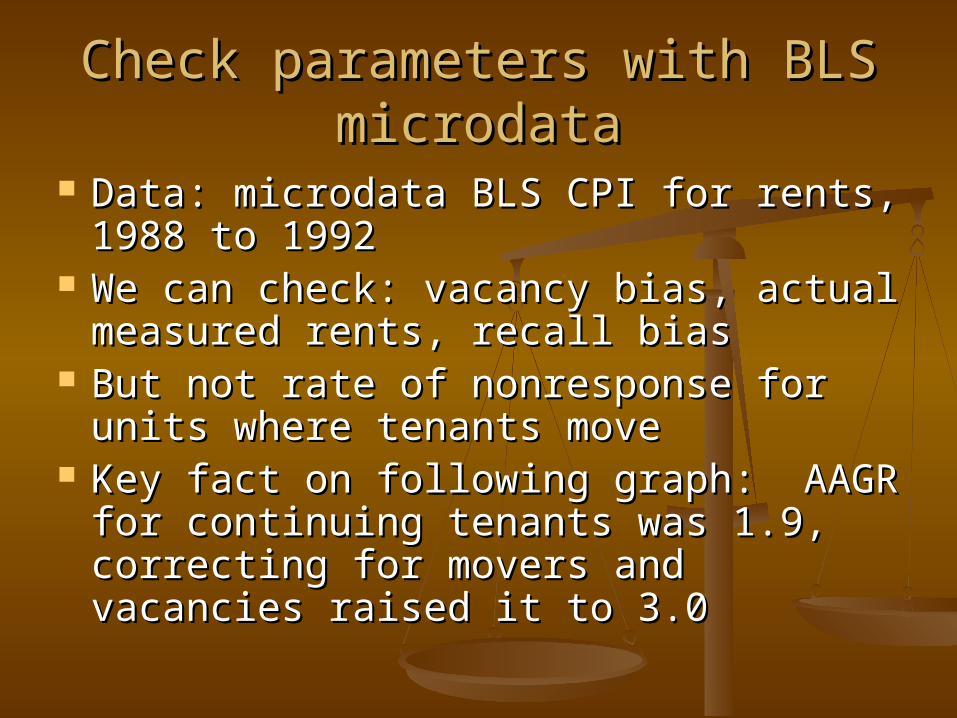
Check parameters with BLS Check parameters with BLS microdatamicrodata
Data: microdata BLS CPI for rents, Data: microdata BLS CPI for rents, 1988 to 19921988 to 1992
We can check: vacancy bias, actual We can check: vacancy bias, actual measured rents, recall biasmeasured rents, recall bias
But not rate of nonresponse for units But not rate of nonresponse for units where tenants movewhere tenants move
Key fact on following graph: AAGR for Key fact on following graph: AAGR for continuing tenants was 1.9, correcting continuing tenants was 1.9, correcting for movers and vacancies raised it to for movers and vacancies raised it to 3.03.0

Figure 1. BLS Rent Microdata, 1988-1992
120
125
130
135
140
145
150
8807
8809
8811
8901
8903
8905
8907
8909
8911
9001
9003
9005
9007
9009
9011
9101
9103
9105
9107
9109
9111
9201
9203
9205
9207
9209
9211
6 MO including imputations 6 MO all reported data 6 MO continuing tenants1 MO with imputations 1 MO all reported data

Inferring rate of nonresponse Inferring rate of nonresponse before 1978 change in proceduresbefore 1978 change in procedures
In 1978, BLS collected CPI data from Jan In 1978, BLS collected CPI data from Jan 1978 to June 1978 on old basis and new 1978 to June 1978 on old basis and new basisbasis
CPI rental inflation was faster on new basis CPI rental inflation was faster on new basis than old basisthan old basis
But:But: recall bias was introduced (should lower inflation)recall bias was introduced (should lower inflation) vacancy bias remained (should lower inflation)vacancy bias remained (should lower inflation)
We can back out how much nonresponse We can back out how much nonresponse bias was eliminated (which raised the bias was eliminated (which raised the inflation rate)inflation rate)

Key Page ShowingKey Page ShowingCalculations, Table 4 on p. 35Calculations, Table 4 on p. 35
Before 1942, only aging biasBefore 1942, only aging bias 1942-77, three stages with n 1942-77, three stages with n
changing from 3 to 6 in 1953, and changing from 3 to 6 in 1953, and qM/qC changing from 0 to 0.2 in qM/qC changing from 0 to 0.2 in 19641964
Note basic calculation in right column Note basic calculation in right column of Table 4. Multiply by 1.55, 1.40, of Table 4. Multiply by 1.55, 1.40, 1.29, 1.19, then only 1.02 1983-94 1.29, 1.19, then only 1.02 1983-94 and zero 1994-presentand zero 1994-present

Figure 1. CNV and official CPI measures of rentratio to CPI all items excluding shelter
0
0.2
0.4
0.6
0.8
1
1.2
1.4
1.6
1942
1944
1946
1948
1950
1952
1954
1956
1958
1960
1962
1964
1966
1968
1970
1972
1974
1976
1978
1980
1982
1984
1986
1988
1990
1992
1994
1996
1998
2000
2002
New CNV tenant rent measure CPI tenant rent measure
According to our measure, rents have risen relative to non-shelter prices
Have rents fallen relative to non-shelter prices?

Growth Rates from CNV Apx Table Growth Rates from CNV Apx Table 1 (pp. 28-29), Why So Wild?1 (pp. 28-29), Why So Wild?
-4.5
-4
-3.5
-3
-2.5
-2
-1.5
-1
-0.5
0
1905 1915 1925 1935 1945 1955 1965 1975 1985 1995
CNV Apx Table 1

Let’s Calm it Down by Taking Let’s Calm it Down by Taking the Decadal Averages from Table 7the Decadal Averages from Table 7
-4.5
-4
-3.5
-3
-2.5
-2
-1.5
-1
-0.5
0
1905 1915 1925 1935 1945 1955 1965 1975 1985 1995
CNV Apx Table 1
CNV Table 7

Table 9. Comparison of alternative rent price indexes with other price indexes, log percent annualized inflation rates.
1940 to 1985
1985 to 2001
Difference
Official rent estimates
CPI-W, not seasonally adjusted, tenant rents, BLS
3.43 3.37 -0.06
New CNV rent estimate
Adjusted CPI-W rents, new estimates
4.84 3.46 -1.38
Median rents
Median gross rents, Census and AHS,
5.78 3.45 -2.33
Residential structures
Residential fixed investment chain price index, BEA
5.06 3.15 -1.91
Compare deceleration to other residential price indexes

ConclusionConclusion
BLS CPI for rents is too low from 1942 BLS CPI for rents is too low from 1942 to 1985, by about 1.4 percent to 1985, by about 1.4 percent annuallyannually
Relative rents have risen relative to Relative rents have risen relative to non-shelter prices over the past 60 non-shelter prices over the past 60 yearsyears
Aggregate real consumption growth Aggregate real consumption growth is about 0.2 percent slower from is about 0.2 percent slower from 1942 to 19851942 to 1985

Comments: How RobustComments: How Robustis the Technique of is the Technique of Parameterization?Parameterization?
Let’s work through their base result Let’s work through their base result for 1963-77 (method 4 Table 4 p. 35)for 1963-77 (method 4 Table 4 p. 35)
Formula comes out that true inflation Formula comes out that true inflation is 1.28 times measured CPI inflation:is 1.28 times measured CPI inflation: 1.28 * 3.43 = 4.761.28 * 3.43 = 4.76 Bias is 3.43 – 4.76 or -1.33Bias is 3.43 – 4.76 or -1.33
Of this -1.33, -0.36 is aging bias and -Of this -1.33, -0.36 is aging bias and -0.97 is the authors’ new calculations0.97 is the authors’ new calculations

Now Adjust Three ParametersNow Adjust Three Parameters
Can’t adjust n (=6) or Can’t adjust n (=6) or ΘΘ (=1/12) (=1/12) Let’s cut Let’s cut ρρ in half from 0.344 to 0.172 in half from 0.344 to 0.172 Let’s cut b in half from 0.33 to 0.165Let’s cut b in half from 0.33 to 0.165 Assume qM/qC is 0.4 instead of 0.2Assume qM/qC is 0.4 instead of 0.2 Result?Result?
Ratio drops from 1.28 to 1.07Ratio drops from 1.28 to 1.07 Aside from aging bias, CPI bias drops from Aside from aging bias, CPI bias drops from
-0.97 to -0.25-0.97 to -0.25 qM/qC of zero gives CPI bias of -0.47qM/qC of zero gives CPI bias of -0.47
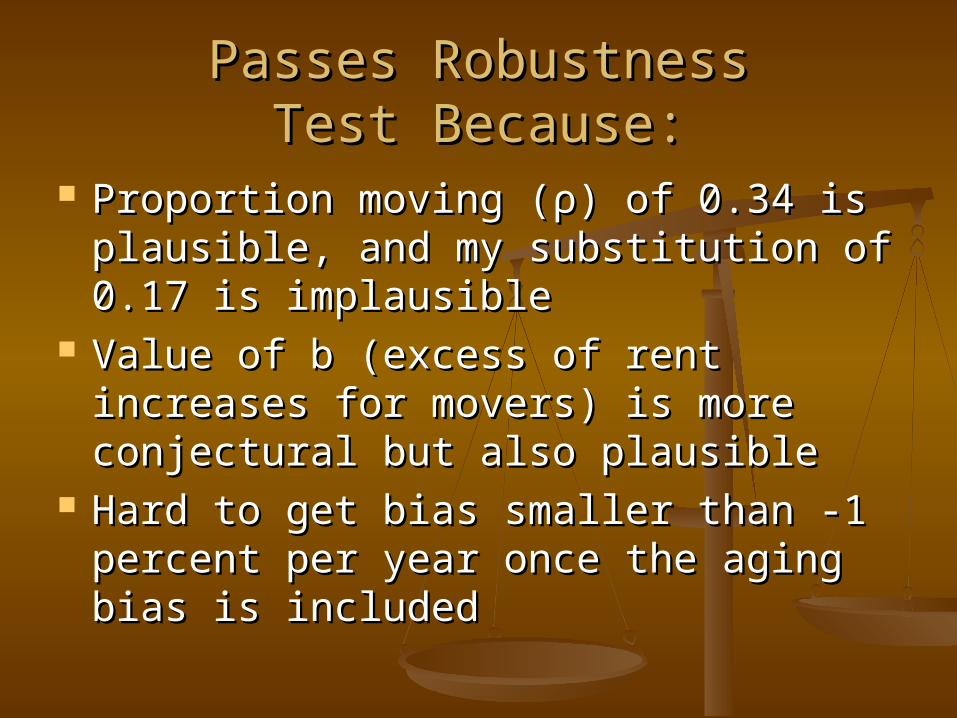
Passes RobustnessPasses RobustnessTest Because:Test Because:
Proportion moving (Proportion moving (ρρ) of 0.34 is ) of 0.34 is plausible, and my substitution of plausible, and my substitution of 0.17 is implausible0.17 is implausible
Value of b (excess of rent increases Value of b (excess of rent increases for movers) is more conjectural but for movers) is more conjectural but also plausiblealso plausible
Hard to get bias smaller than -1 Hard to get bias smaller than -1 percent per year once the aging bias percent per year once the aging bias is includedis included

Issue We Shouldn’t Take for Issue We Shouldn’t Take for Granted: Aging BiasGranted: Aging Bias
CNV Take This at Face ValueCNV Take This at Face Value Yes, Clearly a Source of Downward CPI Bias in the Yes, Clearly a Source of Downward CPI Bias in the
PastPast But What does it Mean?But What does it Mean?
Location: Inner-city vs. SuburbsLocation: Inner-city vs. Suburbs Omitted quality variables from my perspective as an Omitted quality variables from my perspective as an
Evanston landlord: Evanston landlord: New high-rises have viewsNew high-rises have views Central air conditioning, new kitchensCentral air conditioning, new kitchens
But do the older units actually decline in quality?But do the older units actually decline in quality? My coach house says “no”! Renovations not only by owner My coach house says “no”! Renovations not only by owner
but by tenants!but by tenants! Distinction between maintenance (roof, gutters) vs. Distinction between maintenance (roof, gutters) vs.
improvements (e.g., circuit board, kitchen appliances, new and improvements (e.g., circuit board, kitchen appliances, new and better floors)better floors)

What GvG Added to What GvG Added to What CNV had already AchievedWhat CNV had already Achieved
Common Theme – Go Backwards via Quality Common Theme – Go Backwards via Quality ChangeChange
Regression results from AHS, 1975-2003Regression results from AHS, 1975-2003 A more refined empirical analysisA more refined empirical analysis Treatment of discontinuities in AHS dataTreatment of discontinuities in AHS data
Census regressions 1960-1990Census regressions 1960-1990 Extracting crude quality adjustments from Extracting crude quality adjustments from
Weston’s 1972 thesis for 1930-70Weston’s 1972 thesis for 1930-70 Use of CES survey data for housing quality in Use of CES survey data for housing quality in
1918, 1935, 1950, 1972, 1988 from Claire 1918, 1935, 1950, 1972, 1988 from Claire Brown’s Book, Brown’s Book, American Standard of LivingAmerican Standard of Living Impute increase in share of central heating, indoor Impute increase in share of central heating, indoor
plumbing, and electrificationplumbing, and electrification

How do the CNV Bias EstimatesHow do the CNV Bias EstimatesCompare to GvG Table 14?Compare to GvG Table 14?
-1.8
-1.6
-1.4
-1.2
-1
-0.8
-0.6
-0.4
-0.2
0
1905 1915 1925 1935 1945 1955 1965 1975 1985 1995
CNV Table 7
GvG Table 14

Implications of CPI BiasImplications of CPI Bias CNV and GvG agree that bias was greater 1942-78CNV and GvG agree that bias was greater 1942-78 Growth in real consumption and real GDP overstatedGrowth in real consumption and real GDP overstated Golden age of productivity growth 1940-70 Golden age of productivity growth 1940-70
overstatedoverstated Bulge in bias in 1970s worsens the productivity slowdownBulge in bias in 1970s worsens the productivity slowdown Low Bias in 1990s implies bigger productivity revival Low Bias in 1990s implies bigger productivity revival
1% annual bias for 30% of the CPI implies 0.3% 1% annual bias for 30% of the CPI implies 0.3% annual upward bias for real consumption, 0.2% for annual upward bias for real consumption, 0.2% for real GDPreal GDP These are big numbers in the “battle of the basis points”These are big numbers in the “battle of the basis points”
The next step in historical research, try to create a The next step in historical research, try to create a consensus CPI bias estimate that varies over each consensus CPI bias estimate that varies over each decade as CPI methodology has shifteddecade as CPI methodology has shifted
This research makes that goal much closer than it This research makes that goal much closer than it was five years agowas five years ago