Embed Size (px)
Citation preview
RENEWABLES GLOBAL FUTURES REPORTGREAT DEBATES TOWARDS 100 % RENEWABLE ENERGY
Page 16: Electric car / moreimages / shutterstockPage 17: Aerial View of Lujiazui Financial District in Shanghai, China /
shanghainese / shutterstockPage 19: Katse Dam hydroelectric power plant, Lesotho,
Africa / Fabian Plock / shutterstockPage 20: Solarpark / Volker Muether / shutterstockPage 22: San Gorgonio Pass Wind Farm, Riverside, California USA /
Philip Pilosian / shutterstockPage 23: Solar PV modules on remote Island in Fiji / ChameleonsEye /
shutterstockPage 25: Solar boilers / Eunika Sopotnicka / shutterstockPage 26: Aerial view of biogas plant / Kletr / shutterstockPage 33: Wind Farm / Danny Xu / shutterstockPage 35: Hanging tungsten light bulb, energy saving and LED bulb /
Chones / shutterstockPage 36: Solar panels on rooftop / Vittavat Apiromsene / shutterstockPage 40: Based on shutterstockPage 40: Smart city and wireless communication network /
jamesteohart / shutterstockPage 48: Heavy industrial coal powered electricity plant / Rudmer
Zwerver / shutterstockPage 48: Aerial view of a windmillpark at Lake IJsselmeer in the
province Flevoland, Netherlands / Aerovista Luchtfotografie / shutterstock
Page 50: Solar panel on a red roof in Sichuan, China / PK.Inspiration_06 / shutterstock
Page 51: Industrial zone, Steel pipelines, valves and gauges / nostal6ie / shutterstock
Page 53: New District Heating System / dgdimension / shutterstockPage 54: Jack the pellet hand taking beech pellets /
Dedii / shutterstockPage 54: Solar water heating system / Dmitri Ma / shutterstockPage 54: District heating / guentermanaus / shutterstockPage 55: Electric car, part of the car-sharing system in Malmo,
Sweden / Martyn Jandula / shutterstock
Page 56: Red and green trucks / Milos Muller / shutterstock
Page 57: Rechargeable battery pack in electric car / SV Production / shutterstock
Page 58: E-Ship 1 / ka stn Disk/Cat / wikimedia commons
Page 59: Windmills, Zaragoza province, Aragon, Spain / pedrosala / shutterstock
Page 59: Traffic lane dedicated for public transport, buses, taxis and electric cars, Vilnius, Lithuania / Martyn Jandula / shutterstock
Page 66: Solar panels attached on roofs / DutchScenery / shutterstock
Page 67: Wind turbine from aerial view / Blue Planet Studio / shutterstock
Page 71: Hydrocracking installation / diyanski / shutterstock
Page 72: Electric vehicle charging station for home / Chesky / shutterstock
Page 73: Production of solar panels / asharkyu / shutterstock
Page 74: Solar energy station in Brandenburg, Germany / photolike / shutterstock
Page 74: Wind wheels in the sea / sonnee101 / shutterstock
Page 81: Technician, Electrician cleaning and checking solar panels on oil and gas platform / Xmentoys / shutterstock
Page 83: POLICIES word made with building blocks / Kunst Bilder / shutterstock
Page 90: Financial and business centers in developed China town / GaudiLab / shutterstock
Page 91: Solar Panels In The Park Of Modern City / asharkyu / shutterstock
Page 92: Cityscape in middle of Bangkok, Thailand / Imaake / shutterstock
Page 96: Women from Liberia and Malavi after their 6 month solar engineering course / UN Women / Gaganjit Singh
PHOTO CREDITS
REPORT CITATION
REN21. 2017
Renewables Global Futures Report: Great debates towards 100% renewable energy
(Paris: REN21 Secretariat).
ISBN 978-3-9818107-4-5
I. FOREWORD
When REN21 was founded in 2004, the future of renewable energy looked very different than it does today. No one imagined then that in 2016 renewable energy would account for 86% of all new EU power installations; that China would become the renewable energy power house of the world; and that more than half of global renewable energy investments would happen in emerging economies and developing countries.
Riding on the momentum of the Paris Agreement, there is consensus that we have to radically re-consider how we produce and consume energy. Holding global average temperature rise well below 2°C, not to mention a much safer limit of 1.5°C, requires nothing short of a complete decarbonisation of the energy sector. There is no one way to achieve this; what works in one country doesn’t necessarily work in another. Finding solutions for some sectors is easier than for others. The stakes are high – financially, environmentally and socially – and as the transition progresses, there will be clear winners and losers.
For more than a decade, REN21 has worked to “connect the dots” between the public and the private sector to drive the global energy transition. In keeping with this tradition, REN21 has canvassed a wide range of experts and stakeholders from around the world. Experts were asked about their views on the feasibility of achieving a 100% renewable energy future and what they thought related macro-economic impacts might be. This new REN21 Renewables Global Futures Report: Great debates towards 100% reneawble energy presents a spectrum of expert views and contains the most pressing subjects that need to be addressed in order to enable high-shares of renewables on a global level. These subjects, summarised in the report as “Great Debates”, are hotly contested by the interviewed energy experts. Their views are influenced by the different regions and countries that they come from, the current stage of development in their region and in which energy sector they work.
By presenting the full spectrum of views, some might be tempted to conclude that getting to 100% renewables by mid-century is a pipe dream. But if we’ve learned one thing about renewable energy deployment over the last decade, it is that, with sufficient political will to adopt good policies and create financial incentives, most obstacles can be overcome. This report therefore should not be seen as an attempt to predict the future, but to understand better and discuss constructively the opportunities and challenges of such a future.
This REN21 Renewables Global Futures Report is a sister publication to REN21’s annual Renewables Global Status Report (GSR). By design, the annual GSR covers only the current, worldwide status of renewables; it offers no future projections. The two reports are therefore complementary. REN21 intends to use the Futures Report to facilitate an on-going dialogue among a wide range of stakeholders about the future of renewable energy,
This report was made possible with the financial support of the German government and the World Future Council. It benefits from the dedicated work of a broad network of regional partners whom I would like to thank for their collaboration.
Heartfelt thanks goes to report author Sven Teske for his hard work to provide such a remarkable synthesis of the world’s thinking about the future of renewable energy. Thank you also to the dedicated staff of the REN21 Secretariat, who under the leadership of REN21’s Executive Secretary Christine Lins, supported the project, in particular Project Manager Martin Hullin and Communication and Outreach Manager Laura Williamson. And finally, appreciation goes to all the interviewees for their time and expertise.
Anyone who reads this report cannot help but have their own thinking affected by the multitude of viewpoints expressed. It is our hope that each reader will discover new, imaginative, and forward-looking ways to think about the future. I encourage everyone to share those views and engage with REN21 in forging a 100% renewable energy future.
Arthouros Zervos
Chair
3
G L O B A L F U T U R E S R E P O R T 2 017
RENEWABLE ENERGY POLICY NETWORK FOR THE 21ST CENTURYREN21 is the global renewable energy policy multi-
stakeholder network that connects a wide range of key
actors. REN21’s goal is to facilitate knowledge exchange,
policy development and joint action towards a rapid global
transition to renewable energy.
REN21 brings together governments, nongovernmental
organisations, research and academic institutions,
international organisations and industry to learn from one
another and build on successes that advance renewable
energy. To assist policy decision making, REN21 provides
high-quality information, catalyses discussion and debate,
and supports the development of thematic networks.
REN21 facilitates the collection of comprehensive and
timely information on renewable energy. This information
reflects diverse viewpoints from both private and public
sector actors, serving to dispel myths about renewable
energy and to catalyse policy change. It does this through
six product lines.
RENEWABLES INTERACTIVE MAP
RENEWABLES ACADEMY INTERNATIONAL RENEWABLE ENERGY CONFERENCES (IREC)
RENEWABLES GLOBAL STATUS REPORT (GSR)
REGIONAL REPORTS GLOBAL FUTURES REPORTS (GFR)
www.ren21.net/mapwww.ren21.net/mapwww.ren21.net/map
RENEWABLES GLOBAL FUTURES REPORTGREAT DEBATES TOWARDS 100 % RENEWABLE ENERGY
4
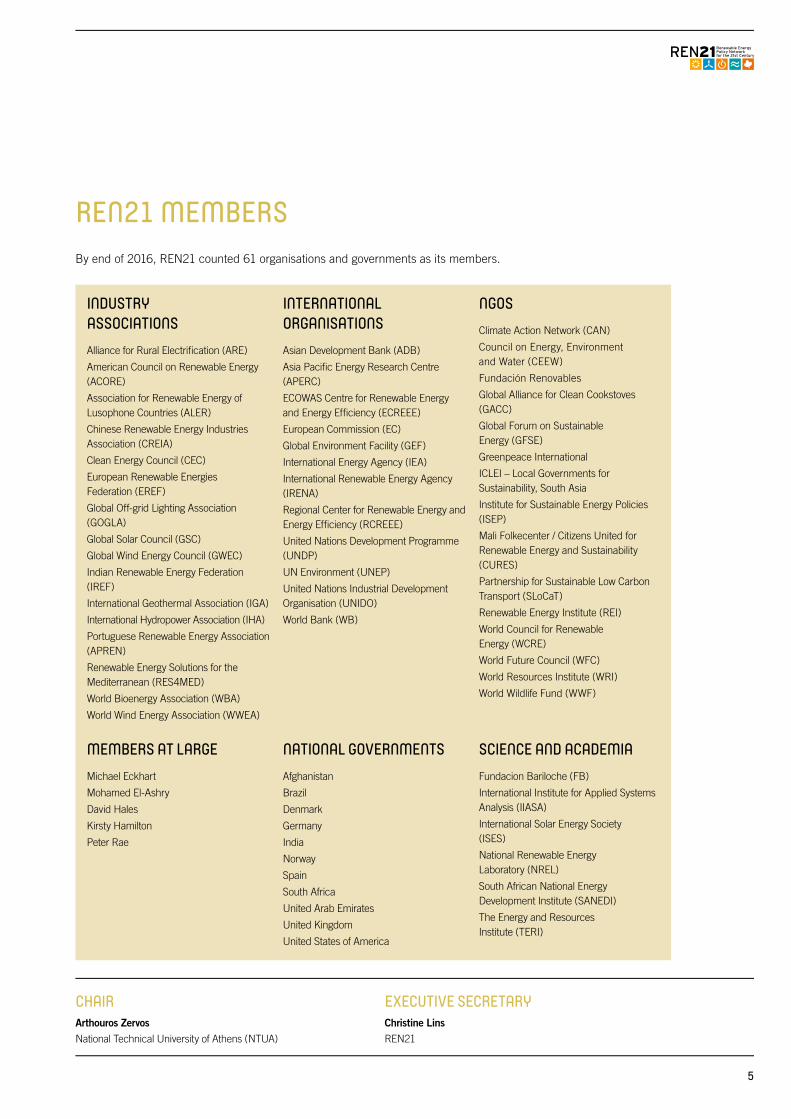
INDUSTRY ASSOCIATIONSAlliance for Rural Electrification (ARE)
American Council on Renewable Energy (ACORE)
Association for Renewable Energy of Lusophone Countries (ALER)
Chinese Renewable Energy Industries Association (CREIA)
Clean Energy Council (CEC)
European Renewable Energies Federation (EREF)
Global Off-grid Lighting Association (GOGLA)
Global Solar Council (GSC)
Global Wind Energy Council (GWEC)
Indian Renewable Energy Federation (IREF)
International Geothermal Association (IGA)
International Hydropower Association (IHA)
Portuguese Renewable Energy Association (APREN)
Renewable Energy Solutions for the Mediterranean (RES4MED)
World Bioenergy Association (WBA)
World Wind Energy Association (WWEA)
INTERNATIONAL ORGANISATIONSAsian Development Bank (ADB)
Asia Pacific Energy Research Centre (APERC)
ECOWAS Centre for Renewable Energy and Energy Efficiency (ECREEE)
European Commission (EC)
Global Environment Facility (GEF)
International Energy Agency (IEA)
International Renewable Energy Agency (IRENA)
Regional Center for Renewable Energy and Energy Efficiency (RCREEE)
United Nations Development Programme (UNDP)
UN Environment (UNEP)
United Nations Industrial Development Organisation (UNIDO)
World Bank (WB)
NGOSClimate Action Network (CAN)
Council on Energy, Environment and Water (CEEW)
Fundación Renovables
Global Alliance for Clean Cookstoves (GACC)
Global Forum on Sustainable Energy (GFSE)
Greenpeace International
ICLEI – Local Governments for Sustainability, South Asia
Institute for Sustainable Energy Policies (ISEP)
Mali Folkecenter / Citizens United for Renewable Energy and Sustainability (CURES)
Partnership for Sustainable Low Carbon Transport (SLoCaT)
Renewable Energy Institute (REI)
World Council for Renewable Energy (WCRE)
World Future Council (WFC)
World Resources Institute (WRI)
World Wildlife Fund (WWF)
MEMBERS AT LARGEMichael Eckhart
Mohamed El-Ashry
David Hales
Kirsty Hamilton
Peter Rae
NATIONAL GOVERNMENTSAfghanistan
Brazil
Denmark
Germany
India
Norway
Spain
South Africa
United Arab Emirates
United Kingdom
United States of America
SCIENCE AND ACADEMIAFundacion Bariloche (FB)
International Institute for Applied Systems Analysis (IIASA)
International Solar Energy Society (ISES)
National Renewable Energy Laboratory (NREL)
South African National Energy Development Institute (SANEDI)
The Energy and Resources Institute (TERI)
CHAIRArthouros Zervos National Technical University of Athens (NTUA)
EXECUTIVE SECRETARYChristine Lins REN21
REN21 MEMBERSBy end of 2016, REN21 counted 61 organisations and governments as its members.
5

G L O B A L F U T U R E S R E P O R T 2 017
Figure 1: Global primary energy supply, 2003 – 2015 . . . . . . . . . . . . . . . .25Figure 2: Illustrative paths of energy from source to service . . . . . . . . .26Figure 3: Total technical renewable energy potential in EJ/yr
for 2050 . . . . . . . . . . . . . . . . . . . . . . . . . . . . . . . . . . . . . . . . . . . . . . . . . . . . . . . . . .27Figure 4: Is the transition to 100% renewables on a global
level feasible and realistic? . . . . . . . . . . . . . . . . . . . . . . . . . . . . . . . . . . . .28Figure 5: What will be the share of global renewable final
energy consumption by 2050? . . . . . . . . . . . . . . . . . . . . . . . . . . . . . .32Figure 6: Global primary energy intensity and total primary energy
demand . . . . . . . . . . . . . . . . . . . . . . . . . . . . . . . . . . . . . . . . . . . . . . . . . . . . . . . . . .34Figure 7: To what extent will global final energy demand
increase or decrease by 2050? (Compared to 2015 in %) . . . . . . . . . . . . . . . . . . . . . . . . . . . . . . . . . . . .34
Figure 8: Average Electricity consumption per electrified household, selected regions and world, 2000, 2005, 2010 and 2014 . . . . . . . . . . . . . . . . . . . . . . . . . . . . . . . .36
Figure 9: Electricity intensity of service sector (to value added), selected regions and world, 2000, 2005, 2010 and 2014 . . . . . . . . . . . . . . . . . . . . . . . . . . . . . . . . . . . . . . . . . . . . . . . . . . . . . . . . .37
Figure 10: Energy Intensity in Industry, Selected Regions and World, 2000, 2005, 2010 and 2014 . . . . . . . . . . . . . . . . . .37
Figure 11: Energy intensity in transport, selected regions and world, 2000, 2005, 2010 and 2014 . . . . . . . . . . . . . . . . . .38
Figure 12: Will „smart homes“ dominate the global building stock by 2050 . . . . . . . . . . . . . . . . . . . . . . . . . . . . . . . . . . . . . . . . . . . . . . . . . .39
Figure 13: Demand and supply management in “smart homes” will be driven by price signals via different time dependent tariffs . . . . . . . . . . . . . . . . . . . . . . . . . . . . . . . . . . . . . . . . . . . . . . .40
Figure 14: Global power generation development since 2003 . . . . . . .42Figure 15: What will be the estimated development of global
renewable power generation share by 2050? . . . . . . . . . . . . .42Figure 16: Wind power projections versus real market
developments . . . . . . . . . . . . . . . . . . . . . . . . . . . . . . . . . . . . . . . . . . . . . . . . . . .43Figure 17: Solar photovoltaic projections versus real
market developments . . . . . . . . . . . . . . . . . . . . . . . . . . . . . . . . . . . . . . . . .45Figure 18: Global annual new installed power plant
capacities 2000 till 2015 . . . . . . . . . . . . . . . . . . . . . . . . . . . . . . . . . . . . .46Figure 19: Global power plant market, 1970 – 2014 . . . . . . . . . . . . . . . . . .48Figure 20: Will decentralised or centralised power
generation dominate by 2050? . . . . . . . . . . . . . . . . . . . . . . . . . . . . . .49Figure 21: Development of global heat supply by source,
2003 – 2015 . . . . . . . . . . . . . . . . . . . . . . . . . . . . . . . . . . . . . . . . . . . . . . . . . . . .52Figure 22: What will be the share of global renewable
heating energy consumption by 2050? . . . . . . . . . . . . . . . . . . . .52Figure 23: The electrification of the heating sector will continue
and will lead to an almost complete electrification . . . . . . .53Figure 24: Development of global transport supply by source,
2003 – 2015 . . . . . . . . . . . . . . . . . . . . . . . . . . . . . . . . . . . . . . . . . . . . . . . . . . . .56Figure 25: What will be the share of global renewable
transport energy consumption by 2050? . . . . . . . . . . . . . . . . . .57Figure 26: The interconnection of sectors . . . . . . . . . . . . . . . . . . . . . . . . . . . . . .62 Figure 27: Demand and supply management in “smart homes”
will be encouraged by price signals via different time dependent tariffs . . . . . . . . . . . . . . . . . . . . . . . . . . . . . . . . . . . . . . . . . . . . . . .63
Figure 28: Vision of a smart-grid . . . . . . . . . . . . . . . . . . . . . . . . . . . . . . . . . . . . . . . . . .68Figure 29: Potential locations and applications of electricity
storage in the power system . . . . . . . . . . . . . . . . . . . . . . . . . . . . . . .70
Figure 30: Overview storage capacity of different energy storage systems . . . . . . . . . . . . . . . . . . . . . . . . . . . . . . . . . . . . . . . . . . . . . . . .71
Figure 31: Range of levelised costs of energy for selected commercially available renewable energy technologies compared to non-renewable energy costs – cost development, 2010 – 2015 . . . . . . . . . . . . . . . . . . . . . . . . . . . . . . . . . . .75
Figure 32: In the coming decades, the price of oil per barrel over USD 100 per barrel is almost certain . . . . . . . . . . . . . . . . . . 76
Figure 33: The cost for renewables will continue to fall and will out-pace all fossil fuels within the next 10 years . . . . .77
Figure 34: What will the annual global investment volume in renewable energy be by 2050? . . . . . . . . . . . . . . . . . . . . . . . . . . . . .79
Figure 35: How many people will be employed in the renewables industry by 2050? . . . . . . . . . . . . . . . . . . . . . . . . . . . . . . .81
Figure 36: Number of countries with renewable energy policies . . . . . . . . . . . . . . . . . . . . . . . . . . . . . . . . . . . . . . . . . . . . . . .83
Figure 37: Efficiency of selected power grid policies: Past experience and future requirements . . . . . . . . . . . . . . . . . . . . . . . . . . . . . . . . . . . . . .85
Figure 38: Efficiency of selected regulatory policies for heating: Past experience and future requirements . . . . . . . . . . . . . . . . . . . . . . . .86
Figure 39: Transport regulatory policies: Past experience and future requirements . . . . . . . . . . . . . . . . . . . . . . . . . . . . . . . . . . . . . . . . . . . . . . . . . . . .88
Figure 40: From petropolis to ecopolis . . . . . . . . . . . . . . . . . . . . . . . . . . . . . . . . . . .93Figure 41: Decentralised energy technologies will play a
significant role even in space-constrained megacities and will supply the majority of the power demand by 2050 . . . . . . . . . . . . . . . . . . . . . . . . . . . . . . . . . . . .94
Figure 42: Decentralised renewable energy technologies will not be enough to give access to energy for all, meaning that large-scale conventional power plants are still required to provide energy access for all. . . . . . . . . . . . . . . . . . .97
Table 1: Projected renewable energy shares (primary) until 2050 . . . . . . . . . . . . . . . . . . . . . . . . . . . . . . . . . . . . . . . . . . . . . . . . . . . . . . . . .29
Table 2: Primary energy demand projections under different scenarios . . . . . . . . . . . . . . . . . . . . . . . . . . . . . . . . . . . . . . . . . . . . . . . . . . . . . . . . .30
Table 3: Renewable primary energy supply projections under different scenarios . . . . . . . . . . . . . . . . . . . . . . . . . . . . . . . . . . . . . . . . . . . . . .31
Table 4: Renewable energy market development over the past decade . . . . . . . . . . . . . . . . . . . . . . . . . . . . . . . . . . . . . . . . . . . . . . . . . . . . . .44
Table 5: ISF scenario analysis – wind power: Cumulative capacities and annual markets of various scenarios . . . . . . .47
Table 6: ISF scenario analysis – solar photovoltaic: Cumulative capacities and annual markets of various scenarios . . . . . . .47
Table 7: Renewable energy jobs in 2015 . . . . . . . . . . . . . . . . . . . . . . . . . . . . . .80Table 8: Renewable energy jobs by technology . . . . . . . . . . . . . . . . . . . . .80
Box 1: Energy efficiency and intensity . . . . . . . . . . . . . . . . . . . . . . . . . . . . . . .35Box 2: Priority dispatch for renewables . . . . . . . . . . . . . . . . . . . . . . . . . . . . . .65Box 3: Fast growth: A challenge for cities in developing
countries . . . . . . . . . . . . . . . . . . . . . . . . . . . . . . . . . . . . . . . . . . . . . . . . . . . . . . . . .92
LIST OF FIGURES AND TABLES
6
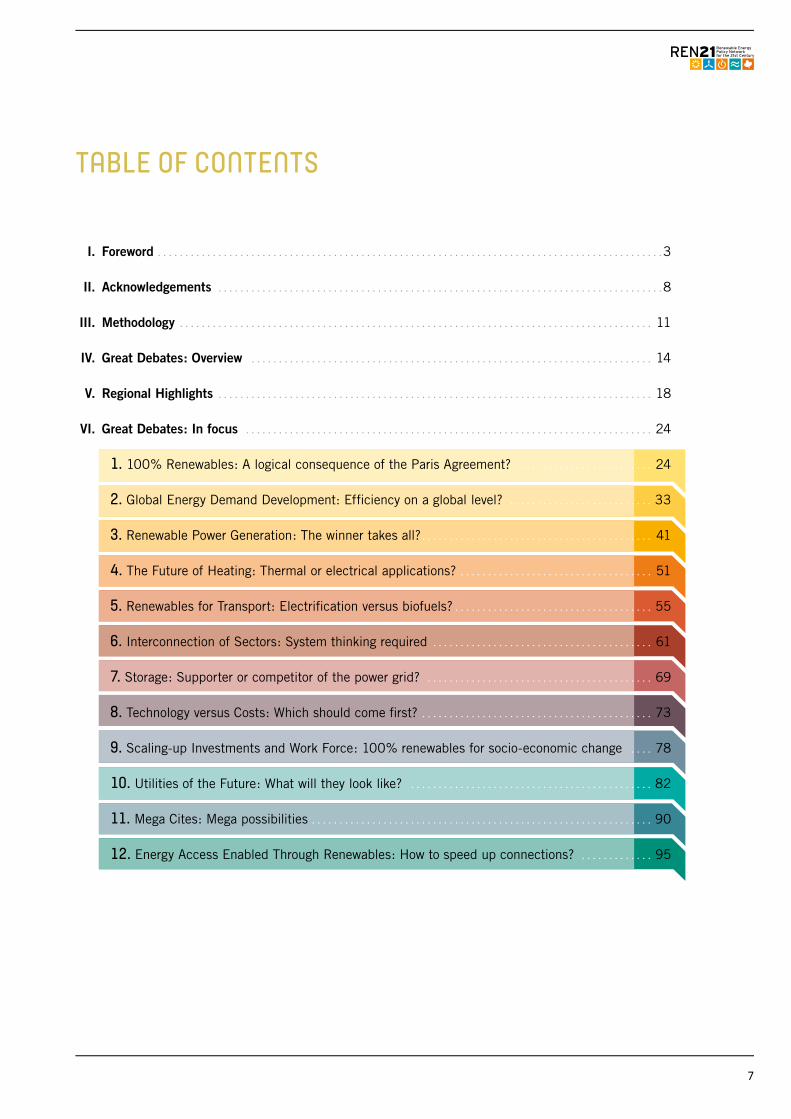
I. Foreword . . . . . . . . . . . . . . . . . . . . . . . . . . . . . . . . . . . . . . . . . . . . . . . . . . . . . . . . . . . . . . . . . . . . . . . . . . . . . . . . . . . . . . . . . . . . 3
II. Acknowledgements . . . . . . . . . . . . . . . . . . . . . . . . . . . . . . . . . . . . . . . . . . . . . . . . . . . . . . . . . . . . . . . . . . . . . . . . . . . . . . . . . 8
III. Methodology . . . . . . . . . . . . . . . . . . . . . . . . . . . . . . . . . . . . . . . . . . . . . . . . . . . . . . . . . . . . . . . . . . . . . . . . . . . . . . . . . . . . . . 11
IV. Great Debates: Overview . . . . . . . . . . . . . . . . . . . . . . . . . . . . . . . . . . . . . . . . . . . . . . . . . . . . . . . . . . . . . . . . . . . . . . . . . 14
V. Regional Highlights . . . . . . . . . . . . . . . . . . . . . . . . . . . . . . . . . . . . . . . . . . . . . . . . . . . . . . . . . . . . . . . . . . . . . . . . . . . . . . . 18
VI. Great Debates: In focus . . . . . . . . . . . . . . . . . . . . . . . . . . . . . . . . . . . . . . . . . . . . . . . . . . . . . . . . . . . . . . . . . . . . . . . . . . 24
1. 100% Renewables: A logical consequence of the Paris Agreement? . . . . . . . . . . . . . . . . . . . . . . . . . 24
2. Global Energy Demand Development: Efficiency on a global level? . . . . . . . . . . . . . . . . . . . . . . . . . . 33
3. Renewable Power Generation: The winner takes all? . . . . . . . . . . . . . . . . . . . . . . . . . . . . . . . . . . . . . . . . . . 41
4. The Future of Heating: Thermal or electrical applications? . . . . . . . . . . . . . . . . . . . . . . . . . . . . . . . . . . . 51
5. Renewables for Transport: Electrification versus biofuels? . . . . . . . . . . . . . . . . . . . . . . . . . . . . . . . . . . . . 55
6. Interconnection of Sectors: System thinking required . . . . . . . . . . . . . . . . . . . . . . . . . . . . . . . . . . . . . . . . 61
7. Storage: Supporter or competitor of the power grid? . . . . . . . . . . . . . . . . . . . . . . . . . . . . . . . . . . . . . . . . . 69
8. Technology versus Costs: Which should come first? . . . . . . . . . . . . . . . . . . . . . . . . . . . . . . . . . . . . . . . . . . 73
9. Scaling-up Investments and Work Force: 100% renewables for socio-economic change . . . . 78
10. Utilities of the Future: What will they look like? . . . . . . . . . . . . . . . . . . . . . . . . . . . . . . . . . . . . . . . . . . . . 82
11. Mega Cites: Mega possibilities . . . . . . . . . . . . . . . . . . . . . . . . . . . . . . . . . . . . . . . . . . . . . . . . . . . . . . . . . . . . . . 90
12. Energy Access Enabled Through Renewables: How to speed up connections? . . . . . . . . . . . . . 95
TABLE OF CONTENTS
7
G L O B A L F U T U R E S R E P O R T 2 017
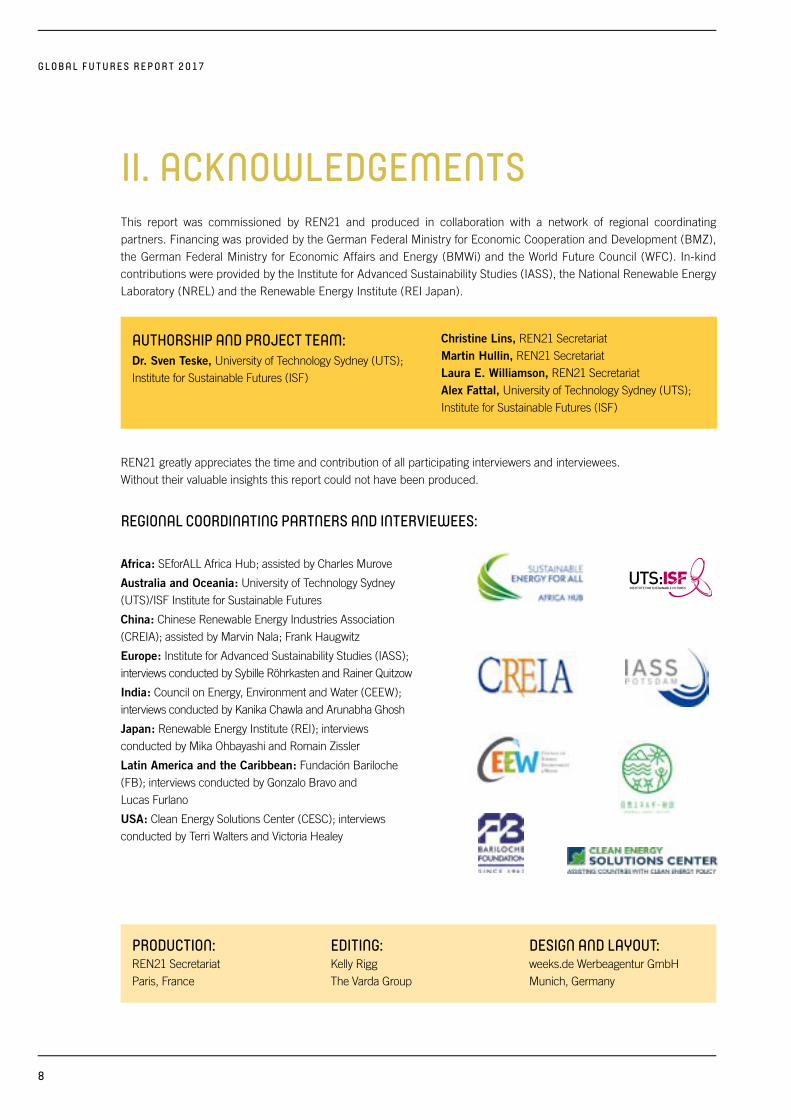
This report was commissioned by REN21 and produced in collaboration with a network of regional coordinating partners. Financing was provided by the German Federal Ministry for Economic Cooperation and Development (BMZ), the German Federal Ministry for Economic Affairs and Energy (BMWi) and the World Future Council (WFC). In-kind contributions were provided by the Institute for Advanced Sustainability Studies (IASS), the National Renewable Energy Laboratory (NREL) and the Renewable Energy Institute (REI Japan).
AUTHORSHIP AND PROJECT TEAM:Dr. Sven Teske, University of Technology Sydney (UTS); Institute for Sustainable Futures (ISF)
Christine Lins, REN21 Secretariat Martin Hullin, REN21 Secretariat Laura E. Williamson, REN21 Secretariat Alex Fattal, University of Technology Sydney (UTS); Institute for Sustainable Futures (ISF)
PRODUCTION: REN21 Secretariat Paris, France
EDITING: Kelly Rigg The Varda Group
DESIGN AND LAYOUT: weeks.de Werbeagentur GmbH Munich, Germany
REN21 greatly appreciates the time and contribution of all participating interviewers and interviewees. Without their valuable insights this report could not have been produced.
REGIONAL COORDINATING PARTNERS AND INTERVIEWEES:
Africa: SEforALL Africa Hub; assisted by Charles Murove
Australia and Oceania: University of Technology Sydney (UTS)/ISF Institute for Sustainable Futures
China: Chinese Renewable Energy Industries Association (CREIA); assisted by Marvin Nala; Frank Haugwitz
Europe: Institute for Advanced Sustainability Studies (IASS); interviews conducted by Sybille Röhrkasten and Rainer Quitzow
India: Council on Energy, Environment and Water (CEEW); interviews conducted by Kanika Chawla and Arunabha Ghosh
Japan: Renewable Energy Institute (REI); interviews conducted by Mika Ohbayashi and Romain Zissler
Latin America and the Caribbean: Fundación Bariloche (FB); interviews conducted by Gonzalo Bravo and Lucas Furlano
USA: Clean Energy Solutions Center (CESC); interviews conducted by Terri Walters and Victoria Healey
II. ACKNOWLEDGEMENTS
8
INTERVIEWEES (114) International Organisations (13)• Tanzeed Alam, Emirates Wildlife Society (WWF)
• Marcel Alers, United Nations Development Programme (UNDP)
• Bruce Douglas, Global Solar Council (GSC)
• Mike Eckhart, Citigroup
• Stefan Gsänger, World Wind Energy Association (WWEA)
• Karin Haara, World Bioenergy Association (WBA)
• Rachel Kyte, Sustainable Energy for all (SEforALL)
• Ernesto Macias, Alliance for Rural Electrification (ARE)
• Dennis McGinn, Energy, Installations and Environment, Department of the US Navy
• Nebojsa Nakicenovic, International Institute for Applied Systems Analysis (IIASA)
• Mark Radka, UN Environment
• Steve Sawyer, Global Wind Energy Council (GWEC)
• Stephan Singer, Climate-Action-Network (CAN) International
Africa (22)• Ahmed Badr, Regional Center for Renewable Energy and Energy Efficiency (RCREEE), Egypt
• Sama Dudley Achu Valdas & Company Ltd, Cameroon
• David Ebong, Clean Energy Partnership Africa LTD (CEPA), Uganda
• Wim Jonker Klunne, Energy & Environment Partnership Programme (EEP), South Africa
• Peter Kinuthia, EAC Secretariat, Tanzania
• Chiedza Mazaiwana, Power4All, Zimbabwe
• Linus Mofor, African Climate Policy Centre, Ethiopia
• Wolfgang Moser, SADC Secretariat, Botswana
• Elizabeth Muguti, African Development Bank (AfDB), Tunisia
• Charles Murove, Hermit Sustainability Advisory, South Africa
• Gertrude Mwangala Akapelwa, University of Technology, Victoria Falls, Zambia
• Kevin Nassiep, South African National Energy Development Institute (SANEDI), South Africa
• Bello Nassourou, Ministry of Energy and Petroleum, Niger
• Kudakwashe Ndhlukula, SADC Centre for Renewable Energy and Energy Efficiency (SACREEE), Namibia
• Joseph Ngwawi Southern African Research and Documentation Centre (SARDC), Zimbabwe
• Ewah Otu Eleri, International Centre for Energy, Environment & Development, Nigeria
• Paul Runge, Africa House, South Africa
• Herve Asemtsa, S2 Services Sarl, Doula, Cameroon
• Daniel Schroth, SEforALL Africa Hub, Tunisia
• Maloba Tshehla, Green Cape, South Africa
• Stephen V. Potter, Sr, Government Liberia, Liberia
• Faruk Yusuf Yabo, Department of Renewable Energy and Rural Power Access, Ministry of Power, Nigeria
Australia and Oceania (9)• Chris Amos, Ausgrid, Australia
• Tom Butler, Clean Energy Council, Australia
• Chris Dunstan, University of Technology Sydney (UTS) Institute for Sustainable Futures, Australia
• Alex Entered, Clean Energy Council, Australia
• Ken Guthrie, Sustainable energy transformation PTY ltd, Australia
• Stuart Johnston, Energy Networks Association, Australia
• Molly Meluish, Xtra, New Zealand
• Atul Raturi, The University of the South Pacific, Fiji
• Ian Shearer, Sustainable Energy Forum, New Zealand
China (10)• He Dexin, China Wind Energy Association
• Wei Feng, Lawrence Berkeley National Lab
• Frank Haugwitz, Asia Europe Clean Energy (Solar) Advisory Co. Ltd.
• Miao Hong, WRI China Office
• Xu Honghua, Institute of Electrical Engineering, Chinese Academy of Sciences
• Lin Jiang, Lawrence Berkeley National Laboratory
• Li Junfeng , Chinese Renewable Energy Industries Association (CREIA)
• Haiyan Qin, Chinese Wind Energy Association, (CWEA)
• Hu Runqing, Energy Research Institute, NDRC
• Xi Wenhua, UNIDO International Solar Energy Center for Technology Promotion and Transfer
Europe (14)• Jean-François Fauconnier, Climate Action Network (CAN) Europe, France
• Christian Hochfeld, Agora Energiewende, Germany
• Tom Howes, European Commission, Belgium
• Øivind Johansen, Ministry of Petroleum and Energy, Norway
• Hans Josef Fell, Energy Watch Group (EWG), Germany
• Anna Leidreiter, World Future Council (WFC), Germany
• Johannes Meier, European Cultural Foundation (ECF), Netherlands
• Dr. Patrick Graichen, Agora Energiewende, Germany
• Martin Schöpe, Federal Ministry for Economic Affairs and Energy (BMWi), Germany
• Stefan Schurig, World Future Council (WFC), Germany
• Konstantin Staschus, ENTSO-E, France
• Frauke Thies, SEDC, Belgium
• Claude Turmes, European Parliament, Belgium
• Dirk Vansintjan, REScoop.eu, Belgium
9
G L O B A L F U T U R E S R E P O R T 2 017
India (10)• Anshu Bharadwaj, Center for Study of Science, Technology and Policy (CSTEP)
• Svati Bhogle, Sustaintech
• Satish Kumar, Alliance for Energy Efficient Economy
• Jamshyd N Godrej, Godrej and Boyce Manufacturing
• Taneja Narendra, Bharatiya Janata Party, (Energy Cell)
• Hari Natarajan, CLEAN Network
• Vinay Rustagi, Bridge To India
• Shyam Saran, Research and Information Systems
• Gauri Singh, Madhya Pradesh Urja Vikas Nigam
• Shri V. Subramanian, Indian Renewable Energy Federation (IREF)
Japan (14)• Hisahito Endo, Organization for Cross-regional Coordination of Transmission Operators,
• Toshimitsu Fujiki, Energy Conservation and Renewable Energy Department, Ministry of Economy, Trade and Industry
• Kimiko Hirata, Kiko Network
• Tetsunari Iida, Institute for Sustainable Energy Policies
• Masaaki Kobayashi, Ministry of Environment
• Masaaki Kameda, Japan Photovoltaic Energy Association
• Hiroyuki Matsubara, Marubeni Research Institute, Marubeni Corporation
• Akiko Miura, Tokyo Metropolitan Government
• Hiroshi Okamoto, Tokyo Electric Power Company Holdings
• Seita Shimizu, Corporate Planning Department, Tokyo Gas CO. LTD
• Manabu Takamoto, Japan Wind Power Association
• Yukari Takamura, Nagoya University
• Nobuo Tanaka, President, the Sasakawa Peace Foundation
• Masakazu Toyoda, The Institute of Energy Economics
Latin America and the Caribbean (14)• Luiz Augusto, NIPE/Unicamp, Brazil
• Luis C.A. Gutierrez-Negrin, Geoconsul, IGA, Mexican Geothermal Association, Mexico
• Manlio F. Coviello, United Nations, CEPAL, Chile
• Erika Garcia, Organización Latinoamericana de Energía (OLADE), Mexico
• Daniel Hugo Bouille, Fundación Bariloche (FB), Argentina
• Ramiro Juan Trujillo Blanco, Transtech, Bolivia
• Jorge M Huacuz, National Institute for Electricity and Clean Energy (INEEL), Mexico
• Lal Marandin, PELICAN, S.A. Nicaragua
• Felipe Miijans, Universidad Nacional de Asunción, Paraguay
• Horta Nogueira, NIPE/Unicamp, Brazil
• Victorio Oxilia, Universidad Nacional de Asunción, Paraguay
• Wilson Sierra, Renewable Energy Office, Uruguay
• Mauricio Solano Peralta, Infratec Ltd., Costa Rica
• Arnaldo Vieira de Carvalho, Inter-American Development Bank, USA
United States of America (8)• Doug Arent, National Renewable Energy Laboratory (NREL)
• Elizabeth Doris, National Renewable Energy Laboratory (NREL)
• Daniel Kammen, University of California at Berkeley
• Noam Lior, University of Pennsylvania
• Steven Malnight, Pacific Gas and Electric (PG&E),
• Wilson Rickerson, Rickerson Strategies
• Carlos St. James, LAC-CORE
• Uday Varadarajan, Pacific Gas and Electric (PG&E),
10

III. METHODOLOGY
BACKGROUNDThe first version of REN21’s Renewables Global Futures Report (GFR) published in January 2013 identified a panorama of likely future debates related to the renewable energy transition. As a reflection of the wide range of contemporary thinking by the many experts interviewed for the report, it did not present just one vision of the future but rather a “mosaic” of insights. Given the positive feedback in response to the first edition, a new edition has been prepared, continuing where the last one left off.
The objective of this report is to gather opinions about the feasibility of a 100% renewable energy future, and the macro-economic impacts it would entail. In so doing, the report reflects on the debates of 2013, and tracks their evolution to the present time. Some remain, some have changed, some have been overtaken by progress, and new ones have arisen. They are summarised here as the Great Debates in renewable energy.
The questionnaire for the survey was developed in close cooperation between the REN21 Secretariat, the Institute for Sustainable Future (ISF) of the University of Technology Sydney/Australia (UTS) and the Institute for Advanced Sustainability Studies (IASS) in Potsdam/Germany. It covered the following topics:
1. How much renewables?
2. Power sector
3. Heating and cooling
4. Transport
5. Storage
6. Demand-side management and energy efficiency
7. Integration of sectors
8. Macro-economic considerations
9. Technology and costs
10. Policy
11. Cities
12. Distributed renewable energy/energy access
13. Barriers/challenges/enablers
114 experts were interviewed in total; the average interview time was approximately one hour. The interviews were conducted between May and October 2016.
The questionnaire was also mirrored in an online version and used both by interviewers and interviewees to record the interview process.
SELECTION PROCESS FOR INTERVIEWEESInterviewees were selected from the following regions:
• Africa
• Australia and Oceania
• China
• Europe
• India
• Japan
• Latin America and the Caribbean
• North America
• International experts and organisations
In each region, up to 22 key experts were selected by REN21 members, in collaboration with leading regional institutes. Each of these experts were categorised according to their perceived attitudes towards the feasibility and desirability of achieving 100% renewable energy in the overall energy mix by 2050:
Progressive: The expert is optimistic that 100% renewable energy is achievable by 2050
Moderate: The expert is in favour of a considerable share of renewables in the energy mix, but considers the 100% goal to be overly ambitious
Conservative: The expert does not believe that renewables will make up a considerable share of the energy mix in 2050
11
G L O B A L F U T U R E S R E P O R T 2 017
PARTNERS FOR GFR INTERVIEWS Regional institutes partnering with the project subsequently conducted the interviews in their respective regions:
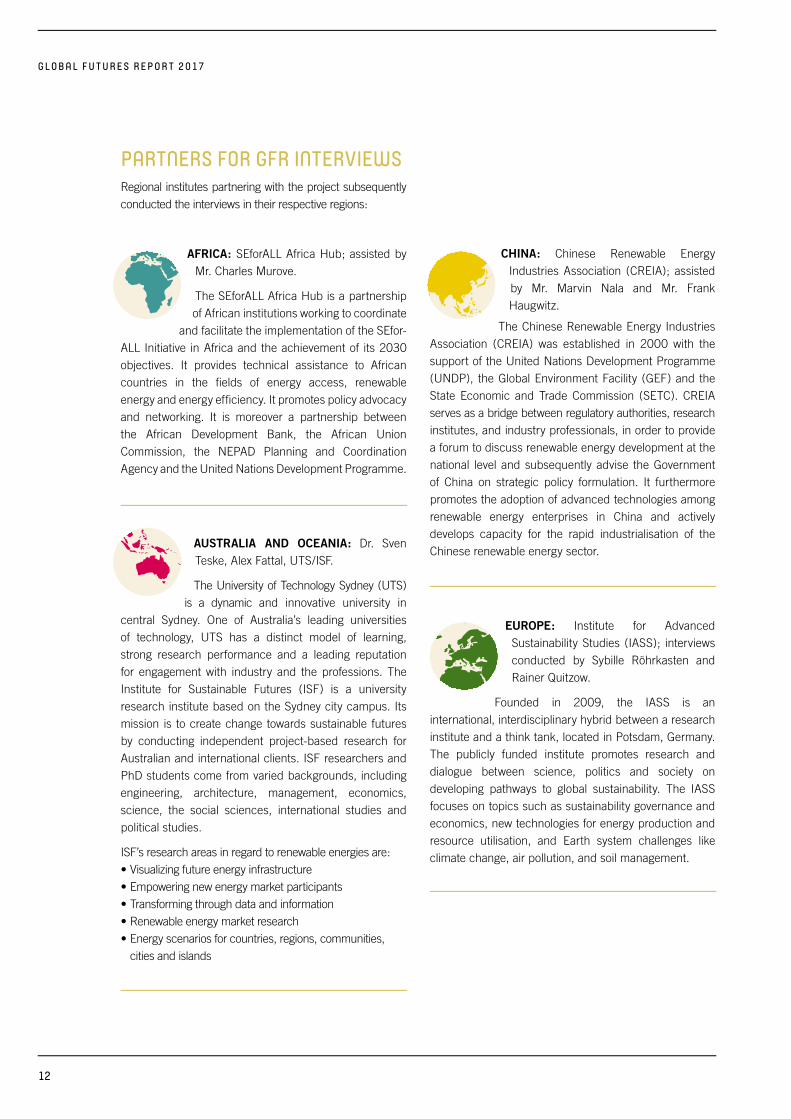
AFRICA: SEforALL Africa Hub; assisted by Mr. Charles Murove.
The SEforALL Africa Hub is a partnership of African institutions working to coordinate
and facilitate the implementation of the SEfor-ALL Initiative in Africa and the achievement of its 2030 objectives. It provides technical assistance to African countries in the fields of energy access, renewable energy and energy efficiency. It promotes policy advocacy and networking. It is moreover a partnership between the African Development Bank, the African Union Commission, the NEPAD Planning and Coordination Agency and the United Nations Development Programme.
AUSTRALIA AND OCEANIA: Dr. Sven Teske, Alex Fattal, UTS/ISF.
The University of Technology Sydney (UTS) is a dynamic and innovative university in
central Sydney. One of Australia’s leading universities of technology, UTS has a distinct model of learning, strong research performance and a leading reputation for engagement with industry and the professions. The Institute for Sustainable Futures (ISF) is a university research institute based on the Sydney city campus. Its mission is to create change towards sustainable futures by conducting independent project-based research for Australian and international clients. ISF researchers and PhD students come from varied backgrounds, including engineering, architecture, management, economics, science, the social sciences, international studies and political studies.
ISF’s research areas in regard to renewable energies are: • Visualizing future energy infrastructure • Empowering new energy market participants • Transforming through data and information • Renewable energy market research • Energy scenarios for countries, regions, communities, cities and islands
CHINA: Chinese Renewable Energy Industries Association (CREIA); assisted by Mr. Marvin Nala and Mr. Frank Haugwitz.
The Chinese Renewable Energy Industries Association (CREIA) was established in 2000 with the support of the United Nations Development Programme (UNDP), the Global Environment Facility (GEF) and the State Economic and Trade Commission (SETC). CREIA serves as a bridge between regulatory authorities, research institutes, and industry professionals, in order to provide a forum to discuss renewable energy development at the national level and subsequently advise the Government of China on strategic policy formulation. It furthermore promotes the adoption of advanced technologies among renewable energy enterprises in China and actively develops capacity for the rapid industrialisation of the Chinese renewable energy sector.
EUROPE: Institute for Advanced Sustainability Studies (IASS); interviews conducted by Sybille Röhrkasten and Rainer Quitzow.
Founded in 2009, the IASS is an international, interdisciplinary hybrid between a research institute and a think tank, located in Potsdam, Germany. The publicly funded institute promotes research and dialogue between science, politics and society on developing pathways to global sustainability. The IASS focuses on topics such as sustainability governance and economics, new technologies for energy production and resource utilisation, and Earth system challenges like climate change, air pollution, and soil management.
12

INDIA: Council on Energy, Environment and Water (CEEW); interviews conducted by Kanika Chawla and Arunabha Ghosh.
The Council on Energy, Environment and Water (CEEW) is one of South Asia’s
leading policy research institutions. CEEW addresses pressing global challenges through an integrated and internationally focused approach. In 2016, CEEW was ranked the best in South Asia in two categories three years running (Global Go To Think Tank Index); among the top 100 out of 6846 think-tanks in nine categories. In 2016, CEEW was also ranked 2nd in India, 4th outside Europe and North America, and 20th globally out of 240 think tanks as per the ICCG Climate Think Tank’s standardised rankings.
JAPAN: Renewable Energy Institute (REI); interviews conducted by Mika Ohbayashi and Romain Zissler.
The Renewable Energy Institute, REI, which was formerly called Japan Renewable
Energy Institute, JREF, was founded in the aftermath of earthquake and nuclear accident occurred in 2011 in Japan. REI aims to establish renewable energy based society in Japan and Asia, conducting researches and advocate policy makers.
LATIN AMERICA AND CARIBBEAN: Fundación Bariloche; interviews conducted by Gonzalo Bravo and Lucas Furlano
The Bariloche Foundation is a private, non-profit research institution aimed at the
development of basic and applied research activities, training, technical assistance and in the field of Energy Economics and Planning, among others. The development of these activities is focused on in-depth analysis of the problematic of Argentina, Latin America and developing countries, within the context of the international energy situation. Most of these specialized research and findings are disseminated within Latin America, through the several postgraduate courses.
USA: Clean Energy Solutions Centre (CESC); interviews conducted by Terri Walters and Victoria Healey.
The Clean Energy Solutions Centre is an initiative of the Clean Energy Ministerial
(CEM), a global forum to share best practices and promote policies and programs that encourage and facilitate the transition to a global clean energy economy. The Solutions Centre is co-led and co-funded by the U.S. Department of Energy (DOE) through support from the U.S. Department of State, and the Australian Department of Industry, Innovation and Science. The International Copper Association also provides support for Solutions Centre activities such as the Clean Energy Regulators Initiative. Power Africa also provides support for Solutions Centre activities in sub-Saharan Africa such as the Ask an Expert Service.
As the Solutions Centre operating agency, the National Renewable Energy Laboratory (NREL) is responsible for content development, service delivery, website design and maintenance, analysis, and all other products and services provided by the Solutions Centre. NREL also coordinates activities with the many Solutions Centre partners.
ASSESSING THE RESULTS:
The questionnaire involved multiple choice questions as well as open questions where the interviewees formulated answers in their own words.
The overall results were downloaded and analysed with the Survey Monkey online platform, and further analysed with Excel.
All multiple-choice answers were analysed with the Survey Monkey analysis tool on the basis of numeric outcomes. The open answers were clustered and categorised, then analysed by a team from ISF and REN21 under the leadership of Dr. Sven Teske.
13

12. 11. 10. 9. 8. 7. 6. 5. 4. 3. 2. 1.
G L O B A L F U T U R E S R E P O R T 2 017
IV. GREAT DEBATES: OVERVIEWThe call for a 100% renewable energy future is gaining widespread support. It is a clear and simple concept, which expresses perfectly the ambition signaled by countries in signing of the 2015 landmark Paris Agreement. Holding global average temperature rise well below 2°C, not to mention a much safer limit of 1.5°C, requires nothing short of the complete decarbonisation of the energy sector. But the world is a complex place; what works in one country doesn’t necessarily work in another. Finding solutions for some sectors is easier than for others. The stakes are high – financially, environmentally and socially – and as the transition progresses, there will be clear winners and losers.
This report follows on the tradition of the first Renewables Global Futures Report (GFR) authored by Dr. Eric Martinot, published in 2013. REN21 has canvassed a wide range of experts and stakeholders from around the world asking them about their views on the feasibility of achieving a 100% renewable energy future, and to explore what the related macro-economic impacts might be.
The GFR is not an advocacy report. The very fact that experts were included whose views run contrary to the 100% vision makes that clear from the outset. Rather, its aim is to present the complex and nuanced opinions and discussions of energy experts from all over the world. How feasible is the goal of reaching a 100% renewable energy future, and what is the likelihood of doing so by mid-century? What are the challenges that will need to be overcome to get us there? And who will bear the costs – either of action or inaction? This report, like its 2013 predecessor, represents a “mosaic” of insight into these questions – it does not present just one vision for the future.
By presenting the full spectrum of views, some might be tempted to conclude that getting to 100% renewables by mid-century is a pipe dream – but if we’ve learned one thing about renewable energy deployment over the last decades, it’s that with sufficient political will – to adopt good policies and create financial incentives – most obstacles can be overcome. This report therefore should not be seen as an attempt to predict the future, but to better understand and discuss the opportunities and challenges.
These are exciting times. Renewable energy technologies are coming of age, and are increasingly cost-competitive with conventional fuels. And given their vast global potential, they will become increasingly dominant in the years to come. They are no longer the “alternative” energy sources of the 1970s; they are the mainstream technologies of the 21st century.
Nonetheless, uncertainties about the pathway towards this future remain. The following section contains the most pressing subjects that need to be addressed in order to enable high-shares of renewables on a global level. These subjects are hotly contested by the energy experts interviewed for this report, coming as they do from different regions, from countries at different stages of development, and from different sectors within the energy field. We refer to such conversations here as the “great debates.”
Although more than two-thirds of the experts interviewed considered a 100% renewable energy future by mid-century to be realistic and feasible, not everybody was convinced. Meanwhile the carbon dioxide concentration in the global atmosphere passed the 400ppm threshold – maybe permanently. The journal SCIENTIFIC AMERICAN reported on 26 September 2016 that “(…) the carbon dioxide we’ve already committed to the atmosphere has warmed the world about 1.8°F since the start of the industrial revolution. This year, in addition to marking the start of our new 400-ppm world, is also set to be the hottest year on record. The planet has edged right up against the 1.5°C (2.7°F) warming threshold, a key metric in last year’s Paris climate agreement.” In order to fulfil the terms of the Paris Agreement and avoid the most catastrophic climate impact scenarios, the energy sector must be decarbonised. A broad global discussion is urgently needed to explore how this can be achieved, and how fast this transition could be accomplished. Unfortunately, discussions amongst climate experts on the one hand, and energy experts on the other, generally take place within their respective silos. We need to break down these separations to make the urgency of the energy transition clear, and to show that realistic solutions are available.
100% Renewables: A logical consequence of the Paris Agreement?1.
Assumptions relating to energy demand are important for planning future energy supply. Developing countries all too often repeat the mistakes of industrialised countries – predicting unnecessarily high energy growth, and when this fails to materialise are saddled with overcapacity and stranded investments. This is because they fail to account for the tremendous opportunities afforded by increasing energy efficiency. Countries as diverse as China and Denmark have shown that decoupling GDP and energy growth is possible. We need a global discussion about how to improve energy efficiency in a systematic way. At the same time, developed countries need to get better at providing expertise and financial support to those without access to energy services without repeating the mistakes of the past, helping them leapfrog to a modern and efficient energy supply.
Global Energy Demand Development: Efficiency on a global level? 2.
The power sector is winning the race to a renewable energy future. Wind power is now among the cheapest new power plant technologies, and solar photovoltaic (PV) systems have achieved grid parity in many countries. Their stellar performance over the past decade has significantly changed the way utilities operate. But achieving 100% renewable energy systems will require a mix of many different technologies to cover the full range of needs, and technologies such as biomass, geothermal and hydro have largely been overshadowed by rapid growth of wind and solar. A debate amongst the multiple sectors and stakeholders of the power market about how to stimulate the growth of all renewable power generation technologies is therefore required to determine the best applications to achieve resilient power systems.
Renewable Power Generation: The winner takes all? 3.
Energy for heating currently represents over 40% of total final energy demand – a greater share than the entire power sector. But heating does not feature as high on the agenda in energy debates. Policies for the heating sector – with regard both to demand and supply – are required. Industrial process heat is universally needed, unlike heating of homes and offices, which are highly dependent on climate conditions. Heating and cooling technologies can help integrate more variable solar and wind power in a number of different ways. Thermal as well as electrical heating technologies can also be used for demand side management and storage, and therefore could play a central role in facilitating high penetration of renewable energy systems. Different technology options require different infrastructures: district heating systems, power or gas/ hydrogen distribution grids. Urgent debate is needed to determine the best options, given the long-term lead-time for installing the necessary infrastructure.
The Future of Heating: Thermal or electrical application?4.
G L O B A L F U T U R E S R E P O R T 2 017
14
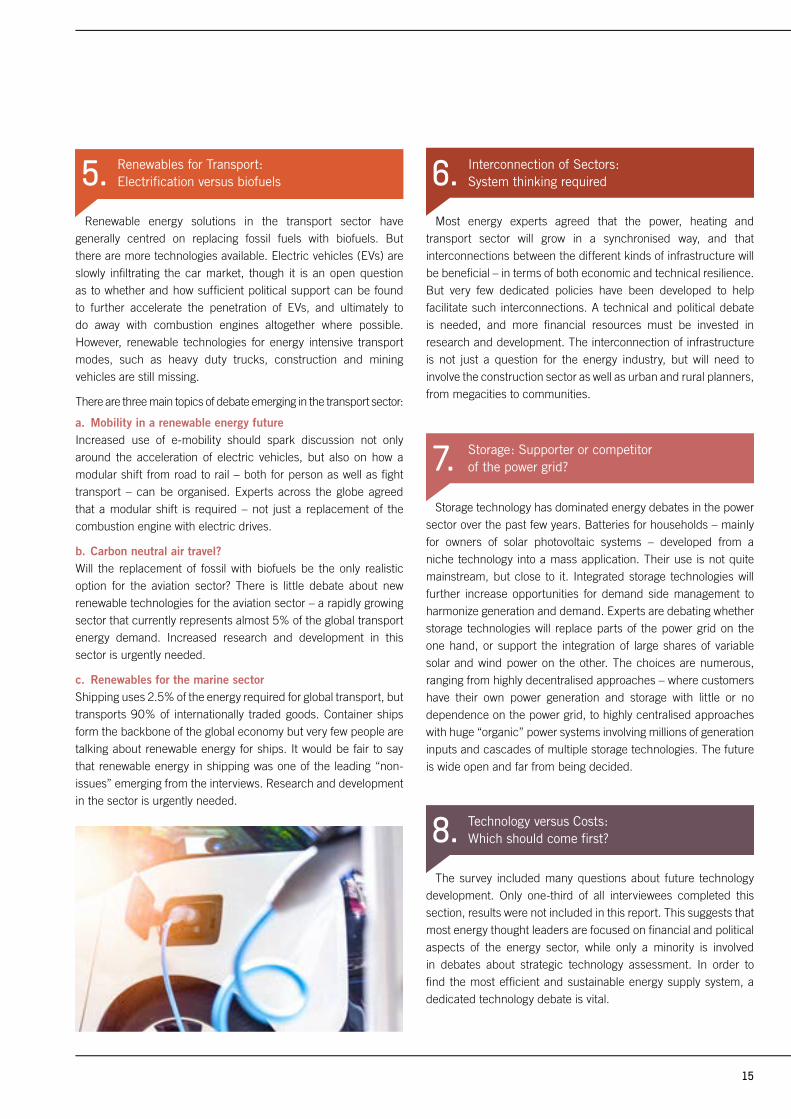
Renewable energy solutions in the transport sector have generally centred on replacing fossil fuels with biofuels. But there are more technologies available. Electric vehicles (EVs) are slowly infiltrating the car market, though it is an open question as to whether and how sufficient political support can be found to further accelerate the penetration of EVs, and ultimately to do away with combustion engines altogether where possible. However, renewable technologies for energy intensive transport modes, such as heavy duty trucks, construction and mining vehicles are still missing.
There are three main topics of debate emerging in the transport sector:
a. Mobility in a renewable energy futureIncreased use of e-mobility should spark discussion not only around the acceleration of electric vehicles, but also on how a modular shift from road to rail – both for person as well as fight transport – can be organised. Experts across the globe agreed that a modular shift is required – not just a replacement of the combustion engine with electric drives.
b. Carbon neutral air travel?Will the replacement of fossil with biofuels be the only realistic option for the aviation sector? There is little debate about new renewable technologies for the aviation sector – a rapidly growing sector that currently represents almost 5% of the global transport energy demand. Increased research and development in this sector is urgently needed.
c. Renewables for the marine sectorShipping uses 2.5% of the energy required for global transport, but transports 90% of internationally traded goods. Container ships form the backbone of the global economy but very few people are talking about renewable energy for ships. It would be fair to say that renewable energy in shipping was one of the leading “non-issues” emerging from the interviews. Research and development in the sector is urgently needed.
Renewables for Transport: Electrification versus biofuels5.
Most energy experts agreed that the power, heating and transport sector will grow in a synchronised way, and that interconnections between the different kinds of infrastructure will be beneficial – in terms of both economic and technical resilience. But very few dedicated policies have been developed to help facilitate such interconnections. A technical and political debate is needed, and more financial resources must be invested in research and development. The interconnection of infrastructure is not just a question for the energy industry, but will need to involve the construction sector as well as urban and rural planners, from megacities to communities.
Interconnection of Sectors: System thinking required6.
Storage technology has dominated energy debates in the power sector over the past few years. Batteries for households – mainly for owners of solar photovoltaic systems – developed from a niche technology into a mass application. Their use is not quite mainstream, but close to it. Integrated storage technologies will further increase opportunities for demand side management to harmonize generation and demand. Experts are debating whether storage technologies will replace parts of the power grid on the one hand, or support the integration of large shares of variable solar and wind power on the other. The choices are numerous, ranging from highly decentralised approaches – where customers have their own power generation and storage with little or no dependence on the power grid, to highly centralised approaches with huge “organic” power systems involving millions of generation inputs and cascades of multiple storage technologies. The future is wide open and far from being decided.
Storage: Supporter or competitor of the power grid? 7.
The survey included many questions about future technology development. Only one-third of all interviewees completed this section, results were not included in this report. This suggests that most energy thought leaders are focused on financial and political aspects of the energy sector, while only a minority is involved in debates about strategic technology assessment. In order to find the most efficient and sustainable energy supply system, a dedicated technology debate is vital.
Technology versus Costs: Which should come first? 8.
15

G R E A T D E B A T E S : O V E R V I E W
Which technology offers the most benefits for a specific application? And if this technology is currently expensive, how do we bring down costs? Take solar photovoltaics for example: 30 years ago it was by far the most expensive power generation technology, but early on it had been identified as having one of the highest technical potentials. As a result, specific support projects were initiated focusing on technology advancement and expansion of market volumes, which led to the expansion of production capacities. Costs decreased by an order of magnitude, and solar photovoltaics are now amongst the cheapest options for power generation.
Scaling-up Investments and Work Force: 100% renewables for socio-economic change9.
Renewables are now the least expensive option for new power generation in almost all countries. Significant barriers for further market expansion are therefore not related to cost but to the limitations of existing infrastructure. And as the growth of renewables leads to the displacement of existing fossil-fired power plants, there is a risk that investments will be stranded. Apart from the economic impact, this will have a dramatic social impact on the people who work in the sector, from miners to refiners and everyone in between. Avoiding these risks has been used as an argument against the expansion of renewables. However, we should not be making a choice between stranding investments, workers or the climate; the debate should focus on how all three of these can be addressed with the least amount of disruption.
Perhaps most importantly, there is a need for discussion about the design of a possible global social plan for the contested fossil fuel industry so that the transition process benefits rather than harms the workforce.
Utilities of the Future: What will they look like? 10.
What will a utility of the future look like? It is clear that future utilities will have little in common with today’s utilities, and that business models will need to change. But how will a future energy market be designed? What are the necessary policy schemes to create a sustainable and long term framework that provides the necessary policy certainty, which in turn creates a stable climate for investment in energy efficiency and renewables? This, together with the future of storage technologies, may be the “Holy Grail” of the energy industry.
Mega Cities: Mega possibilities11. One in every two people worldwide currently lives in an urbanised area. Particularly in emerging economies and developing countries, megacities are growing at a phenomenal speed. Thus, successful city-based projects are key for increased acceptance among the general public. There is a lack of imagination when it comes to envisioning large urban areas running on 100% renewable energy, and consequently whether attaining such a future is feasible in practice. Further awareness is needed about the possibilities of a global energy transition with renewables and energy efficiency at the heart. It will be important to share the personal stories and experiences of communities and cities that are making this transition, to help build confidence amongst institutional investors that investments can and should be scaled-up. Both city- and community energy systems have played increasingly important roles in the renewable energy debate in recent years, as local governments are closer to the public than federal governments in most cases.
Energy Access Enabled Through Renewables: How to speed up connections? 12.
Renewables contribute significantly to making energy services increasingly available to people who currently lack access. How this process can be accelerated and expanded, and how renewables can fuel economic development, should be the subject of further debate. The question is particularly pertinent for rapidly growing economies such as China and India – how can energy gaps be filled during periods of rapid economic growth while avoiding expanded use of fossil fuels?
16
G L O B A L F U T U R E S R E P O R T 2 017
V. REGIONAL HIGHLIGHTS
Despite the remarkable growth of the renewable energy industry, there are still barriers to further market development on the pathway to a 100% global renewable energy supply by 2050. Moreover, the likelihood of achieving 100% renewables in any given region depends on a number of factors including but not limited to overcoming political, technical and socio-economic barriers.
Energy experts interviewed for this report were asked:
3 What is the likelihood that there will be 100% renewable energy initiatives by 2050? Are they achievable and cost-effective? If not, why not?
3 What are the main barriers for achieving a 100% renewable energy supply by 2050?
3 What do you think are the main POLITICAL BARRIERS for achieving a 100% renewable energy supply by 2050?
3 What are the main TECHNICAL BARRIERS for realising a 100% renewable energy supply by 2050?
3 What would you consider will be the main SOCIO-ECONOMIC BARRIERS for achieving a 100% renewable energy supply by 2050?
Their answers to these questions are portrayed by region.
AFRICA: THE ENERGY ACCESS DEBATE OVERSHADOWS THE 100% RENEWABLE ENERGY DEBATE
Poverty creates a unique situation for scaling-up renewables not only in Africa, but in all developing countries: this was stressed by experts from India, Africa, Latin America and Asia. Very specific policy measures are required to help overcome the challenges in solving a range of problems simultaneously. Good local knowledge – not only from the technical, but also from the socio-economic and cultural points of view – is required. “One-size-fits-all” policies do not work. Achieving high shares of renewables require infrastructural changes, which poses challenges even for industrialised countries. For developing countries, with antiquated or non-existent energy infrastructure in place, these changes are challenging but on the other hand also provide ample opportunities to leapfrog.
African experts highlighted the huge role governments play in the energy market, specifically in how the business models of utilities are structured. Thus, against all logic,
reaching high shares of renewables will not necessarily
follow on from the economic breakthroughs of renewable
energy technologies. Furthermore, the pressing demand
to increase access to energy in many African countries
overshadows debates about achieving fully renewable
energy systems. One expert wrote that there is an “urgent
demand for energy” and the “immediate availability of
fossil fuels makes renewables a second choice.”
Moreover, there is no unified energy market or “African energy
policy;” the situation varies between countries, and in fact
national/regional markets are very fragmented. The availability
of fossil fuels such as oil and gas (and their perceived economic
advantages) combined with very low awareness about climate
change impacts, suppress renewable energy deployment.
As a result, the majority of African experts thought the goal of
100% renewables was currently too ambitious and unlikely to
be achieved by 2050.
African energy experts identified inconsistent and
uncoordinated energy policies as a serious political
barrier. In addition, the lack of knowledge and information,
resulting in unsuitable policies which fail to support
renewable energy and energy efficiency, was seen as one
of the biggest hurdles.
This lack of knowledge extends to technical questions
as well. As in many regions around the world, the main
18
challenge for achieving large variable renewable energy shares stems from the lack of know-how regarding grid integration and storage. This is especially true for the least developed countries, where experts identified the deficit of know-how specifically for the operation and maintenance of renewable energy technologies as a barrier.
Most of the renewable energy equipment used in Africa is currently imported from industrialised countries. Therefore, renewable energy investments by African communities often go offshore and thus fail to provide positive local economic benefits. There is a strong consensus amongst African energy experts that this needs to change, and that there needs to be a strong focus on local value creation.
Additional priorities for the African region includes better access to improved end-use devices such as cook stoves and associated fuels for cooking and heating at the basic level, and basic lighting systems.
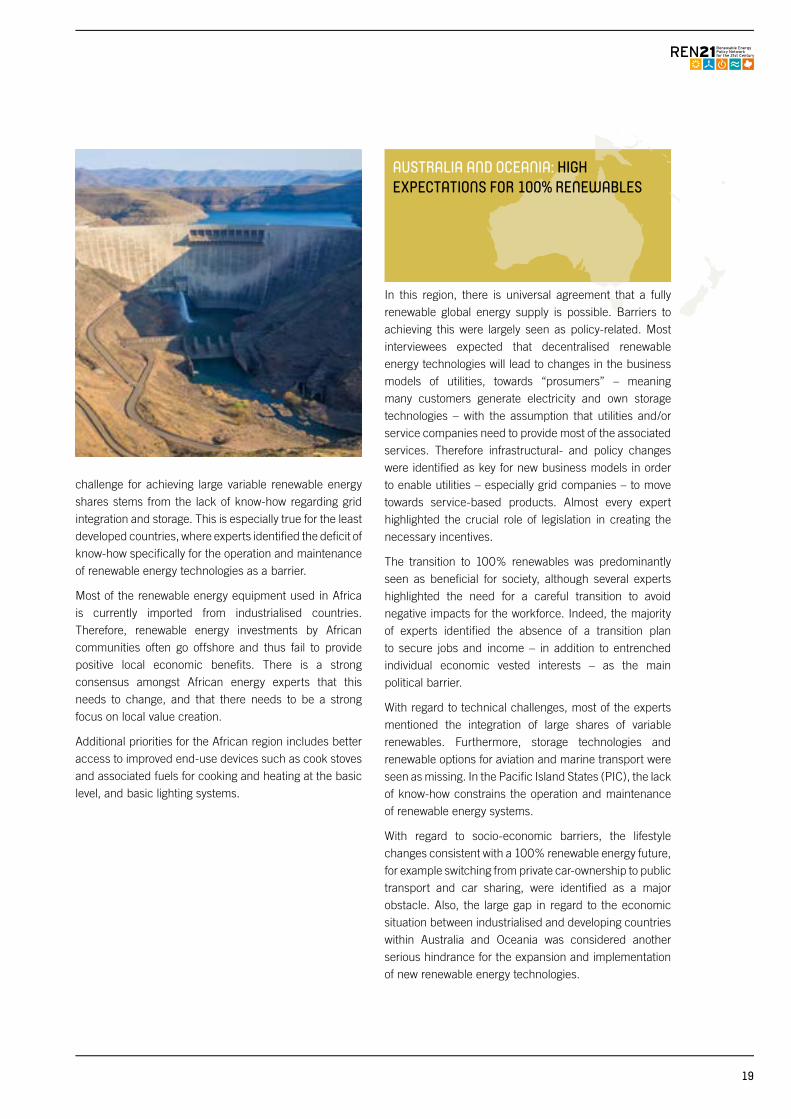
AUSTRALIA AND OCEANIA: HIGH EXPECTATIONS FOR 100% RENEWABLES
In this region, there is universal agreement that a fully renewable global energy supply is possible. Barriers to achieving this were largely seen as policy-related. Most interviewees expected that decentralised renewable energy technologies will lead to changes in the business models of utilities, towards “prosumers” – meaning many customers generate electricity and own storage technologies – with the assumption that utilities and/or service companies need to provide most of the associated services. Therefore infrastructural- and policy changes were identified as key for new business models in order to enable utilities – especially grid companies – to move towards service-based products. Almost every expert highlighted the crucial role of legislation in creating the necessary incentives.
The transition to 100% renewables was predominantly seen as beneficial for society, although several experts highlighted the need for a careful transition to avoid negative impacts for the workforce. Indeed, the majority of experts identified the absence of a transition plan to secure jobs and income – in addition to entrenched individual economic vested interests – as the main political barrier.
With regard to technical challenges, most of the experts mentioned the integration of large shares of variable renewables. Furthermore, storage technologies and renewable options for aviation and marine transport were seen as missing. In the Pacific Island States (PIC), the lack of know-how constrains the operation and maintenance of renewable energy systems.
With regard to socio-economic barriers, the lifestyle changes consistent with a 100% renewable energy future, for example switching from private car-ownership to public transport and car sharing, were identified as a major obstacle. Also, the large gap in regard to the economic situation between industrialised and developing countries within Australia and Oceania was considered another serious hindrance for the expansion and implementation of new renewable energy technologies.
19
G L O B A L F U T U R E S R E P O R T 2 017
CHINA: 100% RENEWABLES FOR CHINA’S REGIONS IS A REAL POSSIBILITY, BUT CONSIDERED OVERLY AMBITIOUS GLOBALLY
While Chinese experts had reservations about the possibility of a global 100% renewable energy supply (for reasons of cost and finance), several experts agreed that it would be technically and economically feasible at the regional or local level. Many saw as major technical obstacles the variability of wind and solar and the shortage of technology alternatives for the transport and industry sectors.
Around half of the Chinese experts said they expected development towards prosumer trends, even though the definition of the term “prosumer” differed between experts. Some defined it as power generation with decentralised applications located near the consumer, while others included consumers who buy green power as well. In any case, China’s energy market system is unique and responses by all the experts assumed that a policy change from the current central planning system towards a more open market mechanism might take place. At that stage, utilities would need to become energy service providers.
Chinese experts identified technological barriers related to power grid integration and infrastructural changes, followed by political barriers, as the main challenges to achieving greater shares of renewable energy. Higher costs and the vested interests of existing energy companies were mentioned as well, but to a lesser extent.
The absence of a long-term and consistent renewable energy policy framework for the whole of China was identified as the main political barrier. The lack of public acceptance of large scale renewable projects and a deficit of information for the general public were seen as pressing socio-economic challenges for China.
Chinese interviewees revealed a very strong reliance on established economic development initiatives, considered 2050 to be very far away and eluded to the immediate need of securing energy supply for the country. Furthermore, most of those interviewed emphasised the same “hot-topics” seen elsewhere: specifically, how to integrate high shares of wind and solar into the grid. Other technologies received significantly less attention (as was the case in all other regions for that matter).
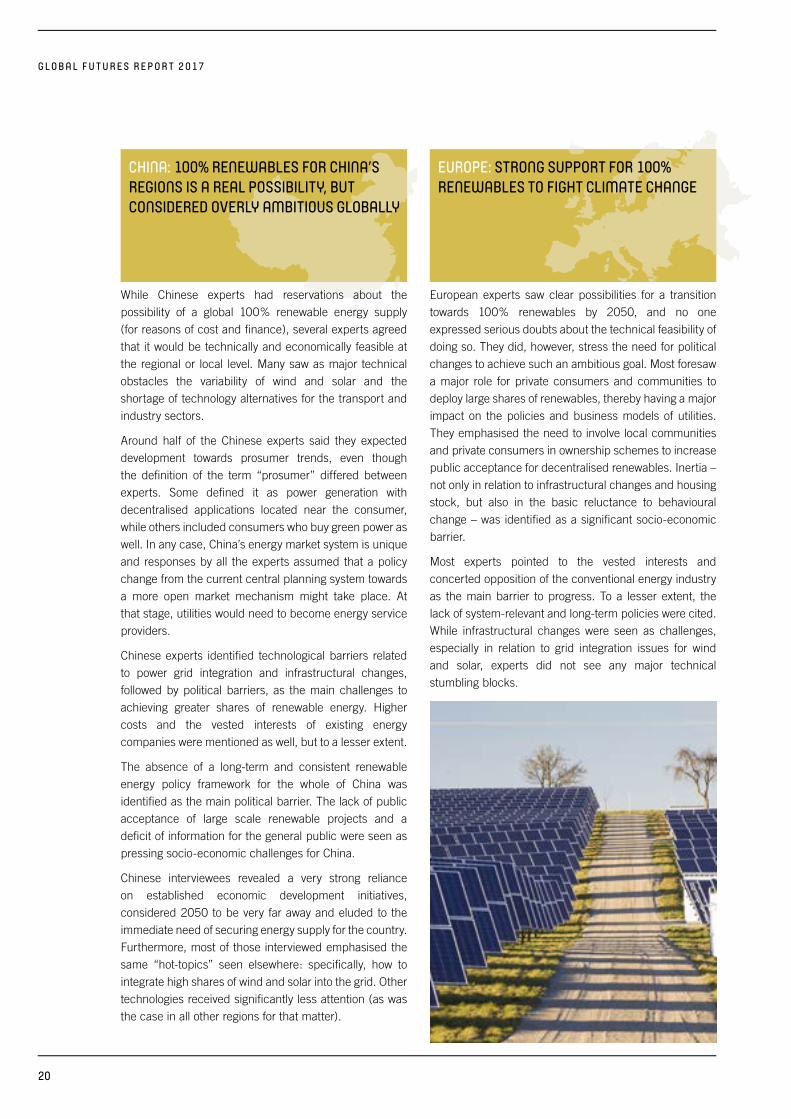
EUROPE: STRONG SUPPORT FOR 100% RENEWABLES TO FIGHT CLIMATE CHANGE
European experts saw clear possibilities for a transition towards 100% renewables by 2050, and no one expressed serious doubts about the technical feasibility of doing so. They did, however, stress the need for political changes to achieve such an ambitious goal. Most foresaw a major role for private consumers and communities to deploy large shares of renewables, thereby having a major impact on the policies and business models of utilities. They emphasised the need to involve local communities and private consumers in ownership schemes to increase public acceptance for decentralised renewables. Inertia – not only in relation to infrastructural changes and housing stock, but also in the basic reluctance to behavioural change – was identified as a significant socio-economic barrier.
Most experts pointed to the vested interests and concerted opposition of the conventional energy industry as the main barrier to progress. To a lesser extent, the lack of system-relevant and long-term policies were cited. While infrastructural changes were seen as challenges, especially in relation to grid integration issues for wind and solar, experts did not see any major technical stumbling blocks.
20
INDIA: DEBATE ON 100% STILL-ONGOING
Half of the Indian experts interviewed suggested that achieving 100% renewables by 2050 is likely, while the other half either disagreed or was undecided.
There was no common opinion among the interviewees about the most challenging political obstacles, which most likely reflects the huge variety of energy policies in India’s 27 states. However, the overarching consensus was that there was a lack of consistent and long-term policies and technical know-how with regard to deployment. They identified a clear need for special assistance from developed countries, especially in relation to grid integration of wind and solar electricity, and operation and maintenance of renewable power generation.
There was general agreement that utilities need to evolve into service companies, but the experts noted that there is no sense of urgency to do this, and no real change is expected within the next decade – or even longer. This could be a reflection of the large role the government currently plays in energy markets. Experts discussed the impact of energy consumption subsidies and whether it might not be better to shift those subsidies towards renewable energy production instead.
As in other regions, the majority of the experts identified technological challenges to integrating large shares of wind and solar power into the grid. Furthermore, access to finance for renewable energy projects and project development were seen as major hurdles.
While opinions about the most significant socio-economic barriers were highly diverse, the gap between rich and poor was considered the most challenging to overcome. Specifically, issues around the affordability of renewables – or energy per se – and related deficits in education and know-how were identified.
Most respondents saw a growing share for renewable energy in the energy mix, but did not consider a 100% renewable energy system to be a feasible scenario for India by 2050. One of the main explanations for their scepticism was that renewables are still believed to be more expensive than conventional energy sources, despite the fact that actual market prices for new build power plants contradicts this perception. Setting up transparent information systems about the actual current costs of renewables could help overcome this perception.
LATIN AMERICA AND THE CARIBBEAN: THE DEBATE ABOUT 100% RENEWABLES HAS NOT YET STARTED
The experts interviewed said the (renewable) energy debate in Latin America was focused on economic arguments, while climate and environmental criteria to drive the expansion of renewables were not considered as important as in Europe for example. They identified the main obstacles to achieving a fully renewable energy supply as cost competitiveness and financing issues, followed by a lack of political and institutional support. A lack of knowledge and awareness, especially among policy makers, was mentioned as well.
Diverse and often-conflicting energy policies were considered by Latin American experts to be the main political hurdles. The problem of vested interests within the energy industry, and their influence on policymakers, was seen as an additional and serious barrier, although not as problematic as in the USA.
Given that the debate about 100% renewables in this region is at an early stage, the discussion about possible technical challenges is likewise just beginning. Grid integration issues around variable renewables were mentioned by some experts. As in most developing countries, costs of renewable energy technologies and their affordability for poorer countries, which in turn often leads to public acceptance problems, were identified as major socio-economic barriers.
While there was a degree of scepticism towards the 100% renewable energy vision expressed by Latin American experts, renewables were nonetheless seen as the most promising technologies for future energy supply. All interviewees thought that the renewable energy share would at least double in the next three decades from 28% at present, and more than half estimated that the share would further increase by between 60 and 80% by 2050. An overwhelming majority saw the renewable industry as flourishing, with investment volumes set to double or triple.
R E G I O N A L H I G H L I G H T S
21
G L O B A L F U T U R E S R E P O R T 2 017
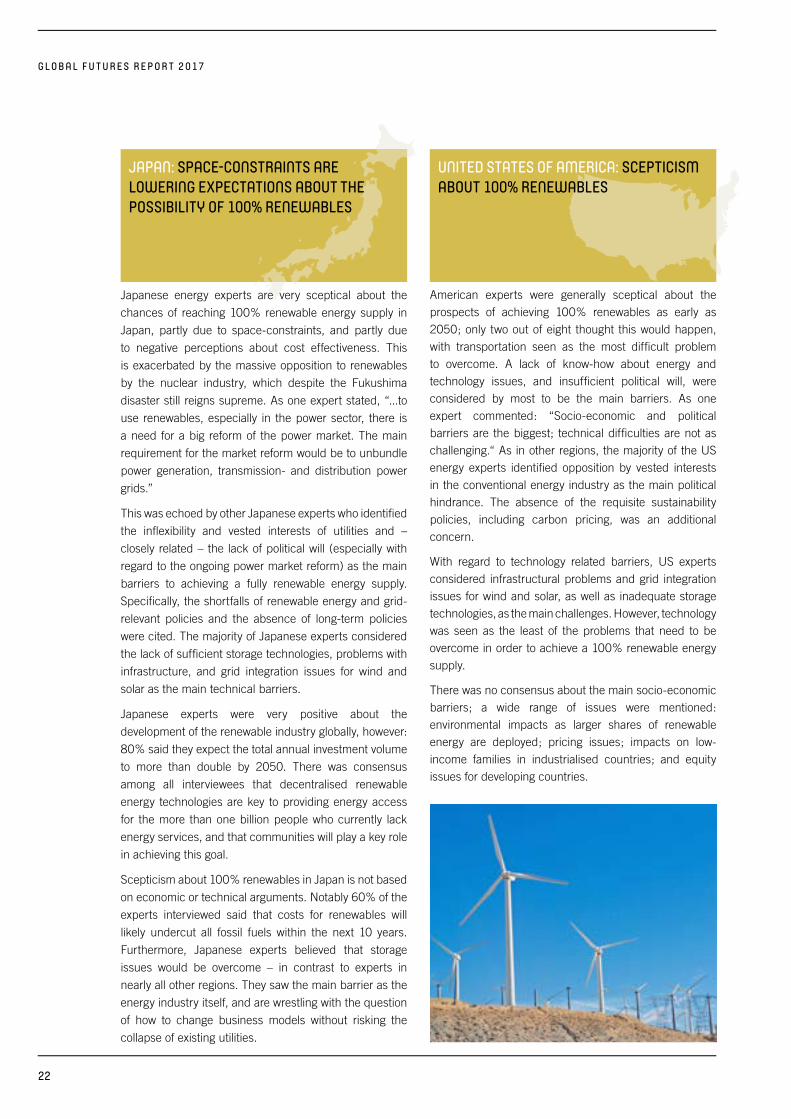
JAPAN: SPACE-CONSTRAINTS ARE LOWERING EXPECTATIONS ABOUT THE POSSIBILITY OF 100% RENEWABLES
Japanese energy experts are very sceptical about the
chances of reaching 100% renewable energy supply in
Japan, partly due to space-constraints, and partly due
to negative perceptions about cost effectiveness. This
is exacerbated by the massive opposition to renewables
by the nuclear industry, which despite the Fukushima
disaster still reigns supreme. As one expert stated, “...to
use renewables, especially in the power sector, there is
a need for a big reform of the power market. The main
requirement for the market reform would be to unbundle
power generation, transmission- and distribution power
grids.”
This was echoed by other Japanese experts who identified
the inflexibility and vested interests of utilities and –
closely related – the lack of political will (especially with
regard to the ongoing power market reform) as the main
barriers to achieving a fully renewable energy supply.
Specifically, the shortfalls of renewable energy and grid-
relevant policies and the absence of long-term policies
were cited. The majority of Japanese experts considered
the lack of sufficient storage technologies, problems with
infrastructure, and grid integration issues for wind and
solar as the main technical barriers.
Japanese experts were very positive about the
development of the renewable industry globally, however:
80% said they expect the total annual investment volume
to more than double by 2050. There was consensus
among all interviewees that decentralised renewable
energy technologies are key to providing energy access
for the more than one billion people who currently lack
energy services, and that communities will play a key role
in achieving this goal.
Scepticism about 100% renewables in Japan is not based
on economic or technical arguments. Notably 60% of the
experts interviewed said that costs for renewables will
likely undercut all fossil fuels within the next 10 years.
Furthermore, Japanese experts believed that storage
issues would be overcome – in contrast to experts in
nearly all other regions. They saw the main barrier as the
energy industry itself, and are wrestling with the question
of how to change business models without risking the
collapse of existing utilities.
UNITED STATES OF AMERICA: SCEPTICISM ABOUT 100% RENEWABLES
American experts were generally sceptical about the prospects of achieving 100% renewables as early as 2050; only two out of eight thought this would happen, with transportation seen as the most difficult problem to overcome. A lack of know-how about energy and technology issues, and insufficient political will, were considered by most to be the main barriers. As one expert commented: “Socio-economic and political barriers are the biggest; technical difficulties are not as challenging.“ As in other regions, the majority of the US energy experts identified opposition by vested interests in the conventional energy industry as the main political hindrance. The absence of the requisite sustainability policies, including carbon pricing, was an additional concern.
With regard to technology related barriers, US experts considered infrastructural problems and grid integration issues for wind and solar, as well as inadequate storage technologies, as the main challenges. However, technology was seen as the least of the problems that need to be overcome in order to achieve a 100% renewable energy supply.
There was no consensus about the main socio-economic barriers; a wide range of issues were mentioned: environmental impacts as larger shares of renewable energy are deployed; pricing issues; impacts on low-income families in industrialised countries; and equity issues for developing countries.
22
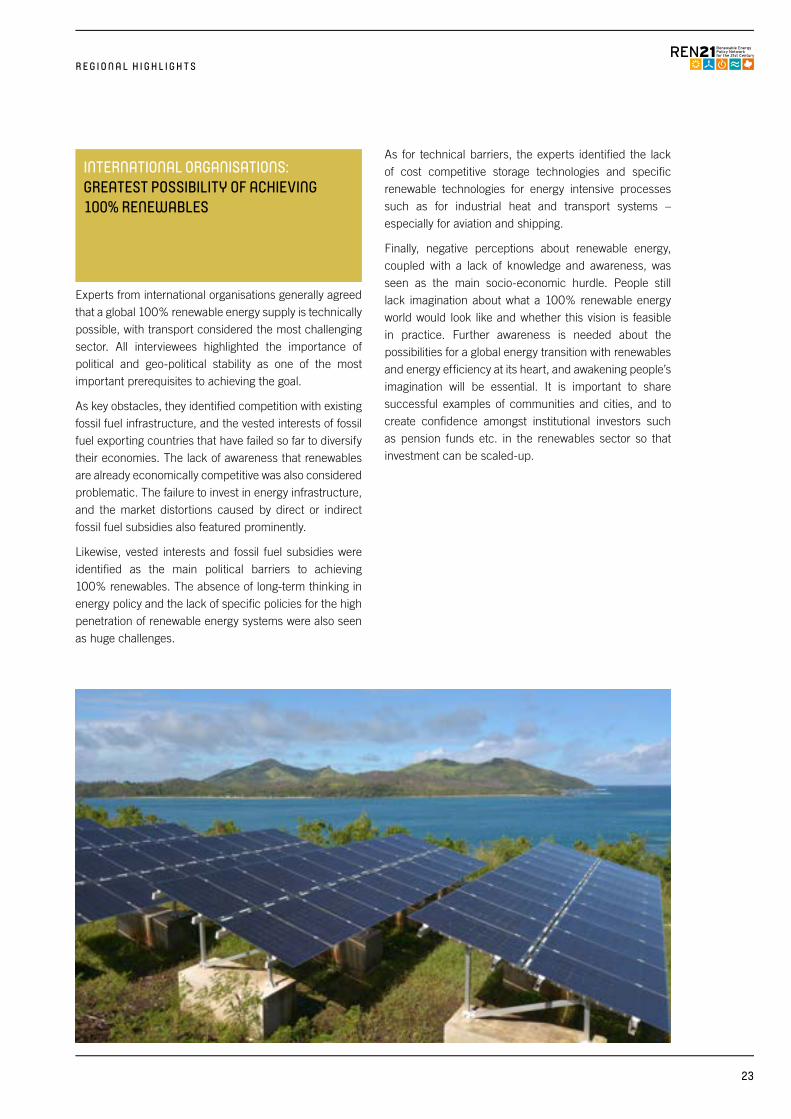
INTERNATIONAL ORGANISATIONS: GREATEST POSSIBILITY OF ACHIEVING 100% RENEWABLES
Experts from international organisations generally agreed that a global 100% renewable energy supply is technically possible, with transport considered the most challenging sector. All interviewees highlighted the importance of political and geo-political stability as one of the most important prerequisites to achieving the goal.
As key obstacles, they identified competition with existing fossil fuel infrastructure, and the vested interests of fossil fuel exporting countries that have failed so far to diversify their economies. The lack of awareness that renewables are already economically competitive was also considered problematic. The failure to invest in energy infrastructure, and the market distortions caused by direct or indirect fossil fuel subsidies also featured prominently.
Likewise, vested interests and fossil fuel subsidies were identified as the main political barriers to achieving 100% renewables. The absence of long-term thinking in energy policy and the lack of specific policies for the high penetration of renewable energy systems were also seen as huge challenges.
As for technical barriers, the experts identified the lack of cost competitive storage technologies and specific renewable technologies for energy intensive processes such as for industrial heat and transport systems – especially for aviation and shipping.
Finally, negative perceptions about renewable energy, coupled with a lack of knowledge and awareness, was seen as the main socio-economic hurdle. People still lack imagination about what a 100% renewable energy world would look like and whether this vision is feasible in practice. Further awareness is needed about the possibilities for a global energy transition with renewables and energy efficiency at its heart, and awakening people’s imagination will be essential. It is important to share successful examples of communities and cities, and to create confidence amongst institutional investors such as pension funds etc. in the renewables sector so that investment can be scaled-up.
R E G I O N A L H I G H L I G H T S
23
1 Source: International Energy Agency, Paris/France, Data compilation: Dr. Sven Teske, UTS/ISF, Australia REN21. 2016. Renewables 2016 Global Status Report (Paris: REN21 Secretariat).
1. 100% RENEWABLES: A LOGICAL CONSEQUENCE OF THE PARIS AGREEMENT?
n INTRODUCTIONThe journal SCIENTIFIC AMERICAN reported on 26 September 2016 that “(…) the carbon dioxide we’ve already committed to the atmosphere has warmed the world about 1.8°F since the start of the industrial revolution. This year, in addition to marking the start of our new 400-ppm world, is also set to be the hottest year on record. The planet has edged right up against the 1.5°C (2.7°F) warming threshold, a key metric in last year’s Paris climate agreement.” In order to achieve those drastic emission reductions, a rapid and complete decarbonisation of the energy sector is required. Thus 100% renewables energy concepts are discussed among climate scientists and energy experts.
n SNAPSHOT 2013The Global Futures Report 2013 (GFR 2013) provided an overview of the leading energy scenarios – and their renewable energy trajectories – that had been published during the late 1990s and early 2000s. At that time, renewable energy had begun to grow more rapidly than many had predicted, and new scenarios emerged that showed much higher shares of renewables over the long-term. Notable among these was a “Sustained Growth” scenario by Shell, one of the world’s largest oil companies that included a 50% share of global energy from renewables by 2050; considering the source, this was a figure that shocked many at the time. The International Energy Agency – an organisation that was largely known for promoting fossil fuel interests – had also released a surprising report: Energy to 2050: Scenarios for a Sustainable Future. It outlined a “Sustainable Development” scenario which included a 30% share of renewables. By the mid-2000s, an increasing number of scenarios were showing 30–50% shares.
n WHERE WE ARE TODAY: GLOBAL ENERGY DEMAND AND SUPPLY
The projected shares of renewable energy in such scenarios have only continued to grow, with shares of 80–100% becoming increasingly common. This optimism is being driven partly by rapidly declining investment costs, especially for wind and solar power generation technologies. Another factor is the urgency demanded by climate change, and the global consensus that deeper and faster emission cuts are required.
As of 2014, the latest figures currently available, renewable energy provided an estimated 19.2% of global final energy consumption. Of this total share, traditional biomass, used primarily for cooking and heating in remote and rural areas of developing countries accounted for about 8.9%. Modern renewables (i.e. not including traditional biomass) increased its share slightly over 2013 to approximately 10.3%. In 2014, hydropower accounted for an estimated 3.9% of final energy consumption; other renewable power sources comprised 1.4%. Renewable heat energy accounted for approximately 4.2% and transport biofuels provided about 0.8%.1
Although the use of renewable energy is rising rapidly, the share of renewables in total final energy consumption is not growing as quickly. This is because all sources – fossil and renewable – grew in accordance with demand, leaving overall percentage shares largely unchanged.
This is illustrated in Figure 1, which shows primary energy development since 2003. In developed countries, energy demand growth is slow. Displacing the large stock of existing infrastructure and fuels takes time. In developing countries on the other hand, energy demand continues to grow rapidly and fossil fuels continue – to for other reasons – play a significant part in supplying it. In addition, the shift away from traditional biomass for heating and
G R E A T D E B A T E S : I N F O C U S
24
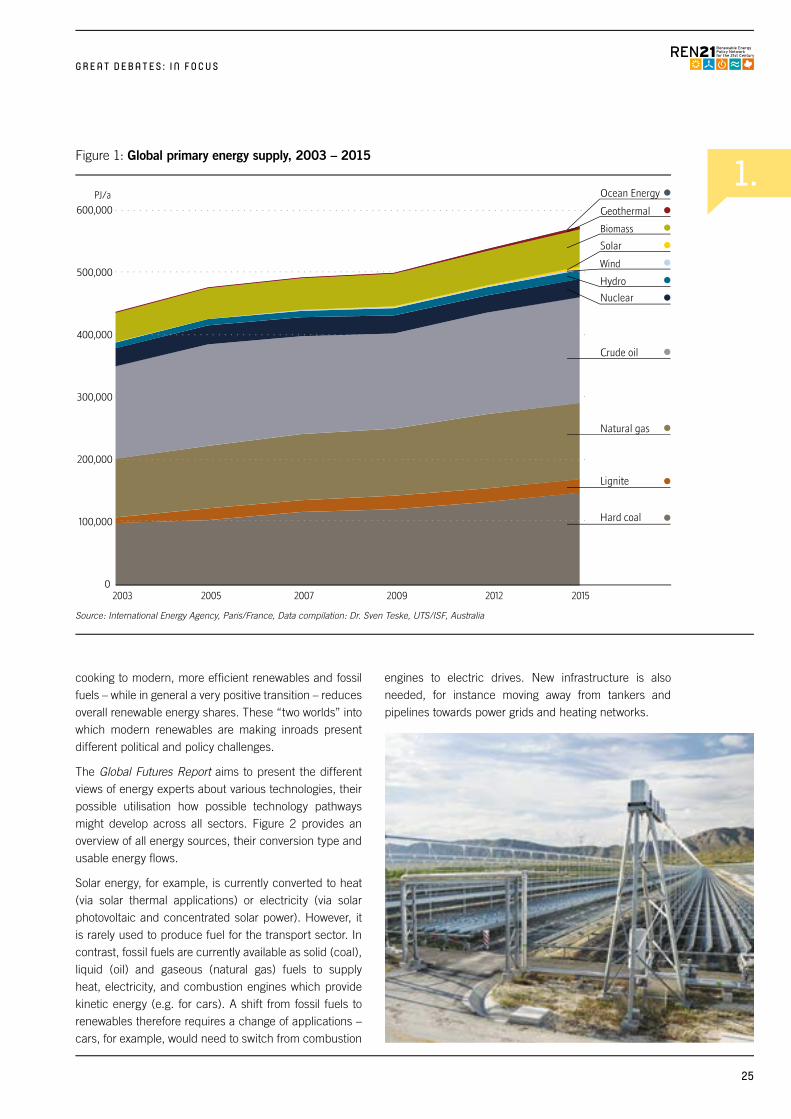
1. 600,000
500,000
400,000
300,000
200,000
100,000
0 2003 2005 2007
PJ/a
2009 2012 2015
Ocean Energy
Geothermal
Biomass
Solar
Wind
Hydro
Nuclear
Crude oil
Natural gas
Lignite
Hard coal
Figure 1: Global primary energy supply, 2003 – 2015
Source: International Energy Agency, Paris/France, Data compilation: Dr. Sven Teske, UTS/ISF, Australia
G R E A T D E B A T E S : I N F O C U S
cooking to modern, more efficient renewables and fossil fuels – while in general a very positive transition – reduces overall renewable energy shares. These “two worlds” into which modern renewables are making inroads present different political and policy challenges.
The Global Futures Report aims to present the different views of energy experts about various technologies, their possible utilisation how possible technology pathways might develop across all sectors. Figure 2 provides an overview of all energy sources, their conversion type and usable energy flows.
Solar energy, for example, is currently converted to heat (via solar thermal applications) or electricity (via solar photovoltaic and concentrated solar power). However, it is rarely used to produce fuel for the transport sector. In contrast, fossil fuels are currently available as solid (coal), liquid (oil) and gaseous (natural gas) fuels to supply heat, electricity, and combustion engines which provide kinetic energy (e.g. for cars). A shift from fossil fuels to renewables therefore requires a change of applications – cars, for example, would need to switch from combustion
engines to electric drives. New infrastructure is also needed, for instance moving away from tankers and pipelines towards power grids and heating networks.
25
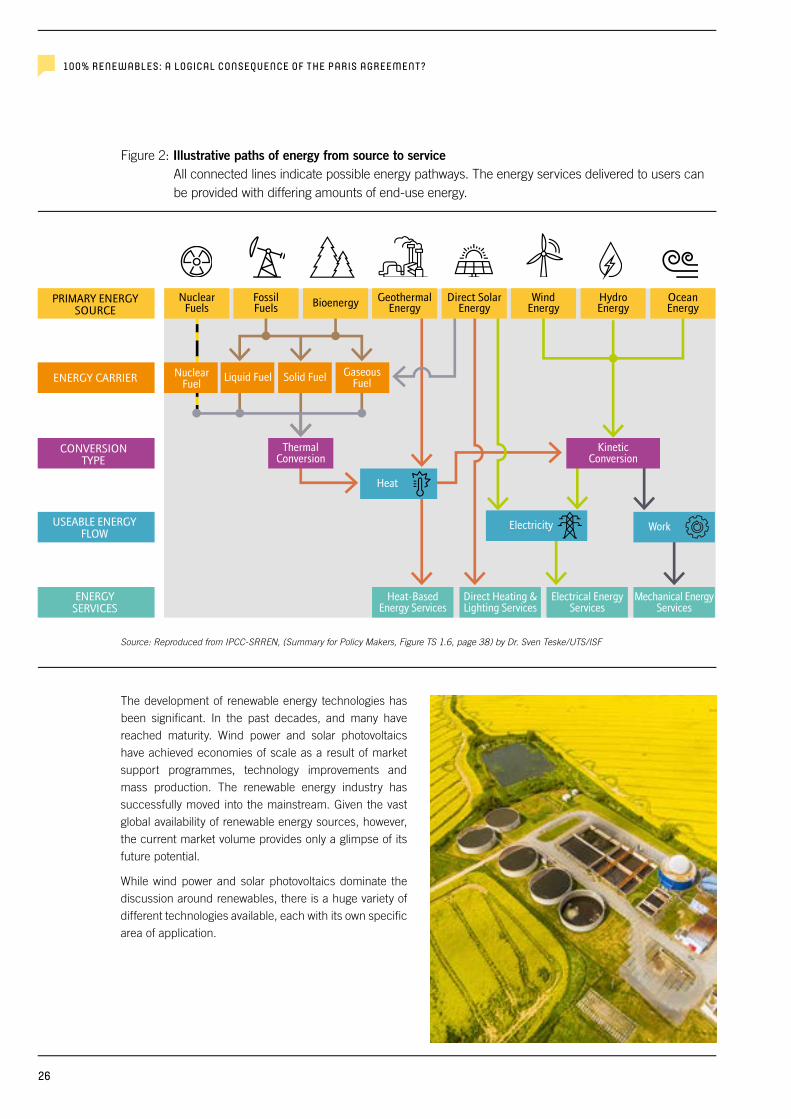
Source: Reproduced from IPCC-SRREN, (Summary for Policy Makers, Figure TS 1.6, page 38) by Dr. Sven Teske/UTS/ISF
PRIMARY ENERGYSOURCE
NuclearFuels
FossilFuels Bioenergy Geothermal
EnergyDirect Solar
EnergyWind
EnergyHydroEnergy
OceanEnergy
ENERGY CARRIER Solid Fuel
Electricity
Liquid FuelNuclearFuel
GaseousFuel
CONVERSIONTYPE
ThermalConversion
KineticConversion
USEABLE ENERGYFLOW
Heat
Work
ENERGYSERVICES
Heat-BasedEnergy Services
Direct Heating &Lighting Services
Electrical EnergyServices
Mechanical EnergyServices
100% RENEWABLES: A LOGICAL CONSEQUENCE OF THE PARIS AGREEMENT?
The development of renewable energy technologies has been significant. In the past decades, and many have reached maturity. Wind power and solar photovoltaics have achieved economies of scale as a result of market support programmes, technology improvements and mass production. The renewable energy industry has successfully moved into the mainstream. Given the vast global availability of renewable energy sources, however, the current market volume provides only a glimpse of its future potential.
While wind power and solar photovoltaics dominate the discussion around renewables, there is a huge variety of different technologies available, each with its own specific area of application.
Figure 2: Illustrative paths of energy from source to service All connected lines indicate possible energy pathways. The energy services delivered to users can be provided with differing amounts of end-use energy.
26
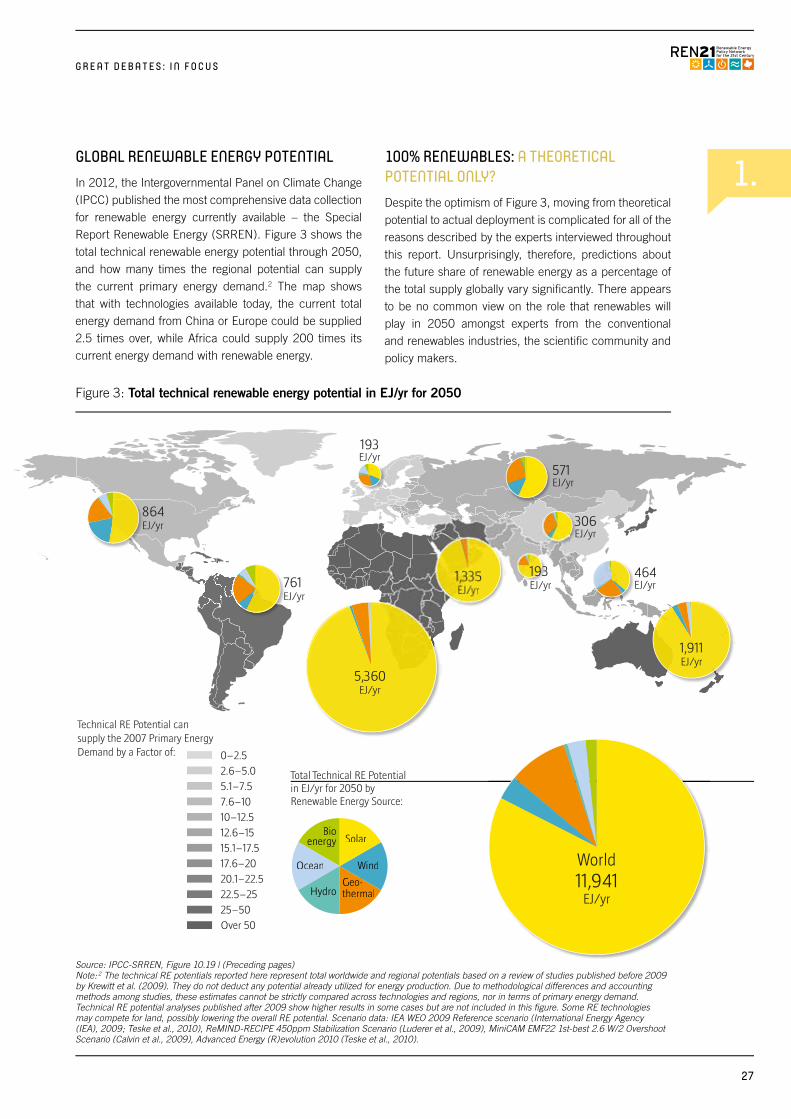
1.
World11,941
EJ/yr
1,335EJ/yr
761EJ/yr
864EJ/yr
464 EJ/yr
571EJ/yr
306EJ/yr
1,911EJ/yr
5,360EJ/yr
193EJ/yr
193EJ/yr
0–2.52.6–5.05.1–7.57.6–1010–12.512.6–1515.1–17.517.6–2020.1–22.522.5–2525–50Over 50
Technical RE Potential can supply the 2007 Primary Energy Demand by a Factor of:
Total Technical RE Potential in EJ/yr for 2050 by Renewable Energy Source:
Solar
Wind
Geo-Geo-thermalHydro
Ocean
Bioenergy
G R E A T D E B A T E S : I N F O C U S
GLOBAL RENEWABLE ENERGY POTENTIALIn 2012, the Intergovernmental Panel on Climate Change (IPCC) published the most comprehensive data collection for renewable energy currently available – the Special Report Renewable Energy (SRREN). Figure 3 shows the total technical renewable energy potential through 2050, and how many times the regional potential can supply the current primary energy demand.2 The map shows that with technologies available today, the current total energy demand from China or Europe could be supplied 2.5 times over, while Africa could supply 200 times its current energy demand with renewable energy.
100% RENEWABLES: A THEORETICAL POTENTIAL ONLY? Despite the optimism of Figure 3, moving from theoretical potential to actual deployment is complicated for all of the reasons described by the experts interviewed throughout this report. Unsurprisingly, therefore, predictions about the future share of renewable energy as a percentage of the total supply globally vary significantly. There appears to be no common view on the role that renewables will play in 2050 amongst experts from the conventional and renewables industries, the scientific community and policy makers.
Source: IPCC-SRREN, Figure 10.19 | (Preceding pages) Note: 2 The technical RE potentials reported here represent total worldwide and regional potentials based on a review of studies published before 2009 by Krewitt et al. (2009). They do not deduct any potential already utilized for energy production. Due to methodological differences and accounting methods among studies, these estimates cannot be strictly compared across technologies and regions, nor in terms of primary energy demand. Technical RE potential analyses published after 2009 show higher results in some cases but are not included in this figure. Some RE technologies may compete for land, possibly lowering the overall RE potential. Scenario data: IEA WEO 2009 Reference scenario (International Energy Agency (IEA), 2009; Teske et al., 2010), ReMIND-RECIPE 450ppm Stabilization Scenario (Luderer et al., 2009), MiniCAM EMF22 1st-best 2.6 W/2 Overshoot Scenario (Calvin et al., 2009), Advanced Energy (R)evolution 2010 (Teske et al., 2010).
Figure 3: Total technical renewable energy potential in EJ/yr for 2050
27
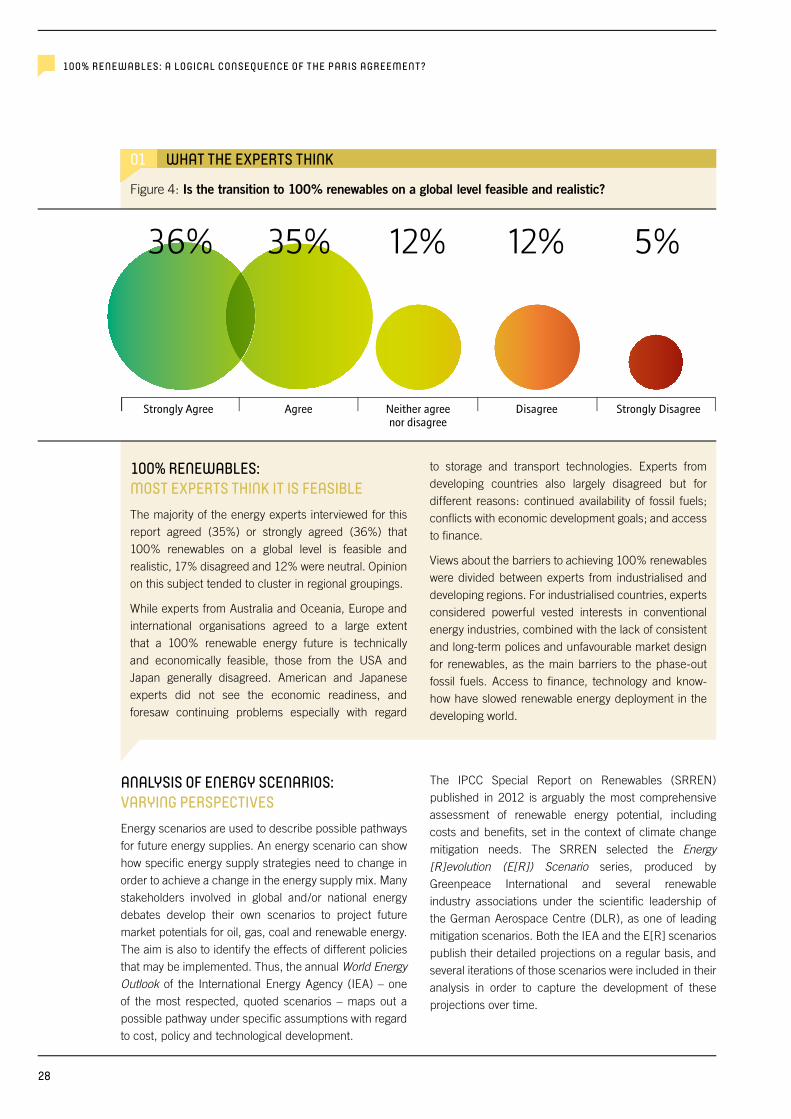
Strongly Agree Agree Neither agreenor disagree
Disagree Strongly Disagree
36% 35% 12% 5%12%
100% RENEWABLES: A LOGICAL CONSEQUENCE OF THE PARIS AGREEMENT?
Figure 4: Is the transition to 100% renewables on a global level feasible and realistic?
100% RENEWABLES: MOST EXPERTS THINK IT IS FEASIBLEThe majority of the energy experts interviewed for this report agreed (35%) or strongly agreed (36%) that 100% renewables on a global level is feasible and realistic, 17% disagreed and 12% were neutral. Opinion on this subject tended to cluster in regional groupings.
While experts from Australia and Oceania, Europe and international organisations agreed to a large extent that a 100% renewable energy future is technically and economically feasible, those from the USA and Japan generally disagreed. American and Japanese experts did not see the economic readiness, and foresaw continuing problems especially with regard
to storage and transport technologies. Experts from developing countries also largely disagreed but for different reasons: continued availability of fossil fuels; conflicts with economic development goals; and access to finance.
Views about the barriers to achieving 100% renewables were divided between experts from industrialised and developing regions. For industrialised countries, experts considered powerful vested interests in conventional energy industries, combined with the lack of consistent and long-term polices and unfavourable market design for renewables, as the main barriers to the phase-out fossil fuels. Access to finance, technology and know-how have slowed renewable energy deployment in the developing world.
ANALYSIS OF ENERGY SCENARIOS: VARYING PERSPECTIVES Energy scenarios are used to describe possible pathways for future energy supplies. An energy scenario can show how specific energy supply strategies need to change in order to achieve a change in the energy supply mix. Many stakeholders involved in global and/or national energy debates develop their own scenarios to project future market potentials for oil, gas, coal and renewable energy. The aim is also to identify the effects of different policies that may be implemented. Thus, the annual World Energy Outlook of the International Energy Agency (IEA) – one of the most respected, quoted scenarios – maps out a possible pathway under specific assumptions with regard to cost, policy and technological development.
The IPCC Special Report on Renewables (SRREN) published in 2012 is arguably the most comprehensive assessment of renewable energy potential, including costs and benefits, set in the context of climate change mitigation needs. The SRREN selected the Energy [R]evolution (E[R]) Scenario series, produced by Greenpeace International and several renewable industry associations under the scientific leadership of the German Aerospace Centre (DLR), as one of leading mitigation scenarios. Both the IEA and the E[R] scenarios publish their detailed projections on a regular basis, and several iterations of those scenarios were included in their analysis in order to capture the development of these projections over time.
01 WHAT THE EXPERTS THINK
28
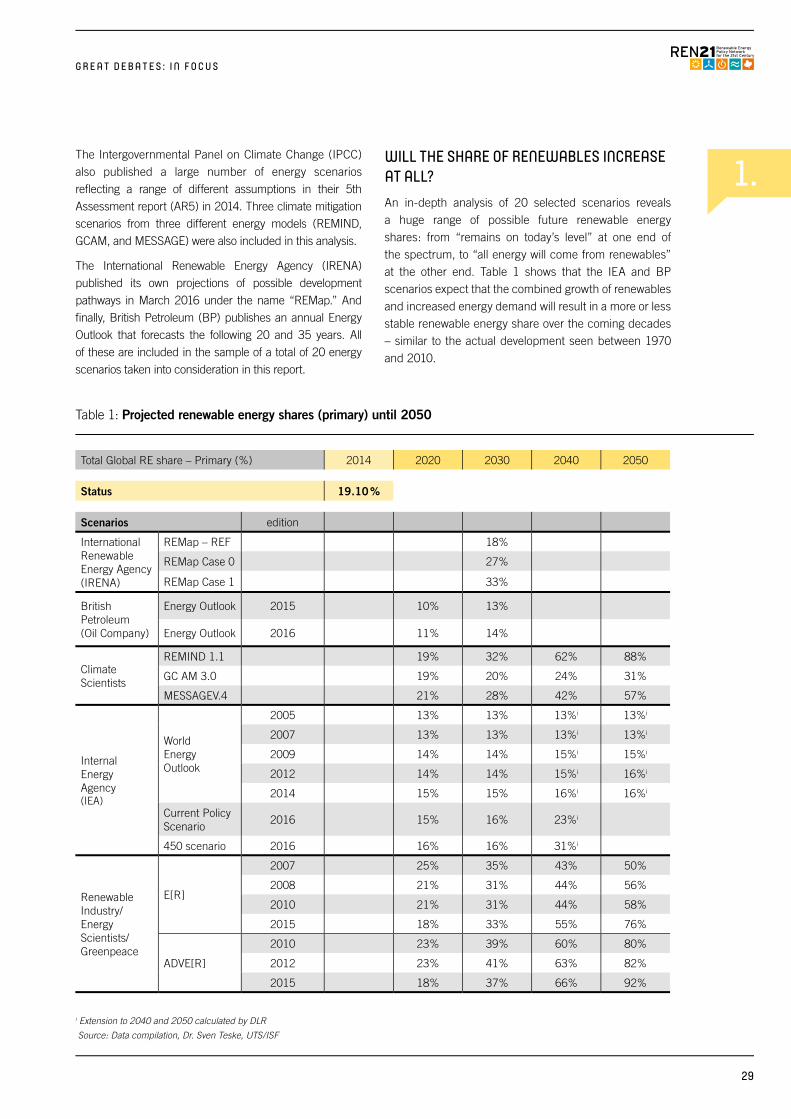
i Extension to 2040 and 2050 calculated by DLR
Source: Data compilation, Dr. Sven Teske, UTS/ISF
1.
Total Global RE share – Primary (%) 2014 2020 2030 2040 2050
Status 19.10 %
Scenarios edition
International Renewable Energy Agency (IRENA)
REMap – REF 18%
REMap Case 0 27%
REMap Case 1 33%
British Petroleum (Oil Company)
Energy Outlook 2015 10% 13%
Energy Outlook 2016 11% 14%
Climate Scientists
REMIND 1.1 19% 32% 62% 88%
GC AM 3.0 19% 20% 24% 31%
MESSAGEV.4 21% 28% 42% 57%
Internal Energy Agency(IEA)
World Energy Outlook
2005 13% 13% 13%i 13%i
2007 13% 13% 13%i 13%i
2009 14% 14% 15%i 15%i
2012 14% 14% 15%i 16%i
2014 15% 15% 16%i 16%i
Current Policy Scenario
2016 15% 16% 23%i
450 scenario 2016 16% 16% 31%i
Renewable Industry/Energy Scientists/Greenpeace
E[R]
2007 25% 35% 43% 50%
2008 21% 31% 44% 56%
2010 21% 31% 44% 58%
2015 18% 33% 55% 76%
ADVE[R]
2010 23% 39% 60% 80%
2012 23% 41% 63% 82%
2015 18% 37% 66% 92%
G R E A T D E B A T E S : I N F O C U S
Table 1: Projected renewable energy shares (primary) until 2050
The Intergovernmental Panel on Climate Change (IPCC) also published a large number of energy scenarios reflecting a range of different assumptions in their 5th Assessment report (AR5) in 2014. Three climate mitigation scenarios from three different energy models (REMIND, GCAM, and MESSAGE) were also included in this analysis.
The International Renewable Energy Agency (IRENA) published its own projections of possible development pathways in March 2016 under the name “REMap.” And finally, British Petroleum (BP) publishes an annual Energy Outlook that forecasts the following 20 and 35 years. All of these are included in the sample of a total of 20 energy scenarios taken into consideration in this report.
WILL THE SHARE OF RENEWABLES INCREASE AT ALL?An in-depth analysis of 20 selected scenarios reveals a huge range of possible future renewable energy shares: from “remains on today’s level” at one end of the spectrum, to “all energy will come from renewables” at the other end. Table 1 shows that the IEA and BP scenarios expect that the combined growth of renewables and increased energy demand will result in a more or less stable renewable energy share over the coming decades – similar to the actual development seen between 1970 and 2010.
29
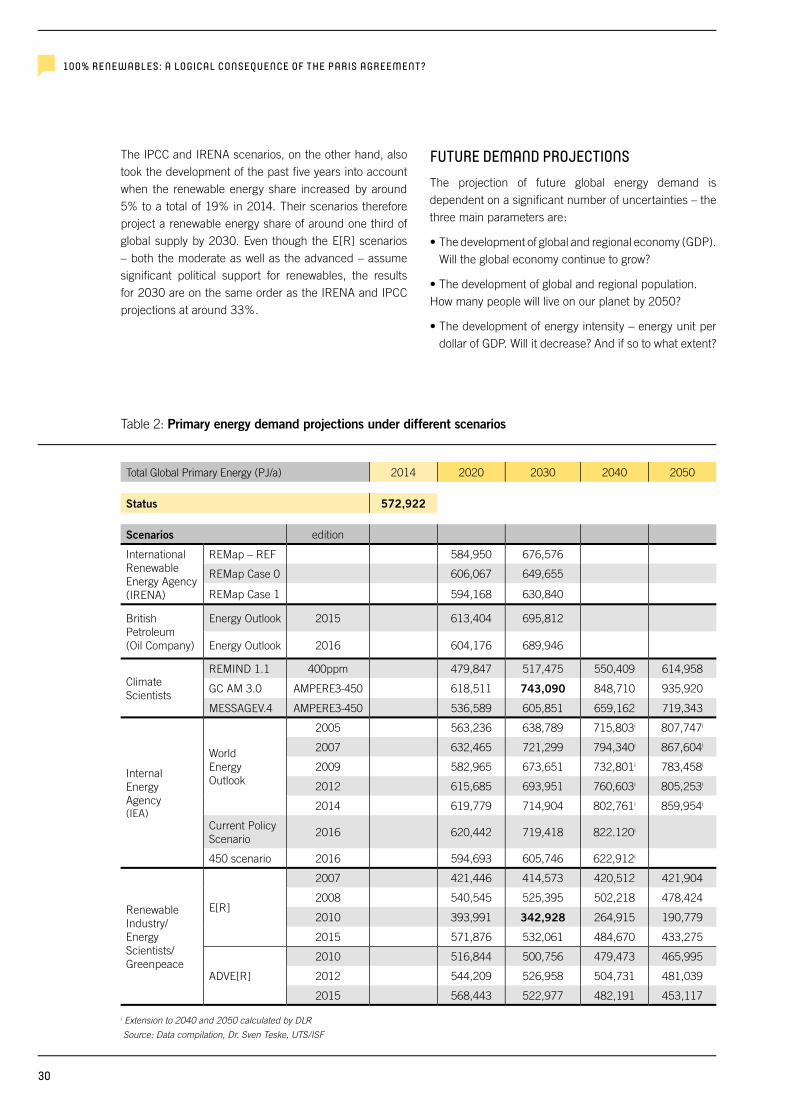
Total Global Primary Energy (PJ/a) 2014 2020 2030 2040 2050
Status 572,922
Scenarios edition
International Renewable Energy Agency (IRENA)
REMap – REF 584,950 676,576
REMap Case 0 606,067 649,655
REMap Case 1 594,168 630,840
British Petroleum (Oil Company)
Energy Outlook 2015 613,404 695,812
Energy Outlook 2016 604,176 689,946
Climate Scientists
REMIND 1.1 400ppm 479,847 517,475 550,409 614,958
GC AM 3.0 AMPERE3-450 618,511 743,090 848,710 935,920
MESSAGEV.4 AMPERE3-450 536,589 605,851 659,162 719,343
Internal Energy Agency(IEA)
World Energy Outlook
2005 563,236 638,789 715,803i 807,747i
2007 632,465 721,299 794,340i 867,604i
2009 582,965 673,651 732,801i 783,458i
2012 615,685 693,951 760,603i 805,253i
2014 619,779 714,904 802,761i 859,954i
Current Policy Scenario
2016 620,442 719,418 822.120i
450 scenario 2016 594,693 605,746 622,912i
Renewable Industry/Energy Scientists/Greenpeace
E[R]
2007 421,446 414,573 420,512 421,904
2008 540,545 525,395 502,218 478,424
2010 393,991 342,928 264,915 190,779
2015 571,876 532,061 484,670 433,275
ADVE[R]
2010 516,844 500,756 479,473 465,995
2012 544,209 526,958 504,731 481,039
2015 568,443 522,977 482,191 453,117
100% RENEWABLES: A LOGICAL CONSEQUENCE OF THE PARIS AGREEMENT?
i Extension to 2040 and 2050 calculated by DLR
Source: Data compilation, Dr. Sven Teske, UTS/ISF
Table 2: Primary energy demand projections under different scenarios
The IPCC and IRENA scenarios, on the other hand, also took the development of the past five years into account when the renewable energy share increased by around 5% to a total of 19% in 2014. Their scenarios therefore project a renewable energy share of around one third of global supply by 2030. Even though the E[R] scenarios – both the moderate as well as the advanced – assume significant political support for renewables, the results for 2030 are on the same order as the IRENA and IPCC projections at around 33%.
FUTURE DEMAND PROJECTIONSThe projection of future global energy demand is dependent on a significant number of uncertainties – the three main parameters are:
• The development of global and regional economy (GDP). Will the global economy continue to grow?
• The development of global and regional population. How many people will live on our planet by 2050?
• The development of energy intensity – energy unit per dollar of GDP. Will it decrease? And if so to what extent?
30
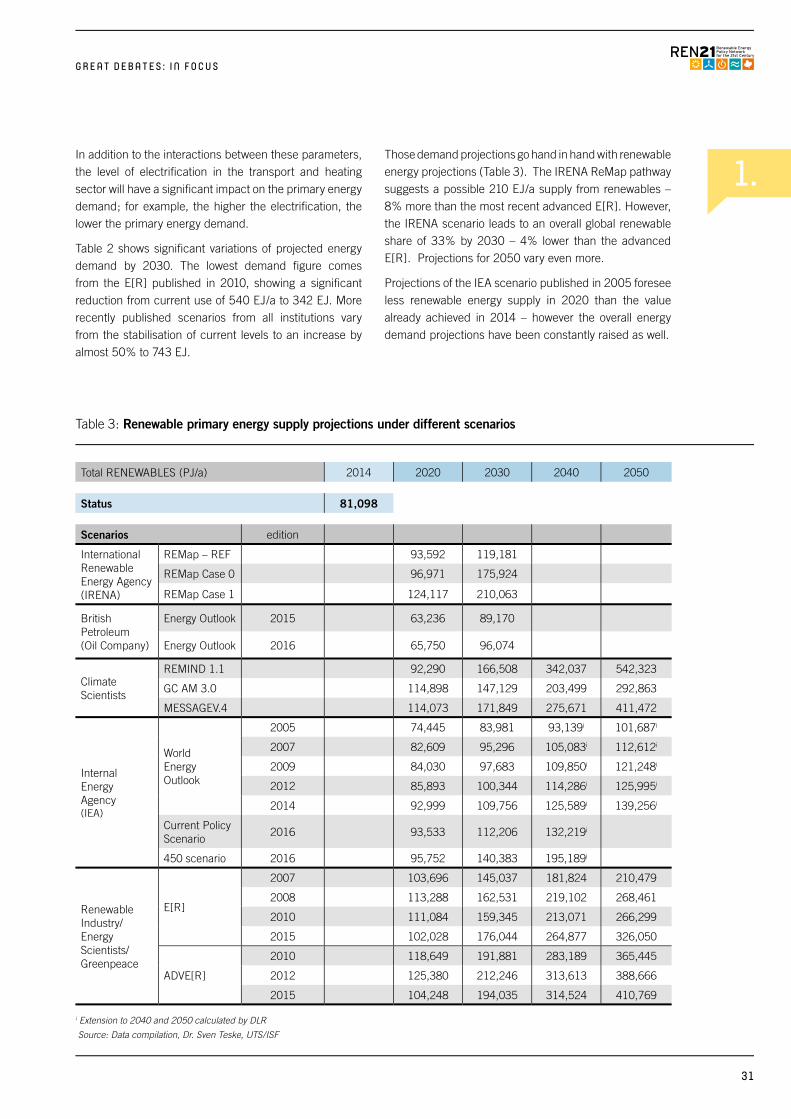
1.
Total RENEWABLES (PJ/a) 2014 2020 2030 2040 2050
Status 81,098
Scenarios edition
International Renewable Energy Agency (IRENA)
REMap – REF 93,592 119,181
REMap Case 0 96,971 175,924
REMap Case 1 124,117 210,063
British Petroleum (Oil Company)
Energy Outlook 2015 63,236 89,170
Energy Outlook 2016 65,750 96,074
Climate Scientists
REMIND 1.1 92,290 166,508 342,037 542,323
GC AM 3.0 114,898 147,129 203,499 292,863
MESSAGEV.4 114,073 171,849 275,671 411,472
Internal Energy Agency(IEA)
World Energy Outlook
2005 74,445 83,981 93,139i 101,687i
2007 82,609 95,296 105,083i 112,612i
2009 84,030 97,683 109,850i 121,248i
2012 85,893 100,344 114,286i 125,995i
2014 92,999 109,756 125,589i 139,256i
Current Policy Scenario
2016 93,533 112,206 132,219i
450 scenario 2016 95,752 140,383 195,189i
Renewable Industry/Energy Scientists/Greenpeace
E[R]
2007 103,696 145,037 181,824 210,479
2008 113,288 162,531 219,102 268,461
2010 111,084 159,345 213,071 266,299
2015 102,028 176,044 264,877 326,050
ADVE[R]
2010 118,649 191,881 283,189 365,445
2012 125,380 212,246 313,613 388,666
2015 104,248 194,035 314,524 410,769
G R E A T D E B A T E S : I N F O C U S
Table 3: Renewable primary energy supply projections under different scenarios
i Extension to 2040 and 2050 calculated by DLR
Source: Data compilation, Dr. Sven Teske, UTS/ISF
In addition to the interactions between these parameters, the level of electrification in the transport and heating sector will have a significant impact on the primary energy demand; for example, the higher the electrification, the lower the primary energy demand.
Table 2 shows significant variations of projected energy demand by 2030. The lowest demand figure comes from the E[R] published in 2010, showing a significant reduction from current use of 540 EJ/a to 342 EJ. More recently published scenarios from all institutions vary from the stabilisation of current levels to an increase by almost 50% to 743 EJ.
Those demand projections go hand in hand with renewable energy projections (Table 3). The IRENA ReMap pathway suggests a possible 210 EJ/a supply from renewables – 8% more than the most recent advanced E[R]. However, the IRENA scenario leads to an overall global renewable share of 33% by 2030 – 4% lower than the advanced E[R]. Projections for 2050 vary even more.
Projections of the IEA scenario published in 2005 foresee less renewable energy supply in 2020 than the value already achieved in 2014 – however the overall energy demand projections have been constantly raised as well.
31
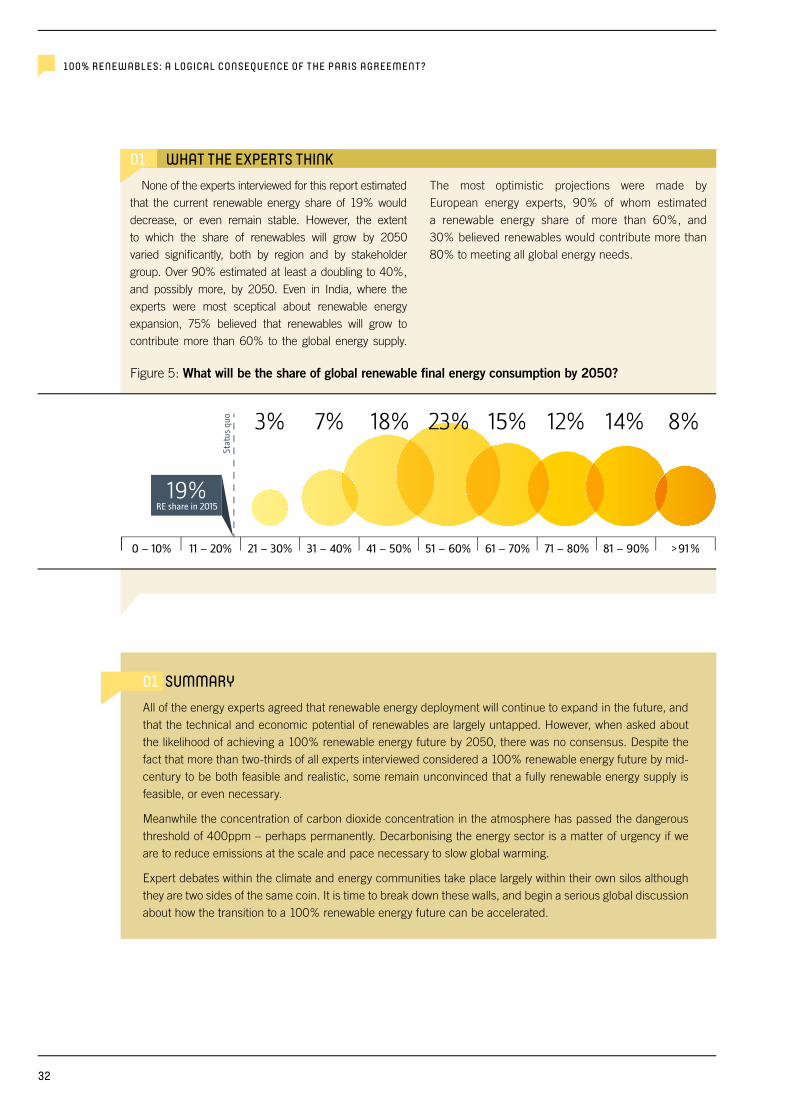
0 – 10% 11 – 20% 21 – 30%
Stat
us q
uo
31 – 40% 41 – 50% 51 – 60% 61 – 70% 71 – 80% 81 – 90% > 91 %
8%14%12%23%18%3% 7% 15%
RE share in 201519%
100% RENEWABLES: A LOGICAL CONSEQUENCE OF THE PARIS AGREEMENT?
Figure 5: What will be the share of global renewable final energy consumption by 2050?
01 WHAT THE EXPERTS THINK None of the experts interviewed for this report estimated
that the current renewable energy share of 19% would decrease, or even remain stable. However, the extent to which the share of renewables will grow by 2050 varied significantly, both by region and by stakeholder group. Over 90% estimated at least a doubling to 40%, and possibly more, by 2050. Even in India, where the experts were most sceptical about renewable energy expansion, 75% believed that renewables will grow to contribute more than 60% to the global energy supply.
The most optimistic projections were made by European energy experts, 90% of whom estimated a renewable energy share of more than 60%, and 30% believed renewables would contribute more than 80% to meeting all global energy needs.
01 SUMMARY All of the energy experts agreed that renewable energy deployment will continue to expand in the future, and that the technical and economic potential of renewables are largely untapped. However, when asked about the likelihood of achieving a 100% renewable energy future by 2050, there was no consensus. Despite the fact that more than two-thirds of all experts interviewed considered a 100% renewable energy future by mid-century to be both feasible and realistic, some remain unconvinced that a fully renewable energy supply is feasible, or even necessary.
Meanwhile the concentration of carbon dioxide concentration in the atmosphere has passed the dangerous threshold of 400ppm – perhaps permanently. Decarbonising the energy sector is a matter of urgency if we are to reduce emissions at the scale and pace necessary to slow global warming.
Expert debates within the climate and energy communities take place largely within their own silos although they are two sides of the same coin. It is time to break down these walls, and begin a serious global discussion about how the transition to a 100% renewable energy future can be accelerated.
32
2. 2. GLOBAL ENERGY DEMAND DEVELOPMENT: EFFICIENCY ON A GLOBAL LEVEL
n INTRODUCTIONProjecting future energy demand on a global, national and regional level is key for future planning: whether infrastructural changes will be required; whether local energy resources will need to be augmented by imports; how energy efficiency measures will affect future demand; and what the anticipated overall investment requirements will be. While the energy demand of industrialised countries has plateaued or is decreasing, these questions are taking on critical significance for developing countries in particular in a climate-constrained world.
Yet for a variety of reasons, developing countries have a tendency to repeat the mistakes of industrialised countries, leading to overcapacities and stranded investments. For example, increased energy demand in China in the last decade outpaced all projections and it was only recently that its double-digit economic growth slowed. It is important to put energy efficiency and consumption patterns at the centre of the debate on future energy needs and policy decisions. Energy efficiency and renewable energy expansion go hand-in-hand and should be discussed in an integrated way.
n SNAPSHOT 2013In the 2013 Global Futures Report, there was no specific analysis of projected overall energy demand. The report provided a detailed analysis of energy scenarios published by the International Energy Agency (IEA), British Petroleum (BP) and Greenpeace in relation to projected renewable energy shares of the power, heating and transport sectors, as well as the overall contribution of renewables as a share of total global energy supply.
n WHERE WE ARE TODAY: GLOBAL AND REGIONAL ENERGY DEMAND
The tremendous global development of renewables over the past three years, combined with the rising energy demand of rapidly emerging economies, brings the debate about specific actions for energy efficiency to increase energy productivity squarely back on the political agenda.
Had energy efficiency measures taken over the past 25 years not been adopted, the current global demand would be 826 EJ/a (19.725 Mtoe); 251 EJ/a (5.987 Mtoe) higher than it is today. Efficiency measures saved an amount of energy equal to the total demand of China, India and Europe combined. Between 1990 and 2014, global primary energy intensity dropped continuously at an average annual rate of 1.5%. In 2015 energy intensity was more than 30% lower than it was in 1990.
Yet global economic growth has continued to precipitate a steady net growth in energy demand. Global energy demand increased by 56% from 1990 to 2014 with an average annual growth rate of 1.9%, with global total primary energy demand (TPED) exceeding 13.7 billion tonnes of oil equivalent in 2014 (GSR 2016).
G R E A T D E B A T E S : I N F O C U S
33
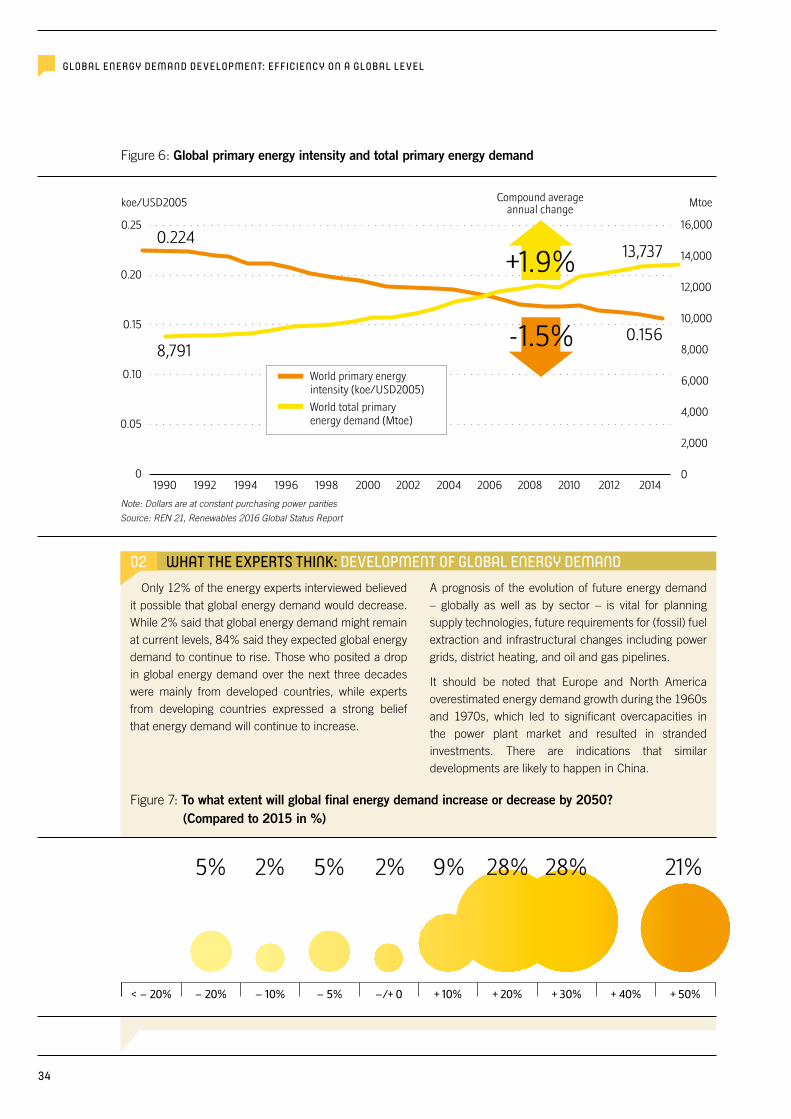
0.25
0.20
0.15
0.10
0.05
0
koe/USD2005 Mtoe
World primary energy intensity (koe/USD2005)
World total primaryenergy demand (Mtoe)
1990 1994 1996 19981992 2000 2002 2004 2006 20102008 2012 2014
16,000
14,000
12,000
10,000
8,000
6,000
4,000
2,000
0
Compound averageannual change
0.224
0.1568,791
13,737+1.9%
-1.5%
GLOBAL ENERGY DEMAND DEVELOPMENT: EFFICIENCY ON A GLOBAL LEVEL
Figure 6: Global primary energy intensity and total primary energy demand
Note: Dollars are at constant purchasing power parities
Source: REN 21, Renewables 2016 Global Status Report
Figure 7: To what extent will global final energy demand increase or decrease by 2050? (Compared to 2015 in %)
< – 20% – 20% – 10% – 5% –/+ 0 + 10% + 20% + 30% + 40% + 50%
21%28%9%2%5% 2% 5% 28%
02 WHAT THE EXPERTS THINK: DEVELOPMENT OF GLOBAL ENERGY DEMANDOnly 12% of the energy experts interviewed believed
it possible that global energy demand would decrease. While 2% said that global energy demand might remain at current levels, 84% said they expected global energy demand to continue to rise. Those who posited a drop in global energy demand over the next three decades were mainly from developed countries, while experts from developing countries expressed a strong belief that energy demand will continue to increase.
A prognosis of the evolution of future energy demand – globally as well as by sector – is vital for planning supply technologies, future requirements for (fossil) fuel extraction and infrastructural changes including power grids, district heating, and oil and gas pipelines.
It should be noted that Europe and North America overestimated energy demand growth during the 1960s and 1970s, which led to significant overcapacities in the power plant market and resulted in stranded investments. There are indications that similar developments are likely to happen in China.
34

2.
Energy intensity =
annual kWh consumption
G R E A T D E B A T E S : I N F O C U S
Box 1: Energy efficiency and intensity
DEVELOPMENT OF ENERGY INTENSITY SINCE 2000 AND TECHNOLOGY TRENDS BY SECTORUsing energy more efficiently is cheaper than producing additional energy, and has many other benefits. Improving the energy efficiency in buildings doesn’t lead to a reduction in comfort. For example, a well-insulated house feels warmer in the winter, cooler in the summer and is healthier to live in. An efficient washing machine or dishwasher uses less power and saves water too. An efficient refrigerator is quieter, has no frost inside or condensation outside, and is likely to last longer. Efficient lighting offers more light where you need it. Efficiency can best be described as enjoying‚ more with less’.
There are very simple steps to increase efficiency both at home and in offices and industries, saving both money and energy. Improvements can be made by updating or replacing specific systems or appliances, but the greatest savings do not come from incremental steps. Rethinking at a system level – ‘the whole house,’ ‘the whole car’ or even ‘the whole transport system’ – can cut energy use by a factor of four to ten compared to taking only incremental steps.
The graphs on the following pages 34 show the development of energy intensity since 2000 in the four main sectors: households, services, industry and transport.
HOUSE-HOLDS: Statistically, global electricity consumption per household has not changed significantly over the past 15 years. Between 2000 and 2014, improvements averaged 0.5% annually, although trends varied by region. In North America, Europe and the Pacific, electricity consumption per household rose between 2000 and 2010, followed by a decline in 2014, associated in part with improved energy efficiency. However, the structure of household electricity demand changed significantly. The power demand of “white goods” such as refrigerators, dishwashers, and washing machines dropped dramatically, between 40% and 70%.
Average electricity consumption in North-America, Australia and Oceania and the Middle East is significantly higher than the global average. This is due to the high demand for electric air-conditioning, oversized refrigerators and electric heating and pumps for private swimming pools.
Energy efficiency is based on the following pillars
3 The implementation of BEST PRACTICE TECHNOLOGIES and a certain SHARE OF EMERGING TECHNOLOGIES via energy efficiency standards
3 BEHAVIOURAL CHANGES e.g. reducing the average room temperature
3 STRUCTURAL CHANGES, such as shifts from individual fossil fuel cars towards electric public transports
3 EQUIPMENT AND INSTALLATIONS are replaced at the end of their (economic) lifetime e.g. switch to LED lighting
Energy efficiency is not a homogenous sector and involves a large number of technologies and measures. While the renewable energy markets can be clearly defined with a small amount of technical and financial parameters, to measure the development of energy efficiency is complex. Therefore “energy intensity” is used as a parameter. Energy intensity describes the specific average amount of energy demand per unit e.g. annual kWh consumption per household.
35
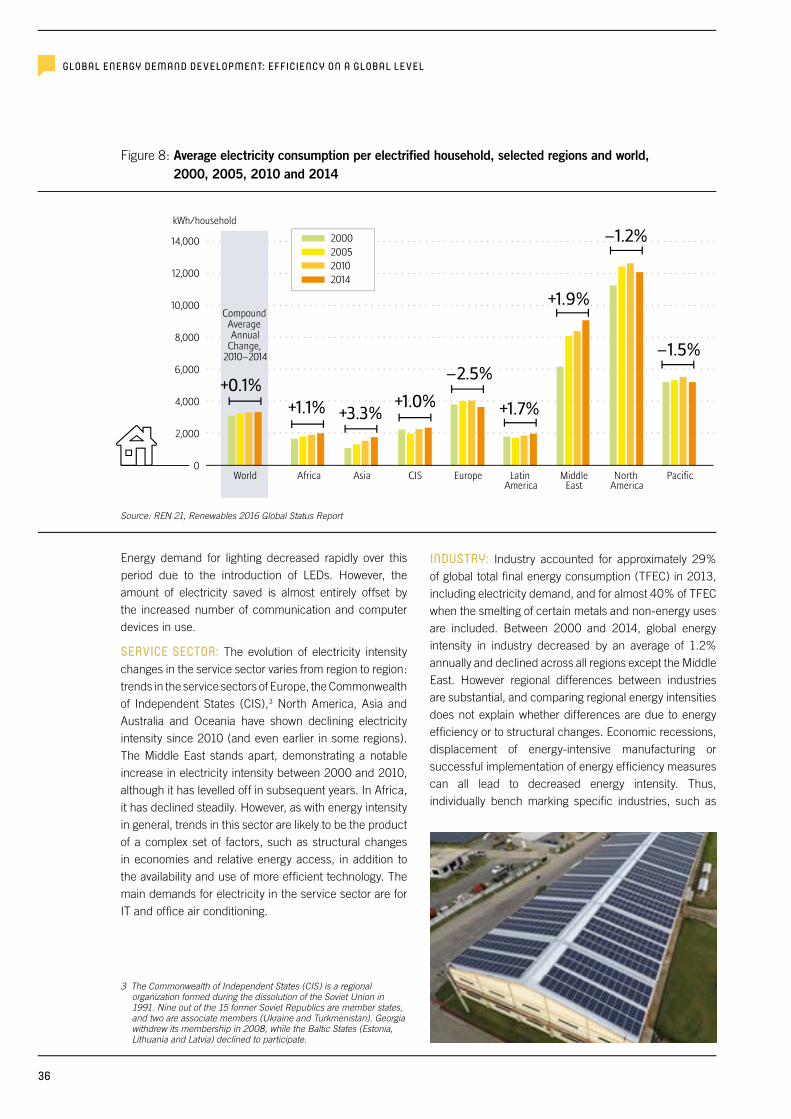
14,000
12,000
10,000
8,000
6,000
4,000
2,000
0World Africa Asia CIS Europe Latin
AmericaMiddle
EastNorth
AmericaPacific
kWh/household
2000200520102014
Compound Average Annual
Change, 2010–2014
+0.1%+1.0% +1.7%+1.1%
+1.9%
+3.3%
–1.5%–2.5%
–1.2%
GLOBAL ENERGY DEMAND DEVELOPMENT: EFFICIENCY ON A GLOBAL LEVEL
Energy demand for lighting decreased rapidly over this period due to the introduction of LEDs. However, the amount of electricity saved is almost entirely offset by the increased number of communication and computer devices in use.
SERVICE SECTOR: The evolution of electricity intensity changes in the service sector varies from region to region: trends in the service sectors of Europe, the Commonwealth of Independent States (CIS),3 North America, Asia and Australia and Oceania have shown declining electricity intensity since 2010 (and even earlier in some regions). The Middle East stands apart, demonstrating a notable increase in electricity intensity between 2000 and 2010, although it has levelled off in subsequent years. In Africa, it has declined steadily. However, as with energy intensity in general, trends in this sector are likely to be the product of a complex set of factors, such as structural changes in economies and relative energy access, in addition to the availability and use of more efficient technology. The main demands for electricity in the service sector are for IT and office air conditioning.
INDUSTRY: Industry accounted for approximately 29% of global total final energy consumption (TFEC) in 2013, including electricity demand, and for almost 40% of TFEC when the smelting of certain metals and non-energy uses are included. Between 2000 and 2014, global energy intensity in industry decreased by an average of 1.2% annually and declined across all regions except the Middle East. However regional differences between industries are substantial, and comparing regional energy intensities does not explain whether differences are due to energy efficiency or to structural changes. Economic recessions, displacement of energy-intensive manufacturing or successful implementation of energy efficiency measures can all lead to decreased energy intensity. Thus, individually bench marking specific industries, such as
Figure 8: Average electricity consumption per electrified household, selected regions and world, 2000, 2005, 2010 and 2014
3 The Commonwealth of Independent States (CIS) is a regional organization formed during the dissolution of the Soviet Union in 1991. Nine out of the 15 former Soviet Republics are member states, and two are associate members (Ukraine and Turkmenistan). Georgia withdrew its membership in 2008, while the Baltic States (Estonia, Lithuania and Latvia) declined to participate.
Source: REN 21, Renewables 2016 Global Status Report
36
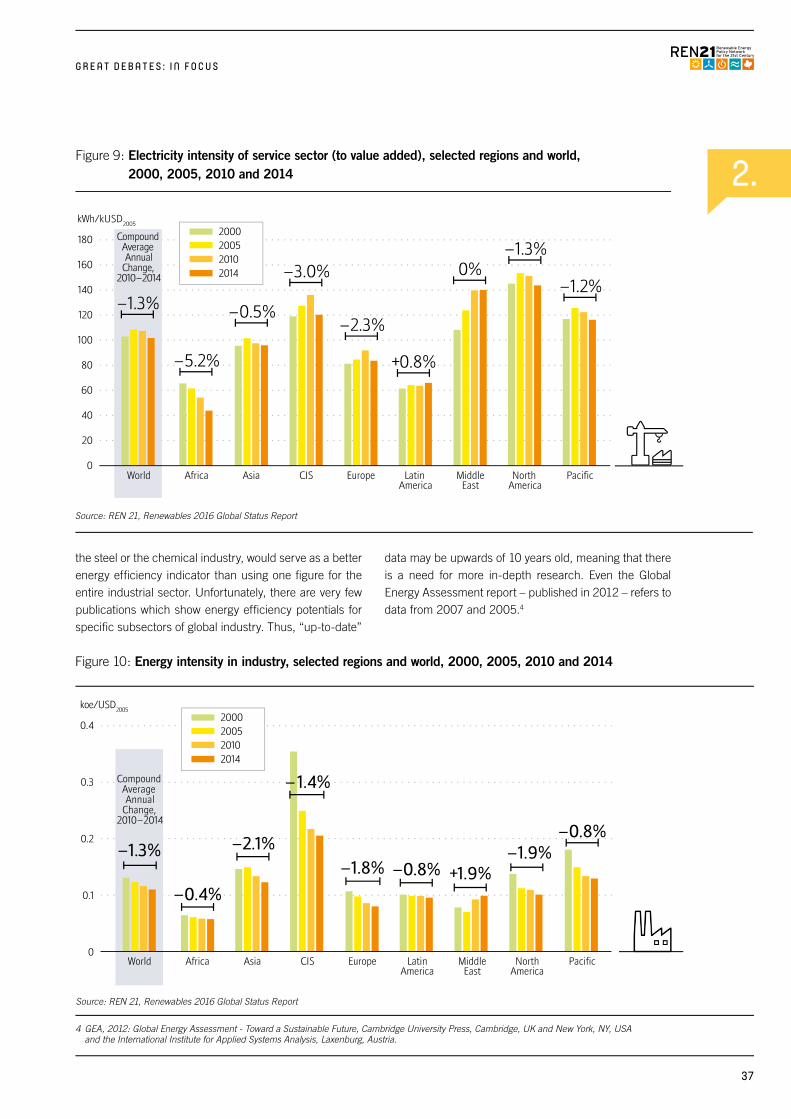
2. 180
160
140
120
100
80
60
40
20
0
kWh/kUSD2005
2000200520102014
Compound Average Annual
Change, 2010–2014
World Africa Asia CIS Europe Latin America
MiddleEast
North America
Pacific
–1.3%–1.2%
–1.3%
–2.3%
–3.0%
–5.2%
0%
–0.5%
+0.8%
0.4
0.3
0.2
0.1
0
koe/USD2005
2000200520102014
Compound Average Annual
Change, 2010–2014
Africa Asia CIS Europe Latin America
MiddleEast
North America
PacificWorld
–1.3%–1.8%
–1.9%–0.8%
–2.1%–0.8%
–0.4%+1.9%
–1.4%
G R E A T D E B A T E S : I N F O C U S
Figure 9: Electricity intensity of service sector (to value added), selected regions and world, 2000, 2005, 2010 and 2014
the steel or the chemical industry, would serve as a better energy efficiency indicator than using one figure for the entire industrial sector. Unfortunately, there are very few publications which show energy efficiency potentials for specific subsectors of global industry. Thus, “up-to-date”
data may be upwards of 10 years old, meaning that there is a need for more in-depth research. Even the Global Energy Assessment report – published in 2012 – refers to data from 2007 and 2005.4
Figure 10: Energy intensity in industry, selected regions and world, 2000, 2005, 2010 and 2014
4 GEA, 2012: Global Energy Assessment - Toward a Sustainable Future, Cambridge University Press, Cambridge, UK and New York, NY, USA and the International Institute for Applied Systems Analysis, Laxenburg, Austria.
Source: REN 21, Renewables 2016 Global Status Report
Source: REN 21, Renewables 2016 Global Status Report
37
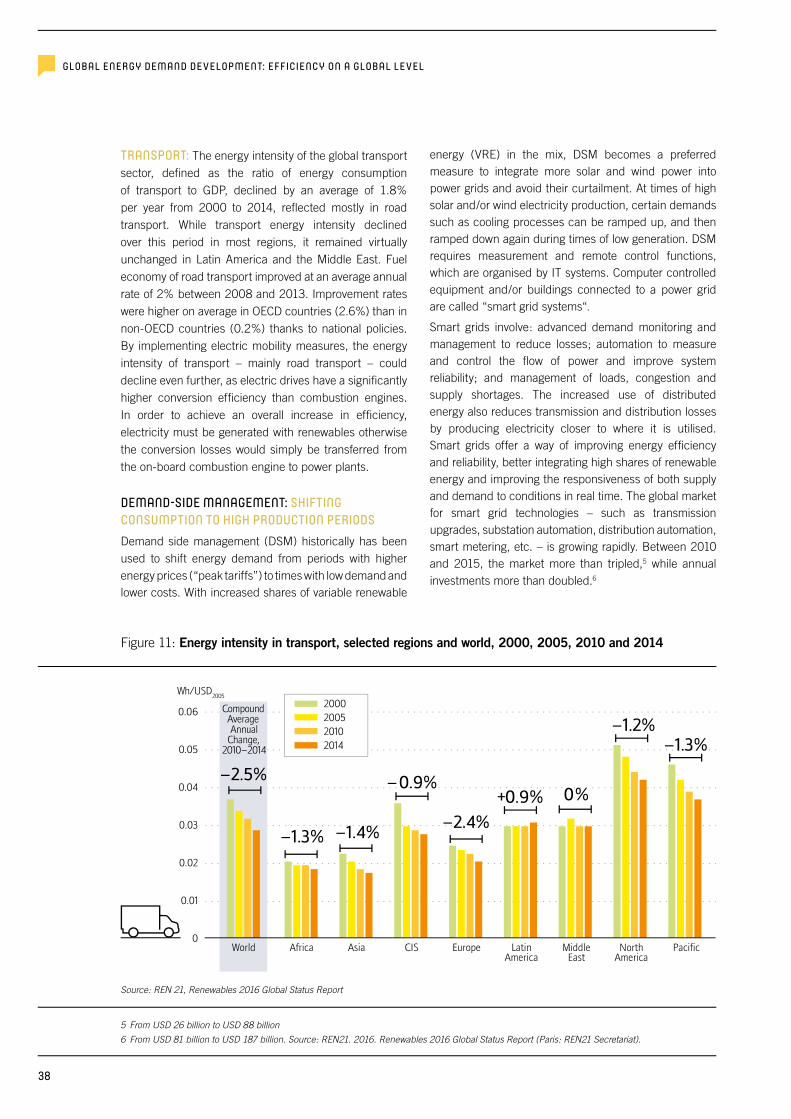
0.06
0.05
0.04
0.03
0.02
0.01
0
Wh/USD2005
2000200520102014
Compound Average Annual
Change, 2010–2014
Africa Asia CIS Europe Latin America
MiddleEast
North America
PacificWorld
–2.5%
–2.4%
–0.9%
–1.2%
+0.9%
–1.4%
–1.3%
–1.3%
0%
GLOBAL ENERGY DEMAND DEVELOPMENT: EFFICIENCY ON A GLOBAL LEVEL
TRANSPORT: The energy intensity of the global transport sector, defined as the ratio of energy consumption of transport to GDP, declined by an average of 1.8% per year from 2000 to 2014, reflected mostly in road transport. While transport energy intensity declined over this period in most regions, it remained virtually unchanged in Latin America and the Middle East. Fuel economy of road transport improved at an average annual rate of 2% between 2008 and 2013. Improvement rates were higher on average in OECD countries (2.6%) than in non-OECD countries (0.2%) thanks to national policies. By implementing electric mobility measures, the energy intensity of transport – mainly road transport – could decline even further, as electric drives have a significantly higher conversion efficiency than combustion engines. In order to achieve an overall increase in efficiency, electricity must be generated with renewables otherwise the conversion losses would simply be transferred from the on-board combustion engine to power plants.
DEMAND-SIDE MANAGEMENT: SHIFTING CONSUMPTION TO HIGH PRODUCTION PERIODS Demand side management (DSM) historically has been used to shift energy demand from periods with higher energy prices (“peak tariffs”) to times with low demand and lower costs. With increased shares of variable renewable
energy (VRE) in the mix, DSM becomes a preferred measure to integrate more solar and wind power into power grids and avoid their curtailment. At times of high solar and/or wind electricity production, certain demands such as cooling processes can be ramped up, and then ramped down again during times of low generation. DSM requires measurement and remote control functions, which are organised by IT systems. Computer controlled equipment and/or buildings connected to a power grid are called “smart grid systems“.
Smart grids involve: advanced demand monitoring and management to reduce losses; automation to measure and control the flow of power and improve system reliability; and management of loads, congestion and supply shortages. The increased use of distributed energy also reduces transmission and distribution losses by producing electricity closer to where it is utilised. Smart grids offer a way of improving energy efficiency and reliability, better integrating high shares of renewable energy and improving the responsiveness of both supply and demand to conditions in real time. The global market for smart grid technologies – such as transmission upgrades, substation automation, distribution automation, smart metering, etc. – is growing rapidly. Between 2010 and 2015, the market more than tripled,5 while annual investments more than doubled.6
Figure 11: Energy intensity in transport, selected regions and world, 2000, 2005, 2010 and 2014
5 From USD 26 billion to USD 88 billion
6 From USD 81 billion to USD 187 billion. Source: REN21. 2016. Renewables 2016 Global Status Report (Paris: REN21 Secretariat).
Source: REN 21, Renewables 2016 Global Status Report
38
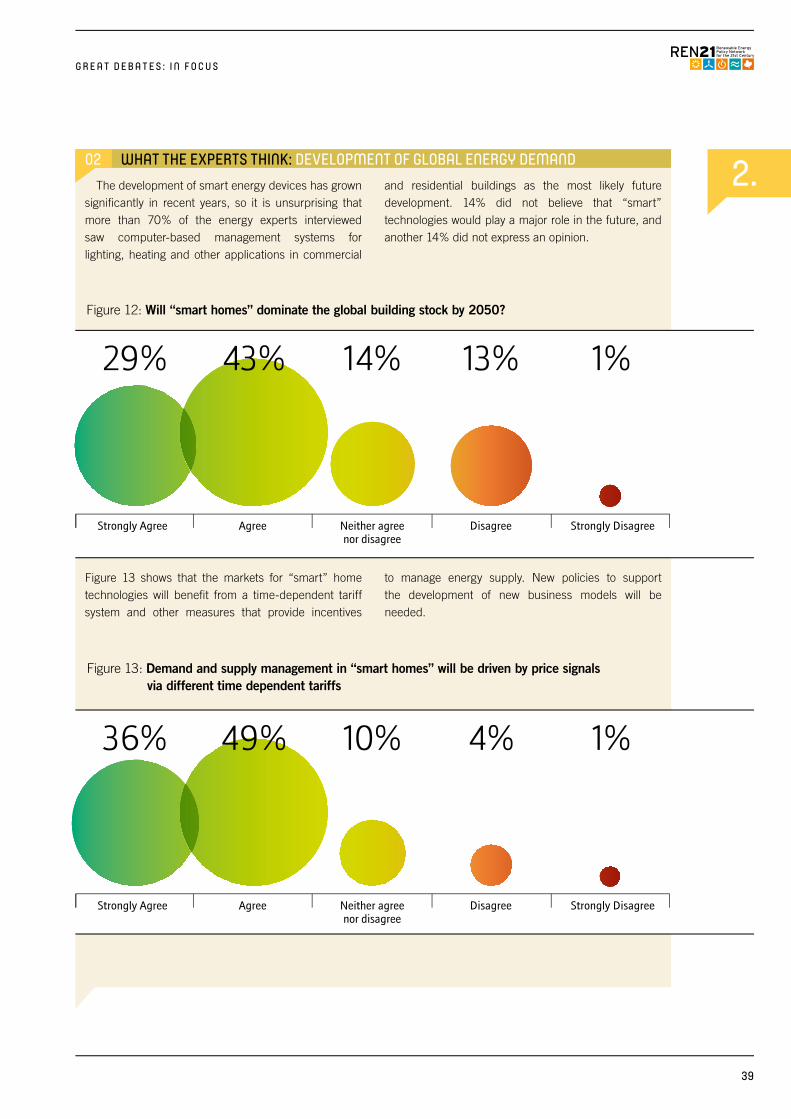
2.
G R E A T D E B A T E S : I N F O C U S
02 WHAT THE EXPERTS THINK: DEVELOPMENT OF GLOBAL ENERGY DEMANDThe development of smart energy devices has grown
significantly in recent years, so it is unsurprising that more than 70% of the energy experts interviewed saw computer-based management systems for lighting, heating and other applications in commercial
and residential buildings as the most likely future development. 14% did not believe that “smart” technologies would play a major role in the future, and another 14% did not express an opinion.
Figure 12: Will “smart homes” dominate the global building stock by 2050?
Strongly Agree Agree Neither agreenor disagree
Disagree Strongly Disagree
36% 49% 10% 1%4%
Figure 13: Demand and supply management in “smart homes” will be driven by price signals via different time dependent tariffs
Figure 13 shows that the markets for “smart” home technologies will benefit from a time-dependent tariff system and other measures that provide incentives
to manage energy supply. New policies to support the development of new business models will be needed.
Strongly Agree Agree Neither agreenor disagree
Disagree Strongly Disagree
29% 43% 14% 1%13%
39

GLOBAL ENERGY DEMAND DEVELOPMENT: EFFICIENCY ON A GLOBAL LEVEL
02 SUMMARY
Expectations about future energy demand are central to technical and economic analyses of global, regional and national energy supply systems. Countries as diverse as China and Denmark have shown that the decoupling of GDP and energy growth is possible. While energy efficiency measures have been very successful in reducing the energy intensity of nearly all technical processes, overall energy demand is still on the rise.
A global debate about how energy efficiency measures can be fast tracked on a global level, including in less developed countries, is urgently needed. Specifically, we must identify efficient financial support mechanisms for those without access to energy services to help them avoid repeating the mistakes of industrialised countries and leapfrog to modern and efficient energy supplies.
Access to know-how and information about successful policies for implementing and utilizing the most efficient technologies will support developing countries in their economic development, benefiting global society as a whole in an increasingly resource-constrained world. Smart technologies are likely to play an important role in combining energy efficiency with new renewables.
SOLAR
WIND
GEOTHERMAL
HYDRO
BIOMASS
EFFICIENCY
SMARTGRID
40

3.
7 Global Wind Energy Council, 2016, (GWEC 2016) “Global Wind Energy Outlook 2016, Brussels/Belgium/Sydney/Australia – October 2016
8 Wind Europe, 2016, (WE 2016), Internet-News: 12 December 2016, The Netherlands’ Minister of Economic Affairs awarded the consortium of Shell, Van Oord, Eneco and Mitsubishi/DGE the concession to build the offshore wind farms Borssele III and IV (700 MW). The winning bid came in at � 54.5/MWh excluding the cost of grid connection. This is 25% lower than for Borssele I and II (72.7/MWh) awarded to DONG Energy in July.
9 International Energy Agency, 2015, (IEA 2015), Key World Energy Statistics 2015, page 24; 1973: 6,131 TWh/a – 2013: 23,322 TWh/a
n INTRODUCTIONWithin the energy industry, the power sector has experienced the most rapid changes over the past decade. Wind power is now among the cheapest new power plant technologies and solar photovoltaics have achieved grid parity in many countries. The development of both technologies has been outstanding and has significantly changed the way utilities operate in some countries, such as Germany. As a result, their success has gained the lion’s share of the attention, becoming synonymous with “renewable energy” in the minds of many.
n SNAPSHOT 2013The 2013 Global Futures Report focused primarily on the power sector, and the debates then were not dissimilar to those still going on today: what kind of policies are required? How can high shares of variable renewables be integrated into the grid? And what will the business models of the future look like?
Of particular interest is the discussion about offshore wind. In 2013 many experts were still discussing its pros and cons in comparison to onshore wind, and expert views varied widely. The positive aspects cited by experts included less visual impact, higher wind speeds, no NIMBY (“not in my backyard”) problems, proximity to coastal urban population centres, larger project sizes providing more credibility and investor security, more predictable wind patterns, scalability to very large size plants, and public relations value for oil companies and pension funds. Some experts framed the issues around offshore wind development as social or institutional questions. One asked: “Should policy promote offshore to avoid the problems of onshore wind power social acceptance and land
use?” Another, however, criticised the diversion of investment resources away from onshore installations that could be more locally owned and controlled: “The only reason we are seeing offshore development is because big utilities like big centralised projects – and that’s not the right reason.”
n WHERE WE ARE TODAY: THE POWER SECTOR AND THE RISE OF “OTHERS”
While the debate about pros and cons of offshore wind is still lively, sector development has continued over the last few years. The offshore wind market has expanded significantly from around 5 GW at the end of 2012 to 12 GW by the end of 2015, with approximately 1.5 GW outside Europe (China and USA).7 Costs have dropped significantly from 12-15 Euro cents per kWh (for offshore wind projects in the North Sea area in 2012) to a record low of 5.45 Euro cents per kWh (for the Dutch offshore wind project Borssele III and IV).8
More generally, however, the power sector has been stable for several decades and the mix of power plants that have provided the bulk of electricity – coal, gas, hydro and nuclear power plants – remains unchanged. Global demand steadily increased over the past 40 years by a factor of four.9 While coal and hydro have maintained their market shares, both gas and nuclear have gained a higher market share at the expense of oil-fired power plants. In 1973, there was a tiny share – less than 1% – of “other” (non-fossil fuel or nuclear) generation sources, mostly waste incineration and minor shares of solar and wind. In 2013, this “other” category grew to 5.7% and only two years later to 7.3%. Now that the majority of the global coal and nuclear power plants are reaching the end of their technical life
3. RENEWABLE POWER GENERATION: THE WINNER TAKES ALL?
G R E A T D E B A T E S : I N F O C U S
41
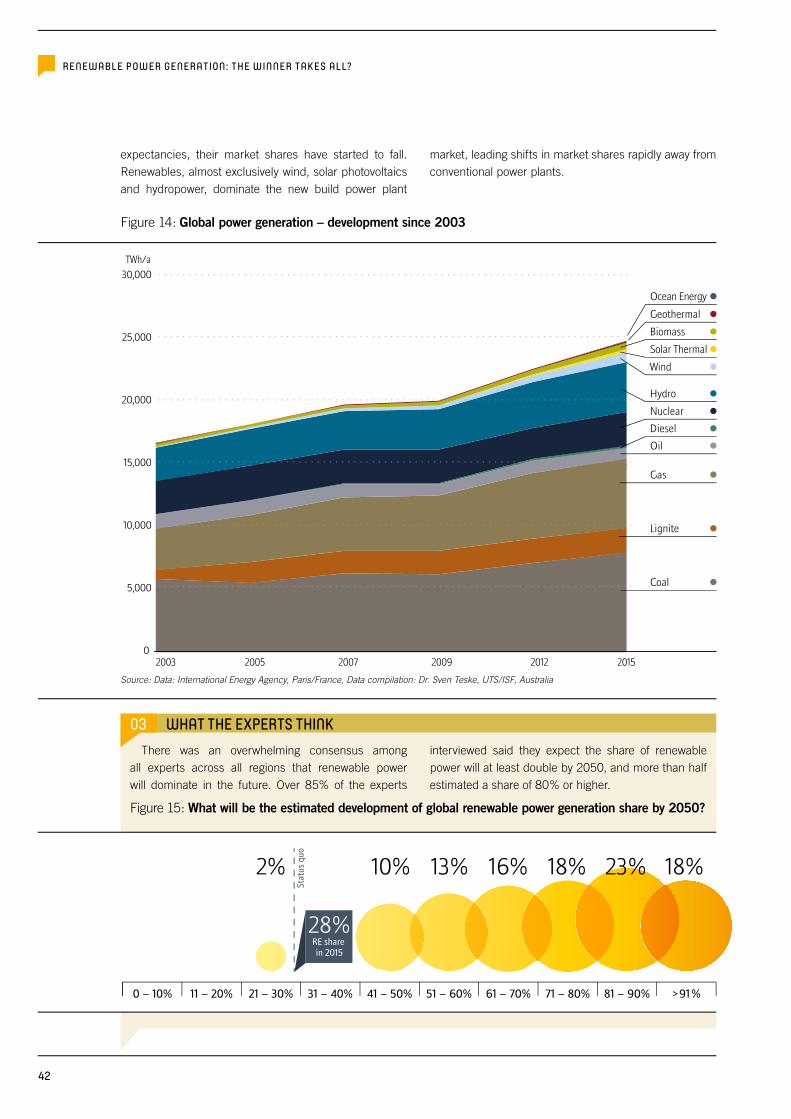
30,000
25,000
20,000
15,000
10,000
5,000
0 2003 2005 2007
TWh/a
2009 2012 2015
Ocean Energy
Geothermal
Biomass
Solar Thermal
Wind
Hydro
Diesel
Nuclear
Oil
Gas
Lignite
Coal
RENEWABLE POWER GENERATION: THE WINNER TAKES ALL?
03 WHAT THE EXPERTS THINKThere was an overwhelming consensus among
all experts across all regions that renewable power will dominate in the future. Over 85% of the experts
interviewed said they expect the share of renewable power will at least double by 2050, and more than half estimated a share of 80% or higher.
expectancies, their market shares have started to fall. Renewables, almost exclusively wind, solar photovoltaics and hydropower, dominate the new build power plant
market, leading shifts in market shares rapidly away from conventional power plants.
Figure 14: Global power generation – development since 2003
Figure 15: What will be the estimated development of global renewable power generation share by 2050?
Source: Data: International Energy Agency, Paris/France, Data compilation: Dr. Sven Teske, UTS/ISF, Australia
0 – 10% 11 – 20% 21 – 30% 31 – 40% 41 – 50% 51 – 60% 61 – 70% 71 – 80% 81 – 90% > 91 %
18%23%18%13%10%2% 16%
Stat
us q
uo
RE share in 2015
28%
42
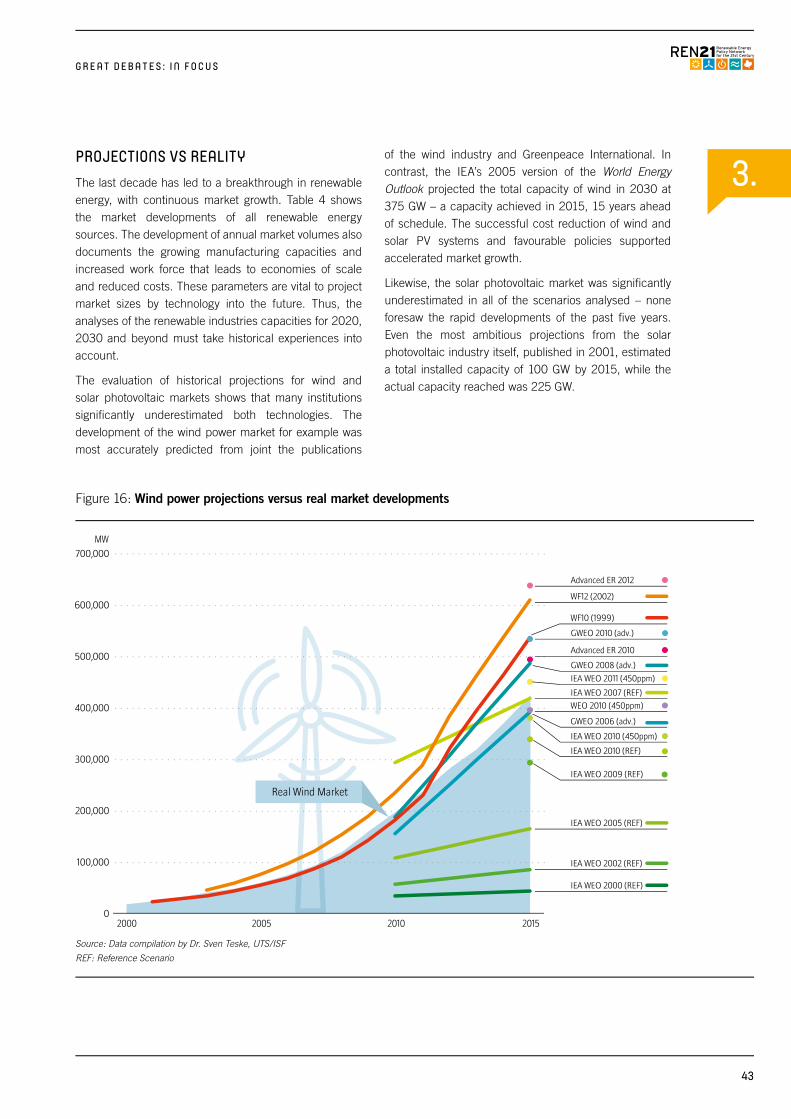
3.
MW
700,000
600,000
500,000
400,000
300,000
200,000
100,000
02000 2005 2010 2015
Real Wind Market
Advanced ER 2012
GWEO 2006 (adv.)
Advanced ER 2010
WEO 2010 (450ppm)
IEA WEO 2010 (450ppm)
IEA WEO 2011 (450ppm)
IEA WEO 2010 (REF)
IEA WEO 2009 (REF)
GWEO 2010 (adv.)
GWEO 2008 (adv.)
WF12 (2002)
IEA WEO 2007 (REF)
IEA WEO 2005 (REF)
IEA WEO 2002 (REF)
IEA WEO 2000 (REF)
WF10 (1999)
G R E A T D E B A T E S : I N F O C U S
PROJECTIONS VS REALITYThe last decade has led to a breakthrough in renewable energy, with continuous market growth. Table 4 shows the market developments of all renewable energy sources. The development of annual market volumes also documents the growing manufacturing capacities and increased work force that leads to economies of scale and reduced costs. These parameters are vital to project market sizes by technology into the future. Thus, the analyses of the renewable industries capacities for 2020, 2030 and beyond must take historical experiences into account.
The evaluation of historical projections for wind and solar photovoltaic markets shows that many institutions significantly underestimated both technologies. The development of the wind power market for example was most accurately predicted from joint the publications
of the wind industry and Greenpeace International. In contrast, the IEA’s 2005 version of the World Energy Outlook projected the total capacity of wind in 2030 at 375 GW – a capacity achieved in 2015, 15 years ahead of schedule. The successful cost reduction of wind and solar PV systems and favourable policies supported accelerated market growth.
Likewise, the solar photovoltaic market was significantly underestimated in all of the scenarios analysed – none foresaw the rapid developments of the past five years. Even the most ambitious projections from the solar photovoltaic industry itself, published in 2001, estimated a total installed capacity of 100 GW by 2015, while the actual capacity reached was 225 GW.
Figure 16: Wind power projections versus real market developments
Source: Data compilation by Dr. Sven Teske, UTS/ISF
REF: Reference Scenario
43
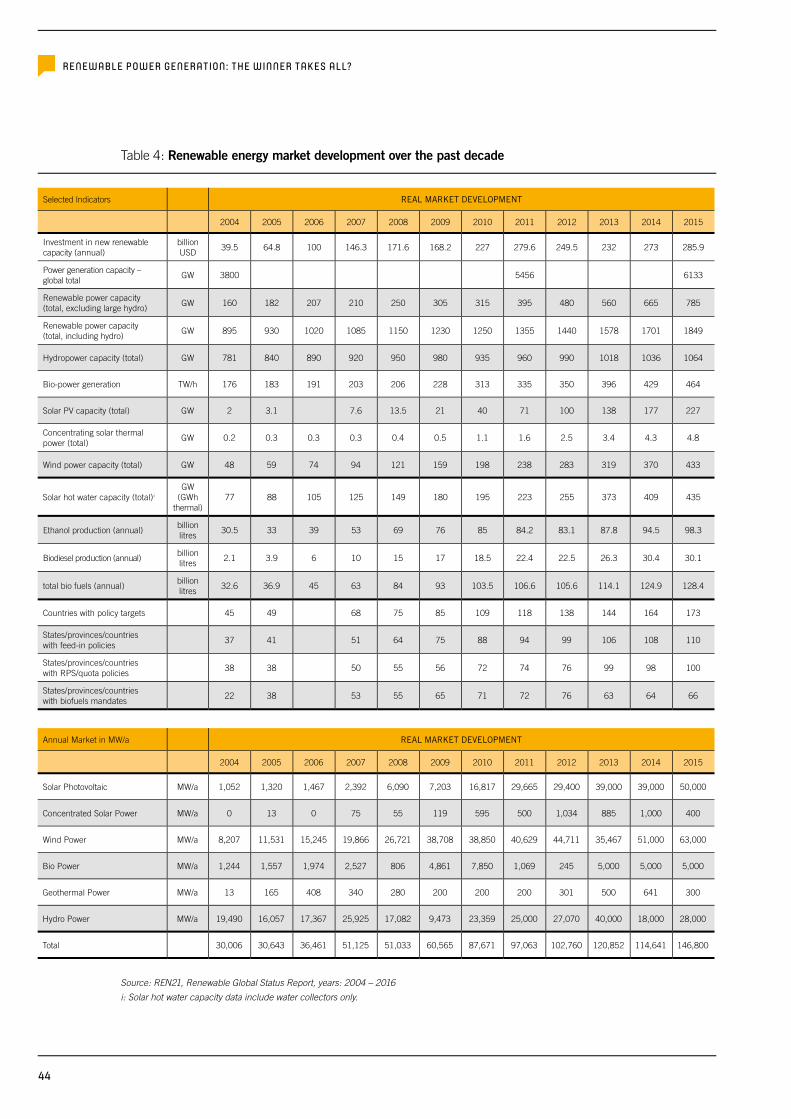
Selected lndicators REAL MARKET DEVELOPMENT
2004 2005 2006 2007 2008 2009 2010 2011 2012 2013 2014 2015
Investment in new renewable capacity (annual)
billionUSD
39.5 64.8 100 146.3 171.6 168.2 227 279.6 249.5 232 273 285.9
Power generation capacity – global total
GW 3800 5456 6133
Renewable power capacity (total, excluding large hydro)
GW 160 182 207 210 250 305 315 395 480 560 665 785
Renewable power capacity (total, including hydro)
GW 895 930 1020 1085 1150 1230 1250 1355 1440 1578 1701 1849
Hydropower capacity (total) GW 781 840 890 920 950 980 935 960 990 1018 1036 1064
Bio-power generation TW/h 176 183 191 203 206 228 313 335 350 396 429 464
Solar PV capacity (total) GW 2 3.1 7.6 13.5 21 40 71 100 138 177 227
Concentrating solar thermal power (total)
GW 0.2 0.3 0.3 0.3 0.4 0.5 1.1 1.6 2.5 3.4 4.3 4.8
Wind power capacity (total) GW 48 59 74 94 121 159 198 238 283 319 370 433
Solar hot water capacity (total)i
GW (GWh
thermal)77 88 105 125 149 180 195 223 255 373 409 435
Ethanol production (annual)billion litres
30.5 33 39 53 69 76 85 84.2 83.1 87.8 94.5 98.3
Biodiesel production (annual)billion litres
2.1 3.9 6 10 15 17 18.5 22.4 22.5 26.3 30.4 30.1
total bio fuels (annual)billion litres
32.6 36.9 45 63 84 93 103.5 106.6 105.6 114.1 124.9 128.4
Countries with policy targets 45 49 68 75 85 109 118 138 144 164 173
States/provinces/countries with feed-in policies
37 41 51 64 75 88 94 99 106 108 110
States/provinces/countries with RPS/quota policies
38 38 50 55 56 72 74 76 99 98 100
States/provinces/countries with biofuels mandates
22 38 53 55 65 71 72 76 63 64 66
Annual Market in MW/a REAL MARKET DEVELOPMENT
2004 2005 2006 2007 2008 2009 2010 2011 2012 2013 2014 2015
Solar Photovoltaic MW/a 1,052 1,320 1,467 2,392 6,090 7,203 16,817 29,665 29,400 39,000 39,000 50,000
Concentrated Solar Power MW/a 0 13 0 75 55 119 595 500 1,034 885 1,000 400
Wind Power MW/a 8,207 11,531 15,245 19,866 26,721 38,708 38,850 40,629 44,711 35,467 51,000 63,000
Bio Power MW/a 1,244 1,557 1,974 2,527 806 4,861 7,850 1,069 245 5,000 5,000 5,000
Geothermal Power MW/a 13 165 408 340 280 200 200 200 301 500 641 300
Hydro Power MW/a 19,490 16,057 17,367 25,925 17,082 9,473 23,359 25,000 27,070 40,000 18,000 28,000
Total 30,006 30,643 36,461 51,125 51,033 60,565 87,671 97,063 102,760 120,852 114,641 146,800
RENEWABLE POWER GENERATION: THE WINNER TAKES ALL?
Table 4: Renewable energy market development over the past decade
Source: REN21, Renewable Global Status Report, years: 2004 – 2016
i: Solar hot water capacity data include water collectors only.
44
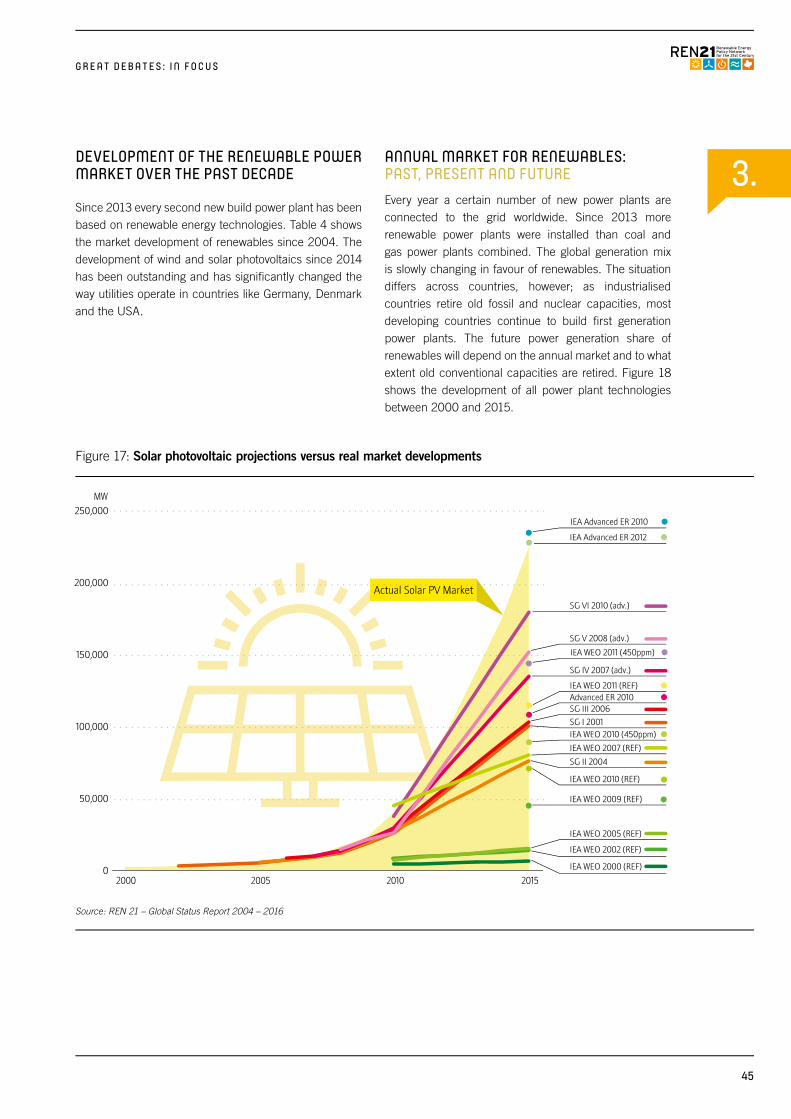
3.
MW
250,000
200,000
150,000
100,000
50,000
02000 2005 2010 2015
Actual Solar PV Market
IEA Advanced ER 2012
IEA WEO 2011 (450ppm)
IEA WEO 2010 (450ppm)
IEA WEO 2010 (REF)
SG II 2004
SG I 2001
SG III 2006
SG V 2008 (adv.)
SG VI 2010 (adv.)
SG IV 2007 (adv.)
IEA Advanced ER 2010
IEA WEO 2009 (REF)
IEA WEO 2007 (REF)
IEA WEO 2005 (REF)
IEA WEO 2002 (REF)
IEA WEO 2000 (REF)
Advanced ER 2010IEA WEO 2011 (REF)
G R E A T D E B A T E S : I N F O C U S
Figure 17: Solar photovoltaic projections versus real market developments
DEVELOPMENT OF THE RENEWABLE POWER MARKET OVER THE PAST DECADE
Since 2013 every second new build power plant has been based on renewable energy technologies. Table 4 shows the market development of renewables since 2004. The development of wind and solar photovoltaics since 2014 has been outstanding and has significantly changed the way utilities operate in countries like Germany, Denmark and the USA.
ANNUAL MARKET FOR RENEWABLES: PAST, PRESENT AND FUTUREEvery year a certain number of new power plants are connected to the grid worldwide. Since 2013 more renewable power plants were installed than coal and gas power plants combined. The global generation mix is slowly changing in favour of renewables. The situation differs across countries, however; as industrialised countries retire old fossil and nuclear capacities, most developing countries continue to build first generation power plants. The future power generation share of renewables will depend on the annual market and to what extent old conventional capacities are retired. Figure 18 shows the development of all power plant technologies between 2000 and 2015.
Source: REN 21 – Global Status Report 2004 – 2016
45
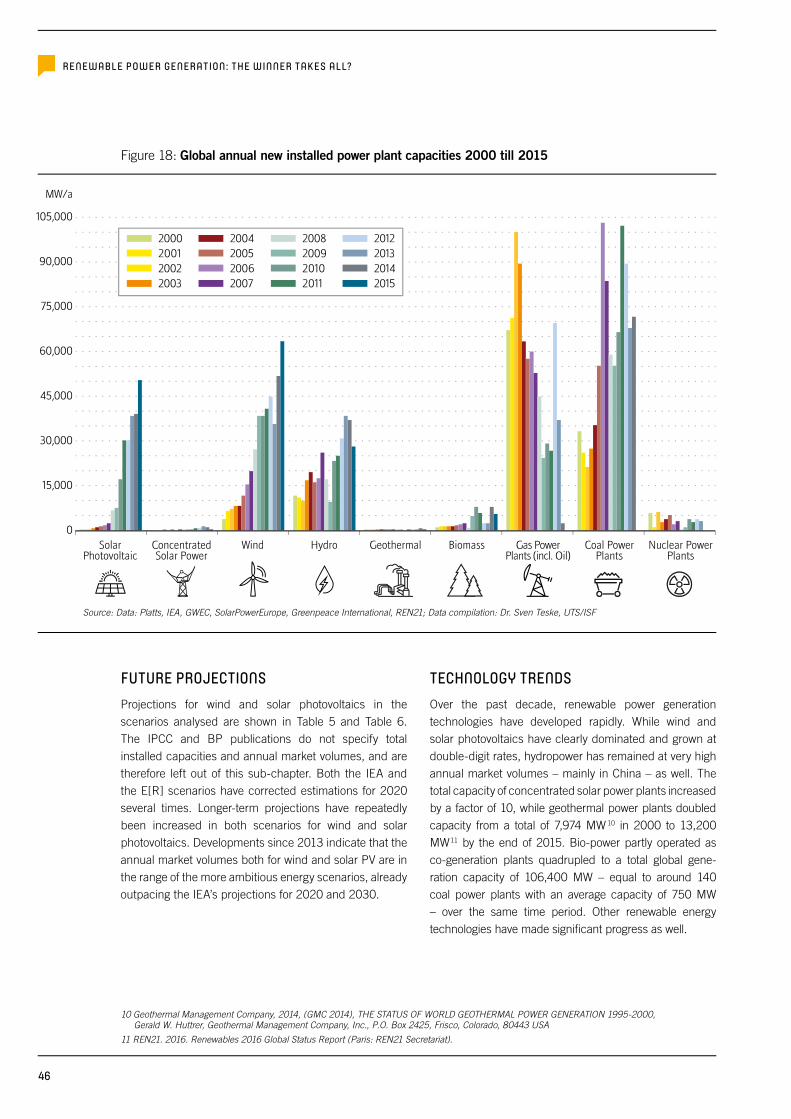
Source: Data: Platts, IEA, GWEC, SolarPowerEurope, Greenpeace International, REN21; Data compilation: Dr. Sven Teske, UTS/ISF
2000200120022003
2004200520062007
2008200920102011
2012201320142015
SolarPhotovoltaic
ConcentratedSolar Power
Wind Hydro Geothermal Biomass Gas PowerPlants (incl. Oil)
Coal PowerPlants
Nuclear PowerPlants
105,000
90,000
75,000
60,000
45,000
30,000
15,000
0
MW/a
RENEWABLE POWER GENERATION: THE WINNER TAKES ALL?
FUTURE PROJECTIONSProjections for wind and solar photovoltaics in the scenarios analysed are shown in Table 5 and Table 6. The IPCC and BP publications do not specify total installed capacities and annual market volumes, and are therefore left out of this sub-chapter. Both the IEA and the E[R] scenarios have corrected estimations for 2020 several times. Longer-term projections have repeatedly been increased in both scenarios for wind and solar photovoltaics. Developments since 2013 indicate that the annual market volumes both for wind and solar PV are in the range of the more ambitious energy scenarios, already outpacing the IEA’s projections for 2020 and 2030.
TECHNOLOGY TRENDSOver the past decade, renewable power generation technologies have developed rapidly. While wind and solar photovoltaics have clearly dominated and grown at double-digit rates, hydropower has remained at very high annual market volumes – mainly in China – as well. The total capacity of concentrated solar power plants increased by a factor of 10, while geothermal power plants doubled capacity from a total of 7,974 MW 10 in 2000 to 13,200 MW11 by the end of 2015. Bio-power partly operated as co-generation plants quadrupled to a total global gene-ration capacity of 106,400 MW – equal to around 140 coal power plants with an average capacity of 750 MW – over the same time period. Other renewable energy technologies have made significant progress as well.
Figure 18: Global annual new installed power plant capacities 2000 till 2015
10 Geothermal Management Company, 2014, (GMC 2014), THE STATUS OF WORLD GEOTHERMAL POWER GENERATION 1995-2000, Gerald W. Huttrer, Geothermal Management Company, Inc., P.O. Box 2425, Frisco, Colorado, 80443 USA
11 REN21. 2016. Renewables 2016 Global Status Report (Paris: REN21 Secretariat).
46
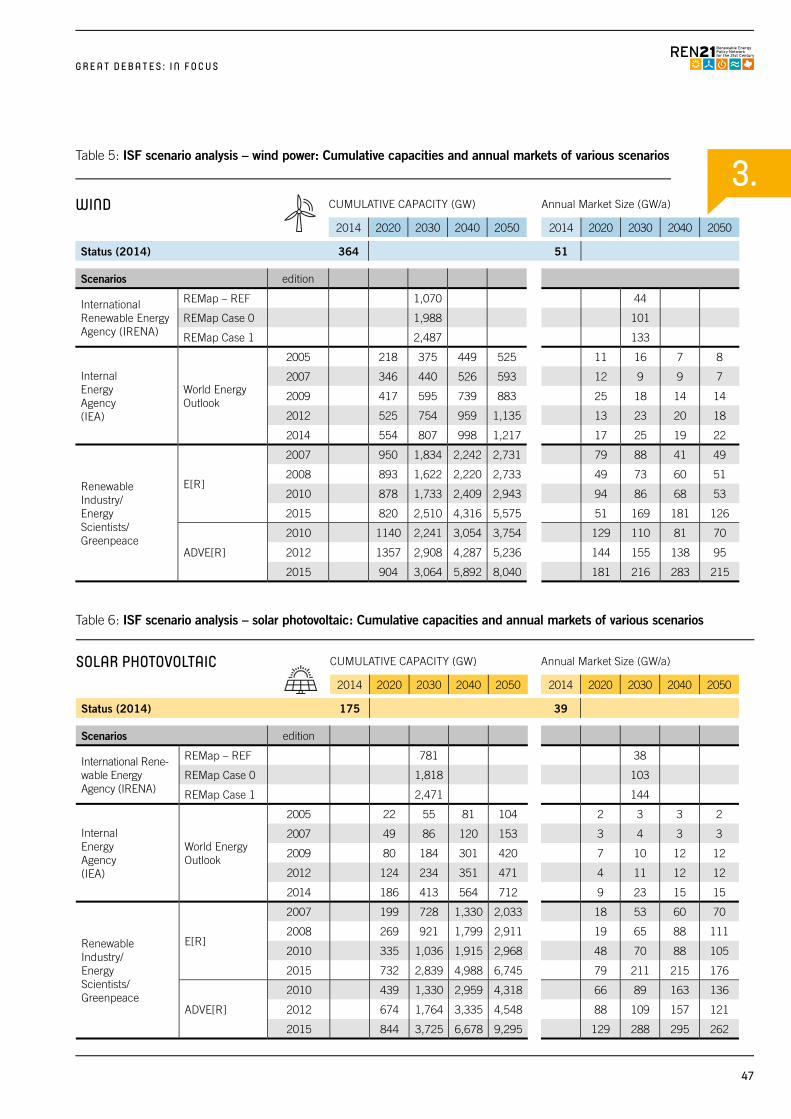
3.
SOLAR PHOTOVOLTAIC CUMULATIVE CAPACITY (GW) Annual Market Size (GW/a)
2014 2020 2030 2040 2050 2014 2020 2030 2040 2050
Status (2014) 175 39
Scenarios edition
International Rene-wable Energy Agency (IRENA)
REMap – REF 781 38
REMap Case 0 1,818 103
REMap Case 1 2,471 144
Internal Energy Agency(IEA)
World Energy Outlook
2005 22 55 81 104 2 3 3 2
2007 49 86 120 153 3 4 3 3
2009 80 184 301 420 7 10 12 12
2012 124 234 351 471 4 11 12 12
2014 186 413 564 712 9 23 15 15
Renewable Industry/Energy Scientists/Greenpeace
E[R]
2007 199 728 1,330 2,033 18 53 60 70
2008 269 921 1,799 2,911 19 65 88 111
2010 335 1,036 1,915 2,968 48 70 88 105
2015 732 2,839 4,988 6,745 79 211 215 176
ADVE[R]
2010 439 1,330 2,959 4,318 66 89 163 136
2012 674 1,764 3,335 4,548 88 109 157 121
2015 844 3,725 6,678 9,295 129 288 295 262
WIND CUMULATIVE CAPACITY (GW) Annual Market Size (GW/a)
2014 2020 2030 2040 2050 2014 2020 2030 2040 2050
Status (2014) 364 51
Scenarios edition
International Renewable Energy Agency (IRENA)
REMap – REF 1,070 44
REMap Case 0 1,988 101
REMap Case 1 2,487 133
Internal Energy Agency(IEA)
World Energy Outlook
2005 218 375 449 525 11 16 7 8
2007 346 440 526 593 12 9 9 7
2009 417 595 739 883 25 18 14 14
2012 525 754 959 1,135 13 23 20 18
2014 554 807 998 1,217 17 25 19 22
Renewable Industry/Energy Scientists/Greenpeace
E[R]
2007 950 1,834 2,242 2,731 79 88 41 49
2008 893 1,622 2,220 2,733 49 73 60 51
2010 878 1,733 2,409 2,943 94 86 68 53
2015 820 2,510 4,316 5,575 51 169 181 126
ADVE[R]
2010 1140 2,241 3,054 3,754 129 110 81 70
2012 1357 2,908 4,287 5,236 144 155 138 95
2015 904 3,064 5,892 8,040 181 216 283 215
G R E A T D E B A T E S : I N F O C U S
200
175
150
125
100
75
50
25
02004 2005 2006 2007 2008 2009 2010 2011 2012 2013 2014 2015
Countries withpolicy targets
States/provinces/countries withbiofuel mandates
States/provinces/countries with RPS/quota policies
States/provinces/countries with feed-in policies
200
175
150
125
100
75
50
25
02004 2005 2006 2007 2008 2009 2010 2011 2012 2013 2014 2015
Countries withpolicy targets
States/provinces/countries withbiofuel mandates
States/provinces/countries with RPS/quota policies
States/provinces/countries with feed-in policies
Table 5: ISF scenario analysis – wind power: Cumulative capacities and annual markets of various scenarios
Table 6: ISF scenario analysis – solar photovoltaic: Cumulative capacities and annual markets of various scenarios
47
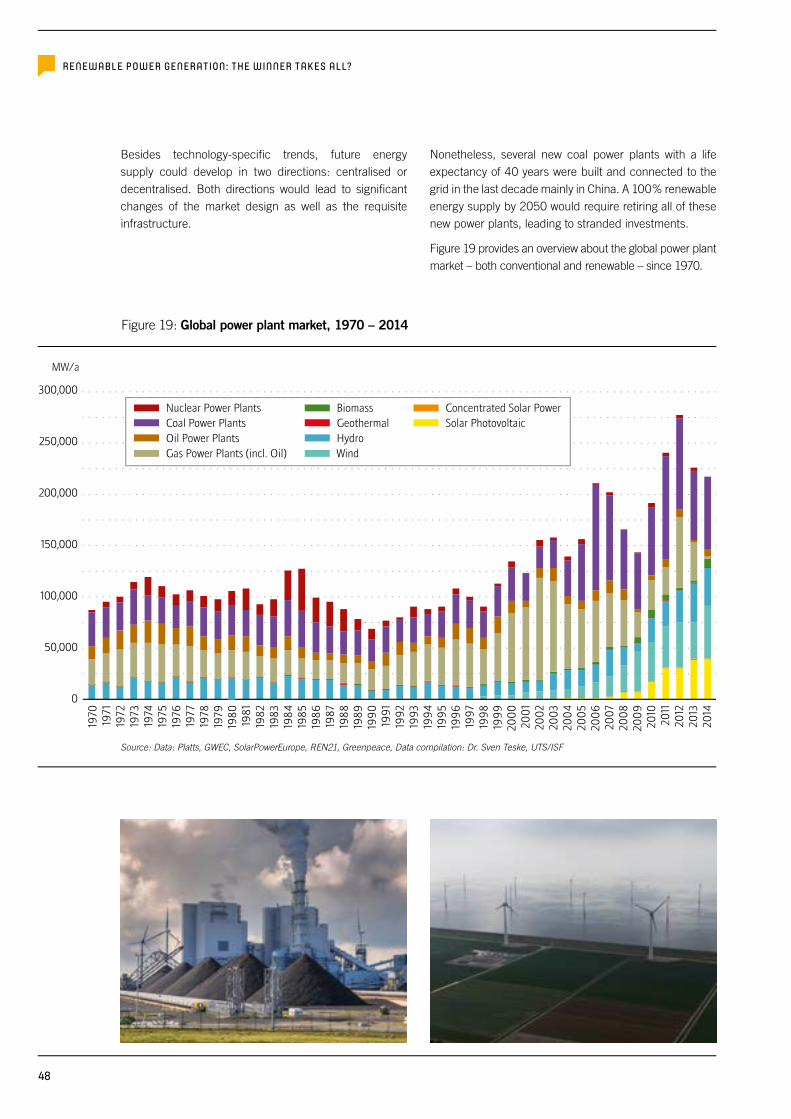
Nuclear Power Plants Coal Power PlantsOil Power PlantsGas Power Plants (incl. Oil)
BiomassGeothermalHydroWind
Concentrated Solar PowerSolar Photovoltaic
300,000
250,000
200,000
150,000
100,000
50,000
0
MW/a
1970
1971
1972
1973
1974
1975
1976
1977
1978
1979
1980
198
119
8219
8319
8419
8519
8619
8719
8819
8919
90
199
119
92
199
319
94
199
519
96
199
719
98
199
920
00
200
120
02
200
320
04
200
520
06
2007
200
820
09
2010
2011
2012
2013
2014
RENEWABLE POWER GENERATION: THE WINNER TAKES ALL?
Besides technology-specific trends, future energy supply could develop in two directions: centralised or decentralised. Both directions would lead to significant changes of the market design as well as the requisite infrastructure.
Nonetheless, several new coal power plants with a life expectancy of 40 years were built and connected to the grid in the last decade mainly in China. A 100% renewable energy supply by 2050 would require retiring all of these new power plants, leading to stranded investments.
Figure 19 provides an overview about the global power plant market – both conventional and renewable – since 1970.
Figure 19: Global power plant market, 1970 – 2014
Source: Data: Platts, GWEC, SolarPowerEurope, REN21, Greenpeace, Data compilation: Dr. Sven Teske, UTS/ISF
48
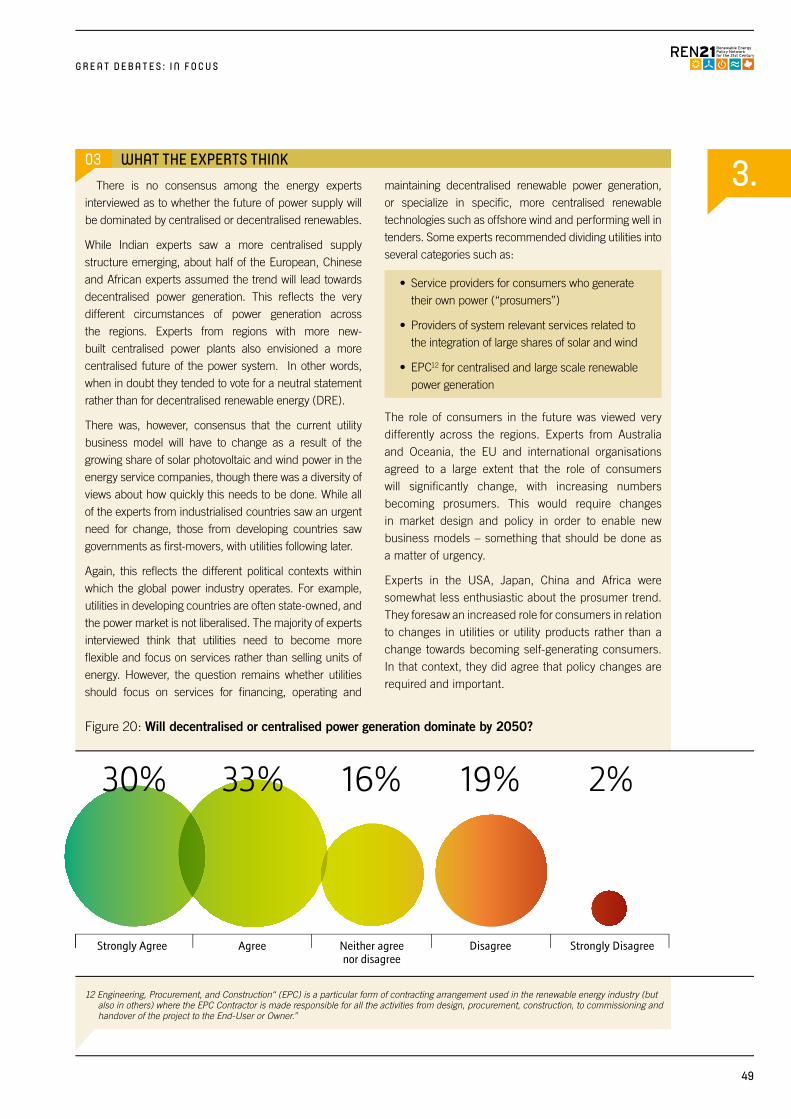
3.
Strongly Agree Agree Neither agreenor disagree
Disagree Strongly Disagree
30% 33% 16% 2%19%
G R E A T D E B A T E S : I N F O C U S
03 WHAT THE EXPERTS THINKThere is no consensus among the energy experts
interviewed as to whether the future of power supply will be dominated by centralised or decentralised renewables.
While Indian experts saw a more centralised supply structure emerging, about half of the European, Chinese and African experts assumed the trend will lead towards decentralised power generation. This reflects the very different circumstances of power generation across the regions. Experts from regions with more new-built centralised power plants also envisioned a more centralised future of the power system. In other words, when in doubt they tended to vote for a neutral statement rather than for decentralised renewable energy (DRE).
There was, however, consensus that the current utility business model will have to change as a result of the growing share of solar photovoltaic and wind power in the energy service companies, though there was a diversity of views about how quickly this needs to be done. While all of the experts from industrialised countries saw an urgent need for change, those from developing countries saw governments as first-movers, with utilities following later.
Again, this reflects the different political contexts within which the global power industry operates. For example, utilities in developing countries are often state-owned, and the power market is not liberalised. The majority of experts interviewed think that utilities need to become more flexible and focus on services rather than selling units of energy. However, the question remains whether utilities should focus on services for financing, operating and
maintaining decentralised renewable power generation, or specialize in specific, more centralised renewable technologies such as offshore wind and performing well in tenders. Some experts recommended dividing utilities into several categories such as:
• Service providers for consumers who generate their own power (“prosumers”)
• Providers of system relevant services related to the integration of large shares of solar and wind
• EPC12 for centralised and large scale renewable power generation
The role of consumers in the future was viewed very differently across the regions. Experts from Australia and Oceania, the EU and international organisations agreed to a large extent that the role of consumers will significantly change, with increasing numbers becoming prosumers. This would require changes in market design and policy in order to enable new business models – something that should be done as a matter of urgency.
Experts in the USA, Japan, China and Africa were somewhat less enthusiastic about the prosumer trend. They foresaw an increased role for consumers in relation to changes in utilities or utility products rather than a change towards becoming self-generating consumers. In that context, they did agree that policy changes are required and important.
12 Engineering, Procurement, and Construction“ (EPC) is a particular form of contracting arrangement used in the renewable energy industry (but also in others) where the EPC Contractor is made responsible for all the activities from design, procurement, construction, to commissioning and handover of the project to the End-User or Owner.”
Figure 20: Will decentralised or centralised power generation dominate by 2050?
49
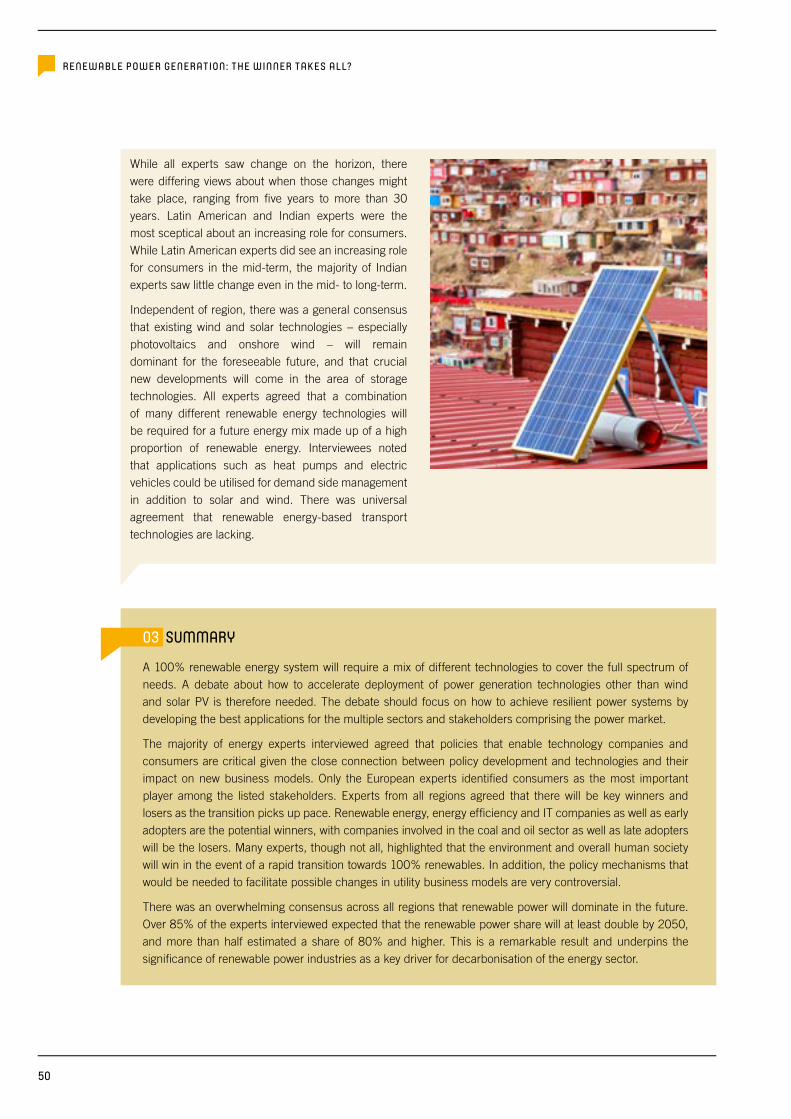
RENEWABLE POWER GENERATION: THE WINNER TAKES ALL?
While all experts saw change on the horizon, there were differing views about when those changes might take place, ranging from five years to more than 30 years. Latin American and Indian experts were the most sceptical about an increasing role for consumers. While Latin American experts did see an increasing role for consumers in the mid-term, the majority of Indian experts saw little change even in the mid- to long-term.
Independent of region, there was a general consensus that existing wind and solar technologies – especially photovoltaics and onshore wind – will remain dominant for the foreseeable future, and that crucial new developments will come in the area of storage technologies. All experts agreed that a combination of many different renewable energy technologies will be required for a future energy mix made up of a high proportion of renewable energy. Interviewees noted that applications such as heat pumps and electric vehicles could be utilised for demand side management in addition to solar and wind. There was universal agreement that renewable energy-based transport technologies are lacking.
03 SUMMARY
A 100% renewable energy system will require a mix of different technologies to cover the full spectrum of needs. A debate about how to accelerate deployment of power generation technologies other than wind and solar PV is therefore needed. The debate should focus on how to achieve resilient power systems by developing the best applications for the multiple sectors and stakeholders comprising the power market.
The majority of energy experts interviewed agreed that policies that enable technology companies and consumers are critical given the close connection between policy development and technologies and their impact on new business models. Only the European experts identified consumers as the most important player among the listed stakeholders. Experts from all regions agreed that there will be key winners and losers as the transition picks up pace. Renewable energy, energy efficiency and IT companies as well as early adopters are the potential winners, with companies involved in the coal and oil sector as well as late adopters will be the losers. Many experts, though not all, highlighted that the environment and overall human society will win in the event of a rapid transition towards 100% renewables. In addition, the policy mechanisms that would be needed to facilitate possible changes in utility business models are very controversial.
There was an overwhelming consensus across all regions that renewable power will dominate in the future. Over 85% of the experts interviewed expected that the renewable power share will at least double by 2050, and more than half estimated a share of 80% and higher. This is a remarkable result and underpins the significance of renewable power industries as a key driver for decarbonisation of the energy sector.
50

4. G R E A T D E B A T E S : I N F O C U S
n INTRODUCTIONAlthough heating accounts for more than 40% of total
final energy demand – more than the entire power sector
– it does not rank high on the agenda in energy debates.
Policies for the heating sector must address both supply
and demand, and account for major differences between
home and office heating (which is climate/weather
dependent) and industrial process heating (which is not).
The good news is that heating technologies can help
integrate variable solar and wind power into the system
with a range of technology options.
n SNAPSHOT 2013In 2013 there was much less awareness about the role of
renewables in the heating sector and was not specifically
discussed in the 2013 GFR.
n WHERE WE ARE TODAY: THE HEATING SECTOR
There has been little change over the last three years
about how renewables could transform the heating
sector, and what technologies could best be utilised.
That said, there is growing discussion about increased
electrification of heating spurred in large part by the
increasing shares of wind and solar photovoltaics, and
the need for technical measures to integrate those into
the power grid. Notably, storage for thermal loads is less
costly than electricity storage.
Still, compared to renewable power generation which
continues to enjoy double-digit growth rates, renewable
heating and cooling technologies have grown at a much
slower pace. This is partly due to the decentralised and
technical diversity of heating applications, but also to
the multitude of decision-making processes – primarily
at the customer level. More complex and therefore fewer renewable energy support policies have also hindered growth in this sector.
In 2015, energy use for heat accounted for 40% of the total world final energy demand (GSR 2016), with the overall global consumption of heat energy over the past decade growing at an average annual rate of just under 1%. The increasing number of highly energy efficient buildings and passive solar architecture has contributed to lower demands for heating. Demand for cooling, on the other hand, is increasing at a much faster rate due to improved energy access – mainly in developing countries with warm climates – and as a result of rising average global temperatures.
In the building sector, biomass and solar thermal energy account for the vast majority of modern renewable heat. Unlike the power sector, the available statistical data for the heating sector is incomplete. However current estimates for the share of bio- and solar thermal energy supplying heat for buildings range from 7% to 10% of combined. With regard to the industrial sector, bioenergy dominates renewable heat production, accounting for around 10% of total demand.
4. THE FUTURE OF HEATING: THERMAL OR ELECTRICAL APPLICATIONS?
51
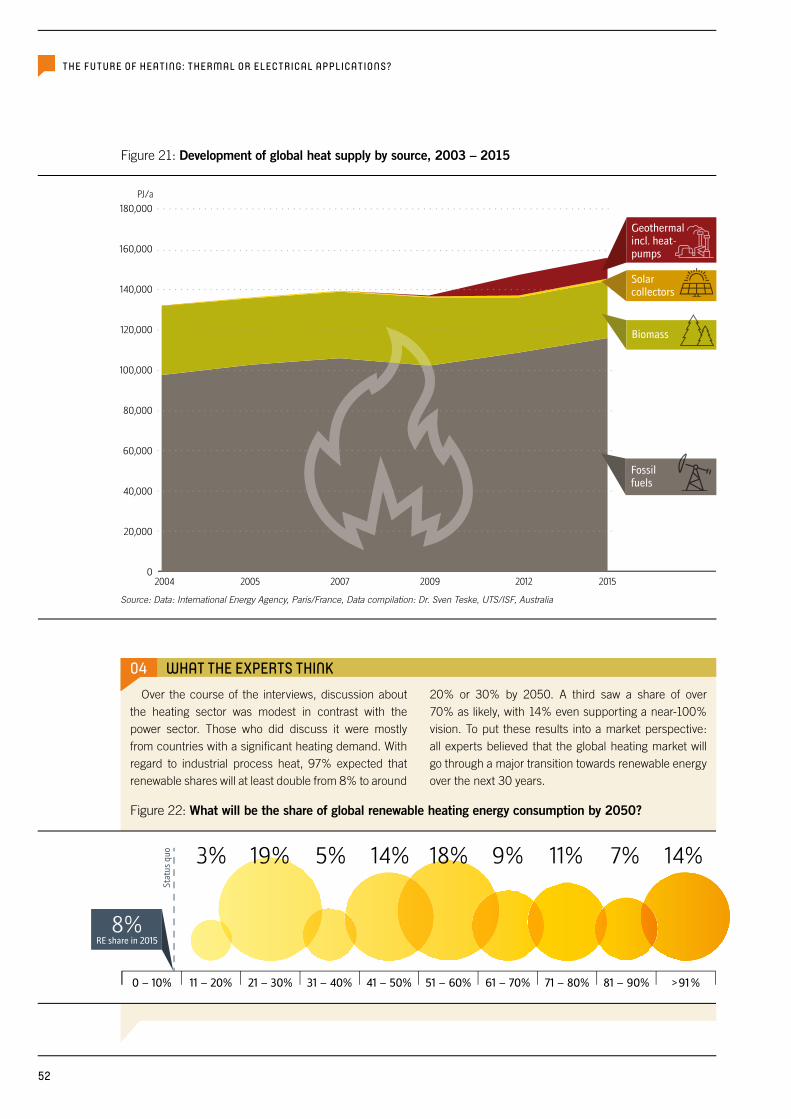
0 – 10% 11 – 20% 21 – 30% 31 – 40% 41 – 50% 51 – 60% 61 – 70% 71 – 80% 81 – 90% > 91 %
14%7%11%18%14%19%3% 5% 9%
Stat
us q
uo
RE share in 20158%
180,000
160,000
140,000
120,000
100,000
80,000
60,000
40,000
20,000
02004 2005 2007
PJ/a
2009 2012 2015
Solar collectors
Fossil fuels
Biomass
Geothermalincl. heat-pumps
THE FUTURE OF HEATING: THERMAL OR ELECTRICAL APPLICATIONS?
04 WHAT THE EXPERTS THINKOver the course of the interviews, discussion about
the heating sector was modest in contrast with the power sector. Those who did discuss it were mostly from countries with a significant heating demand. With regard to industrial process heat, 97% expected that renewable shares will at least double from 8% to around
20% or 30% by 2050. A third saw a share of over 70% as likely, with 14% even supporting a near-100% vision. To put these results into a market perspective: all experts believed that the global heating market will go through a major transition towards renewable energy over the next 30 years.
Figure 21: Development of global heat supply by source, 2003 – 2015
Source: Data: International Energy Agency, Paris/France, Data compilation: Dr. Sven Teske, UTS/ISF, Australia
Figure 22: What will be the share of global renewable heating energy consumption by 2050?
52

4.
Strongly Agree Agree Neither agreenor disagree
Disagree Strongly Disagree
10% 29% 20% 39% 2%
G R E A T D E B A T E S : I N F O C U S
04 WHAT THE EXPERTS THINKThe interviewees did not share a common view
about whether the heating sector will move towards high electrification. About one-third believed that there will be increased electrification while just over a third
disagreed. The rest were undecided. The future of the heating sector therefore requires more research and attention from policy makers, particularly as heating consumes a significant share of global energy demand.
TECHNOLOGY TRENDS: HEATINGThe main sources for renewable heating are bio, geothermal and solar energy technologies that produce direct heat. However, there are also co- and/or tri-generation technologies for geothermal- and biomass available, which can produce power, heat and cooling in parallel. In recent years, renewable heating technologies have competed against electrical heating systems, mainly heat pumps, which are operated with electricity from solar photovoltaic and wind energy. This kind of heat production is used increasingly to help integrate large shares of solar and wind power into grids, to shift demand and as a storage medium for surplus electricity. Increased demand for cooling is almost exclusively supplied by electrical air conditioning systems. Dedicated renewable cooling systems, such as solar cooling technologies, fill only a small market niche.
Energy efficient buildings are reducing the demand for heating globally. The number of net-zero-energy buildings is continuing to rise, as are improvements in the efficiency of industrial processes, building materials and heating and cooling systems. The remaining heat demand is often supplied by electrical systems that are able to provide high and low temperature acclimatisation of buildings.
While the growth of renewable heating technologies is hindered by increased electrification and lower demand, one possible growth sector is district-heating systems in countries with cold winters and heating requirements over several months. Solar thermal collectors as well as renewable heat from other sources can feed in to a local pipe system over several square kilometres, distributing heat to nearby buildings and for commercial purposes. Such systems are particularly useful for power systems with high shares of solar photovoltaic and wind power as district heating systems help to store energy and organize supply- and demand-side management.
Figure 23: The electrification of the heating sector will continue and will lead to an almost complete electrification
53

THE FUTURE OF HEATING: THERMAL OR ELECTRICAL APPLICATIONS?
04 SUMMARY
58% of the experts agreed that thermal renewable heating technologies such as solar thermal collectors, geothermal and bio energy will remain the backbone of (process-) heating supply for the coming decades. 7% disagreed, and 35% were undecided.
There was no dominant opinion about how the heating sector will evolve. The only overall agreement – across all regions – was that the technology choices are still wide open. There are opportunities for new technologies to enter the market or for established technologies to increase their market shares. The future mix is of major importance when it comes to energy system design, however. Electric heat pumps could be used for demand-side management to help integrate more solar PV and wind power, just as district heating systems could distribute solar heat and heat from dispatchable bio and geothermal plants.
Both systems would be beneficial for power systems bringing on-line high shares of variable generation, but each would require different investments in infrastructure. Depending on the technologies chosen, district heating systems, power- or gas and hydrogen distribution grids need to be adapted and/or expanded. A long-term vision for the best solutions in specific places is needed to steer policies in a uniform direction, in order to start building the necessary infrastructure which can take years to put in place.
54
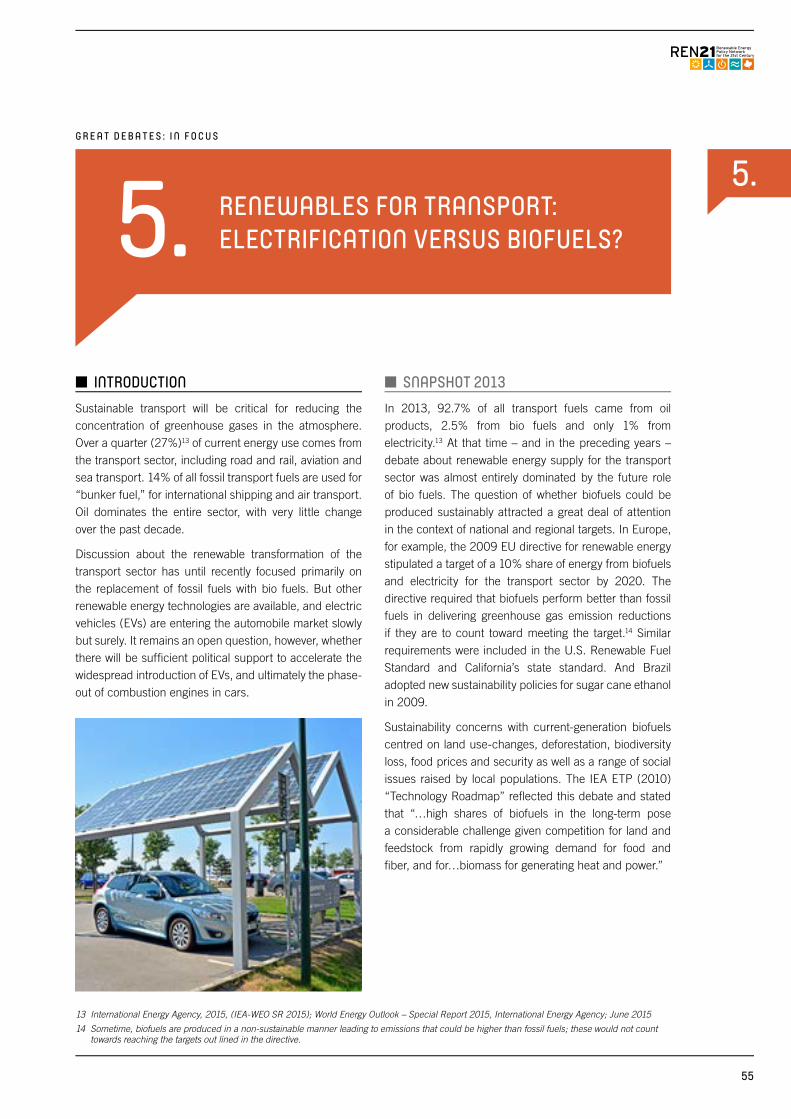
5. G R E A T D E B A T E S : I N F O C U S
n INTRODUCTIONSustainable transport will be critical for reducing the concentration of greenhouse gases in the atmosphere. Over a quarter (27%)13 of current energy use comes from the transport sector, including road and rail, aviation and sea transport. 14% of all fossil transport fuels are used for “bunker fuel,” for international shipping and air transport. Oil dominates the entire sector, with very little change over the past decade.
Discussion about the renewable transformation of the transport sector has until recently focused primarily on the replacement of fossil fuels with bio fuels. But other renewable energy technologies are available, and electric vehicles (EVs) are entering the automobile market slowly but surely. It remains an open question, however, whether there will be sufficient political support to accelerate the widespread introduction of EVs, and ultimately the phase-out of combustion engines in cars.
n SNAPSHOT 2013In 2013, 92.7% of all transport fuels came from oil products, 2.5% from bio fuels and only 1% from electricity.13 At that time – and in the preceding years – debate about renewable energy supply for the transport sector was almost entirely dominated by the future role of bio fuels. The question of whether biofuels could be produced sustainably attracted a great deal of attention in the context of national and regional targets. In Europe, for example, the 2009 EU directive for renewable energy stipulated a target of a 10% share of energy from biofuels and electricity for the transport sector by 2020. The directive required that biofuels perform better than fossil fuels in delivering greenhouse gas emission reductions if they are to count toward meeting the target.14 Similar requirements were included in the U.S. Renewable Fuel Standard and California’s state standard. And Brazil adopted new sustainability policies for sugar cane ethanol in 2009.
Sustainability concerns with current-generation biofuels centred on land use-changes, deforestation, biodiversity loss, food prices and security as well as a range of social issues raised by local populations. The IEA ETP (2010) “Technology Roadmap” reflected this debate and stated that “…high shares of biofuels in the long-term pose a considerable challenge given competition for land and feedstock from rapidly growing demand for food and fiber, and for…biomass for generating heat and power.”
5. RENEWABLES FOR TRANSPORT: ELECTRIFICATION VERSUS BIOFUELS?
13 International Energy Agency, 2015, (IEA-WEO SR 2015); World Energy Outlook – Special Report 2015, International Energy Agency; June 2015
14 Sometime, biofuels are produced in a non-sustainable manner leading to emissions that could be higher than fossil fuels; these would not count towards reaching the targets out lined in the directive.
55
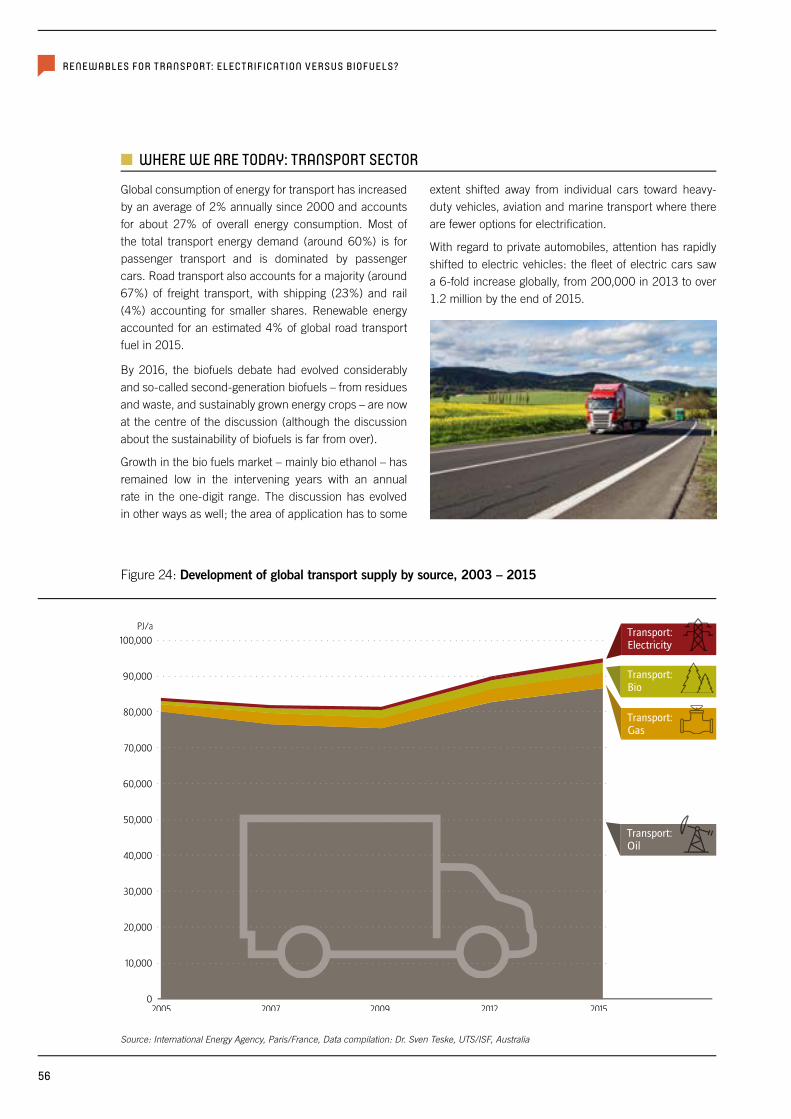
100,000
90,000
80,000
70,000
60,000
50,000
40,000
30,000
20,000
10,000
02005 2007 2009 2012 2015
PJ/a
Transport:Gas
Transport:Oil
Transport:Electricity
Transport:Bio
RENEWABLES FOR TRANSPORT: ELECTRIFICATION VERSUS BIOFUELS?
Figure 24: Development of global transport supply by source, 2003 – 2015
n WHERE WE ARE TODAY: TRANSPORT SECTOR
Global consumption of energy for transport has increased by an average of 2% annually since 2000 and accounts for about 27% of overall energy consumption. Most of the total transport energy demand (around 60%) is for passenger transport and is dominated by passenger cars. Road transport also accounts for a majority (around 67%) of freight transport, with shipping (23%) and rail (4%) accounting for smaller shares. Renewable energy accounted for an estimated 4% of global road transport fuel in 2015.
By 2016, the biofuels debate had evolved considerably and so-called second-generation biofuels – from residues and waste, and sustainably grown energy crops – are now at the centre of the discussion (although the discussion about the sustainability of biofuels is far from over).
Growth in the bio fuels market – mainly bio ethanol – has remained low in the intervening years with an annual rate in the one-digit range. The discussion has evolved in other ways as well; the area of application has to some
extent shifted away from individual cars toward heavy-duty vehicles, aviation and marine transport where there are fewer options for electrification.
With regard to private automobiles, attention has rapidly shifted to electric vehicles: the fleet of electric cars saw a 6-fold increase globally, from 200,000 in 2013 to over 1.2 million by the end of 2015.
Source: International Energy Agency, Paris/France, Data compilation: Dr. Sven Teske, UTS/ISF, Australia
56
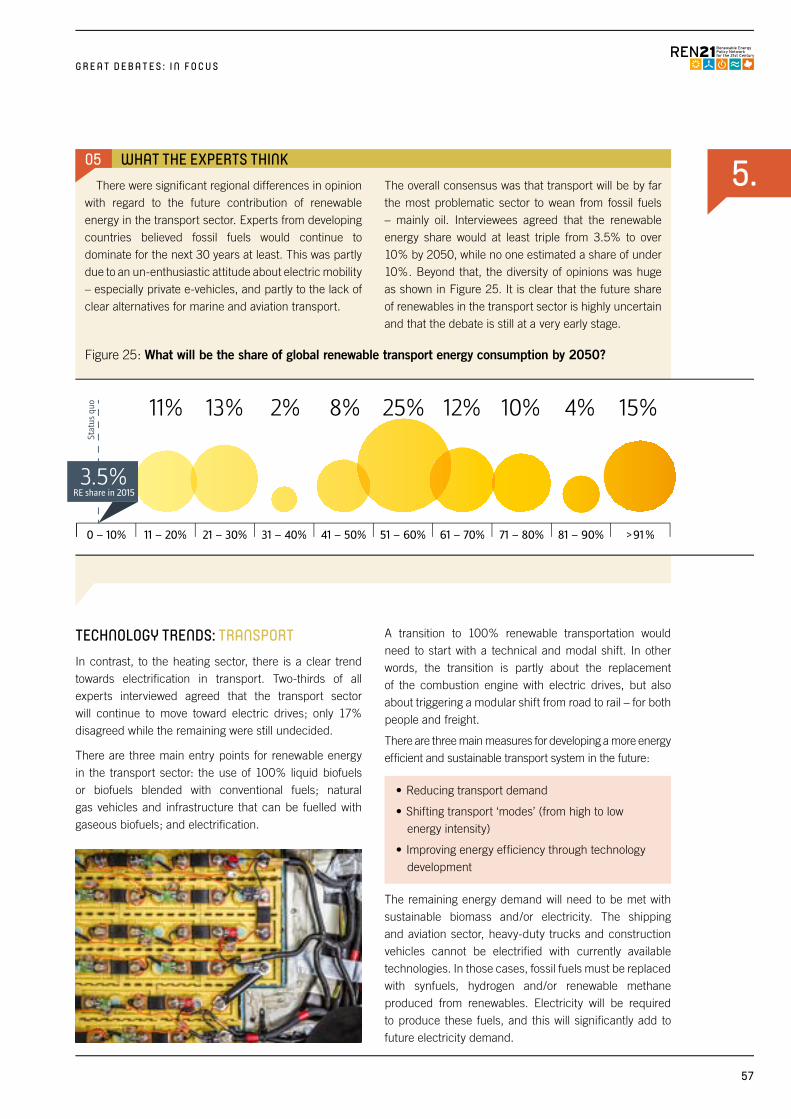
Figure 25: What will be the share of global renewable transport energy consumption by 2050?
5.
0 – 10% 11 – 20% 21 – 30% 31 – 40% 41 – 50% 51 – 60% 61 – 70% 71 – 80% 81 – 90% > 91 %
15%4%10%25%8%13%11% 2% 12%
Stat
us q
uo
RE share in 20153.5%
G R E A T D E B A T E S : I N F O C U S
05 WHAT THE EXPERTS THINKThere were significant regional differences in opinion
with regard to the future contribution of renewable energy in the transport sector. Experts from developing countries believed fossil fuels would continue to dominate for the next 30 years at least. This was partly due to an un-enthusiastic attitude about electric mobility – especially private e-vehicles, and partly to the lack of clear alternatives for marine and aviation transport.
The overall consensus was that transport will be by far the most problematic sector to wean from fossil fuels – mainly oil. Interviewees agreed that the renewable energy share would at least triple from 3.5% to over 10% by 2050, while no one estimated a share of under 10%. Beyond that, the diversity of opinions was huge as shown in Figure 25. It is clear that the future share of renewables in the transport sector is highly uncertain and that the debate is still at a very early stage.
TECHNOLOGY TRENDS: TRANSPORTIn contrast, to the heating sector, there is a clear trend towards electrification in transport. Two-thirds of all experts interviewed agreed that the transport sector will continue to move toward electric drives; only 17% disagreed while the remaining were still undecided.
There are three main entry points for renewable energy in the transport sector: the use of 100% liquid biofuels or biofuels blended with conventional fuels; natural gas vehicles and infrastructure that can be fuelled with gaseous biofuels; and electrification.
A transition to 100% renewable transportation would need to start with a technical and modal shift. In other words, the transition is partly about the replacement of the combustion engine with electric drives, but also about triggering a modular shift from road to rail – for both people and freight.
There are three main measures for developing a more energy efficient and sustainable transport system in the future:
• Reducing transport demand
• Shifting transport ‘modes’ (from high to low energy intensity)
• Improving energy efficiency through technology development
The remaining energy demand will need to be met with sustainable biomass and/or electricity. The shipping and aviation sector, heavy-duty trucks and construction vehicles cannot be electrified with currently available technologies. In those cases, fossil fuels must be replaced with synfuels, hydrogen and/or renewable methane produced from renewables. Electricity will be required to produce these fuels, and this will significantly add to future electricity demand.
57
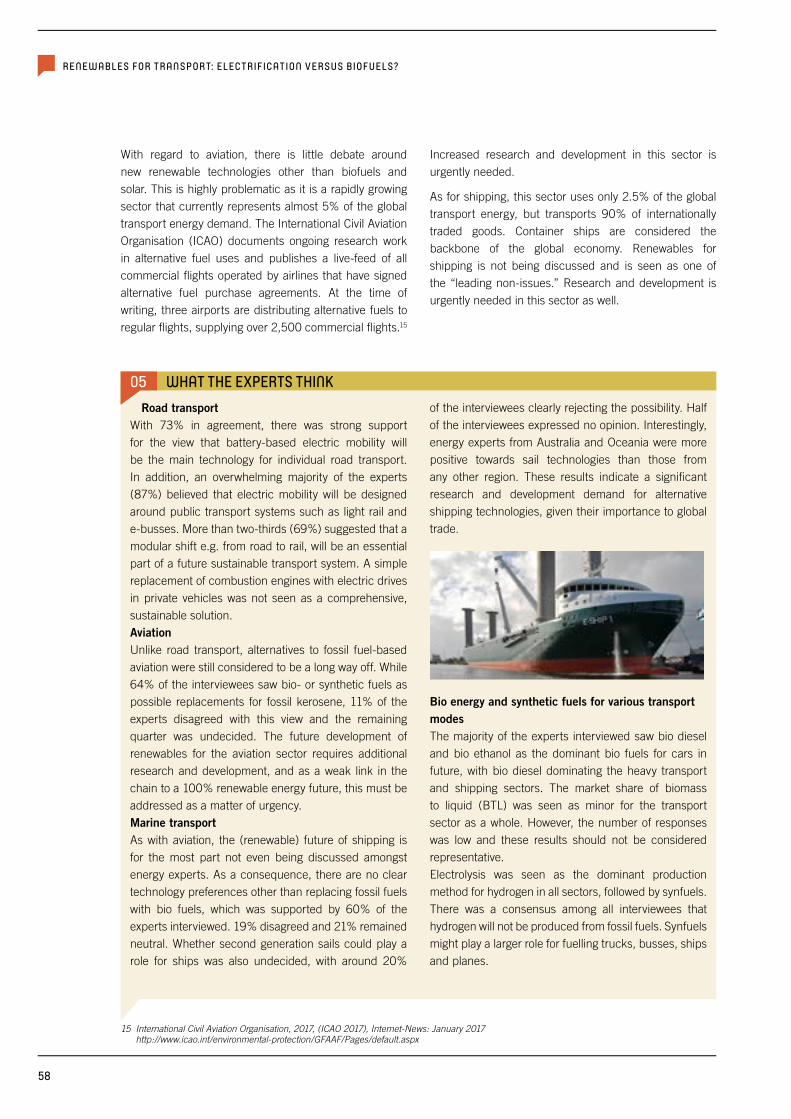
RENEWABLES FOR TRANSPORT: ELECTRIFICATION VERSUS BIOFUELS?
With regard to aviation, there is little debate around new renewable technologies other than biofuels and solar. This is highly problematic as it is a rapidly growing sector that currently represents almost 5% of the global transport energy demand. The International Civil Aviation Organisation (ICAO) documents ongoing research work in alternative fuel uses and publishes a live-feed of all commercial flights operated by airlines that have signed alternative fuel purchase agreements. At the time of writing, three airports are distributing alternative fuels to regular flights, supplying over 2,500 commercial flights.15
Increased research and development in this sector is urgently needed.
As for shipping, this sector uses only 2.5% of the global transport energy, but transports 90% of internationally traded goods. Container ships are considered the backbone of the global economy. Renewables for shipping is not being discussed and is seen as one of the “leading non-issues.” Research and development is urgently needed in this sector as well.
05 WHAT THE EXPERTS THINKRoad transport
With 73% in agreement, there was strong support for the view that battery-based electric mobility will be the main technology for individual road transport. In addition, an overwhelming majority of the experts (87%) believed that electric mobility will be designed around public transport systems such as light rail and e-busses. More than two-thirds (69%) suggested that a modular shift e.g. from road to rail, will be an essential part of a future sustainable transport system. A simple replacement of combustion engines with electric drives in private vehicles was not seen as a comprehensive, sustainable solution.Aviation Unlike road transport, alternatives to fossil fuel-based aviation were still considered to be a long way off. While 64% of the interviewees saw bio- or synthetic fuels as possible replacements for fossil kerosene, 11% of the experts disagreed with this view and the remaining quarter was undecided. The future development of renewables for the aviation sector requires additional research and development, and as a weak link in the chain to a 100% renewable energy future, this must be addressed as a matter of urgency.Marine transportAs with aviation, the (renewable) future of shipping is for the most part not even being discussed amongst energy experts. As a consequence, there are no clear technology preferences other than replacing fossil fuels with bio fuels, which was supported by 60% of the experts interviewed. 19% disagreed and 21% remained neutral. Whether second generation sails could play a role for ships was also undecided, with around 20%
of the interviewees clearly rejecting the possibility. Half of the interviewees expressed no opinion. Interestingly, energy experts from Australia and Oceania were more positive towards sail technologies than those from any other region. These results indicate a significant research and development demand for alternative shipping technologies, given their importance to global trade.
Bio energy and synthetic fuels for various transport modesThe majority of the experts interviewed saw bio diesel and bio ethanol as the dominant bio fuels for cars in future, with bio diesel dominating the heavy transport and shipping sectors. The market share of biomass to liquid (BTL) was seen as minor for the transport sector as a whole. However, the number of responses was low and these results should not be considered representative.Electrolysis was seen as the dominant production method for hydrogen in all sectors, followed by synfuels. There was a consensus among all interviewees that hydrogen will not be produced from fossil fuels. Synfuels might play a larger role for fuelling trucks, busses, ships and planes.
15 International Civil Aviation Organisation, 2017, (ICAO 2017), Internet-News: January 2017 http://www.icao.int/environmental-protection/GFAAF/Pages/default.aspx
58

5.
G R E A T D E B A T E S : I N F O C U S
RENEWABLE ELECTRICITY FOR TRANSPORT Energy efficiency improvements (designing smaller and lighter vehicles, for example), transport mode changes from individual to public transport and the introduction of e-mobility will pave the way towards increasing the share of renewable energy in the transport sector. It should be noted that e-mobility refers not only to private electric cars, but also to electrically powered trains, subways, buses and taxis. Though still limited, there are a growing number of initiatives around the world linking electric transport systems with renewable energy sources, particularly at the city and regional levels.
E-mobility and the effect on power demandThe European Environment Agency (EEA) recently commissioned an assessment that calculated the future impact of greater electric vehicle use on Europe’s energy system, and associated emissions from the road transport and energy sectors.16 The EEA assumed that the share of electric vehicles in Europe will rise to 80% by 2050, raising electricity demand significantly. According to this research, the share of Europe‘s total electricity supply consumed by electric vehicles will increase from approximately 0.03% in 2014 to around 4-5% by 2030 and 9.5% by 2050.
By 2050, an additional 150 GW of power plant capacity would be needed in order to charge all electric cars within the European Union. Furthermore, this additional energy will need to be integrated into the grid infrastructure. Critical conversations need to be had about how much electricity will be needed, what type of generation will be used to cover this additional demand and how charging peaks can be managed.
CENTRALISED AND DECENTRALISED ELECTRIC MOBILITY MARKETS Electric vehicles:Electrification of the transport sector expanded during 2015, enabling greater integration of renewable energy in the form of electricity for trains, light rail, trams as well as two- and four-wheeled electric vehicles. The number of electric passenger vehicles (EVs) on the road increased, with key markets in China, Northern Europe and the United States. Manufacturers announced several new models of light-duty EVs with longer ranges (300 kilometres) that are expected to become more affordable in the coming years. 2015 also saw substantial developments in R&D for electrification of heavy-duty vehicles. Exploration of methods to integrate renewable energy into charging stations for electric cars expanded in 2015, although many projects are still in the pilot or demonstration phase, and integration remains relatively small-scale.
Centralised electric mobility – public transport for (mega) cities: Electric mobility is expanding in (mega) cities where a modular shift from individual to more efficient and convenient public transport systems powered by renewable electricity has become feasible within a short time frame and with currently available technologies. The transport of people in megacities and urban areas will have to be almost entirely reorganised and individual transport must be complemented by and substituted with public transport systems.
Merging centralised and decentralised electric mobility: Car sharing and public transport on demand are only the beginning of the transition needed for a system that carries more people more quickly and conveniently to their destinations while using less energy. Centralised public mobility infrastructure is expanding to decentralised individual transport technologies – such as shared cars, scooters and e-bikes – creating a new sector of mobility.
16 European Environment Agency, 2016, (EEA 2016), Electric vehicles and the energy sector – impacts on Europe‘s future emissions, September 2016; http://www.eea.europa.eu/themes/transport/electric-vehicles/electric-vehicles-and-energy
59

05 SUMMARY
RENEWABLES FOR TRANSPORT: ELECTRIFICATION VERSUS BIOFUELS?
05 WHAT THE EXPERTS THINK: ELECTRIC ROAD TRANSPORTInterviewees anticipated lithium batteries replacing
lead acid and redox flow batteries in all applications of e-mobility. Remarkably, most experts clearly stated that redox flow battery technology would only play a minor role in the transport sector. They were asked whether vehicle batteries would be charged primarily in a decentralised way via individual outlets (e.g. located at private facilities), and if so whether this would be managed by grid operators or individual customers, or whether they would be charged in a more centralised way with battery changing systems at filling stations for example. Experts clearly believed that individual charging points would prevail over battery exchange systems, and that individual outlets would be managed by grid operators in order to optimise the electricity demand for battery charging.
The debate about the possible role of renewable energy in the transport sector has shifted in recent years from bio fuels to electric mobility. Electric vehicles (EV) have taken centre stage, while the aviation and shipping sectors continue to receive little or no attention.
To achieve 100% renewable energy supply on a global scale it is therefore urgent that all areas of transport be included in the discussion. Even with the advancement toward electric drives, technologies for energy intensive road transport modes, such as heavy-duty trucks, and construction and mining vehicles are lagging far behind. For the aviation and marine shipping sectors, biofuels are currently among the only alternatives to fossil fuels under consideration.
The three key topics that should be included in any future debate about 100% renewables in this sector are:
a. How can the rise of e-mobility be organised and expanded to public transport? Experts across the globe agreed that a modular shift is required – not just a replacement of the combustion engine with electric drives.
b. What are the possibilities for renewables in aviation? There is an urgent need for increased research and development.
c. Shipping is the backbone of global freight transport. How can renewable energy be introduced in the marine sector?
During the course of this survey, renewable energy for ships was identified as one of the “leading non-issues.” Here too, research and development are urgently needed.
60
6. G R E A T D E B A T E S : I N F O C U S
n INTRODUCTIONThe power, transport and heating sectors are currently developing in separate silos, which on the surface makes sense given their different energy sources and infrastructure requirements. While the power sector is limited to the power grid, the heating sector relies primarily on gas grids (and in some cases district heating pipeline systems) and the transport sector is in a class of its own. The infrastructure for transport energy distribution (primarily oil-based) includes tankers, pipelines and filling stations. But with increased shares of renewables in the supply mix, siloed thinking no longer works. Public transport is already inextricably linked to the power sector with electrically powered trains, trams and metros, and this will only increase in future. A significantly increased share of electric vehicles will increase power demand, necessitating infrastructural changes in the power grid (see chapter 5 – Transport).
n SNAPSHOT 2013The two dominating debates with regard to the interconnection of sectors featured in the GFR 2013 were themselves deeply interconnected: 1) Whether the concept of “baseload” is meaningful for future energy systems; and 2) the future role of utilities.
Increasing market shares of solar photovoltaics and wind, and the uptake of batteries in power grids were directly influencing the debate about whether baseload generation power plants were needed.
The 2013 question, “Will utilities lead, follow, push back, or perish“ did not have one universal answer (it still doesn’t), but was and is dependent on individual circumstances, such as the policies and strategic directions determined by the leadership team of any given company.
n WHERE WE ARE TODAY: POWER UTILITIES AND SECTORIAL DIVIDES
More and more energy experts are convinced that “classical baseload-power plants” are a thing of the past and flexible power plants will gradually replace them. Renewable power generation – especially solar photovoltaics – can be located closer to consumers, generating electricity in small units where the demand is located. The capacity of a single centralised conventional power plant could in effect be distributed across several thousand locations.
Meanwhile with increasing shares of renewables, the business models and revenue streams of many existing utilities and energy companies have come under threat or stress. Some companies have already lost market shares and revenues, and have been forced to restructure. A significant change in the business models of traditional utilities is needed. With increased electrification, the power sector is likely to merge with the heating and transport sectors.
In many countries utilities are already beginning to adapt to this new situation. The two largest German utilities – E.on and RWE – both restructured in 2014/201517 and formed new business units which focus on renewables and energy services while the conventional fossil and nuclear part of the business has been moved to a separate company.
The German Federal Ministry for Economic Affairs and Energy (BMWi), which is responsible for energy policy in Germany, is currently developing a “Power Market 2.0” policy package that represents the most fundamental change for the German power market since it‘s liberalisation in the 1990s, adapting to the new reality that variable energy sources are dominating the
6. INTERCONNECTION OF SECTORS: SYSTEM THINKING REQUIRED
17 The Guardian, 2016, Intern-News: 4th January 2016, E.ON completes split of fossil fuel and renewable operations; https://www.theguardian.com/environment/2016/jan/04/eon-completes-split-of-fossil-fuel-and-renewable-operations
61
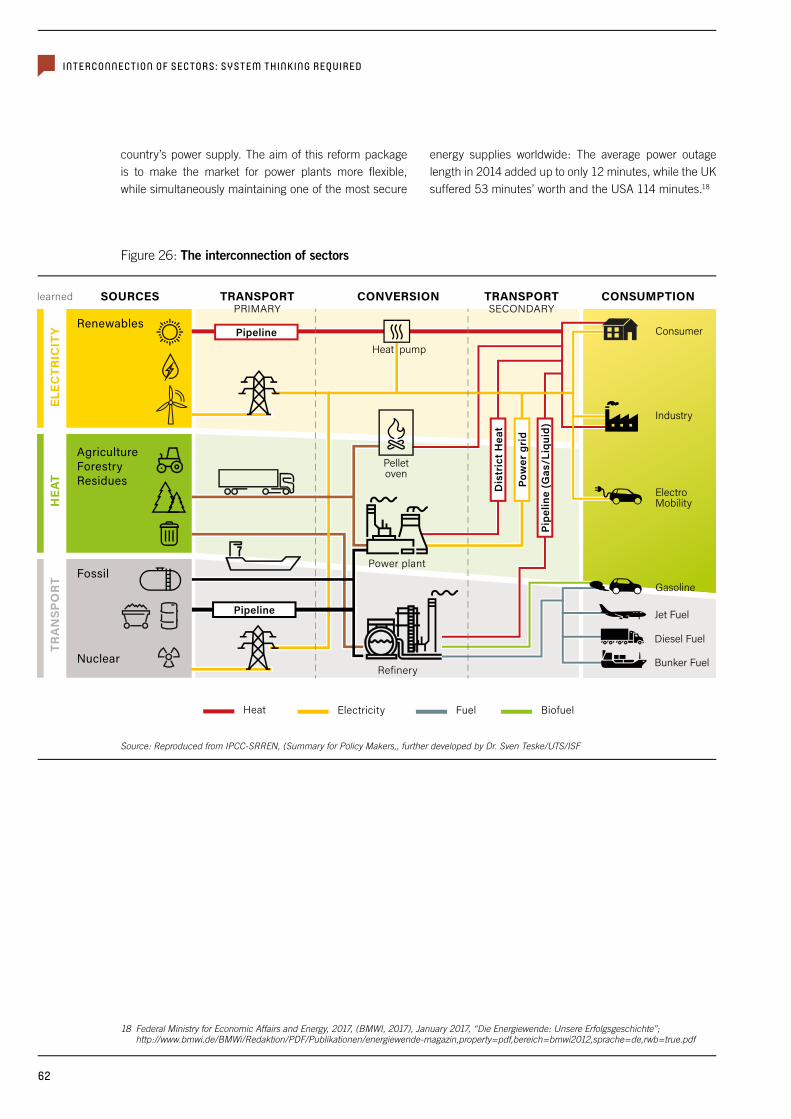
INTERCONNECTION OF SECTORS: SYSTEM THINKING REQUIRED
country’s power supply. The aim of this reform package is to make the market for power plants more flexible, while simultaneously maintaining one of the most secure
energy supplies worldwide: The average power outage length in 2014 added up to only 12 minutes, while the UK suffered 53 minutes’ worth and the USA 114 minutes.18
18 Federal Ministry for Economic Affairs and Energy, 2017, (BMWI, 2017), January 2017, “Die Energiewende: Unsere Erfolgsgeschichte”; http://www.bmwi.de/BMWi/Redaktion/PDF/Publikationen/energiewende-magazin,property=pdf,bereich=bmwi2012,sprache=de,rwb=true.pdf
Figure 26: The interconnection of sectors
Source: Reproduced from IPCC-SRREN, (Summary for Policy Makers,, further developed by Dr. Sven Teske/UTS/ISF
Gasoline
Electro Mobility
Industry
Consumer
Jet Fuel
Diesel Fuel
Bunker Fuel
Renewables
AgricultureForestryResidues
Fossil
Nuclear
SOURCES
ELEC
TRIC
ITY
HEAT
TRANSP
ORT
TRANSPORTSECONDARY
TRANSPORTPRIMARY
CONVERSION CONSUMPTION
Pipeline
learned
Heat Electricity Fuel Biofuel
Pow
er g
rid
Pip
elin
e (G
as/L
iqui
d)
Dis
tric
t Hea
t
Heat pump
Pelletoven
Power plant
Refinery
Pipeline
62
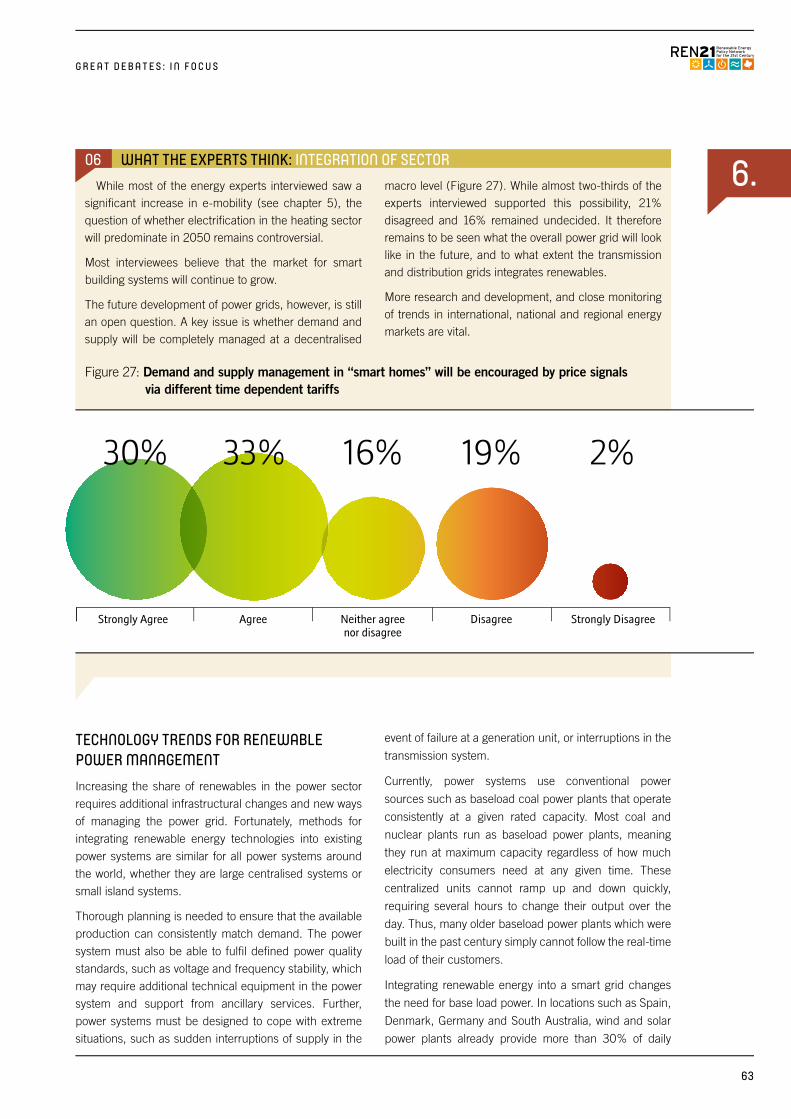
6.
Strongly Agree Agree Neither agreenor disagree
Disagree Strongly Disagree
30% 33% 16% 2%19%
G R E A T D E B A T E S : I N F O C U S
06 WHAT THE EXPERTS THINK: INTEGRATION OF SECTORWhile most of the energy experts interviewed saw a
significant increase in e-mobility (see chapter 5), the question of whether electrification in the heating sector will predominate in 2050 remains controversial.
Most interviewees believe that the market for smart building systems will continue to grow.
The future development of power grids, however, is still an open question. A key issue is whether demand and supply will be completely managed at a decentralised
macro level (Figure 27). While almost two-thirds of the experts interviewed supported this possibility, 21% disagreed and 16% remained undecided. It therefore remains to be seen what the overall power grid will look like in the future, and to what extent the transmission and distribution grids integrates renewables.
More research and development, and close monitoring of trends in international, national and regional energy markets are vital.
Figure 27: Demand and supply management in “smart homes” will be encouraged by price signals via different time dependent tariffs
TECHNOLOGY TRENDS FOR RENEWABLE POWER MANAGEMENT Increasing the share of renewables in the power sector
requires additional infrastructural changes and new ways
of managing the power grid. Fortunately, methods for
integrating renewable energy technologies into existing
power systems are similar for all power systems around
the world, whether they are large centralised systems or
small island systems.
Thorough planning is needed to ensure that the available
production can consistently match demand. The power
system must also be able to fulfil defined power quality
standards, such as voltage and frequency stability, which
may require additional technical equipment in the power
system and support from ancillary services. Further,
power systems must be designed to cope with extreme
situations, such as sudden interruptions of supply in the
event of failure at a generation unit, or interruptions in the
transmission system.
Currently, power systems use conventional power
sources such as baseload coal power plants that operate
consistently at a given rated capacity. Most coal and
nuclear plants run as baseload power plants, meaning
they run at maximum capacity regardless of how much
electricity consumers need at any given time. These
centralized units cannot ramp up and down quickly,
requiring several hours to change their output over the
day. Thus, many older baseload power plants which were
built in the past century simply cannot follow the real-time
load of their customers.
Integrating renewable energy into a smart grid changes
the need for base load power. In locations such as Spain,
Denmark, Germany and South Australia, wind and solar
power plants already provide more than 30% of daily
63
INTERCONNECTION OF SECTORS: SYSTEM THINKING REQUIRED
demand on a regular basis, redefining the need for base load power. In this situation, a flexible approach is required – for example by combining solar photovoltaics, gas, geothermal, wind and demand management – to follow the load over the course of the day and night. Using a mix of different technologies can deliver a resilient power supply, but requires a significant change in the business models of utilities.
SUPPLY SIDE MANAGEMENT FOR ‘24/7’ AVAILABILITYSince load varies over time additional flexible power generation resources are required to provide the right amount of power at any given moment. For rural areas, typical technologies are combined-cycle gas turbines (CCGT) or hydropower stations with sufficient storage capacity to follow daily load variations. In conventional island power systems, a number of small diesel generators are used to provide 24/7 supply. Some generators operate continuously at the point of highest efficiency, and others are used to follow the load variations. The effect of adding renewable power generation to a conventionally centralized or island power system will affect the way in which the system runs. The level of impact depends on the renewable energy technology.19
Biomass, geothermal, concentrated solar power plants (CSP) and hydropower with storage can regulate power output and can supply both base and peak load. When solar photovoltaics, wind power and hydro power plants without storage must rely solely on available natural resources, the power output is variable. These renewable energy sources are often described as ‘intermittent’ power sources, but this is not correct. Intermittent means uncontrollable and non-dispatchable. This is not the case with renewables. The power output of these generation plants can be forecast with a high degree of certainty, and power output can be reduced as needed, hence they can be dispatched. Dispatchable power plants can follow the demand and increase or decrease output independent from available solar and wind resources. The correct term is therefore “variable” generation.
MARKET TRENDS: ENERGY SYSTEM SERVICESPower systems with high shares of flexible generation require more energy system services, presenting new business opportunities for power grid operators and/or utilities.
“Balancing services” refer to the short-term adjustments needed to manage fluctuations over a period ranging from minutes to hours before the time of delivery. In power systems without variable power generation, there can be a mismatch between demand and supply for various reasons: an energy load that was not forecast correctly; or a conventional power plant not operating as scheduled, for instance it has tripped due to a technical problem. The overall impact on the system depends on how large and how widely distributed the variable power sources are. A certain amount of wind power distributed over a larger geographical area will have a lower impact on system balancing than the same amount of wind power concentrated in a single location. Geographical distribution levels out the renewable power generation peaks.
Balancing services include: 1) “day-ahead planning,” which ensures that sufficient generation is available to match expected demand, taking into account forecasted generation from variable power generation sources. This is done typically 12 to 36 hours ahead of time; and 2) “short-term system balancing” involves the allocation of resources to cover events such as a mismatch between forecast generation/demand and actual generation/demand, such as a sudden loss of generation, for example, and is typically done on short notice – seconds or hours ahead.20
19 Greenpeace International, 2012, (GPI 2012), Ackermann, Teske, powE[R] 2030
20 Greenpeace International, 2012, (GPI 2012b), Ackermann et all. 2012
64
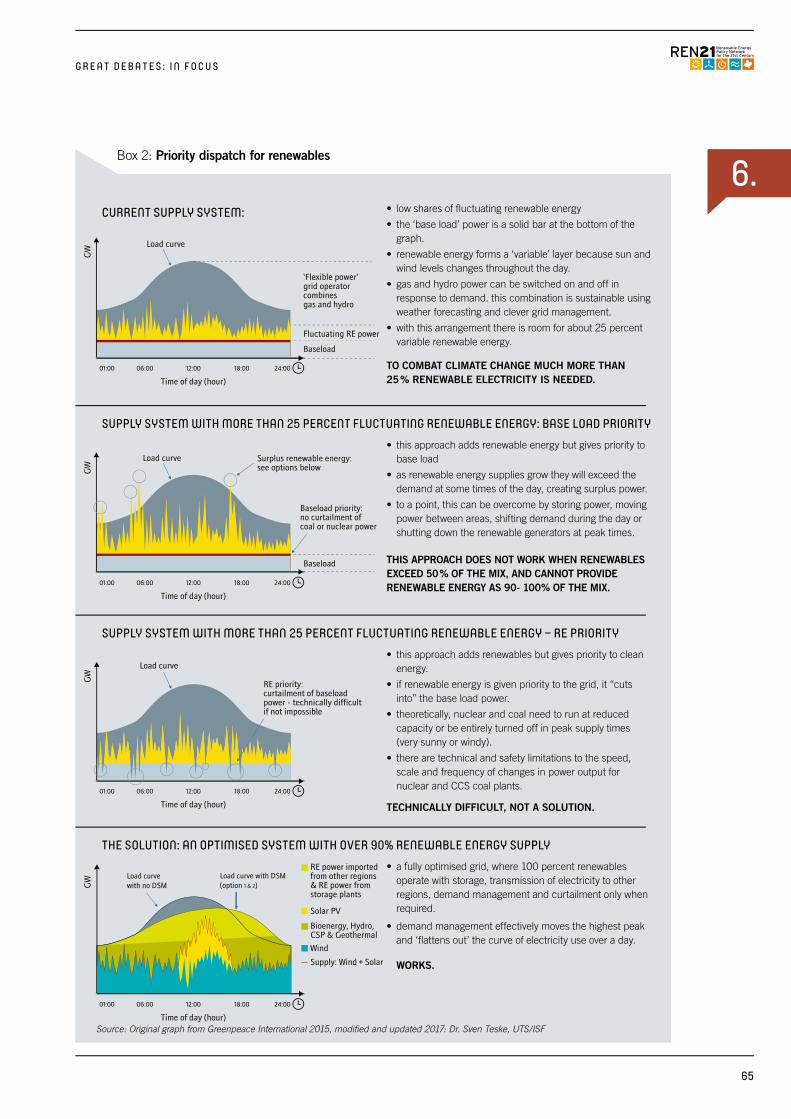
6.
01:00 06:00 12:00 18:00 24:00
GW
GW
GW
GW
Time of day (hour)
Load curve
Load curve
Load curve
Baseload
Fluctuating RE power
‘Flexible power’ grid operator combines gas and hydro
01:00 06:00 12:00 18:00 24:00
Time of day (hour)
Baseload
01:00 06:00 12:00 18:00 24:00
Time of day (hour)
01:00 06:00 12:00 18:00 24:00
Time of day (hour)
Baseload priority: no curtailment of coal or nuclear power
Surplus renewable energy:see options below
RE priority: curtailment of baseload power - technically difficult if not impossible
Load curvewith no DSM
Bioenergy, Hydro, CSP & Geothermal
Solar PV
RE power imported from other regions & RE power from storage plants
Load curve with DSM(option 1 & 2)
Supply: Wind + Solar
Wind
01:00 06:00 12:00 18:00 24:00
GW
GW
GW
GW
Time of day (hour)
Load curve
Load curve
Load curve
Baseload
Fluctuating RE power
‘Flexible power’ grid operator combines gas and hydro
01:00 06:00 12:00 18:00 24:00
Time of day (hour)
Baseload
01:00 06:00 12:00 18:00 24:00
Time of day (hour)
01:00 06:00 12:00 18:00 24:00
Time of day (hour)
Baseload priority: no curtailment of coal or nuclear power
Surplus renewable energy:see options below
RE priority: curtailment of baseload power - technically difficult if not impossible
Load curvewith no DSM
Bioenergy, Hydro, CSP & Geothermal
Solar PV
RE power imported from other regions & RE power from storage plants
Load curve with DSM(option 1 & 2)
Supply: Wind + Solar
Wind
G R E A T D E B A T E S : I N F O C U S
Box 2: Priority dispatch for renewables
CURRENT SUPPLY SYSTEM: • low shares of fluctuating renewable energy
• the ‘base load’ power is a solid bar at the bottom of the graph.
• renewable energy forms a ‘variable’ layer because sun and wind levels changes throughout the day.
• gas and hydro power can be switched on and off in response to demand. this combination is sustainable using weather forecasting and clever grid management.
• with this arrangement there is room for about 25 percent variable renewable energy.
TO COMBAT CLIMATE CHANGE MUCH MORE THAN 25 % RENEWABLE ELECTRICITY IS NEEDED.
SUPPLY SYSTEM WITH MORE THAN 25 PERCENT FLUCTUATING RENEWABLE ENERGY: BASE LOAD PRIORITY • this approach adds renewable energy but gives priority to
base load
• as renewable energy supplies grow they will exceed the demand at some times of the day, creating surplus power.
• to a point, this can be overcome by storing power, moving power between areas, shifting demand during the day or shutting down the renewable generators at peak times.
THIS APPROACH DOES NOT WORK WHEN RENEWABLES EXCEED 50 % OF THE MIX, AND CANNOT PROVIDE RENEWABLE ENERGY AS 90- 100% OF THE MIX.
SUPPLY SYSTEM WITH MORE THAN 25 PERCENT FLUCTUATING RENEWABLE ENERGY – RE PRIORITY • this approach adds renewables but gives priority to clean
energy.
• if renewable energy is given priority to the grid, it “cuts into” the base load power.
• theoretically, nuclear and coal need to run at reduced capacity or be entirely turned off in peak supply times (very sunny or windy).
• there are technical and safety limitations to the speed, scale and frequency of changes in power output for nuclear and CCS coal plants.
TECHNICALLY DIFFICULT, NOT A SOLUTION.
THE SOLUTION: AN OPTIMISED SYSTEM WITH OVER 90% RENEWABLE ENERGY SUPPLY • a fully optimised grid, where 100 percent renewables
operate with storage, transmission of electricity to other regions, demand management and curtailment only when required.
• demand management effectively moves the highest peak and ‘flattens out’ the curve of electricity use over a day.
WORKS.
Source: Original graph from Greenpeace International 2015, modified and updated 2017: Dr. Sven Teske, UTS/ISF
65
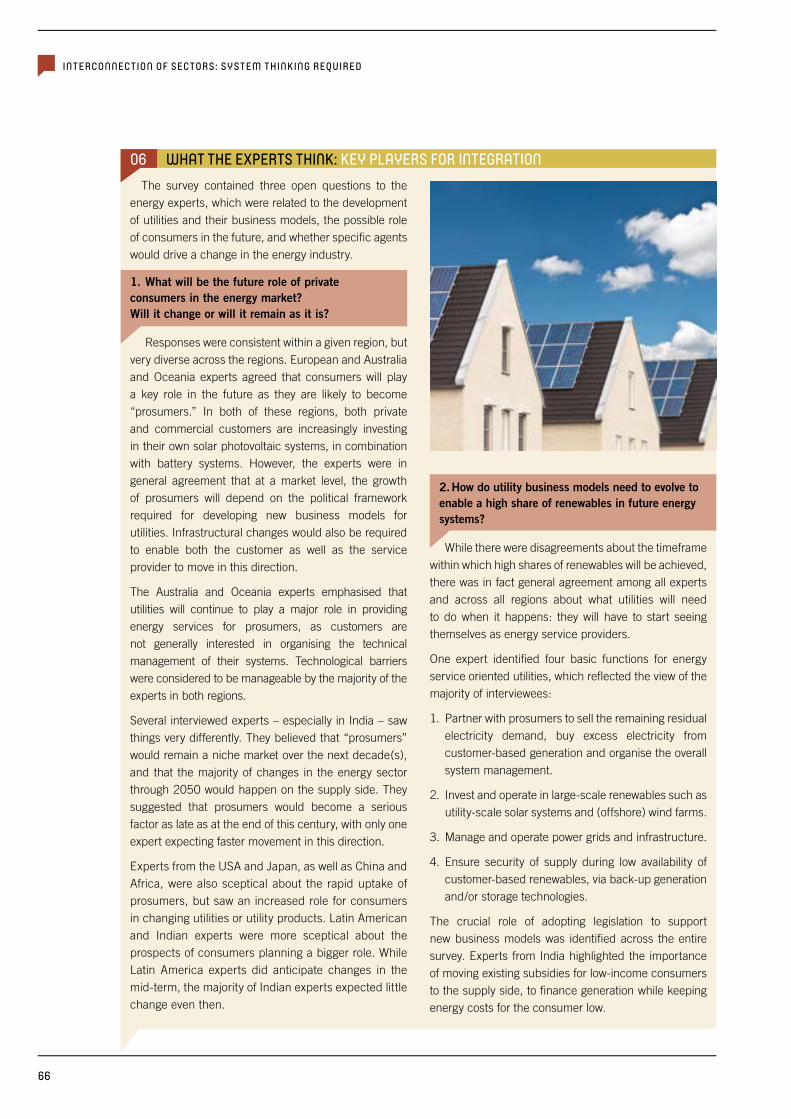
INTERCONNECTION OF SECTORS: SYSTEM THINKING REQUIRED
06 WHAT THE EXPERTS THINK: KEY PLAYERS FOR INTEGRATIONThe survey contained three open questions to the
energy experts, which were related to the development of utilities and their business models, the possible role of consumers in the future, and whether specific agents would drive a change in the energy industry.
1. What will be the future role of private consumers in the energy market? Will it change or will it remain as it is?
Responses were consistent within a given region, but very diverse across the regions. European and Australia and Oceania experts agreed that consumers will play a key role in the future as they are likely to become “prosumers.” In both of these regions, both private and commercial customers are increasingly investing in their own solar photovoltaic systems, in combination with battery systems. However, the experts were in general agreement that at a market level, the growth of prosumers will depend on the political framework required for developing new business models for utilities. Infrastructural changes would also be required to enable both the customer as well as the service provider to move in this direction.
The Australia and Oceania experts emphasised that utilities will continue to play a major role in providing energy services for prosumers, as customers are not generally interested in organising the technical management of their systems. Technological barriers were considered to be manageable by the majority of the experts in both regions.
Several interviewed experts – especially in India – saw things very differently. They believed that “prosumers” would remain a niche market over the next decade(s), and that the majority of changes in the energy sector through 2050 would happen on the supply side. They suggested that prosumers would become a serious factor as late as at the end of this century, with only one expert expecting faster movement in this direction.
Experts from the USA and Japan, as well as China and Africa, were also sceptical about the rapid uptake of prosumers, but saw an increased role for consumers in changing utilities or utility products. Latin American and Indian experts were more sceptical about the prospects of consumers planning a bigger role. While Latin America experts did anticipate changes in the mid-term, the majority of Indian experts expected little change even then.
2. How do utility business models need to evolve to enable a high share of renewables in future energy systems?
While there were disagreements about the timeframe within which high shares of renewables will be achieved, there was in fact general agreement among all experts and across all regions about what utilities will need to do when it happens: they will have to start seeing themselves as energy service providers.
One expert identified four basic functions for energy service oriented utilities, which reflected the view of the majority of interviewees:
1. Partner with prosumers to sell the remaining residual electricity demand, buy excess electricity from customer-based generation and organise the overall system management.
2. Invest and operate in large-scale renewables such as utility-scale solar systems and (offshore) wind farms.
3. Manage and operate power grids and infrastructure.
4. Ensure security of supply during low availability of customer-based renewables, via back-up generation and/or storage technologies.
The crucial role of adopting legislation to support new business models was identified across the entire survey. Experts from India highlighted the importance of moving existing subsidies for low-income consumers to the supply side, to finance generation while keeping energy costs for the consumer low.
66
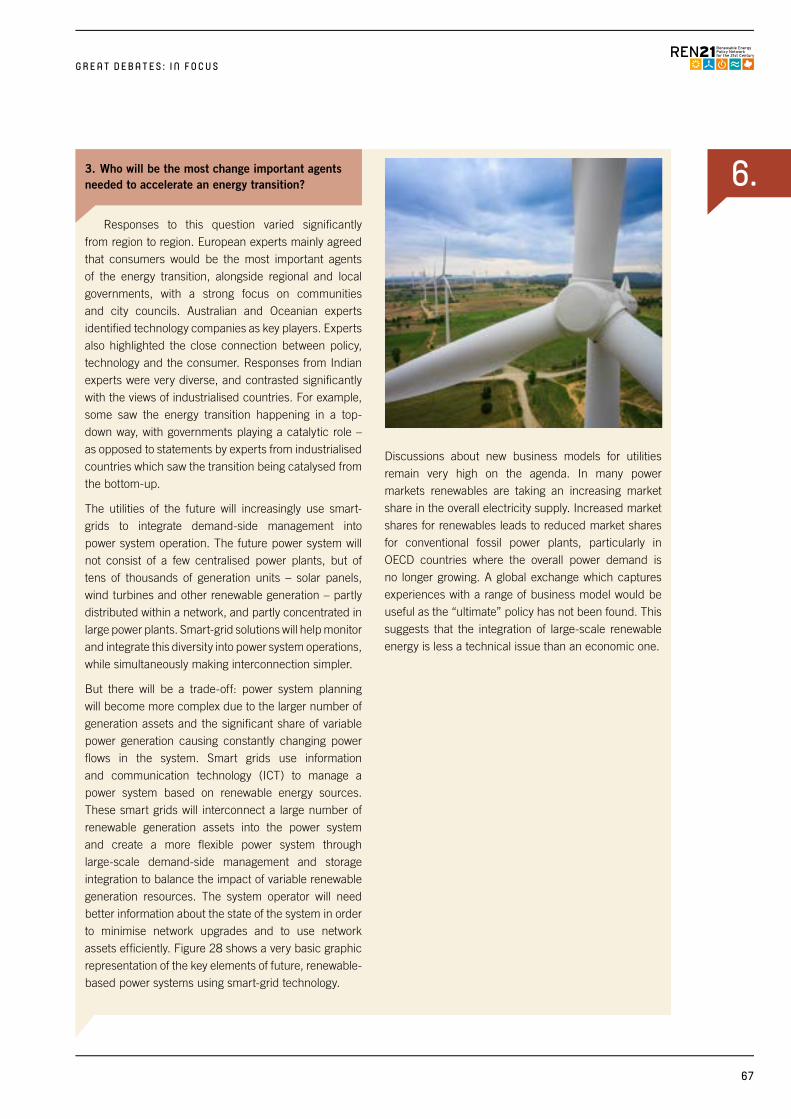
6.
G R E A T D E B A T E S : I N F O C U S
3. Who will be the most change important agents needed to accelerate an energy transition?
Responses to this question varied significantly from region to region. European experts mainly agreed that consumers would be the most important agents of the energy transition, alongside regional and local governments, with a strong focus on communities and city councils. Australian and Oceanian experts identified technology companies as key players. Experts also highlighted the close connection between policy, technology and the consumer. Responses from Indian experts were very diverse, and contrasted significantly with the views of industrialised countries. For example, some saw the energy transition happening in a top-down way, with governments playing a catalytic role – as opposed to statements by experts from industrialised countries which saw the transition being catalysed from the bottom-up.
The utilities of the future will increasingly use smart-grids to integrate demand-side management into power system operation. The future power system will not consist of a few centralised power plants, but of tens of thousands of generation units – solar panels, wind turbines and other renewable generation – partly distributed within a network, and partly concentrated in large power plants. Smart-grid solutions will help monitor and integrate this diversity into power system operations, while simultaneously making interconnection simpler.
But there will be a trade-off: power system planning will become more complex due to the larger number of generation assets and the significant share of variable power generation causing constantly changing power flows in the system. Smart grids use information and communication technology (ICT) to manage a power system based on renewable energy sources. These smart grids will interconnect a large number of renewable generation assets into the power system and create a more flexible power system through large-scale demand-side management and storage integration to balance the impact of variable renewable generation resources. The system operator will need better information about the state of the system in order to minimise network upgrades and to use network assets efficiently. Figure 28 shows a very basic graphic representation of the key elements of future, renewable-based power systems using smart-grid technology.
Discussions about new business models for utilities remain very high on the agenda. In many power markets renewables are taking an increasing market share in the overall electricity supply. Increased market shares for renewables leads to reduced market shares for conventional fossil power plants, particularly in OECD countries where the overall power demand is no longer growing. A global exchange which captures experiences with a range of business model would be useful as the “ultimate” policy has not been found. This suggests that the integration of large-scale renewable energy is less a technical issue than an economic one.
67
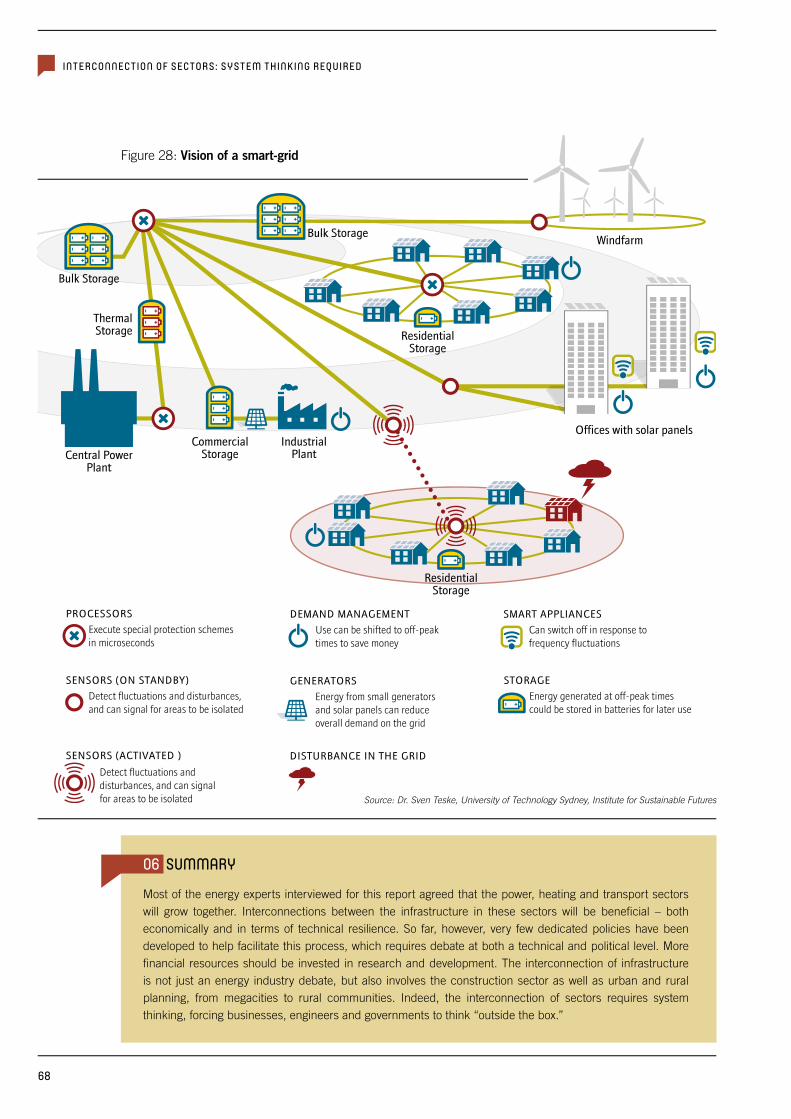
Bulk Storage
ThermalStorage
Bulk Storage
Central PowerPlant
IndustrialPlant
CommercialStorage
ResidentialStorage
Offices with solar panels
Windfarm
SENSORS (ACTIVATED )
PROCESSORS
Execute special protection schemes in microseconds
Detect fluctuations and disturbances, and can signal for areas to be isolated
SMART APPLIANCES
Can switch off in response to frequency fluctuations
DEMAND MANAGEMENT
Use can be shifted to off-peak times to save money
STORAGE
Energy generated at off-peak times could be stored in batteries for later use
ResidentialStorage
SENSORS (ON STANDBY)
Detect fluctuations and disturbances, and can signal for areas to be isolated
GENERATORS
DISTURBANCE IN THE GRID
Energy from small generators and solar panels can reduce overall demand on the grid
INTERCONNECTION OF SECTORS: SYSTEM THINKING REQUIRED
Figure 28: Vision of a smart-grid
Source: Dr. Sven Teske, University of Technology Sydney, Institute for Sustainable Futures
06 SUMMARY
Most of the energy experts interviewed for this report agreed that the power, heating and transport sectors will grow together. Interconnections between the infrastructure in these sectors will be beneficial – both economically and in terms of technical resilience. So far, however, very few dedicated policies have been developed to help facilitate this process, which requires debate at both a technical and political level. More financial resources should be invested in research and development. The interconnection of infrastructure is not just an energy industry debate, but also involves the construction sector as well as urban and rural planning, from megacities to rural communities. Indeed, the interconnection of sectors requires system thinking, forcing businesses, engineers and governments to think “outside the box.”
68
7.
n INTRODUCTIONStorage technologies have taken a central role in the energy debate over the past few years. Battery systems in particular – originally developed for hybrid or fully electric cars – are increasingly being used in conjunction with solar photovoltaic systems due to falling costs. But battery technology represents only one of many storage options, and intensified research and development activities is leading to a whole new variety of storage technologies with the potential to revolutionise the energy sectors.
n SNAPSHOT 2013The global expert debate around energy storage has changed significantly over the past years. In 2013 storage technologies were very expensive and the key question at the time was whether energy storage was even necessary for achieving high levels of renewables. Many experts disputed the conventional wisdom that expensive storage technologies would be necessary, favouring the extensive use of demand side management as part of a wide range of other options for managing variability. The debate also extended to the question of when storage technologies might be needed. Many experts argued that storage options weren’t needed imminently, and recommended managing high levels of variable renewables with pumped hydro and gas. They looked at a 2030 horizon for storage solutions to come into play. Their prime reason for avoiding storage in the shorter-term was the high costs: “Storage has to come down to one-tenth the cost of generation,” noted one expert.
n WHERE WE ARE TODAY: STORAGE TECHNOLOGIES FOR THE POWER SECTOR
The price of lithium-ion battery packs for electric cars has fallen 65% since 2010 and is likely to keep declining, according to a report by Bloomberg New Energy Finance and McKinsey.21 Battery systems for solar photovoltaic systems have fallen accordingly, making it increasingly economic to store surplus rooftop solar electricity rather than sell it to utilities and/or grid operators. As a result, batteries have grown from a niche position into a mass application market. And the trend towards low storage costs is likely to continue.22
Since 2013, the debate has shifted in focus. The conversation is now about how storage technologies could replace parts of the power grid or support integration of large shares of variable solar and wind power. The concepts are numerous, ranging from a highly decentralised approach where customers generate their own power and store it on site with very little or no dependence on the power grid, toward a huge “organic” power system with millions of generation inputs and cascades of multiple storage technologies. The future is wide open and far from being decided.
Meanwhile the central debate of the GFR 2013 has been turned on its head, from: “How can we avoid storage in order to avoid high costs” to “How can we avoid too much power grid expansion to avoid high costs” – a significant paradigm shift.
7. STORAGE: SUPPORTER OR COMPETITOR OF THE POWER GRID?
21 Bloomberg, 2016, Bloomberg News, Battery Cost Plunge Seen Changing Automakers Most in 100 Years by Reed Landberg, 11 October 2016 https://www.bloomberg.com/news/articles/2016-10-11/battery-cost-plunge-seen-changing-automakers-most-in-100-years
22 AECOM, 2015 (AECOM 2015) Energy storage – funding and knowledge sharing priorities, page 32; https://arena.gov.au/files/2015/07/AECOM-Energy-Storage-Study.pdf
G R E A T D E B A T E S : I N F O C U S
69
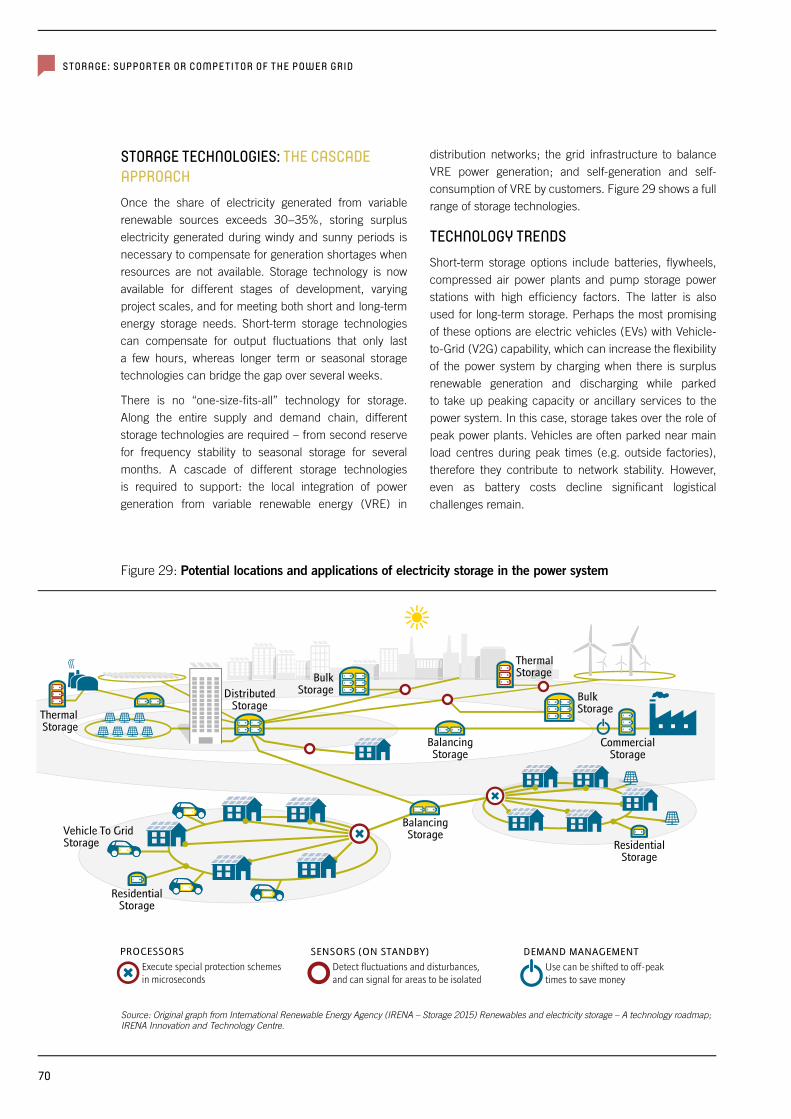
BulkStorage
Bulk Storage
CommercialStorage
BalancingStorage
BalancingStorage
DistributedStorage
Thermal Storage
Thermal Storage
ResidentialStorage
Vehicle To GridStorage Residential
Storage
PROCESSORS
Execute special protection schemes in microseconds
SENSORS (ON STANDBY)
Detect fluctuations and disturbances, and can signal for areas to be isolated
DEMAND MANAGEMENT
Use can be shifted to off-peak times to save money
STORAGE: SUPPORTER OR COMPETITOR OF THE POWER GRID
Figure 29: Potential locations and applications of electricity storage in the power system
Source: Original graph from International Renewable Energy Agency (IRENA – Storage 2015) Renewables and electricity storage – A technology roadmap; IRENA Innovation and Technology Centre.
STORAGE TECHNOLOGIES: THE CASCADE APPROACHOnce the share of electricity generated from variable renewable sources exceeds 30–35%, storing surplus electricity generated during windy and sunny periods is necessary to compensate for generation shortages when resources are not available. Storage technology is now available for different stages of development, varying project scales, and for meeting both short and long-term energy storage needs. Short-term storage technologies can compensate for output fluctuations that only last a few hours, whereas longer term or seasonal storage technologies can bridge the gap over several weeks.
There is no “one-size-fits-all” technology for storage. Along the entire supply and demand chain, different storage technologies are required – from second reserve for frequency stability to seasonal storage for several months. A cascade of different storage technologies is required to support: the local integration of power generation from variable renewable energy (VRE) in
distribution networks; the grid infrastructure to balance VRE power generation; and self-generation and self-consumption of VRE by customers. Figure 29 shows a full range of storage technologies.
TECHNOLOGY TRENDSShort-term storage options include batteries, flywheels, compressed air power plants and pump storage power stations with high efficiency factors. The latter is also used for long-term storage. Perhaps the most promising of these options are electric vehicles (EVs) with Vehicle-to-Grid (V2G) capability, which can increase the flexibility of the power system by charging when there is surplus renewable generation and discharging while parked to take up peaking capacity or ancillary services to the power system. In this case, storage takes over the role of peak power plants. Vehicles are often parked near main load centres during peak times (e.g. outside factories), therefore they contribute to network stability. However, even as battery costs decline significant logistical challenges remain.
70
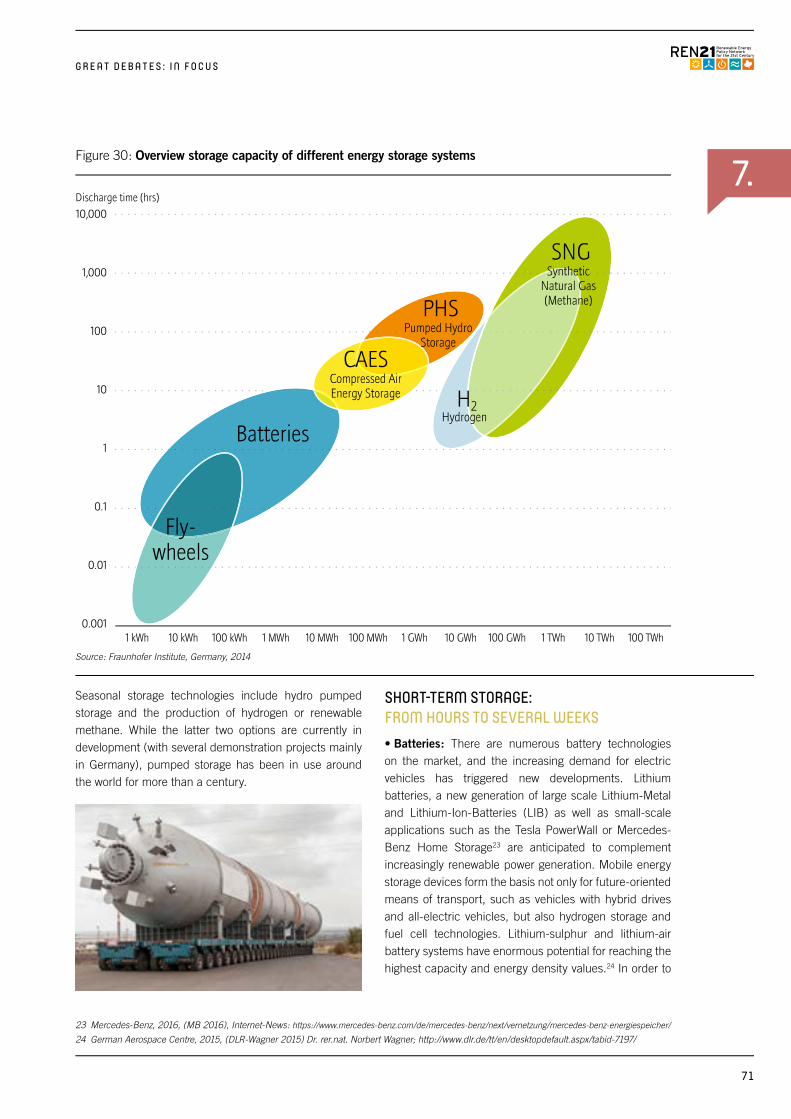
7. 10,000
1,000
100
10
1
0.1
0.01
0.0011 kWh 10 kWh 100 kWh 1 MWh 10 MWh 100 MWh 1 GWh 10 GWh 100 GWh 1 TWh 10 TWh 100 TWh
Discharge time (hrs)
Batteries
CAESCompressed AirEnergy Storage H2
Hydrogen
PHSPumped Hydro
Storage
SNGSynthetic
Natural Gas(Methane)
Fly-wheels
G R E A T D E B A T E S : I N F O C U S
Seasonal storage technologies include hydro pumped storage and the production of hydrogen or renewable methane. While the latter two options are currently in development (with several demonstration projects mainly in Germany), pumped storage has been in use around the world for more than a century.
SHORT-TERM STORAGE:FROM HOURS TO SEVERAL WEEKS • Batteries: There are numerous battery technologies on the market, and the increasing demand for electric vehicles has triggered new developments. Lithium batteries, a new generation of large scale Lithium-Metal and Lithium-Ion-Batteries (LIB) as well as small-scale applications such as the Tesla PowerWall or Mercedes-Benz Home Storage23 are anticipated to complement increasingly renewable power generation. Mobile energy storage devices form the basis not only for future-oriented means of transport, such as vehicles with hybrid drives and all-electric vehicles, but also hydrogen storage and fuel cell technologies. Lithium-sulphur and lithium-air battery systems have enormous potential for reaching the highest capacity and energy density values.24 In order to
Figure 30: Overview storage capacity of different energy storage systems
23 Mercedes-Benz, 2016, (MB 2016), Internet-News: https://www.mercedes-benz.com/de/mercedes-benz/next/vernetzung/mercedes-benz-energiespeicher/
24 German Aerospace Centre, 2015, (DLR-Wagner 2015) Dr. rer.nat. Norbert Wagner; http://www.dlr.de/tt/en/desktopdefault.aspx/tabid-7197/
Source: Fraunhofer Institute, Germany, 2014
71
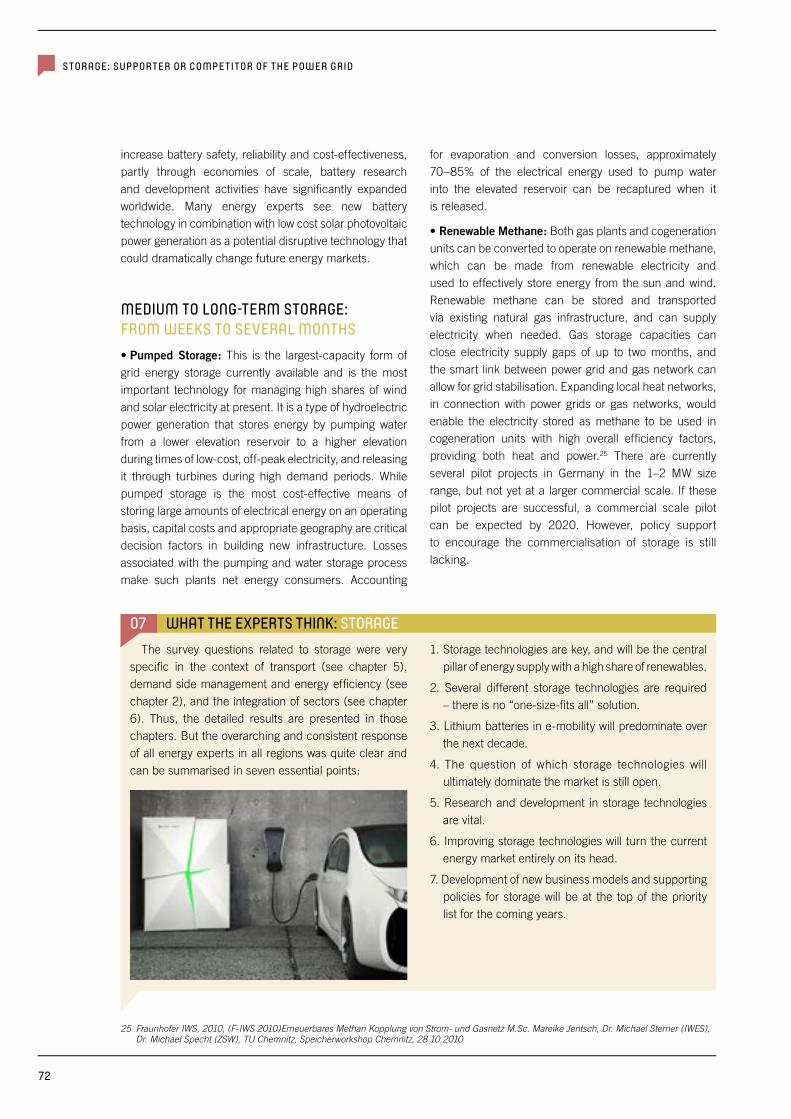
STORAGE: SUPPORTER OR COMPETITOR OF THE POWER GRID
increase battery safety, reliability and cost-effectiveness, partly through economies of scale, battery research and development activities have significantly expanded worldwide. Many energy experts see new battery technology in combination with low cost solar photovoltaic power generation as a potential disruptive technology that could dramatically change future energy markets.
MEDIUM TO LONG-TERM STORAGE: FROM WEEKS TO SEVERAL MONTHS • Pumped Storage: This is the largest-capacity form of grid energy storage currently available and is the most important technology for managing high shares of wind and solar electricity at present. It is a type of hydroelectric power generation that stores energy by pumping water from a lower elevation reservoir to a higher elevation during times of low-cost, off-peak electricity, and releasing it through turbines during high demand periods. While pumped storage is the most cost-effective means of storing large amounts of electrical energy on an operating basis, capital costs and appropriate geography are critical decision factors in building new infrastructure. Losses associated with the pumping and water storage process make such plants net energy consumers. Accounting
for evaporation and conversion losses, approximately 70–85% of the electrical energy used to pump water into the elevated reservoir can be recaptured when it is released.
• Renewable Methane: Both gas plants and cogeneration units can be converted to operate on renewable methane, which can be made from renewable electricity and used to effectively store energy from the sun and wind. Renewable methane can be stored and transported via existing natural gas infrastructure, and can supply electricity when needed. Gas storage capacities can close electricity supply gaps of up to two months, and the smart link between power grid and gas network can allow for grid stabilisation. Expanding local heat networks, in connection with power grids or gas networks, would enable the electricity stored as methane to be used in cogeneration units with high overall efficiency factors, providing both heat and power.25 There are currently several pilot projects in Germany in the 1–2 MW size range, but not yet at a larger commercial scale. If these pilot projects are successful, a commercial scale pilot can be expected by 2020. However, policy support to encourage the commercialisation of storage is still lacking.
25 Fraunhofer IWS, 2010, (F-IWS 2010)Erneuerbares Methan Kopplung von Strom- und Gasnetz M.Sc. Mareike Jentsch, Dr. Michael Sterner (IWES), Dr. Michael Specht (ZSW), TU Chemnitz, Speicherworkshop Chemnitz, 28.10.2010
07 WHAT THE EXPERTS THINK: STORAGEThe survey questions related to storage were very
specific in the context of transport (see chapter 5), demand side management and energy efficiency (see chapter 2), and the integration of sectors (see chapter 6). Thus, the detailed results are presented in those chapters. But the overarching and consistent response of all energy experts in all regions was quite clear and can be summarised in seven essential points:
1. Storage technologies are key, and will be the central pillar of energy supply with a high share of renewables.
2. Several different storage technologies are required – there is no “one-size-fits all” solution.
3. Lithium batteries in e-mobility will predominate over the next decade.
4. The question of which storage technologies will ultimately dominate the market is still open.
5. Research and development in storage technologies are vital.
6. Improving storage technologies will turn the current energy market entirely on its head.
7. Development of new business models and supporting policies for storage will be at the top of the priority list for the coming years.
72
8.
n INTRODUCTIONFuture projections for the commodity price of oil and technical equipment such as renewable generators are essential to the economic forecasting of energy supply options. The greater the uncertainty of future fuel costs, the greater the uncertainty of future energy costs for customers. There are other critical questions as well: Should a technology be chosen because of its current market price or because of its future cost reduction potentials? What technology offers the most benefits for a specific application? And if this technology is currently too expensive, should government-funded projects help achieve cost reductions to make it economically viable rather than waiting for “market forces” to do the job?
n SNAPSHOT 2013Is renewable energy more expensive than conventional energy? This question elicited intense debate in 2013.
Energy systems are mixes of conventional energies and renewable energy, designed to meet current needs, but with an eye towards the future: models of future infrastructure such as power grids; estimation of future energy demand based on projections of population and economic growth; and expectations regarding future fossil fuel prices, interest rates, energy policies, and carbon prices. Scenarios typically model least-cost energy mixes, some with constraints such as future carbon emissions. In 2013 the pure installation and/or generation costs of renewable energies were predominantly higher than those of fossil fuels. Thus, the debate at that time focused on whether a direct comparison of the two properly reflected reality, or whether other parameters should be considered – the external costs of environmental damage, fossil fuel price risks or previously paid subsidies to name a few.
n WHERE WE ARE TODAY: RENEWABLE TECHNOLOGY COSTS
Market development and the development of costs go hand-in-hand. Increased market volumes lead to economies of scale and reduce first the price and then the actual costs of the technology. Reduced prices increase market volumes, which again leads to economies of scale – a feedback-loop in other words. The most drastic cost reduction among renewable energy technologies during the last decade has been achieved in solar photovoltaics, with wind and concentrated solar power closely behind. Pressure on market prices and margins has also led to rapid changes in the market, in particular mergers, bankruptcies and consequently concentration in the hands of fewer companies. The renewable industry is a very competitive sector and prices are likely to come down further. This competition is not limited to the power sector. Falling solar photovoltaic prices for example have put the solar heating market under significant pressure, leading to market share loss as solar PV heat pump combinations outperformed solar heating technologies in some cases.
8. TECHNOLOGY VERSUS COSTS: WHICH SHOULD COME FIRST?
G R E A T D E B A T E S : I N F O C U S
73
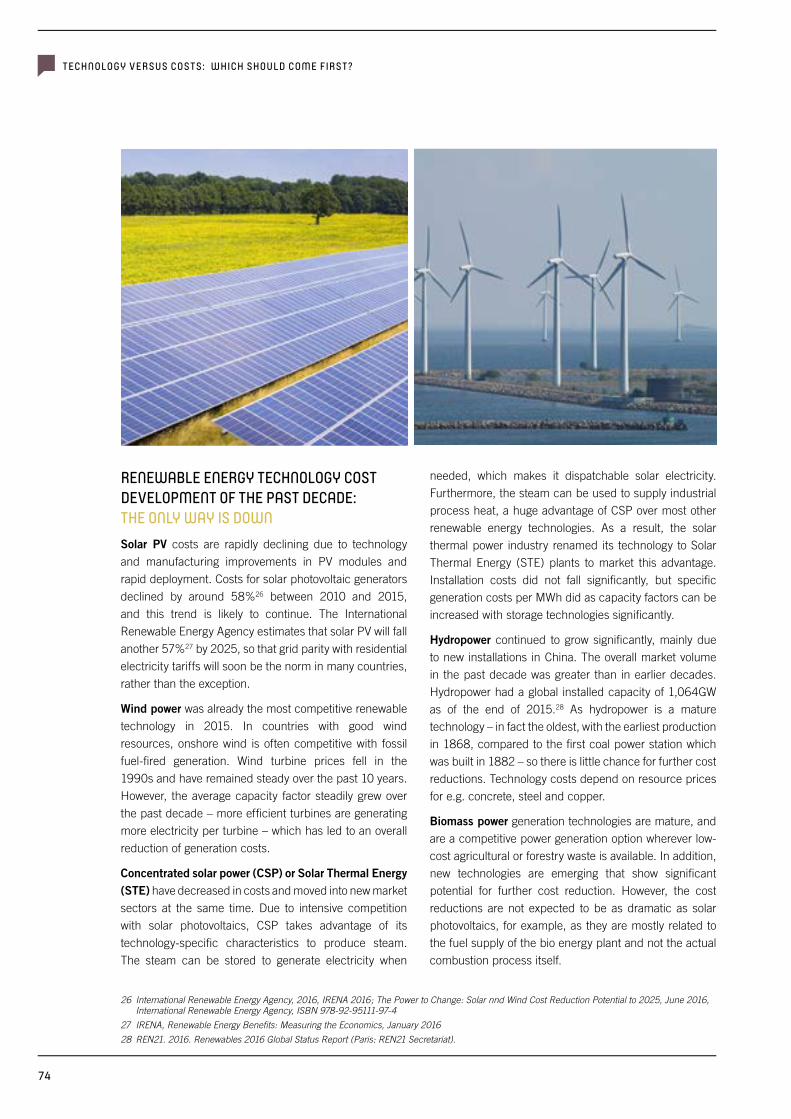
TECHNOLOGY VERSUS COSTS: WHICH SHOULD COME FIRST?
RENEWABLE ENERGY TECHNOLOGY COST DEVELOPMENT OF THE PAST DECADE: THE ONLY WAY IS DOWNSolar PV costs are rapidly declining due to technology
and manufacturing improvements in PV modules and
rapid deployment. Costs for solar photovoltaic generators
declined by around 58%26 between 2010 and 2015,
and this trend is likely to continue. The International
Renewable Energy Agency estimates that solar PV will fall
another 57%27 by 2025, so that grid parity with residential
electricity tariffs will soon be the norm in many countries,
rather than the exception.
Wind power was already the most competitive renewable
technology in 2015. In countries with good wind
resources, onshore wind is often competitive with fossil
fuel-fired generation. Wind turbine prices fell in the
1990s and have remained steady over the past 10 years.
However, the average capacity factor steadily grew over
the past decade – more efficient turbines are generating
more electricity per turbine – which has led to an overall
reduction of generation costs.
Concentrated solar power (CSP) or Solar Thermal Energy (STE) have decreased in costs and moved into new market
sectors at the same time. Due to intensive competition
with solar photovoltaics, CSP takes advantage of its
technology-specific characteristics to produce steam.
The steam can be stored to generate electricity when
needed, which makes it dispatchable solar electricity.
Furthermore, the steam can be used to supply industrial
process heat, a huge advantage of CSP over most other
renewable energy technologies. As a result, the solar
thermal power industry renamed its technology to Solar
Thermal Energy (STE) plants to market this advantage.
Installation costs did not fall significantly, but specific
generation costs per MWh did as capacity factors can be
increased with storage technologies significantly.
Hydropower continued to grow significantly, mainly due
to new installations in China. The overall market volume
in the past decade was greater than in earlier decades.
Hydropower had a global installed capacity of 1,064GW
as of the end of 2015.28 As hydropower is a mature
technology – in fact the oldest, with the earliest production
in 1868, compared to the first coal power station which
was built in 1882 – so there is little chance for further cost
reductions. Technology costs depend on resource prices
for e.g. concrete, steel and copper.
Biomass power generation technologies are mature, and
are a competitive power generation option wherever low-
cost agricultural or forestry waste is available. In addition,
new technologies are emerging that show significant
potential for further cost reduction. However, the cost
reductions are not expected to be as dramatic as solar
photovoltaics, for example, as they are mostly related to
the fuel supply of the bio energy plant and not the actual
combustion process itself.
26 International Renewable Energy Agency, 2016, IRENA 2016; The Power to Change: Solar nnd Wind Cost Reduction Potential to 2025, June 2016, International Renewable Energy Agency, ISBN 978-92-95111-97-4
27 IRENA, Renewable Energy Benefits: Measuring the Economics, January 2016
28 REN21. 2016. Renewables 2016 Global Status Report (Paris: REN21 Secretariat).
74
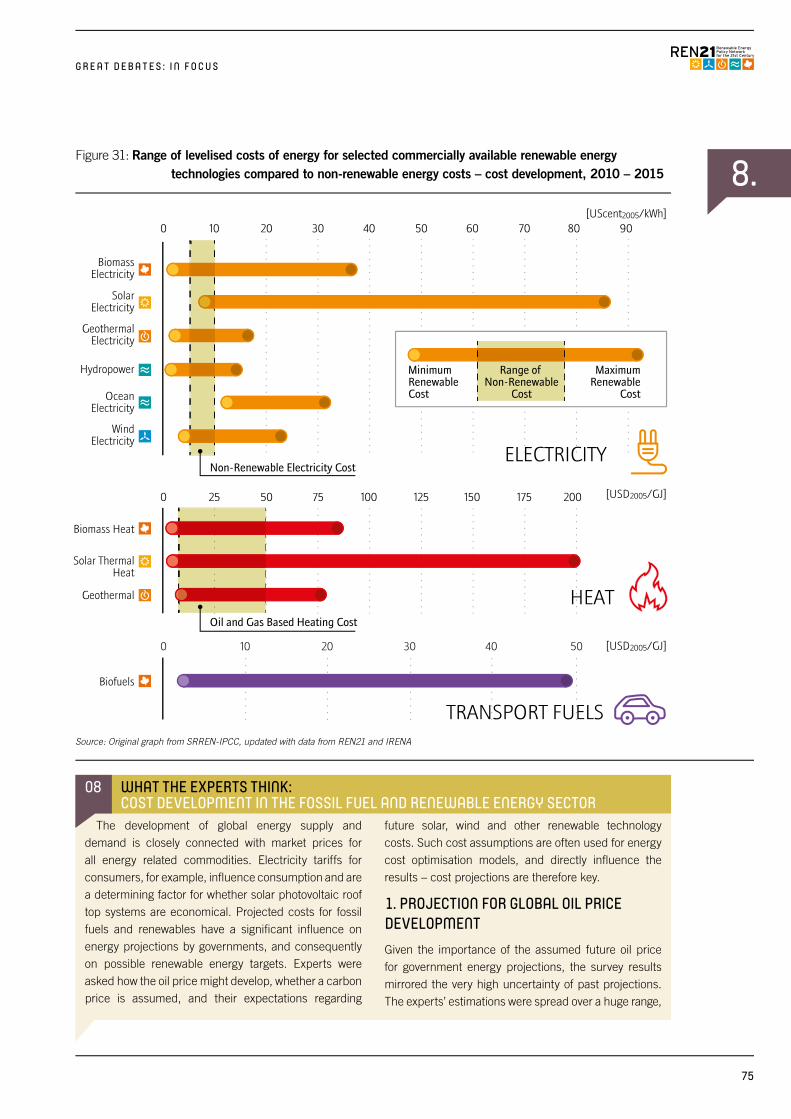
8. 0 10 20 30 40 50 60 70 80 90
[UScent2005/kWh]
[USD2005/GJ]
[USD2005/GJ]
BiomassElectricity
SolarElectricity
GeothermalElectricity
OceanElectricity
WindElectricity
Hydropower
Biomass Heat
Solar ThermalHeat
Geothermal
Non-Renewable Electricity Cost
Oil and Gas Based Heating Cost
0 25 50 75 100 125 150 175 200
Biofuels
0 10 20 30 40 50
ELECTRICITY
HEAT
TRANSPORT FUELS
MinimumRenewable Cost
MaximumRenewable
Cost
Range of Non-Renewable
Cost
G R E A T D E B A T E S : I N F O C U S
Source: Original graph from SRREN-IPCC, updated with data from REN21 and IRENA
08 WHAT THE EXPERTS THINK: COST DEVELOPMENT IN THE FOSSIL FUEL AND RENEWABLE ENERGY SECTOR
The development of global energy supply and demand is closely connected with market prices for all energy related commodities. Electricity tariffs for consumers, for example, influence consumption and are a determining factor for whether solar photovoltaic roof top systems are economical. Projected costs for fossil fuels and renewables have a significant influence on energy projections by governments, and consequently on possible renewable energy targets. Experts were asked how the oil price might develop, whether a carbon price is assumed, and their expectations regarding
future solar, wind and other renewable technology costs. Such cost assumptions are often used for energy cost optimisation models, and directly influence the results – cost projections are therefore key.
1. PROJECTION FOR GLOBAL OIL PRICE DEVELOPMENT Given the importance of the assumed future oil price for government energy projections, the survey results mirrored the very high uncertainty of past projections. The experts’ estimations were spread over a huge range,
Figure 31: Range of levelised costs of energy for selected commercially available renewable energy technologies compared to non-renewable energy costs – cost development, 2010 – 2015
75
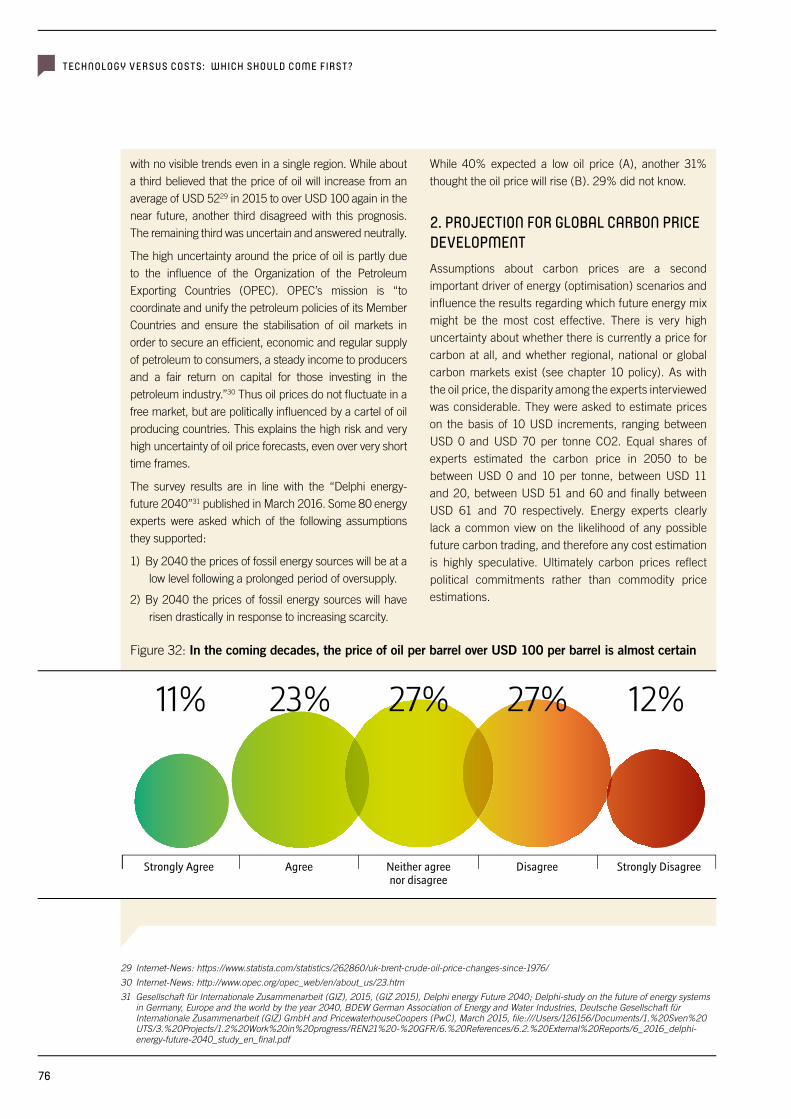
Strongly Agree Agree Neither agreenor disagree
Disagree Strongly Disagree
11% 23% 27% 27% 12%
TECHNOLOGY VERSUS COSTS: WHICH SHOULD COME FIRST?
with no visible trends even in a single region. While about a third believed that the price of oil will increase from an average of USD 5229 in 2015 to over USD 100 again in the near future, another third disagreed with this prognosis. The remaining third was uncertain and answered neutrally.
The high uncertainty around the price of oil is partly due to the influence of the Organization of the Petroleum Exporting Countries (OPEC). OPEC’s mission is “to coordinate and unify the petroleum policies of its Member Countries and ensure the stabilisation of oil markets in order to secure an efficient, economic and regular supply of petroleum to consumers, a steady income to producers and a fair return on capital for those investing in the petroleum industry.”30 Thus oil prices do not fluctuate in a free market, but are politically influenced by a cartel of oil producing countries. This explains the high risk and very high uncertainty of oil price forecasts, even over very short time frames.
The survey results are in line with the “Delphi energy-future 2040”31 published in March 2016. Some 80 energy experts were asked which of the following assumptions they supported:
1) By 2040 the prices of fossil energy sources will be at a low level following a prolonged period of oversupply.
2) By 2040 the prices of fossil energy sources will have risen drastically in response to increasing scarcity.
While 40% expected a low oil price (A), another 31% thought the oil price will rise (B). 29% did not know.
2. PROJECTION FOR GLOBAL CARBON PRICE DEVELOPMENTAssumptions about carbon prices are a second important driver of energy (optimisation) scenarios and influence the results regarding which future energy mix might be the most cost effective. There is very high uncertainty about whether there is currently a price for carbon at all, and whether regional, national or global carbon markets exist (see chapter 10 policy). As with the oil price, the disparity among the experts interviewed was considerable. They were asked to estimate prices on the basis of 10 USD increments, ranging between USD 0 and USD 70 per tonne CO2. Equal shares of experts estimated the carbon price in 2050 to be between USD 0 and 10 per tonne, between USD 11 and 20, between USD 51 and 60 and finally between USD 61 and 70 respectively. Energy experts clearly lack a common view on the likelihood of any possible future carbon trading, and therefore any cost estimation is highly speculative. Ultimately carbon prices reflect political commitments rather than commodity price estimations.
29 Internet-News: https://www.statista.com/statistics/262860/uk-brent-crude-oil-price-changes-since-1976/
30 Internet-News: http://www.opec.org/opec_web/en/about_us/23.htm
31 Gesellschaft für Internationale Zusammenarbeit (GIZ), 2015, (GIZ 2015), Delphi energy Future 2040; Delphi-study on the future of energy systems in Germany, Europe and the world by the year 2040, BDEW German Association of Energy and Water Industries, Deutsche Gesellschaft für Internationale Zusammenarbeit (GIZ) GmbH and PricewaterhouseCoopers (PwC), March 2015, file:///Users/126156/Documents/1.%20Sven%20 UTS/3.%20Projects/1.2%20Work%20in%20progress/REN21%20-%20GFR/6.%20References/6.2.%20External%20Reports/6_2016_delphi- energy-future-2040_study_en_final.pdf
Figure 32: In the coming decades, the price of oil per barrel over USD 100 per barrel is almost certain
76
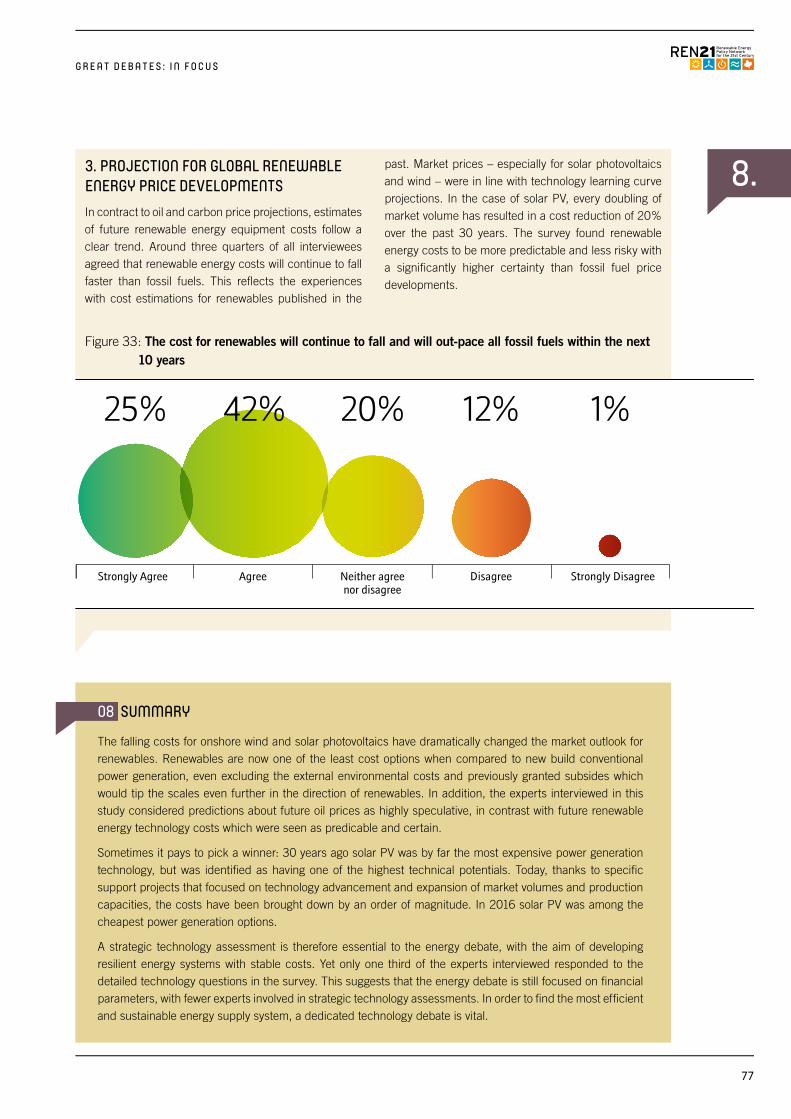
8.
Strongly Agree Agree Neither agreenor disagree
Disagree Strongly Disagree
25% 42% 20% 12% 1%
G R E A T D E B A T E S : I N F O C U S
3. PROJECTION FOR GLOBAL RENEWABLE ENERGY PRICE DEVELOPMENTS In contract to oil and carbon price projections, estimates of future renewable energy equipment costs follow a clear trend. Around three quarters of all interviewees agreed that renewable energy costs will continue to fall faster than fossil fuels. This reflects the experiences with cost estimations for renewables published in the
past. Market prices – especially for solar photovoltaics and wind – were in line with technology learning curve projections. In the case of solar PV, every doubling of market volume has resulted in a cost reduction of 20% over the past 30 years. The survey found renewable energy costs to be more predictable and less risky with a significantly higher certainty than fossil fuel price developments.
Figure 33: The cost for renewables will continue to fall and will out-pace all fossil fuels within the next 10 years
08 SUMMARY
The falling costs for onshore wind and solar photovoltaics have dramatically changed the market outlook for renewables. Renewables are now one of the least cost options when compared to new build conventional power generation, even excluding the external environmental costs and previously granted subsides which would tip the scales even further in the direction of renewables. In addition, the experts interviewed in this study considered predictions about future oil prices as highly speculative, in contrast with future renewable energy technology costs which were seen as predicable and certain.
Sometimes it pays to pick a winner: 30 years ago solar PV was by far the most expensive power generation technology, but was identified as having one of the highest technical potentials. Today, thanks to specific support projects that focused on technology advancement and expansion of market volumes and production capacities, the costs have been brought down by an order of magnitude. In 2016 solar PV was among the cheapest power generation options.
A strategic technology assessment is therefore essential to the energy debate, with the aim of developing resilient energy systems with stable costs. Yet only one third of the experts interviewed responded to the detailed technology questions in the survey. This suggests that the energy debate is still focused on financial parameters, with fewer experts involved in strategic technology assessments. In order to find the most efficient and sustainable energy supply system, a dedicated technology debate is vital.
77
n INTRODUCTIONThe interaction between established traditional energy companies, their existing energy infrastructure and workforce, and the scientific certainty about the urgent need to drastically reduce carbon emissions to avoid dangerous climate change remains inadequate. Employees of the fossil fuel industry find themselves caught between those who want to protect past investments in energy infrastructure ostensibly to secure jobs and those who advocate for rapid carbon reduction to safeguard the global climate. But is it really necessary to choose between economy and ecology? And what role can the oil industry play in helping organise the transition?
n SNAPSHOT 2013Oil companies dominate our existing energy systems. This was the case in 2013 and very little has changed since then. In 2013, oil companies positioned themselves as biofuel suppliers, in a market with many other agriculture-based biofuel producers. Some oil companies also tried to position themselves as future suppliers of hydrogen from renewables, or tried to get involved in small-scale solar and biomass projects, but with limited success. Some experts believed that offshore logistical capabilities would prove advantageous for oil companies moving into offshore wind power, but so far few dedicated oil companies have gone beyond expressing interest.
In 2001 former CEO of British Petroleum (BP) Lord John Browne announced a strategic change from its role as a supplier of oil and gas, to that of an energy company which would provide renewable energy as well. From then on, BP was meant to stand for “Beyond Petroleum.” But in 2013 BP quietly abandoned the slogan, along with the last of its holdings in wind and solar.32 BP is not unique – most other oil companies have had limited involvement in
the renewables industry, with the notable exception of the French oil giant TOTAL, which holds the majority share in SunPower, one of the world’s largest solar photovoltaic companies.
n WHERE WE ARE TODAY: RENEWABLE ENERGY INVESTMENTS
The rapid growth of renewable energy markets worldwide has led to significant increases in investment and job creation, as costs have steeply declined due to economies of scale. As a result new markets for renewable energy technologies have opened up in developing countries where expanded generation capacities are needed to meet increasing energy demand. Interestingly, oil companies have not been able to keep pace with the rapidly growing renewable energy sector; on the contrary, their market share in this sector has declined further.
EVOLUTION OF GLOBAL INVESTMENT IN RENEWABLE ENERGY SINCE 2004Globally, new investment in renewable power and fuels grew steadily from USD 39 billion in 2004 to USD 279 billion in 2011. Investment decreased in 2012 from this all-time high by 11%, down to USD 249.5 billion, and further decreased by 23% on 2011 levels to USD 214 billion in 2013. By 2014, global investments in renewables recovered and climbed close to the 2011 high, to USD 273 billion. Investments increased further to USD 286 billion in 2015.
The decline in investment between 2011 and 2013 were the result of uncertainty over support policies in Europe and the United States, as well as a delayed effect of the global financial crisis. However to some extent, the decrease in investment also resulted from a sharp reduction in technology costs – especially solar PV.
9. SCALING-UP INVESTMENTS AND WORK FORCE: 100% RENEWABLES FOR SOCIO-ECONOMIC CHANGE
32 http://www.cnbc.com/id/100647034
G R E A T D E B A T E S : I N F O C U S
78
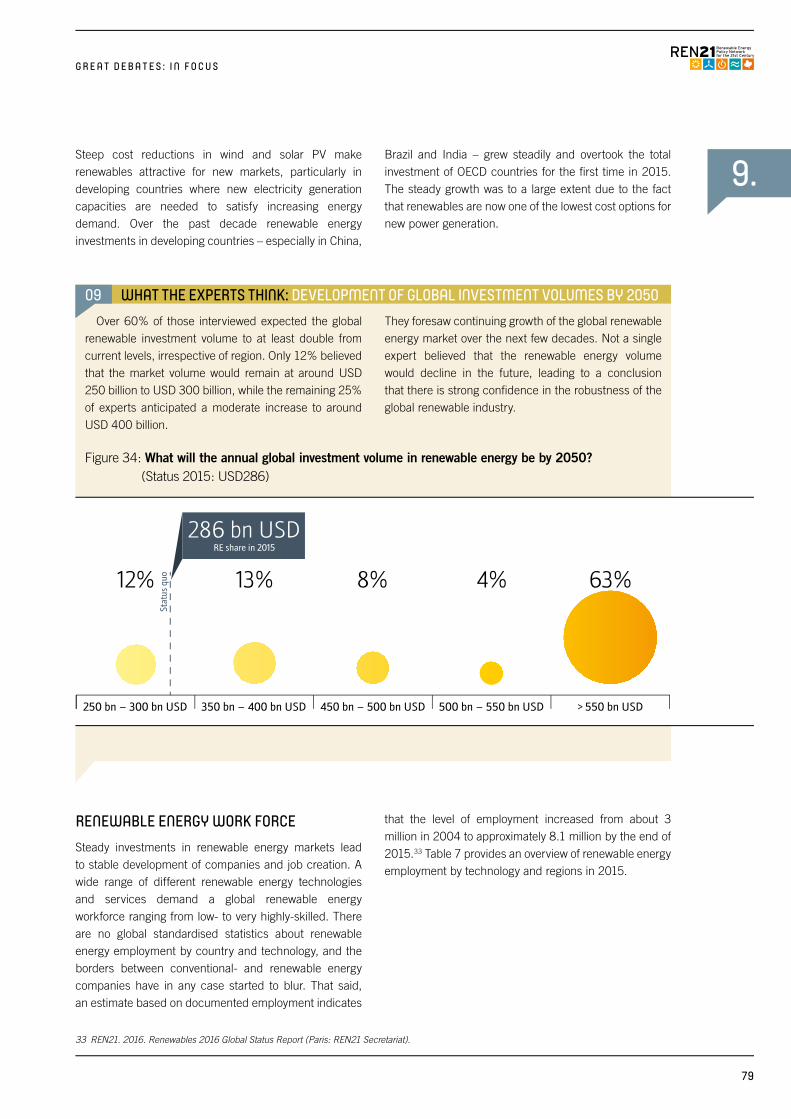
9.
250 bn – 300 bn USD 350 bn – 400 bn USD 450 bn – 500 bn USD 500 bn – 550 bn USD > 550 bn USD
63%4%8%12% 13%
Stat
us q
uo
RE share in 2015
286 bn USD
G R E A T D E B A T E S : I N F O C U S
Steep cost reductions in wind and solar PV make renewables attractive for new markets, particularly in developing countries where new electricity generation capacities are needed to satisfy increasing energy demand. Over the past decade renewable energy investments in developing countries – especially in China,
Brazil and India – grew steadily and overtook the total investment of OECD countries for the first time in 2015. The steady growth was to a large extent due to the fact that renewables are now one of the lowest cost options for new power generation.
09 WHAT THE EXPERTS THINK: DEVELOPMENT OF GLOBAL INVESTMENT VOLUMES BY 2050Over 60% of those interviewed expected the global
renewable investment volume to at least double from current levels, irrespective of region. Only 12% believed that the market volume would remain at around USD 250 billion to USD 300 billion, while the remaining 25% of experts anticipated a moderate increase to around USD 400 billion.
They foresaw continuing growth of the global renewable energy market over the next few decades. Not a single expert believed that the renewable energy volume would decline in the future, leading to a conclusion that there is strong confidence in the robustness of the global renewable industry.
RENEWABLE ENERGY WORK FORCESteady investments in renewable energy markets lead to stable development of companies and job creation. A wide range of different renewable energy technologies and services demand a global renewable energy workforce ranging from low- to very highly-skilled. There are no global standardised statistics about renewable energy employment by country and technology, and the borders between conventional- and renewable energy companies have in any case started to blur. That said, an estimate based on documented employment indicates
that the level of employment increased from about 3 million in 2004 to approximately 8.1 million by the end of 2015.33 Table 7 provides an overview of renewable energy employment by technology and regions in 2015.
Figure 34: What will the annual global investment volume in renewable energy be by 2050? (Status 2015: USD286)
33 REN21. 2016. Renewables 2016 Global Status Report (Paris: REN21 Secretariat).
79
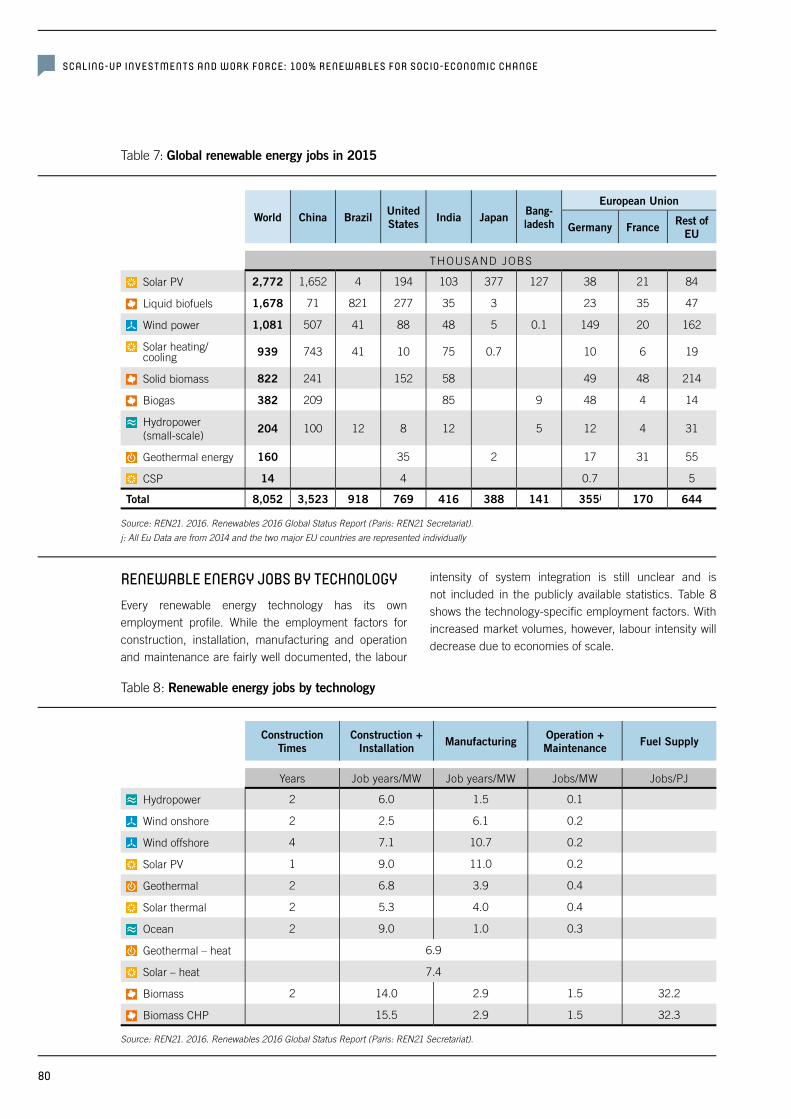
SCALING-UP INVESTMENTS AND WORK FORCE: 100% RENEWABLES FOR SOCIO-ECONOMIC CHANGE
World China Brazil United States India Japan Bang-
ladesh
European Union
Germany France Rest of EU
THOUSAND JOBS
Solar PV 2,772 1,652 4 194 103 377 127 38 21 84
Liquid biofuels 1,678 71 821 277 35 3 23 35 47
Wind power 1,081 507 41 88 48 5 0.1 149 20 162
Solar heating/ cooling 939 743 41 10 75 0.7 10 6 19
Solid biomass 822 241 152 58 49 48 214
Biogas 382 209 85 9 48 4 14
Hydropower (small-scale)
204 100 12 8 12 5 12 4 31
Geothermal energy 160 35 2 17 31 55
CSP 14 4 0.7 5
Total 8,052 3,523 918 769 416 388 141 355j 170 644
Table 7: Global renewable energy jobs in 2015
RENEWABLE ENERGY JOBS BY TECHNOLOGYEvery renewable energy technology has its own employment profile. While the employment factors for construction, installation, manufacturing and operation and maintenance are fairly well documented, the labour
intensity of system integration is still unclear and is not included in the publicly available statistics. Table 8 shows the technology-specific employment factors. With increased market volumes, however, labour intensity will decrease due to economies of scale.
Table 8: Renewable energy jobs by technology
Construction Times
Construction + Installation Manufacturing Operation +
Maintenance Fuel Supply
Years Job years/MW Job years/MW Jobs/MW Jobs/PJ
Hydropower 2 6.0 1.5 0.1
Wind onshore 2 2.5 6.1 0.2
Wind offshore 4 7.1 10.7 0.2
Solar PV 1 9.0 11.0 0.2
Geothermal 2 6.8 3.9 0.4
Solar thermal 2 5.3 4.0 0.4
Ocean 2 9.0 1.0 0.3
Geothermal – heat 6.9
Solar – heat 7.4
Biomass 2 14.0 2.9 1.5 32.2
Biomass CHP 15.5 2.9 1.5 32.3
Source: REN21. 2016. Renewables 2016 Global Status Report (Paris: REN21 Secretariat).
j: All Eu Data are from 2014 and the two major EU countries are represented individually
Source: REN21. 2016. Renewables 2016 Global Status Report (Paris: REN21 Secretariat).
80
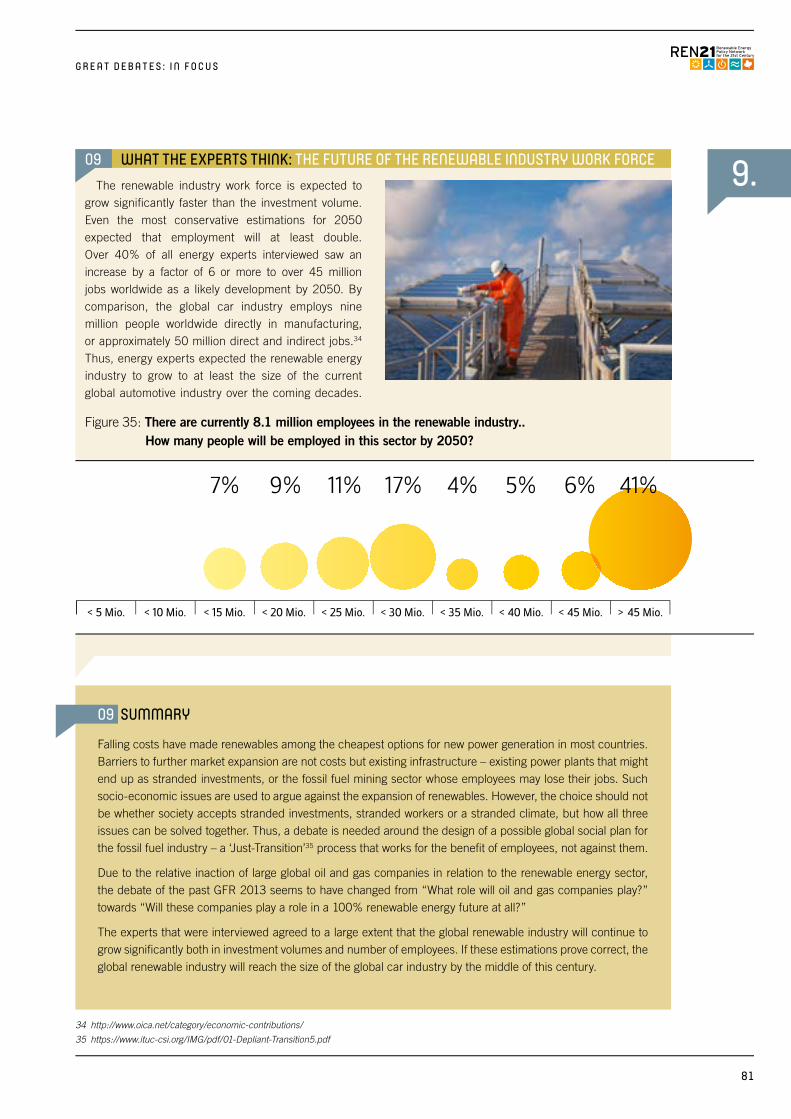
9.
< 5 Mio. < 10 Mio. < 15 Mio. < 20 Mio. < 25 Mio. < 30 Mio. < 35 Mio. < 40 Mio. < 45 Mio. > 45 Mio.
41%6%5%17%11%7% 9% 4%
G R E A T D E B A T E S : I N F O C U S
34 http://www.oica.net/category/economic-contributions/
35 https://www.ituc-csi.org/IMG/pdf/01-Depliant-Transition5.pdf
09 WHAT THE EXPERTS THINK: THE FUTURE OF THE RENEWABLE INDUSTRY WORK FORCEThe renewable industry work force is expected to
grow significantly faster than the investment volume. Even the most conservative estimations for 2050 expected that employment will at least double. Over 40% of all energy experts interviewed saw an increase by a factor of 6 or more to over 45 million jobs worldwide as a likely development by 2050. By comparison, the global car industry employs nine million people worldwide directly in manufacturing, or approximately 50 million direct and indirect jobs.34
Thus, energy experts expected the renewable energy industry to grow to at least the size of the current global automotive industry over the coming decades. Figure 35: There are currently 8.1 million employees in the renewable industry..
How many people will be employed in this sector by 2050?
09 SUMMARY
Falling costs have made renewables among the cheapest options for new power generation in most countries. Barriers to further market expansion are not costs but existing infrastructure – existing power plants that might end up as stranded investments, or the fossil fuel mining sector whose employees may lose their jobs. Such socio-economic issues are used to argue against the expansion of renewables. However, the choice should not be whether society accepts stranded investments, stranded workers or a stranded climate, but how all three issues can be solved together. Thus, a debate is needed around the design of a possible global social plan for the fossil fuel industry – a ‘Just-Transition’35 process that works for the benefit of employees, not against them.
Due to the relative inaction of large global oil and gas companies in relation to the renewable energy sector, the debate of the past GFR 2013 seems to have changed from “What role will oil and gas companies play?” towards “Will these companies play a role in a 100% renewable energy future at all?”
The experts that were interviewed agreed to a large extent that the global renewable industry will continue to grow significantly both in investment volumes and number of employees. If these estimations prove correct, the global renewable industry will reach the size of the global car industry by the middle of this century.
81
n INTRODUCTIONWhat will the utility of the future look like? Experts thinking
about market design and policies for future energy
markets have come to a virtual consensus that future
utilities will have little in common with today’s, and that
business models will need to change. But what will the
future energy market look like? What policies will serve
best to create a sustainable and long-term framework
with the kind of certainty required for the transition to a
market dominated by energy efficiency and renewables?
n SNAPSHOT 2013Four years ago, experts questioned how strong such
policies would need to be in the future, and how much
political will exists to either enact new (renewable) energy
and climate policies or even to maintain existing ones.
Finance experts discussed possible future carbon policies
and how such policies would affect renewable energy.
Thus, many high-renewable scenarios incorporated some
kind of carbon policy, such as carbon taxes or emissions
trading schemes. Moreover, policies for power grid
integration were identified as key areas for future policy.
The International Energy Agency’s World Energy Outlook
2010 concluded, “Policies to facilitate the integration of
variable renewables into networks are important. Such
policies can range from better planning for transmission
projects to the development of smart grids, the creation
of demand response mechanisms and the promotion of
storage technologies.”
One of the most heated policy discussions within the
power sector in 2013 was the future of feed-in policies.
Lower technology costs, higher support costs for
consumers with expanded markets and higher renewable
power shares on grids, sparked a debate especially in
Europe about how much longer those policy support
mechanisms would be needed. The evolution of many
support mechanisms beyond 2020 to meet changing
market conditions and power grid integration was at the
centre of the European renewable energy debate. The
renewable industry saw the need for continuing policies
through 2030 and beyond, particularly if new renewable
energy targets for 2030 were to be adopted. In the
context of solar photovoltaics, some experts believed that
solar PV feed-in tariffs would evolve over time into net
metering policies.
Additionally some experts pointed to purchases of green
power as a means to implement climate and sustainability
goals in a growing number of corporations as an
encouraging trend. However, some experts questioned
whether and to what extent such voluntary models could
support or even replace mandatory energy policies.
n WHERE WE ARE TODAY: RENEWABLE ENERGY POLICIES
The number of countries with renewable energy policies
has steadily increased over the past decade. At least 173
countries had introduced renewable energy targets by the
end of 2015 and an estimated 146 countries had support
policies in place for renewable technologies, mainly in the
power sector. There are five different areas of renewable
policy that require specific instruments:
1. Policies for electricity
2. Policies for heating and cooling
3. Renewable energy transport policies
4. City and local government renewable energy policies
5. Policies for energy access
The question is no longer whether renewables have a role
to play in the provision of energy services, but rather how
to incorporate existing policies into a coherent framework
that allows for the development of new business models.
10. UTILITIES OF THE FUTURE: WHAT WILL THEY LOOK LIKE?
G R E A T D E B A T E S : I N F O C U S
82
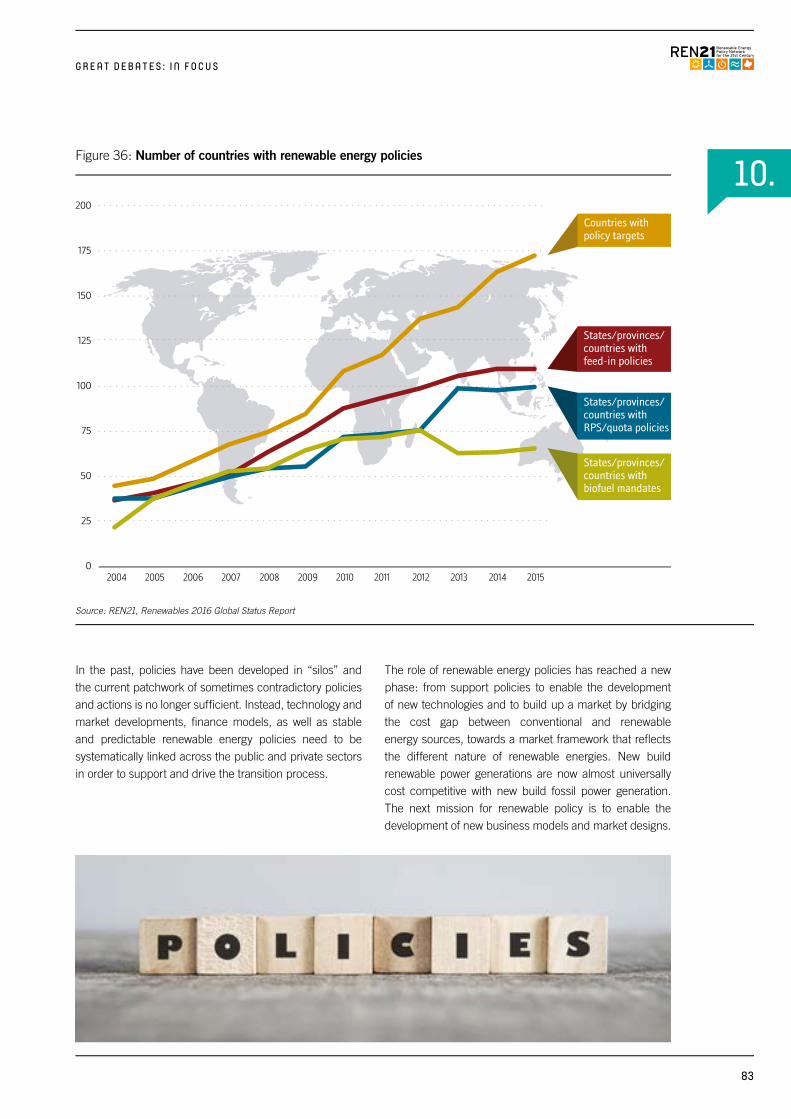
10. 200
175
150
125
100
75
50
25
02004 2005 2006 2007 2008 2009 2010 2011 2012 2013 2014 2015
Countries withpolicy targets
States/provinces/countries withbiofuel mandates
States/provinces/countries with RPS/quota policies
States/provinces/countries with feed-in policies
G R E A T D E B A T E S : I N F O C U S
In the past, policies have been developed in “silos” and the current patchwork of sometimes contradictory policies and actions is no longer sufficient. Instead, technology and market developments, finance models, as well as stable and predictable renewable energy policies need to be systematically linked across the public and private sectors in order to support and drive the transition process.
The role of renewable energy policies has reached a new phase: from support policies to enable the development of new technologies and to build up a market by bridging the cost gap between conventional and renewable energy sources, towards a market framework that reflects the different nature of renewable energies. New build renewable power generations are now almost universally cost competitive with new build fossil power generation. The next mission for renewable policy is to enable the development of new business models and market designs.
Figure 36: Number of countries with renewable energy policies
Source: REN21, Renewables 2016 Global Status Report
83

UTILITIES OF THE FUTURE: WHAT WILL THEY LOOK LIKE?
10 WHAT THE EXPERTS THINK: PAST EXPERIENCES AND FUTURE CHALLENGESExperts discussed how effective key policies had
been for the power, heating and cooling and transport sectors, drawing on their knowledge to date. Comments were also collected on what the future requirements would or could be.36
Inter-sectorial renewable energy policy:The carbon marketThere was a clear consensus that the climate debate supports the development of renewable energy. On a global level, however, half of the experts interviewed noted that a global carbon market would be required to seriously boost the renewable energy market. Interestingly the other half disagreed with this thesis or was undecided. This estimation was also reflected in a second question on the probability of a global carbon market by 2050. The experts who believed that a carbon market was needed supported the thesis that a global carbon market would be possible by 2050. The majority of carbon market supporters came from the USA, India and Australia and Oceania, while the majority of scepticism was observed among European and developing country experts.
Regulatory and fiscal majority feed-in tariffs were seen as the most efficient regulatory policy for the electricity sector over the past decade. There were significant regional differences, however, reflecting different country experiences. While European experts supported feed-in tariffs and saw tradeable certificates
as less favourable, the Australia and Oceania experts took the opposite view.
For the future, there was a sense that the importance of feed-in tariffs will decrease (though will still continue to be important to some degree), while the importance of tendering and net metering will grow significantly. These views support current developments of mature renewable electricity markets, where the investment volumes in tendering for centralised renewables and net metering for decentralised solar photovoltaic generators is increasing.
With regard to fiscal policies, no one scheme stood out as a clear favourite, which again reflects significant regional differences. As for future requirements, all of the five listed regulatory policy options received equal support. The only relatively clear result was that public loans and capital grants scored high across all regions.
The last part of the survey addressed power grid policy options. Several experts stated that power grid policies were among the most important measures for the development of future renewable energy markets. Furthermore, there was a clear majority recognizing the importance of grid (expansion) planning initiatives for future power markets. In addition, the experts ranked mandatory grid connection and priority access and dispatch equally high.
36 This chapter summarises the global results and highlights only some selected regional differences to maintain clarity for readers.
84
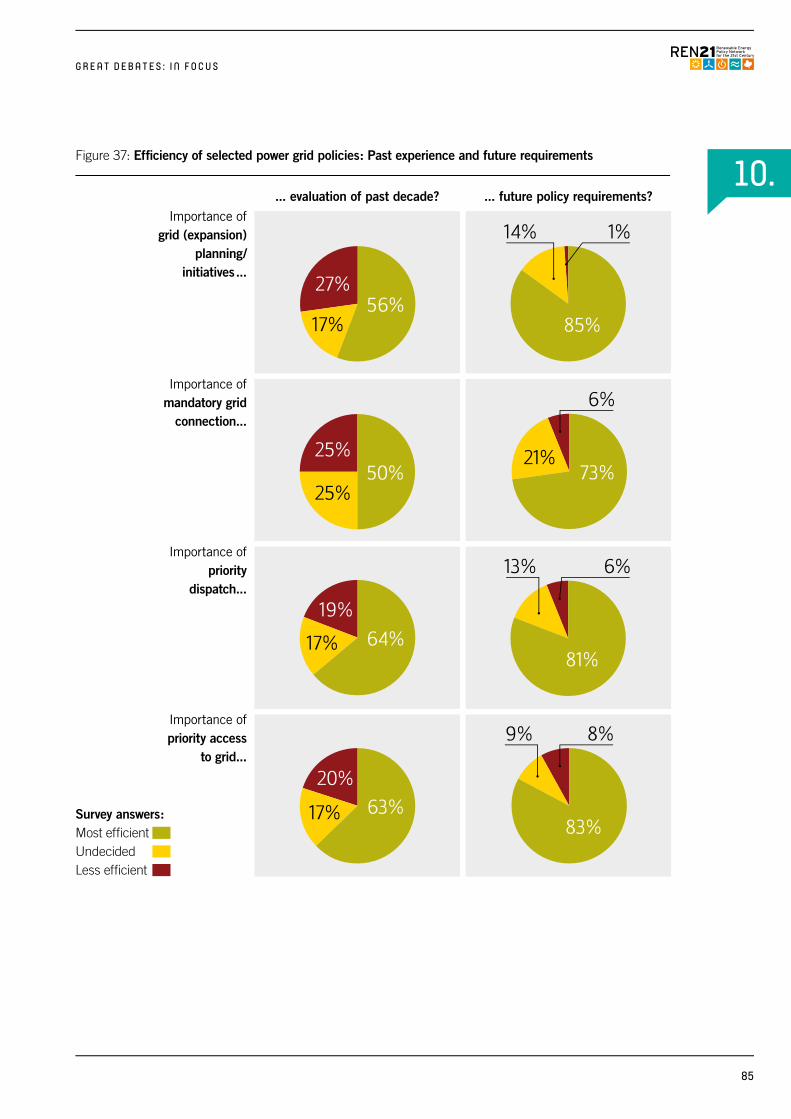
10. ... evaluation of past decade? ... future policy requirements?
Importance of grid (expansion)
planning/ initiatives...
85%
14% 1% 6%
56%17%
27%73%
21%
50%25%
25% 81%
13%
9%
6%
8%
64%17%
19%
83%63%
20%
17%
Importance of grid (expansion)planning/initiatives?
– Future Policy Requirements
Importance of grid (expansion)planning/initiatives?
– Evaluation of Past Decade
Importance mandatory grid connection?
– Future Policy Requirements
Importance mandatory grid connection?
– Evaluation of Past Decade
Importance of priority dispatch? – Future Policy Requirements
Importance of priority dispatch? – Evaluation of Past Decade
Importance of priority access to grid?
– Future Policy Requirements
Importance of priority access to grid?
– Evaluation of Past Decade
Less efficient Undecided Most efficient
Importance of mandatory grid
connection...
85%
14% 1% 6%
56%17%
27%73%
21%
50%25%
25% 81%
13%
9%
6%
8%
64%17%
19%
83%63%
20%
17%
Importance of grid (expansion)planning/initiatives?
– Future Policy Requirements
Importance of grid (expansion)planning/initiatives?
– Evaluation of Past Decade
Importance mandatory grid connection?
– Future Policy Requirements
Importance mandatory grid connection?
– Evaluation of Past Decade
Importance of priority dispatch? – Future Policy Requirements
Importance of priority dispatch? – Evaluation of Past Decade
Importance of priority access to grid?
– Future Policy Requirements
Importance of priority access to grid?
– Evaluation of Past Decade
Less efficient Undecided Most efficient
Importance of priority
dispatch...
85%
14% 1% 6%
56%17%
27%73%
21%
50%25%
25% 81%
13%
9%
6%
8%
64%17%
19%
83%63%
20%
17%
Importance of grid (expansion)planning/initiatives?
– Future Policy Requirements
Importance of grid (expansion)planning/initiatives?
– Evaluation of Past Decade
Importance mandatory grid connection?
– Future Policy Requirements
Importance mandatory grid connection?
– Evaluation of Past Decade
Importance of priority dispatch? – Future Policy Requirements
Importance of priority dispatch? – Evaluation of Past Decade
Importance of priority access to grid?
– Future Policy Requirements
Importance of priority access to grid?
– Evaluation of Past Decade
Less efficient Undecided Most efficient
Importance of priority access
to grid...
85%
14% 1% 6%
56%17%
27%73%
21%
50%25%
25% 81%
13%
9%
6%
8%
64%17%
19%
83%63%
20%
17%
Importance of grid (expansion)planning/initiatives?
– Future Policy Requirements
Importance of grid (expansion)planning/initiatives?
– Evaluation of Past Decade
Importance mandatory grid connection?
– Future Policy Requirements
Importance mandatory grid connection?
– Evaluation of Past Decade
Importance of priority dispatch? – Future Policy Requirements
Importance of priority dispatch? – Evaluation of Past Decade
Importance of priority access to grid?
– Future Policy Requirements
Importance of priority access to grid?
– Evaluation of Past Decade
Less efficient Undecided Most efficient
G R E A T D E B A T E S : I N F O C U S
Figure 37: Efficiency of selected power grid policies: Past experience and future requirements
Survey answers: Most efficient UndecidedLess efficient
85
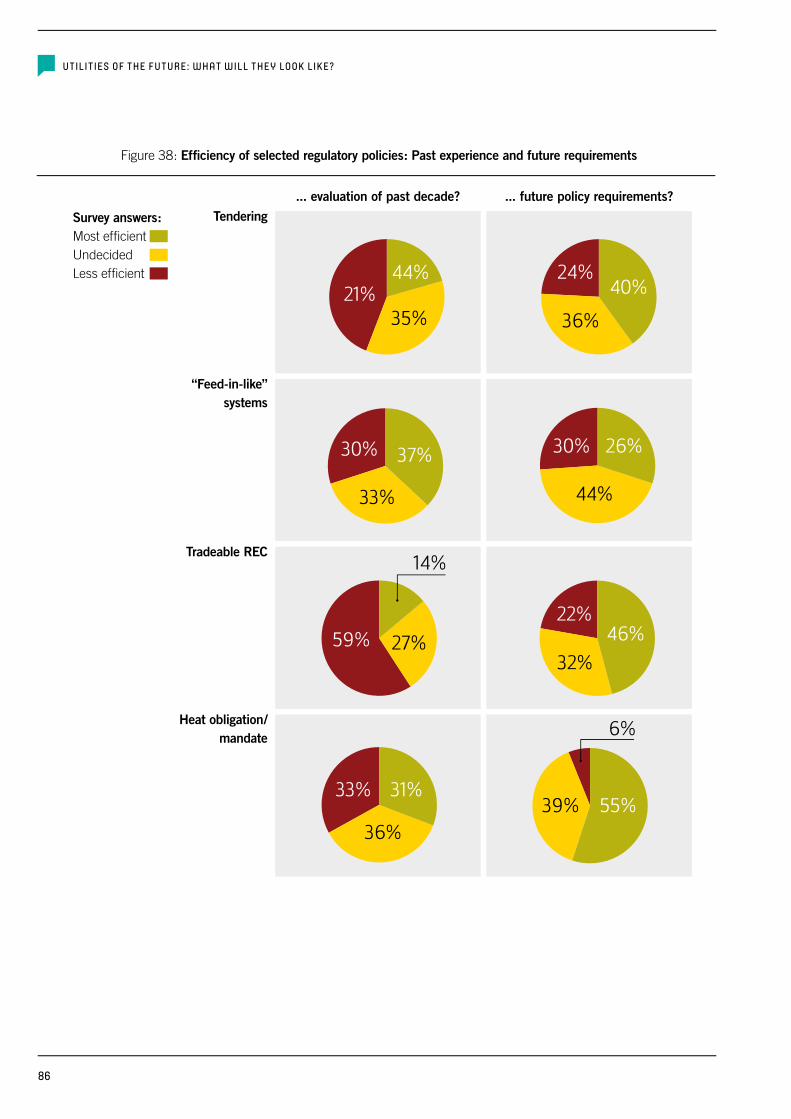
... evaluation of past decade? ... future policy requirements?Tendering
40%24%
36%
44%
35%21%
26%30%
44%
37%30%
33%
46%
39%
6%
14%
27%59%
55%31%33%
36%
Tendering – Future Policy Requirements
Tendering – Evaluation of Past Decade
“Feed-in-like” systems– Future Policy Requirements
“Feed-in-like” systems– Evaluation of Past Decade
Tradeable REC– Future Policy Requirements
Tradeable REC– Evaluation of Past Decade
Heat obligation/Mandate– Future Policy Requirements
Heat obligation/Mandate– Evaluation of Past Decade
Less efficient Undecided Most efficient
32%
22%
“Feed-in-like” systems
40%24%
36%
44%
35%21%
26%30%
44%
37%30%
33%
46%
39%
6%
14%
27%59%
55%31%33%
36%
Tendering – Future Policy Requirements
Tendering – Evaluation of Past Decade
“Feed-in-like” systems– Future Policy Requirements
“Feed-in-like” systems– Evaluation of Past Decade
Tradeable REC– Future Policy Requirements
Tradeable REC– Evaluation of Past Decade
Heat obligation/Mandate– Future Policy Requirements
Heat obligation/Mandate– Evaluation of Past Decade
Less efficient Undecided Most efficient
32%
22%40%
24%
36%
44%
35%21%
26%30%
44%
37%30%
33%
46%
39%
6%
14%
27%59%
55%31%33%
36%
Tendering – Future Policy Requirements
Tendering – Evaluation of Past Decade
“Feed-in-like” systems– Future Policy Requirements
“Feed-in-like” systems– Evaluation of Past Decade
Tradeable REC– Future Policy Requirements
Tradeable REC– Evaluation of Past Decade
Heat obligation/Mandate– Future Policy Requirements
Heat obligation/Mandate– Evaluation of Past Decade
Less efficient Undecided Most efficient
32%
22%
Tradeable REC
40%24%
36%
44%
35%21%
26%30%
44%
37%30%
33%
46%
39%
6%
14%
27%59%
55%31%33%
36%
Tendering – Future Policy Requirements
Tendering – Evaluation of Past Decade
“Feed-in-like” systems– Future Policy Requirements
“Feed-in-like” systems– Evaluation of Past Decade
Tradeable REC– Future Policy Requirements
Tradeable REC– Evaluation of Past Decade
Heat obligation/Mandate– Future Policy Requirements
Heat obligation/Mandate– Evaluation of Past Decade
Less efficient Undecided Most efficient
32%
22%
Heat obligation/ mandate
40%24%
36%
44%
35%21%
26%30%
44%
37%30%
33%
46%
39%
6%
14%
27%59%
55%31%33%
36%
Tendering – Future Policy Requirements
Tendering – Evaluation of Past Decade
“Feed-in-like” systems– Future Policy Requirements
“Feed-in-like” systems– Evaluation of Past Decade
Tradeable REC– Future Policy Requirements
Tradeable REC– Evaluation of Past Decade
Heat obligation/Mandate– Future Policy Requirements
Heat obligation/Mandate– Evaluation of Past Decade
Less efficient Undecided Most efficient
32%
22%
UTILITIES OF THE FUTURE: WHAT WILL THEY LOOK LIKE?
Figure 38: Efficiency of selected regulatory policies: Past experience and future requirements
Survey answers: Most efficientUndecidedLess efficient
86

10.
G R E A T D E B A T E S : I N F O C U S
10 WHAT THE EXPERTS THINK: RENEWABLE ENERGY POLICIES FOR THE HEATING SECTOR Responses to the question of whether regulatory or
fiscal policies are most efficient for the heating sector were equivocal and differ regionally. The debate is more active in industrialised countries, mainly due to a much larger heating demand for the residential sector. More importantly the responses indicate that the policy debate about renewable process heat is in a very early stage. It can be concluded, however, that regulatory policies were seen as the most efficient way to go in the future. The main argument in favour of regulatory policies – just as in the power sector – was the independence from public funding, making them less vulnerable to political interference.
With regard to regulatory policies, the preferred mechanisms differed significantly from the power sector. While feed-in and tendering systems were the preferred options, heat obligations, tradeable certificates and tendering programs were seen as the best policy schemes in this sector. As for fiscal policies, public investment loans, investment or tax credits and/or capital grants were recommended.
The renewable heating sector is decentralised and is not connected to an infrastructural system, unlike the power grid. Heat obligations and tradeable certificates, possibly in combination with soft loans – public or private – and tax based incentives in order to support financing of renewable heating equipment received the most support.
10 WHAT THE EXPERTS THINK: RENEWABLE ENERGY POLICIES FOR THE TRANSPORT SECTORThe transport sector is the most diverse with regard
to possible policy mechanisms, and regional differences were significant. Moreover, transport policies are usually related to urban planning rather than energy policies. This, coupled with a general unfamiliarity with the sector resulted in a low response rate. Therefore, only the results about regulatory policies for transport are presented here, while the other three policy categories – fiscal, traffic management & land use – are not included.
Regarding experience with renewable energy policies in the transport sector during the past decade, biofuel regulations and mandates for specific renewable energy
shares were seen as the most efficient and successful policies, followed by CO
2 regulations for cars. In the future, experts said they saw mandatory shares for renewables, mandates for maximum CO2 emission standards for vehicles and zero-emission vehicles as the most efficient. Green public procurement programmes – e.g. for electric vehicle fleets or busses operated with new alternative fuels such as bio fuel, synthetic fuels or hydrogen – were seen as promising. Furthermore, experts made clear that a variety of policies that address different aspects of transport: vehicle technology support; infrastructural changes; and behaviour change are needed.
87
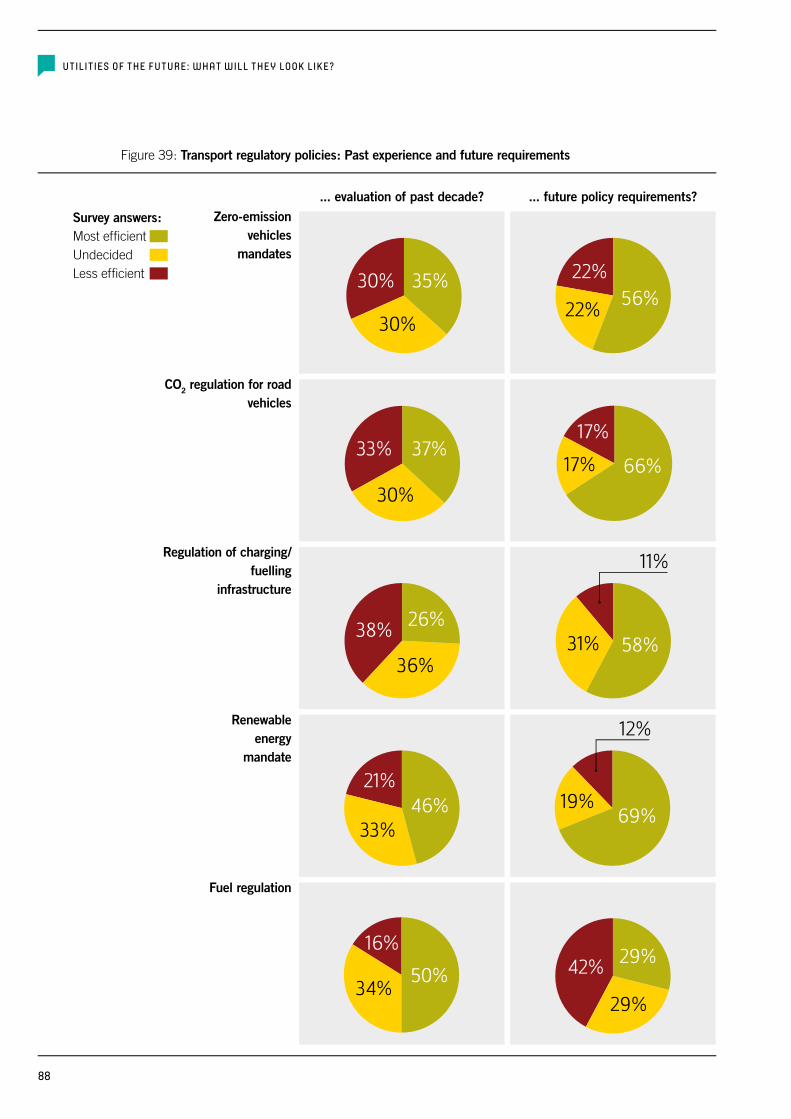
... evaluation of past decade? ... future policy requirements?Zero-emission
vehicles mandates
56%35%
30%
30%66%17%
37%33%
30%58%
19%
11%
12%
26%
36%
38%
69% 46%21%
33%
Zero Emission Vehicles mandates – Future Policy Requirements
Zero Emission Vehicles mandates – Evaluation of Past Decade
CO2 regulation for road vehicles – Future Policy Requirements
CO2 regulation for road vehicles – Evaluation of Past Decade
Regulation of charging/fuelling infrastructure
– Future Policy Requirements
Regulation of charging/fuelling infrastructure
– Evaluation of Past Decade
Renewable ernergy Mandate – Future Policy Requirements
Renewable ernergy Mandate – Evaluation of Past Decade
42% 50%
16%
34%
Fuel Regulation – Future Policy Requirements
Fuel Regulation – Evaluation of Past Decade
Less efficient Undecided Most efficient
22%
22%
17%
31%
29%
29%
CO2 regulation for road vehicles
56%35%
30%
30%66%17%
37%33%
30%58%
19%
11%
12%
26%
36%
38%
69% 46%21%
33%
Zero Emission Vehicles mandates – Future Policy Requirements
Zero Emission Vehicles mandates – Evaluation of Past Decade
CO2 regulation for road vehicles – Future Policy Requirements
CO2 regulation for road vehicles – Evaluation of Past Decade
Regulation of charging/fuelling infrastructure
– Future Policy Requirements
Regulation of charging/fuelling infrastructure
– Evaluation of Past Decade
Renewable ernergy Mandate – Future Policy Requirements
Renewable ernergy Mandate – Evaluation of Past Decade
42% 50%
16%
34%
Fuel Regulation – Future Policy Requirements
Fuel Regulation – Evaluation of Past Decade
Less efficient Undecided Most efficient
22%
22%
17%
31%
29%
29%
Regulation of charging/ fuelling
infrastructure
56%35%
30%
30%66%17%
37%33%
30%58%
19%
11%
12%
26%
36%
38%
69% 46%21%
33%
Zero Emission Vehicles mandates – Future Policy Requirements
Zero Emission Vehicles mandates – Evaluation of Past Decade
CO2 regulation for road vehicles – Future Policy Requirements
CO2 regulation for road vehicles – Evaluation of Past Decade
Regulation of charging/fuelling infrastructure
– Future Policy Requirements
Regulation of charging/fuelling infrastructure
– Evaluation of Past Decade
Renewable ernergy Mandate – Future Policy Requirements
Renewable ernergy Mandate – Evaluation of Past Decade
42% 50%
16%
34%
Fuel Regulation – Future Policy Requirements
Fuel Regulation – Evaluation of Past Decade
Less efficient Undecided Most efficient
22%
22%
17%
31%
29%
29%
Renewable energy
mandate
56%35%
30%
30%66%17%
37%33%
30%58%
19%
11%
12%
26%
36%
38%
69% 46%21%
33%
Zero Emission Vehicles mandates – Future Policy Requirements
Zero Emission Vehicles mandates – Evaluation of Past Decade
CO2 regulation for road vehicles – Future Policy Requirements
CO2 regulation for road vehicles – Evaluation of Past Decade
Regulation of charging/fuelling infrastructure
– Future Policy Requirements
Regulation of charging/fuelling infrastructure
– Evaluation of Past Decade
Renewable ernergy Mandate – Future Policy Requirements
Renewable ernergy Mandate – Evaluation of Past Decade
42% 50%
16%
34%
Fuel Regulation – Future Policy Requirements
Fuel Regulation – Evaluation of Past Decade
Less efficient Undecided Most efficient
22%
22%
17%
31%
29%
29%
Fuel regulation
56%35%
30%
30%66%17%
37%33%
30%58%
19%
11%
12%
26%
36%
38%
69% 46%21%
33%
Zero Emission Vehicles mandates – Future Policy Requirements
Zero Emission Vehicles mandates – Evaluation of Past Decade
CO2 regulation for road vehicles – Future Policy Requirements
CO2 regulation for road vehicles – Evaluation of Past Decade
Regulation of charging/fuelling infrastructure
– Future Policy Requirements
Regulation of charging/fuelling infrastructure
– Evaluation of Past Decade
Renewable ernergy Mandate – Future Policy Requirements
Renewable ernergy Mandate – Evaluation of Past Decade
42% 50%
16%
34%
Fuel Regulation – Future Policy Requirements
Fuel Regulation – Evaluation of Past Decade
Less efficient Undecided Most efficient
22%
22%
17%
31%
29%
29%
UTILITIES OF THE FUTURE: WHAT WILL THEY LOOK LIKE?
Figure 39: Transport regulatory policies: Past experience and future requirements
Survey answers: Most efficientUndecidedLess efficient
88
10.
G R E A T D E B A T E S : I N F O C U S
37 The Guardian, 2016, Intern-News: “Google to be powered 100% by renewable energy from 2017” – The Guardian Adam Vaughan, Wednesday 7 December 2016, https://www.theguardian.com/environment/2016/dec/06/google-powered-100-renewable-energy-2017
38 Greenpeace International, 2012, (GPI 2009), [re]enewables 24/7 – infrastructure needed to save the climate, Greenpeace International, November 2009
10 SUMMARY
There were significant regional differences in experts’ views in regard to power, heating and transport policies. During the interviews for this survey it became clear that the future market design and policy framework is the “Holy Grail” of the energy industry – across all sectors.
Power: Regarding the “Great Debate” topic from 2013 – “How will feed-in tariffs evolve” – the survey aimed to analyse whether regulatory policies or fiscal policies for electricity markets were more effective. For the past decade, the view was very diverse and there was no clear vote for either. For future requirements however, the vast majority of the experts interviewed favoured regulatory policies. Thus, there is a clear need for new market policy frameworks rather than individual financial incentives for selected technologies. As for voluntary programs, large international corporations are increasingly deciding in favour of renewable energy products either from utilities or through direct investment in their own generation. Google for example set itself a 100% renewable electricity target in 2012, which it is expected to achieve in 2017.37 However these initiatives augmented energy policies; they did not replace them.
Improving energy policies to increase the renewable power market remains a top of priority for the energy sector. Priorities shifted further towards inter-sectorial and infrastructural change supporting policies, away from carbon taxes and/or emissions trading. The importance of power grid integration policies was highlighted by stakeholders as diverse as the International Energy Agency (IEA) and Greenpeace International38 already in 2010, and they remain key for the future expansion of renewables.
Heating sector: Policies for heating are mainly being discussed in countries with a significant heating demand namely in Europe and North America. In contrast with the power sector, no specific policies gained the majority of experts’ support. On the contrary, many different options are still being discussed and the policy landscape is as fractured as the technology options themselves. Support mechanisms for industrial process heat are urgently needed for a 100% renewable energy future, but are far from being high on the agenda.
Transport sector: Policies for transport are the most diverse, as they span a range of topics: Urban planning and mobility concepts dominate the debates in the transport sector, while specific energy related issues play a secondary role. Consequently, increasing shares of renewables requires a cross sectorial and interdisciplinary discussion. While the most difficult topic for land transport might be the organisation of the modular shift such from road to rail, marine and aviation transport have the highest technical barriers of the transport sector.
89

n INTRODUCTIONThe previous GFR 2013 did address the issue of
megacities. With every second person in the world living in
an urbanised area, the issue of megacities and their effect on
energy infrastructure is becoming increasingly important.
In recent years the term “resilient cities” is cropping up
in many discussions and publications. The OECD defines
a resilient city as having “…the ability to absorb, recover
and prepare for future shocks (economic, environmental,
social & institutional). Resilient cities promote sustainable
development, well-being and inclusive growth.” The
International Council for Local Environmental Initiatives,39
an international association of local governments and
national and regional local governmental organizations that
have made a commitment to sustainable development,
uses the same definition and identifies requisite actions:
“Building resilience requires identifying and assessing
hazard risks, reducing vulnerability and exposure, and
lastly, increasing resistance, adaptive capacity, and
emergency preparedness.” 40
Cities also play a major role in adopting some of the world’s
most ambitious renewable energy goals and are leading the
rapidly expanding 100% renewables movement. “Energy
Cities” – the European Association of local authorities in
energy transition representing over 1,000 towns and cities
in 30 countries – recently addressed the issue of 100%
renewable energy within their network.41 Thus, urban projects
are key for increased acceptance by the general public.
Some technologies fit very well in urban areas such
as solar systems that can be installed on all building
structures. Other forms of renewable energy carriers
such as wind power, hydropower, concentrating solar
power, solid biomass and liquid biofuels usually needs
more space, and integration in urban areas is challenging.
n WHERE WE ARE TODAY: CITIES AND RENEWABLE ENERGY
In early 2000 over 50% of the world’s population had
concentrated in urban environments for the first time.41
Cities are home to over half of the world’s population
– 3.96 billion people – a number expected to grow to 5.1
billion by 2030.41 This proportion is very likely to continue
to grow over the next few decades and has profound
implications for a new urban future, one in which the
face and nature of our cities will change as they become
increasingly concentrated centres of human cultural,
social and economic activity.
Densely populated and highly urbanised regions
concentrate disaster risks, and cities are becoming more
vulnerable to shocks and stresses such as those resulting
from climate change.41 The urban resilience concept has
gained increased attention in the climate change debate
and is seen as way to help reduce this global threat with
highly localized consequences. Thus, reducing greenhouse
gases is clearly in the best interest of megacities.
11. MEGA CITIES: MEGA POSSIBILITIES
39 http://www.energy-cities.eu/IMG/pdf/publi_100pourcent_final-web.pdf
40 International Energy Agency, 2015, (IEA- 2009); IEA 2009; Cities, towns & Renewable energy – Yes In My Front Yard, OECD/IEA, 2009 International Energy Agency 9 rue de la Fédération 75739 Paris Cedex 15, France, ISBN: 978-92-64-07687-7
41 Untited Nations Department of Economic and Social Affairs, 2015, (UNDESA 2015); http://www.un.org/en/development/desa/news/2015.html
G R E A T D E B A T E S : I N F O C U S
90
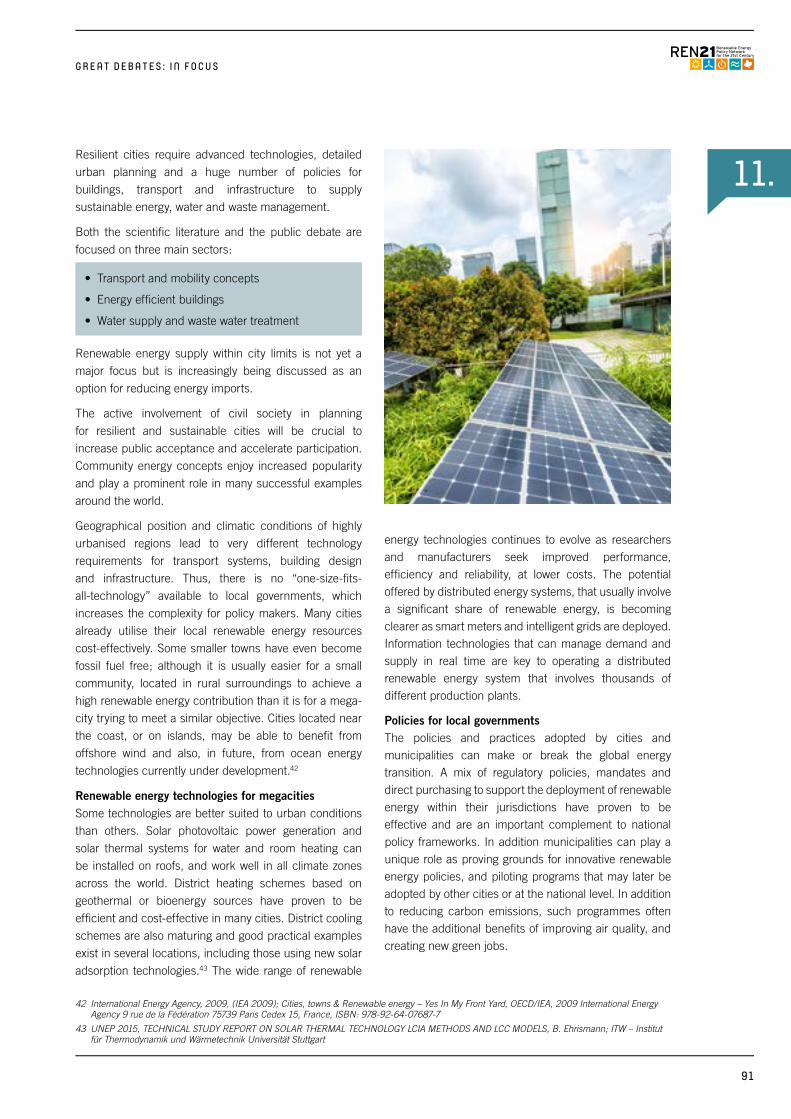
11.
G R E A T D E B A T E S : I N F O C U S
Resilient cities require advanced technologies, detailed
urban planning and a huge number of policies for
buildings, transport and infrastructure to supply
sustainable energy, water and waste management.
Both the scientific literature and the public debate are
focused on three main sectors:
• Transport and mobility concepts
• Energy efficient buildings
• Water supply and waste water treatment
Renewable energy supply within city limits is not yet a
major focus but is increasingly being discussed as an
option for reducing energy imports.
The active involvement of civil society in planning
for resilient and sustainable cities will be crucial to
increase public acceptance and accelerate participation.
Community energy concepts enjoy increased popularity
and play a prominent role in many successful examples
around the world.
Geographical position and climatic conditions of highly
urbanised regions lead to very different technology
requirements for transport systems, building design
and infrastructure. Thus, there is no “one-size-fits-
all-technology” available to local governments, which
increases the complexity for policy makers. Many cities
already utilise their local renewable energy resources
cost-effectively. Some smaller towns have even become
fossil fuel free; although it is usually easier for a small
community, located in rural surroundings to achieve a
high renewable energy contribution than it is for a mega-
city trying to meet a similar objective. Cities located near
the coast, or on islands, may be able to benefit from
offshore wind and also, in future, from ocean energy
technologies currently under development.42
Renewable energy technologies for megacitiesSome technologies are better suited to urban conditions
than others. Solar photovoltaic power generation and
solar thermal systems for water and room heating can
be installed on roofs, and work well in all climate zones
across the world. District heating schemes based on
geothermal or bioenergy sources have proven to be
efficient and cost-effective in many cities. District cooling
schemes are also maturing and good practical examples
exist in several locations, including those using new solar
adsorption technologies.43 The wide range of renewable
energy technologies continues to evolve as researchers and manufacturers seek improved performance, efficiency and reliability, at lower costs. The potential offered by distributed energy systems, that usually involve a significant share of renewable energy, is becoming clearer as smart meters and intelligent grids are deployed. Information technologies that can manage demand and supply in real time are key to operating a distributed renewable energy system that involves thousands of different production plants.
Policies for local governmentsThe policies and practices adopted by cities and municipalities can make or break the global energy transition. A mix of regulatory policies, mandates and direct purchasing to support the deployment of renewable energy within their jurisdictions have proven to be effective and are an important complement to national policy frameworks. In addition municipalities can play a unique role as proving grounds for innovative renewable energy policies, and piloting programs that may later be adopted by other cities or at the national level. In addition to reducing carbon emissions, such programmes often have the additional benefits of improving air quality, and creating new green jobs.
42 International Energy Agency, 2009, (IEA 2009); Cities, towns & Renewable energy – Yes In My Front Yard, OECD/IEA, 2009 International Energy Agency 9 rue de la Fédération 75739 Paris Cedex 15, France, ISBN: 978-92-64-07687-7
43 UNEP 2015, TECHNICAL STUDY REPORT ON SOLAR THERMAL TECHNOLOGY LCIA METHODS AND LCC MODELS, B. Ehrismann; ITW – Institut für Thermodynamik und Wärmetechnik Universität Stuttgart
91

Population (Mio.) Population proj.Annual Growth rate (%)
14,000,000
12,000,000
10,000,000
8,000,000
6,000,000
4,000,000
2,000,000
0
0.3
0.25
0.2
0.15
0.1
0.05
0
Residents Annual growth rate
1955 1960 1965 1970 1975 1980 1985 1990 1995 2000 2005 2010 2015 2020 2025 20301950
M E G A C I T I E S : M E G A P O S S I B I L I T I E S
Source: Data: World Population Review, California/USA, www.worldpopulationreview.com
44 http://worldpopulationreview.com/world-cities/bangkok-population/
Most megacities – especially in developing countries – have grown exponentially over the past few decades. Urban planning has not been able to keep pace. Bangkok for example has an estimated population of 8.2 million residents44 while the overall Bangkok metropolitan region is estimated to host 10.6 million people. Around 1820, Bangkok had less than 50,000 residents, which grew to around 1.2 million in 1950. Between 1950 and 1990, Bangkok’s population quadrupled in only 40 years. Infrastructure for transport, power supply, water and waste need to be expanded faster than urban planning processes could accommodate, especially given the limited financial resources of a developing country. Bangkok is certainly not alone in this regard.
Box 3: Fast growth: A challenge for cities in developing countries
Development of Bangkok’s population
92
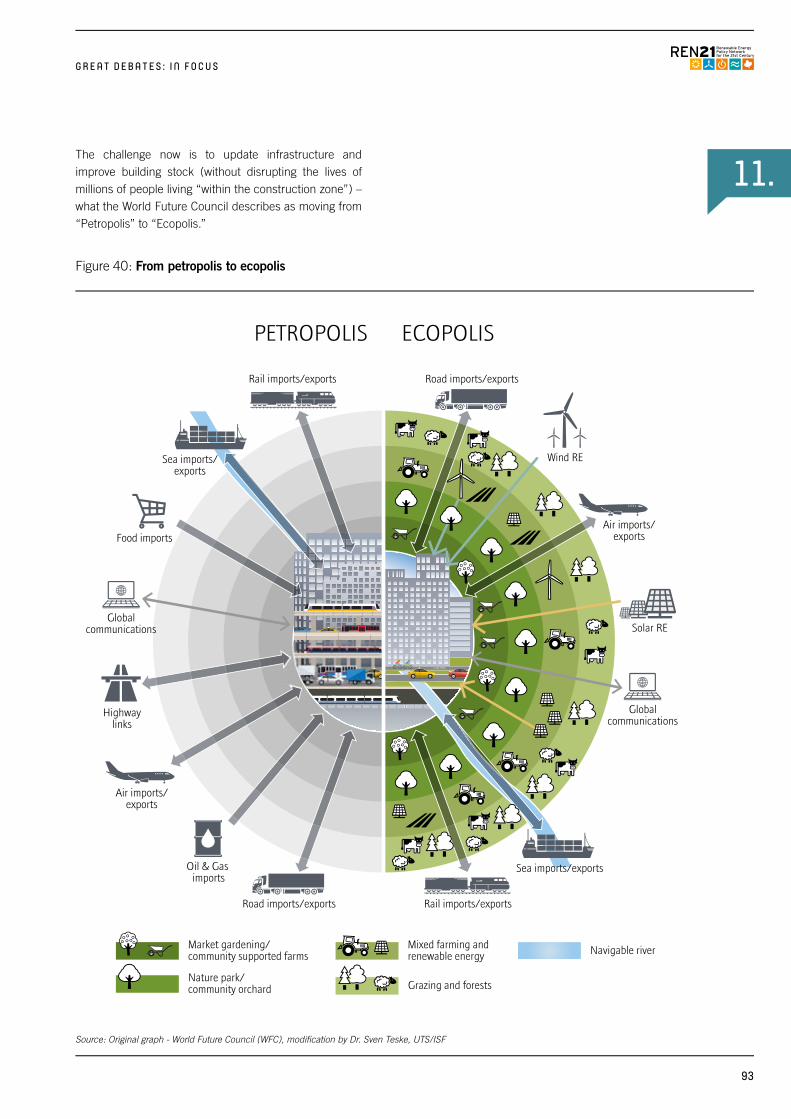
11.
Road imports/exports
Market gardening/community supported farms
Road imports/exports
PETROPOLIS ECOPOLIS
Rail imports/exports
Rail imports/exports
Sea imports/exports
Sea imports/exports
Food importsAir imports/
exports
Air imports/exports
Oil & Gas imports
Wind RE
Solar RE
Globalcommunications
Globalcommunications
Highwaylinks
Nature park/community orchard
Mixed farming and renewable energy
Grazing and forests
Navigable river
G R E A T D E B A T E S : I N F O C U S
Source: Original graph - World Future Council (WFC), modification by Dr. Sven Teske, UTS/ISF
The challenge now is to update infrastructure and improve building stock (without disrupting the lives of millions of people living “within the construction zone”) – what the World Future Council describes as moving from “Petropolis” to “Ecopolis.”
Figure 40: From petropolis to ecopolis
93
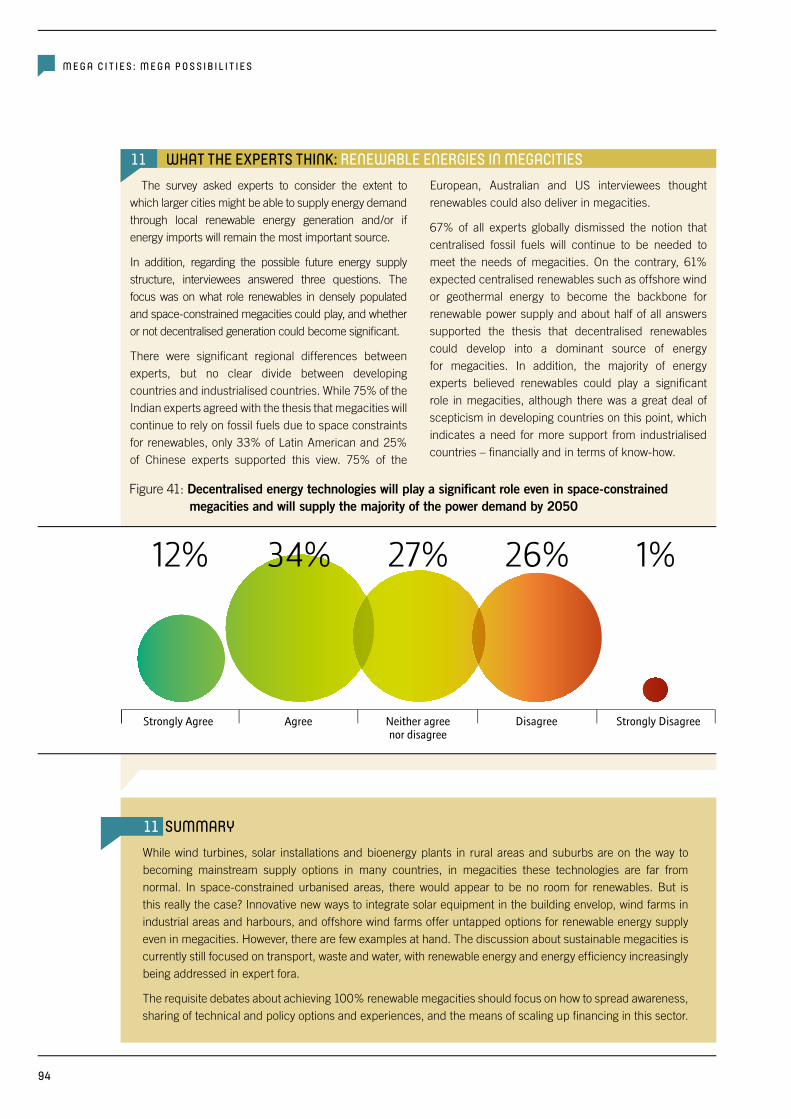
Strongly Agree Agree Neither agreenor disagree
Disagree Strongly Disagree
12% 34% 27% 26% 1%
M E G A C I T I E S : M E G A P O S S I B I L I T I E S
11 WHAT THE EXPERTS THINK: RENEWABLE ENERGIES IN MEGACITIES The survey asked experts to consider the extent to
which larger cities might be able to supply energy demand through local renewable energy generation and/or if energy imports will remain the most important source.
In addition, regarding the possible future energy supply structure, interviewees answered three questions. The focus was on what role renewables in densely populated and space-constrained megacities could play, and whether or not decentralised generation could become significant.
There were significant regional differences between experts, but no clear divide between developing countries and industrialised countries. While 75% of the Indian experts agreed with the thesis that megacities will continue to rely on fossil fuels due to space constraints for renewables, only 33% of Latin American and 25% of Chinese experts supported this view. 75% of the
European, Australian and US interviewees thought renewables could also deliver in megacities.
67% of all experts globally dismissed the notion that centralised fossil fuels will continue to be needed to meet the needs of megacities. On the contrary, 61% expected centralised renewables such as offshore wind or geothermal energy to become the backbone for renewable power supply and about half of all answers supported the thesis that decentralised renewables could develop into a dominant source of energy for megacities. In addition, the majority of energy experts believed renewables could play a significant role in megacities, although there was a great deal of scepticism in developing countries on this point, which indicates a need for more support from industrialised countries – financially and in terms of know-how.
Figure 41: Decentralised energy technologies will play a significant role even in space-constrained megacities and will supply the majority of the power demand by 2050
11 SUMMARYWhile wind turbines, solar installations and bioenergy plants in rural areas and suburbs are on the way to becoming mainstream supply options in many countries, in megacities these technologies are far from normal. In space-constrained urbanised areas, there would appear to be no room for renewables. But is this really the case? Innovative new ways to integrate solar equipment in the building envelop, wind farms in industrial areas and harbours, and offshore wind farms offer untapped options for renewable energy supply even in megacities. However, there are few examples at hand. The discussion about sustainable megacities is currently still focused on transport, waste and water, with renewable energy and energy efficiency increasingly being addressed in expert fora.
The requisite debates about achieving 100% renewable megacities should focus on how to spread awareness, sharing of technical and policy options and experiences, and the means of scaling up financing in this sector.
94
12. 12. ENERGY ACCESS ENABLED THROUGH RENEWABLES: HOW TO SPEED UP CONNECTIONS?
n INTRODUCTIONThe growth of megacities and the slow process of providing access to energy services are closely related and in many cases are two sides of the same coin. There is an exodus of young people in particular from rural areas to large cities in search of professional opportunities. Access to energy is fundamental for economic prosperity. For well over a billion people around the world, obtaining access to the energy required to meet very basic needs remains a daily struggle. In many rural areas of developing countries – as well as some urban slums and peri-urban areas – connections to central electric grids are economically prohibitive and may take decades to materialise, if at all.45
n SNAPSHOT 2013The GFR 2013 identified the future of coal power in India relative to renewables as one of the great debates in the context of energy access for developing countries. Experts believed that a key choice facing India would be whether to increase imported coal for power generation or to turn increasingly to renewable energy for the majority of new power investment. Some experts said that the answer depended heavily on the availability and price of imported coal (and on future expectations in this regard). One expert, however, noted already in late 2012 that there was no business case for new coal plants as India’s largest industry conglomerate Tata‘s had announced it would build only renewables in future given their economic advantages. Some experts underlined the expected growth of GDP and population which would exacerbate chronic power shortages, and said coal would remain a viable option.
n WHERE WE ARE TODAY: ACCESS TO ENERGY SERVICES – RECENT PROGRESS HAS BEEN TOO SLOW TO REACH NEW OBJECTIVES
Whether rapidly developing economies need centralised conventional power plants or not still is an important topic and the debate about energy access needs to find more answers especially in regard to energy supply for industries. Renewable energy programs for developing countries are still almost exclusively focused on small-scale applications. This is starting to change, however. Take India, for example: as costs have come down, over the past four years India has dramatically increased its renewable energy investments In 2015, India ranked among the top five countries with regard to annual investment and/or net capacity additions for hydropower, wind, solar water heating and solar photovoltaic. Furthermore, the first solar photovoltaic market figures for 2016 indicate that India has surpassed China for the first time, with over 17 GW of new installed capacity. A draft plan released in December 2016 by India’s Central Electricity Authority (CEA), noted that the country has no room for further generation capacity beyond the 50 GW coal plants currently under construction, and recommended no further thermal power generation through 2027 while India develops an additional 100 GW of solar and wind capacity.46
In 2013, the UN Secretary General initiated the “Sustainable Energy for All” initiative which was aimed at accelerating the pace of providing energy access for the least developed countries. The first step was to create a central database making previously dispersed information available to decision makers. The World Bank and the IEA – in cooperation with a number of other energy
45 REN21. 2016. Renewables 2016 Global Status Report (Paris: REN21 Secretariat).
46 http://www.climatechangenews.com/2016/12/16/india-to-halt-building-new-coal-plants-in-2022/
G R E A T D E B A T E S : I N F O C U S
95
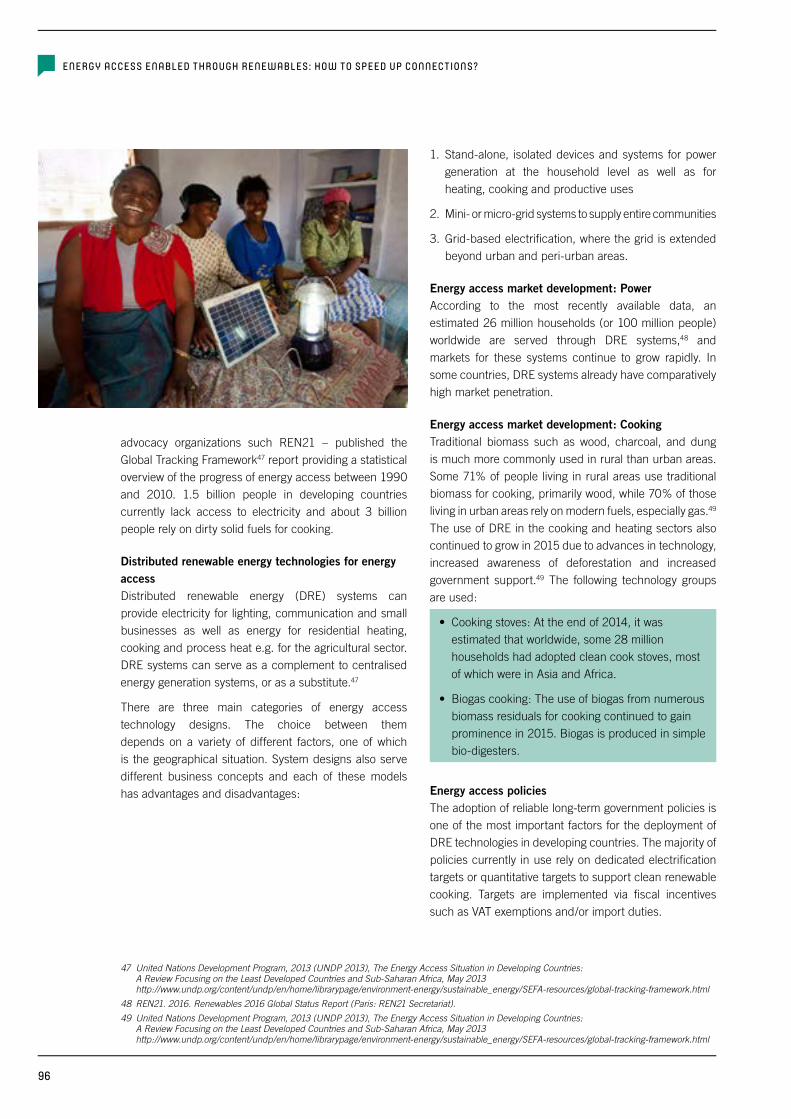
ENERGY ACCESS ENABLED THROUGH RENEWABLES: HOW TO SPEED UP CONNECTIONS?
advocacy organizations such REN21 – published the Global Tracking Framework47 report providing a statistical overview of the progress of energy access between 1990 and 2010. 1.5 billion people in developing countries currently lack access to electricity and about 3 billion people rely on dirty solid fuels for cooking.
Distributed renewable energy technologies for energy access Distributed renewable energy (DRE) systems can provide electricity for lighting, communication and small businesses as well as energy for residential heating, cooking and process heat e.g. for the agricultural sector. DRE systems can serve as a complement to centralised energy generation systems, or as a substitute.47
There are three main categories of energy access technology designs. The choice between them depends on a variety of different factors, one of which is the geographical situation. System designs also serve different business concepts and each of these models has advantages and disadvantages:
1. Stand-alone, isolated devices and systems for power generation at the household level as well as for heating, cooking and productive uses
2. Mini- or micro-grid systems to supply entire communities
3. Grid-based electrification, where the grid is extended beyond urban and peri-urban areas.
Energy access market development: PowerAccording to the most recently available data, an estimated 26 million households (or 100 million people) worldwide are served through DRE systems,48 and markets for these systems continue to grow rapidly. In some countries, DRE systems already have comparatively high market penetration.
Energy access market development: Cooking Traditional biomass such as wood, charcoal, and dung is much more commonly used in rural than urban areas. Some 71% of people living in rural areas use traditional biomass for cooking, primarily wood, while 70% of those living in urban areas rely on modern fuels, especially gas.49 The use of DRE in the cooking and heating sectors also continued to grow in 2015 due to advances in technology, increased awareness of deforestation and increased government support.49 The following technology groups are used:
• Cooking stoves: At the end of 2014, it was estimated that worldwide, some 28 million households had adopted clean cook stoves, most of which were in Asia and Africa.
• Biogas cooking: The use of biogas from numerous biomass residuals for cooking continued to gain prominence in 2015. Biogas is produced in simple bio-digesters.
Energy access policiesThe adoption of reliable long-term government policies is one of the most important factors for the deployment of DRE technologies in developing countries. The majority of policies currently in use rely on dedicated electrification targets or quantitative targets to support clean renewable cooking. Targets are implemented via fiscal incentives such as VAT exemptions and/or import duties.
47 United Nations Development Program, 2013 (UNDP 2013), The Energy Access Situation in Developing Countries: A Review Focusing on the Least Developed Countries and Sub-Saharan Africa, May 2013 http://www.undp.org/content/undp/en/home/librarypage/environment-energy/sustainable_energy/SEFA-resources/global-tracking-framework.html
48 REN21. 2016. Renewables 2016 Global Status Report (Paris: REN21 Secretariat).
49 United Nations Development Program, 2013 (UNDP 2013), The Energy Access Situation in Developing Countries: A Review Focusing on the Least Developed Countries and Sub-Saharan Africa, May 2013 http://www.undp.org/content/undp/en/home/librarypage/environment-energy/sustainable_energy/SEFA-resources/global-tracking-framework.html
96
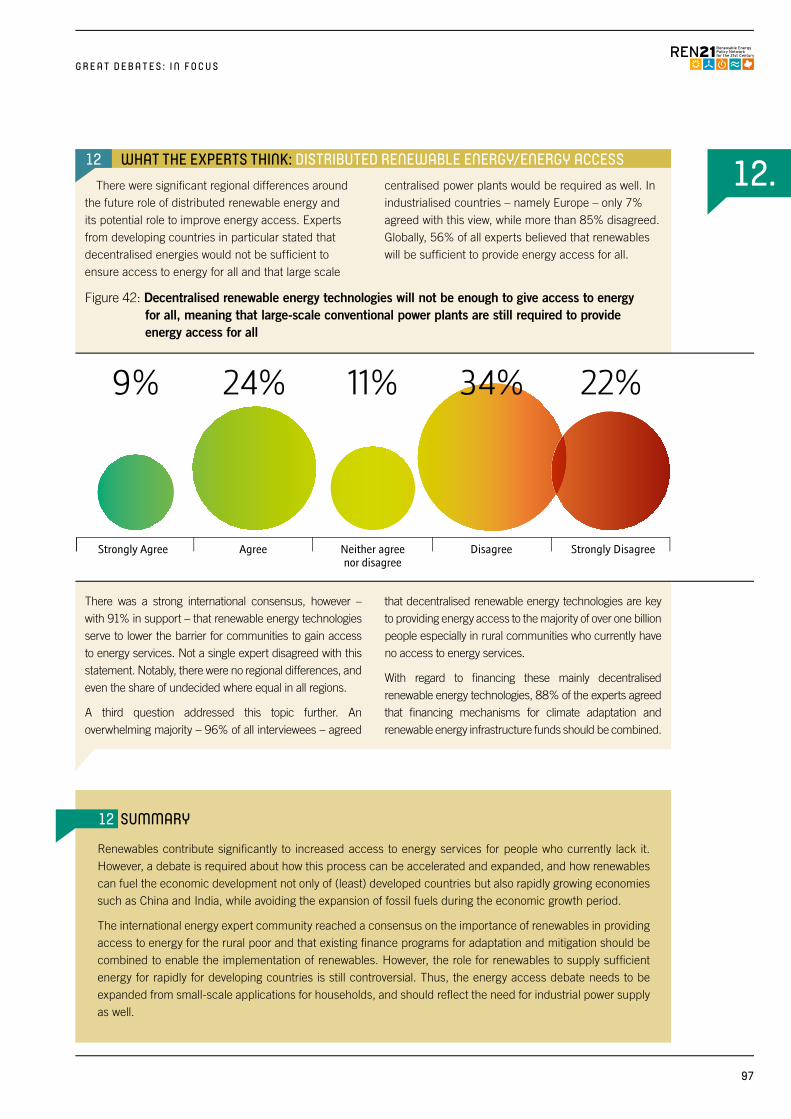
12.
Strongly Agree Agree Neither agreenor disagree
Disagree Strongly Disagree
9% 24% 11% 34% 22%
G R E A T D E B A T E S : I N F O C U S
There was a strong international consensus, however – with 91% in support – that renewable energy technologies serve to lower the barrier for communities to gain access to energy services. Not a single expert disagreed with this statement. Notably, there were no regional differences, and even the share of undecided where equal in all regions.
A third question addressed this topic further. An overwhelming majority – 96% of all interviewees – agreed
that decentralised renewable energy technologies are key to providing energy access to the majority of over one billion people especially in rural communities who currently have no access to energy services.
With regard to financing these mainly decentralised renewable energy technologies, 88% of the experts agreed that financing mechanisms for climate adaptation and renewable energy infrastructure funds should be combined.
12 WHAT THE EXPERTS THINK: DISTRIBUTED RENEWABLE ENERGY/ENERGY ACCESSThere were significant regional differences around
the future role of distributed renewable energy and its potential role to improve energy access. Experts from developing countries in particular stated that decentralised energies would not be sufficient to ensure access to energy for all and that large scale
centralised power plants would be required as well. In industrialised countries – namely Europe – only 7% agreed with this view, while more than 85% disagreed. Globally, 56% of all experts believed that renewables will be sufficient to provide energy access for all.
Figure 42: Decentralised renewable energy technologies will not be enough to give access to energy for all, meaning that large-scale conventional power plants are still required to provide energy access for all
12 SUMMARY
Renewables contribute significantly to increased access to energy services for people who currently lack it. However, a debate is required about how this process can be accelerated and expanded, and how renewables can fuel the economic development not only of (least) developed countries but also rapidly growing economies such as China and India, while avoiding the expansion of fossil fuels during the economic growth period.
The international energy expert community reached a consensus on the importance of renewables in providing access to energy for the rural poor and that existing finance programs for adaptation and mitigation should be combined to enable the implementation of renewables. However, the role for renewables to supply sufficient energy for rapidly for developing countries is still controversial. Thus, the energy access debate needs to be expanded from small-scale applications for households, and should reflect the need for industrial power supply as well.
97
REN21 Secretariat c/o UN Environment Economy Division 1 Rue Miollis Building VII F-75015 Paris France
www.ren21.net
RENEWABLES GLOBAL FUTURES REPORTGREAT DEBATES TOWARDS 100 % RENEWABLE ENERGY
ISB
N 9
78-3
-981
8107
-4-5