Embed Size (px)
Citation preview

Renewables and natural gas2008.9.7 in Groningen
Netherlands
Renewables and Natural Gas
in the industrial sector
SG5.1 Tatsuo Kume
Aksel Hauge Pedersen
Guy Verkest
SG5.1
2008.9.7
Renewables and natural gas2008.9.7 in Groningen
Netherlands
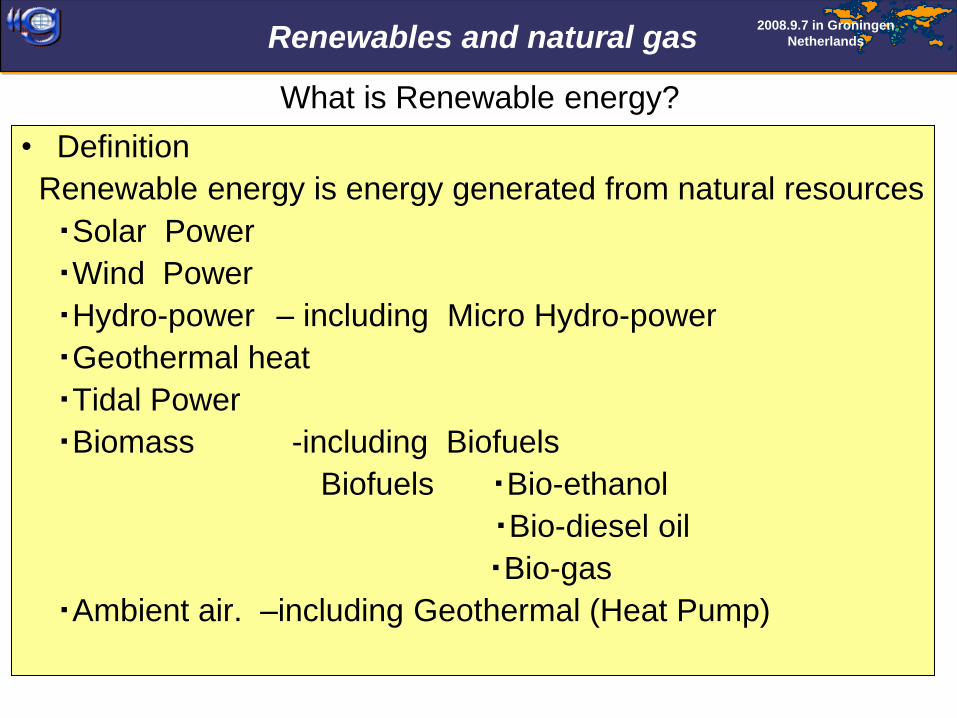
What is Renewable energy?
• Definition
Renewable energy is energy generated from natural resources
・Solar Power
・Wind Power
・Hydro-power – including Micro Hydro-power
・Geothermal heat
・Tidal Power
・Biomass -including Biofuels
Biofuels ・Bio-ethanol
・Bio-diesel oil
・Bio-gas
・Ambient air. –including Geothermal (Heat Pump)

Renewables and natural gas2008.9.7 in Groningen
Netherlands
GHP 4kW
GHP 25kW
EHP 4.5kW
Heat pump water
heater
Heat pumpBiomass
Biogas
Biomass
Wood chip fired
Boiler280t/h
Steam Turbine
Hydropower GeothermalWind power Solar power
EHP
GHP

Renewables and natural gas2008.9.7 in Groningen
Netherlands
Annual Growth of Renewables Supply from 1971 to 2004
2.2% 2.3% 2.1%2.6%
8.2%
0%
2%
4%
6%
8%
10%
12%
TPES Renew ables CRW Hydro Other**
an
nu
al
gro
wth
ra
te
7.5%
28 .1%
48.1%
0.3%
G e o t h e rm a l S o la r W in d T id e , o t h e r
Fuel Shares of World Total Primary Energy Supply,2004
Geothermal
0.414%
Solar 0.039%
Wind 0.064%
Tide, 0.0004%Nuclear
6.5%
Renewable Combustibles
and Waste
10.4%
Hydro
2.2%
Other
0.5%
Non-Renew. Waste
0.2%
Oil
34.3%
Coal
25.1%
Gas
20.9%
Renewables
13.1%
Renewables occupied 13.1% of the world TPES in 2004.
Out of renewables, traditional biomass such as renewable combustibles and waste
occupied ~80%, the hydro power 16.7%, wind power only 0.5%, and solar power 0.3%.
Wind power + Solar power is still less than 0.1% of TPES in2004.
However recent growth rates of these two are far much higher than other renewables.
Source: IEA renewable energy policy analysis by Samantha Ölz 2006
Geothermal Solar Wind
An
nu
al
gro
wth
ra
te
0%
12%
TPES OthersHydroAll RENs
8.2%
CRW
Hydro
CRW

Renewables and natural gas2008.9.7 in Groningen
Netherlands
** Other: Geothermal, Wind, Solar, Tide
Fuel Shares of World Electricity Generation, 2004
Other**
0.8%
Hydro
16.1%
Non-Renew .
Waste
0.3%Gas
19.6%
Coal
39.8%
Oil
6.7%
Renew able
Combustible
s and Waste
1.0%
Nuclear
15.7%
Renew ables
17.9%
Wind power and solar power occupied less than 1% of all
Power generation in the world in 2004.
Source: IEA renewable energy policy analysis by Samantha Ölz 2006

Renewables and natural gas2008.9.7 in Groningen
Netherlands
World renewable energy consumption by sector, 2004
Industry Sector 11.3%Other Transformation
and Energy Sectors
5.6%
Other Sectors 3.3%
Electricity Plants
21.9%
Residential,
Commercial and
Public Sectors 57.9%
Source: IEA renewable energy policy analysis by Samantha Ölz 2006
This graph shows
most renewables are use in the residential, commercial and public sectors.
in industrial sector, about 11% of renewables are used.
Most of them are the combustible renewables such as Biomass like wood chips,
black liquor, garbage, and industrial wastes.
Recently in some countries in EU , thanks to assistance and the subsidy of
the government, industrial customers have been introducing boilers and
CHPs with biogas and biomass fuels combined with NG.

Renewables and natural gas2008.9.7 in Groningen
Netherlands
Regional shares 2004
Hydro
Combustible
Renewables
and Waste
Others (or
“New”)
OECD
OECD
OECD
Former USSROECD Africa Latin America Non-OECD Asia
China Non-OECD Europe
OECD
OECD
Middle East
45.1%
3.1%21.0%
6.8%
12.6%
8.8%0.6%2.0%
66.1%
26.0%
1.8%
1.4%0.6%
3.5%
24.2%
7.6%
33.0%
0.7%0.5%
0.1%
14.6%19.2%
Geothermal
0.414%
Solar 0.039%
Wind 0.064%
Tide, 0.0004%
Nuclear
6.5%
Renewable Combustibles
and Waste
10.4%
Hydro
2.2%
Other
0.5%
Non-Renew. Waste
0.2%
Oil
34.3%
Coal
25.1%
Gas
20.9%
Renewables
13.1%CRW
Hydro
Others
OECD
OECD
OECD

Renewables and natural gas2008.9.7 in Groningen
Netherlands
Renewables in Industrial sector• General description
・Traditionally in biomass processing factory, such as food processing or wood processing factory have disposed a large amount of biomass wastes such as food residue and wood chips when the product was processed, these wastes was used as the energy source of the factory.
・ In the political and economical aspect, recently, in the OECD countries, some percentage of renewable energy use is imposed by government, and also the subsidy for renewable energy introduction is set by government.
・ In the technological aspect , a lot of splendid technologies for renewables have been developed. For example, the cost of the highly efficient solar panel which can be installed on the roofs and walls of the factory has been lowered. As for biogas, several kinds of highly efficient biogas engines have been developed, and the cost of refining equipment of biogas has been lowered.
・ Some industrial customers have begun to sell surplus electricity or surplus steam generated
by renewables.
・ Normally industrial customers use huge amount of energy and need stable and high quality energy. Example Currency , Voltage of Electricity. Pressure, Temperature of Steam
In this aspect, it is very difficult to manage to supply stable energy by only renewables. So natural gas plays an important role as a complement energy.

Renewables and natural gas2008.9.7 in Groningen
Netherlands
Category : Machinery
World largest PV system installed factory
Power storage
Increasing cases of setting up photovoltaic power generation on the roof tops of assembly plants such
as machine shops since the roofs of such factories are wide and flat. But it cannot supply much energy
in a year (~1000 hours in generation time) , and not to be able to install only a PV panel of the ability of
1Kw at 10m2. Renewables occupies only 5.5% in capacity and 0.7% in total electric consumption.
Example:
Roof top type Thin-film, see-through type
Total 129kWTotal 5150kW
Fuel cellsCHP
Percentage of Renewables less than 1%
10,000kW
PV generation systemSuperconducting
Magnetic typeMolten-carbonate
type
250kw 4Units
Natural gas fired
Gas engine type
2880kw 9Units
Fuelcell
1.1%
CapacityTotal
Electricity
Consumption
PV
CHP
PV
CHP
UtilityUtility
Fuelcell
0.7%
25.4%
3.3%
66.6%
756Gwh/y92,040kW
65.1%
28.2%
5.5%
Key data of the plant
PV power 5,210kW(Total space 47,700m2)
CHP 11,520kW(at No1 Plant) 14,400kW (at No2 Plant)
Fuel Cell 1,000kWEnergy storage SystemSuperconducting Magnetic 10,000kW
Capacitor 10,000kWx2units
2,721,600GJ/y

Renewables and natural gas2008.9.7 in Groningen
Netherlands
Example:
Gas engine
Percentage of Renewables 5-10%Category : Food processing brewery
UASB reactor
Gas engine
2087kW
JenbacherTotal
5,550,090GJ/y
Utility
Power
30.5%
Heavy
Oil6.2%
Natural
gas
57.3%
Power bybiogas
Steam by biogas
6%
Key data of the plant
Company A Beer company group 14 Plants
total
Product Beer 2,407000kl/y
Whisky , other Beverage etc
Waste water 16,916,000m3 /y 14total
Amount of biogas 13,931,000 Nm3/y
Gas engine Jenbacher 2087kW etc.
Food processing companies such as brewery exhaust large amount of effluent that contains a high concentration organic compound. Conventionally the effluent is treated by an activated sludge treatment method. Recently from the viewpoint of energy conservation, many breweries have adopted the anaerobic fermentation method. In the long run, large amount of biogas has been generated, and used for power generation by co-generation system, which covers 5%-30% of the power of the entire factory.And Percentage of renewables in total energy consumption of the factory is about 5-10%.
Activated sludge
process equipment
Renewables and natural gas2008.9.7 in Groningen
Netherlands
Bark residue
Example:
Steam turbineSaw dust
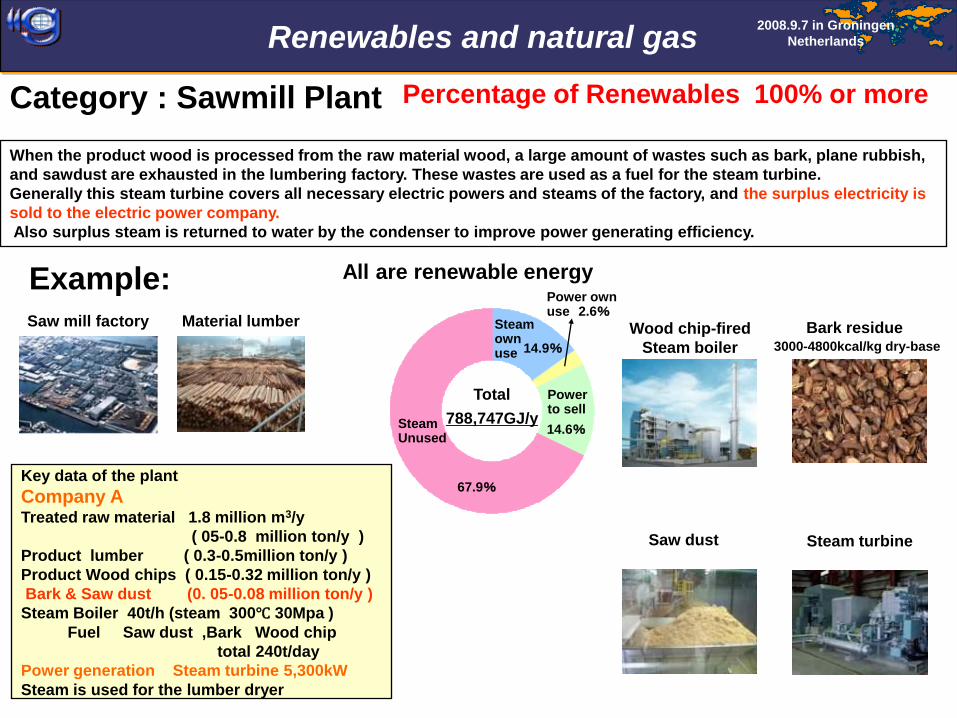
Percentage of Renewables 100% or more
3000-4800kcal/kg dry-base
Wood chip-fired
Steam boiler
Category : Sawmill Plant
When the product wood is processed from the raw material wood, a large amount of wastes such as bark, plane rubbish,
and sawdust are exhausted in the lumbering factory. These wastes are used as a fuel for the steam turbine.
Generally this steam turbine covers all necessary electric powers and steams of the factory, and the surplus electricity is
sold to the electric power company.
Also surplus steam is returned to water by the condenser to improve power generating efficiency.
Key data of the plant
Company ATreated raw material 1.8 million m3/y
( 05-0.8 million ton/y )
Product lumber ( 0.3-0.5million ton/y )
Product Wood chips ( 0.15-0.32 million ton/y )
Bark & Saw dust (0. 05-0.08 million ton/y )
Steam Boiler 40t/h (steam 300℃ 30Mpa )
Fuel Saw dust ,Bark Wood chip
total 240t/day
Power generation Steam turbine 5,300kW
Steam is used for the lumber dryer
Saw mill factory Material lumber
Total
788,747GJ/y
Steam ownuse
Power ownuse 2.6%
Power to sell
SteamUnused
14.9%
67.9%
14.6%
All are renewable energy

Renewables and natural gas2008.9.7 in Groningen
Netherlands
Category : Paper mill
Black Liquor
The paper mill industry consumes the large quantity of energy.
This industry overwhelmingly uses the largest amount of renewable energy for all industrial sectors at the
same time. If paper is made from the wood chip, about 2/3 of the necessary energy can be covered with
black liquor that is the by-product of the pulp. In the case paper is made from recycled paper, a lot of
additional fossil fuels are necessary. To decrease CO2 emission, the natural gas plays an important role.
Paper mill plants use a lot of water, so some of them have a hydro power plant by themselves.
Example:
Hydro Power PlantBlack liquor
concentrator
Percentage of Renewables 30-66%
3000-3600kcal/kg
Key data of the plant
Company A Renewable ratio 66%Product Paper from all pure pulp
Production 1,215,000 ton/y
Black Liquor 3000 ton/d dry -base
oil conservation 320,000kl /y
Black liquor–fired Steam boiler 600ton/h
Steam temp. 505 ℃ Pressure 10.3 Mpa
Steam turbine total capacity 120,000kw
(85,000+35,000)
Key data of the plant
Company B 9Plants average
Renewable ratio 38%Product Paper for news paper etc
Production Total 4,957,381 ton/y
Hydro power Plant 5,2050kW 5plants
RPF-fired Steam boiler 260ton/h etc
Some plants are located near big cities, main material is used paper, in this case, main fuel is fossil fuel and waste such as paper sludge and RPF.
Black Liquor-fired
Steam boiler
Fossil
Fuel total
35.5%
Renewables
38.2%
Utility
Power
13.9%
Waste
RPF etc
12.4%
Total
3,411,268kL
Renewables
67%
Utility Power
7%
HeavyOil
18%
NaturalGas8%
Total
475,000kL
【Crude Oil equivalent】
18,382,500GJ/y
132,015,956GJ/y 9Plants total

Renewables and natural gas2008.9.7 in Groningen
Netherlands
Flow of sewage treatment
Aeration tank
Dewaterer
Anaerobic digesterIncinerator
Energy consumption rate in
sewage treatment plants
Sludge
Biogas engine
Biogas
Hot water
Biogas
A lot of biomass energy gathers into the sewage treatment plants
(STP). STP use a lot of electricity and heat energy especially for
aeration and incineration. STP began to use biogas as the fuel for
warming the anaerobic digester, incineration, and co-generation
system by biogas engine.
Recently, utilization of sludge as fuel is beginning.
Category : Sewage treatment plant Percentage of Renewables about5-10%
total
416,640GJ/y
Renewables
(Biogas)
5%
Utility
Power
Heavy
Oil
14.3%
Natural
Gas
16%
64.7%
Example: Sewage Treatment Plant
Processing quantity of sewage: 238mil ton/Y

Renewables and natural gas2008.9.7 in Groningen
Netherlands
Category: Incineration Plant Percentage of Renewables more than 40%
A lot of renewable energy derives from this incineration plant.
Waste heat of incineration is used for power generation by the steam turbine. In this case, if steam
turbine uses only flue gas from incineration plant ,about 60-70% percentage of the power is derived
from renewables. (30-40% of components of garbage are plastics ,not renewables.) But the
generation efficiency is relatively low ,about 15-20%, because flue gas of incineration plant contains
acid gas such as HCl , and the steam temperature is limited less than 300ºC.
In some EU nations and in Japan, to improve this efficiency , steam is reheated with the high
temperature flue gas from gas-fired turbine, and steam temperature is raised up to about 350ºC. As a
result the efficiency of steam turbine improves into 20-25%, leading total efficiency improvement. In
this case , the contribution of renewables in generated power is about 40%-50%,and the renewable
percentage becomes lower, but total power from renewables will increases. So this system
contributes to CO2 reduction. About 2/3 of generated power is sold to the power utilities.
Example: Key data of the plant
Garbage:460t/ day
Calorific value of garbage
2300kcal/kg
Out put of steam turbine:12,400kW
Break down
Renewable :7,050kW
Others :3,020kW
Flue gas of gas turbine :2,330kW
Out put of gas turbine :4,100kW
Total power :16,500kW
Gas-turbine combined
incineration system
Day/Night
ratio 3.5:S/T
:G/T
: power to
sell
(Time)
Power generation by Garbage Incineration
5,000
10,000
15,000
20,000
00 5 10 15 20 23
Boiler GT
Generated
Power&
Sold
Power
(kWh)
Incinerator GeneratorST
Natural
gas
Steam2.2Mpa×378℃
CondenserDeaerator 144℃
2.7Mpa
300℃
358℃
113℃ 67℃
4,100kW
super heater
Superheater
12,400kW
Steam
163℃
293,878GJ/y

Renewables and natural gas2008.9.7 in Groningen
Netherlands
Example: Canned fruit and Juice
Gas engine
Percentage of Renewables 3-15%Category : Food processing in Spain
UASB reactorKey data of the plant Nufuri Spain
Company A fruit processing & juice manufacturing
Product canned Fruit Juice etc
Waste water 2040000m3 /y Fruit residue 100t/d
Amount of biogas 10,200,000 Nm3/y
Biogas engine Jenbacher 2500kW⋇2units
Natural gas engine Jenbacher 2700kW⋇3units
Solar power 80000kW
Canned food of fruit and juice manufacturing company in Spain. All power is covered in the self power
generation , and the surplus electricity is sold to the electric power company. In this case, waste heat
is fully used to the process, subsidy is paid about 3.5 eurocent/kwh for NG-fired CHP system, and about
6.5eurocent/kwh for biogas fired CHP.
Activate sludge
Treatment reactor
Naturalgas
86.5%
Biogas
10.6%
Soler
Power
2.9%
total
275GJ/y
13.5%
V=7000m3
T=38℃ 18day
Aerobic Fermentor
約300m3/h
Anaerobic Fermentor
Microbial desulphurization
H₂S:8000ppm H₂S:150ppm
GasHolder
1500m3/h
Sludge
Hot water from GE 95℃+Steam
Biogas+NG2500kW
Biogas+NG2500kW
NG2700kW
NG2700kW
NG2700kW
Waste heatBoiler
Primary Sludgedryer
Biomassfired biler
Biogas
Biogas
NaturalGas
Branchof fruit
Residueof fruit
WasteWater
Anaerobic fermentor
(UASB)
Sludge Dryer


![Hammond Pearce Challenges to Renewables in a More Abundant Natural Gas World.012110.Ppt[1]](https://img.pdfslide.us/doc/110x75/577d23e61a28ab4e1e9b1684/hammond-pearce-challenges-to-renewables-in-a-more-abundant-natural-gas-world012110ppt1.jpg)