Embed Size (px)
Citation preview
© OECD/IEA, 2016
Renewable energy markets and global climate goals
Nordic cleantech cooperation in Africa:
Needs, opportunities, challenges and solutions COP22, Marrakech November 9, 2016
Liwayway Adkins
Environment and Climate Change Unit International Energy Agency
© OECD/IEA, 2016
The IEA works around the world to support an
accelerated clean energy transition that is
enabled by real-world SOLUTIONS
supported by ANALYSIS
and built on DATA
© OECD/IEA 2015
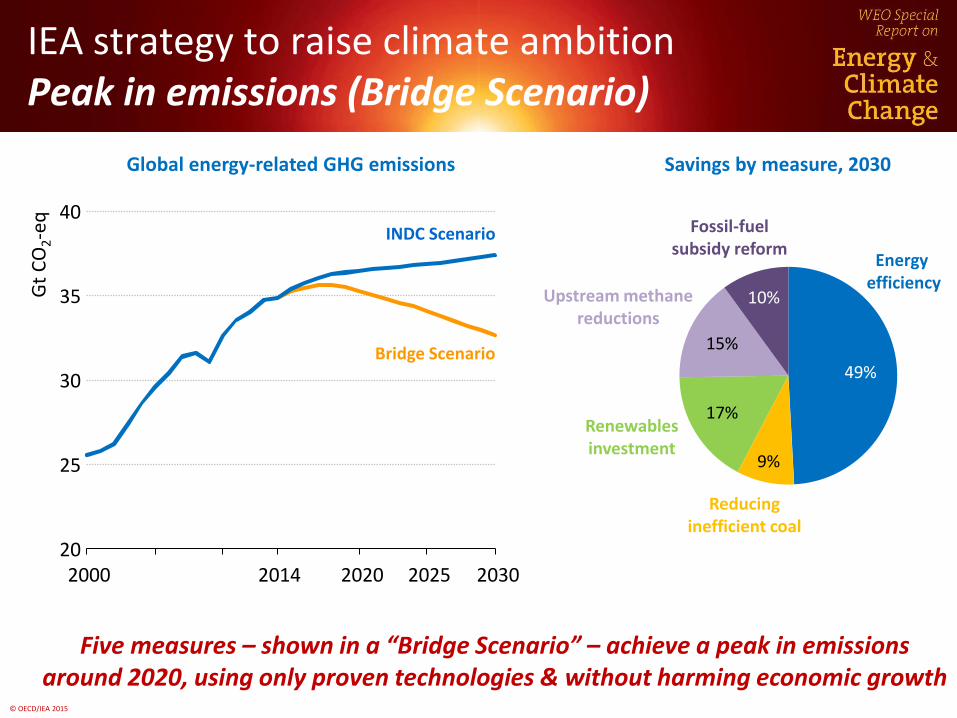
IEA strategy to raise climate ambition Peak in emissions (Bridge Scenario)
Global energy-related GHG emissions
20
25
30
35
40
2000 2014 2020 2025 2030
Gt
CO
2-e
q
Bridge Scenario
INDC Scenario
49%
17%
15%
10%
Savings by measure, 2030
Energy efficiency
Reducing inefficient coal
Renewables investment
Upstream methane reductions
Fossil-fuel subsidy reform
9%
Five measures – shown in a “Bridge Scenario” – achieve a peak in emissions around 2020, using only proven technologies & without harming economic growth
© OECD/IEA, 2016
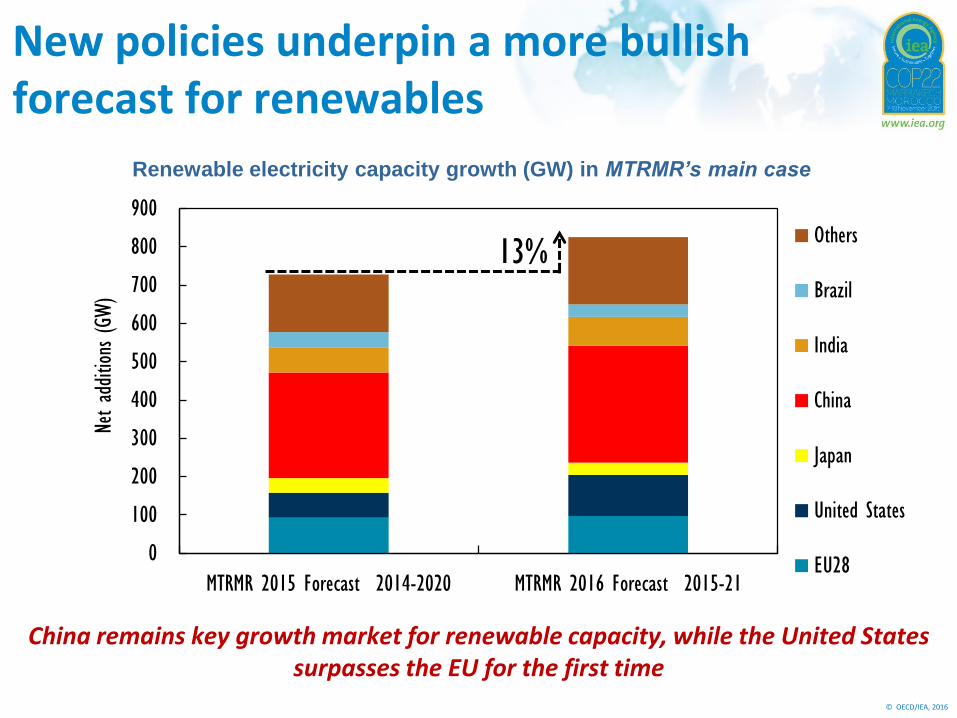
New policies underpin a more bullish forecast for renewables
China remains key growth market for renewable capacity, while the United States surpasses the EU for the first time
Renewable electricity capacity growth (GW) in MTRMR’s main case
13%
0
100
200
300
400
500
600
700
800
900
MTRMR 2015 Forecast 2014-2020 MTRMR 2016 Forecast 2015-21
Net ad
ditio
ns (GW
)
Others
Brazil
India
China
Japan
United States
EU28
© OECD/IEA, 2016
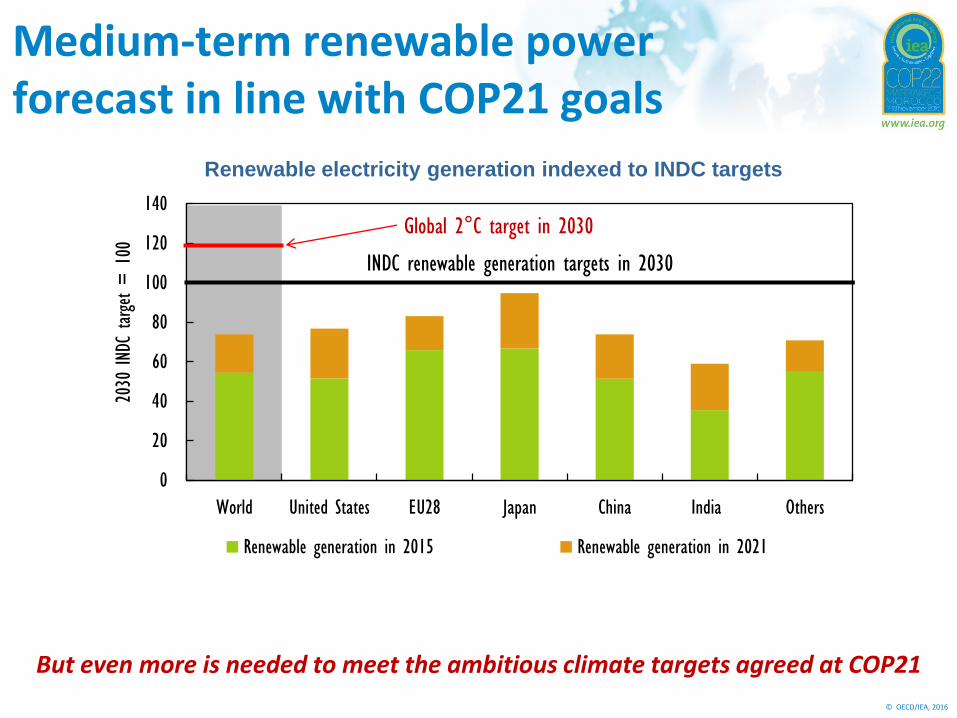
Medium-term renewable power forecast in line with COP21 goals
But even more is needed to meet the ambitious climate targets agreed at COP21
Renewable electricity generation indexed to INDC targets
0
20
40
60
80
100
120
140
World United States EU28 Japan China India Others
2030
IND
C target =
100
Renewable generation in 2015 Renewable generation in 2021
INDC renewable generation targets in 2030
Global 2°C target in 2030
© OECD/IEA, 2016
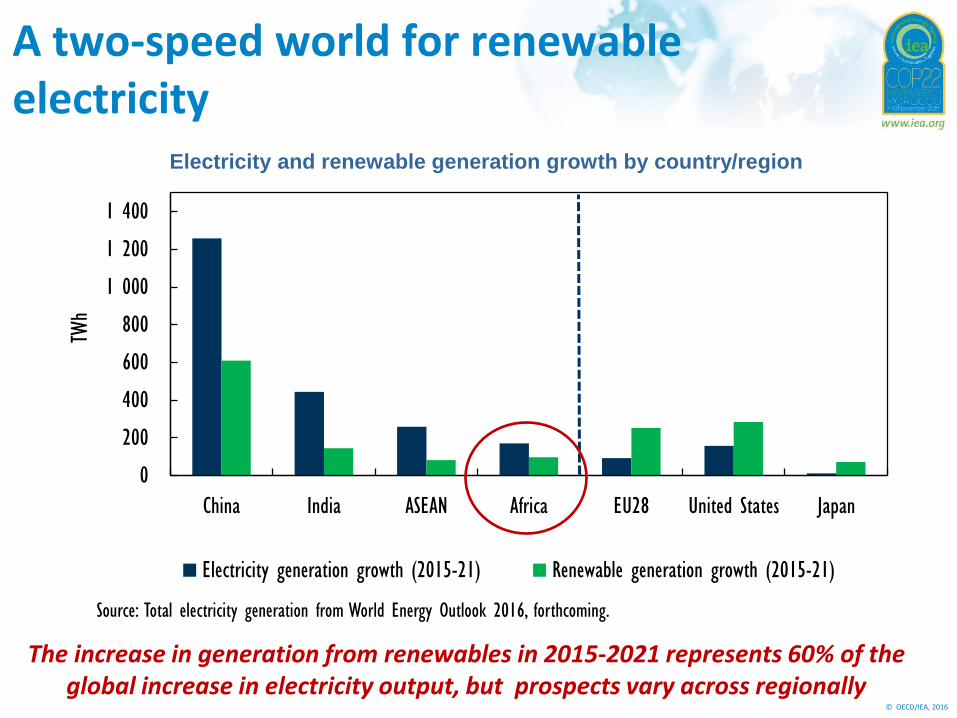
A two-speed world for renewable electricity
The increase in generation from renewables in 2015-2021 represents 60% of the global increase in electricity output, but prospects vary across regionally
Electricity and renewable generation growth by country/region
0
200
400
600
800
1 000
1 200
1 400
China India ASEAN Africa EU28 United States Japan
TWh
Electricity generation growth (2015-21) Renewable generation growth (2015-21)
Source: Total electricity generation from World Energy Outlook 2016, forthcoming.
© OECD/IEA, 2016
0
20
40
60
80
100
120
140
2009-15 2015-21
Gene
ratio
n grow
th (TW
h)
Fossil
Fuels/Other
Hydropower
Other
Renewables
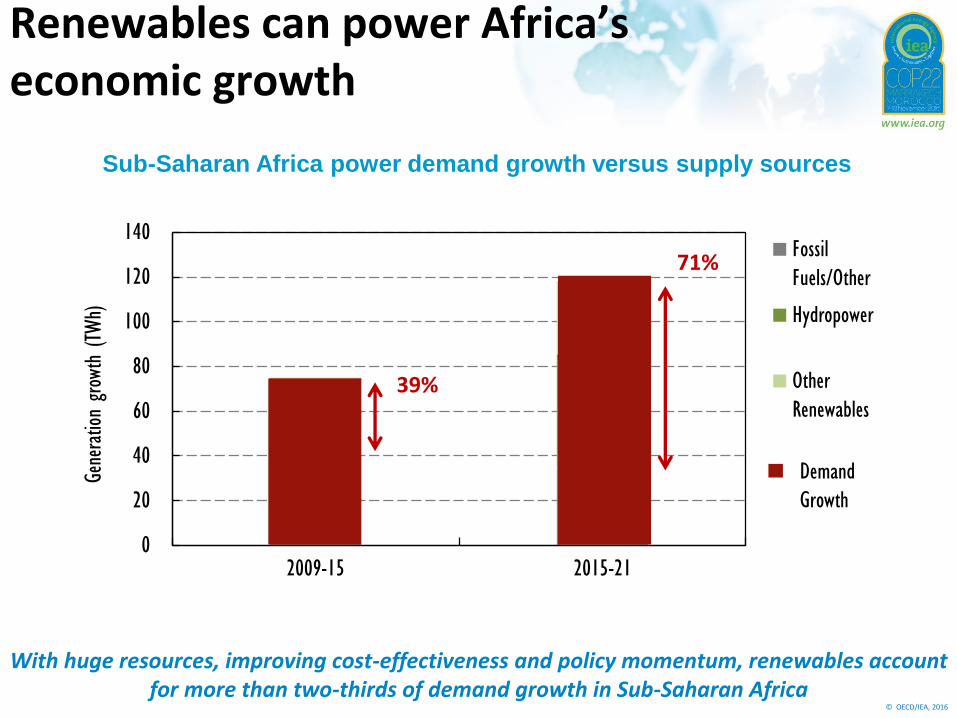
Renewables can power Africa’s economic growth
With huge resources, improving cost-effectiveness and policy momentum, renewables account for more than two-thirds of demand growth in Sub-Saharan Africa
Sub-Saharan Africa power demand growth versus supply sources
Demand
Growth
39%
71%
© OECD/IEA, 2016
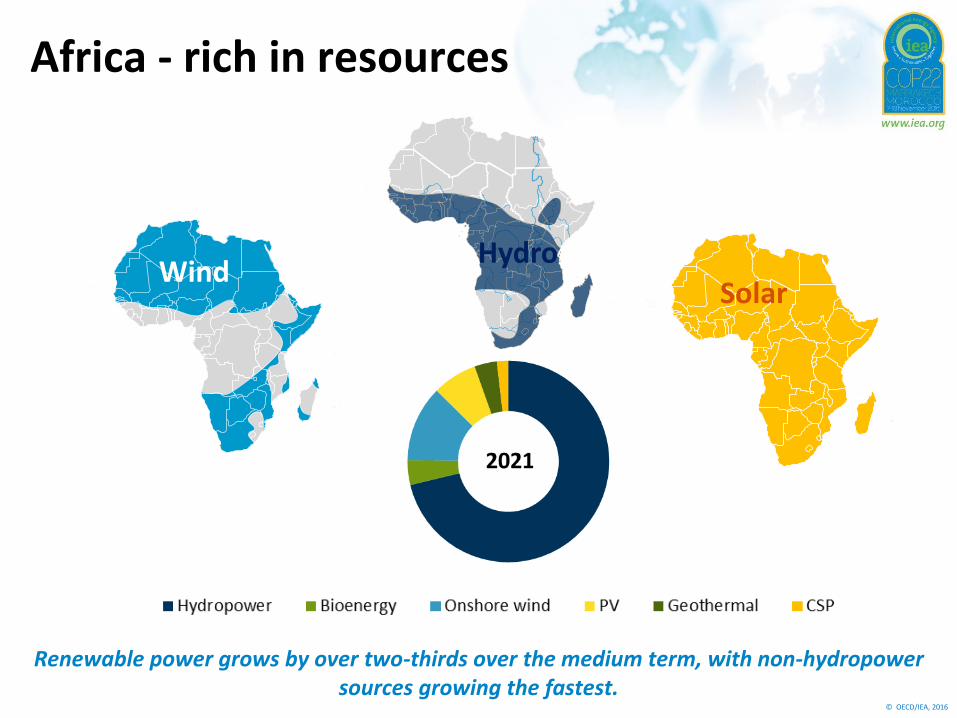
Africa - rich in resources
Hydro Wind
Solar
Renewable power grows by over two-thirds over the medium term, with non-hydropower sources growing the fastest.
© OECD/IEA, 2016
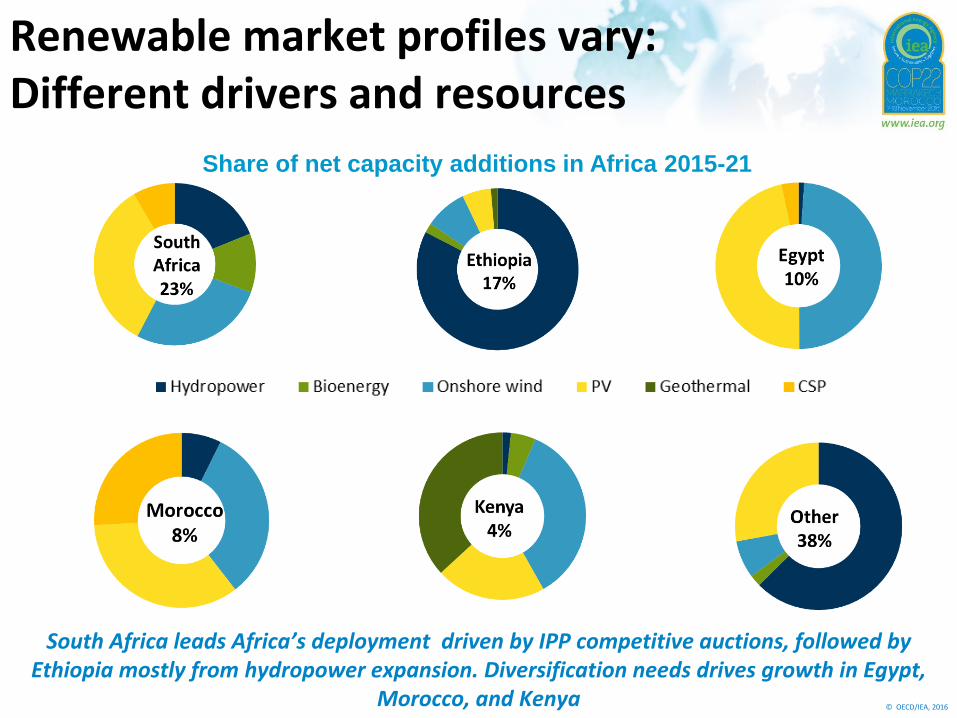
Renewable market profiles vary: Different drivers and resources
South Africa leads Africa’s deployment driven by IPP competitive auctions, followed by Ethiopia mostly from hydropower expansion. Diversification needs drives growth in Egypt,
Morocco, and Kenya
Share of net capacity additions in Africa 2015-21
© OECD/IEA, 2016
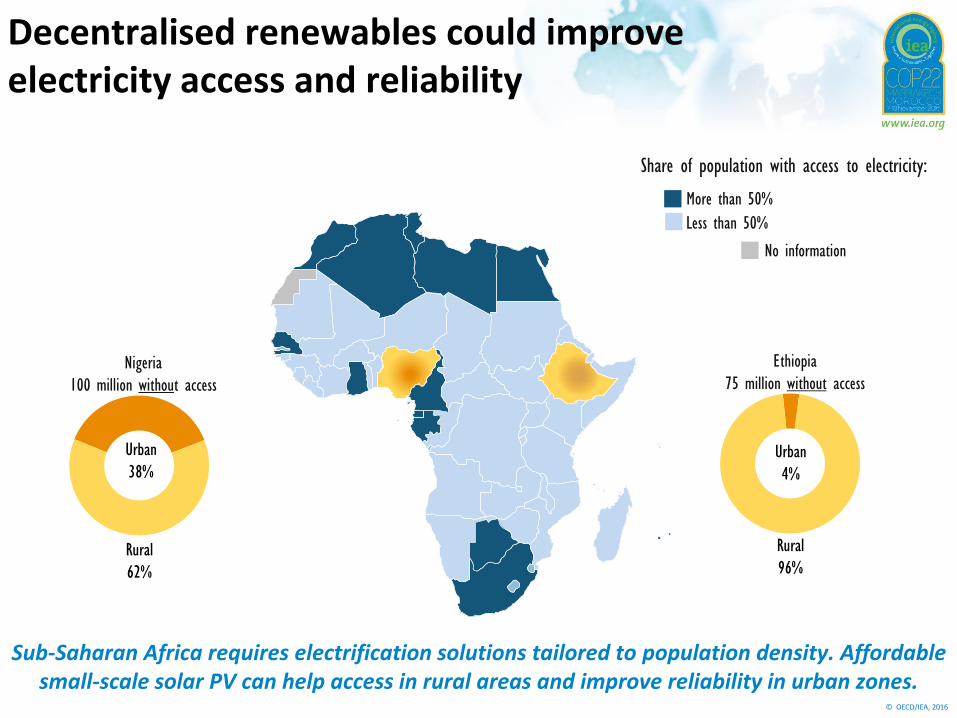
Decentralised renewables could improve electricity access and reliability
Sub-Saharan Africa requires electrification solutions tailored to population density. Affordable small-scale solar PV can help access in rural areas and improve reliability in urban zones.
Less than 50%
More than 50%
No information
Share of population with access to electricity:
Urban
38%
Rural
62%
Urban
4%
Rural
96%
Nigeria
100 million without access
Ethiopia
75 million without access
© OECD/IEA, 2016
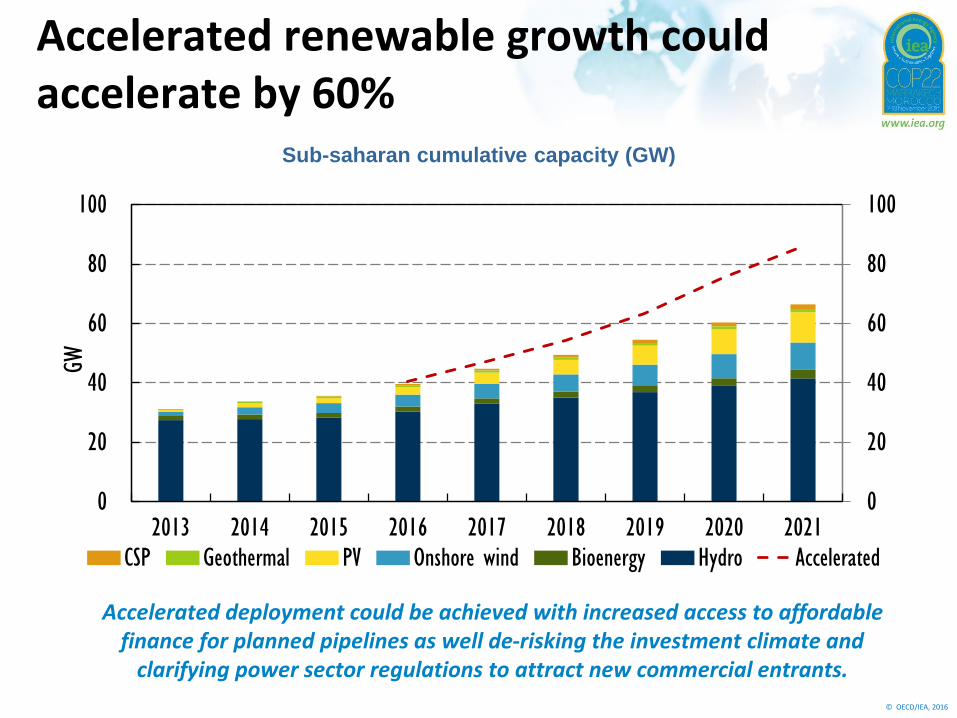
Accelerated renewable growth could accelerate by 60%
Accelerated deployment could be achieved with increased access to affordable finance for planned pipelines as well de-risking the investment climate and
clarifying power sector regulations to attract new commercial entrants.
Sub-saharan cumulative capacity (GW)
0
20
40
60
80
100
0
20
40
60
80
100
2013 2014 2015 2016 2017 2018 2019 2020 2021
GW
CSP Geothermal PV Onshore wind Bioenergy Hydro Accelerated

© OECD/IEA, 2016
Thank you