Embed Size (px)
Citation preview

Renewable Energy
Feasibility Study for the Esk
Valley

Page | 2
Document Data
Project Details
Project Number:
Client: Danby Village Hall
Project Title:
Project Manager: Kate Gilmartin
Document Details
Master Document Title:
Document Title: Renewable energy feasibility for the Esk Valley
Document Reference:
Issue Number: 1
Last Saved By: Kate Gilmartin
First Issued:
Path & Filename: L:\Team Folders\Operations\3 Renewable Energy\Consultancy Projects\CO2 916 Esk
Valley\6 - Working Folder\Esk RE feasibility
Revision & Approval Data
Issue Number Issue Date Revised By Checked By Approved By Revision Details
1 13/2/12 K.Gilmartin S.Brown
Disclaimer
Whilst every effort has been made to ensure the information and figures provided in this document are accurate please
be aware that this is influenced by the completeness and accuracy of data or information provided by the client.
CO2Sense actively works with the client to minimise inaccuracies however at times this can be unavoidable. If CO2Sense
is aware of issues with quality of data or assumptions are made, this is highlighted within the relevant sections.
The payback timescales provided in the recommendations are indicative, often based on the average cost of equipment
and installation. It should be noted that costs can vary widely according to technology, manufacturer, installer and site-
specific conditions, particularly if a recommendation relates to a large capital project. The project timescales do not
allow for all of these factors to be investigated or for site specific quotes to be arranged, therefore indicative pay back
timescales are used. It is strongly recommended that a minimum of 3 quotes are secured prior to making an investment
decision and payback timescales are recalculated based on the preferred supplier quotation and future efficiency
gains/cost savings confirmed by the manufacturer. The examples of products referred to in this report in no way
endorse the products or suppliers but are merely provided to give examples of products available on the market.
This review is time-limited and it is expected that recommendations made within the action plan will go through the
client’s own validation and approval process prior to implementation. CO2Sense places the utmost importance on
ensuring recommendations are robust and fit for purpose, however pertinent information may not have been available
during the review. CO2-Sense reserves the right to amend the findings and recommendations in this document should
more accurate data or information become available. The client holds sole responsibility for the decisions and actions it
takes using information contained within this document.

Page | 3
Executive Summary This report has been compiled by CO2Sense to provide an appraisal of the feasibility of installing
renewable energy technologies, for the generation of heat and electricity in the Esk Valley. This
report is not meant to be an exhaustive assessment, but rather presents suggestions on how to
achieve a low carbon community. This report should be considered in tandem with the 10 year low
carbon strategy document ‘ Esk Valley – A low carbon future’, also undertaken by CO2Sense. This
report, based upon a site visit and desk top study will allow Danby Village Hall to make informed,
business-led decisions on how to develop their sustainability strategy, whilst maximising
government incentives, such as the Renewable Heat Incentive (RHI) and the Feed in Tariffs (FiTs).
The report highlights the large carbon savings that can be made if individuals replace their
existing oil or coal fired heating systems with alternative lower carbon intensive technologies such
as individual biomass boilers. Although the Renewable Heat Incentive has not been launched to
support domestic Biomass installations, this report recommends that when the RHI becomes
available towards the end of 2012, the Esk Valley residents are in a position to utilise this incentive
and upgrade their heating systems.
CO2Sense can provide support to facilitate the installation of renewable energy technologies
through selecting the most suitable installers, undertaking further necessary studies and project
manage installations from design through to operation. If appropriate we could also provide
investment in the installation, or advice on other financing options.
CO2Sense is a not-for-profit, Community Interest Company. We help organisations cut costs and
reduce their carbon emissions by providing:
Advice
We will advise you on the most appropriate ways of saving money from more effective
management of your energy, water and waste. We will also advise you on the feasibility of
making money from suitable renewable energy options for your organisation. We can
produce a strategy, an action plan and help you prioritise your time and resources to
maximise the impact.
Delivery
We will work with you to deliver both the implementation of new initiatives and an ongoing
plan for continuous improvement based on tangible measurements. We can also facilitate
and validate supply chain providers and technology to ensure projects are delivered
appropriately.
Investment
We invest in renewable projects, technology and businesses in order to help get projects off
the ground. As part of our constitution we re-invest financially in the sector and support the
recommendations we make.
Page | 4
Table of Contents
1. Introduction ..................................................................................................................................... 5
1.1 Danby Village Hall .................................................................................................................. 5
1.2 Local Energy Assessment Fund ............................................................................................. 6
1.3 Purpose of Report ................................................................................................................... 6
1.4 Scope of Work ......................................................................................................................... 7
1.5 Structure of Report .................................................................................................................. 7
2. Overview of Area ............................................................................................................................ 8
3. Renewable Energy Technologies ................................................................................................. 10
3.1 Technologies Reviewed ........................................................................................................ 10
4. Renewable Electricity generation ................................................................................................. 12
4.1 Wind Turbines ....................................................................................................................... 12
4.2 Solar PV ................................................................................................................................. 23
5. Renewable Heat generation ........................................................................................................ 32
5.1 Biomass ................................................................................................................................ 32
5.2 Solar thermal ........................................................................................................................ 42
5.3 Heat pump ............................................................................................................................ 47
5.3.1 Ground Source Heat Pump .............................................................................................. 48
5.3.2 Water Source Heat Pump (WSHP) .................................................................................... 51
5.3.3 Air Source Heat Pump (ASHP) .......................................................................................... 52
5.3.3.1 Recommendations ........................................................................................................... 53
6. Summary....................................................................................................................................... 54
6.1 Overview of feasible technologies considered ................................................................... 55
6.2 Recommendations and next steps ...................................................................................... 56
6.2.1 Wind installations ............................................................................................................. 56
6.2.2 PV ...................................................................................................................................... 56
6.2.3 Biomass ............................................................................................................................ 57
6.2.4 Heat Pumps ...................................................................................................................... 57
7. Conclusion .................................................................................................................................... 59
Appendices ....................................................................................................................................... 60
A1 Planning ....................................................................................................................................... 60
A2 Financial Incentives ..................................................................................................................... 67
A3 Solar thermal collectors .............................................................................................................. 70

CO2Sense is working with the community of the Esk Valley to help them to understand how
energy efficiency measures and renewable energy technologies can reduce their energy bills and
generate an ongoing revenue stream. This report will feed into the development of the community
project strategy document, ‘Esk Valley – A low carbon future’.
This feasibility report has been undertaken to determine the most appropriate renewable energy
development for the Esk Valley in terms of technology, scale and location. This is supported by a
financial assessment highlighting the business case for the selection of appropriate renewable
energy technologies and an outline of the next steps required to progress them.
CO2Sense has developed a practical knowledge of the sector through advising and investing in a
vast array of renewable energy projects. Using this industry knowledge, CO2Sense has made
recommendations and drawn conclusions from the report findings, alongside other overarching
considerations, to build a business case for the development of specific renewable energy
technologies
With CO2Sense’s track record of delivery on renewable energy projects, and its network of public
and private sector partners, it is well placed to provide significant added value to this feasibility
assessment and in the longer term, to help invigorate and manage the implementation activity.
1.1 Danby Village Hall
Danby Village Hall is managed by a committee called the Committee of Management, which
includes representatives from local organisations, including Esk Valley Community Energy Group
(EVCEG). The hall was originally built to be used for meetings, lectures, classes and for other forms
of recreation and leisure time occupation and is now used for a wide range of activities including
badminton, theatre productions, craft fairs, dances, weddings, school events and blood donor
sessions.
The Danby Village Hall committee has a vision to create a hub of activity promoting energy
efficiency and renewable energy in the Esk Valley. This vision came about following a survey they
requested from the Esk Valley Community Energy Group to look at how they could improve the
energy efficiency of the building to cut costs, provide a more welcome atmosphere for visitors and
contribute to a reduction in the use of fossil fuels.
The local community has already begun to take a pro-active role in ensuring that the area
progresses with its low carbon ambitions. The Esk Valley community has already implemented
many energy saving measures which can be reviewed in the Community Renewable Energy
project found at www.sunflower.eu. Members of the Esk Valley Community Energy Group have set
up Esk Energy (Yorkshire) Ltd which is in the process of installing a 50kW Hydro-electric power
plant on the River Esk. This is not only an outstanding feat in community achievement and
cohesion, but will give confidence and drive for the community to complete further renewable
installations.
1. Introduction

Page | 6
1.2 Local Energy Assessment Fund
The Department of Energy and Climate Change (DECC) have allocated a new fund for
communities to finance carbon saving projects. This fund is called the Local Energy Assessment
Fund (LEAF) and is administered by the Energy Saving Trust (EST).
The grant fund provided by the programme is intended to help communities to prepare for new
opportunities in sustainable energy and climate change arising from the Green Deal, Renewable
Heat Incentive and Feed in Tariffs. The grants can be used to fund projects that improve energy
efficiency and increase the uptake of renewable energy in local communities.
Danby Village Hall successfully secured LEAF finance to carry out work aimed at empowering the
local community to understand their energy demand and usage, as well as developing
further renewable energy generation locally. The work is split into 3 key objectives:
1 - ‘Conserve and Reduce’ - Energy efficiency
Empowerment of the local community to reduce fuel bills and fuel poverty.
2 - Renewable Action
The progression of the community to become a stakeholder in the production of renewable
energy locally.
3 - Esk Valley – A low carbon future
A 10 year strategy of ‘power down’ of energy use and ‘power up’ of renewable energy
installations, leading to the Esk valley becoming a low carbon hub.
In order to meet objective 2, Renewable Action, CO2Sense has been commissioned to produce
this high level, area wide assessment of feasible renewable energy potential in the Esk Valley.
1.3 Purpose of Report
For the community to achieve low carbon status a combination of energy efficiency activities and
installations of renewable energy technologies must be achieved. Not only will this drive for
reduced energy consumption allow the community to move away from an over reliance on costly
and polluting fossil-fuels, there is also the added benefit of savings made on fuel reduction and
income generation through renewable energy incentive schemes. In summary the overall
objectives for the proposed developments are:
To provide renewable electricity to meet some of the demand of the local community;
To provide renewable heat to meet some of the demand of the local community;
To capitalise on financial incentives such as the Renewable Heat Incentive and Feed in
Tariff;
To provide a degree of energy cost stability in an ever increasingly volatile market;
To reduce the overall carbon footprint of the local community through directly
offsetting energy usage.

Page | 7
1.4 Scope of Work
This report will assist the Esk Valley community to understand the technical and financial viability
(pay back periods and cost benefit analysis) of the following technologies;
Renewable Electricity:
o Wind turbines – assessment of hot spots;
o Solar photovoltaic;
Renewable heat:
o Biomass;
o Solar thermal;
o Ground Source Heat Pump (GSHP);
o Water Source Heat Pump (WSHP);
o Air Source Heat Pumps (ASHP).
1.5 Structure of Report
The technologies under consideration have been assessed and are detailed in this report.
CO2Sense has also provided recommendation for the most appropriate renewable energy
opportunities in terms of technology, scale and location. A financial assessment and outline of
next steps required are provided for each feasible technology.
This report presents the findings of the feasibility study in the following structure:
Overview of the area
Review of feasible renewable electricity potential;
Review of feasible renewable heat potential;
Conclusion and recommendations.
A detailed review of the planning considerations for renewable energy in the Esk Valley, is
provided in Appendix A1. An update to the current status of government subsidies for renewable
energy is provided in Appendix A2.

Page | 8
The Esk Valley, depicted in Figure 1, is situated in the north of the North York Moors National Park.
It has a rural landscape supporting a wealth of wildlife. Geographically, the valley embraces the
area from Westerdale to Whitby. There are few major settlements within the National Park and the
villages in the Esk Valley are thriving local communities, within which a determination to improve
the sustainability of local energy consumption has developed. Many areas in the Esk Valley are in
designated conservation areas, some are listed and there are many classified as ‘hard to treat’.
Figure 1 – Danby and the Esk Valley (Google map - geo-information group 2012)
The local demographic is of an aging population with 42% of the residents over 50.
Unemployment is higher than national average, and a greater proportion of people are employed
in skilled trade occupations and elementary occupations.
The valley is predominantly off the gas network (although there is some mains gas in Sleights).
The majority of space heating needs are met by bottled gas, oil and some properties still use coal.
Electricity supply is reasonably good, although there are only two entry points at each end of the
valley. The Esk Valley borders The North York Moors National Park and this constrains some
developments of larger scale renewable energy technologies. At a micro-generation level, many
of the villages are classed as conservation areas, again constraining the types of renewable
energy installations that can be deployed.
The Valley comprises of seven Parishes seen in Figure 2:
Aislaby;
Danby;
Egton;
Eskdaleside-cum-Ugglebarnby;
Glaisdale;
Goathland;
Grosmont.
2. Overview of Area

Page | 9
CO2Sense conducted a site visit to the Esk Valley on the 15th of February 2012. The visit was
undertaken by James Robinson and Jason Stoyel. The visit was a scoping visit to ascertain which
renewable energy technologies would warrant further investigation and to complete an energy
audit for Danby and Castleton Village Hall.
Figure 2 –Parishes of the Esk Valley (neighbourhood statistics)
Danby
Glaisdale
Aislaby
Eskdaleside-cum-
Ugglebarnby
Grosmont
Egton
Goathland

Page | 10
3.1 Technologies Reviewed
Prior to the installation of renewable energy technologies, it is advised that the energy demand of
any building should be determined and a detailed review of strategies to reduce energy
consumption should be drawn up and implemented.
The calculations to derive payback periods and carbon savings have used the following costs for
domestic energy and carbon emission factors depicted in Table 1 and Table 2.
Table 1 – Cost of domestic energy
Cost of domestic energy
Gas 4p/kWh
Electricity 10p/kWh
Oil 6p/kWh
Table 2 – Green House Gas emission factors of energy sources
Carbon intensity of energy, CO2e kg/kWh
Gas 0.186kg/kWh
Grid Electricity 0.525kg/kWh
Oil 0.267kg/kWh
Wood pellet 0.04kg/kWh
Wood chip 0.02kg/kWh
(Defra GHG emissions)
Table 3 provides an outline of all the renewable energy technologies assessed by CO2Sense for
the Esk Valley Area. This preliminary assessment has identified potential individual technologies
and provides a rational for the inclusion or omission from the rest of this report.
The identified technologies are all generally classed as ‘small scale’ and fit in with the planning
constraints of projects within the North Yorkshire Moors National Park. They have been chosen
specifically for the community impact that they can provide and their potential to provide a source
of income, as well as lowering the carbon foot print of the properties on which they are installed.
The following sections of this report will now look at each of the selected technologies in detail. For
each technology this will cover:
1. Technology overview;
2. Suitability for Esk Valley Installation;
3. Likely constraints;
4. Example installations showing financial viability and cost analysis;
5. Recommendations and Next Steps.
3. Renewable Energy Technologies

Page | 11
Table 3 –Overview of Renewable Energy Technologies
Energy
Generated Technology Further Analysis Rationale
Renewable
Electricity
Wind Yes
Limited due to the location within a National Park and
likely visual impact, however the wind resource is high.
There is therefore likely to be opportunities for small,
domestic size wind turbines.
Solar PV Yes
Many un-shaded southerly facing roof spaces offering
opportunities for Solar PV installations. Also likely to be
less visually intrusive than wind and more likely to
receive planning permission.
Anaerobic
Digestion No
Population density considered too low to give sufficient
feedstock for AD plant. Location within national park
may mean planning permission would be difficult to
achieve. Feasibility study already carried out as part of
previous National Park work.
Hydro No
Feasibility studies along the River Esk have already
been completed and it is felt no further work is
required.
Renewable
Heat
Biomass Yes
There are significant areas in the valley off the gas grid
utilising oil and coal for space heating requirements.
This offers an opportunity for biomass heating.
Biomass
District Heating No
Villages have low population density and are
considered too widely spread to make District Heating
a viable option.
Solar thermal Yes Many un-shaded southerly facing roof spaces offering
opportunities for Solar thermal installations.
Water Source
Heat Pump Yes
The River Esk could be utilised for heating requirements
for buildings located in close proximity to the river
Ground Source
Heating Yes
There are areas with sufficient land for either vertical or
horizontal ground loops with close proximity to suitable
buildings.
Air Source heat
Pump Yes
This system is most effect if utilising low temperature
heating system, such as under-floor heating, in a well
insulated and airtight building. It is therefore most
suitable for new build properties and other
technologies may be more viable for the housing types
present within the Esk Valley
Renewable
Electricity and
Heat
Combined
Heat and
Power
No There are no sufficient heat loads that would warrant
the technology which has a large capital costs.

Page | 12
4.1 Wind Turbines
Wind turbines harness power from the wind to generate electricity. The UK has the largest wind
resource in Europe which offers a great potential to generate renewable energy and could make
a significant contribution to the generation mix within the Esk Valley.
Wind turbines range in size from small roof-top mounted machines, up to the large commercial
machines of the type found operating on wind farms. Therefore there is usually a solution suitable
for any site and wind turbines do not necessarily need to cause a visual impact or noise nuisance,
if chosen appropriately for the location.
4.1.1 Wind Resource
Figure 3 – Wind Map for the Esk Valley (10m agl)
Figure 3 shows the correlated annual mean wind speeds (AMWS) over the Esk Valley. This data is
taken from the Department of Energy and Climate Change (DECC) wind database. This wind
speed datum information applies to a 1km2 resolution at 10m above ground level (agl) and takes
no account of local topography or local surface roughness (such as tall crops, stonewalls, or
trees), both of which may have a considerable effect on the wind speed and ultimately the
electricity a wind turbine could generate.
Despite this restriction in the data, it is a useful guide to potential generation levels and shows that
the Esk valley has a considerable wind resource with a large number of sites seeing average wind
speeds greater than the UK average of 5.6m/s.
The electricity generation potential of a wind turbine depends heavily on the wind speeds at site. It
is generally considered that a minimum wind speed of 6m/s is suitable to justify further
4. Renewable Electricity Generation
AMWS m/s

Page | 13
investigation for wind turbine development. This is to ensure that the turbine operates at a high
capacity factor, giving a high energy output and a low payback.
The wind map in Figure 3 shows that there is a large part of the Esk valley that meets this
minimum wind speed criteria, with average wind speeds exceeding 7m/s in some locations. The
main areas of high wind are away from the main areas of population and tend to be located on
the moors at the edges of the valley. Key areas are to the North of Danby and Lealholmare along
with the moors above both Botton and Goathland. The area between Aislaby and Hutton
Mulgarve, North of Sleights has among the highest average wind speed in the Esk Valley of
7.5m/s at 10m.
Whilst it is unlikely that planning permission would be achieved for any large wind farm in the
areas identified in Figure 3 due to their location inside and on the periphery of a National Park,
there is a potential to install a number of small, single turbines within these high wind speed
areas. These small turbines are less intrusive and should not alter the character of the landscape,
whilst still offering beneficial carbon savings, revenue generation and encourage further
developments in renewable energy.
These turbines are usually installed singularly or in small numbers and have reduced visual
impact due to their low tower size of around 12m. They are well suited to supplying small
businesses, community centres or local industry where a large portion of their energy needs is
electrical. They are also perfect for farm installations, where they can help farmers diversify their
income and secure themselves against future energy price rises.
4.1.2 Turbine Siting Considerations
The perfect site for a wind turbine is on top of a smooth, rounded and exposed hill. It would also
need to be a long distance from any obstacles such as buildings or trees. In reality this very rarely
happens and a compromise on exact location needs to be taken. Some factors to consider when
assessing any potential location are shown in Table 6.

Page | 14
Table 4 –Wind Turbine Siting Criteria
Siting Factor Considerations
Wind Direction A wind turbine should be exposed to the south westerly prevailing winds to ensure optimum generation levels.
Obstacles
Trees, buildings, hedges and topography all act to effectively slow down the wind. Siting a turbine away from such obstacles is important to ensure generation levels are not affected. One way to reduce the effect of obstacles is to increase the turbine tower
height; however this can have a knock on effect on project costs and pose planning issues.
Noise levels Turbines should be sited to ensure that any noise at neighbouring properties is below the levels outlined in statutory guidance.
Visual Impact
The visual impact on the landscape will need carefully consideration. It may be necessary to site the turbine in a slightly less favourable location from a generation perspective, in order to ensure planning issues are reduced. If this is undertaken a
detailed examination of the effects that this will have on generation levels should be undertaken to ensure that the project still remains viable.
Footpaths /
Bridleways /
other rights of
way:
The minimum distance of a small turbine from a right of way is topple distance (height + 10%). For bridleways the British Horse Society has recommended 3 x turbine height as
a distance with the minimum distance set at 200m (although this tends to be more applicable to larger wind turbines).
Birds
Householders and installers should be aware that all bird nests are legally protected
from damage, destruction or interference whilst in use or being built. On any site where there is a known nesting site for all species of bird, the installation
must not be carried out during the nesting season.
Bats
All species of bats in the UK are protected by law. The general guidance for wind
turbines is that a 50m buffer is maintained around any feature (trees, hedges) into which no part of the turbine intrudes.
If bats are present, then turbines should not be installed along the line of an
established hedgerow, or close to a tree canopy as these are used as navigational paths.
Hydrology
Largely there will be no significant disruption to groundwater flows or drainage due to
the small footprint of these systems.
Power Cable
length
The cost of underground cabling may also prove excessive if long cable runs are planned. Losses from cables will result in a reduction of overall energy output. Cable
runs should therefore be kept as short as possible for optimum performance.

Page | 15
4.1.3 Roof Top Mounted Wind Turbines
There are a number of micro wind turbines which are designed for installation on roof tops. Care
should be taken if developing a project such as this to ensure that the turbine is located in clean
and undisturbed air to ensure that generation is not disturbed by turbulence caused by the
building or structure.
Between 2006 and 2008 an independent performance trial was carried out on a number of
rooftop mounted wind turbines known as the Warwick Wind Trials1. This trial found that roof top
mounted turbines generally performed poorly and had an average capacity factor throughout the
monitored period of just 0.85% (Compared to around 30% for well sited, mast mounted wind
turbines). The levels of generation experienced were far lower than the expected levels quoted by
the turbine manufacturers.
With a view to implementing renewable generation in the Esk Valley area, in the most cost
effective manner possible, we would recommend that turbines are installed on masts and are
sited away from buildings to ensure that high capacity factors and expected paybacks are met.
4.1.4 Planning
Small wind energy installations of the type recommended in this report will generally require
planning permission and local consultation with relevant stakeholders, such as neighbours and
statutory bodies.
Overall, national and local planning policies support the development of small scale wind energy.
Planning Policy Statement 22 (PPS22) sets out a clear national policy framework on renewable
energy for planning authorities in England to ensure that the Government's renewable energy
targets are met. Under PPS22 Local Planning Authorities should recognise the full range of
renewable energy sources, their differing characteristics, location requirements and the potential
for exploiting them subject to appropriate environmental safeguards. Small scale developments
can also be permitted within areas such as National Parks, Areas of Outstanding Natural Beauty
and Heritage Coasts provided that there is no serious environmental detriment to the area
concerned. PPS22 introduces a new policy area for small systems by encouraging Local Planning
Authorities to require that new developments should supply a percentage of their energy needs
from onsite renewable energy sources.
Any planning application will need to consider environmental considerations, access to the site,
noise and visual effect.
The Yorkshire Moors National Park Authority has published a Renewable Energy Supplementary
Planning Document April 20102. This document gives guidance on the planning constraints on all
renewable technologies in the National Park. This document states that one of the objectives of
the planning authority is:
1 www.warwickwindtrials.org.uk/index.html
2 www.northyorkmoors.org.uk/uploads/publication/10560.pdf
Page | 16
“To promote the use of renewable energy sources that provide energy for communities within the
National Park providing that any development involved does not significantly detract from the
conservation of the landscape and built environment of the National Park.”
On page 12 of the document they also state:
“Across the National Park, wind energy developments that would be appropriate in terms of
statutory National Park purposes are likely to be domestic size individual turbines associated with
an existing building or use”
This shows that the Planning Authority support wind energy but that development will generally be
restricted to domestic scale installations. Evidence of this policy can clearly be seen from Table 7, a
search of the planning applications for the North Yorkshire Moors National Park since 2007 which
shows the breakdown of wind turbine applications and approvals.
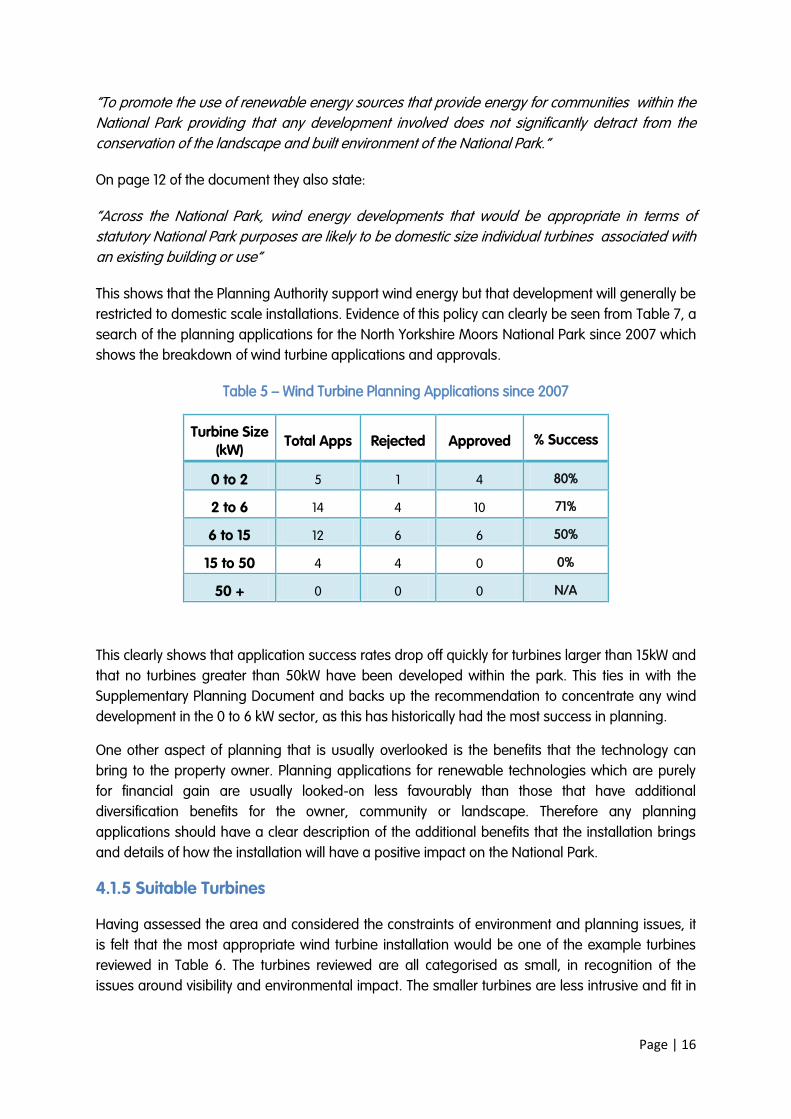
Table 5 – Wind Turbine Planning Applications since 2007
Turbine Size
(kW) Total Apps Rejected Approved % Success
0 to 2 5 1 4 80%
2 to 6 14 4 10 71%
6 to 15 12 6 6 50%
15 to 50 4 4 0 0%
50 + 0 0 0 N/A
This clearly shows that application success rates drop off quickly for turbines larger than 15kW and
that no turbines greater than 50kW have been developed within the park. This ties in with the
Supplementary Planning Document and backs up the recommendation to concentrate any wind
development in the 0 to 6 kW sector, as this has historically had the most success in planning.
One other aspect of planning that is usually overlooked is the benefits that the technology can
bring to the property owner. Planning applications for renewable technologies which are purely
for financial gain are usually looked-on less favourably than those that have additional
diversification benefits for the owner, community or landscape. Therefore any planning
applications should have a clear description of the additional benefits that the installation brings
and details of how the installation will have a positive impact on the National Park.
4.1.5 Suitable Turbines
Having assessed the area and considered the constraints of environment and planning issues, it
is felt that the most appropriate wind turbine installation would be one of the example turbines
reviewed in Table 6. The turbines reviewed are all categorised as small, in recognition of the
issues around visibility and environmental impact. The smaller turbines are less intrusive and fit in

Page | 17
with the planning recommendations from the National Park Planning Authority. They also all fall
into the sub 6kW category and are therefore more likely to receive planning permission.
Table 6 – Summary of outputs from potential wind turbine installations on a 6m/s site
Turbine SkyStream Evance R9000
Rated capacity, kW 1.9 5
Height of tower, m 11.2 12
Blade length, m 1.8 2.75
Potential annual output, kWh (6m/s site) 5,400 13,186
Capex, £ 13,500 30,000
Applicable FiT, £/kWh 0.28 0.28
Potential annual revenue and savings , £ 1,865 4,556
CO2 savings per annum, tonnes 2.84 6.92
Payback, years 7.24 6.59
ROI over 20 years, % 8.8 10.19
The calculations used for the table above have assumed that 50% of the electricity generated will
be consumed on site and 50% exported to the grid. This is generally typical of a domestic wind
installation in the UK.
The table shows that the Return on Investment for both products is very good with the best
payback being 6.59 years for the 5kW Evance R9000. However the capital costs of such a product
are quite high, especially for a domestic customer, and may be more suitable for a small business
or farm.
The appearance of each of these turbines is shown in Figures 4 & 5. These systems represent
typical industry examples and are not specifically recommended over other suppliers.
These turbines could be located singularly at farms or other properties located within the areas
with wind speeds greater than 6m/s, as indicated in Figure 3. An estimate of the potential
installed cacapity in thes areas is given in section 4.1.12.

Page | 18
Figure 4 – 1.9kW Sky Stream Wind turbine located at a domestic property
Figure 5 – 5kW Evance R9000
4.1.6 Shadow Flicker
Tall structures such as wind turbines cast shadows, which vary in shape according to the sun’s
altitude and bearing. Rotating turbine blades cast moving shadows and these shadows can
occasionally cause a flickering effect. The severity and the duration of exposure generally
decrease with increasing distance from the turbine. Shadows occur to the north of the turbine at
mid-day and to the West and East in the early morning and late afternoon.
Shadow flicker can be a problem within 10 rotor diameters of the turbine. For the proposed
turbines detailed in this report, at the proposed height, it is unlikely that nearby housing would be
subject to the issue of flicker.

Page | 19
4.1.7 Noise
With the evolution of wind turbine technology the mechanical noise from turbines is almost
undetectable with the main sound being the aerodynamic swoosh of the blades passing the
tower. It is possible to stand underneath a turbine and hold a conversation without having to raise
your voice. As wind speed rises, the noise of the wind masks the noise made by wind turbines.
There are strict guidelines on wind turbines and noise emissions to ensure the protection of
residential amenity.
The small turbines proposed for the installation would be unlikely to cause noise disturbance to
proximal dwellings, however the planning authority may require a background noise survey if the
turbine is to be located close to neighbouring properties.
4.1.8 Access and Installation
Good road access to the site of the potential wind turbine is required to allow engineering
machinery to install a turbine without significant complexity.
To be eligible for the governments Clean Energy Cash back Scheme (Feed in Tariff) the installation
must be carried out by a Microgeneration Certification Scheme (MCS) accredited installer. A list of
accredited installers is available on the MCS website3. CO2Sense also recommend that any
installers are member of the REAL assurance Scheme4. These installers have agreed to abide by a
consumer code which ensures a high level of customer service and also gives a clear complaint
procedure if anything does go wrong.
4.1.9 Distribution Network Connection
Any turbine location chosen should be close to a point of connection to the electricity network.
Cable costs for long distance connections can be prohibitively expensive so ensuring that the
turbine can be easily connected is key to ensuring the projects viability.
The electricity distribution grid in the Esk Valley is generally strong enough for the connection of
turbines of the size described, however particularly remote installations, especially those at the
end of a line, may struggle to get connections agreed for the Evance R9000.
It is common to connect a turbine of this size through an existing buildings electrical connection as
this enables any energy produced to also be used on site, offsetting electricity that would have
otherwise been purchased from the grid. The UK Clean Energy Cashback Scheme issues a
payment for all the energy that you produce, even if this is used directly on site. Therefore the best
return on investment is usually when this energy is used locally.
In the UK there are two grid connection standards G83/1 and G59/2. G83/1 covers connections
under 16A/phase which is equivalent to a 3.68kW turbine installed single phase or 11kW three
phase. G83/1 is the simplest of these standards and any turbine under these sizes should have no
problems connecting to the distribution network. However, an application to the relative
Distribution Network Operator (For the Esk valley this is Northern Power Grid Ltd) is essential at
3 www.microgenerationcertification.org
4 www.realassurance.org.uk/

Page | 20
least 2 months in advance of any installation. The application and connection under G83/1 are
both usually free of charge.
For installation above 3.68kW single phase (and 11kW three phase) then connections must comply
with G59/2. This is a slightly more complicated standard and again an upfront application should
be made. G59/2 applications are free, however there may be a charge for grid connection,
especially if the network requires upgrading. Again we recommend that an application is made in
advance to ensure that any associated costs do not damage the project’s viability.
A benefit of distributed generation such as small wind turbines is that they are able to help
improve the existing grid capacity and provide reinforcement to the network. If implemented
correctly this means that a network of distributed generation may reduce the need for power line
upgrades or improvements which would otherwise damage the natural landscape if they were
implemented.
4.1.10 Warranty & Maintenance
It is now usual that small wind turbines are sold with a minimum of 5 years warranty. However a
number of manufacturers are offering 10 year warranties. CO2Sense recommend that any
warranty covers at least the anticipated payback period of the turbine as this helps reduce the
risks associated with the investment.
Care should also be taken to identify whether the warranty covers both parts and labour. Labour
costs on any warranty work can be higher than part costs, especially on smaller machines. If
labour is not included a careful examination of the turbines operating history should be
undertaken to ensure the reliability is as expected. CO2Sense would also suggest discussion with
the owners of existing turbines from the same manufacturer with the view of collecting feedback
on operation and service levels.
In order for the warranty to remain valid most manufacturers requires an annual service, the cost
of which is usually in addition to the upfront costs and should be included in any feasibility
calculations. This service usually has to be carried out by an installer approved by the turbine
manufacturer. A number of manufacturers now only require a 2 year service which can reduce
operating costs considerably. However, this has to be considered alongside the increased risk of
an undetected fault occurring due to the lengthened time between inspections.
Outside of the warranty period it is likely that annual servicing will be required to ensure the
turbine continues to run efficiently and safely. A number of turbine suppliers now offer
maintenance service contracts for the turbine’s lifetime, usually 25 years. There are also a number
of maintenance specific companies who are not tied into any specific manufacturer. CO2Sense
recommend securing at least 3 quotes for long term maintenance contacts as the costs can vary
significantly between suppliers.
4.1.11 Recommendations
It can be seen from Table 4 that the installation of wind turbines in the Esk Valley would offer a
reasonable payback of just over 6 years, if an annual mean wind speed of 6.0m/s was achieved.
The Evance R9000 would give the best energy generation and carbon savings and due to its

Page | 21
relatively small tower may reduce the likelihood of multiple objections when seeking planning
permission. There is also precedent for the installation of a turbine of this design with three
planning approvals since 1997.
Large scale wind turbines or wind farms are not recommended for the area and are unlikely to
get planning approval. The most suitable implementation of wind technology for the area is
individual small scale turbines which supply electricity to local business and properties. This meets
recommendations set out by the National Park.
4.1.12 Wind Potential
Wind Turbines are one of the highest yielding renewable energy technologies that could be rolled
out in an area such as the Esk Valley; however it is restricted in terms of the number of suitable
sites and the cumulative impact of a large number of turbines. Table 7 shows a summary of the
predicted potential impact of small wind, based on locating one turbine for every square km with
average winds exceeding 6m/s and includes a potential grid connection.
Table 7 – Summary of Wind Potential of Esk Valley
Total 1km Squares AWS >6m/s 55
Number of Locations With Grid Connection 27
Turbine Size (kW) 5
Potential Total Installed Capacity (kW) 135
Annual Generation (kWh) 356,022
CO2 savings per annum, tonnes 186.91
4.1.13 Next Steps
The next steps investigating wind for the Esk Valley involve identifying the key sites with grid
connections, within the high wind speed areas. These are likely to be private properties (In
particular farms) as no public buildings have been identified within these locations. Discussions
should begin with these landowners to identify if there is any interest in siting turbines on their
property and discuss various funding and ownership options which exist.
Once the site is identified and all parties agree to move forward, there is a requirement to ensure
consideration of factors to ensure economic viability. As the wind speed is the crucial factor in
determining the energy output from the turbine and the revenue it generates, further detailed
modelling of the wind levels should be carried out. If required, measurement of wind speed could
be undertaken on site using an anemometer mounted on a mast, however this may be

Page | 22
considered unnecessary unless a project finance lender specifies this as a requirement for
investment and detailed desktop wind modelling may be more appropriate.
In summary next steps include
Discuss and evaluate existing work done and plan progress;
Identify sites;
Wind data collection /modelling;
Talk to landowners;
Discussions with MCS Wind Turbine Installers, site specific surveys and three
quotes per site;
Initial consultation with LPA concerning permissibility of turbine installation;
Preliminary EIA and consultations with relevant local bodies;
Grid Connection Application;
Local Consultation.

Page | 23
4.2 Solar PV
Solar photovoltaic (PV) modules convert sunlight directly into electricity. Each module consists of a
number of PV cells made up of layers of semi-conducting material with a base, usually, of silicon.
When light falls on the active surface, the electrons in a solar cell are energised in proportion to
the intensity of the light they receive. When their energy level exceeds a certain point a potential
difference is established across the cell. This is then capable of driving a current. The stronger the
sunshine the more energy is produced, although they will still generate electricity on a cloudy day.
4.2.1 Solar Resource
Figure 6 depicts the average irradiation that is received for Whitby. It is split into beam irradiation
which denotes the direct rays from the sun; and diffuse, which is the irradiation that is received
after being refracted from cloud cover. Although there are greater amounts of diffuse than beam
irradiation, this still provides a resource that can be utilised by solar PV modules.
Figure 6 - Average daily irradiation (beam and diffuse components, JRC, 2010)
4.2.2 Suitable Locations for PV Modules
Any un-shaded south facing roof offers the perfect opportunity to install PV modules.
Some possible installation sites are considered to be:
Village Halls e.g. Ruswarp Village Hall & Castleton Village Hall;
Churchs e.g. St John the Evangelist, Sleights & St Thomas, Glaisdale;
Farm Buildings or Ground Mounted installations on unused land;
Schools e.g. Egton C of E Primary School;
Domestic Properties, eg Hermitage Way, Sleights.
0
500
1000
1500
2000
2500
3000
3500
4000
4500
5000
Wh
/m2
diffuse W/m2
beam W/m2

Page | 24
Some of these potential sites can be viewed in Figures 7 to 10.
Figure 7 – Potential site for PV installation –Ruswarp Village Hall
Figure 8 – Potential site for PV installation – St John the Evangelist, Sleights
Figure 9 – Egton C of E Primary School and Farm Building

Page | 25
Figure 10 – Hermitage Way residential dwellings - Sleights
4.2.3 Suitable Modules and Outputs
There are four main types of PV module available on the market, they vary in cost and efficiency
and are classed as:
Mono-crystalline
Polycrystalline
Hybrid
Thin film
As an example the following analysis runs through a potential installation at Ruswarp Village Hall.
Initial assessment has shown that this is a good building for a PV installation, predominantly due
to its large roof area facing within 20 degrees of due south.
An evaluation on potential energy generation for the Ruswarp Village hall has been based upon
the MonoCrystaline, PolyCrystaline and Hybrid panels to show the varying costs and paybacks
using different types of modules with different efficiencies.
Figure 7 shows Ruswarp Village Hall which has around 125m2 of available South/South East facing
roof space. The outputs are based on an approximate 125m2 building mounted array comprising
of 3 rows of 26 panels. The calculations have been completed using irradiation data from JRC GIS,
which has been correlated for Whitby. An angled roof of 400 has been assumed and orientation of
azimuth -100, to denote the building’s roof facing SSE. It is also likely that a 3 phase connection will
be required for an installation of this size.
The potential energy generation can be reviewed in Table 8Error! Reference source not
found. and assumes:
o The assumed typical energy usage on site is 1000kWh/month and that it is
possible to provide around 50% (assumed to be 500kWh/month, displacing grid
electricity assumed to be bought for 10p/kWh) of this from the PV system;
Page | 26
o The remaining electricity generated by the PV array is exported at a minimum of
3.1p/kWh.
The simple payback does not account for:
o annual increment in the FIT, which is correlated to the retail price index inflation
rate,
o annual increases in energy prices,
o degradation of the PV modules over the 25 years they receive the FIT.
o
The payback period with uplift accounts for:
o an annual increase of 0.5p/kWh on energy tariffs,
o a FIT rate increase of 2% each year,
o PV module degradation of quality that impairs the energy generated year on year
with the modules producing 82% of their rated capacity at 25 years.
The margins for the payback can vary greatly according to the variables of:
module efficiency,
percentage exported to the grid,
percentage consumed on site;
price of displaced electricity; and
price of electricity sold to the grid
cost of network connection
Therefore, these variables must be evaluated carefully prior to a PV installation to ensure that
returns are maximised.
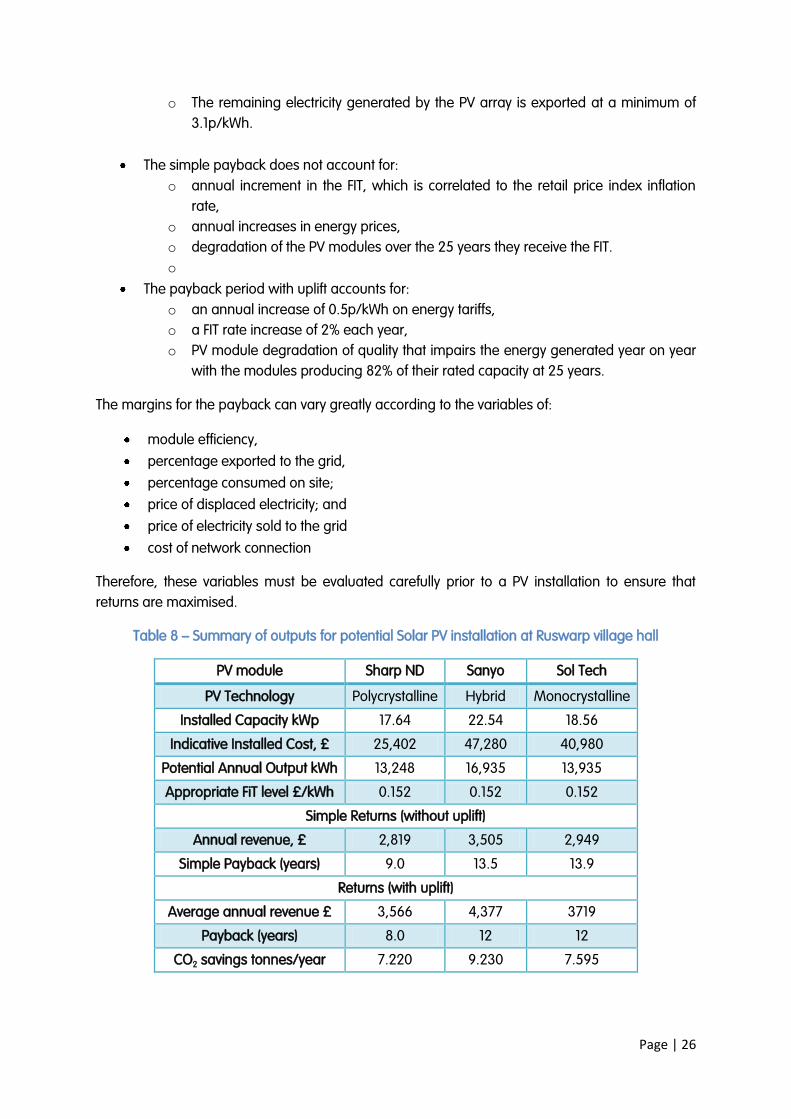
Table 8 – Summary of outputs for potential Solar PV installation at Ruswarp village hall
PV module Sharp ND Sanyo Sol Tech
PV Technology Polycrystalline Hybrid Monocrystalline
Installed Capacity kWp 17.64 22.54 18.56
Indicative Installed Cost, £ 25,402 47,280 40,980
Potential Annual Output kWh 13,248 16,935 13,935
Appropriate FiT level £/kWh 0.152 0.152 0.152
Simple Returns (without uplift)
Annual revenue, £ 2,819 3,505 2,949
Simple Payback (years) 9.0 13.5 13.9
Returns (with uplift)
Average annual revenue £ 3,566 4,377 3719
Payback (years) 8.0 12 12
CO2 savings tonnes/year 7.220 9.230 7.595

Page | 27
Potential energy generation, costs and paybacks at other potential PV sites can be reviewed in
Table 9 and Table 12. One mid-cost, mid-efficiency brand of module has been used in these
examples. An angled roof of 400 has been assumed and the systems are all orientated
approximately due south which will give maximum solar gains.
An assumption has been made as to the quantity of electrical energy consumed on site per
month. The PV modules will meet a varying degree of this demand, dependant on the solar
irradiation received on the module. If the electricity generated on site is consumed on site then it
will displace the more costly grid electricity assumed to be purchased at a price of 10p/kWh.
Table 9 – Summary of outputs for potential Solar PV installations in the Esk valley
Location Castleton Village Hall
St John’s Sleights Egton C of
E Primary
Farm
Building
Installed Capacity kWp 7.21
14.43 5.41 18.03
Indicative Installed Cost, £ £15,131
30,268 11,348 37,820
Potential annual output kWh 5,705
11,412 4,278 14,563
Appropriate FiT level £/kWh 0.168
0.152 0.168 0.152
Approximate electrical
consumption 1000 500 1000 1000
Simple Returns (without uplift)
Potential Annual Revenue, £ 1529
2,471 1,146 3,296
Simple Payback (years) 9.9
12.25 9.9 11.47
Returns (with uplift)
Average annual revenue £ 3482
3028 1442 4164
Payback with uplift (years) 9.0
11.0 9.0 11.00
CO2 savings tonnes/year 3.109
6.219 2.331 7.771

Page | 28
Table 10 – Summary of outputs for potential Solar PV installation in the Esk valley
Location Ground mounted Example Domestic
Dwelling
4.2.4 Planning and Visibility
The North Yorkshire Moors National Park supports PV and searches have shown planning
applications to be very successful. The published Renewable Energy Supplementary Planning
Document - April 20102 outlines guidance in the appropriate siting and visibility of PV within the
national park.
The guidance generally recommends installations on agricultural, industrial and contemporary
buildings as the appearance of the panels fits in most with these building types, however it
doesn’t rule out their installation on domestic properties “ provided satisfactory siting and design
can be achieved.”
Due to the dark colour of PV panels installations, on slate roofs they are usually less visually
intrusive than installation on red pan tiles. Whatever the roofing material, panels should always be
located to conform to the design of the existing building and the locality.
Where an acceptable solution for roof mounted panels cannot be achieved, the use of ground
mounted panels is also indicated as a possibility. Planning for these should be relatively straight
forward as long as the panels are sited to reduce the visual impact, possibly within the rear
garden or other location away from the main frontage of the property or other important views.
5. Installed Capacity kWp 3.00 1.50
6. Indicative Installed Cost, £ 6,293 3,146
7. Potential Annual Output kWh 2301 1127
8. Appropriate FiT level £/kWh 0.21 0.21
9. Approximate Electrical Consumption 0 375
10. Simple Returns (without uplift)
11. Potential Annual Revenue, £ 543 349
12. Simple Payback (years) 11.6 9.0
13. Returns (with uplift)
14. Average Annual Revenue, £ 632.4 456.40
15. Payback with uplift (years) 10 8
CO2 savings tonnes/year 1.252 0.164

Page | 29
Figure 11 – Typical ground mounted solar array
Like all renewable developments within the North Yorkshire Moors National Park, the
recommendation is for small scale installations providing local businesses and properties with
their energy needs. Installations purely for commercial benefit such as solar farms or large scale
installations are far less likely to receive permission.
4.2.5 Structure
The roofs identified as potential locations for PV arrays must be surveyed by a structural engineer
to ensure they have adequate structures to take the additional load of the PV modules. An
average PV module can have a weight of up to 20kg, and further weight can be accrued with
snow loading, or the uplift loads from wind.
4.2.6 Maintenance
PV modules are robust, hard wearing and have a low maintenance regime requiring a simple
annual clean and electrical check. The modules have an operational life of at least 25 years and
manufacturers often give guarantees that the module will perform with 90% power output at 10
year life and 80% power output at 25 years of life. However, the modules could still offer energy
generation well beyond this guarantee of performance. A build up of dust and debris will impair
the module’s performance, so six monthly inspections and cleaning is recommended. A visual
monitor recording the generation of the array will correlate the actual energy generation and
expected generation. This will highlight if the array is underperforming, so relevant checks to
equipment can be made to ensure maximum potential is achieved.
Other considerations are the renewal of the inverter that converts DC to AC. They are usually
guaranteed for 5 years, although some inverters offer longer warranties.
4.2.7 Recommendations
There has been much publicity around the reduction of the PV tariff rate in recent months.
Although the payback achieved by investing in PV modules is now longer due to the lower FIT rate,
they are a low risk technology that, once installed, can continue to produce green electricity for
many years with minimal maintenance.

Page | 30
The reduction in FIT rate is also counteracted by the reduction in PV pricing that has occurred over
the last 2 years. In February 2012 DECC reported that installed PV prices had fallen by 45%
between 2009 and 20115.
It is recommended that only roofs that are South, or nearly South facing, are considered for PV
installations. This is to maximise the potential energy generation and to accrue the maximum
possible feed in tariff revenue which will ensure the shortest payback time is achieved. However, if
a long term view of progressing to a low carbon society is considered, then PV installations offer a
low risk, low maintenance, low carbon option which will assist the area and the council to meet
their renewable energy targets. PV can be considered to be a long term investment for a clean
energy future.
4.2.8 PV Potential
Solar PV is one of the simplest Renewable Energy technologies to roll out in an area such as the
Esk Valley. Table 11 shows an approximate calculation of the potential for PV installation based on
a number of assumptions.
Table 11 - Estimated number of potential PV installations
Estimated Properties 4000
Number of Properties with Suitable Roof 600
Estimated Take-up 10%
Average Array Size 2kW
Potential Total Installed Capacity 1,200kW
Annual Generation 960 MWh
CO2 savings per annum, tonnes 528
4.2.9 Next steps
Other possible sites for further investigation for PV installations are:
Lealholme Methodist Church;
Egton Bridge Church;
Saint Hilda, Egton;
Danby C of E primary school;
Front street shops, Grosmont;
Residential properties, The Carrs, Sleights and Egton Rd;
St Margaret’s Egton Rd;
5 DECC report on Solar PV Prices - Feb 2012 http://tinyurl.com/7ns8r8d

Page | 31
St Bartholomew’s, Ruswarp.
To progress these installations these further steps will need to be considered:
Detailed feasibility study and site visit;
Structural survey of roof to ensure wind and snow loads can be met, an average PV
module can have a weight of up to and around 20Kg;
Planning application;
Assessment by the District Network Operator (DNO);
Securing investment from community and third parties;
Selecting appropriate installer and PV module;
Construction and project management;
Operation and maintenance contract arranged;
Commissioning of system and electrical checks; and
Registration and accreditation of array for feed-in-tariff.
Page | 32
5.1 Biomass
Biomass is a generic term for organic material used as heating fuel. Burning sustainably sourced
biomass is a renewable source of heating and can make significant greenhouse gas emissions
savings compared to fossil fuels. The carbon dioxide emitted when wood is burned is the same
amount that was absorbed over the months and years that the plant was growing, therefore
when the biomass used is replenished in a sustainable cycle there is only net carbon emissions
from the felling and transportation of the biomass fuel. This highlights the importance of securing
a local source of biomass fuel if choosing to install a biomass system. It is estimated that carbon
dioxide (CO2) emission savings can be considerable, with around 7.5 tonnes of CO2 a year being
saved by replacing a solid (coal) fired system or electric storage heating with a wood-fuelled
boiler.
Large parts of the Esk valley are not on the gas grid and are reliant on oil and coal to meet their
space heating needs. By addressing this situation and developing a more sustainable way to
provide space heating to the population of the Esk Valley, huge carbon savings could be realised.
5.1.1 Domestic Heating
Wood-fuelled heating systems, also called biomass systems typically burn wood pellets, chips or
logs to provide warmth, in a single room, or to power central heating and hot water boilers.
However, wood chips are not really suitable for heating a single house and are more often used
to heat larger buildings. There are essentially two technologies that can be used to burn biomass
in a domestic setting:
Woodfuel boilers - these can be used as a direct replacement for standard gas or oil
boilers to provide hot water and heat conventional radiators.
Stoves – these are typically only used to heat individual rooms replacing a conventional
wood or coal fire. However, some can be equipped with a small back boiler to provide
limited hot water.
In the majority of cases, it is recommended that the installation of a woodfuel boiler be prioritised
over a stove. A stove would typically not provide sufficient heat for a property and an alternative
source of heating would still be required (the existing oil boilers).
5.1.2 Wood Fuel
Although the price of woodfuel varies considerably, it is often cheaper than other fuels and this
price advantage is predicted to improve as oil and gas prices rise due to decreasing availability.
Most pellet and chip boilers use automatic fuel feeders which are served by a fuel store which is
periodically refilled by a fuel supplier. Many of these installations now include an auto de-ash and
heat exchanger cleaning system.
5 Renewable Heat generation

Page | 33
There are 3 types of fuel; summary of indicative costs can be reviewed in table 12 :
Logs –They have good availability are cheap but bulky to handle and store.
Pellets –They are energy dense, requiring less storage space, but more expensive, approximately matching the p/kWh of mains gas (but cheaper than oil).
Wood chips–Considerably less expensive than pellets but are bulkier. Moisture content and therefore energy density/quality can vary according to source.
Table 12 – Summary of Wood Fuel costs
Fuel Type Size of system Cost per
tonne
Moisture
content
Logs 3-70kW £20-100 20%
Chips 8-500kW £30-75 30-40%
Pellets 30kW-200MW £130-250 10%
Typically, pellets are much easier to use than logs and chips. Indeed pellet boilers can be
automated and operated in much the same way as conventional gas or oil boilers. Log-burning
stoves and boilers have to be hand fed and consequently require considerably more work.
Pellet costs vary dependent on their specification, heat capacity and size, and method of delivery.
Buying in bulk significantly reduces the cost per tonne, in some places halving the cost from
£200/tonne to just over £100/tonne. However, this cost saving is offset by the need for a large
storage facility. Pellets will be most cost effective if purchased in bags from a local distribution
point as major suppliers are unlikely to deliver such small volumes to a domestic property unless
there are several other sites requiring deliveries nearby. It may be possible to set up a buying co-
operative to capitalise on this potential saving and this is discussed further in a later section.
Logs are typically cheaper and more locally available than pellets but increase in price the further
they have to be transported. As with pellets, buying in bulk can save money but more room is
required for storage. Further savings can be made if unseasoned logs are brought but these then
must be left for a year to season.
5.1.3 Capital Costs
Domestic wood-fuel boiler systems typically cost between £7000 and £12000, depending on
model, size and fuel. A suitably sized automatic pellet boiler for a domestic installation, including
fuel store and feeder, will cost around £11,500 including the flue and 5% VAT. Due to their relative
simplicity, log boiler systems, that have to be manually fed, can be slightly cheaper.
Domestic wood-fuel stoves typically cost between £1500 and £5000 depending on the fuel type
and amount of additional work required during installation. A typical pellet stove will cost around
£4,300 whilst a new log stove could cost up to half this amount, including a new flue or chimney
lining.

Page | 34
5.1.4 Financial Incentives
Unlike larger non-domestic installations these smaller domestic systems do not currently receive
Renewable Heat Incentives (RHI) tariff payments for heat generated from renewable sources.
However, phase 2 of the RHI includes the domestic element of the scheme and is expected to be
introduced in late 2012, around the same time as the UK Government’s Green Deal. Anybody who
has installed an eligible technology, including wood-fuel heating, since 15th July 2009 will be
eligible for the RHI.
However, there is some assistance available in the form of the Renewable Heat Premium
Payment for wood-fuel heating. This is designed to make domestic renewable technologies more
affordable and is effectively the forerunner of the RHI for domestic customers. Unfortunately, the
Renewable Heat Premium Payment scheme is only operational from 1st August 2011 to 31st March
2012 and for biomass heating is worth £950 per property.
However, to secure this the property will need to have a minimum of 250mm loft insulation as well
as cavity wall insulation, if appropriate and practical. In addition, to access this funding the
renewable heat product being installed must be listed under the Microgeneration Certification
Scheme and be installed by someone registered under the scheme.
At present, pellet and log stoves are not eligible for Renewable Heat Premium Payments and are
not expected to be supported by the RHI.
5.1.5 Savings
Financial savings vary depending on the system being replaced and biomass fuel being used. The
Energy Saving Trust estimate that replacing a gas heating system with a wood-burning system
might save £100 a year, but replacing electric heating could save as much as £580 per year. The
following table shows data taken from the Energy Saving Trust website and indicates how much
could be saved by installing pellet central heating in a typical three-bedroom semi-detached
house with basic insulation.
Table 13 – Summary of Wood Fuel costs
Fuel replaced Average annual
saving Expected CO2 saving
(tonnes/year)
Estimated
Payback period
(years) Electricity £580 7.5 16.5
Oil £280 4 40
LPG £720 3.5 13
Coal £300 7.5 32
Gas £100 3 95
Estimated payback periods will vary significantly depending on the total installed cost, the fuel
price and the system being replaced. In Table 13 above the payback periods have been calculated
based on an average installed cost of £9,500.

Page | 35
5.1.6 Installation requirements
Besides the financial considerations of installing a wood-fuel system it is also important to
consider:
1. Space
Wood boilers are larger than the gas or oil equivalents being replaced. In addition, extra
space is required to store the fuel that is convenient for deliveries and feeding the boiler.
2. Flue
All wood-fuel systems will require a flue or chimney that must meet the regulations for wood-
burning appliances. Using an existing chimney is possible but the majority will require lining in
order to comply with new legislations.
3. Planning permission
Typically planning permission is not required but all installations must comply with building
regulations. Some areas will also be designated smokeless zones and this must be checked
prior to installation.
5.1.7 Local Biomass Co-operative
Buying in bulk is normally cheaper than purchasing individual units. It is therefore probably that
greater cost savings, and consequently quicker payback periods, could be achieved by forming a
Biomass Cooperative. Ideally this would cover the purchasing of biomass boilers and the
appropriate fuel.
It has already been shown that buying pellets in bulk can significantly reduce the cost per tonne
by up to half and, whilst a similar reduction in the price is unlikely, buying multiple boilers from the
same supplier should result in savings. However, to offset this advantage space will be required
for the bulk fuel storage and a further local distribution system set-up. In addition, a way to
monitor fuel use will also have to be implemented.
In addition to the initial capital cost savings, buying as a co-operative could also have the
following positive effects:
Reduced delivery frequency of pellets – one monthly bulk delivery rather than biweekly
deliveries to individual units.
Reduce maintenance costs – as all the units will be similar/same routine maintenance
could be carried out at the same time reducing the need for specific trips
Cheaper installation – as well as reducing the cost of the upfront capital it could be
possible to negotiate cheaper installations costs due to the number of units being
installed.
The remote and relatively open nature of the Esk Valley means that there is no real potential to
develop a district heating scheme to provide hot water and/or heating to domestic properties.
Consequently there is no potential for the installation of large biomass heating plant.

Page | 36
5.1.8 Commercial Heating
Biomass boiler installations are financially viable when there is a large and constant base-load.
An example of this type of building could be Esk Moors Lodge extra care housing scheme in
Castleton Moor, depicted in Figure 12. This housing scheme of 12 flats for retired people could offer
a constant base load which could be supplied effectively by a biomass boiler. The Esk Moors
Lodge already utilises GSHP for heating and has PV modules. Further investigation could evaluate
the percentage of heat demand the GSHP achieves and whether this could be compatible to the
addition of renewable energy technologies.
Figure 12 - Potential location of containerised system
The business case for a wood-fuel boiler system could be considered to replace the existing
system. A wood pellet system maybe a more feasible solution than a wood chips boiler system.
Pellets require less space than wood chip due to their higher energy content. However, generally
pellets are more expensive than wood chips. For calculations in this report we have used figures
from a local pellet delivery company. We have estimated current costs of virgin wood pellet
delivered to the site at £200/tonne based on available local supply for an order of less than 10
tonne load per delivery.
5.1.9 Biomass boiler sizing
Based on assumptions of energy use in a modern well insulated building, the energy demand for
space heating has been assumed to be currently 120,000 kWh annually which could be met by a
47kW biomass boiler. We expect that the installation of a modern biomass boiler would increase
the efficiency by 10%.
5.1.10 Plant location and layout
There are two options for the retro-fit of a biomass boiler:
1. The first option is to install a 47kW biomass boiler in the current plant room of the building.
A full site assessment with a boiler installer would need to be carried out to assess the
feasibility of retro-fitting in the current space available.

Page | 37
2. The second option is to install a “47kW boiler in a box” solution on land adjacent to the
building, see Figure 13 and Figure 14 This would entail piping to the current internal boilers
and may have issues in regards to planning permission. A 47kW boiler would meet a high
percentage of the heating demand. Depending on fluctuations of peak demand it may
sufficiently meet up to 90% of the heat demand.
A containerised boiler is a self contained “plug and play” system inside a shipping
container which can be connected to existing heating systems through a heat exchanger.
Housing the Boiler installation in a containerised unit would allow sufficient storage space
for the required equipment including boiler, accumulator tank and fuel store.
The fuel is then fed from the Fuel Store into the Boiler Room via augers which connect
through apertures in the container walls. The process which is computer controlled
ensures just the right amount of fuel is fed into the boiler to enable efficient heating with
minimum amount of emissions. Hot water and heating is then linked to the existing
distribution systems..
Figure 13 - Potential location of containerised system
Figure 14 - Example containerised system
Biomass boiler containerised
solution

Page | 38
Containerised systems can also be clad in a variety of ways to ensure they blend into their
surroundings. A pre-fabricated plant room would include:
Biomass boiler;
Heat Accumulator Tank;
Heating circuit to accumulator tank;
Hydraulic interface to clients heating main;
Heat detection;
Frost protection heating;
On approach and interior lighting;
Ventilation;
Flue;
RHI compliant heat meter.
Pre-fabricated fuel store includes:
Pellet extract auger;
Fill & vent pipes;
Earthling points for fuel tanker;
Level observation windows;
Explosion relief panels;
Figure 15 depicts a 47kW boiler in a container with cladding effect; the length of the container is 20
feet and contains a silo with 5 tonne capacity.
Figure 15 – Containerised solution with cladding effect
5.1.11 Design and Planning
The visual impact of the biomass boiler can be an issue within a National park. Where appropriate
the National Park Authority recommends the conversion of the existing buildings. To house the
biomass boiler, fuel store and accumulator the building may not have sufficient space to retro-fit,
so a containerised solution may be the only solution.

Page | 39
5.1.12 Fuel requirement and delivery
Based on the projected heat demands of the recommended boiler the site will require
approximately 22 tonnes of pellet per year. Ensuring the pellets are delivered by an EN certified
truck, as seen in Figure 16 will ensure the highest quality pellets.
Figure 16 – Fuel delivery trucks, EN certificate, (left) – blowing pellets (right)
5.1.13 Financial assessment
An approximate financial assessment has been undertaken based on the assumptions detailed.
All costs in Table 14 and *If replacing oil with carbon intensity of 0.268kg/kWh with wood pellets =
0.04kg/kWh (DECC)
Table 15 are based on budget quotations, estimates, discussions with installers in the industry and
our experience. The capital cost of the full installation has been estimated at £27,335. In reality the
costs will vary according to factors such as equipment purchased, alterations to design and
escalated quotations for mechanical and electrical costs. Budget quotations were obtained from
three installers of biomass boilers in the UK (Yorkshire Solar, P&H Energy, and Econergy). A
capacity factor of 30% has been assumed.

Page | 40
Table 14 –Biomass Boiler potential outputs
Financial Assessment for Biomass Outputs Units
Oil Boiler
Annual Consumption 120,000 kWh
Boiler Efficiency* 80%
Annual Consumption 120,000 kWh
Estimated boiler output per year 96,000
price per kWh of oil 6 p/kWh
Oil cost per year £7,200 £
Biomass Wood pellet (Virgin)
Boiler Efficiency 90%
Estimated boiler output per year 96,000 kWh
Required Consumption 105,600 kWh
Energy per tonne 4,800 kWh
Estimated fuel consumption 22 Tonnes
Density of Wood Pellet 650 kg/m3
Volume of wood pellet 82 m3
Delivered cost of wood pellet 200 £ (ex
VAT)/tonne
Total Cost of Fuel £4,400
Cost per kWh 4.17 p/kWh
CO2Savings
*28 Tonnes/annum
*If replacing oil with carbon intensity of 0.268kg/kWh with wood pellets = 0.04kg/kWh
(DECC)
Table 15 : Financial appraisal for biomass
Variable Cost
Capital Cost + container with cladding £27,335
Annual Fuel Cost-Oil £7,200
Annual Fuel Cost-Biomass £4,400
Annual Savings (from reduced oil purchase) £2,800
Annual RHI Revenue £6,113
Surplus Income Annually £8,913
Payback (years) 3.1
Income generated over the 20 year RHI period, £ 150,629
Return on investment over 20 years, % 27.5
CO2 Savings (tonnes) year 28
5.1.14 Biomass Potential
There is the potential for a wide roll out of biomass heating throughout the Esk Valley. As can be
seen above, the paybacks are very good, especially for properties off the gas network. Table 16
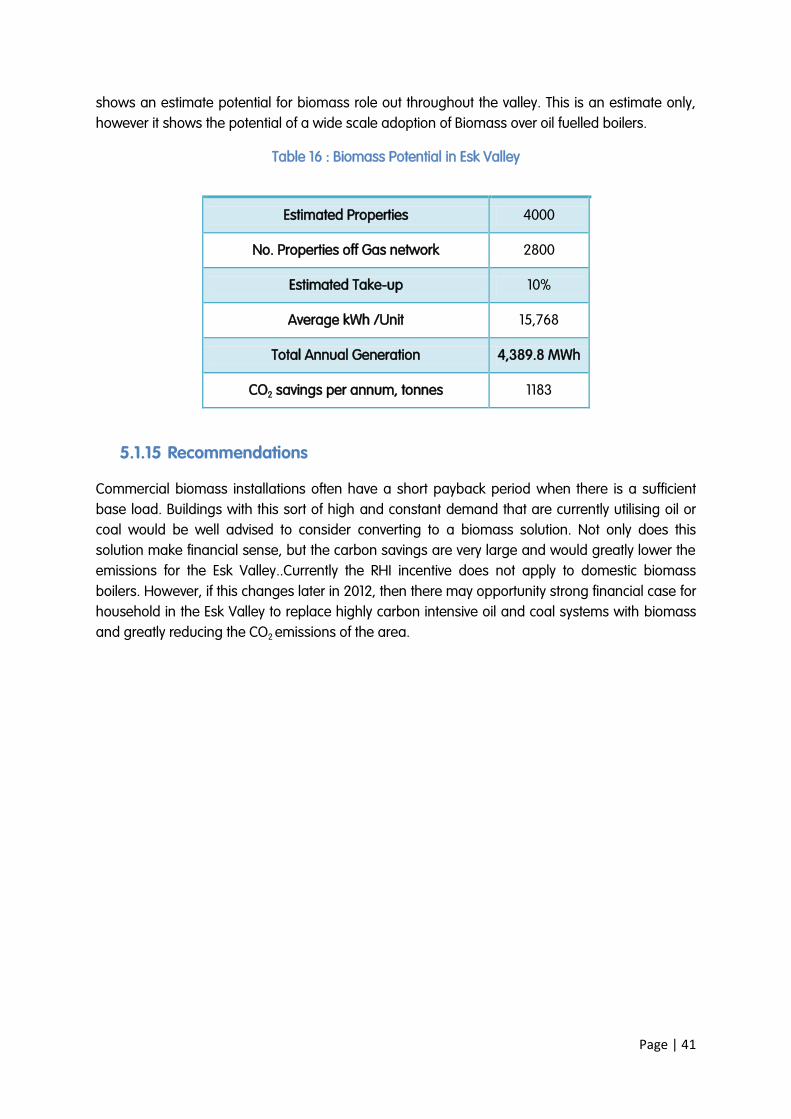
Page | 41
shows an estimate potential for biomass role out throughout the valley. This is an estimate only,
however it shows the potential of a wide scale adoption of Biomass over oil fuelled boilers.
Table 16 : Biomass Potential in Esk Valley
Estimated Properties 4000
No. Properties off Gas network 2800
Estimated Take-up 10%
Average kWh /Unit 15,768
Total Annual Generation 4,389.8 MWh
CO2 savings per annum, tonnes 1183
5.1.15 Recommendations Summary
Commercial biomass installations often have a short payback period when there is a sufficient
base load. Buildings with this sort of high and constant demand that are currently utilising oil or
coal would be well advised to consider converting to a biomass solution. Not only does this
solution make financial sense, but the carbon savings are very large and would greatly lower the
emissions for the Esk Valley..Currently the RHI incentive does not apply to domestic biomass
boilers. However, if this changes later in 2012, then there may opportunity strong financial case for
household in the Esk Valley to replace highly carbon intensive oil and coal systems with biomass
and greatly reducing the CO2 emissions of the area.

Page | 42
5.2 Solar thermal
Solar thermal applications are best suited for premises where there is a requirement for hot water
during and after peak sunshine hours. This corresponds well with retirement homes, restaurants
and domestic dwellings, especially where people are at home during the day and evening,
requiring hot water.
Esk Moors Lodge extra care housing scheme in Castleton Moor, depicted in Figure 17, has an ideal
southerly facing roof to install a solar thermal array to provide hot water to the 12 self contained
apartments. This could also feed into the proposed biomass system described above. This would
allow the solar thermal collectors to pre-heat water in the accumulator which could then be
brought up to temperature by the biomass boiler. The most efficient systems will operate when
they have a lower temperature cold feed. The cold feed water temperature to the solar thermal
collectors would be low enough to allow the solar thermal collectors to operate at high efficiency.
Figure 17 – Location of potential solar thermal collectors – Esk Moor Lodge
Figure 18 represents a closed solar thermal system which uses a working fluid (non-corrosive and
anti-freeze) to absorb the sun’s radiation in a roof-mounted collector. When the temperature
sensors monitor that the collector temperature is approximately 5-100C higher than the
accumulator temperature, the system uses an electric pump to circulate the water into the solar
cycle. The solar heated water is then transferred, via a heat exchanger or coil, into the
accumulator and acts a pre-heat for the secondary heating system. The accumulator has a
secondary coil connected to a biomass boiler to provide the remaining heat to bring the water
temperature up to the recommended working temperature.
Solar thermal array
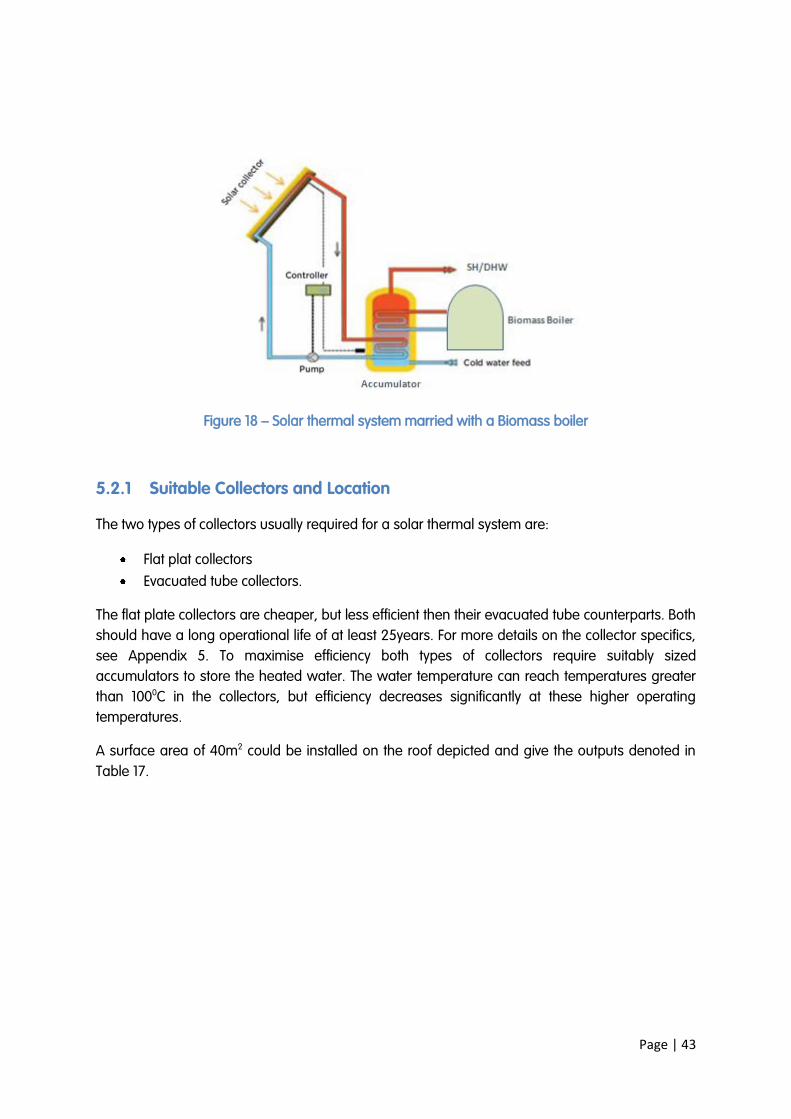
Page | 43
Figure 18 – Solar thermal system married with a Biomass boiler
5.2.1 Suitable Collectors and Location
The two types of collectors usually required for a solar thermal system are:
Flat plat collectors
Evacuated tube collectors.
The flat plate collectors are cheaper, but less efficient then their evacuated tube counterparts. Both
should have a long operational life of at least 25years. For more details on the collector specifics,
see Appendix 5. To maximise efficiency both types of collectors require suitably sized
accumulators to store the heated water. The water temperature can reach temperatures greater
than 1000C in the collectors, but efficiency decreases significantly at these higher operating
temperatures.
A surface area of 40m2 could be installed on the roof depicted and give the outputs denoted in
Table 17.

Page | 44
Table 17 – Summary of outputs for potential solar thermal installation
Thermal collector Evacuated tube Flat plate collector
Area of array, m2 40 40
Annual output of array, kWh 22,222 18,000
Appropriate RHI tariff, p/kWh 0.085 0.085
Potential revenue, £ 1,888 1,530
Potential savings from oil, £ 1,333 1,080
Cost/m2, £ 550 700
Approximate capital costs, £ 22,000 28,000
CO2 savings, p.a. (tonnes) 6.0 4.86
CRC savings at £12/tonne CO2, £ 45.60 36.90
Payback, years 6.8 10.7
ROI 20 years, % 9.97 4.52
Each 1m2 gives 100L/day at 550C draw off
If replacing oil heated hot water
5.2.2 Domestic installations of Solar thermal technology
The Renewable Heat Incentive for domestic properties will be introduced later in 2012 to coincide
with the ‘Green Deal’. Some renewable heat technologies have been eligible for the ‘Renewable
Heat Premium Payment’, however this is due to close on 31st March 2012. The tariff rates have not
yet been confirmed for domestic properties, therefore the example calculations in Table 18, giving
outputs for a 10m2 solar thermal array that could be installed on a south facing roof of a domestic
property, assume the same tariff rates as commercial properties. The domestic hot water heated
by the system could complement the existing system, as seen in Figure 19, although a new hot
water cylinder would need to purchased that can contain the secondary coil of the solar thermal
system.
Table 18 – Summary of outputs for potential solar thermal installation
Thermal collector Evacuated tube Flat plate collector
Area of array, m2 10 10
Annual output of array, kWh 5,556 4,500
Appropriate RHI tariff, p/kWh <200kWth 0.085 0.085
Potential revenue, £ 472.22 382.50
Potential savings, £ 333.3 270
Approximate capital costs, £ 5,500 7,000
CO2 savings, tonnes 1.5 1.2
Payback, years 6.8 10.7
Each 1m2 gives 100L/day at 550C draw off
If replacing oil heated hot water

Page | 45
SH/DHW
Accumulator
Figure 19 – Solar thermal system coupled to an existing heating system
5.2.3 Recommendations
The evacuated tube system would give the best value for money if a solar thermal system was to
be considered. However, currently the RHI doesn’t favour this technology and the payback is
longer than other renewable energy technologies. However, if a solar thermal system is replacing
costly oil heated hot water, then the payback becomes more reasonable. Therefore for those
properties off the gas network it is recommended that this type of renewable energy system
should be considered to meet hot water demand.
Other possible installations could be considered, for example, The National Moor Park Centre,
which has a large daytime hot water usage and possible evening usage?
Figure 20 – Location of potential solar thermal collectors – The National Park Moor Centre
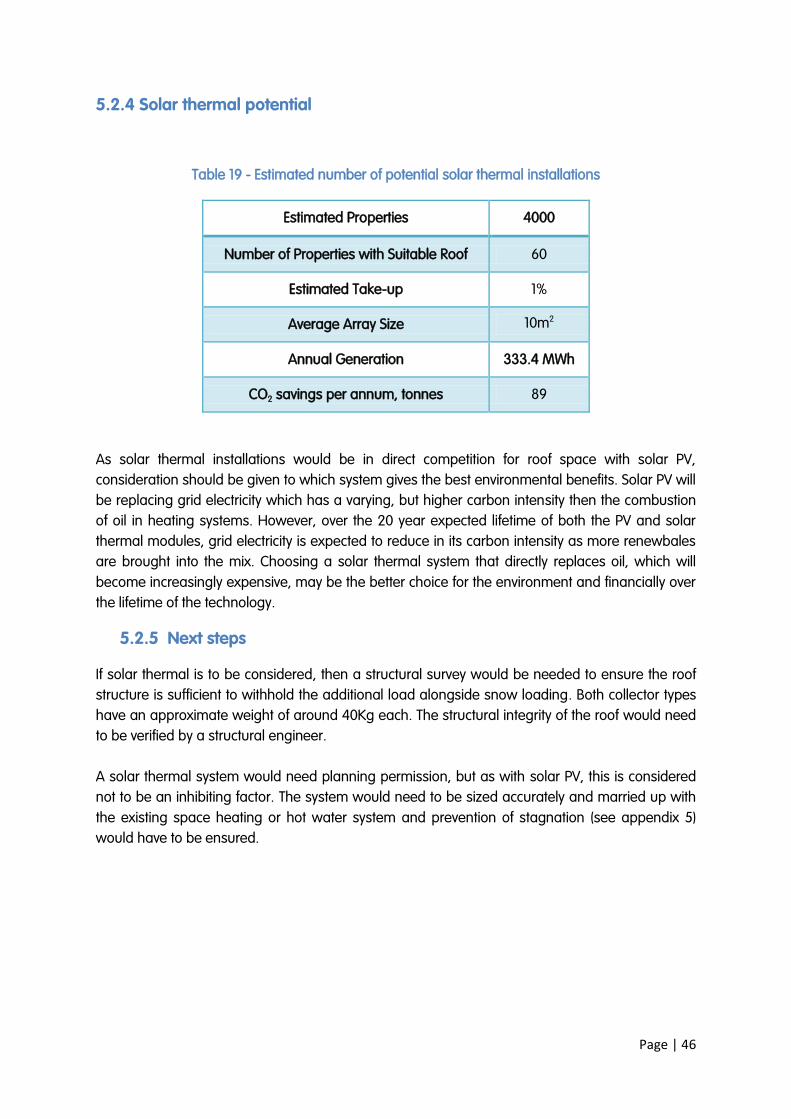
Page | 46
5.2.4 Solar thermal potential
Table 19 - Estimated number of potential solar thermal installations
Estimated Properties 4000
Number of Properties with Suitable Roof 60
Estimated Take-up 1%
Average Array Size 10m2
Annual Generation 333.4 MWh
CO2 savings per annum, tonnes 89
As solar thermal installations would be in direct competition for roof space with solar PV,
consideration should be given to which system gives the best environmental benefits. Solar PV will
be replacing grid electricity which has a varying, but higher carbon intensity then the combustion
of oil in heating systems. However, over the 20 year expected lifetime of both the PV and solar
thermal modules, grid electricity is expected to reduce in its carbon intensity as more renewbales
are brought into the mix. Choosing a solar thermal system that directly replaces oil, which will
become increasingly expensive, may be the better choice for the environment and financially over
the lifetime of the technology.
5.2.5 Next steps
If solar thermal is to be considered, then a structural survey would be needed to ensure the roof
structure is sufficient to withhold the additional load alongside snow loading. Both collector types
have an approximate weight of around 40Kg each. The structural integrity of the roof would need
to be verified by a structural engineer.
A solar thermal system would need planning permission, but as with solar PV, this is considered
not to be an inhibiting factor. The system would need to be sized accurately and married up with
the existing space heating or hot water system and prevention of stagnation (see appendix 5)
would have to be ensured.

Page | 47
5.3 Heat pump
A heat pump transfers and transforms low temperature heat, by way of a refrigeration vapour
compression cycle, to useful higher temperature heat. The smaller the difference between the low
temperature heat source and the temperature at which the heat is to be utilised, the higher the
‘coefficient of performance’ (COP) which is a measure of the energy used to power the heat pump
to the energy produced from the heat pump.
Heat pumps use an electrically driven compressor and pump to generate the heat produced,
therefore the COP is a measure of how much electricity they will consume for the heat they
generate. To maximise this COP and reduce this electrical consumption, it is recommended that
any heat pump uses a low temperature distribution system, such as under-floor heating or
oversized radiators, thus keeping the difference between the temperature source and the heat
used as low as possible.
As heat pumps still use electricity to generate the heat, they cannot be considered as a
‘renewable energy technology’ unless the electricity it uses has come from a renewable source. If
installing a Heat Pump further carbon savings could be made if the building owners or occupiers
chose to adopt ‘green tariff’ electricity.
However, they can be considered as a lower carbon technology if the system is designed to have
a net reduction of CO2 emissions than the system it is replacing. If the system that it is replacing is
a gas heating system, and the heat pump is being coupled to a higher temperature distribution
system, such as the existing radiator system, then this may result in higher net CO2 emissions and
could cost more to run. Therefore a heat pump system should be well thought out and costed to
ensure that the costs and CO2 emissions are in fact lower than the existing system.
However, as many of the dwellings and buildings in the Esk Valley are off the gas grid, a heat
pump system is likely to be replacing a coal or oil system and even with an existing higher
temperature distribution radiator system could give a reduction in overall CO2 emissions than the
existing system.
As with Solar thermal and Biomass domestic installations, the Renewable Heat Incentive tariffs for
heat pumps have not been confirmed and new installations will not be eligible for the RHPP from
31st March 2012. Therefore in these calculations to determine payback periods the tariffs have
been assumed to correlate with the current commercial RHI tariffs.
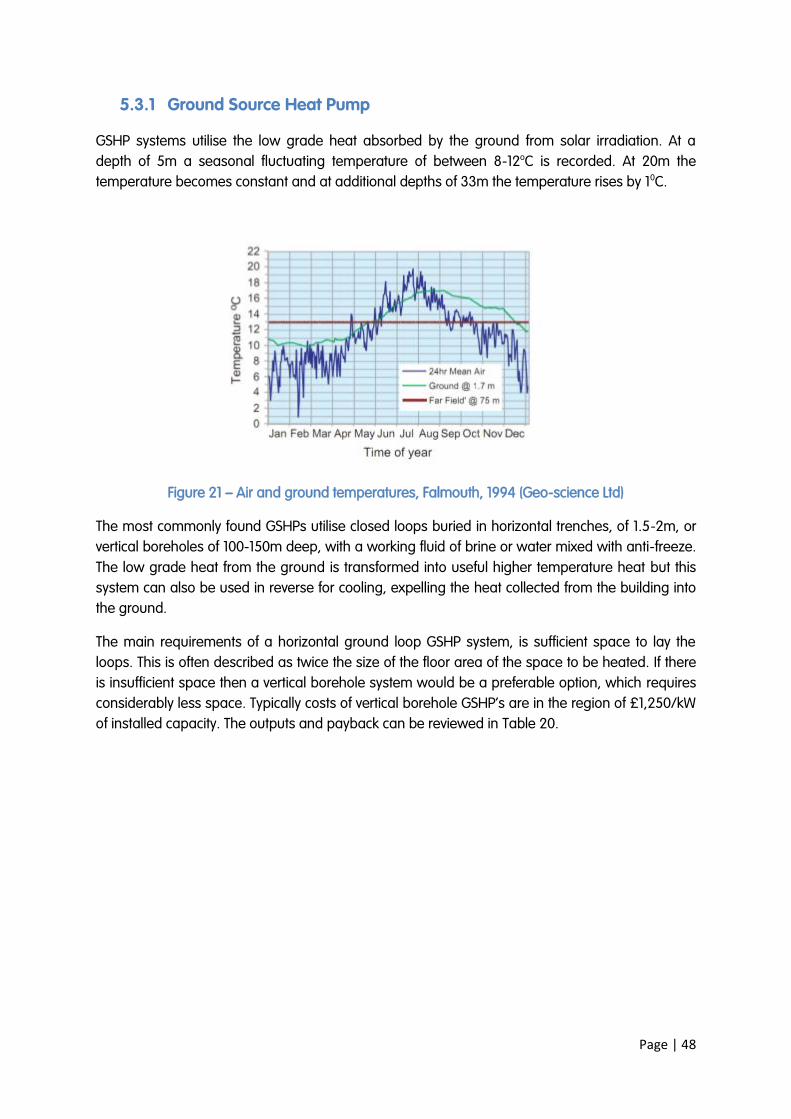
Page | 48
5.3.1 Ground Source Heat Pump
GSHP systems utilise the low grade heat absorbed by the ground from solar irradiation. At a
depth of 5m a seasonal fluctuating temperature of between 8-12oC is recorded. At 20m the
temperature becomes constant and at additional depths of 33m the temperature rises by 10C.
Figure 21 – Air and ground temperatures, Falmouth, 1994 (Geo-science Ltd)
The most commonly found GSHPs utilise closed loops buried in horizontal trenches, of 1.5-2m, or
vertical boreholes of 100-150m deep, with a working fluid of brine or water mixed with anti-freeze.
The low grade heat from the ground is transformed into useful higher temperature heat but this
system can also be used in reverse for cooling, expelling the heat collected from the building into
the ground.
The main requirements of a horizontal ground loop GSHP system, is sufficient space to lay the
loops. This is often described as twice the size of the floor area of the space to be heated. If there
is insufficient space then a vertical borehole system would be a preferable option, which requires
considerably less space. Typically costs of vertical borehole GSHP’s are in the region of £1,250/kW
of installed capacity. The outputs and payback can be reviewed in Table 20.

Page | 49
Table 20 – Summary of outputs for potential GSHP
GSHP Vertical borehole Ground loop Vertical
borehole Ground loop
Capacity of GSHP, kW 10 10 50 50
Assumed COP 4.5 3.5 4.5 3.5
Approximate capital costs
£12,500 £8,000 £62,500 £40,000
Approximate annual, kWh generation
26,280 26,280 131,400 131,400
Appropriate RHI tariff, p/kWh
0.045 0.045 0.045 0.045
Potential revenue, £ £1,183 £1,183 £5,913 £5,913
Cost of current oil system, £
£1,577 £1,577 £7,884 £7,884
Cost of GSHP electricity, £
£584 £751 £2,920 £3,754
Potential fuel savings, £
£993 £826 £4,964 £4,130
CO2 savings, tonnes 2.4 2.4 11.8 11.8
Payback, years 5.67 3.93 5.75 3.98
ROI 20 years, % 12.63 20.46 12.40 20.11
5.3.1.1 Assumptions
The calculations in

Page | 50
Table 20 are made with the following assumptions:
Price of oil = 0.06p/kWh;
Price of electricity = 10p/kWh;
Carbon intensity of oil = 0.268kg/kWh;
Carbon intensity of grid electricity = 0.545kg/kWh;
The capital costs are indicative and could well vary for differing sites according to ground
conditions.
5.3.1.2 Maintenance
Once installed the maintenance regime and costs of a GSHP are minimal, with no annual safety
inspection required, unlike combustion equipment. There are few moving parts, therefore wear
and tear is minimised, except the circulation pump, which will only usually be guaranteed for one
year and should be designed for easy replacement. GSHP systems, once installed, are low impact
both environmentally and visibly. Although they utilise electricity to drive the compressor and
circulating pump, with a typical coefficient of performance of 3, they produce three parts of heat
energy to the electrical energy it consumes.
5.3.1.3 Recommendations
The following recommendations are made in order to progress with the installation of a GSHP:
A detailed calculation of the heating demand of the building is required to accurately size the GSHP;
Energy reduction measures would need to be assessed and implemented to ensure the
energy costs are minimised.
Close scrutiny would need to be made to assess the feasibility of a ground loop or vertical
borehole collector;
Ground loops require an approximate area of 10m/kW installed capacity for GSHP,
therefore and assessment of viable sufficient land area must be made;
If a vertical borehole is to be considered an assessment of the ground conditions would
need to be made;
Assessment of feasibility of installing an under floor heating system or oversized radiators
to ensure the system operates at maximum efficiency and reduces the consumption of
electricity required.

Page | 51
5.3.2 Water Source Heat Pump (WSHP)
A water source heat pump is very similar to a ground source heat pump but uses a surface or underground water source (such as a lake, river, or bore hole) as the heat source. In many cases the same heat pump unit is used for both ground and water based systems. There are two main types of water source heat pumps. Closed Loop and Open loop:
5.3.2.1 Closed Loop
The closed loop water source heat pump operates similarly to a ground source heat pump, but the collector is submerged in the water rather than in the ground. However, it can be seen in Figure 22 that the temperature of a river can drop below those found at depths of 1.7m in the
ground as seen in Error! Reference source not found. These cooler river temperatures will result in lower efficiencies achieved by a WSHP than a GSHP, meaning that a water based unit may not perform as well as a ground based unit during the colder months.
Figure 22 – River temperatures of the River Ribble (EA science report, SC060017/SR)
However, if a heat pump is used for cooling in the summer, then a water source heat pump is generally more efficient than a ground source heat pump, as long as the coil can be submerged to an appropriate depth.
The installation of a closed loop Water Source Heat Pump may be cheaper than an equivalent ground source unit if the water source is located very nearby. However long distances will require an increase in energy used to pump the water and this may reduce the energy savings as well as increasing installation costs.
5.3.2.2 Open Loop
An open loop WSHP pumps the source water directly through the heat pump. However, risks around water quality causing damage to the system and issues about Environment Agency abstraction licenses mean that this system has not been furthered considered in this report.
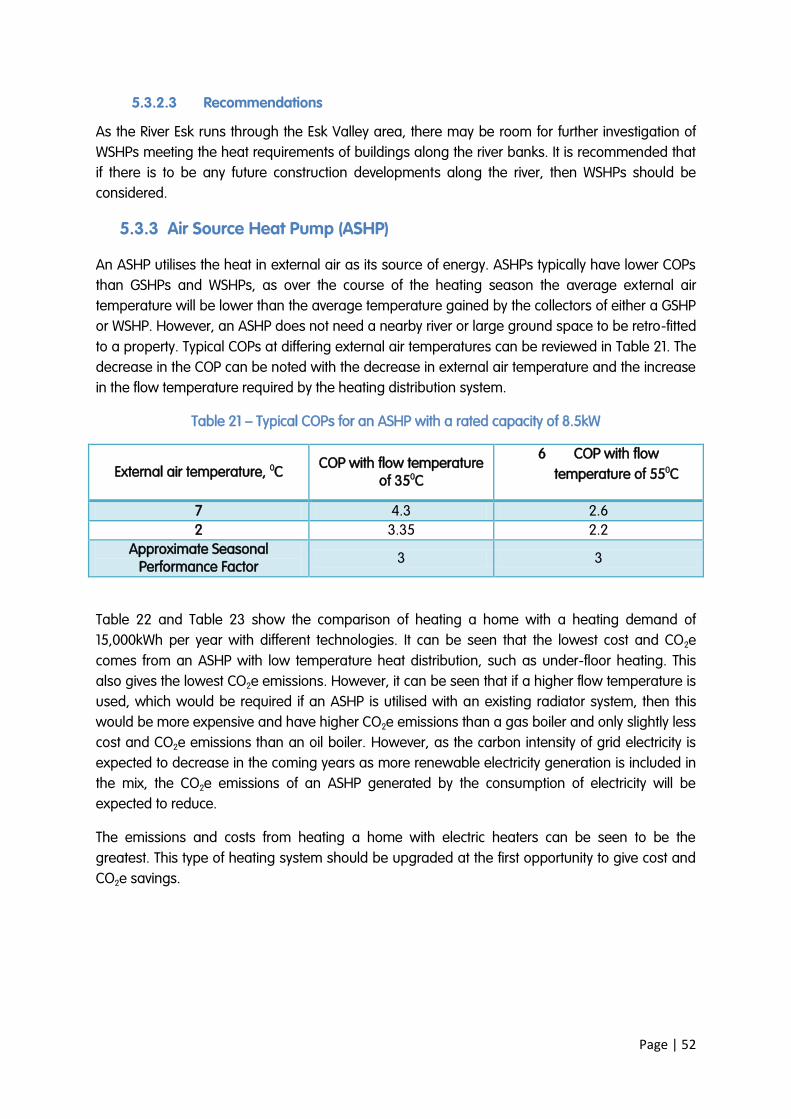
Page | 52
5.3.2.3 Recommendations
As the River Esk runs through the Esk Valley area, there may be room for further investigation of
WSHPs meeting the heat requirements of buildings along the river banks. It is recommended that
if there is to be any future construction developments along the river, then WSHPs should be
considered.
5.3.3 Air Source Heat Pump (ASHP)
An ASHP utilises the heat in external air as its source of energy. ASHPs typically have lower COPs
than GSHPs and WSHPs, as over the course of the heating season the average external air
temperature will be lower than the average temperature gained by the collectors of either a GSHP
or WSHP. However, an ASHP does not need a nearby river or large ground space to be retro-fitted
to a property. Typical COPs at differing external air temperatures can be reviewed in Table 21. The
decrease in the COP can be noted with the decrease in external air temperature and the increase
in the flow temperature required by the heating distribution system.
Table 21 – Typical COPs for an ASHP with a rated capacity of 8.5kW
External air temperature, 0C COP with flow temperature of 350C
6 COP with flow
temperature of 550C
7 4.3 2.6 2 3.35 2.2
Approximate Seasonal Performance Factor
3 3
Table 22 and Table 23 show the comparison of heating a home with a heating demand of
15,000kWh per year with different technologies. It can be seen that the lowest cost and CO2e
comes from an ASHP with low temperature heat distribution, such as under-floor heating. This
also gives the lowest CO2e emissions. However, it can be seen that if a higher flow temperature is
used, which would be required if an ASHP is utilised with an existing radiator system, then this
would be more expensive and have higher CO2e emissions than a gas boiler and only slightly less
cost and CO2e emissions than an oil boiler. However, as the carbon intensity of grid electricity is
expected to decrease in the coming years as more renewable electricity generation is included in
the mix, the CO2e emissions of an ASHP generated by the consumption of electricity will be
expected to reduce.
The emissions and costs from heating a home with electric heaters can be seen to be the
greatest. This type of heating system should be upgraded at the first opportunity to give cost and
CO2e savings.
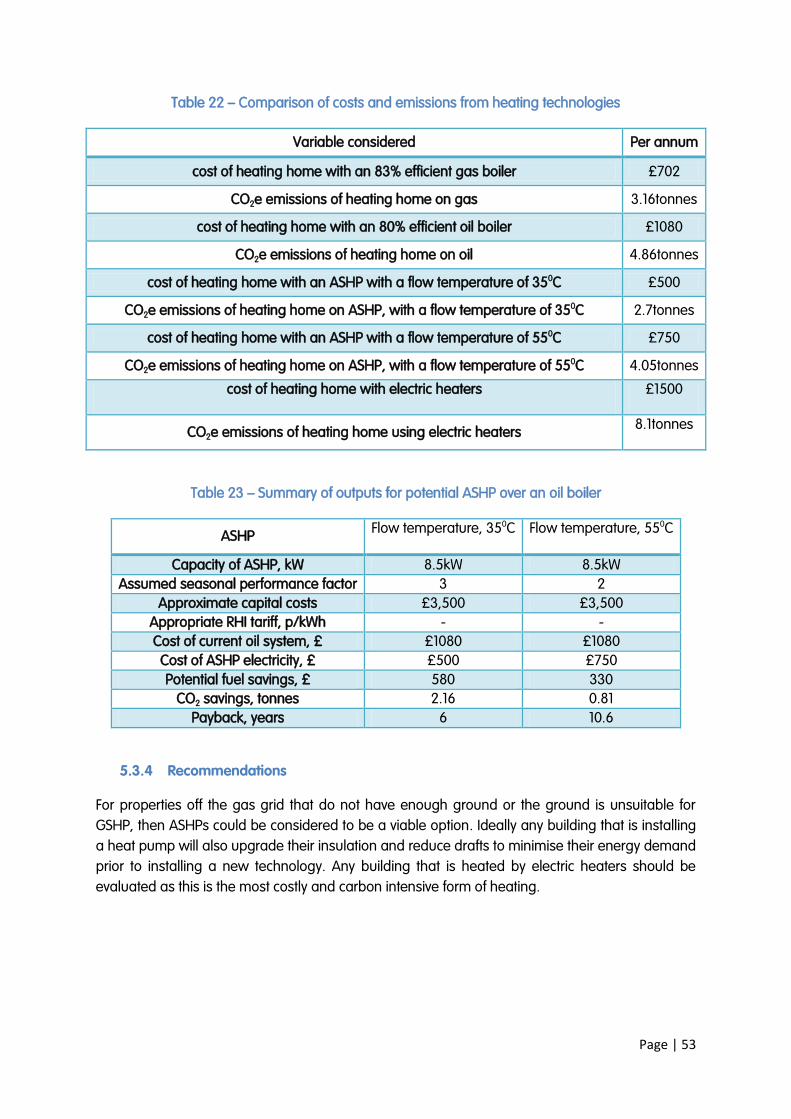
Page | 53
Table 22 – Comparison of costs and emissions from heating technologies
Variable considered Per annum
cost of heating home with an 83% efficient gas boiler £702
CO2e emissions of heating home on gas 3.16tonnes
cost of heating home with an 80% efficient oil boiler £1080
CO2e emissions of heating home on oil 4.86tonnes
cost of heating home with an ASHP with a flow temperature of 350C £500
CO2e emissions of heating home on ASHP, with a flow temperature of 350C 2.7tonnes
cost of heating home with an ASHP with a flow temperature of 550C £750
CO2e emissions of heating home on ASHP, with a flow temperature of 550C 4.05tonnes
cost of heating home with electric heaters £1500
CO2e emissions of heating home using electric heaters 8.1tonnes
Table 23 – Summary of outputs for potential ASHP over an oil boiler
ASHP Flow temperature, 350C Flow temperature, 550C
Capacity of ASHP, kW 8.5kW 8.5kW
Assumed seasonal performance factor 3 2
Approximate capital costs £3,500 £3,500
Appropriate RHI tariff, p/kWh - -
Cost of current oil system, £ £1080 £1080
Cost of ASHP electricity, £ £500 £750
Potential fuel savings, £ 580 330
CO2 savings, tonnes 2.16 0.81
Payback, years 6 10.6
5.3.4 Recommendations
For properties off the gas grid that do not have enough ground or the ground is unsuitable for
GSHP, then ASHPs could be considered to be a viable option. Ideally any building that is installing
a heat pump will also upgrade their insulation and reduce drafts to minimise their energy demand
prior to installing a new technology. Any building that is heated by electric heaters should be
evaluated as this is the most costly and carbon intensive form of heating.

Page | 54
The Esk Valley community have already proved their low carbon credentials by commencing the
installation of their own community owned hydropower turbine and installing many other low
carbon technologies. By implementing the recommendations made in this report Esk Valley could
become an exemplar low carbon community within the Country.
By reducing its carbon footprint by means of embedding sustainability into its long term strategy,
the Esk Valley could reduce their carbon footprint, lower their fuel costs and ensure their own
security of energy. This will not only protect them against future energy price rises and the
increasing problem of fuel poverty, but it could also generate income for the residents of the Esk
Valley.
Gas and electricity prices have increased dramatically in recent years and are likely to remain
volatile. The increasing energy costs and issues regarding security of supply offers a powerful
argument to invest in renewable energy technologies. The aim of this report is to highlight
potential renewable energy installations within the Esk Valley area and give an overview of their
costs, paybacks and carbon savings. The summary of these findings can be reviewed in Table 24.
Table 24 – Renewable installation summary figures
Installation type Installed capacity,
kW
Energy generation,
kWh/yr
Capital cost, £
Payback, years
CO2e savings, tonnes/year
Wind turbine x 27 135 356,022 810,000 6.6 186.8
PV array – all sites highlighted
48.14 36,163 69,245 7 19.708
20 domestic PV arrays
30 23,000 62,920 9 12.53
Biomass – 50 residences
500 1,314,000 475,000 await RHI 399.46*
Biomass – Esk Moor care home
150 400,000 93,106 5.1 95*
GSHP – 10 residences 100 262,800 125,000 5.1 24
ASHP – 20 residences, low flow
temperatures 170 300,000 90,000 6 43.2
*If replacing oil with carbon intensity of 0.268kg/kWh with wood pellets = 0.04kg/kWh
(DECC)
6 Summary

Page | 55
6.2 Overview of feasible technologies considered
Wind – The study has highlighted that there are some sites with great wind speeds for possible
wind turbine developments. However, planning permission and other constraints may only allow
some small developments. CO2Sense would recommend that the land owners of the highlighted
‘hot spots’ sites seek further advice on planning issues regarding the erection of these wind
turbines.
PV - Possible PV installation sites have been pinpointed, although there are only a few buildings
that have roofs facing due south, possibly due to the topography of the area. The costs and
paybacks calculated give indications of the energy generation potential and returns on PV
installations. There has been much media coverage and controversy around the reduced feed in
tariff and PV installations, however, a well designed and costed array can still provide a good
return on investment and offers a low risk, long term source of renewable electricity. CO2Sense
recommends that the Esk Valley community assess the aspect of their own roofs and in the
instance that they have a South facing aspect, they can assess the financial viability of installing
their own PV array. For those sites highlighted, CO2Sense would recommend that the owners of
those properties be encouraged to follow the next steps outlined for the installation of the
potential PV arrays.
Hydro – This feasibility assessment has not investigated the further development of weirs along
the River Esk. EVCEG has previously had feasibility assessments of potential hydro development
sites along the river Esk, CO2Sense would recommend that further research could be undertaken
as to the viability of a future hydropower development at any of these sites.
Biomass – Individual homes currently off the gas grid are currently faced with large heating bills.
With the introduction of the RHI for domestic properties later in 2012, it will make financial sense to
replace many existing fossil fuelled systems with biomass, giving significant CO2 emission savings
to the area.
An installation of a biomass boiler at Esk Moor retirement apartments or similar sites offers a great
opportunity for these types of buildings with that level of heat usage to reduce its carbon footprint
and secure a revenue stream for up to 20 years. CO2Sense recommends that any potential
biomass sites look to undertake feasibility assessments with possible investment potential from
CO2Sense.
Heat pumps –As heat pumps are best utilised with under floor or low temperature heating, no
specific buildings have been highlighted as suitable for retrofitting with a GSHP. However, if a heat
pump is replacing an oil, coal or electric heated building then cost and CO2e emissions savings
will be made.

Page | 56
6.3 Recommendations and next steps
6.3.1 Wind installations
Constraints – There can be many constraints to wind installations
Recommendations – Consultation about the role wind energy can have in reducing the
CO2e emissions in the Esk Valley.
Next steps –
o Identify sites;
o Wind data collection /modelling;
o Talk to landowners;
o Discussions with MCS Wind Turbine Installers, site specific surveys and three
quotes per site;
o Initial consultation with LPA concerning permissibility of turbine installation;
o Preliminary EIA and consultations with relevant local bodies;
o Grid Connection Application;
o Local Consultation.
Comments – Wind installations can be divisive and many people have polarised opinions.
They are however a good long term way of generating green energy and bringing in an
extra revenue stream for land owners. They are not long-term fixed structures, but can be
removed after their operational life with ease. Embedding decentralised generation within
the area will also lead to less requirements for grid strengthening and the works and costs
that these measures will incur.
6.3.2 PV
Constraints – There are not many constraints when installing a PV array:
o Appropriately orientated and pitched roof space;
o Adequate structural load of designated roof;
o Planning permission for commercial buildings;
o Permitted development for domestic buildings;
o For large arrays, sufficient grid connection with appropriate permissions;
Recommendations – Further scrutiny of capital costs and payback periods.
Next steps – Investigation of financial structure whereby a community group can invest in
large scale array on private of council owned building as an ESCo model.
Comments – Once the capital costs have been agreed with an installer and the payback
period is ascertained, PV becomes a low risk, low maintenance green energy generator for
at least 25 years and possibly beyond.

Page | 57
6.4 Biomass
Constraints – There are not many constraints when considering the installation of a
Biomass Boiler:
o Exhaust emissions from the Biomass plant;
o Increased traffic for wood fuel delivery;
Recommendations –
o Ensure the building has energy efficiency recommendations made and
implemented; Confirm heat demand / output of the boilers:
o Ensure sufficient space for the installation of a biomass boiler:
o Negotiate long term contracts with suitable fuel suppliers;
o Undertake detailed financial modelling for the lifetime of the equipment using real
costs and site specific data;
Next steps –
o Detailed feasibility/design and planning support –further detailed assessment will
be required in addition to planning applications and related studies;
o Installer/supplier selection - review experienced qualified suppliers to secure the
best value for money. This would include equipment, installers and fuel suppliers;
6.4.1 Heat Pumps
Constraints – There a few constraints around this type of technology, which once installed
has a low visible impact on the environment and minimal maintenance requirement:
o Appropriate heating distribution system;
o Adequate insulation and air tightness to ensure there isn’t excessive electrical
usage to power the compressor;
GSHP
Adequate space for ground loops;
Adequate ground conditions for vertical bore hole;
No utilities buried on the land earmarked for the ground loops or
boreholes.
ASHP
Sufficient outdoor space to house unit with good air flow;
WSHP
Permission from the Environment agency to sink loops into a river ;
The river isn’t too far from the building to be heated;
The power demand for the pump for the WSHP does not out-
weigh the benefits of the system.
Recommendations – Further scrutiny of energy demand of building, capital costs and
payback periods.
Next steps –
o A detailed calculation of the heating demand of the building in order to more
accurately size the heat pump;

Page | 58
Energy reductions measures need to be assessed and implemented to ensure
that energy costs are minimised.
If a GSHP is considered then a detailed assessment to determine the feasibility of
a ground loop or vertical borehole collector.
If a GSHP vertical borehole is to be considered then an assessment of the ground
conditions would need to be made.
Assessment of feasibility of installing under floor heating or oversized radiators.

Page | 59
This study has highlighted that the Esk Valley will have to consider many renewable micro-
generation installations to achieve a reduction in the CO2e emissions it produces from the
consumption of energy. It has shown that some technologies will give better CO2e savings than
others, particularly those technologies that can replace the highly carbon intensive process of
heating homes that utilise coal or oil.
It can be seen from the results that if 50 properties replaced their oil fired boilers with wood pellet
boilers significant CO2 emissions savings could be achieved. This highlights the carbon intensity of
heating homes, especially off the gas grid, and how a relatively small number of those dwellings
converting to a renewable fuel source can have a huge impact on the carbon emissions for the
area.
Analysis undertaken for this report indicates that with the introduction of the Renewable Heat
Incentive (RHI), biomass heating schemes for buildings with a large and constant heating load
offer the greatest financial and carbon savings for the Esk Valley.
Although there are many constraints around wind turbine developments, wind turbines offer large
carbon savings and reasonable returns on investment. It is recommended that the next steps for
development are implemented to seek planning permission to erect the wind turbines highlighted
in the ‘hot spots’ map.
Investment should also be considered in the PV arrays discussed in this report. Although the
potential paybacks are longer than the biomass and wind installations, PV is a low risk, low
maintenance and long term renewable energy technology. With the lowering of the FiT rate for
solar PV, PV installations have become more costly. Therefore only those sites with a southerly
aspect should be considered for installation. This limits the options for PV installation considerably.
As energy prices continue to rise, this will make renewable energy technologies more cost
effective and reduce their payback times. CO2Sense strongly recommends that uptake of
renewable installations is considered while the Government are offering 20 year guaranteed tariff
rates to subsidise these technologies. Not only will this uptake assist the Esk Valley to reduce its
carbon footprint, but it will give security of energy supply giving resilience to remote communities,
but also protect from the volatile energy market.
This feasibility study should be considered in tandem with the ten year low carbon strategy that
CO2Sense has formulated on behalf of Danby Village Hall to assist the Esk Valley in the transition
to become a low carbon sustainable area.
7 Conclusion

Page | 60
Appendices
A1 Planning
National Policy
The UK’s national planning policy strongly encourages the development of renewable energy in
order to meet European targets on CO2 reduction.
The key national policy statement is Planning Policy Statement 22 ‘Renewable Energy’ (PPS22)
which sets out the Government's policies for renewable energy. It advises that a positive approach
should be taken towards renewable energy proposals in locations where technology is viable and
environmental and social impacts can be satisfactorily addressed. It goes on to state that small
scale projects can provide a valuable contribution to overall outputs of renewable energy and to
meeting energy needs both locally and nationally.
PPS22 also provides guidance for developments in nationally designated areas such as the North
York Moors national park an states:
‘Small-scale developments should be permitted within areas such as National Parks, Areas of
Outstanding Natural Beauty and Heritage Coasts provided that there is no significant
environmental detriment to the area concerned.’
Regional Policy
The Yorkshire and Humber Plan is the Regional Spatial Strategy (RSS) for the region. The Plan was
adopted in May 2008. The RSS is a statutory document and part of the development plan. It
informs the preparation of Local Development Frameworks and is an important consideration in
the determination of planning applications.
Policy ENV5 from the Yorkshire and Humber Plan covers energy and its main goals are to:
Maximise improvements to energy efficiency and increase in renewable energy capacity
Reduce greenhouse gas emissions, improve energy efficiency and maximise the efficient
use of power sources
Maximise renewable energy capacity through the delivery of regional and sub-regional
targets
Promote greater use of local renewable energy in new development
Policy ENV5 also sets targets for individual authority areas and whilst these do not applt to the
National Park, It is however presumed that National Parks will contribute to these via appropriate
developments, in accordance with National Planning Policy PPS22.

Page | 61
It should be noted that in July 2010, the UK Government announced its intention to abolish
Regional Spatial Strategies. These will be replaced as part of the National Planning Policy
Framework which is due later this year. This means that Yorkshire and Humber Plan will no longer
form part of the Development Plan for the National Park.
The aim of the National Planning Policy Framework is to make the planning system less complex
and more accessible, and to promote sustainable growth. It forms part of the localism Bill which
aims to shift power from central government back into the hands of individuals, communities and
councils.
In the revocation announcement of the Regional Spatial Strategies, the Chief Planner stated in
support of Renewable Energy Developments:
“ Through their local plans, authorities should contribute to the move to a low carbon economy,
cut greenhouse gas emissions, help secure more renewable and low carbon energy to meet
national targets, and to adapt to the impacts arising from climate change”
In August 2011 the decision to abolish RSS was challenged successfully in the high court. In light of
this he North Yorkshire Moors Planning Authority are able to continue to use the RSS as part of its
Statutory Development Plan until the Localism Bill is passed into law at which point the RSS will be
superseded by the new Bill.
Local Policy
Planning within the Esk Valley comes under the The North York Moors National Park Authority.
Planning within National Parks is a careful balancing act in meeting the needs of those who live,
visit and work in each National Park now, and protecting these areas for the future.
Every proposal and location will be different and each application will need be considered by the
planning authority on its own merits. In particular, proposals affecting Conservation Areas or
Listed Buildings may require careful consideration to ensure that these receive the necessary level
of protection. Early discussion with Planning Officers and local communities is essential in helping
to identify and resolve any potential issues.
Local Development Framework
The local Development Framework for the North York moors national park consists of a number of
different documents to guide future development whilst ensuring that the National Park's special
qualities are conserved and enhanced.

Page | 62
The Core Strategy and Development Policies document is a key part of this framework 6. It brings
together the core plans and strategies for the National Park and sets out a policy framework up to
2026.
Core Policy D (Climate Change) of this document) states:
Activities in the National Park will address the causes of climate change and contribute to
reducing greenhouse gas emissions, by:
1. Reducing the use of energy and the need to use energy.
2. Generating energy from renewable sources where these are of a location, scale
and design appropriate to the locality and which contribute towards meeting
domestic, community or business energy needs within the National Park.
3. Requiring residential developments of 5 or more houses and other uses of 200sqm or
more to generate energy on-site from renewable sources to displace at least 10% of
predicted CO2 emissions.
However this is needs to be taken into context alongside Development Policy 3 -Design:
To maintain and enhance the distinctive character of the National Park, development will be
permitted where:
1. The siting, orientation, layout and density preserves or enhances views into and out of
the site, spaces about and between buildings and other features that contribute to
the character and quality of the environment and will not result in the loss of an
open space which contributes to the amenity, character and setting of a
settlement.
2. The scale, height, massing, proportion, form, size, materials and design features of
the proposal are compatible with surrounding buildings, and will not have an adverse
effect upon the amenities of adjoining occupiers.
3. A high standard of design detailing is used whether traditional or contemporary,
which reflects or complements that of the local vernacular.
4. Provision is made for adequate storage and waste management facilities.
5. .Good quality sustainable design and construction techniques are incorporated in the
development including measures to minimise energy use and where possible use
energy from renewable sources.
6. A satisfactory landscaping scheme forms an integral part of the proposal.
6 http://tinyurl.com/774mwse North York moors Core Strategy and Development Policies document

Page | 63
7. The design takes account of the safety, security and access needs for all potential
users of the development and provides car parking provision in line with the standards
adopted by the Authority.
North York Moors National Park Management Plan
Alongside specific planning policy, the National Park Authority has a National Park Management
Plan which provides the main source of strategic policies for managing the Park. It describes the
special qualities of the North York Moors and sets out objectives and policies not just for the
Authority but for all organisations and agencies whose work or activities affect the National Park.
The North Yorkshire Moors National Park Management Plan has a number of Development
Objectives which support reneable energy development:
Planning and Sustainable Development Objective 3:
To promote concepts, designs, orientation and aspects of development that minimise the
use of energy and to encourage the use of sustainable resources in the construction of
new development providing that the conservation of the landscape and built environment
of the National Park is not adversely affected.
Planning and Sustainable Development Objective 4:
To promote the use of renewable energy sources that provide energy for communities
within the National Park providing that any development involved does not significantly
detract from the conservation of the landscape and built environment of the National Park.
Renewable Energy - Supplementary Planning Document
The Park authority has also issued a Renewable Energy Supplementary Planning Document.
Whilst this is not policy, it does provide guidance to anyone looking at developing renewable
technology within the National park area.
This document provides an overview of each technology and details of what an application for
each should comprise off. With reference to large scale installations the document also states:
‘Whilst the Authority recognises the importance of reducing the causes of climate change and is
actively seeking to reduce greenhouse gas emissions, large scale renewable energy
developments can be particularly damaging to the landscape and environment of the National
Park which is protected through the 1995 Environment Act. The basis for consideration of all
applications will therefore be that the need for renewable energy must not override the statutory
purposes’

Page | 64
Permitted Development
Installing certain renewable energy technologies, such as solar panels and biomass boilers, has
now been made a lot simpler thanks to Permitted development rights introduced in 2008
The General Permitted Development Order (GPDO) grants rights to carry out certain limited forms
of development on the home, without the need to apply for planning permission. If covered under
GPDO we would still recommend discussing any proposed development with the Planning
Authority to ensure
The scope of the GPDO in England now extends to the following technologies which have been
discussed in this report:
Roof Mounted PV or Solar Thermal
In many cases fixing solar panels to your roof is likely to be considered 'permitted development'
under planning law with no need to apply for planning permission. There are, however, important
exceptions and provisos which must be observed.
All solar installations are subject to the following conditions:
Panels on a building should be sited, so far as is practicable, to minimise the effect on
the appearance of the building.
They should be sited, so far as is practicable, to minimise the effect on the amenity of
the area.
When no longer needed for microgeneration they should be removed as soon as
possible.
The following limits apply to roof and wall mounted solar panels:
Panels should not be installed above the ridgeline and should project no more than
200mm from the roof or wall surface.
If your property is a listed building installation is likely to require an application for listed
building consent, even where planning permission is not needed.
If the property is in a conservation area, or in a World Heritage Site, planning consent is
required when panels are to be fitted on the principal or side elevation walls and they
are visible from the highway. If panels are to be fitted to a building in your garden or
grounds they should not be visible from the highway.

Page | 65
Biomass
Planning permission is not normally needed when installing a biomass system in a house if the
work is all internal. If the installation requires a flue outside, however, it will normally be permitted
development if the conditions outlined below are met.
Flues on the rear or side elevation of the building are allowed to a maximum of one metre
above the highest part of the roof.
If the building is listed or in a designated area even if you enjoy permitted development
rights it is advisable to check with your local planning authority before a flue is fitted.
Consent is also likely to be needed for internal alterations.
In a conservation area or in a World Heritage site the flue should not be fitted on the
principal or side elevation if it would be visible from a highway.
If the project also requires an outside building to store fuel or related equipment the same rules
apply to that building as for other extensions and garden outbuildings.
Air Source Heat Pumps
From 1 December 2011 the installation of an air source heat pump on domestic premises is
considered to be permitted development, not needing an application for planning permission,
provided ALL the limits and conditions listed below are met.
These permitted development rights apply to the installation, alteration or replacement of an air
source heat pump on a house or block of flats, or within the curtilage (garden or grounds) of a
house or block of flats, including on a building within that curtilage. A block of flats must consist
wholly of flats (e.g. should not also contain commercial premises).
Limits to be met:
The volume of the air source heat pump’s outdoor compressor unit (including housing) must not
exceed 0.6 cubic metres.
Only the first installation of an air source heat pump would be permitted development,
All parts of the air source heat pump must be at least one metre from the property boundary.
Installations on pitched roofs are not permitted development. If installed on a flat roof all parts of
the air source heat pump must be at least one metre from the external edge of that roof.
Permitted development rights do not apply for installations within the curtilage of a Listed
Building or within a site designated as a Scheduled Monument.

Page | 66
On land within a Conservation Area or World Heritage Site the air source heat pump must not
be installed on a wall or roof which fronts a highway or be nearer to any highway which bounds
the property than any part of the building.
On land that is not within a Conservation Area or World Heritage Site, the air source heat pump
must not be installed on a wall if that wall fronts a highway and any part of that wall is above
the level of the ground storey.
In addition, the following conditions must also be met. The air source heat pump must be:
used solely for heating purposes.
removed as soon as reasonably practicable when it is no longer needed for microgeneration.
sited, so far as is practicable, to minimise its effect on the external appearance of the building
and its effect on the amenity of the area.

Page | 67
A2 Financial Incentives
Through the use of the ‘Feed-in-tariff’ and the ‘Renewable heat incentive’ the Department for
Energy and Climate Change (DECC) hope to encourage deployment of low carbon generation of
electricity and heat. The schemes promote investment in eligible renewable installations below
5MW and award index linked guaranteed payment, for 20 years, or 25 years for PV.
The feed-in-tariff
The feed-in-tariff supports technologies that generate renewable electricity and offer payments for
both the electricity they generate and export to the grid. The following ‘generation’ tariff rates, in
pence per kWh, are applicable for eligible renewable energy technologies installed before 31st
March 2012.
On 31st October 2011 DECC announced radical planned changes to the solar FIT which proposed
halving the tariff and applying a new rate from 1 April 2012 to all new solar PV installations with an
eligibility date on or after 12th December 2011. There has been widespread concern about the
proposed change and accelerated timescale of change. Subsequently these changes were
challenged in court and the High Court ruled that the proposed changes were unlawful.
As a result the original FiT rates will apply until 3rd March and thereafter fall to the lower rates
proposed by DECC. Therefore installations made before 3rd March will be able to secure the
original FiT rate, while those after this date will receive the lower rates.
From the 1st April all new building-connected PV installations will only be eligible to receive the FiT if
they can demonstrate that the building they are attached to meets minimum energy efficiency
criteria. This is currently proposed at EPC level C or equivalent (this is still in consultation).
A wider review of the FiT for other technologies is due to be released in February although this
may be delayed. CO2Sense are aware of no major changes planned for the FiT for other
technologies, however we cannot confirm any details until the “Phase 2” consultation is released.
Further information is available on the DECC website.

Page | 68
Table 25 – Feed-in-tariff revenues
Technology Scale Tariff p/kWh to April Tariff from October
Anaerobic digestion
<250kW 14.0 14.7
>250kW - <500kW 13.0 13.7
>500kW 9.0 9.0
Hydro
<15kW 20.9 21.0
15kW -< 100kW 18.7 19.7
>100kW - <2MW 11.5 12.1
>2MW – 5MW 4.7 4.5
Wind
<1kW 36.2 21.0
>1.5kW - <15kW 28 21.0
>15kW - <100kW 25.3 21.0
>100kW - <500kW 19.7 17.5
>500kW - <1.5MW 9.9 9.5
>1.5MW - <5MW 4.7 4.5
Solar PV
To 3/3/12 To 31/3/12 (From July)
< 4kW (new building) 37.8 21.0 13.6 to 16.5
<4kW (retro-fit) 43.3 21.0 13.6 to 16.5
>4kW - <10kW 37.8 16.8 10.9 to 13.2
>10kW - <50kW 32.9 15.2 9.9 to 11.9
>50kW - <150kW 32.9 12.9 7.7 to 10.1
>150kW - <250kW 30.7 12.9 5.8 to 10.1
>250kW - <5MW 30.7 8.5 4.7 to 7.1
Stand-alone 30.7 8.5 4.7 to 7.1
Export tariff
3.1 TBC Export tariff
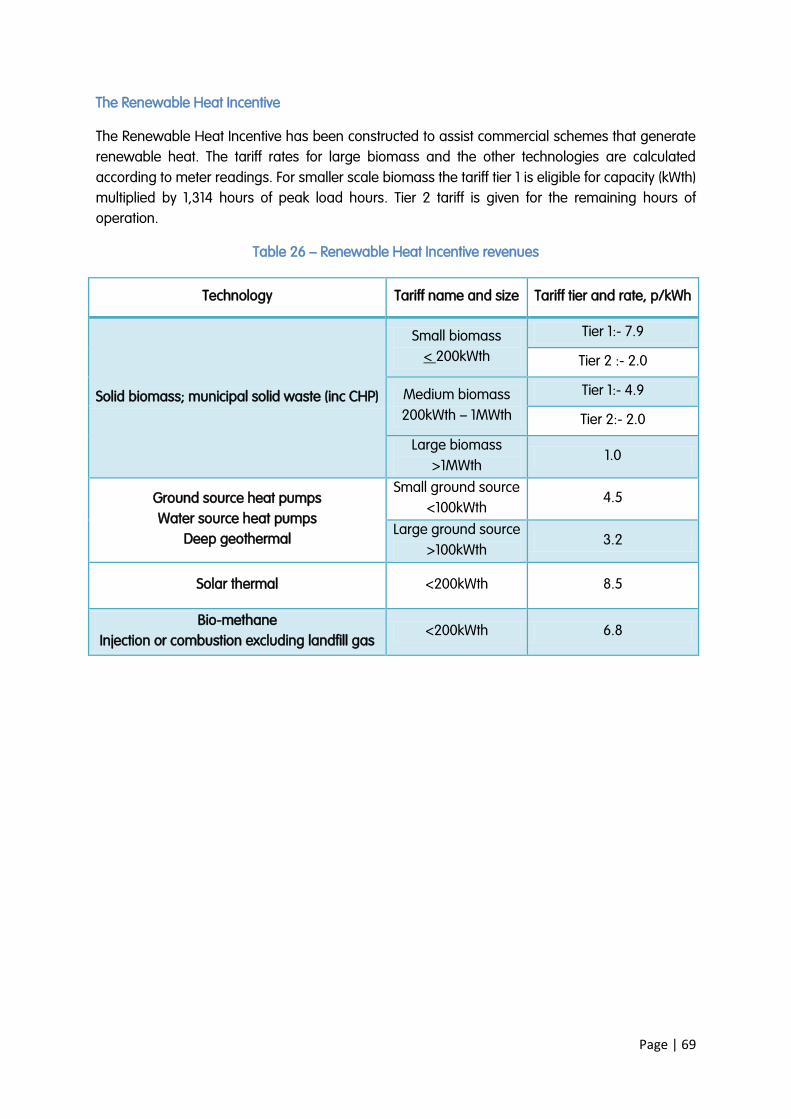
Page | 69
The Renewable Heat Incentive
The Renewable Heat Incentive has been constructed to assist commercial schemes that generate
renewable heat. The tariff rates for large biomass and the other technologies are calculated
according to meter readings. For smaller scale biomass the tariff tier 1 is eligible for capacity (kWth)
multiplied by 1,314 hours of peak load hours. Tier 2 tariff is given for the remaining hours of
operation.
Table 26 – Renewable Heat Incentive revenues
Technology Tariff name and size Tariff tier and rate, p/kWh
Solid biomass; municipal solid waste (inc CHP)
Small biomass
< 200kWth
Tier 1:- 7.9
Tier 2 :- 2.0
Medium biomass
200kWth – 1MWth
Tier 1:- 4.9
Tier 2:- 2.0
Large biomass
>1MWth 1.0
Ground source heat pumps
Water source heat pumps
Deep geothermal
Small ground source
<100kWth 4.5
Large ground source
>100kWth 3.2
Solar thermal <200kWth 8.5
Bio-methane
Injection or combustion excluding landfill gas <200kWth 6.8

Page | 70
A3 Solar thermal collectors
Flat plate collector
A flat plate collector usually has thin capillaries that allow the working fluid to absorb the sun’s
irradiation as it travels through the plate. The highly conductive absorber plate has a high
absorptivity and the plate usually has double or single glazing to reduce emissivity. The
advantage of this type of collector is that is durable over the long term and requires minimal
maintenance.
Evacuated tube collector
They usually consist of a row of tubes inserted with ‘heat pipes’. The heat pipe contains a suitable
liquid which absorbs the solar irradiation and transfers heat by vaporising, rising, exchanging the
heat to the working fluid that circulates along a header pipe at the top of the collector, thereby
condensing and falling to the cold end of the pipe. The heat losses are suppressed due to the
vacuum in the outer tube. The advantages of this type of collector are that if one tube is broken, it
can be easily replaced and they are less cumbersome to fit, as each tube can be connected in
singly, reducing the weight that needs to be lifted into position when working at height.
Stagnation
If the accumulator is not large enough to except the capacity of the solar thermal hot water
generated the ‘stagnation’ can occur. When the accumulator has reached its required
temperature, the pump stops and the circulating fluid within the solar thermal system become
static. The working fluid in the solar thermal collectors can then become superheated and cause
system damage or reduce the working life of the collector.

Page | 71