Embed Size (px)
Citation preview
Contract No. 4.1030/Z/01-119-2001
RENEWARenewable energy from waste through gasification or
incineration for heat, power or fuel production.A project on increased market-share through
stakeholder group networks.
FINAL REPORT
E
Nykomb Synergetics AB Daniel IngmanTomas Ekbom
Mikael Blomgren
December 2003
cotraffic ERD3 ABHenrik BodingPeter Ahlvik
Western Norway Research InstituteOtto Andersen


RENEWA
Ecotraffic ERD3 AB Contract No. 4.1030/Z/01-119-2001December 2003

RENEWA
Ecotraffic ERD3 AB Contract No. 4.1030/Z/01-119-2001December 2003

RENEWA
Ecotraffic ERD3 AB Contract No. 4.1030/Z/01-119-2001December 2003
TABLE OF CONTENTS Page
SUMMARY...........................................................................................................................I
SAMMANFATTNING (SUMMARY IN SWEDISH) ................................................XIII
1 INTRODUCTION ........................................................................................................ 1
1.1 Introduction and background .............................................................................. 1
1.2 Scope and work organisation ............................................................................... 1
1.3 Purpose ................................................................................................................... 3
1.4 Methodology........................................................................................................... 3
1.5 The reference group .............................................................................................. 51.5.1 Other helpful persons......................................................................................................5
2 ARGUMENTS FOR AND AGAINST INCINERATION AND GASIFICATIONOF WASTE ................................................................................................................... 7
2.1 Arguments for........................................................................................................ 7
2.2 Arguments against............................................................................................... 102.2.1 Types of incineration.....................................................................................................102.2.2 The problem...................................................................................................................112.2.3 Alternatives to incineration ..........................................................................................15
2.3 Conclusions .......................................................................................................... 17
3 THE PROBLEMATIC ISSUES WITHIN THERMAL CONVERSION OFWASTE........................................................................................................................ 19
3.1 Environmental aspects ........................................................................................ 193.1.1 Emissions........................................................................................................................193.1.2 Regulations.....................................................................................................................22
3.2 Plant specific aspects ........................................................................................... 253.2.1 Problems related to inorganic materials during thermal treatment of waste..........253.2.2 Slagging and fouling......................................................................................................253.2.3 Corrosion .......................................................................................................................263.2.4 Treatment of ash residue ..............................................................................................263.2.5 Emission monitoring methods......................................................................................273.2.6 Energy efficiency ...........................................................................................................27
3.3 Economy............................................................................................................... 28
3.4 Conclusions .......................................................................................................... 31
4 AUTOMOTIVE FUEL PRODUCTION THROUGH GASIFICATION ............. 33
4.1 Introduction ......................................................................................................... 33
4.2 Overview process description............................................................................. 33
4.3 Process configuration .......................................................................................... 374.3.1 Waste handling and preparation .................................................................................374.3.2 Thermochemical conversion.........................................................................................384.3.3 Gas conditioning and cleaning .....................................................................................43

RENEWA
Ecotraffic ERD3 AB Contract No. 4.1030/Z/01-119-2001December 2003
4.3.4 Fuel synthesis .................................................................................................................464.3.5 Auxiliary systems ..........................................................................................................484.3.6 Discussion.......................................................................................................................52
4.4 Outlook of the manufacturing process .............................................................. 55
4.5 Local requirements.............................................................................................. 564.5.1 Space requirements .......................................................................................................564.5.2 Personnel requirements ................................................................................................564.5.3 Logistics..........................................................................................................................564.5.4 Additional requirements...............................................................................................57
4.6 Mass and energy balances .................................................................................. 584.6.1 Assumptions for calculation .........................................................................................584.6.2 Results of the mass and energy balances by unit........................................................594.6.3 Yields and efficiencies ...................................................................................................634.6.4 Exergy analysis ..............................................................................................................644.6.5 Optimisation ..................................................................................................................66
4.7 Economics............................................................................................................. 674.7.1 Investment cost estimate...............................................................................................674.7.2 Operation cost estimate ................................................................................................694.7.3 Production cost sensitivity ............................................................................................724.7.4 Feasibility .......................................................................................................................754.7.5 Conclusions ....................................................................................................................76
5 QUESTIONNAIRE SURVEY ON BARRIERS...................................................... 77
5.1 Barriers connected to input material (waste): .................................................. 77
5.2 Barriers connected to the gasification/incineration process(plant conversion system): .................................................................................. 80
5.3 Barriers connected to the products (fuel, power, heat).................................... 83
5.4 Discussion............................................................................................................. 855.4.1 Barriers of low importance: .........................................................................................855.4.2 Barriers of medium importance: .................................................................................855.4.3 Barriers of high importance:........................................................................................855.4.4 Important barriers connected to various sub-systems: .............................................865.4.5 Important barriers of various types: ...........................................................................87
5.5 Conclusions .......................................................................................................... 88
6 MARKET OPPORTUNITIES AND PRODUCTION POTENTIAL ................... 90
6.1 Approach to analysis of market opportunities and productionpotentials .............................................................................................................. 91
6.2 Norway ................................................................................................................. 916.2.1 Waste amounts ..............................................................................................................916.2.2 Case 1: Heat production only.......................................................................................936.2.3 Case 2: Production of electricity plus heat..................................................................936.2.4 Case 3: Production of fuel plus heat ............................................................................94
6.3 Sweden.................................................................................................................. 946.3.1 Waste amounts ..............................................................................................................94
RENEWA
Ecotraffic ERD3 AB Contract No. 4.1030/Z/01-119-2001December 2003
6.3.2 Case 1: Heat production only.......................................................................................956.3.3 Case 2: Production of electricity plus heat..................................................................956.3.4 Case 3: Production of fuel plus heat ............................................................................95
6.4 Germany............................................................................................................... 956.4.1 Waste amounts ..............................................................................................................956.4.2 Case 1: Heat production only.......................................................................................956.4.3 Case 2: Production of electricity plus heat..................................................................966.4.4 Case 3: Production of fuel plus heat ............................................................................96
6.5 Europe .................................................................................................................. 966.5.1 Waste amounts ..............................................................................................................966.5.2 Case 1: Heat production only.......................................................................................996.5.3 Case 2: Production of electricity plus heat..................................................................996.5.4 Case 3: Production of fuel plus heat ..........................................................................100
6.6 Summary ............................................................................................................ 100
7 NETWORK............................................................................................................... 103
7.1 Interest groups and networks today ................................................................ 103
7.2 Aspects and actors ............................................................................................. 105
7.3 Interviews ........................................................................................................... 107
7.4 Conclusions ........................................................................................................ 112
8 AUTOMOTIVE FUELS FROM WASTE ............................................................. 115
8.1 Fuel properties................................................................................................... 1158.1.1 Potential fuel converters for methanol and DME ....................................................1178.1.2 Otto engine...................................................................................................................1188.1.3 Diesel engine ................................................................................................................1198.1.4 Fuel cells .......................................................................................................................1208.1.5 Fuel cell – internal reforming (DMFC) .....................................................................120
8.2 Handling, regulations and safety ..................................................................... 1208.2.1 Health and environmental impact from methanol...................................................1218.2.2 Fire and explosion danger ..........................................................................................122
8.3 Distribution ........................................................................................................ 1238.3.1 Release of methanol during distribution...................................................................1238.3.2 Material compatibility and cost issues ......................................................................124
9 LEGISLATION OVERVIEW ................................................................................ 127
9.1 EU ....................................................................................................................... 127
9.2 Sweden................................................................................................................ 127
9.3 Norway ............................................................................................................... 128
9.4 Germany............................................................................................................. 128
10 SUMMARY, BARRIERS ........................................................................................ 129
10.1 Economy............................................................................................................. 129
10.2 Technology barriers .......................................................................................... 130

RENEWA
Ecotraffic ERD3 AB Contract No. 4.1030/Z/01-119-2001December 2003
10.2.1 Technology barriers-Incineration..............................................................................13010.2.2 Technology barriers-Gasification/Fuel Production .................................................13110.2.3 How to overcome the technology barriers ................................................................133
10.3 Energy efficiency ............................................................................................... 133
10.4 Transport ........................................................................................................... 134
10.5 Environment ...................................................................................................... 134
10.6 Legislation .......................................................................................................... 13510.6.1 EU .................................................................................................................................13510.6.2 Sweden..........................................................................................................................13510.6.3 Norway .........................................................................................................................13510.6.4 Germany.......................................................................................................................136
11 CONCLUSIONS....................................................................................................... 137
12 DISSEMINATION ................................................................................................... 139
13 INFORMATION SOURCES AND REFERENCES............................................. 141
13.1 Printed sources .................................................................................................. 141
13.2 Internet sources ................................................................................................. 141
13.3 References .......................................................................................................... 142
IN SEPARATE VOLUME:
APPENDIX 1. AUTOMOTIVE FUELS FROM WASTE.
APPENDIX 2. SEMINAR REPORT.
APPENDIX 3. BIOMETHANOL PRODUCTION IN SCHWARZE PUMPE,GERMANY.
LIST OF TABLES PageTable 1. Comparison between the energy content and emission precursor content of
different MSW fractions.---------------------------------------------------------------- 20Table 2. Dioxin emissions to atmosphere in gram []. ----------------------------------------- 21Table 3. Air emission limit value (daily average).--------------------------------------------- 23Table 4. All average values over the sample period of a minimum of 30 minutes and
a maximum of 8 hours ------------------------------------------------------------------ 23Table 5. Emission limit values for discharges of waste water from the cleaning of
exhaust gases ---------------------------------------------------------------------------- 24Table 6. Data for some incineration plants.---------------------------------------------------- 29Table 7. Landfill tax rates and prices in some countries ------------------------------------- 30Table 8. Elementary composition of waste as received and pre-dried to 10%wt
respectively. Base case 400,000 tpa. Within parenthesis, the water freecomposition is given.-------------------------------------------------------------------- 38
Table 9. The gas composition entering the DME synthesis step. ---------------------------- 47

RENEWA
Ecotraffic ERD3 AB Contract No. 4.1030/Z/01-119-2001December 2003
Table 10. Manpower requirements for a complete waste-to-motor fuel plant, with anannual waste capacity of 400,000 tons. ---------------------------------------------- 56
Table 11. Average number of lorry transports, in case all transports are made bylorry 7 days a week. --------------------------------------------------------------------- 57
Table 12. Project assumptions during the study------------------------------------------------- 59Table 13. Plant overall mass and energy balances, divided on the individual process
units. -------------------------------------------------------------------------------------- 61Table 14. Mass and energy balances of the complete waste-to-motor fuel plant ----------- 63Table 15. Mass and exergy balances of the governing streams of the waste-to-motor
fuel plant (gas), compared to a conventional incineration plant (inc).----------- 65Table 16. Investment costs, broken down into functional parts for the complete
waste-to-motor fuel plant. Additional assumptions are stated below.------------ 68Table 17. Production cost divided into cost components, shown in MEUR. Left
column shows total plant cost and right column shows incremental costscompared to reference incineration plant-------------------------------------------- 70
Table 18. Important barriers connected to various sub-systems ------------------------------ 89Table 19. Waste statistics for Norway for the years 1998, 2000 and 2001 (1000 tons)---- 91Table 20. The composition of total household waste of 1.45 mill. tons in Norway
(2000) ------------------------------------------------------------------------------------- 92Table 21. Estimate of amounts of waste that could be used as raw material for
energy production ----------------------------------------------------------------------- 93Table 22. Total waste generated per year in Europe (1000 tonnes) ------------------------- 97Table 23. Municipal waste generated in Europe (1000 tonnes) ----------------------------- 97Table 24. Municipal waste in Europe recovered for energy production (mill. tonnes)---- 98Table 25. Municipal waste landfilled per yerar in Europe (1000 tonnes) ------------------ 98Table 26. Number of incineration plants and landfill sites in the European states--------- 99Table 27. Potential of not utilised energy from waste in Norway, Sweden, Germany
and Europe. Summary of results.-----------------------------------------------------101Table 28. Affecting aspects and important actors for energy recovery at the end of a
product's lifecycle. ---------------------------------------------------------------------106Table 29. Fuel properties -------------------------------------------------------------------------116Table 30. Voluntary limits for CO2 emissions in Europe--------------------------------------117Table 31. Exposure of methanol for a 70-kg person (source: Statoil, Methanex) ---------121Table 32. Distribution cost for alcohols (€c per litre petrol equivalent)--------------------125
LIST OF FIGURES PageFigure 1. Project scope----------------------------------------------------------------------------- 2Figure 2. Gas phase concentration of critical heavy metals as a function of
temperature [].-------------------------------------------------------------------------- 21Figure 3. Comparison between devolatilization properties of biomass, plastic,
paper and textile waste [].------------------------------------------------------------- 22Figure 4. Emission limits for waste co-firing processes.-------------------------------------- 25Figure 5. Condensation temperatures for Zn, Na and K salts [1]. -------------------------- 26Figure 6. Electrical efficiency for waste combustion plants. --------------------------------- 27Figure 7. Cost for disposal of the by-products ------------------------------------------------- 28

RENEWA
Ecotraffic ERD3 AB Contract No. 4.1030/Z/01-119-2001December 2003
Figure 8. The gate fee required at zero-profit condition with the assumptions of: El.revenue = 60 €/MWh and O & M cost = 50 €/tonne. Source TPS. -------------- 31
Figure 9. Process scheme, involving key features such as waste receiving, pyrolysis,gasification and gas cleaning and relevant material streams.-------------------- 35
Figure 10. The Noell entrained bed gasifier, designed for waste feedstock. ----------------- 41Figure 11. Sankey diagram showing the qualitative relative sizes of the in and output
energy streams to the waste-to-motor fuel plant. Arrows are not to scale;exact figures are shown in Table 15.------------------------------------------------- 64
Figure 12. Grassman diagrams, describing exergy flows, for waste gasification andwaste incineration respectively. The size of each stream is not to scale;figures are available in. Table 16. --------------------------------------------------- 66
Figure 13. Generic capital cost trend for early commercial units of new power planttechnology, based on technical assessment guide by EPRI. ---------------------- 69
Figure 14. DME production cost in EUR/litre and EUR/litre diesel equivalent, versusthe gate fee expressed in EURc/kWh waste fuel. ----------------------------------- 73
Figure 15. DME production cost in EUR/litre and EUR/litre diesel equivalent versusthe plant availability.------------------------------------------------------------------- 74
Figure 16. DME production cost in EUR/litre and EUR/litre diesel equivalent versusinvestment cost. ------------------------------------------------------------------------- 74
Figure 17. DME production cost in EUR/litre and EUR/litre diesel equivalent versusash content, expressed in mass-% (as received). ----------------------------------- 75

RENEWA
Ecotraffic ERD3 AB Contract No. 4.1030/Z/01-119-2001December 2003
i
SUMMARY
IntroductionCombustible wastes in the society are defined partly as such handled by the community,partly as such emerging from industries. In the first category the main part is householdwaste after recovery of paper, wrappings, glass, and metals and could be considered asmainly biofuel. The fossil part has in investigations been estimated to 15-20% dependingon the level of recovery. Other wastes emerge from erection and demolition of buildings,from parks and gardens and from industries, agriculture and forestry.
There are at present large quantities of household and industrial waste available for energyrecovery. Due to the legislation and taxes on landfilling in some countries, the fuel isavailable at a negative price.
The interest in biofuels has increased during the recent years and the reason for that are theinternational ambitions to reduce emissions of greenhouse gases. It is also a question ofsecurity of energy supply not only as Sweden and EU are highly dependent on importedfossil oil but also the fact that the amounts of fossil oils are limited. The fossil fuels willnot be completely exhausted but the costs will increase to a level comparable to productionof biofuels.
Scope and work organisation
Project scope
Household wasteIndustrial waste
WoodPlasticPaperCardboardOrganic wasteSludgeMetalGlass
Incineration
Landfill
Digestion
Gasification
Recycling
Combustion
Synthesisgas
Heat
Electric powerHeat
Electric power
Methanol
DMEHydrogen
The scope of the project is to identify and assess the most important barriers for usingbioenergy from waste through incineration or gasification. This will be carried out byinvestigating the possibilities for eliminating these barriers with the purpose of increasingthe market share for this form of renewable energy in the EU, with the focus on motorfuels. The work will be carried out in a network comprising stakeholders in the wholechain; from the collection of the waste to the energy production and end use in the

RENEWA
Ecotraffic ERD3 AB Contract No. 4.1030/Z/01-119-2001December 2003
ii
vehicles. The project has a primary focus on the conditions in Northern Europe, but theaim is also to compile and distribute knowledge within the whole of EU. The basis for thestudy is that an efficient utilisation of bioenergy from waste, using incineration orgasification, needs a pan-European view. This refers to the source of waste, thecomposition of waste, local and global energy demand as well as the co-operation with theinvolved stakeholders, such as governmental agencies, municipalities, suppliers of energyand the automotive industry.
The basic hypothesis in the project is that a network of stakeholders is necessary to reach aconsensus with the aim of increasing the utilisation of bioenergy from waste. Thestakeholder network is also important for a quick dissemination of the results of theproject.
Purpose• To gain knowledge about the most important barriers for an increased utilisation of
energy from biomass from waste through incineration or gasification.
• To gain knowledge about the barriers for the utilisation of bioenergy from waste asmotor fuels.
• To gain knowledge about the conditions to remove the barriers in order to increase themarket share for bioenergy from waste.
• Present a proposal for a future network with the purpose of achieving an increasedmarket share for bioenergy from waste.
MethodologyThe work in the project consisted mainly of 5 phases:
Phase 1: Survey of stakeholder groups
Phase 2: Survey and analysis of arguments against incineration and gasification of waste
Phase 3: Survey of barriers regarding technology, economy, legislation, environmentalimpact and transport logistics including a cost estimation for a plant producingmotor fuel from waste
Phase 4: Assessment of the market opportunities and production potential of energy fromwaste in Sweden, Norway, Germany and the EU
Phase 5: Proposal for the utilisation of a network in order to achieve an increased marketshare of bioenergy from waste
RENEWA
Ecotraffic ERD3 AB Contract No. 4.1030/Z/01-119-2001December 2003
iii
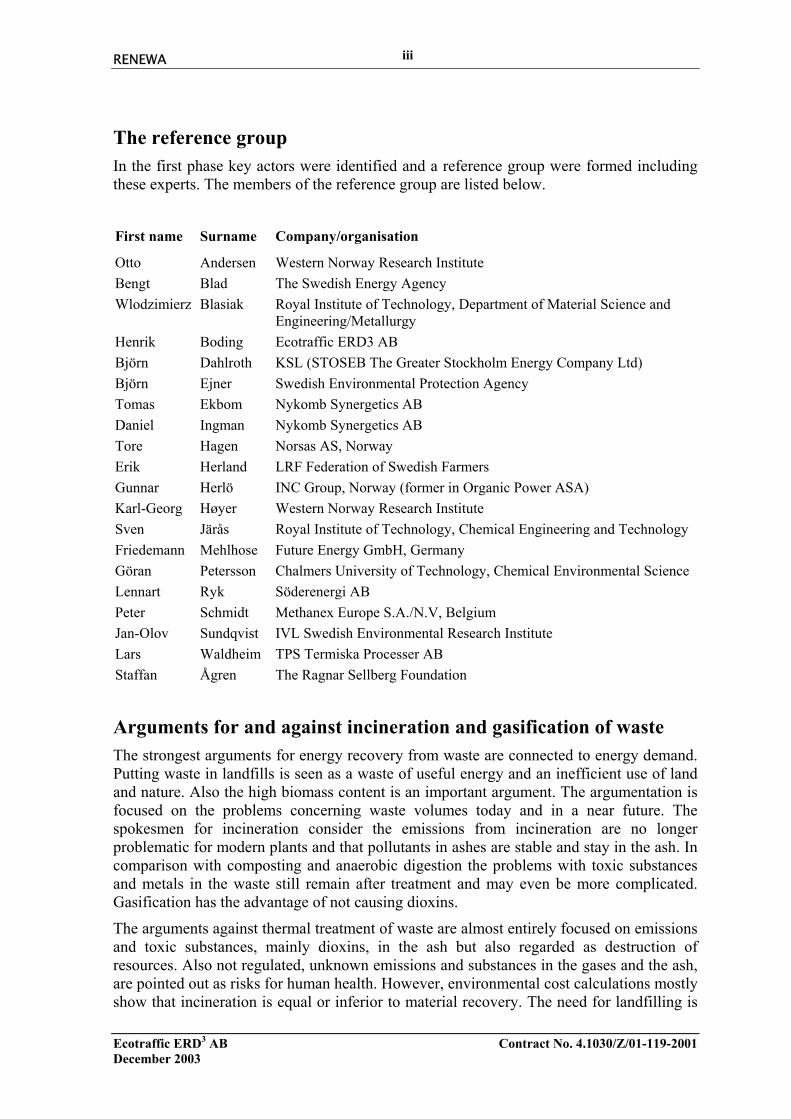
The reference groupIn the first phase key actors were identified and a reference group were formed includingthese experts. The members of the reference group are listed below.
First name Surname Company/organisation
Otto Andersen Western Norway Research InstituteBengt Blad The Swedish Energy AgencyWlodzimierz Blasiak Royal Institute of Technology, Department of Material Science and
Engineering/MetallurgyHenrik Boding Ecotraffic ERD3 ABBjörn Dahlroth KSL (STOSEB The Greater Stockholm Energy Company Ltd)Björn Ejner Swedish Environmental Protection AgencyTomas Ekbom Nykomb Synergetics ABDaniel Ingman Nykomb Synergetics ABTore Hagen Norsas AS, NorwayErik Herland LRF Federation of Swedish Farmers Gunnar Herlö INC Group, Norway (former in Organic Power ASA)Karl-Georg Høyer Western Norway Research InstituteSven Järås Royal Institute of Technology, Chemical Engineering and TechnologyFriedemann Mehlhose Future Energy GmbH, GermanyGöran Petersson Chalmers University of Technology, Chemical Environmental ScienceLennart Ryk Söderenergi AB Peter Schmidt Methanex Europe S.A./N.V, BelgiumJan-Olov Sundqvist IVL Swedish Environmental Research InstituteLars Waldheim TPS Termiska Processer ABStaffan Ågren The Ragnar Sellberg Foundation
Arguments for and against incineration and gasification of wasteThe strongest arguments for energy recovery from waste are connected to energy demand.Putting waste in landfills is seen as a waste of useful energy and an inefficient use of landand nature. Also the high biomass content is an important argument. The argumentation isfocused on the problems concerning waste volumes today and in a near future. Thespokesmen for incineration consider the emissions from incineration are no longerproblematic for modern plants and that pollutants in ashes are stable and stay in the ash. Incomparison with composting and anaerobic digestion the problems with toxic substancesand metals in the waste still remain after treatment and may even be more complicated.Gasification has the advantage of not causing dioxins.
The arguments against thermal treatment of waste are almost entirely focused on emissionsand toxic substances, mainly dioxins, in the ash but also regarded as destruction ofresources. Also not regulated, unknown emissions and substances in the gases and the ash,are pointed out as risks for human health. However, environmental cost calculations mostlyshow that incineration is equal or inferior to material recovery. The need for landfilling is

RENEWA
Ecotraffic ERD3 AB Contract No. 4.1030/Z/01-119-2001December 2003
iv
still considered as a problem since the increasing waste volumes require landfill facilitiesfor the ashes. The campaigns against incineration are addressed to people's emotions andfear of the unknown (which has a strong effect).
The opponents on incineration have a more long-term view with a change in wastehandling system promoting increased reuse and recycling. They refer to environmental costcalculations that show that material recovery often is superior, or at least not inferior, toenergy recovery. Another argument is the loss of energy used in manufacturing when aproduct is combusted
Consequently, both sides have good and important arguments. One opinion they have incommon is the need for reducing pollutants and toxic substances in society.
The problematic issues within thermal conversion of wasteThe concept "waste" refers to a large variety of materials with well distinguishabledifferences in their elemental composition, physical and chemical properties, ash andmoisture content and energy content. Wastes from industries are normally homogeneousmaterials having a well-defined composition. Municipal solid waste (MSW) on the otherhand consists of different fractions. The amount and properties of each fraction are usuallyhousehold- and site specific. Too high content of moisture and non-combustible materials,such as glass and metals in the waste makes it a less attractive material as an energy sourceand in extreme cases energy must be supplied for its destruction.
Emission control and flue gas cleaning systems are necessary equipment within wastecombustion for elimination of the risks of emitting environmental pollutants. There is aclear relationship between the amount of the pollutant released during combustion and thecontent of the pollutant precursors in the raw material. Because of variations in the qualityof the raw material and uncertainties upon the amount of pollutant precursors the capacityof the gas cleaning systems must be dimensioned in a manner for being able of handling amaximum possible emission, i.e. a worst case scenario. Generally the most problematicissues in thermal treatment of waste concerns two main categories:
a) Environmental aspects
b) Plant and process specific aspects
The environmental aspects include questions such as emission of hazardous compounds toair, water and in solid by-products. The plant specific questions are the low efficiencyrelative other fuels, high erosion and corrosion rates and problems related to the disposal ofby-products.
The major barriers within thermal treatment of waste are non-technical. More stringentdemands can technically be achievable to almost any level, penalised by a rapidlyincreasing treatment cost. However, alternative treatment procedures (composting,anaerobic digestion) entail the risk of even higher costs of treatment, as large masses ofresidues requiring post-treatment are generated. Incineration of these can become anecessary part of such Waste-to-Energy (WtE) installations.
A techno- economic barrier is presently the low efficiencies for power production due tosuperheater corrosion.

RENEWA
Ecotraffic ERD3 AB Contract No. 4.1030/Z/01-119-2001December 2003
v
Automotive fuel production through gasificationA principal specification and a cost estimation for a conceivable plant producing motorfuel from waste have been made. The gasification plant setup is focused on the waste pre-treatment and the gasifier technique, as well as the gas cleaning processes. These processesare identified as the most important, whereas processes as DME or methanol productionfrom synthesis gas can be regarded as well-proven technology and therefore given lowerpriority in the report.
It should be emphasised that the uncertainties in the results ultimately depends on the siteconditions and what agreements that may be contracted. If slag may be approved asbuilding material, to be used in roads for instance, this may constitute revenues instead ofthe cost shown. Furthermore, the process may be configured for additional powerproduction.
The total cost as well as the operating costs associated with the implementation of thiswaste-to-motor fuel plant could be handled differently. The main argument for using thisapproach is that when a municipality is discussing to erect an incineration plant, it is theincremental cost for choosing the gasification plant instead that is relevant. That is, thesame functions are delivered with the gasification plant as with the incineration plant; thetotal amount of waste to be deposited is reduced and heat could be produced. Above thesefeatures, automotive fuel is delivered. The cost per unit DME or methanol produced istherefore calculated with respect to the complete plant cost and the additional cost for thegasifier choice, as well.
Since the district heat production in this specific configuration is smaller than for theincineration alternative, there is a negative sign on the district heating revenue.
The estimated cost for a reference incineration plant handling 22 tonnes of waste per houris 110 million EUR. To compare this with the gasification plant, the cost is scaled relativeto the waste capacities resulting in a total investment cost of 180 million EUR. Theincremental capital cost for the gasification plant is the difference in capital costs betweenthe waste-to-motor fuel plant investment cost of 346 million EUR and the 180 millionEUR for the reference incineration plant.
The comparison to the incineration plant, as well as the absolute costs and revenuesassociated with the waste-to-motor fuel plant, is shown in the table below. It is noticed thatthe total incremental cost for building a gasification plant, instead of an incineration plant,exceeds the absolute cost. This is related to the large revenues from the waste, whichnaturally is the same for both the incineration and gasification alternatives, and therevenues from district heating sales that is less for the gasification alternative.
When comparing the revenues for the absolute and the incremental part, a price has beenput on the DME calculated from the current price on diesel fuel. The price on the DMEtherefore equals the diesel price in energy terms, which is taken as 0.76 EUR/litre dieselequivalent. The production cost marginally exceeds this diesel equivalent price.Considering the “worst case” scenario and most of the costs taken on their conservativeboundary, this small difference is not frightening. The sensitivity study shows the largeinfluence from a relatively small increase in tipping fee. A gradually increasing fuel pricefor conventional fossil fuels will decrease the difference further and make the waste-to-motor fuel concept indeed viable.
The production of automotive fuels via gasification of waste is a technically feasibleprocess, generating a DME yield of 31% on an energy basis. The single process layout

RENEWA
Ecotraffic ERD3 AB Contract No. 4.1030/Z/01-119-2001December 2003
vi
investigated, given a certain waste composition with high inert content, results in aproduction cost for DME of 0.82 EUR/litre diesel equivalent.
The waste-to-motor fuel plant fulfils, in principle, the same targets as the incinerationplant, to a higher cost. This is compensated by an additional, higher quality product stream.This also results in higher exergy efficiency for the gasification configuration than for theincineration alternative, calculated as 34 and 23% respectively. The gasification alternativehas lower energy efficiency than the incineration plant, but the flexibility is higher, as wellas the utilisation of waste as feedstock for an automotive fuel is exergetically favourable.
The results of this study show that production of automotive fuels from waste has potentialto be an environmentally and economically viable solution in the future. With a gate fee offully 50 EUR/ton the cost for the automotive fuel is on parity with the price of diesel oil.By further optimisation this can be improved to give margins to profit and fuel tax. Sincethe produced fuel is based mainly on biomass this part should be exempted from fossil fueltaxes.
Improvements would also be possible with a higher quality of the waste. A well specifiedwaste raw material with small variations in composition make a more effective plant
Production cost divided into cost components, shown in MEUR. Left column shows total plant cost andright column shows incremental costs compared to reference incineration plant
MEUR/y
(tot)
MEUR/y
(incr)
Revenues
Gate fee 17.5 0
DME 35.3 35.3
District heating 4.0 -17.5
Sulphur revenue 0.068 0.068
Total revenues: 56.9 17.9
Costs
Capital 32.7 17.0
Operation and maintenance 13.5 4.8
Electrical power consumption 6.9 5.5
Slag 7.0 0
Total costs: 60.1 27.3
Gross profit -3.2 -9.3
Daily DME production [tpd] 170.3 170.3
Production cost DME [EURc/kWh] 8.7 10
Production cost DME [EUR/tonne] 679 787
Production cost per diesel equivalent [EUR/l] 0.82 0.95

RENEWA
Ecotraffic ERD3 AB Contract No. 4.1030/Z/01-119-2001December 2003
vii
design possible with improved overall economy. Studies on automotive fuel production bygasification in a full scale demonstration plant using pure wood waste (forest residues), amuch better raw material than waste, gives a cost of 6.2 EURc/kWh compared to 8.7EURc/kWh in this study. This indicates the potential in possible cost reductions byincreased waste quality.
Questionnaire survey on barriersA survey of barriers for the utilisation of bioenergy from waste was carried out. Thesebarriers comprise of a variety of different areas, such as technology, economy, legislationand environmental impact. The Reference Group has had an essential role in theaccomplishment of this work. Questionnaires were sent to members of the reference groupand other important persons in the field of waste management.
The survey of barriers to incineration/gasification of waste revealed that, among thestakeholders in the project, there are many different views on the importance of the variousbarriers. This is reflected through the answers to the questions, where in total, almost allanswer alternatives were chosen by the respondents altogether. However, there were alsosome trends in the stakeholder groups, which could be seen by the ranging of the answers.
A wide range of issues presented for the Reference Group were considered as constitutingvery important barriers for the increased use of gasification/incineration of waste. Thesecovered all three sub-systems 1) input material, 2) gasification/ incineration process and 3)products. The important barriers are also of different kinds, either in the form of 1)environmental, 2) regulative/legislative, or 3) economical barriers.
It is thus possible to conclude that the barriers to incineration/gasification of waste are notlimited to one or a few key barriers. It is on the contrary a large set of barriers that must beovercome for increased utilisation of waste by incineration/gasification. Neither is itpossible to conclude that the most central barriers are connected to one single part of theoverall system for incineration/gasification of waste. There are important barriers presentin many areas, connected to the various sub-systems.
Barriers of high importance:
• Poor quality of input material (waste) is a barrier for making gasification economicallyfeasible.
• The requirement of very homogenous input material (waste) can be a limitation of thegasification technology.
• Gasification is a high-risk technology for investors due to its complicity, requiringlarge-scale production in order to be commercially feasible.
• The fact that the gasification technology is not well known, with just a fewdemonstration plants worldwide, in contrast to incineration technology that is wellknown, might constitute a barrier to gasification.
• The cost of products from gasification is too high for competitiveness with productsobtained by other routes.
• Increases in number of incineration plants might out-compete gasification regardingavailable waste material.

RENEWA
Ecotraffic ERD3 AB Contract No. 4.1030/Z/01-119-2001December 2003
viii
• The EU taxation act, which allows tax-exemption for pilot tests only, is an importantbarrier for increased use of biofuels.
• Electricity and heat from gasification can be produced cheaper by incineration.
• Waste incineration/gasification may be in conflict with goals of waste reduction,increased product reuse and material recycling.
• The necessary technology is not yet developed for use of biofuels from gasification.
• The EU definition of input material as waste, and not as resource, may implyrestrictions for incineration/gasification.
Market opportunities and production potentialThe analysis aims at determining the amount of waste that could be utilised as rawmaterial, and their potential for producing fuel, electricity and heat production in Norway,Sweden, Germany and Europe. Using the conversion rate ranges for the use of state-of-the-art technology, it is possible to estimate the production potentials for these forms ofrenewable energy from waste material. Three different cases for the utilisation of wasteenergy are applied:
Case 1: Heat production only
Case 2: Production of electricity plus heat
Case 3: Production of motor fuel plus heat
The summary of the result from the analysis of potentials for energy from waste inNorway, Sweden, Germany and Europe is shown in the table below.
Potential of not utilised energy from waste in Norway, Sweden, Germany and Europe.
Norway Sweden Germany Europe
Available waste (million tons) 0.5 2.1 19.5 117.3
MeOH production potential (million tons) 0.1 0.4 4.0 23.9
MeOH replacement potential (%) 1.7 3.3 3.6 4.5
Electricity production potential (TWh) 0.4 1.7 16.2 97.7
Electricity replacement potential (%) 0.4 1.3 2.9 3.9
Heat alone (TWh) 1.3 5.8 54.6 328.5
Heat in combination with electricity (TWh) 0.9 3.9 36.9 222.0
Heat in combination with fuel (TWh) 0.2 1.0 9.9 59.8

RENEWA
Ecotraffic ERD3 AB Contract No. 4.1030/Z/01-119-2001December 2003
ix
NetworkThe objective is to propose the utilisation of a network in order to achieve an increasedmarket share of bioenergy from waste in the future. The work has been carried out throughinterviews, questionnaires and workshop discussions.
There is one main reason why large amounts of waste are landfilled instead of beingenergy recycled. Landfilling is cheaper! That implies that alternative energy sources can beused to produce power and heat at a lower cost. There is also a strong public opinionagainst waste incineration in many countries due to its bad reputation concerningemissions. This may affect politicians and decision-makers to be more interested in othersolutions than incineration. Gasification is in this aspect a more unknown technologyhaving possibilities to get attention but it is not enough demonstrated and the highinvestment costs are a hindrance.
The demand for heat is less in the southern Europe than in the northern parts. That may beone reason why energy from waste in combination with district heating has been sosuccessful in Sweden. A demand for heat is an important condition for a good planteconomy even if power is produced. In general there are few waste-to-energy plants inEurope.
Participants in a network for increased use of energy from waste should represent wastemanagement, energy companies, municipalities, governments, politicians and the EU-administration. Even the manufacturing industry should be represented.
The main task for the network should be to clarify conditions and data as a source ofinformation and open discussions. Politicians and the public need more information.Politicians need tools and facts to be able to make correct decisions on waste and energyissues. Therefore trustworthiness and reliability should be fundamental. The networkshould work for exchange of reliable information and support and fund research andcooperation between the waste sector and energy sector. Gasification technology for solidbiofuels needs support for further development.
The network should also work for equal market conditions for energy from waste by thefollowing activities:
• Stimulate more commercialism and private enterprises.
• Stimulate internal trade within the EU
• Create stable political conditions
• Make it possible to utilise waste as mainly a biofuel
• Question the waste hierarchy
• Include power from waste in the system for Green certificates for electric power
• Introduce equal emission regulations for different energy plants
• Clearly define the difference between recycling and destruction
• Introduce landfill tax to direct waste quantities from landfills to recycling orincineration.

RENEWA
Ecotraffic ERD3 AB Contract No. 4.1030/Z/01-119-2001December 2003
x
Automotive fuels from wasteThe gasification technology enables production of fuels suitable for automotive purposes.Several studies on fuel production from gasification of biomass have pointed out methanol,DME (Dimethyl ether) and FTD (Fischer-Tropsch Diesel) as the most economically andenvironmentally best fuels in a well-to-wheel perspective. Even hydrogen can be producedbut is a much more expensive fuel.
DME is a ”natural” fuel for diesel engines due to the exceptionally high cetane number.Therefore, the same efficiency as for diesel fuel is possible for a diesel engine adapted forDME. DME is non-toxic and should have an inherent property of significantly reducing thetoxic emissions in the exhaust in comparison to conventional diesel fuel. A significantreduction of the NOX emissions for DME in comparison to diesel fuel has been found inseveral studies. Particulate formation is largely avoided with DME in comparison tohydrocarbon fuels. DME also provide the opportunity for using higher rate of EGR1, whichfurther reduce the NOX emissions compared to diesel fuel. Since DME is sulphur-free, theuse of effective aftertreatment devices in general is more easily facilitated with DME thanwith sulphur containing fuels.
A particular problem with DME as a motor fuel is the fuel injection system. DME attacksmost elastomers and therefore, proper seals have to be developed. This problem is alsoevident in the distribution system. Furthermore, DME has a very low lubricity and thus,one solution would be to develop proper additives to improve the lubricity. Althoughemission results also look very promising, much basic research is needed to utilise the fullpotential for emission reductions compared to diesel oil.
Alcohols, methanol and ethanol, have specific advantages in otto engines – these fuels aresimply “natural” otto engine fuels. First, the octane number is higher than for petrol, whichis advantage for an engine where the maximum compression ratio is limited (knocking) bythe octane level. Second, the alcohols have a higher latent heat of evaporation than petroland since the energy content is lower, a total evaporation of the alcohols would give aconsiderably lower temperature of the air-fuel mixture than petrol. A lower temperatureimplies a higher volumetric efficiency.
The greatest problem with alcohol fuels in otto engines today is the substantial increase inemissions when the engine is cold started at low ambient temperature. This problem shouldbe possible to solve in the future when new engine technology (e.g. direct injection) will beavailable.
Methanol and ethanol could be used in diesel engines. An external ignition source, such asa glow plug, is foreseen to avoid the use of an ignition improver in the fuel. The necessityof using an external ignition source for the alcohols is a significant disadvantage incomparison to other alternative fuels, such as DME and FTD.
Methanol has also been identified as a cost efficient hydrogen carrier and could potentiallybe considered as a fuel in next generation's fuel cell applications.
1 Exhaust Gas Recirculation

RENEWA
Ecotraffic ERD3 AB Contract No. 4.1030/Z/01-119-2001December 2003
xi
ConclusionsWaste recovery should be encouraged, primarily through sorting at source. Wastesegregation at an early stage simplifies recycling of products and materials as well as theuse of waste as raw material for motor fuel production. The latter is considerablysimplified if the waste composition is well known with small variations in constitution.Sorted waste fractions make high quality requirements possible by continuos mixing thefractions to a suitable raw material.
The main reason why waste with energy content still is put in landfills is economical. Aslong as landfilling is cheap there are no incentives for large investments in thermaltreatment plants. The situation is, however, not the same all over Europe. In Sweden forexample incineration in combination with district heating is well established.
The strongest arguments for energy from waste are connected to energy demand such asdemand for biobased energy and security of energy supply. Even the opposition to wasteincineration agrees on that energy utilising is better than landfilling but the concerns overpollutants formed by incineration is a stronger argument against. The opposition advocatesreuse and recycling. Since gasification is not well known by people in general it isregarded as incineration even though it has the benefit of not creating dioxins.Consequently, both sides have good and important arguments and they have one argumentin common; reduction of pollutants and toxic substances in society.
Incentives must be created in order to make recycling and energy recovery more attractivethan landfilling. Taxes are one way, regulations another. This study shows that both waysare necessary. There also has to be a demand for the products. The demand for heating isless in southern Europe than in the northern parts but electric power and automotive fuelsare required all over the world. The results of this study show that production ofautomotive fuels from waste has potential to be an environmentally and economicallyviable solution in the future. With a gate fee for waste of fully 50 EUR/ton the cost for theautomotive fuel is on parity with the price of diesel oil. The assumed gate fee is not veryhigh and in some countries waste fees of 100 EUR or more are common. By furtheroptimisation these results can be improved to give margins to profit and fuel tax. Since theproduced fuel is based mainly on biomass this part should be exempted from fossil fueltaxes.
The gasification technology for solid biofuels need to be further developed and the highinvestments required and the lack of demonstration plants are important barriers. Thegrowing interest for gasification of pure biomass, such as forest residues, for automotivefuel production could however lead the way for waste as well.
Changes in the waste regulations are required. For example, MSW is not accepted as abiofuel even though typically 80% of the content is biomass. This needs to be changed.
The major barriers within waste thermal treatment are non-technical. More stringentdemands can technically be achievable to almost any level of the penalty of rapidlyincreased cost of treatment. However, alternative treatment procedures (composting,biogas) entail the risk of even higher costs of treatment, as large masses of residuesrequiring post-treatment are generated. Incineration of these can become a necessary partof such WtE installations.

RENEWA
Ecotraffic ERD3 AB Contract No. 4.1030/Z/01-119-2001December 2003
xii
The not utilised energy in MSW and industrial manufacturing waste landfilled in Europe isestimated to have a potential to replace 4.5% of the diesel and petrol fuel in Europe. This isa large potential and could be increased in the long term if new waste-to-motor fuel plantsreplace old incineration plants.
Participants in a network for increased use of energy from waste should represent wastemanagement, energy companies, municipalities, governments, politicians and the EU-administration. Even the manufacturing industry should be represented as they are inFEAD. The main task for the network should be to clarify conditions and data as a sourceof information and open discussion. Politicians and the public need more information.Politicians need tools and facts to be able to make correct decisions on waste and energyissues. Therefore trustworthiness and reliability should be fundamental. The networkshould work for exchange of reliable information and support and fund research andcooperation between the waste sector and energy sector. Gasification technology for solidbiofuels needs support for further development
The network should also work for equal market conditions for energy from waste by thefollowing activities:
• Stimulate more commercialism and private enterprises.
• Stimulate internal trade of waste within the EU
• Create stable political conditions
• Make it possible to utilise waste as mainly a biofuel
• Question the application of the waste hierarchy
• Include power from waste in the system for Green certificates for electric power
• Introduce equal emission regulations for different energy plants
• Clearly define the difference between recycling and destruction
• Introduce landfill tax to direct waste quantities from landfills to recycling alternativesor incineration.

RENEWA
Ecotraffic ERD3 AB Contract No. 4.1030/Z/01-119-2001December 2003
xiii
Sammanfattning (Summary in Swedish)
IntroduktionBrännbart avfall i samhället är delvis sådant som är kommunens ansvar men också sådantsom härrör från industriell verksamhet. I den förra kategorin ingår hushållsavfall som efterutsortering av papper, förpackningar, glas och metall och kan anses utgöra ett biobränsle.Den fossila andelen har vid flera undersökningar visats vara 15-20% beroende på grad avkällsortering. Annat brännbart avfall utgörs exempelvis av bygg- och rivningsavfall, park-och trädgårdsavfall samt från industrier, jord- och skogsbruk.
Det finns för närvarande stora mängder brännbart avfall tillgängligt. Genom lagstiftningoch deponiskatter är avfallet tillgängligt till ett negativt pris i vissa länder.
Intresset för biodrivmedel har ökat starkt de senaste åren och ett skäl till detta är deninternationella ambitionen att minska utsläppen av växthusgaser. Det är också en fråga omatt trygga energiförsörjningen och inte enbart av det skälet att Sverige och EU är alltmerberoende av importerad fossil energi utan också att oljetillgångarna är begränsade. Oljankommer inte att ta slut helt men kostnaderna kommer att stiga till nivåer där biobaseradedrivmedel kan konkurrera prismässigt.
Omfattning och organisation
Project scope
Household wasteIndustrial waste
WoodPlasticPaperCardboardOrganic wasteSludgeMetalGlass
Incineration
Landfill
Digestion
Gasification
Recycling
Combustion
Synthesisgas
Heat
Electric powerHeat
Electric power
Methanol
DMEHydrogen
Projektet omfattar identifiering och fastställning av de viktigaste hindren för utnyttjandetav bioenergin i avfall genom förbränning eller förgasning. Möjligheterna att elimineradessa hinder kommer att undersökas i syfte att öka marknadsandelen för förnybar energiinom EU med ett särskilt focus på drivmedel. Arbetet kommer att genomföras inätverksform som omfattar intressenter i hela kedjan från avfallsinsamling viaenergiproduktion till slutanvändning i fordon. Projektet är vidare inriktat på förhållandena inorra Europa men målsättningen är att också att sprida kunskap inom hela EU.Utgångspunkten är att ett effektivt utnyttjande av bioenergin i avfall genom förbränning

RENEWA
Ecotraffic ERD3 AB Contract No. 4.1030/Z/01-119-2001December 2003
xiv
eller förgasning kräver ett EU-perspektiv. Inverkar gör faktorer som; avfallets ursprungoch sammansättning, lokalt och globalt energibehov så väl som samarbete med intressentersom tex myndigheter, kommuner, energibolag och fordonsindustrin.
Den grundläggande hypotesen i projektet är att ett nätverk av intressenter är nödvändigt föratt nå samsyn i målsättningen att öka användningen av bioenergin i avfall. Nätverket ärockså viktigt för att snabbt sprida projektresultaten.
Syfte• Att skaffa kunskap om de viktigaste hindren för ett ökat utnyttjande av energi från
biomassa från avfall, genom förbränning eller förgasning.
• Att skaffa kunskap om de hinder för att utnyttjande av bioenergin i avfall somdrivmedel.
• Att skaffa kunskap om förutsättningarna för att undanröja hinder i syfte att ökamarknadsandelen för bioenergi från avfall.
• Ge förslag till utformningen av ett framtida nätverk med syfte att erhålla ökadmarknadsandel för bioenergi från avfall.
Metodik Det huvudsakliga arbetet är uppdelat på 5 faser:
Fas 1: Genomgång av intressentgrupper
Fas 2: Genomgång och analys av argument för och emot förbränning och förgasning avavfall.
Fas 3: Genomgång av hinder avseende teknik, ekonomi, lagstiftning, miljöpåverkanoch transportlogistik inklusive en uppskattning av kostnader för en anläggningför produktion av drivmedel ur avfall.
Fas 4: Bedömning av marknadsmöjligheter och potentialen för energi ur avfall iSverige, Norge, Tyskland och EU.
Fas 5: Lämna förslag på utformningen av ett nätverk för att öka marknadsandelen förbioenergi från avfall.
ReferensgruppenI den första fasen identifierades nyckelpersoner och en referensgrupp inehållande dessaexperter bildades. Medlemmarna i gruppen framgår av nedanstående lista.
Förnamn Eftrenamn Företag/organisation
Otto Andersen Vestlandsforsking, NorgeBengt Blad EnergimyndighetenWlodzimierz Blasiak KTH, Institutionen för Materialvetenskap/MetallurgiHenrik Boding Ecotraffic ERD3 AB

RENEWA
Ecotraffic ERD3 AB Contract No. 4.1030/Z/01-119-2001December 2003
xv
Björn Dahlroth KSL (tidigare STOSEB Stor-Stockholms Energi AB)Björn Ejner NaturvårdsverketTomas Ekbom Nykomb Synergetics ABDaniel Ingman Nykomb Synergetics ABTore Hagen Norsas AS, NorgeErik Herland LRF Lantbrukarnas RiksförbundGunnar Herlö INC Gruppen, Norge (tidigare i Organic Power ASA)Karl-Georg Høyer Vestlandsforsking, NorgeSven Järås KTH, Institutionen för KemiteknikFriedemann Mehlhose Future Energy GmbH, TysklandGöran Petersson Chalmers tekniska högskola, Kemisk miljövetenskapLennart Ryk Söderenergi ABPeter Schmidt Methanex Europe S.A./N.V, BelgienJan-Olov Sundqvist IVL Svenska MiljöinstitutetLars Waldheim TPS Termiska Processer ABStaffan Ågren Ragnar Sellbergs stiftelse
Argument för och emot förbränning och förgasning av avfall.De starkaste argumenten för energi ur avfall är kopplade till energibehovet. Att deponeraavfall ses som ett slöseri med energi och ett ineffektivt utnyttjande av mark och natur. Denhöga andelen av biomassa i avfallet är ett viktigt argument. Argumentationen utgår ifrånproblemen med dagens och framtidens avfallsmängder. Förespråkarna för förbränninganser att emissioner från förbränning inte är ett problem i dagens anläggningar och attfarliga ämnen i askan är stabila och är låsta i askan. Som jämförelse nämns att problemenmed farliga ämnen och metaller i avfallet även är ett problem vid kompostering ochrötning. Kanske till och med ett större problem. Förgasning har fördelen att dioxiner intebildas.
Argumenten mot termisk behandling av avfall är nästan uteslutande fokuserade motemissioner och farliga ämnen, huvudsakligen dioxiner, i askan. Även oregleradeemissioner och ämnen i rökgaserna och i askan pekas ut som hälsorisker. Behovet avdeponering anses utgöra ett problem även vid förbränning på grund av de ständigt ökandeavfallsmängderna eftersom askan och slaggen måste deponeras. Antiförbränningskampanjer tar alltid fasta på mänskliga känslor och rädslan för det okända.Energifrågan finns med i motargumenten men då som en förlust av den energi som går åtdå en vara produceras.
Motståndarna har en mer långsiktig, visionär, syn innefattande ett förändrat system föravfallshantering som gynnar ökad återanvändning och återvinning.
Således har både förespråkarna och motståndarna bra och viktiga argument och en åsiktsom de har gemensamt är; behovet av minskade föroreningar och farliga ämnen isamhället.

RENEWA
Ecotraffic ERD3 AB Contract No. 4.1030/Z/01-119-2001December 2003
xvi
Svårigheter med termisk energiutvinning ur avfallDefinitionen av avfall innefattar en vid flora av material med var för sig väl definieradeskillnader i sammansättning, fysiska och kemiska egenskaper, askinnehåll, fukthalt ochenergiinnehåll. Industriavfall omfattar vanligen homogena material med väl definieradsammansättning. Hushållsavfall däremot är sammansatt av olika fraktioner. Mängden avvarje fraktion och sammansättningen varierar mellan olika hushåll och områden. Högafukthalter och obrännbara material, som t.ex. glas och metaller, gör avfallet mindreattraktivt för energiutvinning och i extrema fall måste energi tillföras för att avfallet skakunna destrueras. Kontinuerlig emissionsövervakning och rökgasreningssystem ärnödvändiga för att eliminera riskerna för utsläpp av föroreningar. Det finns ett tydligtsamband mellan mängden föroreningar i rökgaserna och mängden föroreningar, och ämnensom kan bilda föroreningar, i det ingående avfallet. Eftersom mängden föroreningar efterförbränning varierar måste rökgasreningssystemen dimensioneras för att klara det högstamöjliga halterna av föroreningar. Generellt kan problemområdena för termiskavfallsbehandling delas in i två kategorier:
a) Miljöpåverkan
b) Anläggnings- och processpecifika problem
Miljöpåverkan omfattar t.ex. emissioner av farliga ämnen till luft, vatten och fastarestprodukter. De anläggnings- och processpecifika problemområdena är; låg energi-effektivitet i förhållande till andra bränslen, förslitning och korrosion samt problem-ställningar kring deponering av restprodukter.
Problemen för termiska behandling av avfall är icke-tekniska. Högre krav på rening t.ex.klaras rent tekniskt men till snabbt stigande kostnader. I jämförelse med andrabehandlingsmetoder (kompostering, rötning) är risken för ännu högre kostnader förefterbehandling av stora mängder förorenade restprodukter som kan behöva att förbrännasi efterhand.
Ett tekniskt/ekonomiskt problem är låg verkningsgrad för elproduktion pga korrosions-problem i överhettaren.
Produktion av drivmedel genom förgasningEn principiell anläggning för produktion av DME har skisserats i syfte att göra enkostnadsuppskattning för drivmedel från avfall. Arbetet har fokuserats på förbehandling avavfallet, förgasningsteknik och gasrening. Dessa processteg har bedömts vara de viktigasteatt studera då DME- och metanolproduktion från syntesgas redan är väl utprovad teknik.
Det bör betonas att det finns en osäkerhet i resultaten och att dessa påverkas av en var enanläggning lokaliseras och vilka avtal som kan tecknas. Om slaggen t.ex. kan användassom byggnadsmaterial (vägar) så kan det medföra intäkter eller lägre kostnader.Anläggningen kan också kompletteras med produktion av elkraft.
De totala kostnaderna såväl som driftskostnaderna för en anläggning kan analyseras urolika synvinklar. Huvudskälet till detta är att när exempelvis en kommun avser att uppföraen förbränningsanläggning är det skillnaden i kostnad för att uppföra enförgasningsanläggning som är intressant. Det innebär för jämförelsen i detta fall attförbrännings- respektive förgasningsanläggningen har samma kapacitet för mängden avfallsom ska tas emot och att värme produceras. Utöver detta produceras i förgasningsfallet

RENEWA
Ecotraffic ERD3 AB Contract No. 4.1030/Z/01-119-2001December 2003
xvii
även drivmedel. Kostnadsberäkningarna avser därför den totala kostnaden föranläggningen och dels merkostnaden för en förgasningsanläggning.
Eftersom värmeproduktionen blir lägre i drivmedelsfallet måste detta kompenseras vilketinnebär en extra kostnad för förgasningsanläggningen.
Kostnaden för en motsvarande förbränningsanläggning har beräknats utgående från enbefintlig anläggning för behandling av 22 ton avfall per timme. Kostnaden för denna haruppgetts till 110 miljoner EUR. Denna kostnad har skalats upp med en exponent på 0.6,motsvarande samma kapacitet som förgasningsanläggningen, till 180 miljoner EUR.
Kostnaderna och intäkterna för de två fallen redovisas i tabellen nedan. Det framgår att dentotala merkostnaden för förgasningsanläggningen jämfört med förbränningsanläggningenöverskrider totalkostnaden. Detta beror på de stora intäkterna från dels avfallet och delsvärmeförsäljningen. De sistnämnda är dock lägre för förgasningsanläggningen.
I jämförelsen mellan intäkterna i det absoluta fallet och merkostnadsfallet har priset påDME beräknats utifrån en aktuell prisnivå på dieselolja och antagits till 0.76 EUR/literdieselekvivalent. Som framgår av tabellen är produktionskostnaden något högre ändrivmedelspriset. Denna merkostnad är dock inte avskräckande hög om man beaktar attberäkningarna utgår från "pessimistiska" värden. Känslighetsanalysen visar vilken storinverkan intäkterna från avfallet har. Ett successivt ökande oljepris kommer också attminska denna merkostnad.
Drivmedelsproduktion ur avfall via förgasning är en genomförbar process med ettdrivmedelsutbyte på 31% på energibas. Denna studie, utgående från ett relativt sett dåligtråmaterial och utan några gjorda optimeringar, ger en DME-kostnad på 0.82 EUR/literdieselekvivalent. Både investeringskostnaderna och personalkostnaderna är högre iförgasningsalternativet vilket innebär att förgasningsalternativet lever upp till samma målsom förbränningsalternativet men till en högre kostnad. Detta kompenseras av att DME ären mer högkvalitativ produkt. Det resulterar också i en högre exergi effektivitet iförgasningsfallet på 34% jämfört me 23% i förbränningsfallet. Energieffektiviteten är docklägre i förgasningsalternativet men flexibiliteten är större såväl som attdrivmedelsproduktion ur avfall är att föredra ur exergisynpunkt.
RENEWA
Ecotraffic ERD3 AB Contract No. 4.1030/Z/01-119-2001December 2003
xviii
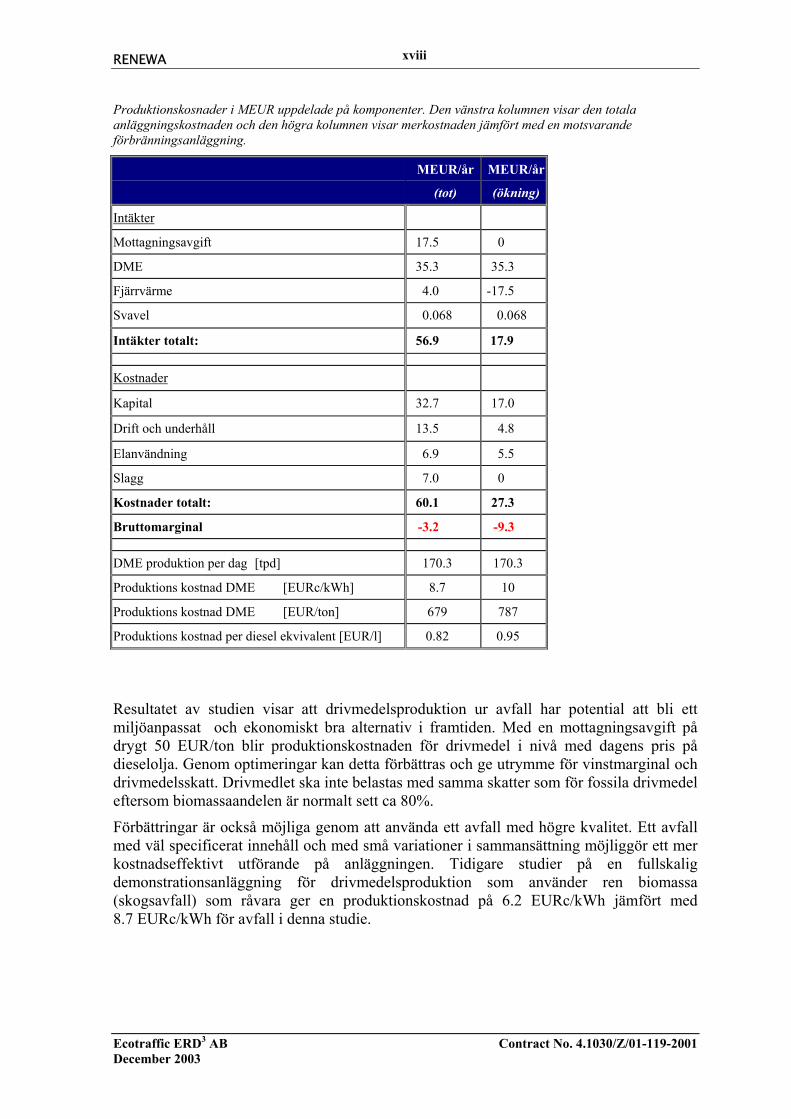
Resultatet av studien visar att drivmedelsproduktion ur avfall har potential att bli ettmiljöanpassat och ekonomiskt bra alternativ i framtiden. Med en mottagningsavgift pådrygt 50 EUR/ton blir produktionskostnaden för drivmedel i nivå med dagens pris pådieselolja. Genom optimeringar kan detta förbättras och ge utrymme för vinstmarginal ochdrivmedelsskatt. Drivmedlet ska inte belastas med samma skatter som för fossila drivmedeleftersom biomassaandelen är normalt sett ca 80%.
Förbättringar är också möjliga genom att använda ett avfall med högre kvalitet. Ett avfallmed väl specificerat innehåll och med små variationer i sammansättning möjliggör ett merkostnadseffektivt utförande på anläggningen. Tidigare studier på en fullskaligdemonstrationsanläggning för drivmedelsproduktion som använder ren biomassa(skogsavfall) som råvara ger en produktionskostnad på 6.2 EURc/kWh jämfört med8.7 EURc/kWh för avfall i denna studie.
Produktionskosnader i MEUR uppdelade på komponenter. Den vänstra kolumnen visar den totalaanläggningskostnaden och den högra kolumnen visar merkostnaden jämfört med en motsvarandeförbränningsanläggning.
MEUR/år
(tot)
MEUR/år
(ökning)
Intäkter
Mottagningsavgift 17.5 0
DME 35.3 35.3
Fjärrvärme 4.0 -17.5
Svavel 0.068 0.068
Intäkter totalt: 56.9 17.9
Kostnader
Kapital 32.7 17.0
Drift och underhåll 13.5 4.8
Elanvändning 6.9 5.5
Slagg 7.0 0
Kostnader totalt: 60.1 27.3
Bruttomarginal -3.2 -9.3
DME produktion per dag [tpd] 170.3 170.3
Produktions kostnad DME [EURc/kWh] 8.7 10
Produktions kostnad DME [EUR/ton] 679 787
Produktions kostnad per diesel ekvivalent [EUR/l] 0.82 0.95

RENEWA
Ecotraffic ERD3 AB Contract No. 4.1030/Z/01-119-2001December 2003
xix
EnkätundersökningSom en del i att kartlägga hinder för utnyttjande av bioenergi i avfall har enenkätundersökning genomförts. Dessa hinder omfattar ett flertal olika områden som t.ex.teknik, ekonomi, regelverk och miljöpåverkan. Referensgruppen har haft en aktiv roll idetta arbete. Enkäter har skickats till referensgruppen och ytterligare några nyckelpersoner.
Enkätundersökningen visar att uppfattningen vad som är viktiga hinder varierar kraftigtinom svarsgruppen. Detta återspeglar sig genom att nästan samtliga svarsalternativ iundersökningen har valts någon gång. Det gick dock att utläsa vissa trender bland svarenvilket visar sig när svaren rangordnas efter hur många personer som valt ett visst svar.
En stor mängd svar ansågs av gruppen utgöra viktiga hinder för ökat energiutnyttjande avavfall. Dessa hinder omfattar alla tre delsystemen 1) råmaterial, 2) förgasning/förbränningoch 3) produkter. Dessa väsentliga hinder är också av olika karaktär; 1) miljö, 2)regelverk/lagstiftning och 3) ekonomi.
Man kan dra slutsatsen att hinder för förbränning/förgasning inte utgörs av några enstakahinder. Det är tvärtom ett stort antal hinder som måste övervinnas för ökadenergiutvinning. Det är däremot inte möjligt att dra några slutsatser om att de viktigastehindren är kopplade till någon särskild del av förbrännings/förgasningssystemdelen.Viktiga hinder finns inom många områden i de olika delsystemen.
Viktiga hinder:
• Låg kvalitet på råvaran (avfallet) utgör ett ekonomiskt hinder för förgasning.
• Kravet på en homogen råvara kan utgöra en begränsning för förgasningstekniken.
• Förgasning är investeringsmässigt en hög-risk teknik på grund av dess komplexitet sominnebär att endast storskalig produktion kan motiveras ekonomiskt.
• Det faktum att förgasningstekniken inte är väl etablerad, med endast ett fåtaldemonstrationsanläggningar världen över, jämfört med förbränning, kan utgöra etthinder.
• Kostnader för produkter framställda genom förgasning är inte konkurrenskraftigajämfört med andra produktionssätt.
• Det ökande antalet förbränningsanläggningar kan komma att konkurrera ut förgasningmed hänsyn till tillgängligt avfall.
• EU:s drivmedelsbeskattning, som endast tillåter skatteundantag för tillfälligapilotprojekt är ett hinder för ökad användning av biodrivmedel.
• Elkraft och värme kan produceras billigare genom förbränning än genom förgasning
• Förbränning/förgasning av avfall kan motverka mål för avfallsminimering, ökadåteranvändning och materialåtervinning.
• Fordonstekniken för användning av biodrivmedel för förgasning är inte fullt utvecklade(metanol-korrosivt och kallstartsproblem, bränslecellsfordon- långt tillkommersialisering)
• EU:s definition på råmaterialet som ett avfall och inte som en resurs kan utgöra enbegränsning för förbränning/förgasning

RENEWA
Ecotraffic ERD3 AB Contract No. 4.1030/Z/01-119-2001December 2003
xx
Marknad och produktionspotentialMålsättningen har varit att fastställa mängden avfall som inte utnyttjas samt potentialen förproduktion av drivmedel, elkraft och värme i Norge, Sverige, Tyskland och Europa.Utgående från prestanda hos moderna anläggningar har är det möjligt att uppskattaproduktionspotentialerna för dessa förnybara energiformer. Tre olika fall har beräknats:
Fall 1: Enbart värmeproduktion
Fall 2: Produktion av elkraft och värme
Fall 3: Produktion av drivmedel och värme
En sammanställning av potentialerna visas i tabellen nedan.
Potentialen för outnyttjad energy i avfall i Norge, Sverige, Tyskland och Europa.
Norge Sverige Tyskland Europa
Tillgängligt avfall (miljoner ton) 0.5 2.1 19.5 117.3
MeOH produktionspotential (miljoner ton) 0.1 0.4 4.0 23.9
MeOH ersättningspotential (%) 1.7 3.3 3.6 4.5
Elkraft produktionspotential (TWh) 0.4 1.7 16.2 97.7
Elkraft ersättningspotential (%) 0.4 1.3 2.9 3.9
Enbart värme (TWh) 1.3 5.8 54.6 328.5
Värme i kombination med elkraft (TWh) 0.9 3.9 36.9 222.0
Värme i kombination med drivmedel (TWh) 0.2 1.0 9.9 59.8
NätverkSyftet är att föreslå utnyttjandet av ett nätverk för att uppnå en ökad marknadsandel förbioenergi från avfall i framtiden. Arbetet har utförts genom intervjuer, frågeformulär ochdiskussioner i seminarier (Workshops).
Det finns en huvudsaklig orsak till varför stora kvantiteter av avfall deponeras påavfallsdeponier i stället för att återvinnas. Avfallsdeponier är billigare! Detta medför att dealternativa energikällorna kan användas för att producera el och värme till en lägrekostnad. Det finns också en kraftig opinion mot förbränning av avfall och i många länderberor detta dåliga rykte på emissionerna. Detta kan påverka politikerna och beslutsfattarnatill att bli mer intresserade i andra lösningar än förbränning. Förgasning är i detta avseendeen mer okänd teknik som har möjligheter att erhålla ökad uppmärksamhet men den har inteblivit tillräckligt demonstrerad och de höga investeringskostnaderna är ett hinder.
Behovet av värme är mindre i södra Europa än in de nordliga delarna. Detta kan vara enorsak till varför energi från avfall i kombination med fjärrvärme har varit så framgångsrik i
RENEWA
Ecotraffic ERD3 AB Contract No. 4.1030/Z/01-119-2001December 2003
xxi
Sverige. Ett behov av värme är en viktig förutsättning för en god ekonomi i anläggningenäven om el produceras. I allmänhet finns det få anläggningar som producerar energi frånavfall i Europa.
Deltagare i ett nätverk för en ökad användning av energi från avfall bör representeraavfallshantering, energileverantörer, kommuner, administration på nationell nivå, politikeroch EU-administrationen. Även tillverkande industri bör vara representerad.
Huvuduppgiften för nätverket borde vara att tydliggöra förutsättningar och fakta som enkälla till information och för öppna diskussioner. Politikerna och allmänheten behöver merinformation. Politikerna behöver verktyg och fakta för att kunna fatta rätt beslut i frågorsom gäller avfall och energi. Därför är trovärdighet och tillförlitlighet fundamentalabegrepp. Nätverket skall arbeta för ett utbyte av tillförlitlig information och stöd och skallfinansiera forskning och samarbete mellan avfalls- och energisektorerna.Förgasningstekniken för fasta biobränslen behöver stöd för fortsatt utveckling.
Nätverket skall också arbeta för rättvisa marknadsförutsättningarna för energi från avfallgenom följande kriterier:
• Stimulera affärsmässighet och privata företag
• Stimulera intern handel inom EU
• Skapa stabila politiska förutsättningar
• Skapa möjligheter att utnyttja avfall främst till biodrivmedel
• Ifrågasätta hierarkin inom avfallshanteringen
• Inkludera el från avfall i systemet för Gröna certifikat för elkraft
• Introducera likvärdiga emissionskrav för olika energiproduktionsanläggningar
• Klart och tydligt definiera skillnaden mellan återvinning och destruering
• Introducera skatter för deponering för att omdirigera avfall från deponier tillåtervinningsbara alternativ, t.ex. förbränning.
Drivmedel från avfallFörgasningstekniken möjliggör produktion av drivmedel som är användbara till fordon.Flera studier av drivmedelsproduktion från förgasad biomassa har pekat ut metanol, DME(dimetyleter) och FTD (Fischer-Tropsch diesel) som de mest ekonomiska och miljömässigtbästa drivmedlen i ett livscykelperspektiv (well-to-wheel). Även vätgas kan produceras pådetta sätt men det är ett mer kostsamt drivmedel.
DME är ett ”naturligt” drivmedel för dieselmotorer på grund av det exceptionellt högacetantalet. Därför är samma effektivitet som för dieselolja möjlig för en dieselmotor somanpassats för drift med DME. DME är icke-toxisk och bör ha en inneboende möjlighet attsignifikant minska de toxiska emissionerna i avgaserna i jämförelse med konventionelladieselbränslen. En signifikant reduktion av NOX emissionerna för DME i jämförelse meddieselolja har konstaterats i ett flertal studier. Partikelbildningen kan i stort sett undvikasmed DME i jämförelse med kolvätebränslen. DME kan också medföra en möjlighet attanvända högre halter av EGR2, vilket ytterligare minskar NOX emissionerna jämfört med 2 Exhaust Gas Recirculation
RENEWA
Ecotraffic ERD3 AB Contract No. 4.1030/Z/01-119-2001December 2003
xxii
dieselolja. Eftersom DME är svavelfritt blir användningen av effektivaefterbehandlingssystem enklare med DME än med drivmedel som innehåller svavel.
Ett speciellt problem med DME som drivmedel är bränsleinsprutningssystemet. DMEangriper de flesta elastomerer och därför måste fungerande tätningar utvecklas. Dettaproblem är också uppenbart i distributionssystemet. Dessutom har DME en mycket dåligsmörjförmåga och därför kunde en möjlighet vara att utveckla fungerade additiv för attförbättra smörjförmågan. Även om emissionsresultaten ser mycket lovande ut är mergrundläggande forskning nödvändig för att utnyttja den fulla potentialen tillemissionsreduktioner jämfört med dieselolja.
Alkoholer, som metanol och etanol, har specifika fördelar i ottomotorer − dessa drivmedelär helt enkelt ”naturliga” ottomotorbränslen. För det första är oktantalet högre än förbensin, vilket är en fördel för en motortyp där det maximala kompressionsförhållandet ärbegränsat (knackning) av oktantalet. För det andra har alkoholerna ett högreförångningsvärme än bensin och eftersom energiinnehållet är lägre skulle en totalförångning av alkoholerna ge en väsentligt lägre temperatur för bränsle-luft blandningen änbensin. En lägre temperatur medför en högre volymetrisk verkningsgrad.
Det största problemet med alkoholbränslen i ottomotorer i dag är den påtagliga ökningenav emissionerna när motorn kallstartas vid låg omgivningstemperatur. Detta problem börvara möjligt att lösa i framtiden när ny motorteknik (t.ex. direktinsprutning) blir tillgänglig.
Metanol och etanol kan användas i dieselmotorer. En extern tändkälla, som t.ex. ettglödstift, förutsätts för att undvika användningen av en tändförbättrare i bränslet.Nödvändigheten att använda en extern tändkälla för alkoholerna är en påtaglig nackdel ijämförelse med andra alternativ som DME och FTD.
Metanol har också visat sig vara en kostnadseffektiv vätebärare med goda förutsättningaratt bli ett bränsle i kommande generationers bränslecellsapplikationer.
SlutsatserÅtervinning av avfall genom källsortering bör stimuleras. Sortering av avfall i ett tidigtskede underlättar såväl återanvändning, materialåtervinning och energiutvinning ochdrivmedelsframställning. Det senare underlättas väsentligt om avfallet är väl specificeratmed små variationer i sammansättning. Sorterade avfallsfraktioner möjliggör att högtställda kvalitetskrav kan realiseras genom att fraktioner kan blandas till önskade kvaliteter.
Skälen till att stora mängder avfall fortfarande deponeras är ekonomiska. Så längedeponering är billigt i relativ bemärkelse finns inte anledning till stora investeringar itermiska behandlingsanläggningar för avfall. Situationen är dock inte lika i hela Europa. ISverige till exempel, är förbränning i kombination med fjärrvärme väl etablerat.
De viktigaste argumenten för energiutvinning ur avfall är kopplat till dels behovet avenergi och bioenergi och dels till tryggad energiförsörjning. Även motståndare tillavfallsförbränning anser det bättre att utnyttja energin i avfallet än att deponera det menoron över föroreningar som bildas vid förbränning sprids, är ett starkare argument mot.Motståndarna förespråkar återanvändning och återvinning. Förgasning som teknik är intelika allmänt känt som förbränning vilket gör att förgasning, trots att t.ex inte dioxinerbildas, uppfattas som och likställs med förbränning. Sammanfattningsvis har bådeförespråkare och motståndare till termisk energiutvinning ur avfall både bra och viktiga

RENEWA
Ecotraffic ERD3 AB Contract No. 4.1030/Z/01-119-2001December 2003
xxiii
argument och en sak har de gemensamt. Behovet av minskad spridning av föroreningar ochfarliga ämnen i samhället.
Incitament måste till för att energiåtervinning ska bli mer attraktivt än deponering. Skatterär ett sätt, regler och bestämmelser ett annat. Denna studie visar att båda är nödvändiga.Det måste också finnas en marknad för produkterna. Behovet av värme är mindre i södraEuropa än i de norra delarna men elkraft och drivmedel efterfrågas världen över.
Resultatet av denna studie visar att drivmedelsproduktion ur avfall har potential att bli ettmiljöanpassat och ekonomiskt bra alternativ i framtiden. Med en mottagningsavgift pådrygt 50 EUR/ton blir produktionskostnaden för drivmedel i nivå med dagens pris pådieselolja. Genom optimeringar kan detta förbättras och ge utrymme för vinstmarginal ochdrivmedelsskatt. Drivmedlet ska inte belastas med samma skatter som för fossila drivmedeleftersom biomassaandelen är normalt sett ca 80%.
Förgasningstekniken behöver utvecklas vidare och de höga investeringsnivåerna ochbristen på demonstrationsanläggningar är utgör viktiga hinder för förgasningsteknikensutveckling. Det ökande intresset för förgasning av ren biomassa, t.ex. skogsavfall, fördrivmedelsproduktion kan dock leda väg för även avfall som råmaterial.
Förändringar i regelverken för avfall efterfrågas. Hushållsavfall består t.ex. av ca 80%biomassa men räknas ändå i vissa avseenden som biobränsle. Detta måste ändras.
Problemen för termiska behandling av avfall är icke-tekniska. Högre krav på rening t.ex.klaras rent tekniskt men till snabbt stigande kostnader. I jämförelse med andrabehandlingsmetoder (kompostering, rötning) är risken för ännu högre kostnader förefterbehandling av stora mängder förorenade restprodukter som kan behöva att förbrännasi efterhand.
Den outnyttjade energipotentialen i hushållsavfall och industriavfall som deponeras iEuropa beräknas ha en energipotential att ersätta 4.5% av nuvarande användning av bensinoch diesel. Detta är en stor potential som kan utökas ytterligare om äldreförbränningsanläggningar ersätts med moderna drivmedelsanläggningar.
Deltagare i ett nätverk för ökad energiutvinning ur avfall bör bestå av representanter frånavfallsbolag, energibolag, kommuner, myndigheter, politiska partier och EU-administrationen. Tillverkningsindustrin bör också finnas med såsom de är idag i FEAD.Nätverkets huvuduppgift bör vara att klarlägga förutsättningar och fakta sominformationsunderlag. Politiker och allmänhet behöver mer information. Politiker behöverockså verktyg för och fakta för att kunna fatta riktiga beslut kring avfall och energifrågor.
Trovärdighet och pålitlighet ska vara fundamentalt för arbetet i nätverket. Nätverket skaarbeta för utbyte av tillförlitlig information och stödja forskning och samarbete avfalls- ochenergisektorn. Förgasningstekniken för avfall behöver stöd för fortsatt utveckling.
Nätverket ska också verka för att avfallsenergi ska få likvärdiga marknadsvillkor genomföljande aktiviteter:
• Stimulera kommersialism och privat företagande
• Stimulera intern handel med avfall inom EU
• Skapa stabila politiska förutsättningar
• Göra det möjligt att utnyttja avfall som biobränsle
• Ifrågasätta tillämpningen av EU:s avfallshierarki

RENEWA
Ecotraffic ERD3 AB Contract No. 4.1030/Z/01-119-2001December 2003
xxiv
• Inkludera elkraft från avfall i systemet för Gröna certifikat
• Införa lika emissionskrav på olika typer av energianläggningar
• Klargöra skillnaderna i definition mellan återvinning och destruering
• Införa deponiskatt för att styra över avfall från deponering till återvinning t.ex genomförbränning

RENEWA
Ecotraffic ERD3 AB Contract No. 4.1030/Z/01-119-2001December 2003
1
1 INTRODUCTION
1.1 Introduction and backgroundCombustible wastes in the society are defined partly as such handled by the community,partly as such emerging from industries. In the first category the main part is householdwaste after recovery of paper, wrappings, glass, and metals and is considered as biofuel.The fossil part has in investigations been estimated to 15-20% depending on level ofrecovery. Other wastes emerge from erection and demolition of buildings, from parks andgardens and from industries, agriculture and forestry.
There are at present large quantities of household and industrial waste available. Due to thelegislation and taxes on waste dumps, the fuel is available at a negative price. Taking thewhole EU in consideration there are even more available in energy terms due to the notincinerated waste on one hand and the energy surplus of the incinerated waste on the otherhand.
The interest in biofuels has increased the recent years and the reason for that are theinternational ambitions to reduce emissions of greenhouse gases. It is also a question ofsecurity of energy supply not only as Sweden and EU are highly dependent on importedfossil oil but also the fact that the amounts of fossil oils are limited. The fossil fuels willnot be completely exhausted but the costs will increase to a level comparable to productionof biofuels.
The Swedish National Energy Administration has calculated the potential of energy inwaste in Sweden to 16 TWh. Today, 5.2 TWh is utilised in incineration with the mainpurpose of heat generation. As a comparison, the total energy use in the transportationsector is some 108 TWh. It is assumed that the potential from waste for the whole of EUwould amount to 5-10% of the energy use in the transportation sector.
To increase the energy use further, the Swedish National Energy Administration haddedicated about 1.1 million Euro for research in the in the programme -Energy from waste-which is in progress year 2000-2003.
From year 2002 it is prohibited in Sweden to put sorted combustible waste in landfills butduring 2002 exemptions from this legislation were made. The deposition of organic wasteis prohibited from 2005 as a consequence of the EU landfill directive.
The present waste incinerating capacity is not enough to meet the demand and taken intoconsideration the plans for building new incineration plants, this will be the situation formany years. Because of the time lag in building a plant the immediate waste problems willfind other solutions in the mean time, possibly in the form of other investments or longterm contracts.
1.2 Scope and work organisationThe scope of the project is to identify and assess the most important barriers for usingbioenergy from waste through incineration or gasification. This will be carried out byinvestigating the possibilities for eliminating these barriers with the purpose of increasingthe market share for this form of renewable energy in the EU, with the focus on motor

RENEWA
Ecotraffic ERD3 AB Contract No. 4.1030/Z/01-119-2001December 2003
2
fuels. The work will be carried out in a network comprising stakeholders in the wholechain; from the collection of the waste to the energy production and end use in thevehicles.
Project scope
Household wasteIndustrial waste
WoodPlasticPaperCardboardOrganic wasteSludgeMetalGlass
Incineration
Landfill
Digestion
Gasification
Recycling
Combustion
Synthesisgas
Heat
Electric powerHeat
Electric power
Methanol
DMEHydrogen
Figure 1. Project scope
The project comprises analytical studies of the barriers for:
different types of waste suitable for recovery of bioenergy;
methods of energy conversion from different types of waste;
energy forms for various production processes and
energy production for the use as motor fuel in vehicles.
The work in the project comprises various activities, e.g. legislation, economy, socio-economic effects, environmental impact, health effects, energy efficiency, life cycleassessment, transportation, logistics, storage and security.
The project has a primary focus on the conditions in Northern Europe, but the aim is alsoto compile and distribute knowledge within the whole of EU. In the project, representativesfrom Germany, Sweden and Norway participate but the basis for the study is that anefficient utilisation of bioenergy from waste, using incineration or gasification, needs apan-European view. This refers to the source of waste, the composition of waste, local andglobal energy demand as well as the co-operation with the involved stakeholders, such asGovernmental Agencies, municipalities, suppliers of energy and the automotive industry.
The basic hypothesis in the project is that a network of stakeholders is necessary to reach aconsensus with the aim of increasing the utilisation of bioenergy from waste. Thestakeholder network is also important for a quick dissemination of the results of theproject.

RENEWA
Ecotraffic ERD3 AB Contract No. 4.1030/Z/01-119-2001December 2003
3
1.3 PurposeThe project has several purposes:
To gain knowledge about the most important barriers for an increased utilisation ofenergy from biomass from waste through incineration or gasification.A widespread understanding of the different ways of extracting renewable energy fromwaste through incineration or gasification using different types of waste would help toincrease the use of the unused potential of renewable feedstock. In a short term, it will alsohelp solving the increasing problems according to landfills and waste treatment. Anincreased utilisation of bioenergy from waste will contribute to the reduction of climatechange. Especially, issues concerning pollutants from incineration plants are one of themain barriers in waste treatment and this impact could be significantly reduced with abetter quality of the waste.
To gain knowledge about the barriers for the utilisation of bioenergy from waste asmotor fuels.In the future, the anticipated use of fuel cells as drivelines in road vehicles, will increasethe interest in fuels particularly suited for these vehicles, such as methanol, DME andhydrogen. These fuels could be produced from biomass using gasification processes.
To gain knowledge about the conditions to remove the barriers in order to increasethe market share for bioenergy from waste.The consensus in how renewable energy from waste should be utilised, which is one of themain goals in this project, is necessary to increase the market share of bioenergy.
Present a proposal for a future network with special focus on participants, function,and areas of work with the purpose of achieving an increased market share forbioenergy from waste.
The understanding of the complexity of the whole waste handling and treatment chainamong all stakeholder groups will reduce the take-off time for utilising the unusedpotential of biomass in waste.
1.4 Methodology
Phase 1: Survey of stakeholder groups The objective of this phase is to identify the key actors, who will form aStakeholder/Reference Group and the experts who should represent these organisations.
The members of the group are listed in section 1.5.
Phase 2: Survey and analysis of arguments against incineration and gasification ofwaste
The objective of this phase is to carry out a survey of the arguments against incinerationand gasification of biomass from waste. This has been done through interviews of

RENEWA
Ecotraffic ERD3 AB Contract No. 4.1030/Z/01-119-2001December 2003
4
influential persons, environmental movements and authorities and members of theReference Group.
The outcome of the work is a comprehensive analysis of the opposition to utilising energyfrom waste.
Phase 3: Survey of barriers regarding technology, economy, legislation,environmental impact and transport logistics including a cost estimation fora plant producing motor fuel from waste
The objective of this phase is to carry out a survey of the barriers for the utilisation ofbiomass from waste. These barriers could comprise of a variety of different areas, such astechnology, economy, legislation, environmental impact and transport logistics. TheReference Group will also have an essential role in the accomplishment of this phase.
This phase also include a principal specification and a cost estimation for a conceivableplant producing motor fuel from waste. For this work a fuel specification has to be made.
The outcome of the work will be a comprehensive analysis of the barriers of utilisingenergy from waste.
Phase 4: Assessment of the market opportunities and production potential of energyfrom waste in Sweden, Norway, Germany and the EU
The objective of this phase is to assess the market opportunities and production potential ofenergy from biomass from waste in Sweden, Norway, Germany and the EU.
The outcome of the work will be an estimation of the potential on the national level for theparticipating countries and for the EU.
Phase 5: Proposal for the utilisation of a network in order to achieve an increasedmarket share of bioenergy from waste
The objective of this phase is to propose the utilisation of a network in order to achieve anincreased market share of bioenergy from waste in the future. The Reference Group willhave an important role in this phase.
The outcome of the work will be the identification of the said network and a proposal inwhich way this network should be used in the future to achieve the long-term objective ofthe EU to decrease the use of fossil energy and to increase the use of renewable energy.
Phase 6: Preparation of project reportsThe objectives of this phase are to ensure the quality of reports made in the projectaccording to both substance and time of delivery.
Phase 7: Dissemination of the project results The objective of this phase is to disseminate the outcome of the project according to thedissemination plan. The outcome of the work will be spread as much as possible toorganisations and companies representing the target groups.

RENEWA
Ecotraffic ERD3 AB Contract No. 4.1030/Z/01-119-2001December 2003
5
1.5 The reference group
First name Surname Company/organisation
Otto Andersen Western Norway Research InstituteBengt Blad The Swedish Energy AgencyWlodzimierz Blasiak Royal Institute of Technology, Department of Material Science and
Engineering/MetallurgyHenrik Boding Ecotraffic ERD3 ABBjörn Dahlroth KSL (STOSEB The Greater Stockholm Energy Company Ltd)Björn Ejner Swedish Environmental Protection AgencyTomas Ekbom Nykomb Synergetics ABDaniel Ingman Nykomb Synergetics ABTore Hagen Norsas AS, NorwayErik Herland LRF Federation of Swedish Farmers Gunnar Herlö INC Group, Norway (former in Organic Power ASA)Karl-Georg Høyer Western Norway Research InstituteSven Järås Royal Institute of Technology, Chemical Engineering and TechnologyFriedemann Mehlhose Future Energy GmbH, GermanyGöran Petersson Chalmers University of Technology, Chemical Environmental ScienceLennart Ryk Söderenergi AB Peter Schmidt Methanex Europe S.A./N.V, BelgiumJan-Olov Sundqvist IVL Swedish Environmental Research InstituteLars Waldheim TPS Termiska Processer ABStaffan Ågren The Ragnar Sellberg Foundation
1.5.1 Other helpful personsNorbert Bosman VVAV, NetherlandsKyra Dreher ITAD e.V., GermanyBill Duncan ASSUREReil Eberhardt Fernwärme Wien GmbH, AustriaÅsa Hagelin RVF - The Swedish Association of Waste ManagementNader Padban TPS Termiska Processer AB
Dieter Reimann Müllheizkraftwerk Bamberg, Germany
Håkan Rylander SYSAV - The Solid Waste Company of Southwest ScaniaWeine Wiqvist RVF - The Swedish Association of Waste Management

RENEWA
Ecotraffic ERD3 AB Contract No. 4.1030/Z/01-119-2001December 2003
6
RENEWA
Ecotraffic ERD3 AB Contract No. 4.1030/Z/01-119-2001December 2003
7
2 ARGUMENTS FOR AND AGAINST INCINERATIONAND GASIFICATION OF WASTE
This chapter gives an overview over arguments for and against incineration andgasification of waste. The arguments are taken from literature, websites, journals, seminarsetc. The arguments against incineration are well structured due to the fact that there is awell-organised campaign against waste incineration arranged by Greenpeace. There are nosuch similar pro-incineration organisations.
2.1 Arguments forSecurity of energy supplyThe energy use continues to grow inexorably and fossil fuels continue to dominate theglobal energy mix. World energy use will increase steadily through 2030 projected toincrease by 1.7% per year. The increase will be equal to two thirds of current demand.Fossil fuels will remain the primary sources of energy, meeting more than 90% of theincrease in demand. Global oil demand will rise by about 1.6% per year to 2030. Oilresources are ample, but more reserves will need to be identified in order to meet rising oildemand to 2030. Most of the projected increase in global oil demand in the next threedecades will be met by OPEC producers, particularly those in the Middle East. EU will beincreasingly dependent on external fossil energy especially in the transport sector. Fossiloil should of that reason be used as little as possible for heat and power production andreplaced by energy from waste.
There is a large not utilised energy potential in household and industrial waste.
The Swedish Energy Agency has calculated a not yet utilised energy potential in waste of10 TWh in Sweden. The produced energy from waste in 2001, amounts to some 8 TWh inthe form of heat and electricity. This means that only 45% of the energy in waste is utilisedin Sweden. This figure is assumed to be much lower for EU as a whole as the energyrecovery share is much lower.
Well-developed district heating systems give Sweden a unique situation compared withmany other countries in Europe. Some 95% of the heat generated is used for districtheating, covering roughly 10% of the total need in Sweden.
The need for heat in central and south Europe is less than in the northern parts but greenelectric power are in great demand and could be produced anywhere.
RDF (Refuse Derived Fuel) makes storage possible and the fuel can be used in lesscomplex plants than designed for waste.
Gasification in combination with gas cleaning can be used to radically improve theefficiency of generating electricity compared to incineration of wastes.
Combustible waste is a domestic resourceCombustible waste appears everywhere human activities are taken part. This is also thecase with human need for energy. Thus, fuel is available close to the consumer and no longtransports are necessary to utilise the energy in the waste.
RENEWA
Ecotraffic ERD3 AB Contract No. 4.1030/Z/01-119-2001December 2003
8
Incineration of household waste contributes only marginally to an increase in thegreenhouse effect as it mostly consists of renewable material – biofuel.
Meeting Kyoto objectives waste and recovered fuels can replace fossil fuels in heat andpower production. The biomass content in household varies among the European countriesand amounts to 50-90% by weight. A lot of plants originally built for coal as fuel has beenrebuilt to use recovered fuels instead.
The increasing waste volumes must be taken care of.
Waste volumes in the European Community are projected to continue to rise in theforeseeable future unless new initiatives are taken. Waste generation is still coupled toeconomic growth. The increasing waste volumes bring pressure on waste treatmentfacilities and make it difficult for countries to raise the recycling rate and reducelandfilling. Even with increasing shares of waste being reused or recycled there will still beconsiderable amounts only suitable for incineration or gasification with energy recovery.
The growing waste amount underlines the importance of building up additional treatmentcapacity for recycling, composting, incineration etc., if the waste landfilled quantities areto be stabilised or reduced.
There are no indications that waste generation will be stabilised in the near future. AnETC/W study published in September 1999 clearly indicates that the quantities ofmunicipal waste would continue to increase in the coming 10 years.
Incineration decreases landfill demand. Wastes that can be incinerated, material recycled, anaerobically digested or compostedshould not be landfilled. This is valid even if landfill gas is extracted and utilised, and theleachate is collected and treated. This is due to that the resources in the waste areinefficiently utilised when landfilled, making it necessary to produce materials, fuels andnutrients from virgin resources [10].
The Council directive 1999/31/EC on the landfill of waste stipulates great reductions ofbiodegradable municipal waste going to landfills. This can be achieved by increased wasteincineration with energy recovery.
Incineration is an established and well functioning method for waste treatment andenergy recovery.
The technology for waste incineration has been developed during over 100 years. Plantshave been more and more complex in order to meet more stringent environmental demand.Today’s incineration plants with combined heat and power production consists ofadvanced well functioning processes.
Modern waste management is an integrated system combining different methods oftreatment such as; recovery and recycling, thermal treatment, biological treatmentand landfilling.Incineration is one necessary part in an integrated waste management system. There willalways be amounts of waste where incineration offer the best treatment alternative.

RENEWA
Ecotraffic ERD3 AB Contract No. 4.1030/Z/01-119-2001December 2003
9
Good economyIncineration with energy recovery shows good economic outcome compared to othertreatment methods. Though waste is available at a negative price a large part of the wasteflow is still too expensive to be recycled.
Lower environmental impact than other treatment alternatives.In an LCA perspective, incineration is the best alternative concerning environmentalimpact. Societal studies on waste management considering different waste treatmentalternatives reveal incineration as a method with low total environmental impact.
Contamination present in the waste will also be present after composting oranaerobic digestion.
Contamination such as heavy metals and chemicals present in the waste will also bepresent after composting or anaerobic digestion. The residual product is therefore hard tofind applications for other than landfilling. Farmers do not accept compost and sludge asfertiliser for food production due to the risk of getting the soil contaminated.
Emission levels from waste incineration are lowStrict levels on emissions from waste incineration are regulated in an EU-directive.
The waste incinerated today is in different degrees pre-sorted in the meaning thathazardous waste, batteries, electronic waste etc are only present in the waste in low levels.
Modern flue gas cleaning systems consist of different steps each one removing even otherpollutants than designed for. This makes the system low emitting even if one step will stopfunction.
The problem of dioxin emissions attracted attention in the mid-1980s. Since then, theplants have cut dioxin emissions by 98%, which means that they now account for a smallershare of the total emission of dioxins into the air. In 2000 the plants together emitted 1.7grams of dioxin. A major RVF study conducted in 2001 has shown that dioxins generatedby incineration are above all bound closely to the residue, including ashes, that is depositedas hazardous waste. This therefore does not cause environmental damage.Since the mid-1980s there has also been a reduction by 90–99% of a number of otheremissions that impact the environment, such as hydrogen chloride, mercury, cadmium,lead, and dust. The EC directive regulates these emissions as well as the emission ofwastewater. All the plants where wastewater arises are already within the limits today.
Emissions from today’s waste incineration are thus very low, and the existing Swedishplants are already adjusted to many of the coming requirements. However, there will stillbe a need for supplementation of, for example, flue gas treatment in order to a furtherreduce of emissions to comply with all the limits in the directive.
An expansion in incineration capacity will not make the society dependent on wasteas a fuel.
Incineration plants can handle a wide range of different solid fuels. A lack of combustiblewaste due to future change in waste treatment can be solved by using other solid fuels.

RENEWA
Ecotraffic ERD3 AB Contract No. 4.1030/Z/01-119-2001December 2003
10
2.2 Arguments againstThis section is mainly based on information from Greenpeace.
Society continues to generate more waste and those who are against waste incinerationsees incineration as a part of the world’s waste problems, not a solution. Incinerators mayreduce the volume of solid waste, but they do not dispose of the toxic substances containedin the waste. They create a source of dioxins, which is one of the most toxic chemicalsknown to science. Incinerators emit a wide range of pollutants in their stack gases, ashesand other residues. The filters used to clean incinerator stack gases produce solid andliquid toxic wastes, which also need to be disposed. The way to improve the situation is toavoid toxic waste production by improving our products and processes. There is no roomfor the incineration of waste in a sustainable society
2.2.1 Types of incineration
Municipal incineratorsMunicipal waste incineration is still the first cause of dioxin pollution, according to a 1999UNEP study. Over the past few years, many countries have updated their old incineratorsor built new ones. In doing so, they have taken advantage of improved technologies for airpollution control. This has resulted in a substantial reduction in toxic emissions. Althoughthis is an improvement, toxic waste production is still a serious global issue. In fact, theproblem has now shifted, and more dioxins and other toxic substances are appearing in theashes, therefore creating new disposal and pollution problems. Studies conducted inEurope have reported that emission measurements from some European incinerators fallwithin the new proposed EU emissions levels, but others exceed this limit.
Industrial/hazardous waste incinerationOnly a few recent studies on emission testing of industrial incinerators are published inscientific literature. A study undertaken in Japan performed point measurements on nineindustrial waste incinerators. Dioxin emissions were below the new EC limit for two of theincinerators and above this level for the remaining six.
In the US, one study reported on dioxin emissions of mobile soil burning incinerators. On-site remediation of soils, contaminated by these incinerators, is employed where sitescontain compounds that are difficult to destroy. Data collected primarily from the trialburns of 16 incinerators, showed that 10 of the incinerators failed to meet the proposedEPA standard.
Medical waste - useful waste into hazardous wasteOnly 10% or less of a typical hospital’s waste stream is potentially infectious. It is possibleto sterilise this waste with heat, microwaves and other non-burn disinfecting technologies.The remaining waste is not infectious and often includes paper, plastic and food waste.This is similar to the waste coming from hotels, offices and restaurants, as hospitals serveall of these functions. Incineration of medical waste has become a formidable chemicalpollution problem, that is costly to manage and difficult to contain. Fortunately, there arealternative technologies available to ensure the appropriate sterilisation of medical waste.

RENEWA
Ecotraffic ERD3 AB Contract No. 4.1030/Z/01-119-2001December 2003
11
Waste to energy schemesThe generation of energy from waste has increased. It is now used extensively bygovernments and industry, to “green” incineration, thereby making it more acceptable tothe public. However, all the negative impacts of incineration also apply to “waste toenergy” facilities. Moreover, the energy used to produce the product is lost and only afraction of the intrinsic energy content of the materials can be recovered. Reuse andrecycling, even from an energy perspective, are the preferred options.
Refuse-derived fuel (RDF)Refuse-derived fuel (RDF) typically consists of pelletized or fluff waste that remains afterthe removal of non-combustible materials such as ferrous materials, glass, grit, and othernon combustible materials. The remaining material is then sold as RDF and used indedicated RDF boilers or co-incinerated with coal or oil in a multi-fuel boiler. However,the environmental concerns of incineration also apply to RDF combustion facilities.
Pyrolysis/thermal gasificationPyrolysis and thermal gasification are related technologies. Pyrolysis is the thermaldecomposition of organic material at elevated temperatures, in the absence of gases such asair or oxygen. The process, which requires heat, produces a mixture of combustible gases(primarily methane, complex hydrocarbons, hydrogen and carbon monoxide), liquids andsolid residues.
Thermal gasification of waste is different from pyrolysis in that the thermal decompositiontakes place in the presence of a limited amount of oxygen or air. The generated gas canthen be used in either boilers or cleaned up and used3 in combustion turbine generators.
Both of these technologies are at the development stage, with a limited number of units inoperation. Most of the environmental concerns for incineration also apply to pyrolysis andthermal gasification facilities.
Cement kilnsThroughout the world some 60 cement kilns have been modified so that various wastes canbe burned along with conventional fuels. However, cement kilns are designed to makecement and not to dispose of waste. A study by the US Centre for the Biology of NaturalSystems, found that emissions of dioxins are eight times higher from cement kilns thatburn hazardous waste than those that do not burn it.
2.2.2 The problem Burning was once considered the most effective method for disposing waste materials.However, since industrialisation the nature of waste has changed dramatically. Massproduction of chemicals and plastics means that burning or incinerating today’s waste is acomplex, costly and highly polluting method of disposal.
The myth that burning makes waste disappear has lead to incineration emerging as awidely used method for disposing many kinds of waste, including hazardous wastes. 3 The gas could be cleaned and upgraded to a synthesis gas for production of chemicals or automotive fuelse.g. methanol, DME, Fischer-Tropsch Diesel oil or hydrogen.

RENEWA
Ecotraffic ERD3 AB Contract No. 4.1030/Z/01-119-2001December 2003
12
Rather than making waste disappear, incinerators create more toxic waste that poses asignificant threat to public health and the environment.
Incineration is often touted as an alternative to land filling. However, what many people donot realise is that incinerator ashes are contaminated with heavy metals, unburnedchemicals and new chemicals formed during the burning process. These ashes are thenburied in landfill or dumped in the environment.
Incineration is a method where industry can break down its bulk waste and disperse it intothe environment through air, water and ash emissions. It is a convenient way for industryto mask today’s waste problems and pass them onto future generations.
Incineration impacts - emissionsExisting data shows that burning hazardous waste, even in “state-of-the-art” incinerators,will lead to the release of three types of dangerous pollutants into the environment:
1 Heavy metals;
2 Unburned toxic chemicals
3 New pollutants - entirely new chemicals formed during the incineration process.
Toxic MetalsMetals are not destroyed during incineration and are often released into the environment inmore concentrated and dangerous forms.
High temperature combustion releases toxic metals such as lead, cadmium, arsenic,mercury and chromium from waste products containing these substances, includingbatteries, paints and certain plastics. These metals are released as tiny gas particles, whichincrease the risk of inhalation and yet further amounts will be found in residual ashes andliquids. Pollution control equipment can remove some but not all heavy metals from stackgases. However, the metals do not disappear; they are merely transferred from the air intothe ash, which is then land filled.
Subsequently, metals in the ash may leach into and contaminate soils and potentiallygroundwater. Presently, ash from incinerators is sometimes used in construction materialsuch as asphalt and cement. This practice can also have implications for the environmentand for human health, as metals can leach out of these construction materials. Ash from amunicipal waste incinerator in Newcastle, UK, was used on local allotments and pathsbetween 1994 and 1999. Recently, it was removed, as was found to contain unacceptablyhigh levels of heavy metals and dioxins.
Unburned toxic chemicalsNo incineration process operates at 100% efficiency. Unburned chemicals are emitted inthe stack gases of all hazardous waste incinerators.
While incinerators are designed to burn wastes, they also produce more waste in the formof ash and effluent from wet scrubbers and/or cooling processes. Incinerator ash carriesmany of the pollutants that are emitted as stack gases. Studies have identified up to 43different semi-volatile, organic chemicals in incinerator ash, and at least 16 organic
RENEWA
Ecotraffic ERD3 AB Contract No. 4.1030/Z/01-119-2001December 2003
13
chemicals in scrubber water from hazardous waste incinerators. Ash is commonly buried inlandfill, while effluent is often treated before being discharged into rivers or lakes.
New pollutants - dioxins and furansOne of the most insidious aspects of incineration is the new and highly toxic chemicalsformed during combustion. Fragments of partially burned waste chemicals recombinewithin incinerator furnaces, smokestacks, and/or pollution control devices. Hundreds,possibly thousands, of new substances are created, and many of these substances are moretoxic than the original waste.
Very little research exists on the multitude of pollutants emitted from incinerators. Onestudy identified 250 volatile organic compounds, many of which are known to be highlytoxic or carcinogenic. It is likely that many other compounds are emitted duringincineration that are yet to be identified.
Among the possible compounds are dioxins and furans, often referred to as just dioxins.These are a class of chemical compounds widely recognised to contain many highly toxiccompounds including Dichlorodiphenyltrichloroethane (TCDD). TCDD has beendescribed as the most toxic chemical known to man. Dioxins are created when materialscontaining chlorine are burned. They have no useful purpose and are associated with awide range of health impacts including, cancer, altered sexual development, male andfemale reproductive problems, suppression of the immune system, diabetes, organ toxicityand a wide range of effects on hormones.
Fugitive emissions Some waste is accidentally released when:
Chemicals are removed from storage containers at the incinerator site;
It is moved to transportation vehicles;
It is shipped to and moved about within the incineration facility.
According to the US Environmental Protection Authority: “Fugitive emissions andaccidental spills may release as much, or even more toxic material into the environmentthan direct emissions from incomplete waste incineration.” There is also the risk ofcatastrophic waste releases in fires and explosions.
Incinerator ash is hazardous wasteLeftover incinerator ash is extremely toxic, containing concentrated amounts of lead,cadmium and other heavy metals. It can also contain dioxins and other toxic chemicals.Toxic ash disposal in an environmentally sound manner is problematic and expensive. Ifhandled improperly it poses short and long-term health and environmental dangers. Thebetter the pollution-trapping device in an incinerator smokestack, the greater the quantityand toxicity content of the residues. A hundred times more dioxin may leave anincineration facility via ash, than in air emissions. Some experts recommend burying thisash in a landfill equipped with a plastic liner to prevent leaching into groundwater.However, all landfill liners will eventually leak. However, ashes can be solidified (orglassified), substantially decreasing the risk of releasing metals and other toxicants to theenvironment.

RENEWA
Ecotraffic ERD3 AB Contract No. 4.1030/Z/01-119-2001December 2003
14
Impacts of incineration - health and environmentIncreased cancer rates, respiratory ailments, reproductive abnormalities and other healtheffects are noted among people living near some waste-burning facilities, according toscientific studies, surveys by community groups and local physicians. Cancer, birthdefects, reproductive dysfunction, neurological damage and other health effects are alsoknown to occur at very low exposures to many of the metals, organochlorines and otherpollutants released by waste-burning facilities.
Many pollutants released in incinerator air emissions have been shown to accumulate inand on food crops. This is most notable on crops where the edible portion is exposed suchas leafy vegetables. While thorough washing of produce may remove a portion ofpollutants on crop surfaces, a significant amount (typically from 15 to 50%) will remain.
Incineration - theory versus practiceIn theory, a properly designed incinerator should convert simple hydrocarbons into nothingother than carbon dioxide and water.
Practical experience, however, has shown that even the best combustion systems usuallyproduces Products of Incomplete Combustion (PICs), some of which highly toxic.
Even under the most stringent standards, incinerators emit chemicals that have escapedcombustion as well as newly-formed PICS. Newly formed products refer to the thousandsof different chemicals, which only a small fraction has been identified.
Different countries monitor and measure incinerator performance in various ways and todifferent degrees. Actual incinerator performance can deviate radically due to combustionupsets such as:
Equipment failure;
Human error;
Rapid changes in the type of waste fed to an incinerator.
Only a small fraction of the waste needs to experience a combustion upset for there to besignificant deviations from the targeted destruction efficiencies.
Pollution control devicesPollution control technologies for different pollutants are often incompatible. Scrubbersdesigned to filter out particulate and heavy metals will cool the exhaust gas to the idealrange for dioxin formation. This means that decreasing the emission of one pollutant oftenincreases the emissions of others and no pollution control device can eliminate dioxin orheavy metal emissions completely.
Incineration removes the incentive to recycle and reuseIncinerators with pollution control equipment are prohibitively expensive, and onceauthorities have invested in incineration they often do not have the money to invest inwaste reduction. In this way, incineration directly competes with efforts to reduce andrecycle waste.
Incineration actually perpetuates the use of landfills because of the large quantities ofleftover ash produced by incinerators. It is estimated that for every three tons of waste that

RENEWA
Ecotraffic ERD3 AB Contract No. 4.1030/Z/01-119-2001December 2003
15
is incinerated, one tonne of ash is generated. This ash might be very toxic, containingconcentrated amounts of heavy metals and dioxins which, when buried, will eventuallyleach into the soil, potentially polluting groundwater.
Recycling saves more energy than incineration yields. Incineration can only recover someof the calorific value contained in the waste. It cannot recover any of the energy invested inthe extraction, processing, fabrication and chemical synthesis involved in the manufacturematerials present in the waste stream. However, re-use and recycling can do this. In fact, acost-benefit study conducted for the European Commission in 1997 concluded that evenland filling was better and more energy efficient than incineration, for managing householdwaste.
2.2.3 Alternatives to incinerationMunicipal and hospital waste incinerators are the largest dioxin sources in industrialcountries. PVC plastic is probably the most significant source of dioxin generating chlorinein these incinerators. Incinerators that burn hazardous waste from industry are also pointsources of dioxin.
Strategies to prevent generating incinerable waste streams currently exist by:
Toxic use reduction planning within industries;
Waste reduction and alternative forms of sterilisation in hospitals; and
Efficient reduction, recycling and compost actions at community level for householdwaste.
Incinerators and cement kilns that burn hazardous waste will never solve toxic wasteproblems. A clean production approach, which substitutes safe materials and processes tostop the generation of hazardous waste in the first place, is needed.
Alternatives to municipal waste incineration Although PVC only accounts for approximately 0.5 percent of municipal waste by weight,PVC provides over 50 percent of available chlorine - the element essential to dioxinformation. According to the majority of incineration studies, when all other factors are heldconstant, there is a direct correlation between input of PVC and output of dioxin. For thisreason the Danish government policy is to avoid the presence of PVC in incinerators.
“Cleaner production is as much about attitudes, approaches and management as it is abouttechnology. This is why it is called cleaner production and not cleaner technology.”Cleaner Production in the Mediterranean Region, 1995.
If all the PVC and chlorinated wastes were eliminated from the waste stream, incinerationwould still be a poor solution due to high costs, loss of jobs in the recycling industry, lostprofits from secondary resale and on-going contamination from heavy metal, hydrocarbonand other air emissions.
Cost effective and eco-efficient waste management alternatives to incineration exist Glass, metals and paper can be easily recycled and reused. Organic waste fractions can becomposted at household or community level. Some plastics such as polyethylene and

RENEWA
Ecotraffic ERD3 AB Contract No. 4.1030/Z/01-119-2001December 2003
16
polypropylene can be efficiently recycled if collection and recycling systems are basedwithin the region.
Recycling is not the answer to waste reduction however. We need to reduce our use ofpackaging and products and advocate reusable, returnable packaging and better productdesign for durability and reparability.
Alternatives to medical waste incineration In medical waste incinerators, the dominant chlorine donor is PVC plastic, which entersthese facilities as packaging and in many disposal medical products. An estimated 9.4% ofall infectious waste is PVC, and virtually all available chlorine fed to medical wasteincinerators comes from PVC.
In reality there are dioxin-free means of disposing of 99.7% of the medical waste stream.Because medical waste incinerators are major point sources of dioxins some countries havebrought in more stringent regulations. This has resulted in many hospitals closing theirown on-site incinerator and shipping waste to a commercial incinerator with morepollution control devices.
However, this is increasingly seen as an inadequate solution. Increasingly hospitals inAustria, Germany and Denmark are reducing the amount and nature of wastes by switchingto reusables, which can be sterilised. Substitution of PVC products go with programmes toprevent waste and separate for recycling. Reasons for phasing out PVC in these hospitals:
municipal incineration plants either did not accept wastes where the chlorine contentexceeded the determined percentage, or would do so only at a considerably increasedprice;
incineration plants had to be closed due to more stringent emission regulations;
repeated complaints from the community.
Currently there are often increased costs for PVC alternatives (often 20-30% moreexpensive). However these costs must be balanced against the cost of ongoing incinerationfees and dioxin emissions.
Non PVC hospital products In general, 85% of the total medical waste stream in hospitals consists of the same mixtureof discarded paper, plastic, glass, metal and food waste that is found in ordinary householdwaste. The remaining 15 percent are defined as infectious and these wastes must besterilised before disposal.
A small percentage of this waste or 0.3 percent of the total medical waste stream, can onlybe incinerated, in part for cultural or aesthetic reasons, but also because it is difficult tosterilise in any other way. Thus there are dioxin-free means of disposing of 99.7 percent ofthe medical waste stream. Non hazardous waste can be recycled within a household waste-recycling plan.
For disposing of infectious waste there are several alternative dioxin-free methods that arecost comparative. Three of these are autoclaving, microwave disinfection and superheatedsteam sterilisation.

RENEWA
Ecotraffic ERD3 AB Contract No. 4.1030/Z/01-119-2001December 2003
17
Alternatives to hazardous waste incineration There are European researchers that estimate that 70 percent of all current waste andemissions from industrial processes can be prevented at source by using technically soundand economically profitable procedures.
No country should contemplate a commercial hazardous waste incinerator without anational programme of cleaner production. Policy measures to achieve this have been welldocumented by UN agencies and cleaner production initiatives have achieved significantresults particularly within small and medium scale industries.
Once an incinerator is built, ongoing toxic waste generation is legitimised and there is littleincentive to investigate process changes within industry even if cleaner productionmethods are more profitable. For this reason, mandatory toxic use reduction plans shouldbe prepared by each facility currently generating toxic waste.
2.3 ConclusionsThe strongest arguments for energy from waste are connected to energy demand. Puttingwaste in landfills is seen as a waste of energy and an inefficent use of land and nature. Alsothe high biomass content is an important argument. The argumentation is focused on theproblems concerning waste volumes today and in a near future. The spokesmen forincineration consider the emissions from incineration is no longer a problem with newplants and that pollutants in ashes are stable and stays in the ash. In comparison withcomposting and anaerobic digestion the problems with toxic substances and metals in thewaste still a problem after treatment and even a worse one. Gasification has the advantageof not causing dioxins.
The arguments against thermal treatment of waste are almost entirely focused on emissionsand toxic substances, mainly dioxins, in the ash. Also not regulated, unknown emissionsand substances in the gases and the ash, are pointed out as risks for human health. Theneed for landfilling is still considered as a problem since the increasing waste volumesrequires landfill facilities for the ashes. The campaigns against incineration are adressed topeople's emotions and fear of the unknown wich has a strong effect. Even energy is anargument but in this case the loss of energy while the energy used in manufacturing is lostwhen a product is combusted.
The opponents have a more long-term view with a change in waste handling systempromoting increased reuse and recycling. However, environmental cost calculations mostlyshow that incineration is equal or inferior to material recovery!
Consequently, both sides have good and important arguments and they have one argumentin common; reduction of pollutants and toxic substances in society.

RENEWA
Ecotraffic ERD3 AB Contract No. 4.1030/Z/01-119-2001December 2003
18

RENEWA
Ecotraffic ERD3 AB Contract No. 4.1030/Z/01-119-2001December 2003
19
3 THE PROBLEMATIC ISSUES WITHIN THERMALCONVERSION OF WASTE
The concept "waste" refers to a large variety of materials with well distinguishabledifferences in their elemental composition, physical and chemical properties, ash andmoister content and energy content. Wastes from industries are normally homogeneousmaterials having a well-defined composition. Municipal solid wastes (MSW) on the otherhand consist from different fractions. The amount and properties of each fraction are usallyhousehold- and site- specific. Too high content of moisture and non-combustible materials,such as glass and metals in the waste makes it a less attractive material as an energy sourceand in extreme cases energy must be supplied for its destruction. Emission control and fluegas cleaning systems are the necessary equipments within waste combustion forelimination of the risks of emission of environmental pollutants. There is a clearrelationship between the amount of the pollutant released during combustion and thecontent of the pollutant precursors in the raw material. Because of variations in the qualityof the raw material and uncertainties upon the amount pollutant precursors the capacity ofthe gas cleaning systems must be dimensioned in a manner for being able of handling amaximum possible emission. Generally the most problematic issues in thermal treatment ofwaste concerns two main categories:
c) Environmental aspects
d) Plant and process specific aspects
The environmental aspects include questions such as emission of hazardous compounds toair, water and in solid by-products. The plant specific questions are the low efficiencyrelative other fuels, high erosion and corrosion rates and problems related to the disposal ofby-products.
3.1 Environmental aspects
3.1.1 Emissions
Inorganic pollutantsAlthough associated with low overall efficiency and high cost, the combustion of untreatedwaste is a well-established technique. Compared to clean fuels such as forest residue ornatural gas, waste contains higher amounts of N, S and Cl, which are the precursors ofNOx, SOx, HCl and dioxins. Other inorganic compounds of great importance in the wasteare heavy metals. During thermal processing these compounds becomes concentrated inone of the output streams from the process.
The content of emission precursors varies significantly in different fractions of waste.Table 1 shows a comparison between compositions of different waste fractions. As can beseen in the table; despite a negligible contribution to the energy content, certain fractionsof waste such as food residue can show a very large contribution concerning the pollutantprecursors.

RENEWA
Ecotraffic ERD3 AB Contract No. 4.1030/Z/01-119-2001December 2003
20
Table 1. Comparison between the energy content and emission precursor content ofdifferent MSW fractions.
MSW fraction Wood Anim.Residue
Veg.Residue
Rubber &leather
Poly-ethene
PVC
Ash (% wt.) 1 5 5 8 3 Moisture (% wt.) 15 50 70 5 0 LHV (MJ/kg) 15 7 3 44 45 20.5Nitrogen (mg/MJ) 638 6 019 15 876 262 Sulphur (mg/MJ) 2 407 825 625 35 Chlorine (mg/MJ) 5- 250 13 611 28 660 1 008 25 085
In general the first measure to reduce the risk for emission from waste thermal treatment isto control the quality of the waste to be burnt. This quality control can be achieved by theseparation of waste into different fractions. The separation is however costly and labourintensive affecting the process economy negatively and results in the generation of“undesired” fractions that must be disposed of anyhow. Fractionating of waste to differentcategories can be done in households but there is no warranty that pollutant sources will beeliminated totally from the waste.
In thermal treatment, due to uncertainties upon the level of the contaminants in the wastethe waste water and flue gas cleaning systems must be dimensioned to a maximumcapacity that can be needed for the case of most contaminated waste fractions. Since thesefacilities stand for a considerable part of the capital and operational costs, the strengtheningdemands on the limits of the pollutant emissions can result in a serious drawback indeployment of the waste combustion plants in the future.
Emission of certain categories of compounds from waste combustion plants can becontrolled by optimising the operational conditions. E.g. the release of heavy metals in gasphase is strongly dependent on the temperature of the flue gas. A low gas cleaningtemperature results in accumulation of the heavy metals in other product streams than fluegas. For some compounds like mercury however, a total elimination can be achieved eitherby cooling the gas to temperatures close to room temperature (Figure 2) or by its carefulseparation from the fuel in the steps prior to thermal treatment. In the first case theseparated mercury will contaminate the process water produced during waste treatment andmeasures must be taken to stabilize the captured mercury.
The existing reduction processes for mercury show a capacity of about 50%, which can beregarded as unsatisfactory for the fuels with high mercury content. There are reportsavailable about advanced high efficient mercury capturing methods tested in thelaboratory, which show a reduction capacity higher than 90%. The investment andoperational costs for such processes are however high and uncertainties in verification ofthe performance in a real process is one of the major barriers in deployment of thetechnique.
The process conditions have a limited effect on the quantity and the quality of theemissions released in combustion of dirty fuels. The most reliable method to prevent theundesired emissions for these cases is to apply advanced gas or wastewater cleaningsystems.

RENEWA
Ecotraffic ERD3 AB Contract No. 4.1030/Z/01-119-2001December 2003
21
Inorganic polutant soursec
0
20
40
60
80
100
0 100 200 300 400 500 600 700 800 900 1000
Temperature (°C)
Gas
pha
se fr
actio
n(%
of t
he in
put)
Hg(g)Cd(g)As(g)
Figure 2. Gas phase concentration of critical heavy metals as a function oftemperature [1].
Organic compoundsAmong organic emissions from waste treatment facilities the release of polychlorinated di-benzo dioxins (PCDDs or dioxins) and polychlorinated di-benzo furans (PCDFs or furans)to atmosphere is of a major concern. Dioxins and furans are found in the fly ash, in thebottom ash and in the scrubber residues in all waste incinerators also. Their typicalconcentration in fly ash and scrubber residues is reported to range from parts per trillion(ppt) to parts per billion (ppb). In bottom ash, concentrations are characteristically at pptlevels. US EPA has established very stringent emission limits for dioxins and furans.Experiences from countries like Sweden and Netherlands show that there is great potentialfor decreasing the dioxin emissions to atmospheres (Table 2). Thorough separation ofdioxin precursors such as PVC plastics from the waste is considered to be one of the majorreasons behind this decrease. The most important issue concerning dioxins and furans ishowever the uncertainties in estimation of the global emissions. Dioxin monitoring is avery costly procedure and requires specialists with expertise skill of both in sampling andin analysis. The high costs for measurement results in that the estimations upon the globalemissions are often based on short time and periodical samplings within certain conditions.As the quality of the fuel and the process conditions can be very different in differentperiods the results from such estimations can be regarded questionable.
Table 2. Dioxin emissions to atmosphere in gram [2].
Country Incineration source 1990/5 2000
Municipal Waste 96.2 9.9Sweden
Hazardous Waste 7.3 4.9
Municipal Waste 382 2-4Netherlands
Hazardous Waste 16 1.7

RENEWA
Ecotraffic ERD3 AB Contract No. 4.1030/Z/01-119-2001December 2003
22
The other important question in waste thermal treatment is the amount of unburnedfraction in the combustion residues. The reason to this is mostly the inhomogeneity of thefuel and the fact that different waste fractions have different chemical reaction activities(Figure 3).
Devolatilization of different feedstocks
51155
272375
468546
614678
736 782
0100200300400500600700800900
10001100
1 2 3 4 5 6 7 8 9 10
Nor
mal
ized
wei
ght (
mg/
mg)
;T
empe
ratu
re (°
C)
WplasticTextileWpaperWbiomassTplastic (°C)Tbiomass(°C)TPaper(°C)Ttextile(°C)
Figure 3. Comparison between devolatilization properties of biomass, plastic, paperand textile waste [3].
EU:s directive on establishing criteria and procedures for the acceptance of waste atlandfills (2003/33/EG) allows a highest total organic content of 5% (wt) for combustionresidues. A higher content of unburned substances in the residues from waste combustionplants will result in a different classification of these materials with a considerable increasein landfill costs as consequence. For extreme cases pre-treatment of the combustionresidues can become necessary to fulfil the requirements for disposable wastes.
3.1.2 RegulationsThe impact of waste incineration on the environment is regulated by the EuropeanParliament Directive 2000/76/EC. Table 3 to 5 show the requirements set by this directiveto the quality of the gas and water released from the waste thermal treatment plants.

RENEWA
Ecotraffic ERD3 AB Contract No. 4.1030/Z/01-119-2001December 2003
23
Table 3. Air emission limit value (daily average).
Total dust 10 mg/m3
Gaseous and vaporous organic substances, expressed as total organiccarbon
10 mg/m3
Hydrogen chloride (HCl) 10 mg/m3
Hydrogen fluoride (HF) 1 mg/m3
Sulphur dioxide (SO2) 50 mg/m3
Nitrogen monoxide (NO) and nitrogen dioxide (NO2) expressed asnitrogen dioxide for existing incineration plants with a nominal capacityexceeding 6 tons per hour or new incineration plants
200 mg/m3 (*)
Nitrogen monoxide (NO) and nitrogen dioxide (NO2), expressed asnitrogen dioxide for existing incineration plants with a nominal capacityof 6 tons per hour or less
400 mg/m3 (*)
Dioxin and furans 0,1 ng/m3
(*) Until 1 January 2007 and without prejudice to relevant (Community) legislation the emission limit valuefor NOx does not apply to plants only incinerating hazardous waste.
Table 4. All average values over the sample period of a minimum of 30 minutes and amaximum of 8 hours
Cadmium and its compounds, expressed as cadmium (Cd)Thallium and its compounds, expressed as thallium (Tl) Total 0,05 mg/m3 total 0,1 mg/m3 (*)Mercury and its compounds, expressed as mercury (Hg) 0,05 mg/m3 0,1 mg/m3 (*)Antimony and its compounds, expressed as antimony (Sb)Arsenic and its compounds, expressed as arsenic (As)Lead and its compounds, expressed as lead (Pb)Chromium and its compounds, expressed as chromium (Cr)Cobalt and its compounds, expressed as cobalt (Co)Copper and its compounds, expressed as copper (Cu)Manganese and its compounds, expressed as manganese (Mn)Nickel and its compounds, expressed as nickel (Ni)Vanadium and its compounds, expressed as vanadium (V)
Total 0,5 mg/m3 total 1 mg/m3 (*)
(*) Until 1 January 2007 average values for existing plants for which the permit to operate has been grantedbefore 31 December 1996, and which incinerate hazardous waste only.

RENEWA
Ecotraffic ERD3 AB Contract No. 4.1030/Z/01-119-2001December 2003
24
Table 5. Emission limit values for discharges of waste water from the cleaning ofexhaust gases
Polluting substances Emission limit values expressed in massconcentrations for unfiltered samples
1. Total suspended solids as defined by Directive91/271/EEC
95 %;30 mg/l
100%;45 mg/l
2. Mercury and its compounds, expressed as mercury (Hg) 0,03 mg/l3. Cadmium and its compounds, expressed as cadmium (Cd) 0,05 mg/l4. Thallium and its compounds, expressed as thallium (Tl) 0,05 mg/l5. Arsenic and its compounds, expressed as arsenic (As) 0,15 mg/l6. Lead and its compounds, expressed as lead (Pb) 0,2 mg/l7. Chromium and its compounds, expressed as chromium
(Cr)0,5 mg/l
8. Copper and its compounds, expressed as copper (Cu) 0,5 mg/l9. Nickel and its compounds, expressed as nickel (Ni) 0,5 mg/l10. Zinc and its compounds, expressed as zinc (Zn) 1,5 mg/l11. Dioxins and furans 0,3 mg/l
Until 1 January 2008, exemptions for total suspended solids may be authorised by the competent authorityfor existing incineration plants provided the permit foresees that 80 % of the measured values do not exceed30 mg/l and none of them exceed 45 mg/l.
Restrictions in the release of gas phase pollutants to the atmosphere from waste co-firingplants are defined in the same directive as well. For these processes the limit for emissionis dependent on the share of the waste in the fuel. In general a co-combustion plant isdefined as a plant where the purpose of firing is production of useful energy. There is ingeneral no limitation on the proportion of waste fired in the co-firing plant. Especially forhazardous waste, if the contribution to the total energy produced is larger than 40%, the co-firing process must fulfil the same requirements as for pure waste firing processes. Table 3.

RENEWA
Ecotraffic ERD3 AB Contract No. 4.1030/Z/01-119-2001December 2003
25
Calculated emission limits for waste co-firing processes
050
100150200250300350400
0 0,1 0,2 0,3 0,4 0,5 0,6Contribution of the hazardeous waste to the produced
energy
Lim
it fo
r em
issi
on
(mg/
Nm
3 )NOx SO2 Dust
Figure 4. Emission limits for waste co-firing processes.
3.2 Plant specific aspects
3.2.1 Problems related to inorganic materials during thermal treatment ofwaste
Compared to renewable and other solid fuel, waste usually contains a considerable higheramount of inorganic material. A high inorganic content increases the total throughout ofthe ash trough the process resulting in faster erosion and wear out of tubs, vessels andfiltering equipment. The main part of the inorganic content in waste can consist of inertcompounds such as calcium, aluminium and silicon that are either in a stable form prior to,or becoming stabilised during, the thermal treatment. The problems caused by the non-inertpart of the inorganic content in the waste can be described as:
a) Fouling and deposit formation followed by corrosion and operational failures
b) Contamination of process water
c) Contamination of bottom and fly ash
3.2.2 Slagging and foulingDeposit formation during thermal treatment of waste occurs throughout differentmechanisms but the formation of condensable products is a necessary step for initiation ofdepositing and fouling. Sodium, potassium and zinc are the most important componentsthat are found in considerable concentration in the composition of unsorted waste and areable of forming compounds with low melting temperature. In fluidised bed processes severproblems of bed material agglomeration and sintering occur due to the formation of lowtemperature melting compounds containing potassium and sodium. Periodical interruptionsin operation due to fouling and sintering is well known problem that decreases thereliability of the waste combustion process in energy production applications. Figure 5shows the results from calculations, based on thermodynamic equilibrium, for
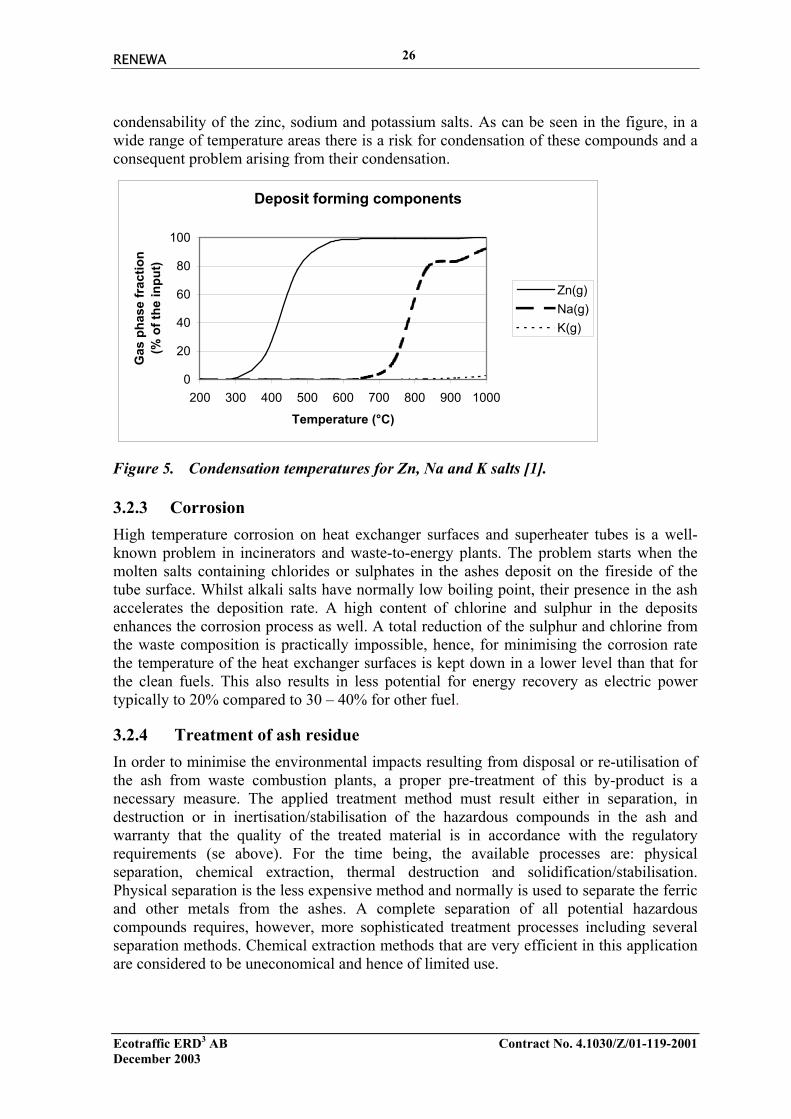
RENEWA
Ecotraffic ERD3 AB Contract No. 4.1030/Z/01-119-2001December 2003
26
condensability of the zinc, sodium and potassium salts. As can be seen in the figure, in awide range of temperature areas there is a risk for condensation of these compounds and aconsequent problem arising from their condensation.
Deposit forming components
0
20
40
60
80
100
200 300 400 500 600 700 800 900 1000
Temperature (°C)
Gas
pha
se fr
actio
n(%
of t
he in
put)
Zn(g)Na(g)K(g)
Figure 5. Condensation temperatures for Zn, Na and K salts [1].
3.2.3 CorrosionHigh temperature corrosion on heat exchanger surfaces and superheater tubes is a well-known problem in incinerators and waste-to-energy plants. The problem starts when themolten salts containing chlorides or sulphates in the ashes deposit on the fireside of thetube surface. Whilst alkali salts have normally low boiling point, their presence in the ashaccelerates the deposition rate. A high content of chlorine and sulphur in the depositsenhances the corrosion process as well. A total reduction of the sulphur and chlorine fromthe waste composition is practically impossible, hence, for minimising the corrosion ratethe temperature of the heat exchanger surfaces is kept down in a lower level than that forthe clean fuels. This also results in less potential for energy recovery as electric powertypically to 20% compared to 30 – 40% for other fuel.
3.2.4 Treatment of ash residueIn order to minimise the environmental impacts resulting from disposal or re-utilisation ofthe ash from waste combustion plants, a proper pre-treatment of this by-product is anecessary measure. The applied treatment method must result either in separation, indestruction or in inertisation/stabilisation of the hazardous compounds in the ash andwarranty that the quality of the treated material is in accordance with the regulatoryrequirements (se above). For the time being, the available processes are: physicalseparation, chemical extraction, thermal destruction and solidification/stabilisation.Physical separation is the less expensive method and normally is used to separate the ferricand other metals from the ashes. A complete separation of all potential hazardouscompounds requires, however, more sophisticated treatment processes including severalseparation methods. Chemical extraction methods that are very efficient in this applicationare considered to be uneconomical and hence of limited use.

RENEWA
Ecotraffic ERD3 AB Contract No. 4.1030/Z/01-119-2001December 2003
27
3.2.5 Emission monitoring methodsContinuous emission monitoring (CEM) is a necessity factor to assure regulators and thepublic that the thermal processing facilities are operating safely and within permittedemissions limits. For the time being there is mature and commercially available techniquefor measuring hydrocarbons, nitrogen oxides, sulfur oxides and hydrogen chloride.However, continuous monitoring of some analytes is much more complex than thesecommercially available CEMs.
3.2.6 Energy efficiencyOf several reasons the thermal conversion of waste is often associated with low overallefficiency: due to the high energy demand in gas and waste water cleaning systems andenergy losses, the amount of the energy that is internally used in the plant is comparativelyhigh in waste combustion. In a Combined Heat and Power (CHP) plant the overallefficiency is dependent on the highest applicable temperature and pressure of the steamproduced. Waste thermal treating plants suffer from serious problems related to corrosionon heat exchanger and superheater surfaces. The corrosion is dependent on theenvironment and the temperature. Increased temperature in a corrosive environmentaccelerates the corrosion rate. To suppress the corrosion the boiler and heat recoverysystems in waste treating plants are normally operated at lower temperature than in thecase with clean fuels. The low steam temperature (<420°C) and steam pressure result in aninsufficient electrical efficiency for the whole process. A summary of the electricalefficiency for waste-based CHP-plants in Sweden is plotted in Figure 6. As can be seen thehighest alfa value (defined as the ratio: electricity/heat) achievable in these plants is below0.45. This can be compared to the options of CHP with clean fuels that can be as high as0.6. As long as the produced heat can be utilised as a product the low electrical efficiencyis not considered as a serious drawback. Absence of demands on heat being more relevantto Europe as a whole, however makes the question to a critical issue that affects the totaleconomy of the process.
α- value as a function of steam temperature at existing MSW burning CHP plants in Sweden
0,00
0,10
0,20
0,30
0,40
0,50
150 250 350 450 550
Steam temperature °C
α- v
alue
75MW62 MW30MW18 MW
Figure 6. Electrical efficiency for waste combustion plants.

RENEWA
Ecotraffic ERD3 AB Contract No. 4.1030/Z/01-119-2001December 2003
28
3.3 EconomyThe economics of a waste treatment plant producing heat and electricity is dependent onthe following parameters:
The gate fee: As waste treatment is a capital and energy consuming process, a gate fee fortreatment of the waste is necessary.
The revenues from the produced energy: The price for the produced energy is set by themarket and waste treating plant are obliged to compete with the cheapest available energyin the market such as energy produced from conventional e.g. coal or nuclear sources
The investment cost: Due to the tough requirements on the gas and waste water cleaningsystems the waste thermal treating plants are highly capital intensive investments.
Operational and maintenance costs: The magnitude of these costs is comparatively high forwaste treatment plants. This is due to a fast worn out of the plant components and also thelarger number of process units that are necessary in the plant.
Handling of the by-products: By-products from the waste treatment plants are classified aswaste and the disposal cost is strongly affected by their quality. For the time being, theproblem with reutilising of the by-products such as fly and bottom ash is not properlysolved. To reduce the disposal cost the amount of the hazardous residues in the by-products must be reduced to a minimum. Figure 7 illustrates the cost for the disposal ofashes from the waste treatment plant in accordance to Swedish regulations. As can be seenin the figure for a normal process only the cost for disposal of the produced ash is above200 SEK/tonne waste treated. This must be compared to the existing gate fees that arenormally in the range of 400 – 450 SEK/tonne waste accepted.
0
50
100
150
200
250
300
0,1 1 10 100
Content of Ash, Cl, S
Solids disposal cost, SEK
Ash content, 20 % as flyash
Chlorine content
Sulphur content
Bottom ash 1000SEK/tonneFly ash, gas cleaning solids 2000SEK/tonne
10 % ash, 0.4 % S, 0.4% Cl
Figure 7. Cost for disposal of the by-products

RENEWA
Ecotraffic ERD3 AB Contract No. 4.1030/Z/01-119-2001December 2003
29
Requirements on the process reliability concerning the environmental issues result in thatthe investment costs for waste treatment plants are not going to be less in the future. Table6 shows investment costs for two state-of-the-art waste incineration plants of the same sizein Sweden. The Malmö plant was commissioned in 2003 and the plant in Uppsala isplanned to be ready in 2005. The investments in flue gas cleaning in Uppsala stands forone third of the total investment costs.
Table 6. Data for some incineration plants.
Uppsala Malmö RABA-Rostock
TREABreisgau
MVAPfaffenau
Country Sweden Sweden Germany Germany Austria
Commissioning 2005 2003 2005 2005 2008
Investment MEUR 108 103 60 77 185
Operating time h/year 7800 8200 7800
Capacity ton/h 22 25 32
Capacity ton/year 176,000 205,000 150,000 150,000 250,000
Investment EUR/ton 616 503 400 513 740
Energy content MJ/kg 10,80 10,80 10,7 11 9
Total energy input TJ/year 1901 2214 1605 1650 2261
Heat MW 70a 65 20 50-54
Electricity MW - 16 15 15-11
Total MW 70 81 35 65a Heat and steam
Competition in the market reduces the price for the products from these plants e.g. heat andpower to a minimum level. As there is no possibility to reduce the operational andmaintenance costs in these plants, the gate fee becomes the only parameter that canregulate the economy of the plant. In the cases where the produced heat can be regarded asa product with a positive market value there is a good opportunity for the survival of wastethermal treating plants even with comparatively low incomes from gate fee. Otherwise, thelevel of the gate fee must be adjusted to retain the economical feasibility of waste thermaltreating processes. So far the gate fees have been kept on a low level due to thecompetition with landfilling. This has restrained the expansion of waste-to-energy plants inEurope due to low profitability but changes could be foreseen due to legislation andincreasing tax levels on landfilling. In Table 7 examples on landfilling prices and taxes insome European countries are given.

RENEWA
Ecotraffic ERD3 AB Contract No. 4.1030/Z/01-119-2001December 2003
30
Table 7. Landfill tax rates and prices in some countries
EU statesTax rates
EUR/tonneLandfill prices
EUR/tonne
Austria 29-86 57-130
Belgium 5-22 68-81
Denmark 44 21-33
Finland 14 -
France 6 -
Germany none 25-51
Greece none 6-14
Ireland none -
Italy 1-25 -
Luxembourg none -
Netherlands 13-63 75
Portugal none 6-14
Spain none 14
Sweden 27 44-109
UK 2-13 13-23
Czech Republic 17 -
Norway 38-79 -
Switzerland 10-32 89-103
Note. Figures are approximate due to rounding. Figures represent the latest years available and may not beconsistent between countries. Some countries is proposing tax increases.
Sources: UK Strategy Unit report: Waste not, want not (OECD, ENDS, Austrian Federal EnvironmentAgency) and RVF report: Swedish Waste Management 2002.Conversion rates used: 0,63 GBP/EUR, 9,15 SEK/EUR
Of those countries which have a landfill tax, the UK currently has the lowest tax rates foractive waste, apart from France which has an escalator of 1 Euro per tonne per annum andFinland which is proposing large increases.
Increasing the electrical efficiency of waste combustion plants can be regarded as asolution but as can be seen in Figure 8, there is a limitation on the effect of this measure.The figure shows the case for plant only producing electricity without heat revenues, basedon experiences of the company TPS (Termiska Processer AB). The red line in the figurerepresents the investment levels for modern plants seen in Table 6. The blue line representsplants with less sophisticated flue gas cleaning systems. When planning the plant inUppsala Vattenfall decided not to invest in electricity production due to low profitability.

RENEWA
Ecotraffic ERD3 AB Contract No. 4.1030/Z/01-119-2001December 2003
31
The gate fee as a function of el-efficiency of
-150
-130
-110
-90
-70
-50
-30
-10
10
30
50
0 10 20 30 40 50 60
El eff.,
Gate fee, €/tonne
Spec. inv. 300Spec. inv. 600
Today
Figure 8. The gate fee required at zero-profit condition with the assumptions of:El. revenue = 60 €/MWh and O & M cost = 50 €/tonne. Source TPS.
3.4 ConclusionsThe major barriers within waste thermal treatment are non-technical, more stringentdemands can technically be achievable to almost any level of the penalty of rapidlyincreased cost of treatment. However, alternative treatment procedures (composting,biogas) entail the risk of even higher costs of treatment, as large masses of residuesrequiring post-treatment are generated. Incineration of these can become a necessary partof such WtE installations.
A techno- economic barrier is presently problems related to superheater corrosion thatlowers the efficiency for power production and causing high maintenance costs.

RENEWA
Ecotraffic ERD3 AB Contract No. 4.1030/Z/01-119-2001December 2003
32

RENEWA
Ecotraffic ERD3 AB Contract No. 4.1030/Z/01-119-2001December 2003
33
4 AUTOMOTIVE FUEL PRODUCTION THROUGHGASIFICATION
In this chapter the outline and design basis of the plant concept are presented. Insection 4.2 the process plant is briefly described and in section 4.3 the process is describedin detail. Hereafter the mass and energy balances are described in section 4.6 and theeconomics of the complete plant in section 4.7.
4.1 IntroductionThis part of the study considers the implementation of a waste-to-motor fuel plant forconditions representative for a medium to large city in northern Europe. Even though theplant setup is relatively unaffected by the geographical position, the logistics anddimensioning is carried out with respect to an intermediate or densely populated area. Theresults and conclusions derived from this presentation should therefore be applicable to anymiddle-sized European city, such as Stockholm, housing 1.2 million citizens. The scope isto give the reader an idea of what the waste treatment facility in such a region could looklike.
The gasification plant setup is focused on the waste pre-treatment and the gasifiertechnique, as well as the gas cleaning processes. These processes are identified as the mostimportant, whereas processes as DME or methanol production from synthesis gas can beregarded as well-proven technology and therefore given lower priority in the report.
The study is performed by Nykomb Synergetics AB (NSAB) and Future Energy GmbH(FE), where NSAB has been responsible for the contact between FE andEcotraffic ERD3 AB. NSAB has performed the overall technical and economical analysisand accounted for the final report. FE has provided the mass and energy balances,performed the dimensioning of the plant and also supplied an investment cost estimate.
4.2 Overview process descriptionThe following description is intended to give a brief overview over the process concept ofthe full conversion from waste through pyrolysis and gasification technique to automotivemotor fuels. Theoretically, automotive fuels may be methanol, dimethyl ether (DME),hydrogen or Fischer Tropsch diesel (FTD) etc. Here the process is configured for eitherDME or methanol synthesis, although the emphasis is on DME production. Previously,NSAB has been involved in a number of feasibility studies concerning methanolproduction from biomass fuel, using gasification technology [4,5,6]. The process schemefrom waste to automotive fuel, as proposed by FE, is schematically shown in Figure 9,including the whole chain from waste receiving to syngas cleaning.
The technique chosen for the gasification process is the entrained flow gasifier, whosecharacteristics are further discussed in section 4.3.6. The combustible waste materialobtained in the industry or in communities needs various kinds of pre-treatment in order tobe suitable for feeding an entrained flow gasifier system. The pre-treatment involves a pre-drying unit followed by a pyrolysis section.

RENEWA
Ecotraffic ERD3 AB Contract No. 4.1030/Z/01-119-2001December 2003
34
The incoming waste material is delivered to an unloading station, where the material isstored and mixed in a bunker system. The waste material considered is MSW andindustrial waste, solely making up solid waste fractions. The waste fractions are neitherpre-dried, nor sorted or size reduced in any way and therefore, the plant layout mustcontain both a pre-dryer unit as well as a shredder to reduce the size and make the fuelmore homogeneous. From the bunker storage, the waste material is sent to a shredder unitand further to the pre-drying section. The dried material is now fed into the rotary kiln ofthe pyrolysis unit. These units generate a pyrolysis coke, a pyrolysis gas and separatedfrom the gas also pyrolysis oil.
All three intermediate products are to be treated and temporarily stored before feeding thegasifier. The subsequent gasification of the three separate streams takes place in anoxygen-blown Noell-type entrained-flow gasifier at temperatures of 1500-1600 °C and anoperating pressure of 32 bar (a). The outcome is a raw syngas, composed of hydrogen,carbon monoxide, carbon dioxide, water vapour and trace levels of hydrogen sulphide,methane, higher hydrocarbons, carbonyl sulphide, metals, chloride compounds, ammoniaand hydrogen cyanide. Simultaneously, an unleachable slag is formed. The slag containshigh concentrations of silica, aluminium and calcium and lower levels of a large number ofother, mainly metal, species.
In a next process step the hot raw synthesis gas is cooled, primarily by quenching withwater to 220 °C, ultimately down to 50 °C. The cooling is accomplished by generatingsteam with various pressure levels and temperatures on the cold side. A part of this heatrecovery system (HRS) is made up of a water gas-shift reactor, where the exothermicreaction provides heat to the incoming syngas to the reactor. A part of the gas stream is by-passed the shift unit, to achieve the desired stoichiometry of hydrogen and carbonmonoxide for the following synthesis.
The synthesis gas from the heat recovery section still contains sulphur components in formof hydrogen sulphide and carbonyl sulphide as well as other undesired compounds such ascarbon dioxide, traces of higher hydrocarbons including benzene, and possibly other tracesthat can be harmful for the synthesis step.
A proven technology suited to meet the high quality demand for DME synthesis gas is theRectisol® process. The Rectisol plant separates hydrogen sulphide, carbonyl sulphide andcarbon dioxide from the syngas and generates a highly purified cleaned gas, using a cooledsolvent. It is possible to achieve an off gas containing less than 1 vppm of sulphur andcarbon dioxide in the ppm range as well. Low sulphur concentration is important in ordernot to deactivate the DME catalyst. The catalyst activity is not reduced by the carbondioxide, but the carbon dioxide content should be minimised due to its dilution andincrease of the total gas flow. Lowering the carbon dioxide concentration is, however,energy demanding and therefore an optimisation should be carried out. Any ammonia,hydrogen cyanide existent and the carbon dioxide content will also be removed. As theconcentrated solvent is hygroscopic as well, this leaves a cleaned gas of just hydrogen andcarbon monoxide.
The cleaned outlet gas is then compressed to about 60 bar (a) prior to the DME synthesisloop. The gas cleaning unit will produce a hydrogen sulphide-rich gas which is treated andused in a Claus plant to produce elemental sulphur. The separated carbon dioxide is used aspurging gas e.g. within the gasifier island.

RENEWA
Ecotraffic ERD3 AB Contract No. 4.1030/Z/01-119-2001December 2003
35
Both the gasification and the gas treatment are carried out under pressurised conditions at apressure above 30 bar (a), as a lower pressure results in an exergy loss of the recoverableheat evolved in the gasifier reactor. The high pressure also simplifies the final compressionprior to the synthesis step. Methanol and DME synthesis is thermodynamically favoured atincreased pressure and low temperatures. Traditionally, methanol synthesis was carried outat around 300 bar (a), modern catalysts have reduced the necessary operating pressure to50-100 bar (a) and 200-300 °C [7, 8] This interval also reflects the optimal conditions froman economic point of view.
In the DME synthesis the syngas reacts to a DME/methanol/syngas mixture by means ofcatalysts in the DME reactor. The cooling of the methanol reactor generates low pressuresteam, which is used directly for the further DME treatment. The raw DME contains water
and fusel oil that are removed as a waste water stream and a combustible streamrespectively. Raw DME and water are separated from the gas mixture by cooling andcondensing, whereas the syngas is recycled to the DME reactor. After a final distillationthe purified DME stream appears as a water-free product. In parallel to the production ofDME a direct manufacture of methanol is possible, which is a very similar process to theDME synthesis loop by using a special catalyst. By-product streams from the DME
Figure 9. Process scheme, involving key features such as waste receiving, pyrolysis,gasification and gas cleaning and relevant material streams.

RENEWA
Ecotraffic ERD3 AB Contract No. 4.1030/Z/01-119-2001December 2003
36
synthesis are the combustible purge gas, which is recycled to the gasifier, and the flash gasstreams, which are flared together with other vent streams.
In detail, the complete system described above, and also seen from Figure 9, is comprisedof the following subsystems:
1. Waste handling and preparation• Waste unloading and storage
• Waste shredder
• Waste drying.
2. Thermochemical conversion• Pyrolysis
• Feed preparation and supply to the gasifier
− Media supply systems to the gasifier
− Pyrolysis coke supply system
− Pyrolysis gas supply system
− Pyrolysis oil & slurry supply system
• Gasifier system
− Burner and burner cooling circuit
− Reactor with quencher
− Slag discharge.
3. Gas conditioning and cleaning• Heat recovery system
− Steam generator
− Raw gas cooler
• Gas cleaning and conditioning
− Water gas-shift reactor and pre-heater
− Rectisol plant
− Refrigerator system
− Regeneration system
− Claus plant.
4. Fuel synthesis• DME production
• DME separation and purification

RENEWA
Ecotraffic ERD3 AB Contract No. 4.1030/Z/01-119-2001December 2003
37
• DME storage.
5. Auxiliary systems• Purge and vent system
• Flare system
• Steam and condensate system
• Cooling water system
• Emergency system
• Waste water cleaning unit
• Slag discharge• Air separation unit.
The different process parts can be schematically shown, in analogy with the block diagramas seen in Figure 9 (where the shift and methanol/DME units are not shown). The featuresof the plant will be more closely described in the following section, where each part ishandled in the same order as above, i.e. divided into functionality.
4.3 Process configuration
4.3.1 Waste handling and preparationA representative German waste composition, mass flow and heating values are presentedin Table 8. Here, the composition is given for the waste as received and after the pre-drying process step to 10%wt water content, respectively. As previously mentioned, thewaste is composed of both MSW and industrial waste, and it reflects the composition fornorthern Germany without any sorting or size-reductions. As can be seen, the ash andalkali contents are significant, as well as the sulphur content that is comparable to that ofmany coal fuels. This waste composition is, however, only an example of a Europeanwaste fraction and used as a reference for the plant setup. A similar approach to arepresentative Swedish waste fraction would reveal a different composition with lowersulphur and ash content.
The waste is delivered by truck and quantitatively registered and examined for identity.Although this report address solid waste only, with the composition given in Table 8, it ispossible to handle liquid waste as well if desired. The solid waste is loaded into a bunkerwhere it is stored temporarily, whereas any liquid waste is collected in a tank storage.Waste is delivered to the plant five days a week. The size of the bunker storage has to bedimensioned with respect to the five days a week deliveries, to allow for thorough mixingof waste and for contingency situations. Any solids larger than 1 mm contained in theliquid waste, are removed in a drum screening unit and transferred to the solid wastebunker. The solid material is manually moved by crane to the shredder unit, which iscomposed of two redundant rotary scissors. Before being fed to the pre-dryer, the waste iscut up into approximately 40 mm sized parts by rotary scissors.

RENEWA
Ecotraffic ERD3 AB Contract No. 4.1030/Z/01-119-2001December 2003
38
The water content, which may be significantly higher than shown in Table 8, requires thatthe waste is dried before fed to the pyrolysis and gasifier trains, this also reduces the size ofdown-stream apparatus since the total mass flow decreases. The installation of pre-dryersmakes it possible to process waste material containing with maximum moisture content of50%. The pre-drying is carried out in dryer drums, heated indirectly using LP-steam. Thesteam demand is controlled by the temperature in the overhead vent gas, which is purgedwith nitrogen in order to minimise the risk of explosion. The vapour vent from the dryer iscooled and dried through condensing the water vapour, before being reheated andrecirculated to the dryer. The condensed water is used as wash water in scrubbers andfinally sent to the waste water treatment. A small part of the circulating gas is exhaust.There are five separate drying trains, each providing 25% capacity, where the maximumsize is limited by its physical dimensions and the suppliers of equipment.
4.3.2 Thermochemical conversion
4.3.2.1 PyrolysisThe principles of the pyrolysis and gasification processes are combined in order to utilisethe advantages of each process. The pre-dried waste is transferred to the pyrolysis rotarykiln, by apron-type and drag chain conveyors. To prevent the infiltration of oxygen into therotary kiln and to prevent the pyrolysis gas from escaping, the lock process is accompaniedby a specific inerting process with nitrogen. Liquid feedstocks, however, would be directlyfed into the rotary kiln via an injector lance.
As the waste material is heated, the remaining water is evaporated; thereafter carbonisationis taking place at 200-500 °C parallel to gas and liquid production. At still higher
Table 8. Elementary composition of waste as received and pre-dried to 10%wtrespectively. Base case 400,000 tpa. Within parenthesis, the water freecomposition is given.
Waste material, asreceived
Waste material,pre-dried
Total mass flow [tph] 50 44.4
mass flow [t DS/h] 40 40
HHV [MJ/kg] 12.8
LHV [MJ/kg] 10.9 12.6
Composition [%wt]
C 20 (25) 22.5
H 6 (7.5) 6.75
N 1.8 (2.3) 2.03
S 0.7 (0.9) 0.79
O 10 (12.5) 11.3
Cl 1.5 (1.9) 1.7
Ash 40 (50) 45
Water 20 (0) 10
RENEWA
Ecotraffic ERD3 AB Contract No. 4.1030/Z/01-119-2001December 2003
39
temperatures, higher hydrocarbons are thermally cracked into carbon, methane andhydrogen, according to reaction 1.
CnHm d xCH4 + (m/2-2x)H2 + (n-x)C(s) (1)Steam reforming reactions also occur and the solid carbon is gasified into carbonmonoxide and hydrogen via the water gas reaction, as shown by reactions (2 and 3.
CH4 + H2O l CO + 3H2 (2)
C(s) + H2O(g) l H2 + CO (3)
In total, the process unit consists of five rotary kilns, following the five trains of pre-dryers,heated indirectly by a large number of gas fired burners. The burners are distributed intosix individually burner zones, which can be adjusted according to local energy demand,that ensures the exact setting of a specific axial temperature profile. The burners areinitially fired with LPG (syngas after stabile operation of the gasifier system) and theexhaust gas is discharged via the stack.
The discharge system is directly connected to the rotary kiln. This system makes it possibleto discharge the pyrolysis gas and the pyrolysis coke separately. The pyrolysis coke isdischarged via a discharge chute according to the filling level. Coke is deposited at up to aheight of 1.5 m in the discharge chute, which provides a virtually gas-tight divisionbetween the pyrolysis gas in the outlet and the following coke treatment stage. In order toavoid gas from escaping, the entire coke treatment stage is operated with carbon dioxide ata pressure of at least 1 bar above the pressure inside the reactor space.
The generated gas is separated from liquid tars by cooling, initially a quencher andsubsequently a cooler. Any oil and dust content is thereby separated giving a liquid slurry,parallel to the cleaned gas. Any acidic gas components are removed from the gas by meansof an alkaline scrubbing stage. The slurry is further treated by means of two decanters, onefor each cooling section. The high-solid fraction in the first decanter is transferred back tothe solid waste bunker whereas the oil phases from both decanters are stored beforefeeding the gasifier. The solid residues are separated into a coarse and a fine fraction bymeans of a vibrating screen. The fine coke is loaded into silo transport vehicles forrecovery, whereas the coarse-grain fraction is cooled directly by a submerged wet slagextractor, transported to separator to remove first the ferrous particles, and then the non-ferrous ones. Both sizes of coke are stored in silos before feeding the final grinding unit.The milling unit consists of a screening unit and a ball mill. The milled fine coke is sent toa buffer silo by a pneumatic conveyor, using a carrier gas (nitrogen in the start up phase,and recycled carbon dioxide during normal operation). By means of a conveyer system, thepulverised pyrolysis coke is passed to a dense flow feeding system consisting of asequence of an atmospheric fuel bunker, three lock hoppers and a feeder vessel.
Pyrolysis coke is charged from a storage bin to pulverised fuel feeding. The pulverised fuelis partially fluidised by means of the carrier gas in the vortex shaft of the feeder vessel, inwhich the fuel conveying lines are immersed. The fuel is pneumatically transported in adense flow to the gasifier nozzle. The fuel mass flow is determined by correlationmeasurement comparing conveyance velocity and the mixed flow (fuel and carrier gas)density. The fuel mass flow rate is established through control of the pressure dropbetween the feeder vessel and the gasifier reaction chamber. Buffer tanks compensate forvarying carrier gas requirements. The entire process of pulverised fuel feeding is integrated

RENEWA
Ecotraffic ERD3 AB Contract No. 4.1030/Z/01-119-2001December 2003
40
into the automation system as sequence control system. Thus, all parameters that arerelevant to the system are constantly monitored. A sequence-independent interlockingsystem guarantees the maintenance of the pressure regime.
Before feeding the gasifier, each stream is pressurised to comply with the operatingconditions in the gasifier. The liquid fraction, a slurry of oil, water and dust is intensivelyagitated to emulsify the mixture and prevent separation into water and oil. To improve thecharacteristics the slurry is heated with LP-steam before pumped with piston pumps to45 bar (a). The slurry should be of constant quality to be finely atomised by means of thenozzle. Prior to main burner start-up, the slurry is recirculated in a closed loop. Purging ofslurry lances is carried out with nitrogen during the start-up phase. Finally, the pyrolysisgas pressure is increased using a speed-regulated compressor, compressing the gas to35 bar (a) before feeding it to the main burner of the gasifier system. The compressor isredundantly installed. This procedure results in three streams, which flows are regulatedand optimised before being fed to the gasifier. This is carried out by means of bufferstorages, for each of the feed streams, which also ensures stable operation of the gasifier.
These three streams are fed to the main combination burner; above this, a pilot burner isused to generate the necessary heat. In the start-up phase and during the heating-up phaseLPG is used as fuel for the pilot burner. As soon as the production of syngas is established,the generated syngas will instead be used as fuel gas, operating as hot standby. The oxygenis provided to the gasifier from the ASU at a pressure of 40 bar (a) and a temperature of120 °C. The oxygen feed rate to each burner is regulated by a control valve by ratio controlwith the actual fuel feed rate. Downstream the last shut-off valve before the burner, anitrogen purge line leads into the oxygen line, which shall ensure a definite stream inreactor direction at burner shut-down. The oxygen supply system is part of the gasifiersafety system.
4.3.2.2 Gasification plantThe entrained gasifier, quench and burner system by Noell used in this study are shown inFigure 10. The reactants (fuel and gasification media) are fed into the reaction chamber inparallel flow through the main and pilot burner at the gasifier top. The latter are convertedin a heterogeneous flame reaction in entrained flow at a pressure of approximately32 bar (a) and temperatures of about 1500 °C. The partial oxidation reaction converts theorganic components of the feed materials primarily into hydrogen and carbon monoxide,with secondary formation of carbon dioxide, water vapour and low levels of hydrogensulphide, methane, higher hydrocarbons, carbonyl sulphide, metals, chloride compounds,ammonia and hydrogen cyanide. The non-volatile and inert components in the feed areforming a slag or salts.
The specified high-ash feedstock will be gasified in a patented “cooling screen” designgasifier. The cooling screen design is highly suitable for high-ash containing feedstocks.This design lowers the risk of slag attack on the refractory lining and offers long and lowmaintenance-cost operation. For safe capture of slag and solids a full-quench system isproposed.
Gasifier control at the Future Energy gasifier system is automatic. The initial set-point forthe gasification oxygen requirement is controlled by the mass flow rate of the fuels. Theoxygen-to-fuel ratio is trimmed to adjust for changes in load, fuel characteristics (such asinert fraction and composition, slag melting temperatures etc.), pressure differential across
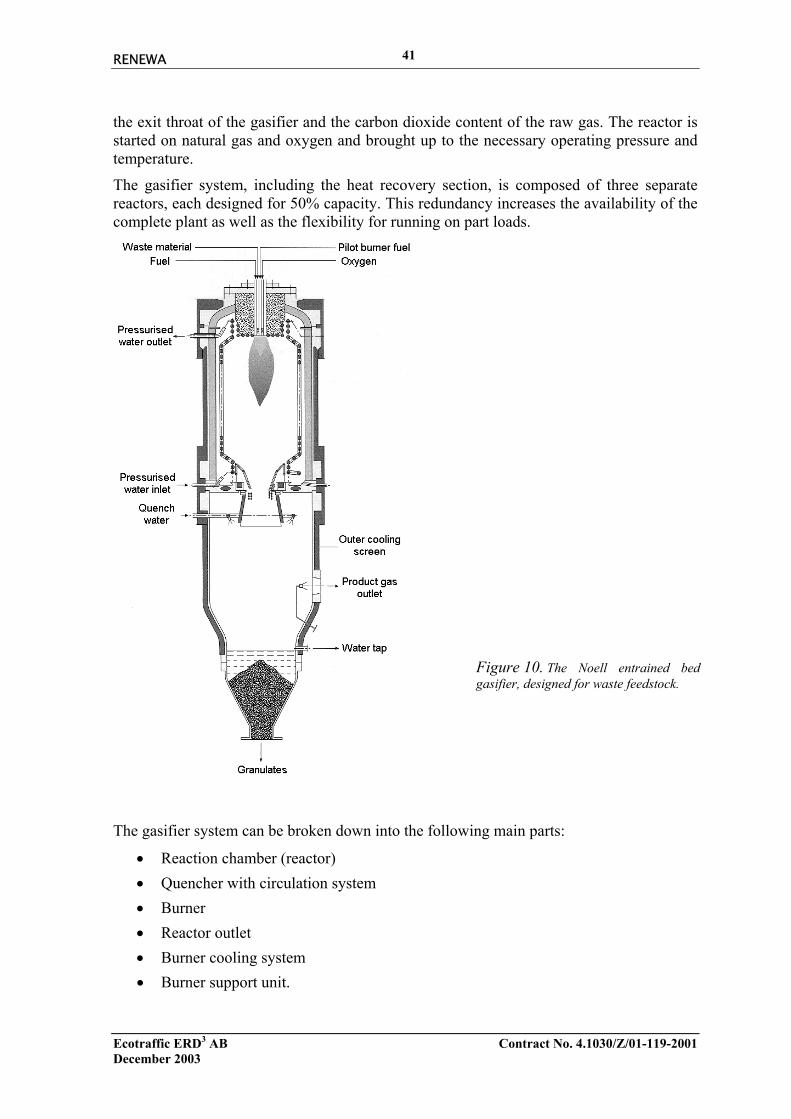
RENEWA
Ecotraffic ERD3 AB Contract No. 4.1030/Z/01-119-2001December 2003
41
the exit throat of the gasifier and the carbon dioxide content of the raw gas. The reactor isstarted on natural gas and oxygen and brought up to the necessary operating pressure andtemperature.
The gasifier system, including the heat recovery section, is composed of three separatereactors, each designed for 50% capacity. This redundancy increases the availability of thecomplete plant as well as the flexibility for running on part loads.
Figure 10. The Noell entrained bedgasifier, designed for waste feedstock.
The gasifier system can be broken down into the following main parts:
• Reaction chamber (reactor)• Quencher with circulation system• Burner• Reactor outlet• Burner cooling system• Burner support unit.

RENEWA
Ecotraffic ERD3 AB Contract No. 4.1030/Z/01-119-2001December 2003
42
The reactor designated for waste gasification comprises an outside pressure wall and aninside cooling screen (inner diameter about 1.7 m) cooled by pressurised water to protectthe outside wall against chemical and thermal attacks. The cooling screen consists mainlyof a spiral pipe coil studded and covered with a ceramic ramming mass. The reactor head iscovered by the burner support unit, which bears the combination burner.
Heat from the reaction chamber is rejected to the cooling screen steam generator, theburner cooling circuit (BCC) and to the burner support unit through a closed-loop coolingsystem. Liquid slag and solids from the gas in the reactor flow down the inner wall, whichis protected by solidified slag, through the cooled reactor outlet and passing the directcoupled quench vessel.
The burner installation comprises a pilot burner with ignition device and flame monitoringsystem and a main burner, useable for different kind of feedstock (solids, slurry, gas).During the start-up phase, i.e. until carbon dioxide is available from the gas cleaning unit,nitrogen is used for purging. Following the ignition of the main burner, the pilot burner isswitched from LPG to syngas. Media supply systems comprise all instrumentation andcontrol installation necessary to regulate the media feed rates.
Once the pilot burner for the ignition of the fuel is in temperature maintenance operation,the gas content in the system pressurised, the gasifier can be brought on line withinminutes. From the hot standby condition it can be brought to full load within 10 minutes.About 0.5 to 1 hours are necessary to bring the gasifier from “cold condition” to full load.To achieve high plant availability it is common practice to keep the stand-by gasifier in“warm condition”, i.e. the gasifier being run with pilot burner.
Burner components that are subjected to high thermal loads are intensely cooled by aseparate cooling water circuit, which includes a buffer vessel, an air cooler and redundantBCC pumps. The pressure of this cooling circuit follows the reactor pressure in such amanner that the burner cooling water pressure exceeds the reactor pressure by about 1 bar.This prevents the migration of syngas into the cooling circuit in the event of a leak in thecooling coils or in the cooling shroud of the burner. The cooling water used is recycled,cooled by an air cooler.
The hot raw synthesis gas and the liquid slag leave the gasifier reaction chamber and flowin parallel vertically downward and discharge directly into a quench section. The raw gasis instantaneously cooled down to approximately 220 °C by direct injection of water.Generated slag granulates in the water bath in the bottom of the quench system.
After passing the quench section, the raw gas is completely saturated with water vapour.This water content is condensed in the following cooling steps and it will be used again asquench water. The liquid water part of the quench process, i.e. the remaining quench water,is flashed together with suspended solids (slag, fine ash, coke, soot and salts) and finallysent to the waste water pre-treatment. Main parts of this cleaned water are recycled to thequencher as quench water whereas a small flow is discharged as waste water in order tomaintain the salt concentration in the cycle water.
Preceding the quench section the remaining ash and soot particulates are removed from theraw gas in a venturi scrubber. The scrubber is run on gas condensate from a downstreamprocess and part of this scrubber water is directed to the waste water treatment unit.

RENEWA
Ecotraffic ERD3 AB Contract No. 4.1030/Z/01-119-2001December 2003
43
4.3.3 Gas conditioning and cleaningThe cleaning and conditioning of the derived raw gas is perhaps the most delicate part ofthe process, together with the gasifier, where the composition of the gas is shifted to matchthe desired stoichiometry in the synthesis section. Prior to the conditioning of the raw gas,the heat is recovered in a multi-stage system.
4.3.3.1 Heat recovery systemThe hot raw gas exiting the quencher outlet is cooled in a multi-stage HRS. The first stageis a MP-steam generator, followed by a water gas-shift unit with pre-heater and shift-reactor. Downstream the pre-heater the gas has a temperature of about 280 °C, whichfacilitates steam generation at 40 bar (a) in a HP-steam generator. The gas is further cooledin a second MP-steam generator followed by a LP-steam generator. Part of this LP-steamis used for pre-heating of slurry and oxygen. The sixth and last section is a cooling sectionusing cooling water. The outlet temperature of the raw gas leaving the HRS isapproximately 50 °C, before entering the Rectisol plant.
The condensate generated during the cooling operation is collected in a gas condensatevessel that is operated at raw gas pressure. The main part of the condensate is used asquench water and is recycled to the quench. A small part of this water, containingammonia and other trace compounds, is passed to the waste water treatment plant.
4.3.3.2 Water gas-shift reactorDownstream the first MP-steam generation step, a water gas-shift reactor is installed toconvert parts of the carbon monoxide content in the raw syngas into desired hydrogen andcarbon dioxide. The overall process is delivered by Linde, using a “dirty-shift” catalyst,where the active phase is Co/Mo. The dirty-shift catalyst requires a certain amount ofhydrogen sulphide in the gas to remain in its active conformation, i.e. sulphated. Thesulphur content in the gas is well above the critical limit of 700 ppm stated by themanufacturer. To handle any trace compounds that could deactivate the catalyst, thecatalyst is installed in three sections. This improves the catalyst life for the second andthird sections. Depending on the feedstock and the resulting concentrations of pollutants inthe gas, an inactive guard bed could be placed upstream the catalyst bed.
The exothermic water gas-shift reaction starts at an initial temperature of about 280 °C andincreases to about 430 °C. The generated heat from the shift reaction is used to heat up thesyngas upstream the shift reactor to the inlet temperature of 280 °C. A by-pass to the shiftreactor is used to adjust the demanded hydrogen to carbon monoxide ratio, before enteringthe synthesis unit. The carbon dioxide content in the processed gas stream is subsequentlyremoved in the Rectisol plant.
4.3.3.3 Rectisol plantThe Rectisol process is an acid gas removal system using an organic solvent attemperatures below 0 °C. In general, methanol is used for hydrogen sulphide/carbonylsulphide in parallel to carbon dioxide removal. By means of the Rectisol process it ispossible to produce a purified synthesis gas with less than 0.1 vppm total sulphur and acarbon dioxide content in the ppm range. The degree of carbon dioxide reduction should befurther investigated and optimised in a more detailed study. In the given one-stage Rectisol

RENEWA
Ecotraffic ERD3 AB Contract No. 4.1030/Z/01-119-2001December 2003
44
design hydrogen sulphide/carbonyl sulphide and carbon dioxide are simultaneouslyremoved in a single wash column.
The main advantage compared to other processes is the use of cheap and in-processavailable methanol as solvent, the very flexible process configuration and the rather lowutility consumption figures. In addition, the sulphur compounds (trail gas) and the carbondioxide can be removed in separate fractions.
The Rectisol process is a commercially tested and verified method, used world wide for thepurification of hydrogen, ammonia- and methanol syngas, pure carbon monoxide oroxogases. Since the gas from the entrained gasifier is tar free, the Rectisol is the onlyrequired gas cleaning utility.
The raw gas that enters the Rectisol plant is cooled down in a heat exchanger system whileheating the cleaned syngas and the generated carbon dioxide gas, before exiting theRectisol plant. The physically acting absorption unit removes hydrogen sulphide/carbonylsulphide and carbon dioxide from the crude syngas by cold lean and semi-lean methanol,cooled to temperatures below -10 °C. Trace compounds introduced in the process togetherwith the feed gas, such as hydrogen cyanide and ammonia will also be removed. Preferablesolvent is methanol.
The methanol from the bottom of this section is loaded with carbon dioxide and hydrogensulphide/carbonyl sulphide. The heat of solution is covered partly by heating of themethanol and partly by external refrigeration (temperature level -42 °C). The purified gasstream from the top of the wash column is heated by the incoming gas stream and given tothe syngas compressor before entering the methanol/DME plant.
The loaded methanol stream from the main scrubber is expanded in the flash column to anintermediate pressure in order to recover an impure carbon dioxide gas stream. The flashedcarbon dioxide is heated, and in addition to being given to the carbon dioxide compressorfor recycle, it is sent out for external use.
The loaded methanol from the flash column is expanded further, close to ambient pressure,for supplementary carbon dioxide flashing. Thereafter the methanol stream is split; onepart is pumped back to the main absorber as semi-lean solvent, whereas the other part isstripped with low pressure nitrogen in order to recover the last heat of solution and therebydecrease the consumption of external refrigeration in the absorption process. The overheadgas (mainly carbon dioxide and nitrogen) is warmed up in the feed gas cooler.
The cold stripped methanol is heated and fed into the regeneration column, where all yetdissolved acid gases are stripped off by means of methanol vapour, generated in a steamheated reboiler. The lean methanol from the bottom is cooled and pumped back to the topof the main scrubber and to the top of the carbon dioxide scrubber. Methanol vapour iscondensed from the acid gas fraction before leaving the column overhead.
The methanol/water mixture from the bottom of the stripping column is separated in themethanol/water distillation column into methanol and water. The column again is heatedby steam, as reflux lean methanol is used. The methanol from the top supports the warmregeneration.
The acid gases from the flash column, the regeneration column and the benzene strippercolumn are collected and passed through a water wash column for removal of methanolbefore given to the sour gas treatment. The wash water is water from the methanol/water
RENEWA
Ecotraffic ERD3 AB Contract No. 4.1030/Z/01-119-2001December 2003
45
separation and demineralised water. The loaded water is routed back to the decanter fordiluting the methanol and for methanol recovery. A part of the water from themethanol/water distillation is given out of the process as waste water in order to bring outimpurities and balance the water of the Rectisol unit.
4.3.3.4 Sour gas treatmentFrom the regeneration step of the Rectisol, a hydrogen sulphide-rich sour gas comes out.The pre-cooled gas, finally washed with demineralised water, is fed to a Claus plant togenerate pure sulphur for commercial use. For the Claus plant the Oxyclaus process ischosen. As the hydrogen sulphide-rich gas from the Rectisol unit enters the Oxyclausplant, it is passed through a knock-out drum to remove any entrained liquids. From theknock-out drum the gas is routed to the Oxyclaus burner, which consists of a central burnercalled burner muffle, where LPG is burnt with air in heating purpose. Around the burnermuffle, a number of hydrogen sulphide burners are located. Each of these burners consistsof a central oxygen lance for oxygen supply and concentric mounted tubes for hydrogensulphide and air supply. All burners eject their hot flue gases into the Claus combustionchamber. In the combustion chamber, the hydrogen sulphide in the feed gas is converted toelemental sulphur by partial oxidation with oxygen and air. The air is supplied by an airblower.
The size of the Claus combustion chamber is suitably dimensioned to reach nearly thethermodynamic equilibrium in the flue gas from the hydrogen sulphide-burners. Thechemical reactions taking place in the Claus combustion chamber transform approximately50% of the hydrogen sulphide into sulphur vapour.
The chemical reactions occurring during the process are described by reactions 4-7 below,where reaction 4 is the net reaction of a number of hydrogen sulphide reactions in theClaus process, exemplified by reactions 5-8. The predominant reactions 4,5 and 8 arestrongly exothermic and the heat is used to generate MP-steam, parallel to precipitating thesulphur vapour as elemental sulphur. As the process gas is cooled down, the sulphur in theform of S2 is converted to higher atomic sulphur, i.e. for decreasing temperature the molarweight of the sulphur species increases.
2H2S + O2 l 2H2O + S2(g) (4)H2S + 3/2O2 t H2O(g) + SO2 (5)
H2S + CO2 t COS + H2O(g) (6)
2H2S + CO2 t CS2 + 2H2O(g) (7)
In the first Claus reactor hydrogen sulphide and sulphur dioxide are further catalysed toelementary sulphur according to reaction 8 in the presence of a catalyst.
2H2S + SO2 l 2H2O(g) + 3/2S2(g) (8)
Other sulphur compounds of the process gas are initially hydrolysed according toreactions 18-19 below.
COS + H2O(g) l CO2 + H2S (9)
CS2 + H2O(g) l COS + H2S (10)

RENEWA
Ecotraffic ERD3 AB Contract No. 4.1030/Z/01-119-2001December 2003
46
Upon leaving the first reactor, the process gas is cooled down in a sulphur condenser byproducing LP-steam. As the process gas is cooled down, the sulphur once again isconverted into higher atomic sulphur.
Prior to entering the second reactor, the process gas is reheated using HP-steam to reachthe proper reaction temperature. The reactor operates with a highly active aluminium oxidecatalyst that further converts the remaining sulphur compounds to elementary sulphur.
Downstream the second reactor the process gas is cooled in a sulphur condenser toprecipitate most of the sulphur vapour left in the gas. In the last sulphur condenser the gasis cooled by cooling water. Preceding the last sulphur condenser the process gas passes asulphur separator, a special separator with agglomeration of particles to compress the finemist droplets. Downstream the separator the Claus tail gas is routed to the flare forcombustion.
The converted liquid sulphur drains via double-shell traced pipes into sulphur collectingtank. The sulphur collecting tank is equipped with two submerged sulphur pumps whichare used to degas the sulphur (by circulating and spraying) and to transfer the sulphur tothe sulphur storage or to sulphur loading station.
4.3.4 Fuel synthesis
4.3.4.1 DME productionBased on a commercial methanol technology, the LPMEOH™ liquid phase process by AirProducts and Chemicals Inc, the methanol reactor can be converted to produce DME inone step by including a dehydration function in the catalyst. This increases the productivityof the reactor since the methanol formed is removed, which further shifts the equilibriumposition in the methanol formation reaction. The equilibrium shift results in higherconversions per pass and thus, more DME formed. This process, LPDME™, is alsocommercialised by Air Products and Chemicals Inc. Haldor Topsøe A/S has separatelydeveloped a DME catalyst, which converts synthesis gas into DME. This catalyst has,except the dual function for converting synthesis gas into methanol and further to DME,also activity for equilibrating the water gas-shift reaction. The process choice for thecurrent waste-to-motor fuel plant is the liquid phase reactor by Air Products and ChemicalsInc.
The synthesis of DME from the cleaned syngas involves compressing the syngas from thesyngas cleaning unit, and pre-heating it before entering the liquid phase DME reactorsystem. The compressor is equipped with a by-pass including a gas cooler, utilisingcooling water. The pressure downstream the compressor is controlled by a control valve atthe discharge of the compressor. A control valve, at the recycle of the compressor, controlsthe flow rate through the compressor by controlling upstream gasifier system pressure.This gas-recycle system, including cooler and return to the suction side, is provided toavoid surge conditions through the compressor during periods of low forward flow andduring the start-up phase. On occasions when the DME plant is unable to receive thesyngas, the flare system is designed to meet the capacity of produced syngas.
The reaction from synthesis gas to DME is a sequential reaction, involving methanol as anintermediate product. The first part of the reaction, i.e. synthesis gas to methanol is quiteexothermic and it is thermodynamically limited at a fairly low temperature. Therefore, thefirst part of the reaction takes place in a cooled reactor, where the reaction heat is

RENEWA
Ecotraffic ERD3 AB Contract No. 4.1030/Z/01-119-2001December 2003
47
continuously removed by generation of HP-steam, and the equilibrium may be approachedat optimum conditions.
The second part of the reaction from methanol to DME is much less exothermic, and theequilibrium is limited at a different temperature. Therefore, this part of the reaction takesplace in a separate adiabatic fixed-bed reactor.
In the DME synthesis section, the first step involves reacting hydrogen, carbon monoxideand carbon dioxide into methanol according to reactions 11-12, both exothermic.
CO + 2H2 l CH3OH (11)
CO2 + 3H2 l CH3OH + H2O (12)
The stoichiometry for these reactions implies a volumetric relation between the reactants,commonly written as equation 13 below:
2COCOCOH
2
22 ≈+− (13)
The purified and highly hydrogen enriched gas, thatenters the DME synthesis reactor has the compositionshown in Table 9. It could be seen that, after passingthrough the shift reactor and the sour gas cleaning, thenumber of compounds in the synthesis gas has beenreduced. The relation stated in equation 13, is around 2.3and the carbon dioxide content could probably beincreased from the low level in Table 9 to furtheroptimise the process.
The second reaction step including the formed methanolas reactant is the dehydration of methanol to from the di-methyl ether, shown in reaction14.
2CH3OH l CH3-O-CH3 + H2O (14)
In addition, some side reactions take place to a very limited extent, for instance formationof higher alcohols and the water gas-shift reaction shown in reactions 15-16.
2CO + 4H2 l CH3CH2OH + H2O (15)
CO + H2O l CO2 + H2 (16)Consequently, the two-stage reactor concept permits both steps of the sequential reactionfrom syngas to DME to take place at optimum conditions, while at the same time thesynthesis section becomes more similar to a conventional methanol synthesis loop. Withrespect to technology verification at industrial scale, the only major difference between theDME synthesis and the methanol synthesis is the second stage adiabatic reactor, loadedwith the proprietary dual-function catalyst.
The generated DME gas is then cooled in the economiser, followed by a cooling watercooler before separating the DME/methanol/water mixture from the unreacted syngas andinert gas. The separated gas is partly recycled to the feed gas while a small rest is washedwith methanol and sent as purge gas to the gasifier system.
Table 9. The gas compositionentering the DMEsynthesis step.
Compound %v
H2 68CO 28N2 3.2
H2O 0.53CO2 0.42

RENEWA
Ecotraffic ERD3 AB Contract No. 4.1030/Z/01-119-2001December 2003
48
4.3.4.2 DME separation and purification Given that the LPDME process does not generate chemical grade DME product duringthe synthesis, no provision for DME storage or extensive distillation is included. Ifflexibility is desired to make AA Chemical grade methanol or Chemical grade DME, suchcould be added at additional cost. Compared to methanol synthesis, the recovery of theDME is more complex as DME is gaseous at normal conditions and unconverted methanolmust be recovered for recycling.
The specific layout of the separation and purification section ultimately depends on thespecific demands for product purity. Naturally, lower demands on product purity result inlower investment and energy consumption. In fact, substantial savings are achieved byproducing fuel grade DME, i.e. DME containing minor amounts of methanol (7-8%) andwater (appr. 3%), compared to a chemical grade product. The specific heating value is onlyslightly lowered compared to pure DME. From a reference point of view, the direct DMEpurification section may be considered as a combination of a methanol distillation sectionand the purification section of a conventional DME plant based on methanol dehydration.In this case, water is also produced as a by-product and vents are to be recycled to be usedas fuel in the gasification unit.
4.3.4.3 DME storageBecause fuel grade DME has physical characteristics similar to LPG, fuel grade DME canleverage from the vast experience, mature technologies and proven equipment developedand used to handle LPG. Consequently, fuel grade DME can utilise LPG loading and off-loading, storage and shipping equipment and technology with only minor modifications.DME, like LPG, can be stored onshore in either a pressurised, semi-pressurised, orrefrigerated condition.
A crude DME vessel, designed for 16 hours of DME production volume, is used to storematerials that will be sent to the DME distillation section for purification. It acts as a bufferbetween the synthesis and distillation sections to maximise on-stream time. All off-specDME product and any contaminated water or methanol collected from the DME unit aresent to these tanks for processing in the DME distillation section.
Product DME from distillation flows to the DME day vessels, which are designed for16 hours of DME production, just as the crude vessel. These vessels are used to allow thetime required analysing its contents to ensure product quality before pumping to the largeproduct DME tank, designed for 4 days of DME production. All vessels are kept under apressurised nitrogen blanket to minimise venting and also to control pressure. Furthermore,each vent is routed to a collector pipe and sent to the flare.
Product DME is fed from the storage tank to the truck/rail car loading station. Prior toloading the fuel, the receiving vehicles are purged with nitrogen and vented through thevent collector to the flare.
4.3.5 Auxiliary systemsThe utility system of the complete gas to motor fuel system consists of some key features,including vent and flare system, steam and condensate system, cooling water system,emergency system and an air separation unit. These systems are needed to sustain the main

RENEWA
Ecotraffic ERD3 AB Contract No. 4.1030/Z/01-119-2001December 2003
49
systems of the plant, but they also provide potential links to external plants. Closely relatedto these systems, is the waste water cleaning unit and the slag discharge system.
4.3.5.1 Vent and flare systemThe produced syngas is normally consumed in the methanol/DME plant or used as fuel inthe pyrolyser and pilot burner in the gasifier. However, when these plant parts are notoperating, or when syngas cannot be forwarded to further treatment because of unspecifiedquality (during start operation or shut down), the syngas is combusted and exhausted toatmosphere via a flare. The flare system includes a knock-out drum for separating anyliquids from the stream, from which a bottoms pump forwards the collected liquid to thewaste water treatment for disposal. Because syngas is a clean burning fuel, the ground flaredoes not require any steam or air assist, although ignition is insured by a continuous fuelgas pilot. The fuel gas is possible to replace by purge and vent gas coming out of themethanol/DME distillation. The flare is capable of combusting maximum plant syngascapacity. A small fuel gas/vent gas purge is maintained through the flare header to thedrum and through the flare to prevent the ingress of oxygen back into the gas system.
Tail gases from the Claus plant and purge gas (nitrogen) from the pyrolysis, tank area andfrom buffer vessels are to be collected in a header line and sent to flare for combustion andfor safe discharge to atmosphere.
4.3.5.2 Steam and condensate system Boiler feed water (BFW) is the base for steam generation, divided into three differentqualities: LP-steam at 4 bar (a), MP-steam at 10 bar (a), and HP-steam at 40 bar (a). Thesestreams are utilising redundant BFW-pumps for the respective pressure level. Dependingon its temperature and pressure domain, every stream has a certain usage in the waste-to-motor fuel plant.
The steam and condensate systems are important items in parts of the complete waste-to-motor fuel plant, such as: the gasification plant, the gas treatment unit, the Claus plant andthe methanol/DME plant. Steam is required for different purposes, involving heating,process and cleaning medium. Formed condensates are to be collected, cooled and appliedas demineralised water in the sour gas wash water column. Remaining parts are possible tosend as boiler feed water to the boiler system.
Condensate is to be applied in the following areas:
• Heat Recovery During start and heating up
• Feed system Continuous
• Claus plant Continuous
• Rectisol regeneration Continuous
• Methanol/DME distillation Continuous
• Utility stations Clearing and washing.
During normal operation, a surplus of condensate is generated and a fraction of the waterhas to be exported to the boiler system. Some issues are site-specific and must beinvestigated further, for instance the use of MP-steam condensate for LP-steam generation.

RENEWA
Ecotraffic ERD3 AB Contract No. 4.1030/Z/01-119-2001December 2003
50
The LP-steam generated in the heat recovery and through the reactor cooling is used partlyfor heating purposes in the waste drying, partly for the reboiler at the columns in theRectisol regeneration unit as well as in the methanol/DME distillation. If desired, a systemfor generation of LLP-steam (2 bar (a)) in the heat recovery and in the Claus plant could beadded.
4.3.5.3 Cooling water systemHeat return from all cooling processes is transferred via cooling water to ambient. Thecooling tower will give a 5 ºC approach to summer wet bulb temperature of about 15 ºC,for a cooling water supply temperature of 20 ºC. Tower duty represents the heat duty of allconsumers of the complete plant at full load. Naturally, where available, heat sinks in lakesand rivers should be utilised. The available cooling water supply temperature from largelakes is maximum 10-15 ºC, depending on the depth. The lower temperature, compared tocooling towers, reduces the necessary size of heat transfer units and thereby the costsassociated with heat exchangers. Clarified river water is used as make-up water to thetower basin when cooling towers are used.
Each plant owns its own pump group operating with one running and one spare pump atdesign capacity. Before sending to the consumers the cooling water is filtered and checkedby pH-value and the conductivity. Biocide is stored in a vessel to prevent biologicalgrowth in the water system and is to be pumped to the basin.
4.3.5.4 Emergency systemThe emergency power supply system shall be used in case of a power failure to supplycritical equipment, such as cooling screen circuit, burner cooling circuit, process control,flare system or nitrogen purging. The emergency power supply system consists of twounits: an emergency generating set (Gen-set) and an emergency power distribution system(EPD).
The emergency generating set includes an automatically controlled diesel driven generatorset. In case of a power failure the diesel engine starts automatically and, after havingaccelerated to normal speed, automatically cuts in the generator voltage, the moment thelatter has stabilised.
4.3.5.5 Waste water treatmentThe waste water that is produced during pyrolysis (moisture from the input and productwater during the pyrolysis process) is cleaned in a conventional plant, in compliance withthe requirements specified by the plan approval. The biological waste water cleaning plantconsists of the following areas:
• Nitrite separation (reduction of ammonia)• Oxidation (cyanide, hydrogen sulphide decomposition)• Precipitation/flocculation (removal of heavy metals)
• Tower-type biological systems (CSB, phenol decomposition, denitrification)
• Filtration with subsequent activated carbon filter.
Only the cleaned waste water which complies with the guidelines for discharge to surfacewater is allowed to discharge continuously to the local waste water network. Another part
RENEWA
Ecotraffic ERD3 AB Contract No. 4.1030/Z/01-119-2001December 2003
51
of waste water is generated in the gasification system and during the heat recovery. Thiswaste water originates from the following sources:
• Waste water from the slag discharge
• Remaining quench water
• Wash water from the venturi circuit
• Waste water from the DME plant and from the Claus plant.
The treatment plant has to reduce a number of components, for instance solids (fineslag/soot), heavy metals, cyanide, ammonia, phosphate, carbonate, fluoride, sulphides andsalts.
To fulfil these demands, the waste water treatment plant consists of the following units:
• Slag discharge
• Water cooling and steam generation for the waste water vaporisation
• Separation of fine slag
• Precipitation/flocculation (removal of salts/soot/heavy metals).
The main part of the pre-treated waste water is recycled to the gasification system. Theremaining part is further treated by various methods, such as oxidation for cyanide andhydrogen sulphide decomposition, precipitation/flocculation/neutralization for removal ofadditional cyanide/sulphide and waste water vaporisation.
After cooling, the different liquid effluents, i.e. from the quench system, slag dischargeunit and the scrubbing water from the venturi scrubber, all contain fractions of fineparticulate matter, soot, salts and volatile heavy metal sulphides removed from theirrespective gas stream. The fine particulate matter is filtered, and any heavy metalcompounds are chemically precipitated, coagulated and filtered. The waste water pH isadjusted to precipitate metal hydroxides. Fine slag and precipitate are removed in aclarifier, thickened and dewatered using a fabric filter to separate the precipitate from thewaste water. The washed and dried filter cake is containerised for appropriate off-sitedisposal.
Waste water for discharge is further treated by cyanide oxidation, by means of hydrogenperoxide and the pH is adjusted by addition of sodium hydroxide. The last step in thisprocedure is the waste water vaporisation, where the heat of the waste water cooling isused. The generated concentrate is finally dried to a moisture content of about 15% beforebeing deposited.
4.3.5.6 Slag dischargeGenerated slag that is produced in the gasifier reactor granulates in a water bath in thebottom of the quench system. The slag, i.e. slag, fine ash, coke, soot and salts, dischargedfrom the quencher sump falls into a water-filled pressurised lock hopper. The slagdisplaces the water and an upper lock is closed. After cooling a lower lock is opened, andthe slag and any water remaining in the hopper are discharged into a slag receiving tank.
The major portion of the slag settles in the slag-receiving tank from where it is dischargedby means of screws, and may then be put to further utilisation. Water carried out of the

RENEWA
Ecotraffic ERD3 AB Contract No. 4.1030/Z/01-119-2001December 2003
52
slag discharge system are collected in a conveyor overflow and pumped to the waste watertreatment plant.
4.3.5.7 Air separation unit The oxygen required in the gasification process is delivered by a cryogenic air separationunit (ASU). Gaseous oxygen and nitrogen are provided with a pressure of 40 and 56 bar (a)respectively. The nitrogen delivered is an important part of the safety system and is alsoused to replace carbon dioxide when the gas cleaning process is not operating. In detail, themain parts of the ASU consist of:
• Air compressor with filter• Air cooler and air scrubber• Air cleaning and drying• Nitrogen compressor• Oxygen compressor• Refrigerator unit.
Nitrogen is supplied from the ASU as HP-nitrogen at 56 bar (a) for the gasifier and gasifiersupply systems as well as LP-nitrogen for start up processes and for purging. When carbondioxide is available from the gas cleaning unit and stable operating conditions have beenestablished, the process is switched over from HP-nitrogen to carbon dioxide, since thenitrogen content in the syngas should be minimised.
The nitrogen system for purging the oxygen lines is also part of the gasifier safety system.To prevent malfunction, the oxygen supply system must be technically segregated from thenitrogen supply system for purging pipelines and vessels bearing combustible gases. Toensure safe plant shut-down if nitrogen supply is interrupted, nitrogen is stored in buffertanks before supplied to the gasifier.
4.3.6 DiscussionThe availability of the complete waste-to-motor fuel plant is ensured using built-inredundancy. The plant is configured with a number of parallel trains, designed withsufficient over-capacity so that at least one process unit in delicate parts of the process, e.g.a gasifier or a pyrolyser, can be under maintenance (i.e. for n trains, n-1 would suffice thedesign spec.). The current setup is also due to physical limitations of the size of certainreactors. This is, apart from the larger capacity in the gasifier reactor, one explanation ofwhy the number of trains converges from five to three, since the mass flow of solid fueldecreases from the pyrolysis zone to the gasifiers. In total, the expected availability of theplant is around 8,000 hours per year. The availability of the plant is dependent on the fuelcharacteristics as well as the plant design, regarding environmentally and safety concepts.
The complex layout of the complete waste-to-motor fuel plant could be deepened furtherby including a biomass fired boiler. This would make the plant self-sustained on electricalpower, which otherwise has to be purchased from the national grid. The boiler would thenheat exchange the MP-steam from the waste-to-motor fuel plant against the boiler feedwater. Feeding steam at 40 bar (a) and 540 °C to the turbine, generating the required

RENEWA
Ecotraffic ERD3 AB Contract No. 4.1030/Z/01-119-2001December 2003
53
26 MWe (see Table 13), would then imply that the transferred net energy from the boilershould amount to around 9 MWth, if the steam were to be condensed at 20 °C.
The implementation of a biomass plant is only one possible solution. Making the totalwaste-to-energy plant self-sustained on electricity, however, gives a common basis forcomparison with other biofuel plants (see references in section 4.1). Another possibleconfiguration might include the production of district heating by heat exchanging theMP-steam against a district heating grid. The general relation between heat and powerprices probably makes this the most economical option. Therefore, the following sectionswill consider the district heating option, where electricity is purchased from the grid.
The current plant layout is, however, not claimed to be the most optimal, and it is always amatter of choice for the referred application to design the process. This, of course, isreflected in the investment cost as well. Depending on the site conditions, the choices varyfor the utilisation of surplus heat, whereof the district heating option has already beenmentioned. It could be possible to also deliver the MP-steam to nearby process plants,having electrical power in return or even using the steam in a condensing turbine togenerate additional power. The latter alternative results in an extra investment cost, whichhowever, could be economically feasible. Since these options are more of nichealternatives, they are not further investigated.
4.3.6.1 Feedstock characteristicsThe waste fuel characteristics put demands on every part of the process, and also determinethe plant layout. It is therefore important to get as well specified fuel as possible, to avoidlarge fluctuations in fuel quality. One significant parameter is the water content which, inspite of the drying process, affects the dimensioning and layout of for instance the steamand condensate systems. The water content of the delivered waste may vary with seasonand depending on its origin etc. It is therefore necessary to mix several fractions in thebunker to achieve a relatively homogeneous waste material, before feeding it to the dryingand pyrolysis sections. At this position, it is important that the fuel feeding system is non-compacting in order to get an even feed of fuel. Furthermore, large objects have to beremoved prior to the shredding unit, and metal contains should be removed by usingmagnets and eddy current separators for aluminium materials.
Another parameter of the fuel characteristics is the ash content. The ash content shown inTable 8, is the highest occurring limit value. Waste material is, however, often around 20%in ash content. For the operation of the gasifier, however, a waste fuel with high ashcontents could even be advantageous as the slagging characteristics improve. To ensure astable operation, the relatively high ash content calls for a high discharge capacity. This isone feature which is easily dealt with using an entrained flow gasifier, additionaladvantages and disadvantages of this gasifier technology are given below.
Advantages:
• Feedstock ash content between 1 and 45%
• Liquid, solid (grinded) or gaseous feedstock possible to gasify simultaneously
• No impact of aggressive slag on the inner contour of the reactor, caused by self-protecting surface
• Wide range of possible feedstock and feedstock mixture

RENEWA
Ecotraffic ERD3 AB Contract No. 4.1030/Z/01-119-2001December 2003
54
• Vitrified slag as by-product – non-leachable material
• Tar free syngas
• High lifetime and availability of reactor by special cooling screen design
• Very short start and shut-down period of the gasifier
• Low risk of blocking the reactor outlet
• Compact design
• Small footprint• High capacity.
Disadvantages:
• Feedstock preparation for gasifier feeding (pyrolysis, solid grinding, dense flowfeeding)
• Slow changes in feedstock composition – intimidate buffer necessary
• Heat loss by special cooling screen design
• Large exergy loss by quenching
• Special safety consideration necessary• Pilot burner.
4.3.6.2 Safety and environmental conceptThe safety philosophy of the pressurised gasification process by Future Energy starts outfrom undesired primary events inferred from the fire and explosion hazard analysis of theprocess and their danger potential. Said primary events can be classified by their causesinto three groups:
• Penetration of free, unconverted oxygen from the reaction chamber into thedownstream raw gas system involving the danger of explosive oxygen-fuel mixtureformation
• Exceeding the design pressure of the reactor and downstream plant• Exceeding the design temperature of the reactor/quencher.
Therefore, explosion and fire risk precautions including technological and safe-practicemeasures must avert said dangerous conditions with a high degree of reliability. Controland instrumentation field equipment necessary to meet said requirements has beenconsidered and included into the layout. It is characterised by the following features:
• Decoupling of control and monitoring functions
• Redundant or multi-redundant design of measuring systems, (e.g. flow ratemeasurement for oxygen and fuel)

RENEWA
Ecotraffic ERD3 AB Contract No. 4.1030/Z/01-119-2001December 2003
55
• Application of diversity systems to ensure special operation mode.
Said control signals are processed by special control systems (for example protectiveinterlocking systems, shut-down control mechanisms to establish safe plant condition).Control systems mentioned are either integral part of the higher-order supervisory controlsystem, or exist as separate control devices. Regarding the control system in general, thefacility control systems shall be tied through local PLC’s to a facility central controlsystem. It is assumed that a central control system will serve as the operator interface tomonitor and/or control the processes, alarm generation, report generation and dataarchiving.
Apart from the hazards related to gases produced in the process, there are numerous liquidstreams resulting from the plant. For instance, in the Rectisol process, the removed waterin the syngas stream is withdrawn as a waste water stream. Since there are tracecompounds from the gasification process purged with this stream, the waste water istreated in a biological water treatment unit.
Environmental impacts from air emissions could consist of odour and VOC, potentialsmog forming compounds. Thus, any evaporation losses of DME to the atmosphere shouldbe minimised and tanker filling will therefore be performed with equipment for pressurisedbottom filling. This will provide a user-friendly operation, which reduces manpower needsand simultaneously reduces the environmental effects. The transportation of LPG is alsoassociated with potential risks. The storage of large amounts of LPG has to be consideredin the fire and explosion hazard analysis, but is the transports that are associated with thelargest risk. Transportation of large amounts of LPG, either on road or railway, should beplanned with respect to preferred routes for hazardous materials. Furthermore, the numberof transports should be kept as low as possible due to the safety aspects.
4.4 Outlook of the manufacturing process Companies like Air Products and Chemicals Inc and Haldor Topsøe A/S (HT) havedeveloped an integrated process for the direct production of DME from synthesis gas,which has been demonstrated in pilot plants. This process can produce fuel grade DMEusing a converter catalyst with a function to take advantage of equilibrium conditions thatfavour the formation of DME over methanol. Because of the attractiveness of this processfor large scale fuel manufacture, BP Amoco and HT have entered into an alliance for thecommercial development of DME by this one-step manufacturing route. The new DMEtechnology is ready for commercialisation, but it may be emphasised that this newtechnology actually is a modified, methanol technology which has been practised for manyyears.
Due to the extensive catalyst testing and the simple adiabatic reactor configuration, thetechnology risk in the DME synthesis is minimal. Recent advances now permit theconstruction of large scale fuel grade DME plants which leads to further reduction inmanufacturing cost. Based on their extensive experience in syngas production, methanolsynthesis, and DME-related pilot plant work, HT and BP Amoco have identified proventechnologies for the construction of greenfield DME plants with capacities in the range of8,000-10,000 tons per day, based on natural gas.

RENEWA
Ecotraffic ERD3 AB Contract No. 4.1030/Z/01-119-2001December 2003
56
4.5 Local requirements
4.5.1 Space requirementsAmong the requirements on the site location isnaturally the physical space. The overall spacerequirement for the complete plant (includingstreets, parking places, distance areas, storageareas) is an area of 78,000 m2 (approximately350 x 220 m). The area used for buildings andstorages is 32,400 m2, giving a space factor ofabout 2.4 compared to the total area required.
4.5.2 Personnel requirementsThe expected manpower required for thecontinuous operation of the plant is shown inTable 10. This is the required personnel for thecontinuous operation of the plant, presumed to bein a four shift working mode. To estimate thepersonnel requirements for a plant, with only a fewor no references, is of course difficult. Further
automatisation in the operation, of for instance the waste take-over section, can beexpected to reduce the manpower required. Centralised control and surveillance systemsfor different units should trim down the number of employees needed for each unit. It ishowever, hard to reduce the personnel requirements very much, without having tooutsource activities. It should be remembered that a gasification plant differs from, forinstance a conventional power plant, in terms of complexity and therefore personnelrequirements. A plant of this kind should rather be compared to a chemical processindustry than a power plant.
In Table 10, the staff requirements are segregated with respect to the number of shifts. Anumber of professionals are only needed in the day-shifts, such as the supervisor, secretary,economist and the maintenance technicians. The four maintenance technicians areseparated into one electrician, two mechanics and one laboratory staff. The laboratoryposition is a one shift activity, examining samples collected by the night-shifts by therespective operators as well. This includes samples taken from the operation of the powerplant. Some, less sensitive processes, could be operated by a smaller staff. This is shownby lumping the gasifier and the Rectisol unit and the waste pre-treatment and the ASUplant respectively, into one operator each. The five operators handling the cranes in thewaste receiving are not possible to reduce, as the cranes must be manually operated for thefive individual lines.
4.5.3 LogisticsThe size of the current plant results in a large number of transports to and from the plantarea. These transports of fuel and products to and from the plant are crucial, since the fuelsupply to the plant must be continuous because of the technically advanced processesinvolved. Waste fuel is available all year around and provided five days a week. Most ofthe waste is transported to the plant by local waste management companies, but it is also
Table 10. Manpower requirements fora complete waste-to-motor fuel plant,with an annual waste capacity of400,000 tons.
Category Number
Supervisor 1
Secretary 1
Economist 1
Maintenance Technicians 4
Operators:
Waste take over 5 x 4
Waste pre-treatment/ASU 2 x 4
Gasifier/Rectisol 1 x 4
DME/Methanol unit 1 x 4
Waste water treatment 1 x 4
Total 47

RENEWA
Ecotraffic ERD3 AB Contract No. 4.1030/Z/01-119-2001December 2003
57
possible that a portion of the waste fuel is delivered fromreloading stations in nearby municipalities. In case offuture over-capacity of waste incineration, long-termcontracts with waste managers should be concluded.Transportation of waste over longer distances has, oncethe waste has been collected, a relatively small impact onthe total economics, energy consumption andenvironmental impact [9]. This plant is, however,presumed to be located in the direct vicinity of a middle-sized European city and relatively long distances are notrelevant.
The various material streams related to the operation ofthe waste-to-motor fuel plant, are transported by lorry onroad. Land transport by train is also a viable alternative,if possible with respect to the location. The majority of
all transports regards the waste delivery, which to avoid reloading vehicles, is most easilytransported by lorries. The loading capacity for road vehicles differs for the variousmaterials, depending on their density, and the different types of vehicles relevant to eachstream. The loading capacity for lorries is assumed to be 40 tons for bulk material exceptfor waste material. The loading capacity for waste is 7 tons for local lorries and 30 tons forlorries arriving from reloading capacities. The weighted average value, assuming 20% ofall waste transported from reloading stations, is 12 tons.
In Table 11 the transports by lorry are summarised for the various streams, based on theseload capacities. From this it is seen that the waste transport makes up the majority of alltransports, although the formed slag is also a significant post in the logistic scheme. Thenumbers presented are calculated as average values. Taken into consideration that waste isonly delivered five days a week, the waste transports increase to 140 lorries per day.
4.5.4 Additional requirementsAs indicated in the previous sections, cooling is essential for the operation of the plant. Innorthern Europe cooling towers are seldom used, because of the easy access to coolingwater in coastal areas as well as rivers and lakes. In this study, a cooling tower has beenincluded, which allows operation in other than coastal areas. Water is also often used forfeed water, since large industrial units rarely are connected to the district water supply. Themake-up water is fed to the water treatment plant before being used in the processes.
There is also need of LPG, for instance in the safety and flare system and the Claus unit.Where available, LPG should be substituted with natural gas which is relatively commonin Europe. The natural gas grid is, however, not considered to cover the general region ofinterest in this study, even though the plans for further expansion in Europe according tothe guidelines on trans-European energy networks perhaps will change this. The differencein heating values, between natural gas and propane is only slight and the mass balance isexpected to be unchanged in large, no matter what fuel is chosen.
The required supply of LPG was calculated to approximately 209 Nm3/h, whichcorresponds to 149 kg/h. On the plant site, LPG is stored in pressurised, vertical tanks towhich the gas is transported either by tank lorries or train, depending on the localconditions. These lorry tankers have a loading capacity of 25 tons, which result in an
Table 11. Average number oflorry transports, in caseall transports are madeby lorry 7 days a week.
Material stream Lorries/day
Waste 100
Slag 12
DME 3
LPG < 1
Sulphur < 1
Total 115

RENEWA
Ecotraffic ERD3 AB Contract No. 4.1030/Z/01-119-2001December 2003
58
average transport of less than one lorry a day, as shown in Table 11. Using transportationby train, the loading capacity is 45 tons, but this calls for auxiliary equipment for un-loading the LPG from the train. The pressure under which the LPG is stored depends onthe ambient temperature, but is usually 2-9 bar (a). Based on the annual consumption of1,300 tons, the required tank volume is around 300 m3. Whether this volume should becomprised in a single tank, or two smaller, has to be decided considering leasing contractsand investment costs, required maintenance/inspections and matching delivery capacitywith the tank capacities etc.
Other waste streams, such as the sulphur and slag products should be found a market for.Finding purchasers for the relatively small amount of sulphur produced should be possibleon a chemical market for elemental sulphur, for instance to the paper industry. Thecontracted price is however, likely to be lower than the market price because of the smallervolume, perhaps lower quality and discontinuous deliveries. The formed slag would besafe to put in landfill, but its attritional and inert characteristics make it useful; for instance,slag from the waste gasification plant in Karlsruhe, Germany, has been used as blastingmaterial. Blasting sand has usage outside the lacquer industry and may be used in drillingoperations as well. The treatment of the slag to fulfil the requirements on blasting sandcould mean an additional investment. The slag is more likely to be used as road filling orconstruction material, which also eliminates the cost for depositing the slag formed. As afirst and conservative alternative in this study, the slag is deposited, which implicates costsfor landfill deposits. Over longer time-period contracts should be established for otherallocation of the slag stream.
4.6 Mass and energy balancesThe total mass and energy balances of the plant have been calculated. This section, inlarge, comprises the work made by Future Energy, extended with an exergy analysis. Itshould be emphasised that the current scenario, is the “worst case” using a waste fuel withash and heating value in their upper and lower regions respectively, as shown in Table 8.
The calculation is based on a one load case using waste with a relatively low heating value,resulting in the largest size of equipment/plant by a relatively low energy/productgeneration. This worst case could show the point of lowest efficiency of the plant. Basedon the results, an overall mass balance, including all units, is generated to show finalproducts, by-products and wastes as well as the demand of utilities and feedstock by usinginterconnections among the units.
4.6.1 Assumptions for calculationParameters, prices, and costs used to calculate the cost of fuel grade methanol produced inthe plant are given in Table 12. All amounts appearing in the context of this report arerecalculated from the different currencies using the exchange rates given in the lower partof Table 12. The currency used in running text is EUR for consistency, whereas the basisfor calculation often is expressed in other currencies.
The parameters are intended to be realistically set even though some values, such as theoperational hours for heat, may be applicable to Northern Europe only. The ambienttemperature is exclusively used in the exergy analysis and its value is rather conservativelychosen. Another technical assumption made, is the quality of the produced DME. The

RENEWA
Ecotraffic ERD3 AB Contract No. 4.1030/Z/01-119-2001December 2003
59
product is classified as fuel grade and therefore contains small quantities of water andmethanol. This fact has been neglected when calculating the mass and energy balances, i.e.energy balances are based on the heating value for pure DME.
The construction period is expected to be two years in total, ranging from foundation tocomplete waste-to-motor fuel plant. To this time period comes the commissioning phase.The total time should therefore be close to 2.5 years before the plant is in commercialoperation.
4.6.2 Results of the mass and energy balances by unitIn Table 13, governing mass and energy balances of the complete waste-to-motor fuelplant are shown. From Table 13, information about the main product streams, theconsumption materials and the process effluents could be withdrawn. Basis for generatingthese mass and energy balances are separately developed computer models for gasificationand gas cooling with water gas-shift reaction respectively. For evaluation of balances forthe pyrolysis, the Rectisol process, the DME plant, the ASU and the Claus plantrespectively, material from potential suppliers was used and adapted to the conditions ofthe given study.
Performance characteristics for the gasifier system, including the quench, have been takenfrom special firm models by Future Energy, calculated by assuming chemical equilibriumat the exit of the gasifier, and adapted to the gasification of waste materials. The gascomposition leaving the gasifier was taken as the starting point in the thermodynamicmodelling (using CHEMCAD™) of the following processes of gas treatment. The production
Table 12. Project assumptions during the study
Project assumptions
Financial year Q3 2003
Inflation 2.0 %
Interest rate on debt 7.0 %
Project lifetime 20 years
Operational hours 8,000 hours/year
Operational hours, heat 5,000 hours/year
Ambient temperature 10 °C
Fuel and product costs and prices, incl. tax
- Waste fuel gate fee 14 EUR/MWh
- District heating 32 EUR/MWh
- Electricity 33 EUR/MWh
- Slag deposit 44 EUR/tonne
- Sulphur 25 EUR/tonne
Exchange rates: 7.74 SEK/USD; 9.12 SEK/EUR (Stockholmsbörsen AB, 3 June 2003)

RENEWA
Ecotraffic ERD3 AB Contract No. 4.1030/Z/01-119-2001December 2003
60
of different sorts of steam for use in the complete system was also included in themodelling.
Downstream process steps (methanol/DME synthesis, methanol/DME distillation, ASU,Claus plant) were modelled based on performance estimates obtained from vendors. Tosimplify the analysis, pressure losses were neglected, except where the loss is substantial,i.e. through the high-pressure methanol synthesis unit. The compression preceding theDME synthesis was assumed to be completed in a single stage, with a polytropic efficiencyof about 85%. Some of the information used in the calculations, mainly concerning theDME synthesis step and the ASU unit, has been derived from in-house knowledge ofNSAB, and adjusted to the current application.

RENE
WA
Eco
traf
fic E
RD
3 AB
Con
trac
t No.
4.1
030/
Z/0
1-11
9-20
01D
ecem
ber
2003
61
Tabl
e 13
.Pl
ant o
vera
ll m
ass a
nd e
nerg
y ba
lanc
es, d
ivid
ed o
n th
e in
divi
dual
pro
cess
uni
ts.
unit
AS
US
hred
der
D
ryer
Pyr
olys
isFe
edin
gG
asifi
er
Que
nch/
SD
W
WT
Hea
t re
cove
ry
CO
shi
ft
Gas
Tr
eatm
ent
[REC
]D
ME
Pla
ntC
oolin
g To
wer
/Util
ity
Flar
eC
laus
Pla
ntB
io-W
WT
Tank
S
tatio
nTo
tal
Pro
duct
sD
ME
m³/h
10.6
10.6
DM
Etp
d17
0.3
170.
3C
O2
Nm
³/h-1
449
-310
0 18
455
1390
6N
itrog
en
Nm
³/h85
952
-520
8 -2
00
-783
1 -8
0 0
-160
02
0-2
00
-229
-2
50
5595
1M
P S
team
/ 10
bar
tph
86,1
822
,82
109,
00H
P S
team
/ 4
0 ba
rtp
h0,
89-1
,05
-0,1
7 S
ulph
urkg
/h33
333
3C
onsu
mpt
ions
Cat
alys
t t/
a-2
0 -1
1 -3
1 LP
GN
m³/h
-150
-5
9 -2
09
LPG
(S
tart
)N
m³/h
-854
0 -1
60
-50
-875
0 N
itrog
en (
Sta
rt)
Nm
³/h-1
159
-144
0 -1
475
-500
-4
574
Rive
r Wat
erm
³/h-1
80
-180
LP
Ste
am /
4,1
bar
tph
-31,
02
-0,7
5 -1
,29
7,93
7,86
-1,2
7 -2
,83
4,21
-17,
15
Out
put
Sla
gkg
/h30
285
3028
5V
ents
Nm
³/h14
583
7625
2428
655
621
0230
149
453
Was
te w
ater
m³/h
4,72
55,0
20,
34,
066
Was
te w
ater
Sol
ids
kg/h
471
471
Inte
rnal
Air
Nm
³/h-1
5886
0 -1
5886
0 B
FWm
³/h-8
,1
-96,
8 -7
-3
2,90
-1
45
Con
dens
ate
m³/h
31,0
20,
371,
291,
291,
39,
41,
0645
,70
Coo
ling
Wat
erm
³/h94
610
1912
0725
078
338
031
494
100
5209
Dem
in W
ater
m³/h
-41
-41
Nitr
ogen
LP
Nm
³/h-5
208
-200
-5
821
-100
-2
50
-115
80
Nitr
ogen
HP
Nm
³/h-2
010
-80
-160
02
-100
-2
29
-184
21
Oxy
gen
Nm
³/h23
976
-205
00
-339
4 -8
1 0
Slu
dge
m³/h
-0,5
4 0,
540
Syn
gas
Nm
³/h-1
3338
-2
50
2546
811
880
Pow
er C
omsu
mpt
ion
kW90
0018
9250
1091
470
950
410
5100
1834
1155
7227
2617
3


RENEWA
Ecotraffic ERD3 AB Contract No. 4.1030/Z/01-119-2001December 2003
63
4.6.3 Yields and efficienciesThe calculation of the mass and energy balances is performed for the case where electricpower is purchased to cover the intern needs. The background for the calculations is given byTable 13, where the steam production can be seen, as well as the power consumption in thecomplete waste-to-motor fuel plant. According to Table 13, the configuration chosen resultsin purchase of 26 MW electric power and a DME production of 170.3 tpd from the 151 MWcontained in the waste input.
These results can be summarised in a Sankey diagram, Figure 11, graphically showing the in-and output energy streams, regarding the complete waste-to-motor fuel plant. The data used togenerate this figure can be seen in Table 14, where apart from the energy terms, also the massbalance is shown. Here, mass and energy flows of input streams, i.e. waste, electric power andLPG, are presented as well as the product streams of DME and district heating. From thistable, it is concluded that approximately 1% of input energy is LPG, 15% electric power andthe rest as waste fuel.
Although the slag granulates transfer much of their thermal energy content to the waterreservoir in the gasifier bottom, there is still a certain amount of sensible heat that cannot bewithdrawn, as well as unburned carbon. There is also heat associated with the inert fractionleaving the pyrolysis ovens. An approximation on the amount of energy in slag and inerts isthe 5 MW stated in Table 14, which makes about 3% of the total energy output [10]. Becauseof the uncertainty of this value, it is not included in the exergy analysis.
The plant configuration also allows for district heating, amounting to some 25.3 MW or 14%of the total output. The mass flow stated is within parenthesis, since the flow is dependant onthe temperature differences (here assumed to be 40 °C). This relatively low value reflects the
Table 14. Mass and energy balances of the complete waste-to-motor fuel plant
Stream Mass flow [tph] Energy [MWth]
Input
Waste material (LHV, 20% moisture) 50 151.4
Electric power - 26.2
LPG 0.1 1.8
Total: - 179.4
Output
DME (LHV) 7.1 55.8
District heating 545 25.3
Sulphur 0.33 -
Slag 20 5.0
Losses - 93.3
Total: - 179.4
DME yield 14.2% (mass) 31.1% (energy)

RENEWA
Ecotraffic ERD3 AB Contract No. 4.1030/Z/01-119-2001December 2003
64
fact that no major efforts have been made to withdraw all generated waste heat as districtheating. A more extensive study should address the optimisation of each process unit, andthereby maximise the district heating yield. As energy is a conservative property, thedifference between the sum of the different output stream and the input streams representlosses in the system. Losses, in most cases are unrecoverable heat, either as low-grade hotwater or heat released via flares in the safety system.
The desired products, DME and district heating, amount to 81 MW or 45% of the output. Thatis, the total energy efficiency of the waste-to-motor fuel plant is 45%. The DME yield is 31%on an energy basis and 14% on mass basis of the waste input. This implicates that the rest, ismade up of losses (the energy contained in slag and inerts is also losses, since they are notrecovered).
4.6.4 Exergy analysisTo further shed some light on the advantages of the gasification technology compared toconventional incineration an exergy, or availability, analysis is made. Exergy is a propertythat could be used as a complement, or instead of, the energy concept. Regarding energy only,there is a penalty in producing a higher-value product as the process is more complex and thetotal losses increase. Differently put, it is easier to achieve high energy efficiencies in anincineration plant producing district heating only compared to the current gasification plantwhere a high-quality product is synthesised. Exergy is a property that discriminates betweenthese two product streams, considering not only the energy contained; exergy puts values ondifferent kind of energy types depending on their nature, or their potential of use. Thisindicates that electricity has higher exergy than thermal heat (electricity and work is pureexergy) and steam has higher exergy than hot water (more contained energy per mass unit).This also indicates that exergy, unlike energy, is not conserved during a process.
After the brief introduction to exergy given above, the analysis of the total waste-to-motorfuel plant is given. That is, putting the boundaries around the complete plant area. In Table 15
Was
te-to
-DM
E pl
antWaste
151 MW
El power26 MW
LPG2 MW
DME56 MW
Other losses93 MW
Districtheating25 MW
Slag5 MW
Figure 11. Sankey diagram showing the qualitative relative sizes of the in and outputenergy streams to the waste-to-motor fuel plant. Arrows are not to scale;exact figures are shown in Table 14.
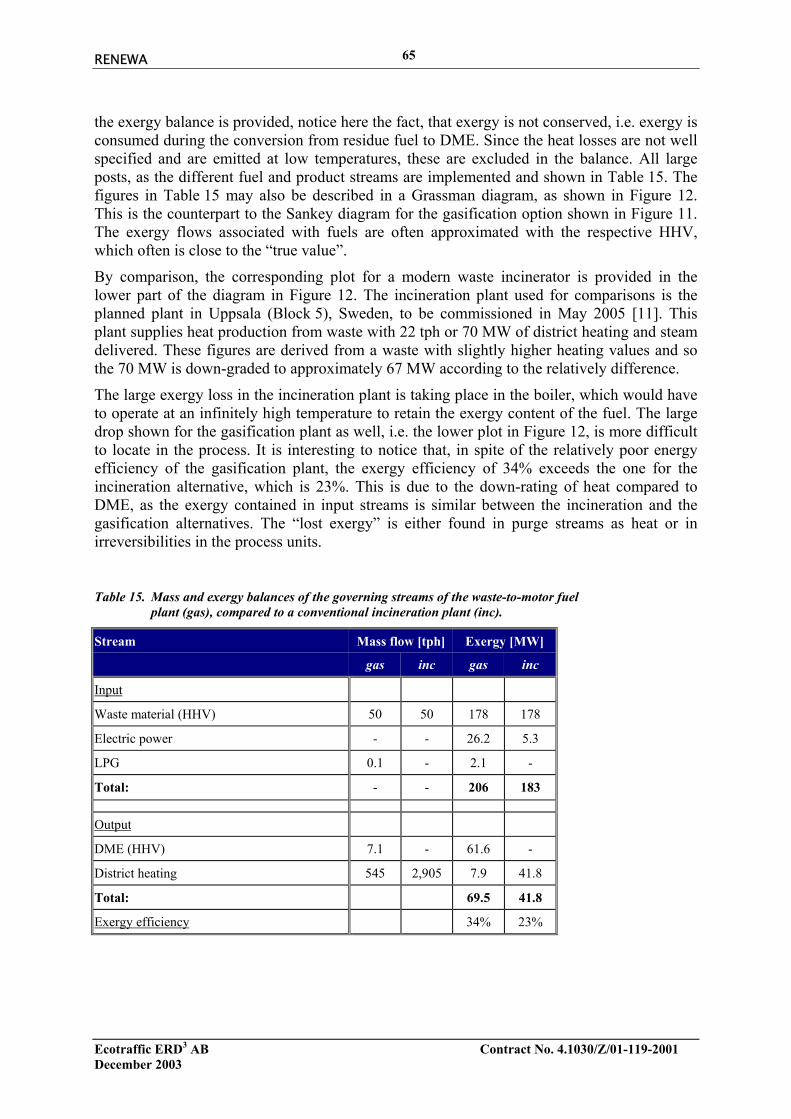
RENEWA
Ecotraffic ERD3 AB Contract No. 4.1030/Z/01-119-2001December 2003
65
the exergy balance is provided, notice here the fact, that exergy is not conserved, i.e. exergy isconsumed during the conversion from residue fuel to DME. Since the heat losses are not wellspecified and are emitted at low temperatures, these are excluded in the balance. All largeposts, as the different fuel and product streams are implemented and shown in Table 15. Thefigures in Table 15 may also be described in a Grassman diagram, as shown in Figure 12.This is the counterpart to the Sankey diagram for the gasification option shown in Figure 11.The exergy flows associated with fuels are often approximated with the respective HHV,which often is close to the “true value”.
By comparison, the corresponding plot for a modern waste incinerator is provided in thelower part of the diagram in Figure 12. The incineration plant used for comparisons is theplanned plant in Uppsala (Block 5), Sweden, to be commissioned in May 2005 [11]. Thisplant supplies heat production from waste with 22 tph or 70 MW of district heating and steamdelivered. These figures are derived from a waste with slightly higher heating values and sothe 70 MW is down-graded to approximately 67 MW according to the relatively difference.
The large exergy loss in the incineration plant is taking place in the boiler, which would haveto operate at an infinitely high temperature to retain the exergy content of the fuel. The largedrop shown for the gasification plant as well, i.e. the lower plot in Figure 12, is more difficultto locate in the process. It is interesting to notice that, in spite of the relatively poor energyefficiency of the gasification plant, the exergy efficiency of 34% exceeds the one for theincineration alternative, which is 23%. This is due to the down-rating of heat compared toDME, as the exergy contained in input streams is similar between the incineration and thegasification alternatives. The “lost exergy” is either found in purge streams as heat or inirreversibilities in the process units.
Table 15. Mass and exergy balances of the governing streams of the waste-to-motor fuelplant (gas), compared to a conventional incineration plant (inc).
Stream Mass flow [tph] Exergy [MW]
gas inc gas inc
Input
Waste material (HHV) 50 50 178 178
Electric power - - 26.2 5.3
LPG 0.1 - 2.1 -
Total: - - 206 183
Output
DME (HHV) 7.1 - 61.6 -
District heating 545 2,905 7.9 41.8
Total: 69.5 41.8
Exergy efficiency 34% 23%

RENEWA
Ecotraffic ERD3 AB Contract No. 4.1030/Z/01-119-2001December 2003
66
Figure 12. Grassman diagrams, describing exergy flows, for waste gasification and wasteincineration respectively. The size of each stream is not to scale; figures areavailable in. Table 15.
4.6.5 OptimisationIn view of the results in Table 13, the optimisation should be carried out with emphasise onthe pyrolysis unit, which together with the shredder unit, consumes large amounts of energyand syngas. The energy consumption in the ASU is fixed and related to the compressions inseveral stages and the ASU is therefore not subject to any optimisation. The DME yield couldbe increased if the internal syngas consumption would be lowered, creating a larger available
Was
te-to
-DM
E pl
ant
District heating
Wastematerial
El power
DME
LPGIn
cine
ratio
n pl
ant
District heating
Wastematerial
El power

RENEWA
Ecotraffic ERD3 AB Contract No. 4.1030/Z/01-119-2001December 2003
67
feedstock to the DME reactor. This could be achieved by using LPG or natural gas, NG,where available, instead of the syngas in the heating of the pyrolysis kilns. Replacing allsyngas with NG could double the DME yield, although lowering the total plant efficiency.That is, replacing syngas with NG is not energetically favourable. This scenario also movestowards the current DME plants, using NG as feedstock and thus reducing the environmentalbenefits of the current plant setup.
The total DME efficiency could also be increased by using nitrogen, instead of carbondioxide, as fluidising medium in the transportation of coke from the pyrolysis. This wouldresult in more carbon dioxide available for synthesis and therefore higher carbon efficiency.This increased carbon efficiency would, however, result in more nitrogen in the syngas, whichaffect the downstream DME reactor negatively. This would also affect the powerconsumption of the ASU negatively because of a larger throughput of air. The absolutebenefits of this configuration must be further investigated.
As previously discussed, the district heating output could be increased by assessing eachprocess unit more thoroughly. A total plant efficiency of 45% must be considered low,whereas the DME yield is more feasible. To improve the efficiency as well as the economics,the largest potential lies in reducing the losses from the current level of 93 MW.
4.7 EconomicsThe economics of a complex process plant such as the current is hard to establish on a fairbasis. As a complete plant, the operational costs and revenues are relatively easy to establish,but this does not constitute a fair comparison to conventional incineration plants. The mainpurpose of thermochemical conversion of waste is to minimise the waste stream to bedeposited and also to provide district heating (and in some cases electrical power). Thesepurposes are fulfilled with the gasification plant as well, but there are also additional productstreams generated. This fact is most justly described by calculating the alternative costs forinstalling a gasification plant instead of an incineration plant and dividing that additional costwith the produced amount of DME. Theoretically, this sounds straightforward, but it might betroublesome to correctly estimate what part of the total cost that is the alternative. Thisdiscussion is continued in the subsequent sections, where both the complete plant costs andthe alternative, or incremental, costs are examined.
4.7.1 Investment cost estimateThe investment cost for the complete plant is given as a turnkey sum, including engineeringwork, procurement, civil, approval and permission, license and commissioning of all parts,including staff training, of the plant. Besides, all process related plants, buildings, bins, allauxiliary systems, loading station, streets, landscape gardening measures, drainage and ditchsystems (without biological clarification system), fencing and office, and social buildings areincluded. Construction, interest during construction, commissioning and unspecified costs arestated separately in Table 16. The investment costs are based on comparable investmentestimates of the units, resulting in a cost estimate within ±30%. Units not included in thislump sum are for instance: wheel loader, forklift truck, spare and wear parts, costs for expertsduring approval, office consumption material, tools and cleaning facility, computer/networksystem/software/telephone system. Compared to the included units, the latter are minor partsof the total investment cost.

RENEWA
Ecotraffic ERD3 AB Contract No. 4.1030/Z/01-119-2001December 2003
68
Without discriminating between the different plant units, the cost of the complete waste-to-motor fuel plant amounts to 346 million EUR, seen in Table 16. It may be concluded thatsome parts of the plant involves larger uncertainties than other, less commercially proventechnologies. Since there are no commercial waste-to-motor fuel plants of this kind, alearning effect reducing the operational as well as the investment cost could be anticipated.This would lower the investment cost as the number of erected plants increases. Every waste-to-motor fuel plant will, however, be more or less unique on every new site, depending on thespecific requests of the customer. Thus, the benefits from the learning effect are somewhatreduced to mainly comprise engineering knowledge, still, it will always be beneficial toestablish a broadened in-house knowledge. Many of the included process units are, however,well-known techniques, usually expensive units, and hard to further reduce the cost for, unlessthe process is modified in order to optimise their size.
The learning effect on the cost development for a complicated plant, similar to this kind ofplant, could be illustrated by Figure 13, showing the specific cost development for differentphases of development. The status of the current project is probably intermediate the firstcommercial service and available for commercial order position in the figure. According tothis data, the cost is not likely to decrease very much from the current level of development;rather the cost is increasing towards the first commercial plant. From this first commercialplant to the n:th, however, the relative cost reduction is significant.
The relatively high investment cost reflects the complexity of the plant. There is, for instance,several process units divided on five lines. This is an expensive configuration, as well as theseparate units are expensive. The total cost for the shredders and pyrolyser, divided on fivelines and the feed preparation and the gasifier, which are divided into three linesis 140 million EUR, or 40% of the total cost for the waste-to-motor fuel plant. The control
Table 16. Investment costs, broken down into functional parts for thecomplete waste-to-motor fuel plant. Additional assumptionsare stated below.
Investment costs MEUR
Equipment and assembly (a) 280
Construction costs (b) 29.4
Interest during construction period © 19.6
Start-up and commissioning costs (d) 3.0
Unspecified costs (e) 14.3
Total investment cost 346
a) Equipment and assembly (EA) covers all relevant process units of the plant, control system, wastewater cleaning and engineering etc.
b) Construction cost includes construction and foundation work, calculated as 10.5% of EA.
c) Interest during construction has been estimated with principal payments during 1.5 years at aninterest rate of 7%
d) Start-up and commissioning has been estimated as 3 million EUR
e) Unspecified costs are taken as 5% of equipment and assembly

RENEWA
Ecotraffic ERD3 AB Contract No. 4.1030/Z/01-119-2001December 2003
69
and electric systems are also contributing significantly to the plant cost, as well as the ASU,the DME and the Rectisol units. Smaller costs, below 6 million EUR, are the Claus plant andthe heat recovery system.
4.7.2 Operation cost estimateBased on the investment cost and the economical assumptions made in Table 12, productioncosts can be broken down into some large components shown in the left part of Table 17.From this table it can be seen that the dominant post is the capital cost. In the same order ofmagnitude are the revenues from the waste, whereas slag is deposited for a lower costof 7 million EUR. The gate fee used in this calculation is only 44 EUR/tonne, which is a lowand conservative estimate even for MSW. In a real installation, the MSW may be mixed withcommercial and industrial wastes as well, which are objects to higher gate fees. It should berecalled that the strength in gasification technology is to handle troublesome waste that is hardto process in conventional incineration plants. Such wastes, for instance liquid fractions,could well command gate fees exceeding 100 EUR/tonne.
The sales of elementary sulphur are practically negligible, amounting to less than a millioneuro a year. The staff cost is also minor in comparison, contributing to the operating cost withonly 2.3 million EUR annually. The salaries are included in the operation and maintenancecost, housing the catalyst cost as well. It could also be reasoned that some costs are left-out,for instance real estate for building site. This cost is however site-specific and rather includedin the unspecified cost of the investment than in the operational cost.
TimeTime
Con
stan
tC
onst
ant D
olla
r Cap
ital
Dol
lar C
apita
l C
ost
Cos
t /Uni
t of
/Uni
t of C
apac
ityC
apac
ity
Simplified cost estimate with incomplete data
Development period costestimates
Estimate Actual
Available for commercial orderPreconstruction and licensing period
Finalized cost estimateDesign/construction period
First commercial serviceSecond plant in service
Third plant in service
Fourth plant in service
Fifth plant in serviceMature plant cost
Figure 13. Generic capital cost trend for early commercial units of new power planttechnology, based on technical assessment guide by EPRI.
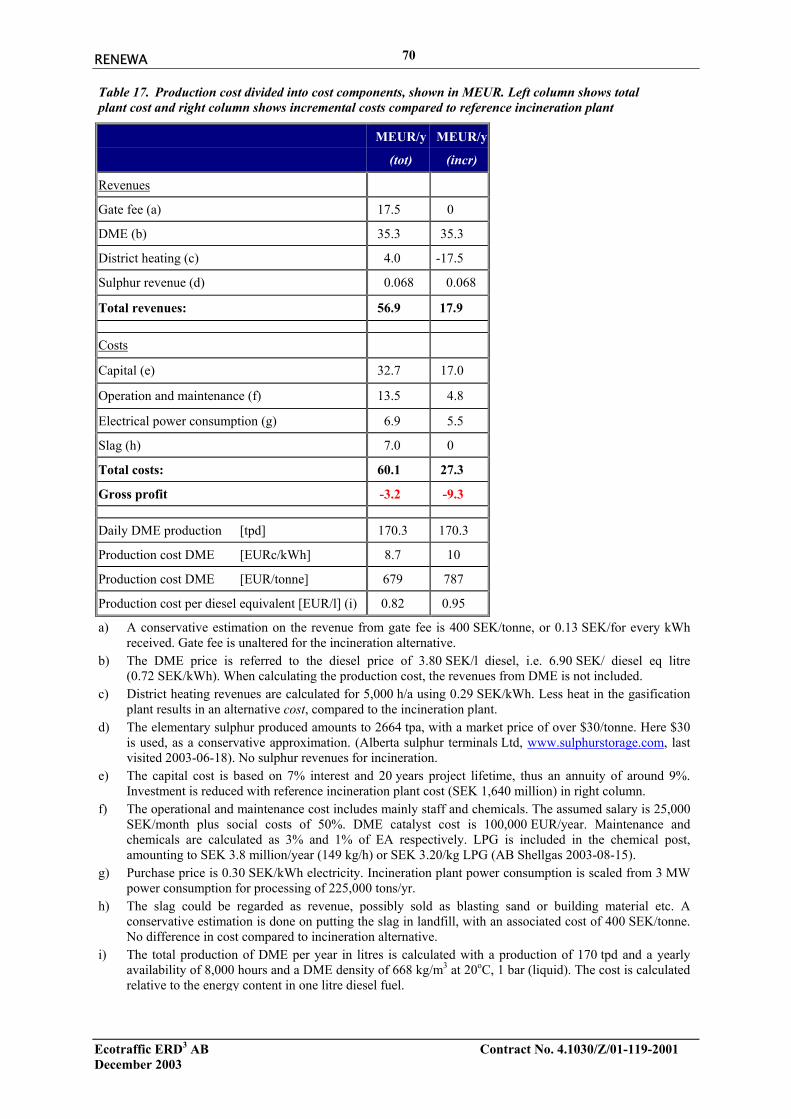
RENEWA
Ecotraffic ERD3 AB Contract No. 4.1030/Z/01-119-2001December 2003
70
Table 17. Production cost divided into cost components, shown in MEUR. Left column shows totalplant cost and right column shows incremental costs compared to reference incineration plant
MEUR/y
(tot)
MEUR/y
(incr)
Revenues
Gate fee (a) 17.5 0
DME (b) 35.3 35.3
District heating (c) 4.0 -17.5
Sulphur revenue (d) 0.068 0.068
Total revenues: 56.9 17.9
Costs
Capital (e) 32.7 17.0
Operation and maintenance (f) 13.5 4.8
Electrical power consumption (g) 6.9 5.5
Slag (h) 7.0 0
Total costs: 60.1 27.3
Gross profit -3.2 -9.3
Daily DME production [tpd] 170.3 170.3
Production cost DME [EURc/kWh] 8.7 10
Production cost DME [EUR/tonne] 679 787
Production cost per diesel equivalent [EUR/l] (i) 0.82 0.95
a) A conservative estimation on the revenue from gate fee is 400 SEK/tonne, or 0.13 SEK/for every kWhreceived. Gate fee is unaltered for the incineration alternative.
b) The DME price is referred to the diesel price of 3.80 SEK/l diesel, i.e. 6.90 SEK/ diesel eq litre(0.72 SEK/kWh). When calculating the production cost, the revenues from DME is not included.
c) District heating revenues are calculated for 5,000 h/a using 0.29 SEK/kWh. Less heat in the gasificationplant results in an alternative cost, compared to the incineration plant.
d) The elementary sulphur produced amounts to 2664 tpa, with a market price of over $30/tonne. Here $30is used, as a conservative approximation. (Alberta sulphur terminals Ltd, www.sulphurstorage.com, lastvisited 2003-06-18). No sulphur revenues for incineration.
e) The capital cost is based on 7% interest and 20 years project lifetime, thus an annuity of around 9%.Investment is reduced with reference incineration plant cost (SEK 1,640 million) in right column.
f) The operational and maintenance cost includes mainly staff and chemicals. The assumed salary is 25,000SEK/month plus social costs of 50%. DME catalyst cost is 100,000 EUR/year. Maintenance andchemicals are calculated as 3% and 1% of EA respectively. LPG is included in the chemical post,amounting to SEK 3.8 million/year (149 kg/h) or SEK 3.20/kg LPG (AB Shellgas 2003-08-15).
g) Purchase price is 0.30 SEK/kWh electricity. Incineration plant power consumption is scaled from 3 MWpower consumption for processing of 225,000 tons/yr.
h) The slag could be regarded as revenue, possibly sold as blasting sand or building material etc. Aconservative estimation is done on putting the slag in landfill, with an associated cost of 400 SEK/tonne.No difference in cost compared to incineration alternative.
i) The total production of DME per year in litres is calculated with a production of 170 tpd and a yearlyavailability of 8,000 hours and a DME density of 668 kg/m3 at 20oC, 1 bar (liquid). The cost is calculatedrelative to the energy content in one litre diesel fuel.

RENEWA
Ecotraffic ERD3 AB Contract No. 4.1030/Z/01-119-2001December 2003
71
It should be emphasised that the uncertainties in most of the figures in Table 17, ultimatelydepends on the site conditions and what agreements that may be contracted. If slag may beapproved as building material, to be used in roads for instance, this may constitute revenuesinstead of the cost shown. Furthermore, the process may be configured for additional powerproduction.
As discussed in the beginning of this section, the total cost, as well as the operating costs,associated with the implementation of this waste-to-motor fuel plant could be handleddifferently. The main argument for using this approach is that when a municipality isdiscussing to erect an incineration plant, it is the incremental cost for choosing thegasification plant instead that is relevant. That is, the same functions are delivered with thegasification plant as with the incineration plant; the total amount of waste to be deposited isreduced and heat could be produced. Above these features, automotive fuel is delivered. Thecost per unit DME or methanol produced should therefore not be calculated with respect tothe complete plant cost, but to the additional cost for the gasifier choice.
Since the district heat production in this specific configuration is smaller than for theincineration alternative, there is a negative sign on the district heating revenue in Table 17. Inother words, this makes an alternative cost. The amount of waste is reduced, however, andthus the, perhaps, main purpose is fulfilled. The reference incineration unit used is the same asused in section 4.6, in the exergy analysis. The estimated cost for this plant is 110 millionEUR. To compare this with the gasification plant, the waste capacities are scaled with aconservative exponent of 0.6, resulting in a total investment cost of 180 million EUR. Theincremental capital cost for the gasification plant is the difference in capital costs between thewaste-to-motor fuel plant investment cost of 346 million EUR and the 180 million EUR forthe reference incineration plant.
The comparison to this plant, as well as the absolute costs and revenues associated with thewaste-to-motor fuel plant, is shown in Table 17. It is noticed that the total incremental cost forbuilding a gasification plant, instead of an incineration plant, exceeds the absolute cost. Thisis related to the large revenues from the waste, which naturally is the same for both theincineration and gasification alternatives, and the revenues from district heating sales that isless for the gasification alternative. The somewhat lower capital cost and the negativeelectricity cost, when considering the incremental cost only, does not compensate for theincineration plant revenues from district heating and the higher operation cost.
When comparing the revenues between the absolute and the incremental part, a price has beenput on the DME. This price has been calculated from the current price on diesel fuel. Theprice on the DME therefore equals the consumer diesel price in energy terms, which is takenas 0.76 EUR/litre diesel equivalent. The use of the DME price is limited to the comparisonwith the incineration plant and when calculating the production cost for DME, this revenue isobviously excluded. As seen from the last rows in Table 17, the production cost marginallyexceeds this diesel equivalent price. Considering the “worst case” scenario and most of thecosts taken on their conservative boundary, this small difference is not frightening. See forinstance the sensitivity study addressing the influence from a relatively small increase intipping fee in Figure 14. A gradually increasing fuel price for conventional, fossil, fuels in thenear future will decrease the difference further and make the waste-to-motor fuel conceptindeed viable.

RENEWA
Ecotraffic ERD3 AB Contract No. 4.1030/Z/01-119-2001December 2003
72
4.7.3 Production cost sensitivityThe cost for producing DME is dependent on various input parameters in the calculation. Thiseffect from important parameters on the DME cost is easily visualised in a sensitivityanalysis, altering the parameters within reasonable intervals. This is done varying one variableat a time, and the variables chosen are: availability in hours per year, price on the wastematerial and the total investment cost, shown in Figure 14 to Figure 16. Each parameter isallowed to vary approximately 75 to 130% relative to the base case, where the base case isshown as vertical lines in the plots. On the primary y-axis the production cost per litre DME isshown, whereas the secondary y-axis shows the cost of one diesel-equivalent litre. That is,compensating for the lower energy content per kg in the DME as well as for the lowerdensity, according to Table 29.
In varying the gate fee for receiving waste, the break even price is identified with respect tothe DME production cost. The waste revenue is also the second largest income, which resultsin a sharp climb of the graph in Figure 14 From this figure, the price on waste correspondingto the break-even cost of DME could be seen as approximately 1.7 EURc/kWh of waste. Theavailability has a rather limited effect on the DME cost in the examined interval, shown bythe slowly descending graph in Figure 15. This indicates that the fixed costs are less importantcompared to the operating costs. The dominating fixed cost is the capital cost, which is variedin Figure 16. The steep slope indicates a proportional relationship between the DME cost andthe investment cost. The large sensitivity towards the investment cost implicates that this costshould be determined as exactly as possible, and preferably minimised. The break-even costfor DME is reached just below 320 million EUR, all other parameters fixed.
As the ash content used in this study is rather high, it would be interesting to also calculate theDME production cost when the ash content is reduced. In Figure 17 the ash content is reducedfrom the 40%wt used as the reference case, down to 20%wt representing, perhaps morecommon MSW compositions in Sweden. The change in ash content, is mainly affecting thedeposit cost for the formed slag, but it is of course also affecting the heating value of thewaste fuel. That is, keeping the amount of delivered waste fixed, the heat input is increased.Considering the additional heat input ending up proportionally in the DME output, neglectingchanges in district heating output etc., it could be seen in Figure 17 that the DME cost is verydependant on the ash content. Notice, however, that the scale is somewhat different comparedto Figure 15to Figure 16. Figure 17 shows the importance of the waste composition andsimilar plots could be generated for various moisture and carbon fractions etc.

RENEWA
Ecotraffic ERD3 AB Contract No. 4.1030/Z/01-119-2001December 2003
73
DME Production Cost vs. Waste Fuel Cost
0,36
0,41
0,46
0,51
0,56
-1,09 -1,16 -1,23 -1,30 -1,38 -1,45 -1,52 -1,59 -1,67 -1,74 -1,81 -1,88
Fuel Cost, €c/kWh
EUR/litre
0,65
0,70
0,75
0,80
0,85
0,90
0,95
1,00
1,05
EUR/diesel equivalent litre
Figure 14. DME production cost in EUR/litre and EUR/litre diesel equivalent,versus the gate fee expressed in EURc/kWh waste fuel.

RENEWA
Ecotraffic ERD3 AB Contract No. 4.1030/Z/01-119-2001December 2003
74
DME Production Cost vs. Availability
0,36
0,41
0,46
0,51
0,56
6 300 6 500 6 700 6 900 7 100 7 300 7 500 7 700 7 900 8 100
Operation Hours/Year
EUR/litre
0,65
0,70
0,75
0,80
0,85
0,90
0,95
1,00
1,05
EUR/diesel equivalent lit re
EUR/diesel equivalent lit re
Figure 15. DME production cost in EUR/litre and EUR/litre diesel equivalent versus theplant availability.
DME Production Cost vs. Investment Cost
0,36
0,41
0,46
0,51
0,56
260 280 300 320 340 360 380 400 420 440
Investment Cost , million EUR
EUR/liter
0,65
0,70
0,75
0,80
0,85
0,90
0,95
1,00
1,05
EUR/diesel equivalent litre
Figure 16. DME production cost in EUR/litre and EUR/litre diesel equivalent versusinvestment cost.

RENEWA
Ecotraffic ERD3 AB Contract No. 4.1030/Z/01-119-2001December 2003
75
DME Production Cost vs. Ash Content
0,28
0,33
0,38
0,43
0,48
0,53
0,58
18 22 26 30 34 38 42
Ash Content mass-%
EUR/liter
0,60
0,65
0,70
0,75
0,80
EUR/diesel equivalent litre
Figure 17. DME production cost in EUR/litre and EUR/litre diesel equivalent versus ashcontent, expressed in mass-% (as received).
4.7.4 FeasibilityAlthough the economical analysis generates a somewhat high cost for the producedDME, 680 EUR/tonne DME, a cost that is roughly 50% higher compared to the productioncost for DME derived from natural gas (438 EUR/tonne DME [12]), the implementation ofthe discussed plant may still be legitimate. There are for instance, several parameters that canbe varied in order to optimise the economics of this plant. Combining this plant with a powerplant and exchange process steam for electric power would be a feasible solution, reducingthe net purchase of electric power. Since the capital cost makes the dominant part of the totaloperating cost, efforts should be made to reduce the total investment either by choosing analternative process or reducing the number of lines.
Contacts have been taken with additional vendors of both alternative gasification processesand pre-treatment units for the waste material. Without further presenting the informationreceived, the data implies that the complete waste-to-motor fuel plant could be optimisedwhen examining the apparatus in each unit operation separately. There seems to be potentialfor lowering the investment cost with more than 25%, conservatively estimated. Theoptimisation and evaluation of different process alternatives should be the scope of a futurestudy. The derived fuel prices from the current study are, however, not extreme whenconsidering previous studies on fuel production via biomass gasification. Further optimisationin investment cost, process configuration and trimming operating parameters should thereforehave the potential to generate a competitive fuel, possibly even compared to fossilcounterparts. This assumption is based on tax-exemptions for “green fuels”.
Countries using gasification extensively as waste reduction method, e.g. Japan and Germany,often see the method as a cleaner way of waste reduction compared to conventionalincineration. The main purpose is, hence, often to decrease the amount of waste to be put ondeposit and not to derive products such as automotive fuels. These products would rather be

RENEWA
Ecotraffic ERD3 AB Contract No. 4.1030/Z/01-119-2001December 2003
76
considered as valuable by-products. The main objective is reflected in the gate fee, which isset to a market value without referring to the energy content. Waste is thereby not consideredas fuel in the same sense as biofuel or coal etc. It could be noted that the price (for theprovider to pay!) used on waste currently is in the same order as biofuel ( 1.1 EURc/kWh).Increasing the gate fee to, say, 90 EUR/tonne (3.0 EURc/kWh) would result in a DME cost of24 EURc/litre, according to the current calculations. This aspect is also reflected in theprevious production cost sensitivity analysis and illustrated by Figure 14, although theboundary is not that broad. It should be kept in mind that, in European countries e.g. Holland,Germany, Norway and Denmark, the average gate fee in all cases exceeds 79 EUR/tonne(corresponding to 2.6 EURc/kWh). Germany and Norway both have taxes on incineration aswell, which reduces this gross revenue. Still, in a European perspective the gate fee used inthe reference case is far lower than the average value.
The current study has focused on the production of DME. This implies that the derivedresults, in large, are equally true for methanol production instead. The major differences lie inDME reactor, and the dehydrating function of the catalyst. Excluding this second reactor, theinvestment is slightly reduced as well as the operating cost related to maintenance. Theconfiguration in the distillation step would also be altered, but the investment cost is likely tobe unchanged. The storage tanks do not have to be pressurised, which would also lower theinvestment cost. An improved yield in the synthesis step will lower the specific cost formethanol.
It is obvious that gasification of waste to produce an automotive fuel is a very feasibleprocess, generating a production cost relatively close to the one using fossil feedstock inmuch larger plants. The great benefit of waste gasification is the revenues associated with thefuelstock as well as the derived product. This revenue-in revenue-out concept makes a largerinvestment cost more legitimate.
4.7.5 ConclusionsIn view of the process description part in chapter 4 some important conclusions are made. Theproduction of automotive fuels via gasification of waste is a technically feasible process,generating a DME yield of 31% on an energy basis. The single process layout investigated,given a certain waste composition with high inert content, results in a production cost forDME of 0.82 EUR/litre petrol equivalent, using the assumptions stated in Table 12. A futurestudy should investigate the potential for alternative processes, which could be more energyefficient. The investment cost is higher compared to conventional incineration plants, as wellas the personnel requirements are higher. The waste-to-motor fuel plant thereby fulfils, inprinciple, the same targets as the incineration plant, to a higher cost. This is compensated byan additional, higher quality product stream. This also results in a higher exergy efficiency forthe gasification configuration than for the incineration alternative, calculated as 34 and 23%respectively. The gasification alternative has a lower energy efficiency than the incinerationplant, but the flexibility is higher, as well as the utilisation of waste as feedstock for anautomotive fuel is exergetically favourable.

RENEWA
Ecotraffic ERD3 AB Contract No. 4.1030/Z/01-119-2001December 2003
77
5 QUESTIONNAIRE SURVEY ON BARRIERSThe objective of this phase is to carry out a survey of the barriers for the utilisation of biomassfrom waste. These barriers comprise of a variety of different areas, such as technology,economy, legislation and environmental impact. The Stakeholder Group has had an essentialrole in the accomplishment of this work.Questionnaires were sent to members of the reference group and other important persons inthe field of waste management. Respondents were asked to characterise the barriers inquestion as either “Very important”, “Important”, “Not important” or “Don’t know”. Inaddition there was a possibility for the respondents to enter comments connected to eachindividual barrier. After each of the three main barrier groups the respondents were also giventhe possibility to suggest other barriers connected to each main group.
The results are shown below, indicating for each of the barriers how many of the respondentsgave the respective characterisation. All the comments are also shown.
5.1 Barriers connected to input material (waste):1.1. Waste incineration/gasification may be in conflict with goals of waste reduction,
increased product reuse and material recycling.
3 Very important3 Important 4 Not important0 Don’t know
Comments:
• Recycling will always be the first alternative. What is left will be gasified or incinerated.• There is a conflict between energy recovery and material recycling. This conflict has been
very apparent in Sweden. There may also be a conflict with waste reduction. Thehousehold waste in Sweden has increased about 20 % during the last ten years. Thegovernmental policies have stimulated increased material recycling and increasedincineration, but not the waste reduction.
• In a system where energy from waste stands for a reasonable share of the energy demandthe waste as fuel could be replaced by wood fuels (chips, pellets) which can normally beused in waste incinerators.
• Since reasonable decisions about a balance between the alternatives can be taken ongrounds of fact, there is no in-built conflict other than a political one.
1.2. Waste incineration/gasification may be in conflict with goals of more biological wastetreatment.
1 Very important4 Important 4 Not important1 Don’t know
Comments:
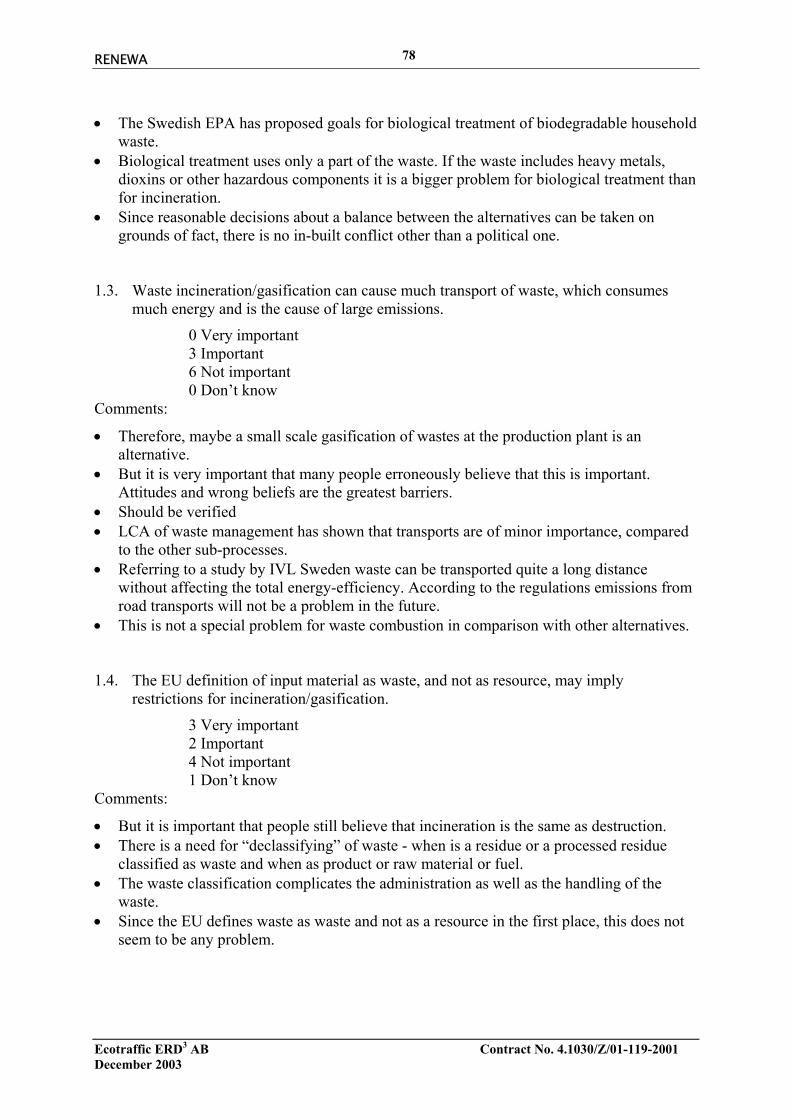
RENEWA
Ecotraffic ERD3 AB Contract No. 4.1030/Z/01-119-2001December 2003
78
• The Swedish EPA has proposed goals for biological treatment of biodegradable householdwaste.
• Biological treatment uses only a part of the waste. If the waste includes heavy metals,dioxins or other hazardous components it is a bigger problem for biological treatment thanfor incineration.
• Since reasonable decisions about a balance between the alternatives can be taken ongrounds of fact, there is no in-built conflict other than a political one.
1.3. Waste incineration/gasification can cause much transport of waste, which consumesmuch energy and is the cause of large emissions.
0 Very important3 Important 6 Not important0 Don’t know
Comments:
• Therefore, maybe a small scale gasification of wastes at the production plant is analternative.
• But it is very important that many people erroneously believe that this is important.Attitudes and wrong beliefs are the greatest barriers.
• Should be verified• LCA of waste management has shown that transports are of minor importance, compared
to the other sub-processes. • Referring to a study by IVL Sweden waste can be transported quite a long distance
without affecting the total energy-efficiency. According to the regulations emissions fromroad transports will not be a problem in the future.
• This is not a special problem for waste combustion in comparison with other alternatives.
1.4. The EU definition of input material as waste, and not as resource, may implyrestrictions for incineration/gasification.
3 Very important2 Important 4 Not important1 Don’t know
Comments:
• But it is important that people still believe that incineration is the same as destruction.• There is a need for “declassifying” of waste - when is a residue or a processed residue
classified as waste and when as product or raw material or fuel. • The waste classification complicates the administration as well as the handling of the
waste.• Since the EU defines waste as waste and not as a resource in the first place, this does not
seem to be any problem.

RENEWA
Ecotraffic ERD3 AB Contract No. 4.1030/Z/01-119-2001December 2003
79
1.5. Poor quality of input material (waste) is a barrier for making gasification economicallyfeasible.
3 Very important6 Important 1 Not important0 Don’t know
Comments:
• But there are techniques, which can be used to gasify low quality wastes. • I think gasification is more sensitive than incineration.• The variation in quality is the biggest problem. Especially if syngas for fuel production is
to be produced. • Partly this depends on exactly what sources and applications that we consider.
1.6. Increases in number of incineration plants might out-compete gasification regardingavailable waste material.
2 Very important5 Important 3 Not important0 Don’t know
Comments:
• Today incineration and gasification often are seen as competing methods. If thegasification technology becomes successful, incineration and gasification may havedifferent markets.
• Since incineration is less demanding than gasification as regards homogeneity, thesemethods do not necessarily compete for the same wastes.
1.7. The requirement of very homogenous input material (waste) can be a limitation of thegasification technology.
4 Very important5 Important 1 Not important0 Don’t know
Comments:
• We should try to develop technologies which can also work with heterogeneous wastes• Some techniques have lower requirements on fuel quality• I think gasification is more sensitive to the input than incineration.• To some extent it is a limitation but since we get more out of gasification, it may be more
advantageous for some special wastes, not least for production wastes that cannot berecycled in the industry.

RENEWA
Ecotraffic ERD3 AB Contract No. 4.1030/Z/01-119-2001December 2003
80
1.8. Are there other barriers connected to input material (waste) that you considerimportant? Give a short description of these.
• Various materials will require different types of gasifiers but also the fuel gas cleaningsystems. Thus cost of installation is also dependent on type of wastes gasified.
• The goal for material recycling is a problem. Today there is a lot of recycling which canneither be motivated by energy saving, nor by material saving or general environmentalreasons. In north Europe it is even doubtful to recycle paper when the alternative is toburn it for district heating.
• Cost of purifying the syngas from catalyst-poisoning elements coming from the waste.• We do not see any!
5.2 Barriers connected to the gasification/incineration process(plant conversion system):
2.1. Incineration of waste is producing air emissions and is spreading pollutions through thedisposal of ash.
1 Very important4 Important 5 Not important0 Don’t know
Comments:
• Dependent on technique, solutions are available• The problem is that people do not believe in what modern flue-gas (can achieve?)• LCA of incineration has shown that incineration is a rather “clean” method.• It is a long-term problem, of making the land-fillings into potential risk areas.• Every alternative has its own environmental disadvantages, and a fair comparison
cannot be done by just pointing out disadvantages of one of the alternatives. Airemissions and emissions from ash disposal are smaller problems today than they havebeen. The resource issue seems to be more of a problem than the one of emissions.
2.2. Gasification of waste is producing air emissions and is spreading pollutions through thedisposal of ash.
1 Very important2 Important 6 Not important0 Don’t know
Comments:
• Therefore, we should focus on techniques which are free of such problems• LCA of gasification has shown that gasification is a rather “clean” method.• Gasification does not generate dioxins. • Every alternative has its own environmental disadvantages, and a fair comparison cannot
be done by just pointing out disadvantages of one of the alternatives. Air emissions andemissions from ash disposal are smaller problems today than they have been. The resource

RENEWA
Ecotraffic ERD3 AB Contract No. 4.1030/Z/01-119-2001December 2003
81
issue seems to be more of a problem than the one of emissions.
2.3. The new EU incineration directive might constitute a barrier to waste incinerationthrough stringent emission restrictions.
1 Very important4 Important 5 Not important0 Don’t know
Comments:
• Modern incinerators fulfil these demands • In Sweden there is an expanding incineration capacity, despite the incineration directive.
The directive may be a barrier to bad, unqualified waste incineration.• It may be a problem that already existing incineration plants for other fuels, which are
suitable for waste as well but not allowed for it, do not want permits for wasteincineration, because they would then be treated like waste incineration plants all over,facing more stringent emissions restrictions than necessary for all other fuels.
2.4. The new EU incineration directive might constitute a barrier to waste gasificationthrough stringent emission restrictions.
1 Very important2 Important 6 Not important0 Don’t know
Comments:
• Does not interfere• Large scale can carry the cost• If gasification shall have a future, it must be better than incineration.• Considering the extremely dioxin-free and NOx-free process of low-oxygen gasification
under high pressure, this is less of a problem for gasification than for incineration.
2.5. Gasification is a high-risk technology for investors due to its complicity, requiring largescale production in order to be commercially feasible.
6 Very important3 Important 1 Not important0 Don’t know
Comments:
• But the real problem is what to do with the gas. If you just burn it you could as well justselect incineration.
• History has shown that there are a lot of gasification projects that have failed, whileincineration is a successful technology!

RENEWA
Ecotraffic ERD3 AB Contract No. 4.1030/Z/01-119-2001December 2003
82
• It is most important for fuel production since the fuel have to be price-competitive withgasoline and diesel oil.
• Gasification can be feasibly performed in small plants (an on-going project at KTH showsthis).
2.6. Gasification is not a politically favoured technology as of today.
3 Very important2 Important 2 Not important3 Don’t know
Comments:
• Gasification has to show both good qualifications and that it is a sustainable technology,before it can be favoured.
• If gasification could be shown to contribute by making use of some waste fractions thatotherwise would give less return, there should be no political obstacle. The real problem isthat politicians know too little about all alternatives including gasification, and not leasthow to combine them optimally.
2.7. The fact that the gasification technology is not well known, with no demonstrationplants, while incineration technology is well known, might constitute a barrier togasification.
7 Very important1 Important 2 Not important0 Don’t know
Comments:
• Existing demonstration plants have not made enough progress, so there is not manycommercial installations.
• Concrete technology demonstration is a key issue in this respect.
2.8. Are there other barriers connected to the gasification/incineration process that youconsider important? Give a short description of these.
• Properties of wastes influence design of gasifier. Therefore, we must develop gasificationprocess for some specific group of wastes
• Gas cleaning processes are not demonstrated widely with gasification. Lack of market andsuppliers, trained operators and other skilled personnel.
• Prejudice based on the bad environmental performance of old incineration plants.

RENEWA
Ecotraffic ERD3 AB Contract No. 4.1030/Z/01-119-2001December 2003
83
5.3 Barriers connected to the products (fuel, power, heat)
3.1. The regulations for transportation of dangerous goods may be barriers for the increaseduse of fuels from gasification (DME and hydrogen - explosion hazard, methanol toxicand water soluble - spillage hazard).
2 Very important1 Important 6 Not important1 Don’t know
Comments:
• Depending on the fuel• Needs to be addressed• The products should be of minor importance. Probably waste will substitute other raw
material, so the amount of fuel is independent of how much waste that is gasified.• Technical solutions are available so it is not a problem. The cost for distribution of
hydrogen is a very important barrier.• This should not be more difficult to handle than for a lot of other chemical products out on
the roads.
3.2. The EU taxation act, which allows tax-exemption for pilot tests only, is an importantbarrier for increased use of biofuels.
4 Very important3 Important 2 Not important1 Don’t know
Comments:
• But the description is not correct• This is because 1) the environmental cost of fossil fuels tends not to be fully reflected by
today’s pricing/taxation on the market and 2) relative cost advantages tend to be anunavoidable prerequisite for the initial build-up of new systems, competing with wellestablished old solutions.
3.3. The cost of products from gasification is too high for competitiveness with productsobtained by other routes.
3 Very important5 Important 1 Not important1 Don’t know
Comments:
• Without respect to taxes and a full LCA • Gasification of biomass to motor fuels is costly compared to fuels from natural gas. • It may even be very important but is not within our best expertise to comment!

RENEWA
Ecotraffic ERD3 AB Contract No. 4.1030/Z/01-119-2001December 2003
84
3.4. Electricity and heat from gasification can be produced cheaper by incineration.
5 Very important2 Important 1 Not important2 Don’t know
Comments:
• It is site dependent, not generally.• Established methods usually have a cost advantage!
3.5. The necessary technology is not yet developed for use of biofuels from gasification(methanol – corrosivity and cold-start problems, fuel cell vehicles – far fromcommercial stage).
3 Very important3 Important 4 Not important0 Don’t know
Comments:
• Considering low blend, more important for higher blends• Problems are over-exaggerated by opponents. If there is a will to change, it is very
possible.• More experience is needed.• The technology for using methanol is developed and the auto industry is well aware of
what is required. Methanol can and have been used in Otto and diesel engines and couldbe introduced as low blend in petrol immediately. Piston engines for DME and hydrogenare in a development phase.
• There still seems to be some R& D needed in these respects.
3.6. Are there other barriers connected to the incineration and gasification products that youconsider important? Give a short description of these.
• Gasification products depend on properties therefore the products cleaning system mustbe adjusted to its properties and type of the equipment which will utilise the gas (gasengine, fuel cell or gas turbine, chemical process)
• Today there is no market demand for methanol, DME or hydrogen. That is the majorbarrier for syngas fuels. FTD (Fischer Tropsch Diesel) could easily be blended inconventional diesel oil but the production is not as energy effective as for methanol, DMEand hydrogen. To be competitive as motor-fuel there must be long term tax exemptions.
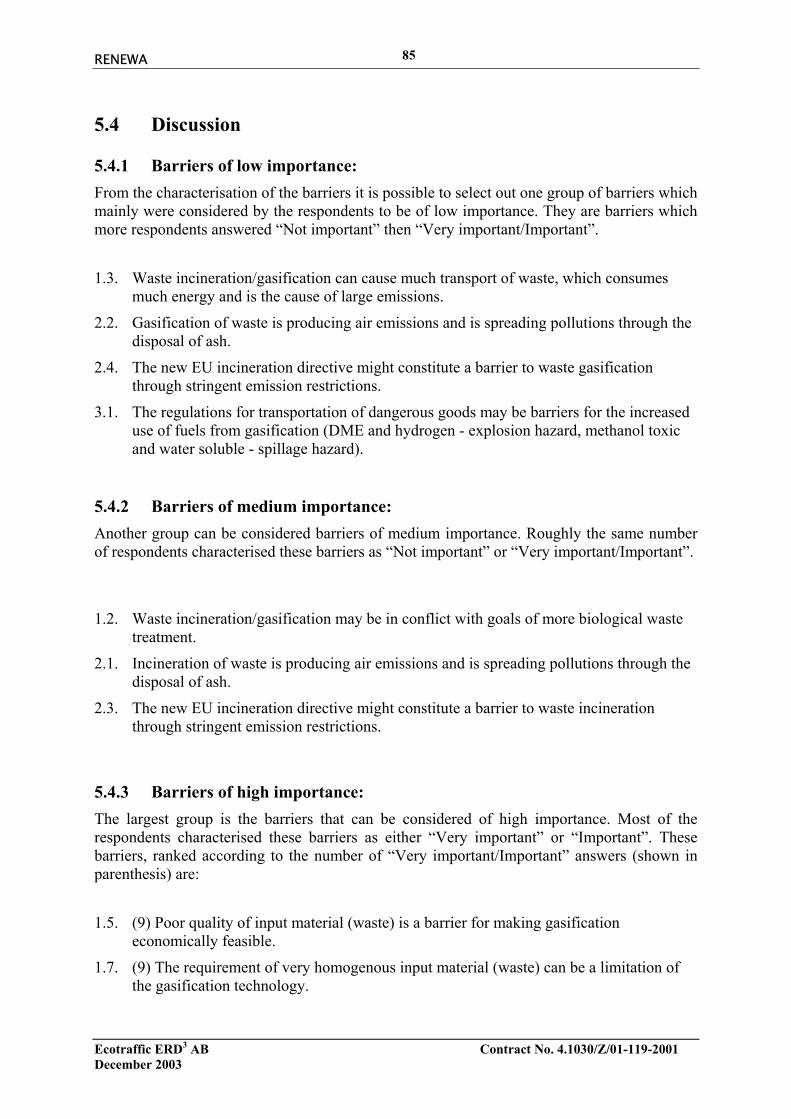
RENEWA
Ecotraffic ERD3 AB Contract No. 4.1030/Z/01-119-2001December 2003
85
5.4 Discussion
5.4.1 Barriers of low importance:From the characterisation of the barriers it is possible to select out one group of barriers whichmainly were considered by the respondents to be of low importance. They are barriers whichmore respondents answered “Not important” then “Very important/Important”.
1.3. Waste incineration/gasification can cause much transport of waste, which consumesmuch energy and is the cause of large emissions.
2.2. Gasification of waste is producing air emissions and is spreading pollutions through thedisposal of ash.
2.4. The new EU incineration directive might constitute a barrier to waste gasificationthrough stringent emission restrictions.
3.1. The regulations for transportation of dangerous goods may be barriers for the increaseduse of fuels from gasification (DME and hydrogen - explosion hazard, methanol toxicand water soluble - spillage hazard).
5.4.2 Barriers of medium importance:Another group can be considered barriers of medium importance. Roughly the same numberof respondents characterised these barriers as “Not important” or “Very important/Important”.
1.2. Waste incineration/gasification may be in conflict with goals of more biological wastetreatment.
2.1. Incineration of waste is producing air emissions and is spreading pollutions through thedisposal of ash.
2.3. The new EU incineration directive might constitute a barrier to waste incinerationthrough stringent emission restrictions.
5.4.3 Barriers of high importance:The largest group is the barriers that can be considered of high importance. Most of therespondents characterised these barriers as either “Very important” or “Important”. Thesebarriers, ranked according to the number of “Very important/Important” answers (shown inparenthesis) are:
1.5. (9) Poor quality of input material (waste) is a barrier for making gasificationeconomically feasible.
1.7. (9) The requirement of very homogenous input material (waste) can be a limitation ofthe gasification technology.

RENEWA
Ecotraffic ERD3 AB Contract No. 4.1030/Z/01-119-2001December 2003
86
2.5. (9) Gasification is a high-risk technology for investors due to its complicity, requiringlarge scale production in order to be commercially feasible.
2.7. (8) The fact that the gasification technology is not well known, with no demonstrationplants, while incineration technology is well known, might constitute a barrier togasification.
3.3. (8) The cost of products from gasification is too high for competitiveness with productsobtained by other routes.
1.6. (7) Increases in number of incineration plants might out-compete gasification regardingavailable waste material.
3.2. (7) The EU taxation act, which allows tax-exemption for pilot tests only, is an importantbarrier for increased use of biofuels.
3.4. (7) Electricity and heat from gasification can be produced cheaper by incineration.
1.1. (6) Waste incineration/gasification may be in conflict with goals of waste reduction,increased product reuse and material recycling.
3.5. (6) The necessary technology is not yet developed for use of biofuels from gasification(methanol – corrosivity and cold-start problems, fuel cell vehicles – far fromcommercial stage).
1.4. (5) The EU definition of input material as waste, and not as resource, may implyrestrictions for incineration/gasification.
5.4.4 Important barriers connected to various sub-systems:By using the matrix for barriers shown in Table 18 is possible to characterise these barriersfurther. Many of the barriers of high importance are connected to Sub-system 1 - the inputmaterial (collected waste fractions). They include:1.1. Waste incineration/gasification may be in conflict with goals of waste reduction,
increased product reuse and material recycling.
1.4. The EU definition of input material as waste, and not as resource, may implyrestrictions for incineration/gasification.
1.5. Poor quality of input material (waste) is a barrier for making gasification economicallyfeasible.
1.6. Increases in number of incineration plants might out-compete gasification regardingavailable waste material.
1.7. The requirement of very homogenous input material (waste) can be a limitation of thegasification technology.
In comparison, relatively fewer barriers of high importance are connected to Sub-system 2 -the gasification/ incineration process (plant conversion system). The following two are ofthis category:
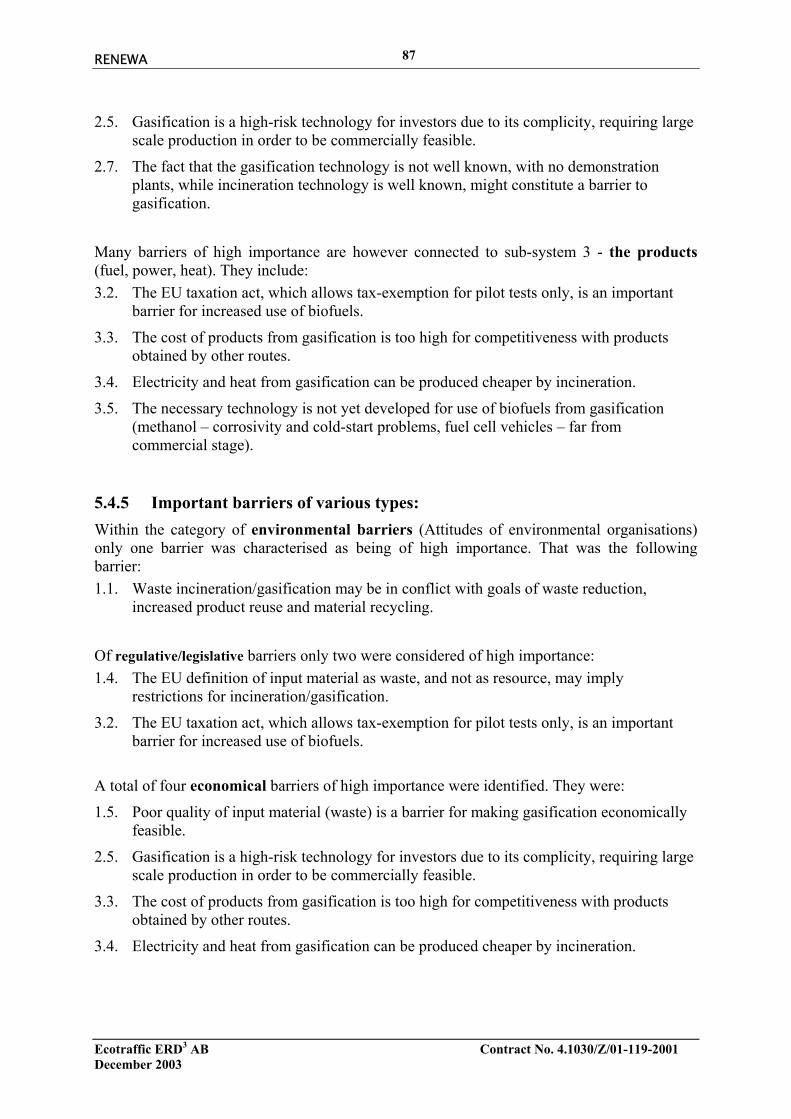
RENEWA
Ecotraffic ERD3 AB Contract No. 4.1030/Z/01-119-2001December 2003
87
2.5. Gasification is a high-risk technology for investors due to its complicity, requiring largescale production in order to be commercially feasible.
2.7. The fact that the gasification technology is not well known, with no demonstrationplants, while incineration technology is well known, might constitute a barrier togasification.
Many barriers of high importance are however connected to sub-system 3 - the products(fuel, power, heat). They include:3.2. The EU taxation act, which allows tax-exemption for pilot tests only, is an important
barrier for increased use of biofuels.
3.3. The cost of products from gasification is too high for competitiveness with productsobtained by other routes.
3.4. Electricity and heat from gasification can be produced cheaper by incineration.
3.5. The necessary technology is not yet developed for use of biofuels from gasification(methanol – corrosivity and cold-start problems, fuel cell vehicles – far fromcommercial stage).
5.4.5 Important barriers of various types:Within the category of environmental barriers (Attitudes of environmental organisations)only one barrier was characterised as being of high importance. That was the followingbarrier:1.1. Waste incineration/gasification may be in conflict with goals of waste reduction,
increased product reuse and material recycling.
Of regulative/legislative barriers only two were considered of high importance: 1.4. The EU definition of input material as waste, and not as resource, may imply
restrictions for incineration/gasification.
3.2. The EU taxation act, which allows tax-exemption for pilot tests only, is an importantbarrier for increased use of biofuels.
A total of four economical barriers of high importance were identified. They were:
1.5. Poor quality of input material (waste) is a barrier for making gasification economicallyfeasible.
2.5. Gasification is a high-risk technology for investors due to its complicity, requiring largescale production in order to be commercially feasible.
3.3. The cost of products from gasification is too high for competitiveness with productsobtained by other routes.
3.4. Electricity and heat from gasification can be produced cheaper by incineration.

RENEWA
Ecotraffic ERD3 AB Contract No. 4.1030/Z/01-119-2001December 2003
88
One political barrier of high importance was characterised as being of high importance. That wasthe following barrier:1.6. Increases in number of incineration plants might out-compete gasification regarding
available waste material.
Three technological barriers of high importance were identified. They were:1.7. The requirement of very homogenous input material (waste) can be a limitation of the
gasification technology.
2.7. The fact that the gasification technology is not well known, with no demonstrationplants, while incineration technology is well known, might constitute a barrier togasification.
3.5. The necessary technology is not yet developed for use of biofuels from gasification(methanol – corrosivity and cold-start problems, fuel cell vehicles – far fromcommercial stage).
5.5 Conclusions The survey of barriers to incineration/gasification of waste revealed that, among thestakeholders in the project, there are many different views on the importance of the variousbarriers. This is reflected through the answers to the questions, where in total, almost allanswer alternatives were chosen by the respondents altogether.
However, there were also some trends in the stakeholder groups, which could be seen by theranging of the answers, according to how many respondents choose one particular answer.From this ranging it was possible to differentiate between those barriers that were consideredunimportant and those that were considered of higher importance. Few stakeholders were ofthe opinion that the potential increase in transport of waste from increasedincineration/gasification would constitute an important barrier. Neither were the regulationsfor transportation of dangerous goods considered important. The same could be said about thepotential of gasification for producing air emissions and pollution. The new EU incinerationdirective, through stringent emission restrictions, was not considered a main barrier to wastegasification.
A wide range of issues presented for the Stakeholder Group were considered as constitutingvery important barriers for the increased use of gasification/incineration of waste. Thesecovered all three sub-systems 1) input material, 2) gasification/ incineration process and 3)products. The important barriers are also of different kinds, either in the form of 1)environmental, 2) regulative/legislative, or 3) economical barriers.
It is thus possible to conclude that the barriers to incineration/gasification of waste are notlimited to one or a few key barriers. It is on the contrary a large set of barriers that must beovercome for increased utilisation of waste by incineration/gasification. Neither is it possibleto conclude that the most central barriers are connected to one single part of the overallsystem for incineration/gasification of waste. There are important barriers present in manyareas, connected to the various sub-systems.
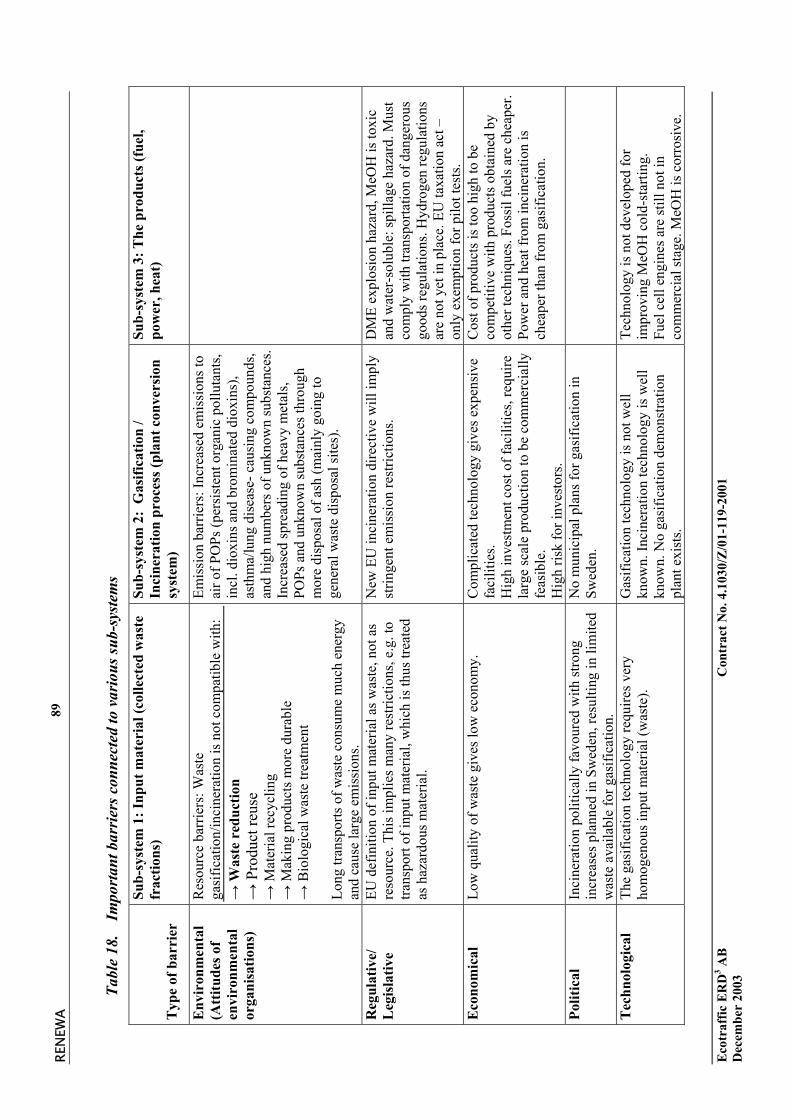
RENE
WA
Eco
traf
fic E
RD
3 AB
Con
trac
t No.
4.1
030/
Z/0
1-11
9-20
01D
ecem
ber
2003
89
Tabl
e 18
.Im
port
ant b
arri
ers c
onne
cted
to v
ario
us su
b-sy
stem
s
Typ
e of
bar
rier
Sub-
syst
em 1
: Inp
ut m
ater
ial (
colle
cted
was
tefr
actio
ns)
Sub-
syst
em 2
: G
asifi
catio
n /
Inci
nera
tion
proc
ess (
plan
t con
vers
ion
syst
em)
Sub-
syst
em 3
: The
pro
duct
s (fu
el,
pow
er, h
eat)
Env
iron
men
tal
(Att
itude
s of
envi
ronm
enta
lor
gani
satio
ns)
Res
ourc
e ba
rrie
rs: W
aste
gasi
ficat
ion/
inci
nera
tion
is n
ot c
ompa
tible
with
:→
Was
te r
educ
tion
→ P
rodu
ct re
use
→ M
ater
ial r
ecyc
ling
→ M
akin
g pr
oduc
ts m
ore
dura
ble
→ B
iolo
gica
l was
te tr
eatm
ent
Long
tran
spor
ts o
f was
te c
onsu
me
muc
h en
ergy
and
caus
e la
rge
emis
sion
s.
Emis
sion
bar
riers
: Inc
reas
ed e
mis
sion
s to
air o
f PO
Ps (p
ersi
sten
t org
anic
pol
luta
nts,
incl
. dio
xins
and
bro
min
ated
dio
xins
),as
thm
a/lu
ng d
isea
se- c
ausi
ng c
ompo
unds
,an
d hi
gh n
umbe
rs o
f unk
now
n su
bsta
nces
.In
crea
sed
spre
adin
g of
hea
vy m
etal
s,PO
Ps a
nd u
nkno
wn
subs
tanc
es th
roug
hm
ore
disp
osal
of a
sh (m
ainl
y go
ing
toge
nera
l was
te d
ispo
sal s
ites)
.
Reg
ulat
ive/
Leg
isla
tive
EU d
efin
ition
of i
nput
mat
eria
l as w
aste
, not
as
reso
urce
. Thi
s im
plie
s man
y re
stric
tions
, e.g
. to
trans
port
of in
put m
ater
ial,
whi
ch is
thus
trea
ted
as h
azar
dous
mat
eria
l.
New
EU
inci
nera
tion
dire
ctiv
e w
ill im
ply
strin
gent
em
issi
on re
stric
tions
.D
ME
expl
osio
n ha
zard
, MeO
H is
toxi
can
d w
ater
-sol
uble
: spi
llage
haz
ard.
Mus
tco
mpl
y w
ith tr
ansp
orta
tion
of d
ange
rous
good
s reg
ulat
ions
. Hyd
roge
n re
gula
tions
are
not y
et in
pla
ce. E
U ta
xatio
n ac
t –on
ly e
xem
ptio
n fo
r pilo
t tes
ts.
Eco
nom
ical
Low
qua
lity
of w
aste
giv
es lo
w e
cono
my.
Com
plic
ated
tech
nolo
gy g
ives
exp
ensi
vefa
cilit
ies.
Hig
h in
vest
men
t cos
t of f
acili
ties,
requ
irela
rge
scal
e pr
oduc
tion
to b
e co
mm
erci
ally
feas
ible
. H
igh
risk
for i
nves
tors
.
Cos
t of p
rodu
cts i
s too
hig
h to
be
com
petit
ive
with
pro
duct
s obt
aine
d by
othe
r tec
hniq
ues.
Foss
il fu
els a
re c
heap
er.
Pow
er a
nd h
eat f
rom
inci
nera
tion
isch
eape
r tha
n fr
om g
asifi
catio
n.
Polit
ical
Inci
nera
tion
polit
ical
ly fa
vour
ed w
ith st
rong
incr
ease
s pla
nned
in S
wed
en, r
esul
ting
in li
mite
dw
aste
ava
ilabl
e fo
r gas
ifica
tion.
No
mun
icip
al p
lans
for g
asifi
catio
n in
Swed
en.
Tec
hnol
ogic
alTh
e ga
sific
atio
n te
chno
logy
requ
ires v
ery
hom
ogen
ous i
nput
mat
eria
l (w
aste
).G
asifi
catio
n te
chno
logy
is n
ot w
ell
know
n. In
cine
ratio
n te
chno
logy
is w
ell
know
n. N
o ga
sific
atio
n de
mon
stra
tion
plan
t exi
sts.
Tech
nolo
gy is
not
dev
elop
ed fo
rim
prov
ing
MeO
H c
old-
star
ting.
Fuel
cel
l eng
ines
are
still
not
inco
mm
erci
al st
age.
MeO
H is
cor
rosi
ve.

RENEWA
Ecotraffic ERD3 AB Contract No. 4.1030/Z/01-119-2001December 2003
90
6

RENEWA
Ecotraffic ERD3 AB Contract No. 4.1030/Z/01-119-2001December 2003
91
MARKET OPPORTUNITIES AND PRODUCTIONPOTENTIAL
6.1 Approach to analysis of market opportunities and productionpotentials
In this chapter we will analyse the opportunities for producing energy from waste. The newdirective for phasing-in of biofuels implies that the EU-member states shall replace 2 % ofthe mineral-based fuels by biofuels in 2005, increasing to 5.75 % in 2010. This results in astrong demand for biofuels in Europe the next years to come. The amount of biofuelsneeded in Europe can be estimated to about 6 mill. tons in 2005 increasing to 17 mill. tonsin 2010. A main barrier for realising these production amounts of fuels from waste is theuncertainty regarding the consideration of waste as a renewable energy source. Thebiofuels-directive is not clear on the issue about waste qualifying as a source for biofuelsproduction.
The analysis aims at determining the amount of waste that could be utilised as rawmaterial, and their potential for producing fuel, electricity and heat production in Norway,Sweden, Germany and Europe. Using the conversion rate ranges for the use of state-of theart technology, it is possible to estimate the production potentials for these forms ofrenewable energy from waste material. Three different cases for the utilisation of wasteenergy are applied:
Case 1: Heat production only
Case 2: Production of electricity plus heat
Case 3: Production of motor fuel plus heat
The fuel calculations are performed for methanol only. However, similar results would beobtained if DME were chosen as the fuel of preference.
6.2 Norway
6.2.1 Waste amountsThe waste statistics for Norway for the years 1998, 2000 and 2001 are shown in Table 19.
Table 19. Waste statistics for Norway for the years 1998, 2000 and 2001 (1000 tons)
Total Sorted Landfill Incineration Other
1998 1,365 453 592 320
2000 1,452 581 467 406
2001 1,507 668 382 445 11

RENEWA
Ecotraffic ERD3 AB Contract No. 4.1030/Z/01-119-2001December 2003
92
It is first of all the amounts of waste going to landfill, which must be considered utilised infuel production. The composition of the waste is however crucial for determining howmuch fuel can be produced. The composition of the total waste in Norway is as shown inTable 20.
Table 20. The composition of total household waste of 1.45 mill. tons in Norway (2000)
Type of waste %
Paper/Cardboard 33.0
Food 27.9
Plastics 8.2
Metal 4.6
Glass 3.6
Hazardous waste 0.1
Other 22.6Source: Statistics Norway (2001)
There are no statistics for the total composition of the land-filled waste in Table 19.However, some information regarding wood waste and organic waste going to landfills isavailable. Of a total of 1.15 mill. tons wood waste in 1998, 25 % were deposited inlandfills. This amounted to 0.29 mill. tons, which could potentially have been utilised forfuel production. Of the total wet organic waste in 1998, 75 % were deposited in landfills.This amounted to 0.19 mill. tons, which also could potentially have been utilised for fuelproduction.
However, since 1998 there has been a trend, which is shown in Table 19, of less householdwaste going to landfills, and more to incineration and recycling. In 2001 a total of 25 % ofall waste from household was deposited in landfills, or about 0.37 mill. tons.
It is then possible to estimate the amounts of waste that could be used as raw material forfuel production, as shown in Table 21.

RENEWA
Ecotraffic ERD3 AB Contract No. 4.1030/Z/01-119-2001December 2003
93
Table 21. Estimate of amounts of waste that could be used as raw material for energyproduction
Type of waste Amount (1000 tons)
Wood4 260
Wet-Organic (incl. paper/cardboard contaminated with food)5 150
Other (incl. plastics contaminated with food)6 70
Total 480
6.2.2 Case 1: Heat production onlyThe energy amount that could be utilised in district heating connected to the combustion ofwaste in state-of the art plants is in the range of 90-95 % (Nykomb, 2003). Using theenergy content of 151.4 MW per 50 tons waste as applied in Table 14, section 4.6, of thisreport, or 3.0 MWh/tons, this implies that a total of about 1.3 TWh available heat could beproduced from the total waste in Norway shown in Table 21.
6.2.3 Case 2: Production of electricity plus heatThe electricity production potential in connection with gasification of waste can bedetermined by applying conversion rates based on a study of a 90 MWh cogeneration plant[13]. In this study, an electricity amount equivalent to 28 % of the energy in the wastecould be generated using a gasifier coupled with a gas furnace. However, with the use of agasifier coupled to a gas turbine, an electricity amount equivalent to 36 % of the energy inthe waste could be generated. This is considerably higher than existing waste-to-energyplants. E.g. the company Thermoselect has developed a process where 1/3 of the syngasenergy is used for electricity production in gas engines [14]. This could potentiallygenerate around 25 % electricity and 60-65 % heat. Our approximation is to use asomewhat higher conversion rate (27%) in the determination of production potentials forelectricity and heat in combination. The amount of electricity that could be produced fromthe waste amount in Norway in Table 21, would be about 0.40 TWh. The annual electricityconsumption in Norway was 113 TWh in 2001 [15]. This implies that electricity producedfrom waste in combination with heat has the potential to contribute about 0.35 % of thetotal electricity consumption in Norway.
The heat production that could be produced from the waste in Norway, in combinationwith electricity would be about 0.91 TWh annually.
4 Based on the assumption of a continuation of the trend that more wood will be incinerated or sorted out forrecycling/reuse, and less is deposited in landfills.5 Based on the assumption of a continuation of the trend that more wet-organic waste will be composted, andless is deposited in landfills6 Based on the assumption of a continuation of the trend that more plastics are sorted out and incinerated orrecycled/reprocessed.

RENEWA
Ecotraffic ERD3 AB Contract No. 4.1030/Z/01-119-2001December 2003
94
6.2.4 Case 3: Production of fuel plus heatAn energy conversion rate of 22 % for turning the energy in waste into methanol in agasification plants has been applied by Nykomb Synergetics [16]. At the facility inSchwarze Pumpe in north eastern Germany, it is annually produced 100,000 -120,000 tonsmethanol from an input of 450,000 tons waste plus 110,000 brown coal. This gives aconversion rate of approximately 0.24 tons methanol per tons waste. However, this facilityis not completely representative of pure waste conversion technologies, as there is acomponent consisting of brown coal in the input material at this facility. In Table 14,section 4.6 of this report a mass based yield of DME of 14.2 % is used. This corresponds to20.4 % methanol. The amount of methanol that could be produced from the waste amountsin Table 21, would thus be about 0.098 mill. tons. In comparison, the total fuel use(gasoline plus diesel) for transport in Norway in the year 2000 amounted to 2.8 mill. tons[17]. Taking into consideration that the specific energy content7 of methanol equalsapproximately half of the specific energy content of gasoline and diesel, fuel from wastethus has a maximum potential for replacing not more than 1.7 % of the total fuel use fortransport in Norway.
The energy amount that could be utilised in district heating connected to the conversion ofwaste into fuel through a state-of the art gasification plant has been determined inTable 14, section 4.6 of this report. For such a facility, an energy amount of 25.3 MWh inthe form of district heat can be generated from a waste input of 50 tons per day with energycontent of 151.4 MWh. This implies that 16.7 % of the daily input waste energy, or 0.51MWh/tonne waste can be used in the form of district heating. Applied to the annualavailable waste amount of 0.48 mill, tons in Norway, this could have the potential toproduce 0.24 TWh heat annually.
6.3 Sweden
6.3.1 Waste amountsSince RVF (www.rvf.se) started collecting statistics on waste in 1994, the amounts goingto landfills have been reduced by approx. 30 %. The part being made up by householdwaste has been reduced even more, from 1.38 mill. tons in 1994 to 0.88 mill. tons in 2001,in other words a reduction by 36 %. Within the same years, the number of landfill sites thatreceives more than 50 tons municipal waste per year has been reduced from about 300 tocloser 230 sites.
The estimated amount of combustible waste being landfilled in Sweden today is 2.6 mill.tons [18]. This includes household waste and industrial waste. One can assume that a wasteamount corresponding to 80 % of this have been utilised in fuel, electricity and heatproduction in 2003.
7 Specific energy content is here understood as energy content per volume unit of the fuel

RENEWA
Ecotraffic ERD3 AB Contract No. 4.1030/Z/01-119-2001December 2003
95
6.3.2 Case 1: Heat production onlyUsing the same conversion factors as for Norway above, a total of about 5.8 TWh availableheat could be produced from the 2.06 mill. tons available waste in Sweden.
6.3.3 Case 2: Production of electricity plus heatWhen using the conversion rates as for Norway above in the determination of productionpotentials for electricity and heat in combination, the amount of electricity that couldannually be produced from the 2.06 mill. tons available waste in Sweden, would amount toabout 1.7 TWh. The annual electricity consumption in Sweden was 129 TWh in 2000 [19].This implies that electricity produced from waste in combination with heat has thepotential to contribute about 1.3 % of the total electricity consumption in Sweden.
The heat production that could be produced from the waste in Sweden, in combinationwith electricity, would be about 3.89 TWh annually.
6.3.4 Case 3: Production of fuel plus heatWhen using the conversion rates as for Norway above in the determination of productionpotentials for fuels and heat in combination, the amount of methanol that could beproduced from the 2.06 mill. tons available waste in Sweden, would be about 0.42 mill.tons. In comparison, the total fuel use (gasoline plus diesel) for transport in Sweden was6.31 mill. tons in 2000 [19]. Again taking into consideration the differences in energycontent between methanol and gasoline/diesel, fuel from waste thus has a maximumpotential for replacing 3.3 % of the total fuel use in Sweden.
The energy amount that could be utilised in district heating connected to the conversion ofwaste into fuel through state-of the art gasification plants in Sweden would be about 1.05TWh heat annually.
6.4 Germany
6.4.1 Waste amountsIn Germany, a total of 27.8 mill. tons waste was deposited at landfills in 1993. One canassume that a waste amount corresponding to 70 % of this could be utilised in fuel,electricity and heat production in 2003.
6.4.2 Case 1: Heat production onlyUsing the same conversion factors as applied above, a total of a total of about 54.6 TWhavailable heat could be produced from the 19.5 mill. tons available waste in Germany.

RENEWA
Ecotraffic ERD3 AB Contract No. 4.1030/Z/01-119-2001December 2003
96
6.4.3 Case 2: Production of electricity plus heatWhen using the conversion rates as applied above in the determination of productionpotentials for electricity and heat in combination, the amount of electricity which couldannually be produced from the 19.5 mill. tons available waste in Germany, would amountto about 16.2 TWh. The annual electricity production in Germany was 555.4 TWh in 1999[20]. This implies that electricity produced from waste in combination with heat has thepotential to contribute about 2.93 % of the total electricity production in Germany.
The heat production that could be produced from the waste in Germany, in combinationwith electricity, would be about 36.9 TWh annually.
6.4.4 Case 3: Production of fuel plus heatWhen using the conversion rates as applied above in the determination of productionpotentials for fuels and heat in combination, the amount of methanol that could beproduced from the 19.5 mill. tons available waste in Germany, would be about 3.98 mill.tons. In comparison, the total fuel use (gasoline plus diesel) for road-based transport inGermany in the year 1999 amounted to 57.54 Mtoe (EC, 2002). This corresponds to about55.3 mill. tons8. Again taking into consideration the differences in energy content betweenmethanol and gasoline/diesel, fuel from waste thus has a maximum potential for replacing3.6 % of the total fuel use in Germany.
The energy amount that could be utilised in district heating connected to the conversion ofwaste into fuel through state-of the art gasification plants in Germany would be about 9.94TWh heat annually.
6.5 Europe
6.5.1 Waste amountsIn Europe, almost 1 800 mill. tonnes waste is generated per year (Table 22). How much ofthis that is deposited on landfills is not known, but the municipal waste part (Table 23) ofthis is fairly well accounted for in Europe. Of the total 245 mill. tonnes municipal wastegenerated, 29 mill. tonnes is recovered for energy production (Table 24), while 156 mill.tonnes is deposited at landfills per year (Table 25), based on reporting by each country,mainly 1999-data, but also from some countries back to 1993 (Eurostat). One can assumethat a waste amount corresponding to 75 % of this could potentially be utilised in fuel,electricity and heat production in 2003.
8 A factor of 11 640 GWh/Mtoe is applied. An energy content of 12.1 kWh/kg is assumed as the average ofthe total fuel consumed.
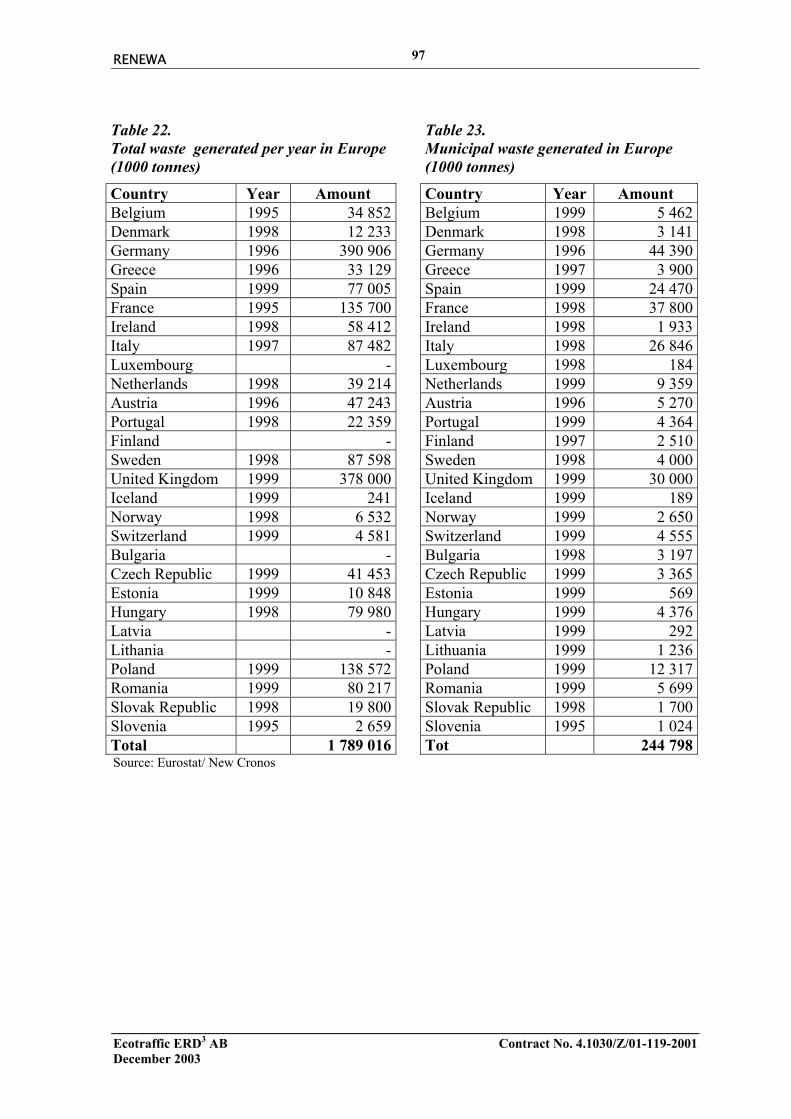
RENEWA
Ecotraffic ERD3 AB Contract No. 4.1030/Z/01-119-2001December 2003
97
Table 22.Total waste generated per year in Europe(1000 tonnes)
Table 23.Municipal waste generated in Europe(1000 tonnes)
Country Year Amount Country Year AmountBelgium 1995 34 852 Belgium 1999 5 462Denmark 1998 12 233 Denmark 1998 3 141Germany 1996 390 906 Germany 1996 44 390Greece 1996 33 129 Greece 1997 3 900Spain 1999 77 005 Spain 1999 24 470France 1995 135 700 France 1998 37 800Ireland 1998 58 412 Ireland 1998 1 933Italy 1997 87 482 Italy 1998 26 846Luxembourg - Luxembourg 1998 184Netherlands 1998 39 214 Netherlands 1999 9 359Austria 1996 47 243 Austria 1996 5 270Portugal 1998 22 359 Portugal 1999 4 364Finland - Finland 1997 2 510Sweden 1998 87 598 Sweden 1998 4 000United Kingdom 1999 378 000 United Kingdom 1999 30 000Iceland 1999 241 Iceland 1999 189Norway 1998 6 532 Norway 1999 2 650Switzerland 1999 4 581 Switzerland 1999 4 555Bulgaria - Bulgaria 1998 3 197Czech Republic 1999 41 453 Czech Republic 1999 3 365Estonia 1999 10 848 Estonia 1999 569Hungary 1998 79 980 Hungary 1999 4 376Latvia - Latvia 1999 292Lithania - Lithuania 1999 1 236Poland 1999 138 572 Poland 1999 12 317Romania 1999 80 217 Romania 1999 5 699Slovak Republic 1998 19 800 Slovak Republic 1998 1 700Slovenia 1995 2 659 Slovenia 1995 1 024Total 1 789 016 Tot 244 798Source: Eurostat/ New Cronos

RENEWA
Ecotraffic ERD3 AB Contract No. 4.1030/Z/01-119-2001December 2003
98
Table 24.Municipal waste in Europe recoveredfor energy production (mill. tonnes)
Table 25.Municipal waste landfilled per yerarin Europe (1000 tonnes)
Country Year Amount Country Year AmountBelgium 1998 1 136 Belgium 1998 1 473Denmark 1998 1 654 Denmark 1998 357Germany 1993 8 552 Germany 1993 27 840Greece - Greece 1997 3 561Spain 1999 2 603 Spain 1999 17 477France 1998 8 906 France 1998 23 352Ireland - Ireland 1998 1 766Italy 1997 1 222 Italy 1997 21 262Luxembourg 1998 123 Luxembourg 1998 62Netherlands - Netherlands 1999 1 136Austria 1996 491 Austria 1996 1 102Portugal 1999 349 Portugal 1999 3 596Finland 1997 80 Finland 1997 1 610Sweden 1998 1 400 Sweden 1998 1 300United Kingdom - United Kingdom 1996 21 800Iceland 1999 4 Iceland 1999 147Norway 1999 374 Norway 1999 1 843Switzerland 1999 2 130 Switzerland 1999 1 070Bulgaria - Bulgaria 1998 3 167Czech Republic 1998 176 Czech Republic 1998 -Estonia - Estonia 1999 568Hungary 1999 352 Hungary 1999 1 416Latvia - Latvia 1999 292Poland - Poland 1999 12 074Romania - Romania 1999 5 699Slovak Republic - Slovak Republic 1995 1 121Slovenia 1998 140 Slovenia 1998 1 310Tot 29 692 Tot 156 401Source: Eurostat/ New Cronos
The number of incineration plants and landfill sites in the European states are shown inTable 26.

RENEWA
Ecotraffic ERD3 AB Contract No. 4.1030/Z/01-119-2001December 2003
99
Table 26. Number of incineration plants and landfill sites in the European states
Country Year Incineration plants Landfill sitesBelgium 1999 9 212Denmark 1998 - -Germany 1996 154 -Greece - -Spain 1998 13 195France 1998 305 452Ireland 1998 6 126Italy 1997 164 789Luxembourg - -Netherlands 1999 14 38Austria 1997 9 -Portugal 1999 4 120Finland 1998 1 359Sweden 1998 22 -United Kingdom - -Iceland 1999 5 21Norway 1999 9 150Switzerland 1999 37 60Bulgaria - -Czech Republic 1999 78 347Estonia 1999 1 261Hungary 1999 1 729Latvia 1999 - 550Poland 1999 - 1 401Romania 1999 - 765Slovak Republic 1998 92 277Slovenia 1995 - 168Tot 924 7 020Source: Eurostat/ New Cronos
6.5.2 Case 1: Heat production onlyUsing the same conversion factors as applied above, a total of a total of about 328.5 TWhavailable heat could be produced from the 117 mill. tons available waste in Europe.
6.5.3 Case 2: Production of electricity plus heatWhen using the conversion rates as applied above in the determination of productionpotentials for electricity and heat in combination, the amount of electricity which couldannually be produced from the 117 mill. tons available waste in Europe, would amount toabout 97.7 TWh. The total annual electricity production in Europe was 2,531 TWh in 1999[20]. This implies that electricity produced from waste in combination with heat has thepotential to contribute about 3.86 % of the total electricity production in Europe.
RENEWA
Ecotraffic ERD3 AB Contract No. 4.1030/Z/01-119-2001December 2003
100
The heat production that could be produced from the waste in Europe, in combination withelectricity is about 222 TWh annually.
6.5.4 Case 3: Production of fuel plus heatWhen using the conversion rates as applied above in the determination of productionpotentials for fuels and heat in combination, the amount of methanol that could beproduced from the 117 mill. tons available waste in Europe, would be about 23.9 mill.tons. In comparison, the total fuel consumption (gasoline plus diesel) for transport inEurope was 279 Mtoe in 1999 [21]. This corresponds to about 268 mill. tons fuel9. Againtaking into consideration the differences in energy content between methanol andgasoline/diesel, fuel from waste thus has a maximum potential for replacing 4.5 % of thetotal fuel use in Europe. This fuel-production from waste materials alone is well above thebiofuels directive-target of achieving a 2 % phase-in by 2005, and not that far from the2010 -target of 5.75 % replacement.
The energy amount that could be utilised in district heating connected to the conversion ofwaste into fuel through state-of the art gasification plants in Europe is about 59.8 TWh heatannually.
6.6 SummaryThe summary of the result from the analysis of potentials for energy from waste inNorway, Sweden, Germany and Europe is shown in Table 27.
9 A factor of 11 640 GWh/Mtoe is applied. An energy content of 12.1 kWh/kg is assumed as the average ofthe total fuel consumed.

RENEWA
Ecotraffic ERD3 AB Contract No. 4.1030/Z/01-119-2001December 2003
101
Table 27. Potential of not utilised energy from waste in Norway, Sweden, Germany andEurope. Summary of results.
Norway Sweden Germany Europe
Available waste (million tons) 0.5 2.1 19.5 117.3
MeOH production potential (million tons) 0.1 0.4 4.0 23.9
MeOH replacement potential (%) 1.7 3.3 3.6 4.5
Electricity production potential (TWh) 0.4 1.7 16.2 97.7
Electricity replacement potential10 (%) 0.4 1.3 2.9 3.9
Heat alone (TWh) 1.3 5.8 54.6 328.5
Heat in combination with electricity (TWh) 0.9 3.9 36.9 222.0
Heat in combination with fuel (TWh) 0.2 1.0 9.9 59.8
10 The calculations of electricity replacement potential for Norway and Sweden are based on total electricityconsumption, while the corresponding figures for Germany and Europe are based on total electricityproduction.

RENEWA
Ecotraffic ERD3 AB Contract No. 4.1030/Z/01-119-2001December 2003
102
RENEWA
Ecotraffic ERD3 AB Contract No. 4.1030/Z/01-119-2001December 2003
103
7 NETWORKThe objective of the work presented in this chapter is to propose the utilisation of anetwork in order to achieve an increased market share of bioenergy from waste in thefuture. The work has been carried out by interviews, questionnaires and workshopdiscussions.
7.1 Interest groups and networks todayThe utilisation of waste to produce energy involves many actors of different kinds. Thereare several interest groups with waste as a common basis but with different purposes. Themost important organisations active in Europe in this field are listed below. In thisconnection it doesn't seem to be a lack of interest organisations. FEAD and ASSURE areorganisations representing a wide range of members. A significant difference between thetwo are that FEAD's members are those who take care of the waste while ASSURE'smembers are mainly involved in the creation of products that one day will be classified aswaste but FEAD is also a member.
FEAD - European Federation on Waste Management and Environmental Services.FEAD have members from most EU Member States and four accession countries andNorway representing companies with activities in all forms of waste management. Thesecompanies employ over 300,000 people who operate around 3,000 controlled landfills,1,350 recycling and sorting centres, 1,000 composting sites and 350 incinerators and playan important role in the determination of the best environmental option for wastemanagement problems.
FEAD's role in Brussels is to gather expertise and up-to-date information from its memberson the many subject areas covered, to compare experiences and to advise decision-makersof the overall situation in Europe. Lessons learnt in practice should lead us to better, moreeffective legislation, and therefore superior environmental and economic performance.
FEAD works with a broad network of other similar organisations in Brussels ensuring thatopinions are not formed in isolation, and obtain wide-spread approval for a given policyposition or direction.
ASSURE - The Association for the Sustainable Use and Recovery of Resources inEuropeASSURE is a partnership for action, which aims to play an important role in transformingSustainable Resource Management from a concept into a practical process and to work fora better EU legislative framework through better dialogue between all relevant actors andthe EU institutions. ASSURE have a broad membership basis and expertise able to presenta holistic non-sectoral view of the interlinked phases which represent the full life cycle ofmaterials, from cradle to grave.
ASSURE's approach is to:

RENEWA
Ecotraffic ERD3 AB Contract No. 4.1030/Z/01-119-2001December 2003
104
• Raise the level of informed debate as regards the key issues of sustainable resourcemanagement and feed expertise into the EU institutions
• Uphold the vital link between EU policy formulation and implementation and ensurethat experiences on the ground are fed back into the decision-making system.
• Commission Best Practice case studies and share lessons learned
• Track key issues and developments in technology and policy
CEWEP - Confederation of European Waste-to-Energy Plants.CEWEP is a lobby organisation for European waste incinerators seated in Brussels. Thebasic environmental law is made by the EU and member states have to implement theseregulations made in Brussels into national law.
CEWEP is a European representation:
• to represent and coordinate the interests of W-t-E Plants and to bundle up their forces;
• to give competent address to the decision-makers in the EU;
• to explain to public and political sector the high technical standard of W-t-E Plants andtheir environmental advantages; this must also be communicated to the environmentalorganisations;
• to take part in the Commission's decision processes and provide qualified statementsbefore the official legislation process begins;
• to influence and create the EU-environmental legislation;
• to build up continual communication to the decision-makers in the EU and to makethem aware of the concerns of W-t-E Plants;
• to reach a good reputation of waste incinerators, accepted as producers of green energy,replacing fossil fuels;
• to obtain a level-playing-field with regard to other waste treatment facilities, especiallythe industrial plants co-incinerating waste;
• last, but not least to exchange experiences between the European waste incinerators, tolearn from each other and to develop new ideas for the daily practice.
ISWA - The International Solid Waste Association.ISWA is a global professional network in the field of waste management with the missionto promote sustainable waste management world-wide. The organisation's declared goal isto help implement eco-efficient and sustainable waste management systems on a globalscale. Especially developing countries and economies in transition need support in thisfield.
Mission:
• Protect human health, natural resources and the environment
• Provide information

RENEWA
Ecotraffic ERD3 AB Contract No. 4.1030/Z/01-119-2001December 2003
105
• Promote research and development, education and training
• Influence policies by providing advice
• Serve the membership
ETC/WMF - The European Topic Centre on Waste and Material Flows (ETC/WMF), established in 1997, is one of five Topic Centres under the EuropeanEnvironment Agency. The mission of the Topic Centre is to provide reliable andcomparable data and information on waste and material flows in Europe to decision-makers and the public.
The Topic Centre is a consortium of eight specialist partner organisations fromenvironmental authorities and research communities in Europe. The consortium is ledjointly by the Danish Environmental Protection Agency and the Environmental ProtectionAgency of the City of Copenhagen. The Topic Centre is part of the European Informationand Observation Network (EIONET).
7.2 Aspects and actorsOn a workshop arranged by Ecotraffic on May 23, 2003 the projects Reference grouppenetrated issues regarding constitution of a network. The main questions were whichactors are important to create conditions for increased use of waste for energy productionand what would be the most important tasks for this network. The work defined importantactors and problematic issues in different parts of the lifecycle chain from productconstruction of the article of consumption to energy production. The chain were dividedinto six main parts, each including aspects and actors affecting the possibilities for laterenergy utilisation for products that will end up as waste at the end of the chain, Table 28.
Part 1. Product design:
The design of a product decides how it should be treated as waste. Aspects that affect thewaste handling are e.g. material choice, complexity in structure, use of composites,possibility of easy dismantling, material labelling etc. The product designer decides thefinal shaping but does it in a way to satisfy the buyer. This means that current trends willaffect the design. Legislation will affect the design as well and as an example the producerresponsibility regarding recycling of packaging have resulted in development ofpackaging that reduces the recycling costs.
Part 2. Purchasing:At the moment of purchase the price and function of course is essential but reasonably theway to dispose of the product ought to affect the purchasing. Especially for enterprises thatcan see the direct costs for different kinds of waste. Clear product labelling anddeclarations would help buyers to choose easily incinerated and green products.

RENEWA
Ecotraffic ERD3 AB Contract No. 4.1030/Z/01-119-2001December 2003
106
Table 28. Affecting aspects and important actors for energy recovery at the end of aproduct's lifecycle.
Part Affecting aspects Actors
1. Product design Material choiceCompositesHard to dismantleProducer responsibility
Packing developersProduct designersLegislators
2. Purchasing PriceEnvironmental labelling
PurchasersPrivate persons
3. Disposal EU waste definitionAvailable wasteseparation system
EmployeesPrivate personsMunicipalities/Wasteresponsible
4. Collecting andtransport
Waste separation systemTransport time andnumber of fractions
Municipalities/WasteresponsibleWaste managementcompanies
5. Waste treatment Price, including taxesWaste qualityAvailable facilities
Municipalities/WasteresponsibleLegislators
6. Energy demand Price, including taxesType of energy
GovernmentsEnergy consumers
Part 3. DisposalThe actual waste handling system decides how the product is going to be disposed of. Awaste separation system with a "combustible" fraction would significantly raise thequality of the waste as a fuel. More common is a system where the unsorted rest isincinerated which of course leads to a bad fuel quality. The EU waste definition isaffecting the handling of the waste but what if some fractions could be classified as fuel orbiofuel and be exempted from the waste definition and the municipalities responsibility?As a fuel it could be traded on a free market to probably lower costs.
The waste definition can only be changed by the EU administration. Effective wastehandling systems are affected of the current legislation and the municipalities or wasteresponsibles ambitions. The quality of the separated waste fractions is also depending onthe knowledge of employees or private persons on how to sort and the importance ofcorrect sorting.
Part 4. Collecting and transportTransport distances have only a small affect on the costs [9]. More important are the timeneeded for collecting (tons/hour) and the number of fractions to be transported. In thisaspect an outsorting of a high quality fuel would be costly. The transport extent is a

RENEWA
Ecotraffic ERD3 AB Contract No. 4.1030/Z/01-119-2001December 2003
107
consequence of the waste separation system and is influenced by municipalities or thoseresponsible for the waste. Waste management companies have a role in developing moreeffective methods and equipment.
Part 5. Waste treatmentThe way the waste is treated depends on price including taxes (gate fees), waste qualityand available treatment facilities. Since the waste responsibility falls on the municipalityor local authority waste treatment solutions, and so the treatment costs, vary from oneplace to another. The treatment costs are sort of say fixed in short to medium terms.Introducing a fuel fraction could raise the heating value in the fuel but existingincinerators may have limits in design for the fuel's heating value. In the long term theremust be regulations promoting energy from waste. Cost harmonising for thermal treatmentin comparison to landfilling is necessary. The actors affecting the waste treatment aremunicipalities/waste responsible and legislators.
Part 6. Energy demand
The market opportunities for energy from waste are not only a question of price, but aquestion of waste strategies in a community as well. District heating structures require acertain amount of fuel (waste) in order to satisfy the energy demand. The customers(consumers) have small opportunities, if any, to choose another supplier which is limitingan open market. The situation for power production is different since the numbers ofsuppliers connected to the grid are not limited. If power from waste would be seen asgreen electricity the market opportunities would increase. In fact, this must reasonably bethe case. The major part of the combustible part of waste is normally biobased. The samearguments could be applied for motor fuel production. According to the EU biofueldirective the "member states should ensure that a minimum proportion of biofuels andother renewable fuels is placed on their markets, and, to that effect, shall set nationalindicative targets". Some fuels are more easily introduced while some requires adaptationof the vehicles and the distribution systems. Some fuels requires introduction of newtechnologies in vehicles and distribution systems. Anyhow, the biofuel directive opens upan opportunity for motor fuels from waste. This is though depending on measures fromthe governments. Only if energy prices, mainly concerning power and motor fuels, are atthe same levels as for energy from traditional energy sources, energy consumers willchoose waste (bio) energy.
7.3 InterviewsA questionnaire, formed as a basis for discussion, was sent to a number of persons in thefield of waste management throughout Europe. Following persons answered thequestionnaire. Some in written form and some preferred a discussion by phone.

RENEWA
Ecotraffic ERD3 AB Contract No. 4.1030/Z/01-119-2001December 2003
108
Name OrganisationNorbert Bosman VVAV, Netherlands
Björn Dahlroth KSL, Sweden
Kyra Dreher ITAD e.V., Germany
Bill Duncan ASSURE
Reil Eberhardt Fernwärme Wien GmbH, Austria
Dieter Reimann Müllheizkraftwerk Bamberg, Germany
Håkan Rylander SYSAV, Sweden
Weine Wiqvist RVF, Sweden
Staffan Ågren The Ragnar Sellberg Foundation, Sweden
As a basis for the questions three statements were given:
1. More waste-to-energy increase use of renewable energy and decrease fossil energydependency
2. More than 50% of the municipal waste in EU are put in landfills
3. The amount of waste produced increases 2-3% per year
The questionnaire contained three questions:1. What is your opinion on why so much waste is put in landfills in the EU instead of
being incinerated or gasified for energy recovery?
2. Which actors are important to make an increase in the share of energy recovery fromwaste by thermal conversion? (e.g. governments, waste management companies etc?)
3. How can these actors cooperate in a network? What would be the main issues for thisnetwork?
The order of the answers given below does not correspond to the order of the names givenin the list above.
Answers to the first question:
Person A. Landfill is actually a cheap and traditional method and the environmental impacthas so far not been very strong. The immediate environmental impact is actually still quitesmall and confined to limited areas. In most countries incineration has mainly been used asa method to reduce volume in such cases where place for landfill is getting scarce.However place is getting more and more scarce and we are getting more and moreinformation about long term effects.
To produce energy has so far not been anything but a small additional side possibility andthen it has almost always been a question of producing some electricity and sometimesonly for the consumption of the incineration plants themselves. Sometimes there has been a

RENEWA
Ecotraffic ERD3 AB Contract No. 4.1030/Z/01-119-2001December 2003
109
production of steam. Other forms of energy have been, and are still, very cheap. For a highuse of the energy content in municipal waste it is necessary to have access to a districtheating system based on distribution of hot water or steam.
To produce high quality (purity and heating value) gas from waste is more difficult thangasification of coal or oil and you must have some use of the gas. Industrial gasification ingeneral is a dying industry with the advent of natural gas for the chemical industry and ofcheap electricity for many other uses.
Person B. All possibilities concerning post-use recovery of products and materials shouldprincipally be considered and evaluated. This is still far from done, or only done in a waythat does not support much common unity as regards desirable solutions (betweenpoliticians, the industry, and the public). What we can say is that there is at least muchgeneral agreement on recovery being superior to landfilling from a resource perspective.However, the optimal balance between material recovery and energy recovery underdifferent conditions still needs to be much investigated and discussed. This is a problem forall, including material recyclers and incineration/gasification plants. On the other hand, itis a necessary stage of the development that takes its time, no matter what we think aboutit.
Person C. The situation is very different in European countries. In the northern parts thedemand for heating is larger due to the colder climate than in the southern Europe. InSweden waste have been used for a long time for energy production and the system fordistrict heating have been built up successfully in parallel. In Sweden the landfill tax areset to encourage recycling and together with the prohibition of depositing outsortedcombustible waste from 2002 and deposition of organic waste from 2005, the trend todayis that less waste are deposited and the number of waste-to-energy plants will increase. Thelandfill directive regulate depositing of biodegradable waste and member states shall haveset up national strategies for reducing biodegradable waste going to landfill. The grades ofobservance though, vary from country to country.
In many countries there is a strong public opinion against waste incineration e.g Englandwhere landfilling is the dominating management method.
Person D: The price for putting waste in landfills is much lower than incineration. Even ifthere are national regulations on putting combustible waste in landfills this is still going onand a price competition is in progress.
Politicians are more interested in alternative solutions than incineration. They are unsure ofthe effects of incineration and are influenced of the opinion against waste incineration. Thecommon acceptance for incineration is low. The public needs to be informed about notonly the low risks but the benefits as well.
Person E: Depositing in landfills is much cheaper than incineration and the incinerationcapacity is in relative terms low. There aren't enough waste-to-energy plants. Landfill taxis an important instrument of control. The new directive on landfilling will increase thelandfill management costs and lead to higher gate fees. Waste intended for recycling is insome extent only recycled to some percent. The main part is put in landfill, which ischeaper.
District heating is in use in central Europe, e.g in Germany, Holland and Poland butnormally not connected to a waste incineration plant. Existing plants are often old andremotely situated from the district-heating grid. There are also different approaches on the

RENEWA
Ecotraffic ERD3 AB Contract No. 4.1030/Z/01-119-2001December 2003
110
definition of biodegradable waste. Some countries define household waste as 100%biomass.
Person F: Landfilling is by far cheaper than incineration of waste.
Person G: This might have something to do with on the one hand the (not so positive)reputation waste incineration has in certain countries and on the other hand the substantialamounts of money which have to be invested in order to build a state-of-the-art energy-from-waste plant.
Person H: The costs for depositing waste in landfill sites are dramatically cheaper than forincineration. As long there are no clear regulations for thermal treatment (e.g. special taxfor depositing; waste treatment such as incineration for municipal waste with more than3% TOC is a must;.. ) energy recovery will not be compliable.
Person I: Landfill came first –remains cheapest. Reflects a disposal mentality. Often thenearest physical option.
Answers to the second question:Person A. Power and district heating companies, material manufacturers, municipalitycouncils, governments, politicians. And very important -The EU-administration, who mustlook seriously into the matter of waste as an energy resource with very small GWP andbase their analytical work on facts that are relevant for the future instead of historical dataand popular beliefs and with regard to that conditions in the various European countries aredifferent. There is reason to question the waste hierarchy, which by many is being acceptedas a dogma. The hierarchy is OK as an indication but one should accept, and in factrecommend, that it is investigated for each region and each city and town whether wasteand material in waste should be reused, recycled, used as an energy resource or landfilledand in this process consider environment, all resources (including time) and money. It isalso important to realise that the future is dynamic and what seems or is true today is notalways true in 20 years. Internal trade within EU of waste or waste fractions for energyshould also be recommended since North Europe has better possibilities for this than SouthEurope.
Another important actor is media who often are either badly informed or more interested inexploiting existing attitudes than informing about real facts.Person B. The key issue is to make more research to get evaluation tools good enough tobe used by the politicians and become widely accepted by the industry and the public.Then there can be a well-motivated price put on different alternatives that the market cantake into concern. To increase the share of energy recovery is no end in itself but if itmeans replacing landfilling we already see policies (laws, taxes, producer responsibilitiesetc.) that will result in that change. Facts already point to that this is good resource policy.
Person C. Important actors are the EU Commission and National energy agencies.
Person D: Politicians and the European Commission.
Person E: There are many important actors. There have to be motive forces and will at theauthorities to have a good working supervising administration over waste flow. Morecommercialism and private enterprises is needed to get a more cost-effective management.To erect a new waste-to-energy plant high investments are necessary. To reduce

RENEWA
Ecotraffic ERD3 AB Contract No. 4.1030/Z/01-119-2001December 2003
111
economical risks long-term contracts of fuel (waste) supply is required. Normallymunicipals are responsible for both waste handling in the municipality and energy supplybut they have restricted investment capability.
Person F: The governments (EU included) are the most important actors, since there willbe no investments in thermal conversion as long as there are no stable political conditionsand frameworks and as long one can't foresee how the market will develop.
Person G: Waste management companies, governments and scientific bureaus.
Person H: Governments and authorities at first.
Person I: 1. EU institutions2. Member state governments3. Local governments
Need for clear signalling of acceptability, facilitation of planning permits, engagementwith citizens.
Answers to the third question:Person A. The European union could start a project with the intention to really clarifyconditions and data that are relevant to use in the study of locally adapted future wastemanagement and create a network for discussion and free flow of information and factsregarding the use of waste for various applications. And that this network will be consultedin early stages of writing suggestions for new directives and revision of old ones. Theoffice responsible for the network should also have a home page with information andlinks which is accessible for all who want to have some information on waste, wastemanagement and various ways of recycling and energy recovery etc. It is rather depressingto read document from the EU-parliament and find that they discuss whether plasticflowerpots are packages or products or whether the little brush in the eyeliner or eyeshadow box is part of the package or not. This kind of “stupidity” is not creating a goodimage for either the EU-administration or its parliament. There is a lack of information andunderstanding.
In short - the network should be a source of information and open discussion and a help forthe EU-administration and others. Person B. The main issue is to increase research and co-operation as regards all-embracingquestions within the waste sector and the energy sector in parallel. The industry needs tohave a much more pro-active attitude in this respect to avoid bad and costly solutions puton them by badly informed/prejudiced authorities. Waste management is traditionally notan academic subject but needs to incorporate more of qualified knowledge to find practicalsolutions that fit into holistic systems thinking. Networking will be needed to fund researchand spread all answers that single actors cannot tackle on their own.
Person C. It is important that waste must be seen as mainly a biofuel, which it in fact oftenis. Thereafter it could be given the same conditions as other biofuels. E.g. the interpret ofthe European Court recently (2003) that waste-to-energy in a waste incineration plantcould not be seen as recycling while co-firing does. The system for green certificates forpower is not including waste-to-energy plants.

RENEWA
Ecotraffic ERD3 AB Contract No. 4.1030/Z/01-119-2001December 2003
112
Further, the regulations on emissions from energy plants must be equal irrespective of fuelused. Today waste-to-energy plants have to live up to more stringent emission levels thanplants using other fuels (both fossil fuels and biofuels).
Person D: Landfill taxes would help. Information to politicians and EU-Commission.
Person E: A network needs to be adapted from region to region because the conditions aredifferent. The networks ought to be initiated by those who have the legal responsibility forthe waste. An important question is what is recycling and what is destruction? At presentincineration with energy recovery is not recycling but destruction, according to the EU-court. This pleases both the cement industry and the environmental organisations but indifferent aspects. The cement industry uses different kind of waste as fuel and don’t wantcompetition from w-t-e plants. Environmental such as Greenpeace don’t like any forms ofincineration no matter which fuels are used.
Person F: By exchanging reliable information and willingness to really cooperate.Therefore the main issues for a network would be trustworthiness and reliability.
Person G: The main issues would be the financing of initiatives concerning energy-from-waste, the level-playing-field on a EU-scale, public relations.
Person H: The EU should actually give authorities and politicians enough facilities tocooperate.
Person I: Less need for a network than for a legislative driver (targets, timetables) andconsequent engagement in implementation process.
7.4 ConclusionsThere is one main reason why large amounts of waste are put in landfills instead of energyrecycled. Landfilling is cheaper! That implies that other energy sources can be used toproduce power and heat to a lower cost. There is also a strong public opinion against wasteincineration in many countries due to its bad reputation concerning emissions. This mayaffect politicians and decision-makers to be more interested in other solutions thanincineration. Gasification is in this aspect a more unknown technology having possibilitiesto get attention but it is not enough demonstrated and the investment costs are high.
The demand for heat is less in the southern Europe than in the north. That may be onereason why energy from waste in combination with district heating has been so successfulin Sweden. A demand for heat is an important condition to a good plant economy even ifpower is produced. In general there are few waste-to-energy plants in Europe.
Participants in a network for increased use of energy from waste should represent wastemanagement, energy companies, municipalities, governments, politicians and the EU-administration. Even the manufacturing industry should be represented as they are inFEAD. The main task for the network should be to clarify conditions and data as a sourceof information and open discussion. Politicians and the public need more information.Politicians need tools and facts to be able to make correct decisions on waste and energyissues. Therefore trustworthiness and reliability should be fundamental. The networkshould work for exchange of reliable information and support and fund research andcooperation between the waste sector and energy sector. Gasification technology for solidbiofuels needs support for further development

RENEWA
Ecotraffic ERD3 AB Contract No. 4.1030/Z/01-119-2001December 2003
113
The network should also work for equal market conditions for energy from waste by thefollowing activities:
• Stimulate more commercialism and private enterprises.
• Stimulate internal trade within the EU
• Create stable political conditions
• Make it possible to utilise waste as mainly a biofuel
• Question the waste hierarchy
• Include power from waste in the system for Green certificates for electric power
• Introduce equal emission regulations for different energy plants
• Clearly define the difference between recycling and destruction
• Introduce landfill tax to direct waste quantities from landfills to recycling alternatives,e.g. incineration.

RENEWA
Ecotraffic ERD3 AB Contract No. 4.1030/Z/01-119-2001December 2003
114
RENEWA
Ecotraffic ERD3 AB Contract No. 4.1030/Z/01-119-2001December 2003
115
8 AUTOMOTIVE FUELS FROM WASTEThe gasification technology enables production of fuels suitable for automotive purposes.Several studies on fuel production from gasification of biomass have pointed out methanol,DME (Dimethyl ether) and FTD (Fischer-Tropsch Diesel) as the most economically andenvironmentally best fuels in a well-to-wheel perspective. Even hydrogen can be producedbut are a much more expensive fuel.
Information given in this chapter is to a large extent based on references[22,23,24,25,26,27,28,29,30]
8.1 Fuel properties Some relevant fuel properties for petrol (according to EU 2005 specification), diesel fuel(Swedish Environmental Class 1), methanol, DME, hydrogen and propane are shown inTable 29. Petrol and diesel fuels are shown as reference and propane is also added as acomparison for DME, since these fuels have similar physical properties.
Some comments on the fuel properties can be made. Methanol and DME contain oxygen incomparison to the other fuels, where only petrol may contain a small amount of oxygen(<2,7%). In case RME is blended to diesel fuel, this fuel will also contain some oxygen.The viscosity is lower for DME and methanol than for diesel fuels, which gives lowerlubricity. Differences in vapour pressure, flash point and some other properties haveinfluence on the risk of fire and explosion. The difference in boiling point is vast, rangingfrom diesel fuel to the fuels in gaseous state (DME and propane) at normal temperatureand pressure. DME and methanol contain less energy per mass and volume than petrol anddiesel. The alternative fuels are practically sulphur-free but the sulphur content of petroland diesel fuel has, or will be, reduced to almost zero level for these fuels as well. DMEand methanol contain no olefins, aromatic or polycyclic aromatic hydrocarbons (PAH),thus implying a considerable advantage regarding the health effects from toxic emissions.One the other hand, formaldehyde, considered as an “air toxic” in the USA, might beformed with DME and methanol as fuel. However, diesel fuel also gives formaldehyde inthe exhaust but in the DME case, the formation of formaldehyde seems very low. Thesimple molecular structure of DME and methanol implies that the formation of heaviertoxic emission compounds will be less than for the conventional fuels. Since the oxygencontent of DME and methanol is low, and there are no carbon-carbon bonds, the sootformation with direct injection and diffusion flame combustion of these fuels will benegligible in contrary to other fuels.

RENEWA
Ecotraffic ERD3 AB Contract No. 4.1030/Z/01-119-2001December 2003
116
Table 29. Fuel properties
Fuel property PetrolEU 2005
Diesel fuelSwe EC1 Methanol DME Propane
Chemical compositionCoal, % C ~86,5 ~85,75 37,5 52,1 81,7Hydrogen, % H ~13,5 ~14,25 12,6 13,1 18,3Oxygen, % O 0-2,7 0 49,9 34,7 0
Mole weight ~100 32,042 46,068 44,094Viscosity @ 40°C (cSt) 1,4-4,0 0,60 0,25Density (gas) @ 20°C (kg/m3) 1,35 1,92 1,88Density (liq.) @ 20°C (kg/m3) 730-770 810-820 795 668 501Gas density rel. air (15°C) 3,4-4 4-5 1,11 1,59 1,52Vapour press.@ 20°C (bar) <0.5 kPa 0,12 5,1 8,4RVP at 37,8°C (bar) 0,0007 0,32 8 13,5Vapour press. @ 60°C (bar) 0,77 14 20,8Boiling point @ 1 bar(a) 30-225 180-300 65 -24,9 -42,1Melting point (°C) <-26 -94 -141 -190Flash point >50 11 -41 -100Heat of evaporation (MJ/kg) 0,25 1,17 0,41 0,43Heat of comb., HHV (MJ/kg) 22,65 50,3
HHV (MJ/lit.) 18,0 25,6LHV (MJ/kg) 42,5 42,3 19,9 28,43 46,4LHV (MJ/lit.) 32,0 35,2 15,8 19.0 23,5
CO2 formation, LHV (g/MJ) ~74,3 ~72,3 68,9 67 64,6Autoignition temp. (°C) ~250 235-350 470Flammability limits (%vol) 1,4-7,6 0,6-6,5 6,7-36 3,4-17 2,1-9,4Water sol. @ 1 bar, 20°C (%m) unmisc ∞ 5,7 0,39Water sol. @ 4,8 bar, 20°C (%m) ∞ 5,5Sulphur content (ppmw, mg/kg) 50 10 0 0 0Olefins, max (%) n.l. 0 0 0Benzene (%) <1 0 0 0Aromatics, max (%) <42 <5 0 0 0PAH, tri+ (%) <0,02 0 0 0Cetane number n.a. >51 ~5 >55 n.a.Octane No. (RON) >95 n.a. 120 n.a. 112

RENEWA
Ecotraffic ERD3 AB Contract No. 4.1030/Z/01-119-2001December 2003
117
8.1.1 Potential fuel converters for methanol and DME
Driving forces for a technology shift Engine and vehicle development is driven today by a number of partly conflictingrequirements. These are:
• Safety
• Exhaust emissions
• Reduction of climate gases (primarily CO2)
The first issue (safety) is of significant importance for light-duty vehicles (though ofsomewhat less importance for heavy-duty vehicles) but it is left without further comments,while the two remaining issues are of significant interest to discuss.
Emission regulations have been passed for light-duty vehicles for the to 2005/2006 (EuroIV) and for engines used in heavy-duty vehicles to 2008/2009 (Euro V). These emissionlimits are reasonably well known and the technology for meeting them is being developed.Therefore, no particular analysis of the impact of the emission norms is made here. Ingeneral, alternatively fuelled engines have many advantages over conventional fuelsregarding the emissions. The primary driving force for the emission development will be tomeet the limits for the conventional fuels (petrol and diesel fuel). The routes chosen forengine and aftertreatment development will also have a substantial impact on theadaptation of these engines for alternative fuels. Consequently, the development on theconventional fuels must be taken into account when assessing the potential of futuredevelopment of the alternative fuels.
In order to reduce climate gases from transportation, the European car manufacturer’sassociation ACEA and the EU have agreed on voluntary future limits for CO2 emissionsfor light-duty vehicles. Later, the Japanese (JAMA) and Korean (KAMA) manufacturersagreed on similar commitments but with one year delay. The limits (target and indicativetargets) for ACEA are shown in Table 30.
Table 30. Voluntary limits for CO2 emissions in Europe
Year CO2 (g/km) Red. (%) Remarks1995 185 0% Base level for the comparison2003 165 – 170 -9,9% Indicative target range2008 140 -24,7% Target for 20082012 120 -35,5% Indicative target for 2012
A technology shift is currently taking place for both otto and diesel engines. The potentialfor fuel consumption and CO2 reductions is the driving force in both cases. The technologyreferred to is direct injection of the fuel − both in the petrol and the diesel case.

RENEWA
Ecotraffic ERD3 AB Contract No. 4.1030/Z/01-119-2001December 2003
118
During the last couple of years, significant progress has been made on fuel cells. Severallight-duty vehicles have been demonstrated by various car manufacturers and technologysuppliers. Limited production of vehicles is about to begin within a few years. However, alarge-scale introduction of fuel cell cars is not likely during this decade. The best choice offuel for the fuel cells has not yet been determined. Hydrogen, methanol and reformulatedpetrol are some of the candidate fuels being discussed. Low or zero emissions is one of thedriving forces for the use of fuel cells and the potential for high efficiency is the secondprimary driving force.
8.1.2 Otto engine An important question regarding the use of alternative fuels is the level of optimisation ofthe engines to the fuels and consequently, the question rise whether the alternative fuelshave specific advantages that could be utilised in the development. It is plausible that thefull potential of these fuels has not been fully exploited today. Some estimations andassumptions are used to elucidate these issues. The assessment is based on the baselinepetrol-fuelled engine. Consequently, the development of an engine for this fuel is describedfirst.
Alcohols It is well known that the alcohols, ethanol and methanol, have specific advantages in ottoengines – these fuels are simply “natural” otto engine fuels. First, the octane number ishigher than for petrol. Second, the alcohols have a higher latent heat of evaporation thanpetrol and since the energy content (per litre or per kg) is lower, a total evaporation of thealcohols would give a considerably lower temperature of the air-fuel mixture than petrol. Itis notable that alcohol engines have a higher volumetric efficiency than petrol-fuelledengines, which implies that the physical properties of the fuel have an impact. Yet anotheradvantage for the alcohols is a slightly increased mass flow rate per unit of energy causedby the lower energy density of the fuel. This also gives a small contribution to increasedpower and efficiency.
The greatest problem with alcohol fuels in otto engines today is the substantial increase inemissions when the engine is cold started at low ambient temperature. This problem shouldbe possible to solve in the future when new engine technology (e.g. direct injection) will beavailable.
Perhaps the most interesting question about future alcohol engines with direct injection iswhether these engines can be made fuel flexible (FFV). Even if this concept is acompromise in comparison to a dedicated engine, FFV is a concept that must be usedduring an introduction phase. It is well known that the injection system and air-fuelpreparation in a diesel engine is not particularly well suited for FFV operation, since thedifferences in fuel density (volume) for the fuels in mind (diesel and alcohol) are vast. Insummary, we have anticipated that the future alcohol-fuelled otto engine will be equippedwith direct injection and that it will be a FFV type. Instead of using M85 and E85 fuels, wehave anticipated “clean” alcohols (besides denaturants), i.e. M100 and E100. The vastlyimproved cold start properties of the direct injection should enable blending with petrol. Byusing this fuel strategy, the option of using the same fuel quality for both alcohol-fuelleddiesel and otto engines is created under the condition that the diesel engines do not needblending with an injection improver.
RENEWA
Ecotraffic ERD3 AB Contract No. 4.1030/Z/01-119-2001December 2003
119
An advantage of alcohol fuels in direct injection otto engines would be the foreseenreduction in soot and particulate formation in comparison to petrol. The particulateformation in direct injection petrol engines is a particular problem (especially at lowambient temperatures), since these emissions are approaching those of modern dieselengines without particular filters.
8.1.3 Diesel engine A diesel engine optimised for diesel fuel is the basis for diesel engines fuelled withalternative fuels. No decisive differences in efficiencies have been anticipated for the fullydeveloped diesel engines running on alternative fuels.
Diesel fuel The greatest obstacle for diesel engines is still the NOX and particulate emissions.Particulate traps are now being commercialised by one car manufacturer (Peugeot-Citroën)while other manufacturers have announced that they also are developing filter systems.The technology for reducing the NOX emissions will not be introduced in larger scale untillow-sulphur fuel is available on several markets in Europe. In order to fulfil future NOXemission limits – that are anticipated to be significantly stricter in the future for diesel-fuelled cars, presumably similar to petrol cars – a NOX storage catalyst will be necessary.
DMEDME is a ”natural” fuel for diesel engines due to the exceptionally high cetane number.Therefore, the same efficiency as for diesel fuel is possible for a diesel engine adapted forDME. DME is non-toxic and should have an inherent property of significantly reducing thetoxic emissions in the exhaust in comparison to conventional diesel fuel. A significantreduction of the NOX emissions for DME in comparison to diesel fuel has been found inseveral studies. Particulate formation is largely avoided with DME in comparison tohydrocarbon fuels. DME also provide the opportunity for using higher rate of EGR, whichfurther reduced the NOX emissions compared to diesel fuel. Deducing from the limitednumber of studies available, it seems that the use of a NOX reducing catalyst should be aviable solution for this fuel. Since DME is sulphur-free, the use of effective aftertreatmentdevices in general is more easily facilitated with DME than with sulphur containing fuels.
A particular problem with DME as a motor fuel is the fuel injection system. Severalproblems arise from the physical and chemical properties of DME. DME attack mostelastomers and therefore, proper seals have to be developed. This problem is also evidentin the distribution system. Furthermore, DME has a very low lubricity and thus, onesolution would be to develop proper additives to improve the lubricity. Recently, newinjection systems are being developed with this purpose and the results available so farappear promising. Although emission results also look very promising, much basicresearch is needed to utilise the full potential for emission reductions compared to dieselfuel. In summary, the large-scale commercial introduction of DME will not happen in thenear future. The next objective might be to aim for a small-scale demonstration fleet withDME.
A DME engine cannot be made fuel flexible, without too large compromises and at areasonable cost. This is of course a significant disadvantage during an introduction phase

RENEWA
Ecotraffic ERD3 AB Contract No. 4.1030/Z/01-119-2001December 2003
120
and, in particular, this is of importance for general use of this fuel, as in case of passengercars.
Alcohols The experience from heavy-duty vehicles has shown that ethanol and methanol could beused in diesel engines. An external ignition source, such as a glow plug, is foreseen toavoid the use of an ignition improver in the fuel. The necessity to use an external ignitionsource for the alcohols is a significant disadvantage in comparison to other alternativefuels, such as DME and FTD.
The NOX emissions will be lower for the alcohol engines than for diesel fuel andsimultaneously the rate of EGR can be increased, which further reduces the NOXemissions. In general, the soot and particulate formation is significantly reduced withalcohols. The application of a NOX reducing catalyst should be easily facilitated onmethanol according to limited test data, due to the excellent properties of methanol as areducing agent.
As in the case with DME, there are no practical opportunities to make alcohol dieselengines fuel flexible.
8.1.4 Fuel cells Hydrogen is the preferred fuel for the fuel cell stack, since no reforming of this fuel isnecessary. However, the distribution, refuelling and storage of hydrogen in the vehicle area significant problem for hydrogen. Therefore, other fuels are being considered.
Both methanol and DME could be used in a fuel cell. Today, there is almost no experienceavailable in the public domain database about the use of DME in fuel cells so allstatements must be based on theoretical considerations. Reforming is somewhat easier andmore energy efficient in the methanol case. Furthermore, methanol is a liquid fuel that isless costly to distribute.
8.1.5 Fuel cell – internal reforming (DMFC) Today, there is little information available about direct methanol fuel cells (DMFC) andtheir performance. Up to now, the reported efficiency for these fuel cells has been very low(seldom more than 15%) but it could be expected that a maximum efficiency of more than40% is possible with new breakthrough technology. Significant improvements of thissystem have been made recently, and therefore, this alternative cannot be overlooked.However, it is not clear whether the expectations for the DMFC fuel cell can be fulfilled.On the condition that a high efficiency can be achieved in the future, this option would bevery interesting, since it is a notably simpler system than a fuel cell with reformer. TheDMFC technology can only be applied on methanol and consequently, other fuels are oflittle interest for DMFC.
8.2 Handling, regulations and safety Since methanol is toxic, the issues concerning handling and distribution require a specificanalysis. Although both petrol and diesel fuel likewise are toxic when ingested, there is along experience from handling and use of these fuels. Consequently, the number of
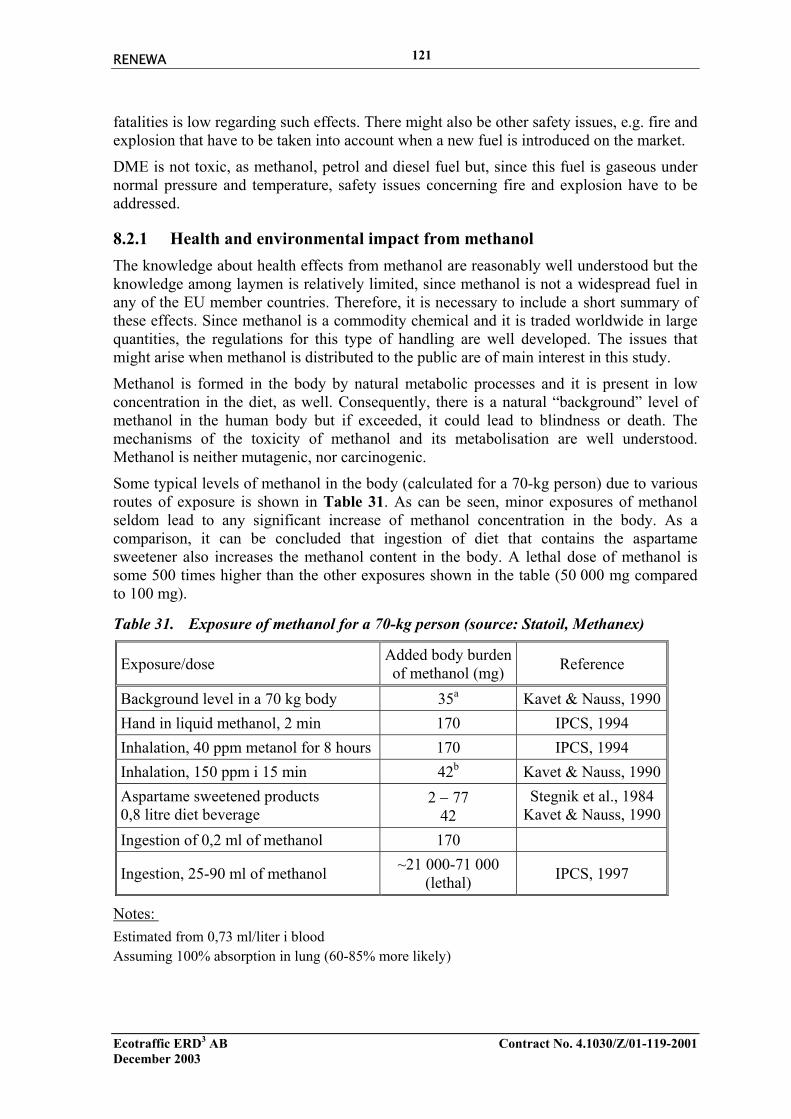
RENEWA
Ecotraffic ERD3 AB Contract No. 4.1030/Z/01-119-2001December 2003
121
fatalities is low regarding such effects. There might also be other safety issues, e.g. fire andexplosion that have to be taken into account when a new fuel is introduced on the market.
DME is not toxic, as methanol, petrol and diesel fuel but, since this fuel is gaseous undernormal pressure and temperature, safety issues concerning fire and explosion have to beaddressed.
8.2.1 Health and environmental impact from methanol The knowledge about health effects from methanol are reasonably well understood but theknowledge among laymen is relatively limited, since methanol is not a widespread fuel inany of the EU member countries. Therefore, it is necessary to include a short summary ofthese effects. Since methanol is a commodity chemical and it is traded worldwide in largequantities, the regulations for this type of handling are well developed. The issues thatmight arise when methanol is distributed to the public are of main interest in this study.
Methanol is formed in the body by natural metabolic processes and it is present in lowconcentration in the diet, as well. Consequently, there is a natural “background” level ofmethanol in the human body but if exceeded, it could lead to blindness or death. Themechanisms of the toxicity of methanol and its metabolisation are well understood.Methanol is neither mutagenic, nor carcinogenic.
Some typical levels of methanol in the body (calculated for a 70-kg person) due to variousroutes of exposure is shown in Table 31. As can be seen, minor exposures of methanolseldom lead to any significant increase of methanol concentration in the body. As acomparison, it can be concluded that ingestion of diet that contains the aspartamesweetener also increases the methanol content in the body. A lethal dose of methanol issome 500 times higher than the other exposures shown in the table (50 000 mg comparedto 100 mg).
Table 31. Exposure of methanol for a 70-kg person (source: Statoil, Methanex)
Exposure/dose Added body burdenof methanol (mg) Reference
Background level in a 70 kg body 35a Kavet & Nauss, 1990Hand in liquid methanol, 2 min 170 IPCS, 1994Inhalation, 40 ppm metanol for 8 hours 170 IPCS, 1994Inhalation, 150 ppm i 15 min 42b Kavet & Nauss, 1990Aspartame sweetened products0,8 litre diet beverage
2 − 7742
Stegnik et al., 1984Kavet & Nauss, 1990
Ingestion of 0,2 ml of methanol 170
Ingestion, 25-90 ml of methanol ~21 000-71 000(lethal) IPCS, 1997
Notes: Estimated from 0,73 ml/liter i bloodAssuming 100% absorption in lung (60-85% more likely)

RENEWA
Ecotraffic ERD3 AB Contract No. 4.1030/Z/01-119-2001December 2003
122
A concluding remark about the levels of exposure is that “normal” exposures hardly couldcause a lethal dose of methanol. Some unintended and intended exposure (i.e. ingestion)could result in lethal doses. Statistic information from the USA shows that of theapproximately 10 cases of lethal exposure that are registered every year, about 50% arerelated to suicides. However, in many of the other cases, the reason is unknown, whichcould render an even higher percentage of suicide. Whether these fatal cases could beinfluenced (increased or decreased) by an increased use of methanol (i.e. widespread use)is pure speculation.
Inhalation and skin exposure Longer exposure to methanol through inhalation and skin penetration will give similartoxic reactions as ingestion, since methanol is readily distributed in the body regardless oftype of exposure. The risk of high exposure due to inhalation seems to be limited due to thelow concentrations of methanol vapour in the air during normal handling of methanol. Thisis also a general feature for skin penetration, as only extreme carelessness would lead tohigh exposure.
Both petrol and methanol penetrate through the skin but the absorption is faster in themethanol case since the methanol molecule is smaller than the (average) petrol molecule.On the other hand, methanol evaporates faster from the skin, which reduces the totalexposure, since the contribution from inhalation will be far less than from skin penetration.
Use of methanol in windshield washer fluid Methanol is used in in windshield washer fluid in North America, whereas isopropanol,and in some cases ethanol, is used in Sweden and Europé. The use of alcohols inwindshield washer fluid is to avoid freezing.
The use of methanol in windshield washer fluid is an example of widespread use ofmethanol by the public, although the concentration usually is less than 50%. It may appearobvious that windshield washer fluid should not be ingested, regardless of which alcohol isused as freeze protection, as the fluid contain other substances than methanol and water. Itis evident that methanol used in this application can be handled without significantfatalities in Northern America.
Health and environmental risk of DME DME is not toxic, nor carcinogenic or mutagenic. DME is commonly used today as anaerosol propellant. Due to this use, comprehensive investigations have been carried outabout the health effects of DME. Apparently, no health risks seem to occur. Consequently,DME has a competitive advantage over many other fuels in this respect.
8.2.2 Fire and explosion danger Methanol is classified in a similar class as petrol, i.e. class 1, implying that the flash pointis so low (<-21°C) that fire and explosion danger must be considered. The lower vapourpressure of methanol in comparison to petrol implies that the possibility of reaching aflammable mixture in open areas is lower than for petrol. This advantage is furtherenhanced by a lower density for methanol vapour (1,1:1) than for petrol vapour (up to 4:1)

RENEWA
Ecotraffic ERD3 AB Contract No. 4.1030/Z/01-119-2001December 2003
123
in relation to air. Still there is a risk for ignition under these circumstances, for example incalm weather, which motivate the fire classification.
If methanol vapour is ignited, the heat release rate is significantly lower than for petrol.The lower heat of combustion and higher heat of evaporation leads to that methanol burnswith a speed of only a fourth of the speed of petrol. Consequently, the energy release isonly about one-fifth to one-eighth of the level for petrol.
Methanol is combusted with an almost invisible flame in sunlight, in contrast to petrol anddiesel fuel that both have a yellow flame. A yellow flame indicates that soot is formed,which is not the case for methanol. A lower heat radiation in a methanol fire is the result ofthe less visible flame. Lower heat radiation is an advantage, since the ignition of otherflammable materials near the fire is less likely. Furthermore, fire fighters can approach thefire closer.
Methanol is fully soluble in water and this is of an advantage from a fire fighting point ofview. In contrast, petrol and diesel fuel will float on top of water, with the potential forsteam explosions and further spread of the fire.
The properties of methanol regarding fire hazard have been considered an importantfeature in motor sports, e.g. in the US CART series, where methanol is the prescribed fuel.
DME has not been investigated thoroughly in this study regarding its hazards for fire andexplosion, since no experience is available from widespread public use of this fuel butsome comments are nevertheless included. DME has similar physical properties as LPGand consequently, some of the experiences from LPG can be applied to DME as well.DME burns with a visible flame and has less flame radiation than petrol. Containers(tanks) for DME are stronger than petrol tanks and therefore, the risk of leak in a collisionand due to other damage is less. The dispersion of DME is faster than petrol due to the lowvapour density (1,5:1), but on the other hand, the formation of vapour clouds is faster.Likewise, the persistence of clouds in still-air is more likely than for petrol. DME is likelyto have a greater explosion hazard than petrol if it is spilled, due to the wide detonabilitylimits. The flammability risk is higher than for petrol. In summary, it is somewhat difficultto assess whether DME would pose higher or lower risk for explosions and fire comparedto petrol. It is likely that DME must be treated as a more dangerous fuel than petrol in thisrespect.
8.3 Distribution
8.3.1 Release of methanol during distribution The distribution of methanol in general could include various different transportationmodes. In general, methanol of fossil origin is produced at remote sites. Thus, thedistribution could include sea, rail and truck transport. Pipeline distribution is not likelyother than in rare occasions. During distribution methanol could be spilled to surfacewater, ground water, soil and evaporate into the atmosphere.
Spill of methanol to land, water and the air evidently occur, since methanol is one of themostly traded chemicals in the world (No. 3).
The release of crude oil or oil products (such as petrol and diesel fuel) to water and soilgenerally cause great impact on the environment (at least on a local scale). Catastrophic oil

RENEWA
Ecotraffic ERD3 AB Contract No. 4.1030/Z/01-119-2001December 2003
124
spills are regularly occurring on a smaller or greater scale and the environmental impact issometimes great, as for a spill in a sensitive area (e.g. Exxon Valdez in Alaska). Accidentswith tank trucks and rail cars can happen and in such cases, spill to soil and water is oftenthe case. The question is what the consequences of a methanol spill would be in similarcases, as described previously.
Methanol is readily soluble in water in contrast to oil products that have a very limitedsolubility in water. Therefore, the acute toxicity will be noted in direct association to thespill area only, but below a certain concentration methanol is not toxic. Instead, some lifeforms will metabolise methanol, i.e. use the methanol as nutrition. Such an example is thatmethanol is used today for just this purpose, i.e. as nutrition for the microorganisms used inwastewater treatment (denitrification, i.e. removal of nitrates).
Spill of methanol to surface water will result in a fast dispersion due to the infinitesolubility in water. At a concentration level of less than 1%, it is no longer toxic andtherefore, the acute effect is only local. Estimations of a spill of 10 000 ton of methanol inthe sea show that a concentration would be less than 0,36% within less than one hour.
Methanol is dissolved very fast in the ground water after a spill on land, and this might bea drawback in comparison to petrol and diesel fuel, where the diffusion is not as fast. In aworst-case situation, this could lead to a faster contamination of water supplies. However,it is not likely that the diffusion would be so fast that precautionary measures could not betaken to avoid the distribution of contaminated drinking water. Again, the advantage offaster biodegradation limits the damage to a local scale.
In summary, methanol should have significant advantages compared to petrol regardingreleases to soil, water and air (and compared to diesel fuel in some cases).
8.3.2 Material compatibility and cost issues Issues regarding material compatibility and associated cost have been investigated inearlier studies by the author’s organisation. One example is a study by Ecotraffic for theSwedish Governmental Agency KFB (today part of the agency Vinnova). Another exampleis a study by the consultant company EA Engineering that was carried out for AMI.
The relatively new report by EA Engineering provides an overview of the distribution ofmethanol and identifies the necessary measures compared to the distribution of petrol. Thereport concentrates on the cost for upgrading an existing distribution system. The authorsconcluded that a new refilling unit (replacement of a petrol tank of 10 000 gallon) could beinstalled for a cost of approximately 10 000 USD. Upgrading of an existing unit could cost19 000 USD. In both cases, the authors concluded that the incremental cost was relativelylow. In Sweden, several oil companies have rebuilt existing tanks to be compatible withmotor alcohols. This is now a common procedure in rebuilding tanks (new tank linings,etc.) and when new refilling stations are built, they are made alcohol compatible.
A Swedish company of fuel dispensers, Identic, is currently developing a new spill-freedispensing system for methanol. A prototype system has been installed in the Necar 5prototype fuel cell car by DaimlerChrysler.
It could be of interest to show the potential incremental cost of distributing methanol incomparison to petrol. Evidently, there is an additional cost related to methanol. First, this isdue to the use of more expensive materials in the methanol case. Second, an increase in thefuel volume has to be taken into account, as methanol has low energy density. In

RENEWA
Ecotraffic ERD3 AB Contract No. 4.1030/Z/01-119-2001December 2003
125
comparison to petrol, the volume increase would be some 40% for ethanol and 85% formethanol. In a previous study by Ecotraffic, the incremental cost of distributing ethanoland methanol was estimated. Since this work was completed in 1996, the cost wasrepresentative for the situation in mid 1990’s.
The results from the mentioned study areshown in Table 32. As can be noted, thedistribution cost for substituting one litre ofpetrol is 11,3 €c for methanol and 10,3 €cfor ethanol, i.e. an advantage of 1 €c forethanol. As reference, the cost of distributingpetrol was estimated to 8,5 €c per litre.Consequently, the incremental cost ofdistributing methanol is 2,8 €c per litrepetrol substituted. If the fact that the engineefficiency can be increased by using anoptimised methanol engine in comparison toa petrol engine would be taken into account,the incremental cost could decreasemarginally.
The incremental cost of substituting petrol (or diesel fuel) with DME is significantly higherthan for methanol simply because DME has to be handled under pressure. The cost ofDME distribution was calculated in a previous report by Ecotraffic. Since DME is a fuelfor diesel engines, the comparison was made with diesel fuel. However, as the previousfigures for motor alcohols were compared with petrol, the results in the mentioned reporthave been recalculated for a substitution of petrol. The recalculation gives a cost of 14,2 €cper litre of substituted petrol. This is almost 3 €c higher than for methanol and nearly twice(5,7 €c) the difference between methanol and petrol. As diesel engines are more efficientthan otto engines, the comparison with petrol would be more favourable if this was takeninto account.
Table 32. Distribution cost for alcohols(€c per litre petrol equivalent)
Distribution stage Methanol EthanolSea transport 1,1 0,85Depot 1,7 1,6Land transport 1,3 1,0Refuelling station 2,7 2,35Charge, distributor 2,0 2,0Charge, station 2,5 2,5Total distr. cost 11,3 10,3

RENEWA
Ecotraffic ERD3 AB Contract No. 4.1030/Z/01-119-2001December 2003
126
RENEWA
Ecotraffic ERD3 AB Contract No. 4.1030/Z/01-119-2001December 2003
127
9 LEGISLATION OVERVIEW
9.1 EUThe Directive 1999/31/EG on landfilling is a comprehensive description of the operation ofa landfill, with respect to the handling of waste, as well as continuous monitoring ofleaching water and air emissions. The cost for depositing waste on a landfill is, however,not quantitatively expressed. The landfill principal should, however, claim a price that issufficiently high for both the continuous operation of the unit and the close-down and post-treatment during at least 30 years.
The operation of waste incinerators is governed by Directive 2000/76/EC on theincineration of waste. The main objects are to eliminate or reduce the negative effects onthe environment. To accomplish these targets the operation of waste incineration plants isthoroughly regulated with respect to what waste that may be processed, what operationconditions that must be fulfilled in terms of residence time and temperatures and emissionthreshold values and control procedures.
9.2 SwedenAs for the EU, the Swedish legislation comprises a number of directives on the incin-eration of waste as well as restrictions on landfilling. The technical operation is regulatedthrough NFS 2002:28, which is an extension of SFS 2001:1063. Here, threshold values aregiven for emissions to air and water recipients. The contents of NFS 2002:28 are similar tothe European Directive 2000/76/EC. Landfilling is regulated through SFS 2001:512, whichis the Swedish version of the European Directive 1999/31/EG.
The new Directive on landfilling requires better barriers and sealing. Also, leaching watermust be withdrawn and collected. The implementation of the new regulations onlandfilling will result in that at least half of the domestic 500 waste disposals will bedecommissioned. This will reduce a large number of facilities into a smaller number oflarge units with high standard and good control.
Taxes of 27 EUR/tonne were introduced in the year of 2000 for landfill deposit11, even sothe total amount of waste is still increasing. This tax was increased in January 2003 andcurrently amount to 41 EUR/tonne (SFS 2002:998). The total fee, including taxes, onwaste depositing is 44-1,100 EUR/tonne, where the lower figure is most representative forthe major part of the handled waste. The waste that is deposited is decreasing and in 1994amounted to 160 kg/capita and in 1999 103 kg/capita and the decreasing trend iscontinuing. A part of the current development is explained by the fact that deposition ofcombustible waste is prohibited from 2002 and deposition of organic waste from 2005.
11 There are, in some occasions, possibilities to get tax reductions on ashes being deposited, for instanceutilisation as construction material within the plant area or used in order to stabilise other deposited material.

RENEWA
Ecotraffic ERD3 AB Contract No. 4.1030/Z/01-119-2001December 2003
128
9.3 NorwayThe situation in Norway is not different to Sweden with respect to the decrease in thenumber of landfills. The current waste deposit is expensive and may amountto 110 EUR/tonne. The average cost is 99 EUR/tonne, of which taxes constitute 40 EUR.
Norway has since 2001 had a ban on depositing wet-organic waste. This is, however, notultimately prohibited, but it is decided for every individual site. The total capacity of theNorwegian incineration facilities is not sufficient and currently, waste is exported toSwedish incineration plants.
9.4 GermanyIncineration of waste in Germany is performed under stringent safety standards. In 1990the 17th Federal Imission Control Ordinance was adopted, which sets limits ondioxins/furans and heavy metals [31]. The EU directives on landfill of waste and theincineration of waste mentioned above, follow the basic principles developed in Germanyand a few other European countries.
Germany has during the 1990’s tried to gain better control of the waste problems, usingeconomical mechanisms. There was an attempt to establish a Waste Charges Act, whichrequired the operator of a disposal facility to pay a fee for each tonne of waste. This Actwas never implemented but the work was instead further aimed at minimising waste in theClosed Substance Cycle and Waste Management Act. Simultaneously, the EC FrameworkDirective on Waste was implemented (75/442/EC). The new regulations and ordinancesstipulate that landfills that fail to meet the required standards must be shut down by theyear 2005, or with only small deviations, by 2009 at the latest. Some 200 landfills forwaste now need to be decommissioned.
Currently, there are no restrictions on putting waste in landfills above the EuropeanDirective from 1999, neither are there any taxes on landfilling or incineration. There is,however, a fee on depositing of 15-175 EUR/tonne. In the year of 2005 there will be a banon depositing organic waste, similar to the Swedish conditions [32]. An estimation of theannual deficiency of German incineration capacity is 3-4 Mtonnes of waste.

RENEWA
Ecotraffic ERD3 AB Contract No. 4.1030/Z/01-119-2001December 2003
129
10 SUMMARY, BARRIERSThis chapter summarises the most important barriers for increased utilisation of energyfrom waste through thermal conversion. Waste in this context is both Municipal SolidWaste (MSW) and Refuse Derived Fuels (RDF) from industrial waste.
10.1 EconomyThe most important barrier, or motive force, is economy. Solutions to different kinds ofbarriers can almost always be found but if implemented or not is a question of costs andcompetitiveness to other alternatives.
Today landfilling in Europe is in general cheaper than incineration. It is therefore hard tofind investors to incineration plants and distribution systems for district heating. However,in the northern and colder parts of Europe the demand for heating is high making itpossible to utilise the energy in the waste as heat in a competitive way.
The high costs for Waste-to-Energy plants is mainly related to:
• Flue gas treatment
• Maintenance due to corrosion and erosion
• Capital costs due to the need of oversized plant design
• Disposal of by-products
A first solution to the problem would be to implement taxes on landfilling with the purposeto make thermal treatment more competitive.
Another way is to increase the quality of the waste fuel. This could be done by sorting outwaste fractions at source making it possible to mix combustible fractions to a well-specified fuel with only small variations in composition and quality. The plant designcould be made more cost effective since it will be less oversized. This solution requireslong term political conditions and ambitions for waste sorting at source.
The market conditions for energy based on waste needs to be improved by making itpossible to market energy from waste as Green energy in relation to the biomass content inthe waste.
Concerning gasification the economic considerations is even more important. Producteconomics is by many identified as the most important determinant in gasificationtechnology deployment potential [33].
However, the results of this study show that production of automotive fuels from waste haspotential to be an environmentally and economically viable solution in the future. With agate fee of fully 50 EUR/ton the cost for the automotive fuel is on parity with the price ofdiesel oil. By further optimisation this can be improved to give margins to profit and fueltax. Since the produced fuel is based mainly on biomass this part should be exempted fromfossil fuel taxes.
RENEWA
Ecotraffic ERD3 AB Contract No. 4.1030/Z/01-119-2001December 2003
130
Improvements would also be possible with a higher quality of the waste. A well specifiedwaste raw material with small variations in composition make a more effective plantdesign possible with improved overall economy. Studies on automotive fuel production bygasification in a full scale demonstration plant using pure wood waste (forest residues), amuch better raw material than waste, gives a price of 6.2 EURc/kWh [7] compared to8.7 EURc/kWh in this study. This indicates the potential cost reductions possible byraising the quality of the waste. It also indicates that available waste should be used forheating and wood for automotive fuel.
As with most new technologies, gasification projects require a higher hurdle rate, or highercost of capital, than projects using existing technology. That is, investors require a higherrate of return on their investment in a relatively new or untested technology to offset therisk in not knowing how the technology may perform in the marketplace. Unfortunately,gasification technology advantages with regard to reducing criteria pollutants, solid waste,and atmospheric mercury are non-monetized and do not provide any type of financialoffset to the cost of gasification projects.
10.2 Technology barriersTechnology barriers could rather be seen as economical barriers. Especially in the case forincineration which is a well-proven application. Most technology problems can be solved.It is just a question of costs and the competitiveness to other energy production.
10.2.1 Technology barriers-IncinerationThe major barriers within waste thermal treatment are non-technical. More stringentdemands can technically be achievable to almost any level of the penalty of rapidlyincreased cost of treatment. However, alternative treatment procedures (composting,anaerobic digestion) entail the risk of even higher costs of treatment, as large masses ofresidues requiring post-treatment are generated. Incineration of these can become anecessary part of such Waste-to-Energy installations.
Emission control and flue gas cleaning systems are the necessary equipment within wastecombustion for elimination of the risks of emission of environmental pollutants. There is aclear relationship between the amount of the pollutant released during combustion and thecontent of the pollutant precursors in the raw material. Because of variations in the qualityof the raw material and uncertainties upon the amount pollutant precursors the capacity ofthe gas cleaning systems must be dimensioned in a manner for being able of handling amaximum possible emission.
Compared to other solid fuels, waste usually contains a considerable higher amount ofinorganic material. A high inorganic content increases the total throughout of the ashtrough the process resulting in faster erosion and wear out of tubs, vessels and filteringequipment.
Deposit formation during thermal treatment of waste occurs throughout differentmechanisms but the formation of condensable products is a necessary step for initiation ofdepositing and fouling. In fluidised bed processes severe problems of bed materialagglomeration and sintering occurs. Periodical interruptions in operation due to fouling and

RENEWA
Ecotraffic ERD3 AB Contract No. 4.1030/Z/01-119-2001December 2003
131
sintering is well known problem that decreases the reliability of the waste combustionprocess in energy production applications.
A total reduction of the sulphur and chlorine from the waste composition is practicallyimpossible, hence, for minimising the corrosion rate the temperature of the heat exchangersurfaces is kept down in a lower level than that for the clean fuels. This also results in lesspotential for energy recovery as electric power typically to 20% compared to 30 – 40% forother fuel.
Waste thermal treating plants suffer from serious problems related to corrosion on heatexchanger and superheater surfaces. The corrosion is dependent on the environment andthe temperature. Increased temperature in a corrosive environment accelerates thecorrosion rate. To suppress the corrosion the boiler and heat recovery systems in wastetreating plants are normally operated at lower temperature than in the case with clean fuels.The low steam temperature (<420°C) and steam pressure result in an insufficient electricalefficiency for the whole process.
10.2.2 Technology barriers-Gasification/Fuel ProductionThe most important technology barriers for producing automotive fuels throughgasification of solid waste are presented in this section. The following problems have beenidentified:
• Waste is a heterogeneous feedstock. It is uncontinueous and unpredictable.
• Waste has low energy content.
• There is relatively little information on gasification of waste, and a lot of wastegasification projects in the past have failed.
• Gasification in general suffers from poor process reliability.
• Feeding systems for high-pressure gasifiers are not yet satisfactory.
• What to do with the ash/slag from the gasifiers.
Each of these issues is discussed in detail below.
1.) Municipal Solid Waste (MSW) is not a continuous and predictable feedstock. Thecomposition of MSW [34]
• changes from country to country
• is very different for rural areas compared to urban areas
• can vary over the seasons and is changing over a long period of time as a countrydevelops or implements different waste management strategies.
Gasification is an extremely complex and delicate process and may therefore not be wellsuited to treat the highly heterogeneous waste [35]. The following technical problems arereported to have been encountered when attempting to gasify waste:
• Syngas is an inflammable and explosive gas. This requires high safety measures.
• The syngas has to be cooled before it can be cleaned. This quenching results in animportant loss of energy, which in turn results in a lower overall efficiency.

RENEWA
Ecotraffic ERD3 AB Contract No. 4.1030/Z/01-119-2001December 2003
132
• After cleaning the syngas, it will still contain some impurities and pollutants. This willresult in corrosion/erosion problems in the gas turbine or gas engine. In general, gasturbines and gas engines are designed for clean gaseous fuels like natural gas or syngasfrom oil.
• The process produces a char and tar which has to be taken care of.
In order to overcome the char and tar problem, additional air has to be introduced in thesystem. This results in a higher degree of oxidation of the syngas and therefore a lowercalorific value. Some suppliers try to overcome this problem by using pure oxygen insteadof air, which results in an increased operating cost (high power consumption). Oftenmethane gas is mixed with the syngas in order to keep the calorific value constant andsufficiently high for the gas turbine or gas engine.
2.) Feedstock preparation issues in gasification focus mainly on the use of low-rank coalsand alternative feedstocks such as waste, sewage sludge, and biomass [36]. Suchfeedstocks suffer from low energy density and high moisture content, making themuneconomical for transport over very large distances. In addition, physically handling andpreparing many of these materials for use in gasifiers are impediments to their use. Evenafter dewatering some materials, problems with feeding have been experienced, especiallyfor fibrous materials such as biomass.
3.) The gasification process was used with waste in the United States in the 1970s, butthose plants have been shut down because of operating and financial problems. Somegasification plants were built and operated in Europe in the early 1980s. Los Angeles had asystem designed to use dried sewage sludge. The gas was burned to drive a 10 megawattsteam turbine-generator [37].
4.) In July 2002, the U.S. Department of Energy investigated present and futuregasification technologies and markets from an industry perspective, by interviewing expertteams from 22 prominent organizations across a wide span of the U.S. gasification industry[38]. For gasification as a whole, process reliability is identified by nearly all participantsas the single most important technical limitation to be overcome in order to achievewidespread deployment of the technology.
5.) Operation and maintenance issues remain regarding erosion and corrosion of valves,pipes, and pumps. The development of new or improved feeding systems for high-pressuregasifiers remains fairly high on the list of priorities. For plants processing opportunityfeedstocks, the feed system is typically the cause of reliability problems and developmentsare needed to improve performance with such feedstocks in high-pressure gasifiers.
6.) As the number of gasification plants continues to increase in the world, the dispositionof the ash and slag becomes increasingly important. New markets and ways of utilizing theash/slag from gasifiers need to be developed because disposing of this material in a landfillis expected to become a significant issue in years to come. Currently, it is difficult to find amarket for the ash and slag where its value exceeds transportation costs. It is desirable forthe ash/slag to be a revenue-generating stream and help drive the technology to fullutilization of all waste materials.
Mr. Dirk Eeraerts, SEGHERS Better technology Singapore Pte. Ltd., concludes ongasification of municipal solid waste [39]:

RENEWA
Ecotraffic ERD3 AB Contract No. 4.1030/Z/01-119-2001December 2003
133
“Gasification is successfully applied for thermal conversion of predictable and clean fuelssuch as coal, petrol and gas. The technology also has potential for power generation usingcertain biomass fuels (crop wastes) and dried/pelletized wastewater treatment sludge. ForMSW, gasification remains unreliable, too expensive and too risky.”
10.2.3 How to overcome the technology barriersThe U.S. Environmental Protection Agency (EPA) recently recognized the superiority ofgasification in processing refinery wastes and the associated waste source reduction andthe recycling of wastes into usable by-products [40]. Similar action on non-refinery-basedtoxic compounds, such as PCBs, is hoped for in the near future. It is considered that withsome research and development on municipal solid waste (MSW) processing and injection,waste can also become a gasification feedstock subject to waste reduction and recycling,rather than continued treatment and disposal.
In contrast with many other energy technologies that require fuel to be purchased, wastefacilities are paid by the fuel suppliers to take the fuel (known as a “tipping fee”) [41].
Consequently, there appears to be a need to develop new or improved approaches fordewatering and increasing the energy density of waste. It would further be good to developlow-cost briquetting techniques including use of low-cost binders.
According to a recent U.S. Department of Energy report [42], there is a need to develop anaffordable on-line analytical device that can provide the elemental composition of thegasifier feedstock for those situations where the composition is constantly varying, as withthe heterogeneous waste feedstock, or co-feed applications.
The gasification block of a plant is of course very important. As an example, it can bementioned that the gasification block constitutes about 15% of the capital cost of an IGCCplant. There is general agreement that the priority for gasification is to reduce the capitalcost and increase the reliability of gasifiers. Numerous technology needs are identified toaccomplish this. Nearly all of the participants identify the feed injectors and refractoryliners used in gasifiers as the weakest links in the process for achieving high on-streamavailability factors. The need for new process monitoring and control instrumentation forthese weak links is of paramount importance.
10.3 Energy efficiencyProducing only heat from waste could be done with a high energy efficiency. Existingplants today have an efficiency of 70-75% but a state-of-the-art plant will reach efficiencyof 90-95%, but of course to a higher cost. To utilise this high market demand over the yearis required.
Power production from waste has lower energy efficiency in comparison to other "clean"fuels. To minimise the corrosion rate the temperature of the heat exchanger surfaces is keptdown in a lower level than that for the clean fuels. This results in less potential for energyrecovery as electric power typically to 20% compared to 30 – 40% for other fuel. To reachhigh total energy efficiency in a CHP-plant it has to be a demand for the surplus heat.
A waste-to-motor fuel plant has greater energy losses and as for a CHP-plant it has to be ademand for the surplus heat. However, the motor fuel product has a high exergy and isstorable.

RENEWA
Ecotraffic ERD3 AB Contract No. 4.1030/Z/01-119-2001December 2003
134
10.4 TransportTransports of waste, when the waste once has been collected, is of very low importanceconsidering consumption of energy resources, environmental impact and economy, if thetransport is performed in an efficient manner [9]. Private transports of separated waste(from home to the collection site) can be of importance if the transport is made by car sinceenergy use and emissions increase. According to the high demanding regulations onemissions from road transports emissions will not be a problem in the future.
10.5 EnvironmentCompared to clean fuels such as forest residue or natural gas, waste contains higheramounts of N, S and Cl, which are the precursors of NOx, SOx, HCl and dioxins. Otherinorganic compounds of great importance in the waste are heavy metals. During thermalprocessing these compounds becomes concentrated in one of the output streams from theprocess. The content of emission precursors varies significantly in different fractions ofwaste. Though the emissions to air can be reduced to very low levels the pollutants formedduring combustion ends up in the ash and the slag. Even unburned fractions in the slag area problem has to be taken into consideration. The combustion residues have to be takencare of and landfilled under strict regulated conditions. Efforts are made to find use for theresidues, e.g. roads etc., but the product have to be prepared to a stable form with no riskfor leakage of pollutants.
Dioxins are formed during incineration and monitoring is a very costly procedure andrequires specialists with expertise skill of both in sampling and in analysis. The high costsfor measurement results in that the estimations upon the global emissions are often basedon short time and periodical samplings within certain conditions. Since the quality of thefuel and the process conditions can be very different in different periods the results fromsuch estimations can be regarded questionable.
Gasification is environmentally superior to incineration. Gasification is in many wayspreferable to combustion for the destruction of municipal and industrial wastes, andespecially because gasification does not emit dioxins or furans like incineration processesdo.
The U.S. Environmental Protection Agency (EPA) recently recognized the superiority ofgasification in processing refinery wastes and the associated waste source reduction andrecycling of the wastes into usable by-products [43]. Similar action on non-refinery-basedtoxic compounds is hoped for in the near future. And, many believe that with some R&Don waste processing and injection, waste too can become a gasification feedstock subject towaste reduction and recycling, rather than continued treatment and disposal.
The perception that gasification plants are “dirty” because the feedstock are seen as “dirty”is impeding deployment by lengthening the permitting process. Public visions of dust,smoke, unclean water discharges, and solid waste disposal make siting a gasification plantvery difficult.
RENEWA
Ecotraffic ERD3 AB Contract No. 4.1030/Z/01-119-2001December 2003
135
10.6 Legislation
10.6.1 EUThe Directive 1999/31/EG on landfilling is a comprehensive description of the operation ofa landfill. The cost for depositing waste on a landfill is, however, not quantitativelyexpressed. The landfill principal should, however, claim a price that is sufficiently high forboth the continuous operation of the unit and the close-down and post-treatment during atleast 30 years.
The operation of waste incinerators is governed by Directive 2000/76/EC on theincineration of waste. The main objects are to eliminate or reduce the negative effects onthe environment. To accomplish these targets the operation of waste incineration plants isthoroughly regulated with respect to what waste that may be processed, what operationconditions that must be fulfilled in terms of residence time and temperatures and emissionthreshold values and control procedures. One may reflect over the different emission limitsfor incineration and co-firing respectively as shown in Figure 4. The emission limits shouldbe independent on what kinds of fuel are used.
In Council Regulation (EEC) No 259/93 supervision and control of the shipments of wastewithin, into and out of the European Community is regulated. These regulations constitutenot an important barrier but administrative routines and permits are normally required.
10.6.2 SwedenAs for the EU, the Swedish legislation comprises a number of directives on the incin-eration of waste as well as restrictions on landfilling. The contents of NFS 2002:28 aresimilar to the European Directive 2000/76/EC.
Taxes of 27 EUR/tonne were introduced in the year of 2000 for landfill deposit12, even sothe total amount of waste is still increasing. This tax was increased in January 2003 andcurrently amount to 41 EUR/tonne (SFS 2002:998). The total fee, including taxes, onwaste depositing is 44-1,100 EUR/tonne, where the lower figure is most representative forthe major part of the handled waste. Landfilling of combustible waste is prohibited from2002 and deposition of organic waste from 2005.
10.6.3 NorwayThe situation in Norway is not different to Sweden with respect to the decrease in thenumber of landfills. The current waste deposit is expensive and may amountto 110 EUR/tonne. The average cost is 99 EUR/tonne, of which taxes constitute 40 EUR.
Norway has since 2001 had a ban on depositing wet-organic waste. The total capacity ofthe Norwegian incineration facilities is not sufficient and currently, waste is exported toSwedish incineration plants.
12 There are, in some occasions, possibilities to get tax reductions on ashes being deposited, for instanceutilisation as construction material within the plant area or used in order to stabilise other deposited material.

RENEWA
Ecotraffic ERD3 AB Contract No. 4.1030/Z/01-119-2001December 2003
136
10.6.4 GermanyIncineration of waste in Germany is performed under stringent safety standards. In 1990the 17th Federal Imission Control Ordinance was adopted, which sets limits ondioxins/furans and heavy metals [44]. The EU directives on landfill of waste and theincineration of waste mentioned above, follow the basic principles developed in Germanyand a few other European countries.
Germany has during the 1990’s tried to gain better control of the waste problems, usingeconomical mechanisms. Currently, there are no restrictions on putting waste in landfillsabove the European Directive from 1999, neither are there any taxes on landfilling orincineration. There is, however, a fee on depositing of 15-175 EUR/ton. In the year 2005there will be a ban on depositing organic waste, similar to the Swedish conditions [45].

RENEWA
Ecotraffic ERD3 AB Contract No. 4.1030/Z/01-119-2001December 2003
137
11 CONCLUSIONSHigh amounts of energy are lost today by not utilising the energy content in waste that areput in landfills. The dependency in Europe on imported fossil energy increases as well asthe amounts of waste generated in society. This is not a sustainable development processand it need to be altered.
Waste recovery should be encouraged, primarily through sorting at source. Wastesegregation at an early stage simplifies recycling of products and materials as well as theuse of waste as raw material for motor fuel production. The latter is considerablysimplified if the waste composition is well known with small variations in constitution.Sorted waste fractions make high quality requirements possible by continuos mixing thefractions to a suitable raw material.
Products that cannot be reused or material recycled should be used as fuel for energyrecovery. The energy content is too valuable to be put in landfill to no use. Complexmaterials with less or no “second hand” use should be avoided. Such short-living materialsare wastefulness of natural resources.
The main reason why waste with energy content still is put in landfills is economical. Aslong as landfilling is cheap there are no incentives for large investments in thermaltreatment plants. The situation is though not the same all over Europe. In Sweden forexample incineration in combination with district heating is well established.
The strongest arguments for energy from waste is connected to energy demand such asdemand for biobased energy and security of energy supply. Even the opposition to wasteincineration agrees on that energy utilising is better than landfilling but the concerns overpollutants formed by incineration is a stronger argument against. The opposition advocatesreuse and recycling. Since gasification is not well known by people in general it isregarded as incineration even though it has the benefit of not creating dioxins.Consequently, both sides have good and important arguments and they have one argumentin common; reduction of pollutants and toxic substances in society.
Incentives must be created in order to make recycling and energy recovery more attractivethan landfilling. Taxes are one way, regulations another. This study shows that both waysare necessary. There also has to be a demand for the products. The demand for heating isless in southern Europe than in the northern parts but electric power and automotive fuelsare required all over the world. The results of this study show that production ofautomotive fuels from waste has potential to be an environmentally and economicallyviable solution in the future. With a gate fee of fully 50 EUR/ton the cost for theautomotive fuel is on parity with the price of diesel oil. The assumed gate fee is not veryhigh and in some countries waste fees of 100 EUR or more are common. By furtheroptimisation these results can be improved to give margins to profit and fuel tax. Since theproduced fuel is based mainly on biomass this part should be exempted from fossil fueltaxes.
The gasification technology for solid biofuels need to be further developed and the highinvestments required and the lack of demonstration plants are important barriers. Thegrowing interest for gasification of pure biomass, such as forest residues, for automotivefuel production could however lead the way for waste as well.

RENEWA
Ecotraffic ERD3 AB Contract No. 4.1030/Z/01-119-2001December 2003
138
Changes in the waste regulations are required. For example, MSW is not accepted as abiofuel even though typically 80% of the content is biomass. This needs to be changed.
The major barriers within waste thermal treatment are non-technical, more stringentdemands can technically be achievable to almost any level of the penalty of rapidlyincreased cost of treatment. However, alternative treatment procedures (composting,biogas) entail the risk of even higher costs of treatment, as large masses of residuesrequiring post-treatment are generated. Incineration of these can become a necessary partof such WtE installations.
The not utilised energy in MSW and industrial manufacturing waste put in landfills inEurope is estimated to have a potential to replace 4.5% of the diesel and petrol fuel inEurope. This is a large potential and could be increased in the long term if new waste-to-motor fuel plants replace old incineration plants.
Participants in a network for increased use of energy from waste should represent wastemanagement, energy companies, municipalities, governments, politicians and the EU-administration. Even the manufacturing industry should be represented as they are inFEAD. The main task for the network should be to clarify conditions and data as a sourceof information and open discussion. Politicians and the public need more information.Politicians need tools and facts to be able to make correct decisions on waste and energyissues. Therefore trustworthiness and reliability should be fundamental. The networkshould work for exchange of reliable information and support and fund research andcooperation between the waste sector and energy sector. Gasification technology for solidbiofuels needs support for further development
The network should also work for equal market conditions for energy from waste by thefollowing activities:
• Stimulate more commercialism and private enterprises.
• Stimulate internal trade within the EU
• Create stable political conditions
• Make it possible to utilise waste as mainly a biofuel
• Question the waste hierarchy
• Include power from waste in the system for Green certificates for electric power
• Introduce equal emission regulations for different energy plants
• Clearly define the difference between recycling and destruction
• Introduce landfill tax to direct waste quantities from landfills to recycling alternatives,e.g. incineration.

RENEWA
Ecotraffic ERD3 AB Contract No. 4.1030/Z/01-119-2001December 2003
139
12 DISSEMINATIONThis project is based on the use of stakeholders for collecting data and sharing experiences.The Reference Group has formed the basis complemented by contacts with other interestedparties and experts resulting in a broad network of competence representing actors in thewhole chain, from the collection of the waste to the energy production and end use in thevehicles. This means that the outcome of the project have been distributed to a broad groupalready from the start to the end of the project and will continue after the project work.
The first action of the dissemination was the work carried out in the beginning of theproject to set up the Reference Group. In this phase information about the project werespread to about 50 persons connected to waste issues. This resulted in constituting aReference Group of 20 persons.
The seminar on the topic "Arguments for and against incineration of waste. Suitable wastefor energy recovery, potential, and quality requirements" arranged by Ecotraffic ERD3 ABand held in September 2002 gathered and involved, in addition to members of theReference Group, another 12 persons representing companies, authorities and institutions.
On a previous seminar held in Trollhättan in January 2002 on the topic "AutomotiveBiofuels by wood gasification, also arranged by Ecotraffic, information on the RENEWAproject were given.
Information about the project has also been presented on the project websitewww.ecotraffic.se.
Discussions have been held with the Swedish organisation "The Recycling Industry" forpresenting the project on their annual conference "The Recycling days". This year, 2003,the program for the conference unfortunately didn't admit any further presentations.
At the moment Ecotraffic is planning an international seminar in Sweden on gasification ofbiomass and waste for automotive fuel production. The seminar will probably be held inspring 2005.
This final report has been distributed to all the members of the Reference group and otherhelpful persons (see chapter 1.5). It will be presented on the special website for the projectbut also permanently on Ecotraffics website among other scientific reports made by thecompany. Links to the report will be presented on the participants' websites.

RENEWA
Ecotraffic ERD3 AB Contract No. 4.1030/Z/01-119-2001December 2003
140

RENEWA
Ecotraffic ERD3 AB Contract No. 4.1030/Z/01-119-2001December 2003
141
13 INFORMATION SOURCES AND REFERENCES
13.1 Printed sources 1. Swedish Nature Conservation Board Remiss 2002. “Ekologiskt hållbar
avfallshantering”2. Greenpeace 2000. "Kol i kubik. Utsläpp av CO2 från förbränning av avfall."3. Greenpeace 2000. "Skryt eller skrot"4. Greenpeace 1999. "Dioxin i drivor"5. Avfall & Energi. STOSEB 1998.
13.2 Internet sources1. Blue Ridge Environmental Defense League. “Pyrolysis and Thermal Gasification of
Municipal Solid Waste”. www.bredl.org/solidwaste/gasification_facts.htm.Downloaded at 020729.
2. Blue Ridge Environmental Defense League. “Waste Gasification – Impacts on theEnvironment and Public Health”. April 1, 2002.http://www.bredl.org/pdf/wastegasification.pdf. Downloaded at 020802
3. California Energy Commission. “Municipal Solid Waste Power Plants”. Page 1.http:/www.energy.ca.gov/development/biomass/msw.html, 020729.
4. Eeraerts D. “Gasification of Municipal Solid Waste (MSW)”.www.scientecmatrix.com/seghers/tecma/scientecmatrix.nsf/_/F1582290270FE44DC1256B5D00394D4F. Downloaded at 020729.
5. Gasification Technologies Council. “The Technology – What is Gasification?”.www.gasification.org/story/explaine/explaine.html. Downloaded at 020819.
6. Howell H. Heck and Marwan E. Jubran. Homepage of Civil Engineering Research atFlorida Institute of Technology. http://civil.fit.edu/heck_research.html. Downloaded at020808.
7. Svenska Renhållningsverkföreningen. www.rfv.se. 020729.8. The Methanol Institute. www.methanol.org. “World Methanol Plants” (Meohcapb.pdf).
Downloaded at 020823.9. www.spi.se “Försörjningsbalans 1997”, 1998-04-30. 10. www.identic.se/ “Identics Internet homepage, 2001.

RENEWA
Ecotraffic ERD3 AB Contract No. 4.1030/Z/01-119-2001December 2003
142
13.3 References
1 Padban, N., Nilsson, T., Berge, N., ”Energi ur avfall genom förgasning”- report nr. TPS– 02/16, publ: TPS Termiska Processer AB, SE-611 82 Nyköping, Sweden, (inSwedish).
2 Hansen, E., Skarup, S. and Jensen, A. (2000) Substance Flow Analysis for Dioxins inDenmark. Environmental Protection Agency No. 570, Danish EPA: Copenhagen.
3 Padban, N., “PFB Air Gasification of Biomass, Investigation of product formation andproblematic issues related to Ammonia, Tar and Alkali., Doctoral Thesis, ISRN -LUTKDH / TKKT - 00 / 1058 - - SE, Publ: Lund University, Lund, Sweden.
4 Feasibility phase project for biomass-derived alcohols for automotive and industrialuses, Altener BAL-fuels project, Contract No XVII/4.1030/Z/95-124, 1997
5 Planning of Biomass based Methanol Energy combine – Trollhättan region (BioMeeT),Altener Contract No XVII/4.1030/Z/98-368, 2000. Final report by TrollhättanMunicipality, Ecotraffic R&D AB and Nykomb Synergetics AB. March 2000.
6 Bio-Methanol Production in Hagfors, prefeasibility Study for VärmlandsMetanol AB,2003
7 Stakeholders for Biomass based Methanol/DME/Power/Heat energy combine(BioMeeT II), Altener Contract No 4.1030/C/00-014/2000, 2003. Final report byTrollhättan Municipality, Ecotraffic ERD3 AB and Nykomb Synergetics AB. March2000.
8 Moulijn, J.A., Makkee, M., Van Diepen, A., Chemical Process Technology, John Wiley& Sons Ltd, Chichester, England, (2001) ISBN 0471 63009 8
9 Sundqvist, J., et al., ”Hur ska hushållsavfallet tas om hand? Utvärdering av olikabehandlingsmetoder”, IVL Svenska Miljöinstitutet AB, B 1462, Stockholm, Feb 2002
10 Carl, J., Fritz, P., Noell-Koversationsverfahren zur Verwertung und Entsorgung vonAbfällen, EF Verlag für Energie- und Umwelttechnik GmbH, 1996 (ISBN 3-924511-82-9)
11 Vattenfall web site,http://www.vattenfall.se/om_vattenfall/var_verksamhet/lokal/block5/sopor.asp (Lastvisited July 2003)
12 The bio-DME project Phase I, A report by the bio-DME consortium, available from theSwedish national energy administration (STEM), April 2002
13 Waldheim. L. (2002): Avfallskvalitet för förgasning. „RENEWA“ seminariumSeptember 19, 2002, Stockholm. TPS Termiska Processer AB (www.tps.se), 611 82Nyköpimg, Sweden.
14 Thermoselect website, www.thermoselect.com15 Statistics Norway (2003). Electricity statistics 2001.
http://www.ssb.no/emner/10/08/10/elektrisitetaar/16 Ekbom. T. (2001): Metanolframställning genom förgasning av bioråvara och avfall i
Tyskland. Presentasjon vid seminarium – Förutsettningar för storskalig introduksjon avmotoralkoholer som drivmedel på den svenska marknaden. Nykomb Synergetics AB.Floragatan 10B. SE-11431 Stockholm.

RENEWA
Ecotraffic ERD3 AB Contract No. 4.1030/Z/01-119-2001December 2003
143
17 OFV (2003): Bil og vei. Statistikk 2003. Opplysningsrådet for veitrafikken AS, Oslo (inNorwegian).
18 Håkan Rylander. Presentation 200119 Swedish National Energy Administration: Energy in Sweden 2001. Report ET 37:2001.20 EC (2002): 2001 –Annual Energy Review, January 2002, European Commission.21 EC (1999): EU Transport in Figures. Statistical Pocketbook. European Commission.22 DME - Drivmedel för dieselmotorer. Produktion, distribution och användning. KFB-
Meddelande 1997:30. December 1997.23 Brandberg Å. and Sävbark B.: ”Distribution of motor alcohols.” KFB-Message
1996:23, 1996, in Swedish24 Gill D. (AVL), Ofner H. (AVL), Sturman E. (Sturman Ind.) Schwarz D. (AVL) and
Wolverton M. A. (Sturman Ind.): “The performance of a heavy-duty diesel engine witha production feasible DME injection system.” SAE Paper 2001-01-3629, 2001
25 Information available at the Internet site of the American Association of Poison ControlCenters, www.aapcc.org, 2002.
26 Plotkin S. E. (ANL): ”Assessment of PNGV Fuels Infrastructure: InfrastructureConcerns Related to the Safety of Alternative Fuels.”, ANL Report ANL/ESD-TM-160,2000
27 Machiele P. (EPA): ”Summary of the Fire Safety Impacts of Methanol as aTransportation fuel.” SAE Paper 901113, 1990
28 Edited by Malcolm Prinie Inc.: ”Evaluation of the Fate and Transport of Methanol inthe Environment.”, AMI Report 3522-22, available for download at the Internet site ofAMI at: www.methanol.org, 2001
29 Edited by EA Engineering: ”Methanol Refueling Station Costs”, AMI, available fordownload at the Internet site of AMI at: www.methanol.org, 1999
30 Brandberg Å. (Ecotraffic), Sävbark B. (Ecotraffic), Landälv I. (Nykomb Synergetics)and Lindblom M. (Nykomb Synergetics): “DME A motor fuel for diesel engines.”KFB-Message 1997:30, 1997, in Swedish
31 Federal Imission Control Act, Federal Law Gazette I, p. 2331, 14 May 199032 ”Ett ekologiskt hållbart omhändertagande av avfall”, Swedish EPA, Report 5177, Feb
2002, ISBN 91-620-5177-633 Clayton, Stewart J. et al. “Gasification Markets and Technologies – Present and
Future”. A U.S. Department of Energy Report. July 2002. Page 4.34 Dirk Eeraerts. “Gasification of Municipal Solid Waste”. Page 2.
http:/www.scientecmatrix.com, 02072935 Dirk Eeraerts. “Gasification of Municipal Solid Waste”.
http:/www.scientecmatrix.com, 02072936 Clayton, Stewart J. et al. “Gasification Markets and Technologies – Present and
Future”. A U.S. Department of Energy Report. July 2002. Page 23.37 Blue Ridge Environmental Defense League. “Pyrolysis and Thermal Gasification of
Municipal Solid Waste”. Page 1.http://www.bredl.org/solidwaste/gasification_facts.htm, 020729
RENEWA
Ecotraffic ERD3 AB Contract No. 4.1030/Z/01-119-2001December 2003
144
38 Clayton, Stewart J. et al. “Gasification Markets and Technologies – Present andFuture”. A U.S. Department of Energy Report. July 2002. Page vi.
39 Dirk Eeraerts. “Gasification of Municipal Solid Waste”. http:/www.scientecmatrix.com.020729
40 Clayton, Stewart J. et al. “Gasification Markets and Technologies – Present andFuture”. A U.S. Department of Energy Report. July 2002. Page v.
41 California Energy Commission. “Municipal Solid Waste Power Plants”. Page 1.http:/www.energy.ca.gov/development/biomass/msw.html, 020729
42 Clayton, Stewart J. et al. “Gasification Markets and Technologies – Present andFuture”. A U.S. Department of Energy Report. July 2002.
43 Clayton, Stewart J. et al. “Gasification Markets and Technologies – Present andFuture”. A U.S. Department of Energy Report. July 2002. Page 13.
44 Federal Imission Control Act, Federal Law Gazette I, p. 2331, 14 May 199045 ”Ett ekologiskt hållbart omhändertagande av avfall”, Swedish EPA, Report 5177, Feb
2002, ISBN 91-620-5177-6