Embed Size (px)
Citation preview

SENSOR FINAL REPORT
CONTRACT N° : GRD2-2000-30202 ACRONYM : SENSOR TITLE : Secondary Road Network Traffic Management Strategies – Handbook for Data Collection, Communication and Organisation. PROJECT CO-ORDINATOR : ETRA INVESTIGACION Y DESARROLLO, S.A. (E) PARTNERS : DIPUTACIÓN DE VALENCIA (E) FIT CONSULTING, S.r.l (I) PTV AG (D) AACHEN (D) MTWM (HU) TRANSPORT OPERATIONS RESEARCH GROUP (UK) DARMSTADT UNIVERSITY OF TECHNOLOGY (D) REPORTING PERIOD : FROM 01/01/2002 TO 30/09/2004 PROJECT START DATE : 01/01/2002 DURATION : 33 MONTHS Date of issue of this report : 30/09/2004
Project funded by the European Community under the ‘Competitive and Sustainable Growth’ Programme (1998-2002)

Table of Contents 1. Executive Publishable Summary ................................................................................... 3 2. Objectives of the project................................................................................................ 4 3. Scientific and technical description of the results ......................................................... 6
3.1 SENSOR Technical Results .................................................................................. 6 3.1.1 WP1 User Involvement ................................................................................. 6 3.1.2 WP2 WHAT to Collect ................................................................................. 7 3.1.3 WP3 HOW to Collect .................................................................................... 9 3.1.4 WP4 WHERE to Collect ............................................................................. 11 3.1.5 WP5 Organisational Aspects ....................................................................... 14 3.1.6 WP6 Linking ............................................................................................... 16 3.1.7 WP7 Pilot Test Sites and Case Studies........................................................ 18 3.1.8 WP8 Handbook ........................................................................................... 21 3.1.9 WP9 Dissemination & Exploitation ............................................................ 22
3.2 Main Exploitable Results .................................................................................... 24 3.2.1 SENSOR DSS GUI ..................................................................................... 24 3.2.2 SENSOR HANDBOOK.............................................................................. 32
3.3 SENSOR Demonstrations ................................................................................... 33 3.3.1 Pilot Sites..................................................................................................... 33 3.3.2 Case Studies................................................................................................. 39
4. List of deliverables ...................................................................................................... 43 4.1.1 Project Deliverables..................................................................................... 43
5. List of SENSOR Contact Persons ............................................................................... 44 6. Glossary....................................................................................................................... 45 7. Results and Conclusions.............................................................................................. 46 8. References ................................................................................................................... 47

© SENSOR Consortium -3- Final Technical Report
1. Executive Publishable Summary At present there are a large number of traffic and transport applications that are using advanced computational technologies, being very efficient to manage specific events or to support the decision process of traffic/transport planners and decision makers. Nevertheless, it is a lack in terms of the interoperability of those existing tools to enable the share of their outputs towards a global analysis of a given scenario.
SENSOR project – Secondary Road Network Traffic Management strategies – Handbook for Data Collection, Communication and Organisation- has developed an advanced management environment that enables the integration of different types of management tools in a common framework. This allows the Traffic Managers and Road Operators a flexible solution to combine the outputs of these tools with the added value given by the possibility of integrating them with the secondary road traffic management system.
The success of the system relies on the fact that SENSOR DSS is composed of four independent tools namely Administration, Assessment, Cost Assessment and Optimisation Tool as described below:
• Administration Tool – definition of procedures for storing collected traffic data in a database. Generic and flexible data structures have been defined to enable the optimum further use and continuous update for the Administration Tool.
• Assessment Tool – helps end-users to decide what sensor technologies fit the best with their requirements. An assessment tool for evaluating the data collection that can be used for optimising a certain criteria specified by the user, according to the conditions (technological, organisational, economical, etc) of the section of the road network subject of analysis.
• Cost – Assessment Tool – The Cost Assessment Tool (CAT) has been developed to be able to assess and calculate the costs for data acquisition equipment during the planning phase to ascertain costs related to installation, communication and maintenance for new detectors.
• Optimisation Tool - The optimisation tool is designed to solve the network count location problem (NCLP) that is the identification of links, which maximise information for data completion. By collecting data from the links identified, the user will be able to improve the accuracy of estimates of OD flows, path flows, travel times etc. which are the result of data completion. The central question answered by the optimisation tool is: “I have N detectors. Where should they be placed?”
Considering the results form the project, the Consortium envisages a short term for the exploitation of the results, supported by the interest in the national demonstrations that have been provided at the national and international level to Local Road Authorities. The exploitation of the results is a process that can be carried out during the next decade, as the nature of the results will enable the incorporation of new technologies: enhanced simulation capabilities in the road management framework without substantial additional effort.

© SENSOR Consortium -4- Final Technical Report
2. Objectives of the project Governments and local authorities have identified the use of traffic management tools as a way of enabling transport policies that can reduce pollution in cities, improve traffic safety on the roads, and ensure that safety requirements are traceable through the decision making process. It will ensure that policy risks are identified and mitigated at the earliest possible opportunity. However, the monitoring and control of traffic situation does not exist for the secondary feeder network (regional or national roads) or it can be consider as deficient in most cases.
This leads to an inconvenient situation, in which users need additional work to combine the information of the different road networks involved. This also reduces the flexibility of traffic engineers and decision makers. Furthermore, good traffic management requires details on the real time traffic situation on motorways as well as in the secondary road network
The following aspects particularly have to be taken into account when acquiring real-time traffic data and when assessing traffic situations in the secondary road network:
• Network structure, which unlike the motorway network includes a vast number of places where traffic may “seep away“ (sources or sinks for traffic).
• Intersections which may cause disturbances to traffic flow.
• Variation of the local speeds which, depending on the type of road, may be rather large in the secondary road network.
• Data transmission problems due to missing telephone cables along the sections.
• Power supply problems for data collection equipment.
• Problems of how the traffic situation on a certain subsection of the secondary road network can be inferred from real time, locally acquired traffic engineering parameters.
Traffic data collection in the secondary road network and the assessment of the traffic situation by its classification can be carried out in very different ways:
• A dense network of data collection points can be set up in the secondary road network. However, this is costly. Therefore, it has to be taken care that all existing traffic engineering installations will be used best
• There is equally the possibility of using estimation methods, by means of which data missing within road sections or networks can be completed in a control centre. Precious network information like time dependent path flows and travel times, OD matrices and junction turning movements are either very expensive or practically impossible to collect. Thus, techniques of data completion become vital to get the most from the data available. This can be done by means of existing path flow estimation methods.
SENSOR tackles the problem of deciding what, how and where to collect data locally, network flows (path flows, travel times, turning proportions, OD tables) are estimated for the secondary road network using path flow estimation techniques.

© SENSOR Consortium -5- Final Technical Report
The main objectives of the project are:
1. The development of a Handbook which allows to plan, implement, and manage road traffic data collection (including both detection and communication) in a cost-efficient way.
2. The handbook is accompanied by an advanced Decision Support System (DSS), which is designed to answer questions like: "I have N additional sensors of type X, where should I place them, and what will be the benefit?".
3. The use of 1&2 to develop a number of strategies for the establishment of real time data collection for traffic management and information systems. These strategies are validated in at least three EU test sites.
4. The combined use of 1&2 facilitates:
a. The achievement of an advanced level of sensorisation in the EU secondary road network at a low cost.
b. An improved level of service for secondary road network users -e.g. by means of real time travel information services-.
c. The improvement of road planning activities by secondary road network management authorities -e.g. by means of improved possibilities of road data analysis-.
d. The effective implementation of a traffic management strategy at a network level -e.g. diverting traffic from a congested motorway to the secondary road network-.
5. Last, but not least, the project identifies the need for further developments (specially in views of EC policy requirements)

© SENSOR Consortium -6- Final Technical Report
3. Scientific and technical description of the results
3.1 SENSOR Technical Results Along this section, it is identified the Technical Results of the project organised per WP.
3.1.1 WP1 User Involvement
3.1.1.1 Description of the work
Work package 1 “User involvement” deals with the identification of the user need, “Why to collect?” and with the support of activities of the Users Group.
The work package was lead by the Diputación de Valencia (DIPVAL) and its results were described comprehensively in deliverable 1.1.
The consortium expected four main needs justifying the improvement of data collection and management practices, namely:
• the achievement of an advanced level of sensorisation in the EU secondary road network at a low cost,
• an improved level of service for secondary road network users
• the improvement of road planning activities by secondary road network management authorities
• the effective implementation of a traffic management strategy at a network level
The work package was divided into two tasks:
Task 1.1 User Needs: The work started with the identification of the, potential and actual, users and actors that manage or use the traffic information of secondary road networks. Then there was analysed their current practices to identify and formalise their needs of new approaches and models. Both, surveys among the users and review of the literature and results of other related projects were the sources for this work.
Task 1.2 User Group: A user forum has been established, with representatives of national/local key actors for each site. This user forum has assisted in the definition of needs and current situation and have had the opportunity to comment on the interim results from the project. The user forum has a preferential access to the results of the project. The membership include all kinds of organisations involved in the concerned area: transport authorities, road operators, local authorities, user representatives.
3.1.1.2 Results
Based on the experience of the experts (road operators, consultants, developers, researchers) needs about the collection and management of the traffic information (not only number of cars but other external data like weather or more elaborated traffic info) of the secondary road network have been identified. This work has been carried out, in addition to the survey of the user needs and current practices in the countries of the EU, by the review of the previous work in methodologies and processes for traffic data collection, management and dissemination.

© SENSOR Consortium -7- Final Technical Report
A user forum with participants of user groups out of different countries has provided the basis of the experience. Also based on experiences and investigations the state of the art and reasonable developments of methodologies, approaches, technologies, tools, and organisational forms for an optimised data management has been analysed.
The main output is the deliverable D1.1. The key goal of that report is answering the question “Why do secondary road managers need improvements in the current state of the art of data collection?”.
The deliverable describes how road administrations operate, and sets out the framework for data collection for the secondary road network. The analysis includes the definition of secondary road network and a country-independent model for road, which is the root of a top-down approach chosen to identify step-by-step the phases leading to data collection and the categories of users involved.
3.1.1.3 Conclusions
The secondary road network in European countries comprises the biggest part of the whole road network outside urban areas. The different types of secondary roads carry a lot of daily traffic, especially regional and supra-regional traffic. On the other hand, the number of accidents occurring in the secondary road network is quite high and thus there is a high influence on overall road safety. The knowledge of where what happens in the secondary road network is insufficient. The possibilities of improving traffic detection and incident detection (as it has been done on a bigger part of the European motorways) are much more constrained. Therefore an intelligent, cost-efficient way of improving the data base of the secondary road network is needed to optimise secondary road network overall performance as well as road safety.
Deliverable 1.1 shows that there are a lot of similarities concerning the problems in the secondary road network (e. g. occurring of accidents) in the different European countries. In addition, despite of the differences in the local, regional and national road administration, the planning process and the responsible authorities are very similar too. This is shown by the "rolling multiyear programme", which differs only a little bit from country to country, but which can be used as a general approach to describe which institutions are responsible in the different phases from the long-term general national policy to the daily operation of roads.
3.1.2 WP2 WHAT to Collect
3.1.2.1 Description of the work
Work package 2 “What to collect?” deals with the question which data have to be acquired in order to implement traffic management strategies in the secondary road network.
This work package is based on the work package 1 (“Why to collect?”) and makes use of the identified user needs. It gives output to the work package 3 (“How to collect?”), but also to the work package 4 (“Where to collect?”) and work package 5 (“Organisational aspects”). The work package was lead by Darmstadt University of Technology (TUD).
The work package started in May 2002 and was finished in November 2002. The approach and its results of work package 2 were described comprehensively in deliverable 2.1 and in a more condensed way in deliverable 2.2 as internal guidelines for the consortium and the user group.

© SENSOR Consortium -8- Final Technical Report
The whole consortium was involved in this work package and each partner of the consortium contributed its specific knowledge to it. The work package was divided into three tasks. Task 2.1 dealt with the scope of application and was lead by TUD. The Hungarian Ministry of Traffic and Water Management was responsible for task 2.2 (Models of traffic management strategies). PTV Planung Transport Verkehr AG was leader of task 2.3 (Assessment parameters for a cost effective data collection and communication management).
The results were not only described in detail but it was tried to make it more comprehensible for the users by means of tables, work flow charts and figures.
Work package 2 had two main objectives. The first was to give an overview of relevant control structures and relevant data for operating management strategies in the secondary road network. The second one was to define assessment parameters for a cost effective data collection and traffic management. These two general objectives could be reached, which will be further on explained by each single task.
In task 2.1(scope of application), the general planning process for traffic management strategies were described. Having defined traffic management strategies and their effects on different areas as well as some specific terms of traffic management strategies, the strategies and their comprising actions were explained in detail. The overall process to plan and implement traffic management strategies was described and laid down in a flow chart.
To define which data have to be collected, it is necessary to be aware of the existing situations (states, problems and events) in a secondary road network and the traffic management actions that allow to mitigate these problems. For each action, different systems of information and control are possible to translate the strategies into action. For each action, different kinds of data are needed or at least useful. The data, which can be collected generally, were described and linked with the traffic management actions they are needed for.
The purpose and scope of the handbook was developed as a flow chart and has two main effects. On the one hand, it guided the SENSOR consortium through the further work. On the other hand it enabled the future users to make easier use of the handbook and the whole procedure to plan and implement traffic management and its necessary data collection in the secondary road network.
Task 2.2 (Models of traffic management strategies) describes different classes of local conditions. These local conditions comprise the network, the intersections, the cross-sections and others like alignment. Other local conditions like surrounding area and weather conditions were also taken into account. This was done in order to get to know which sections of a network are potentially suitable for traffic management strategies and which are not.
Besides the local conditions, the local control structures were analysed in order to get to know which traffic management strategies were easier to implement because of existing control devices. Here, for example existing signalling systems, road section influencing devices etc. were considered.
The relevant data for different control structures were also taken into account. For the further proceeding an analysis of a network it is important to get to know the most common situations. This can be done by expert knowledge or by analysing historical traffic data, traffic counts and questionings.

© SENSOR Consortium -9- Final Technical Report
Task 2.3 deals with assessment parameters for a cost effective data and communication management. Three main issues were taken into account in order to get these assessment parameters. Beside the type of sensor the power supply and the data transmission have to be considered.
It is possible to distinguish between data collection on site (which is nowadays most common practice) and mobile data acquisition by means of floating car data. Data characteristic parameters, which have an influence on assessing data collection procedures, are accuracy and precision as well as consistency and repeatability. Sensor characteristic parameters are failure, mounting position, input power and environmental limitations. Besides the mentioned data characteristics the technical performance parameters are important to assess a sensor, too. Last but not least, for an economic assessment the costs for investment, operation, maintenance and replacement as well as for power supply and data transmission were taken into consideration.
The basics established in this task were detailed further on in work package 3 (“How to collect”?).
3.1.2.2 Results
Deliverable 2.1 “Report on what to collect” describes the scope of application including the general planning process for traffic management strategies, the description of the collection and integration of the traffic data and the purpose and the scope of the Handbook and the methodology. Furthermore, the local, infrastructure , control and traffic conditions have been taken into account. Therefore, tables and checklists were created in order to offer an easy to use and practicable approach for the users. In the third part of Deliverable 2.1, the assessment parameters for a cost effective data collection and communication management were presented. Here, organisational aspects, the parameters for data acquisition, data and sensor characteristics as well as technical performance parameters and parameters for economic assessment were elaborated.
Deliverable 2.2 “Guidelines on what to collect” comprises a shortened version of the most relevant results of Workpackage 2.
3.1.2.3 Conclusions
One important conclusion is that the starting point for data collection is not the question which data (e. g. velocity. number of vehicles, type of vehicles) shall be collected, but for which purpose the data will be collected. Therefore, the users have to analyse the local situation, to define goals and traffic management strategies how to reach these goals by different strategies. From these strategies, the different actions, measures and systems for influencing traffic can be derived. Having defined these starting parameters, the necessary data can be selected. The integration of traffic management strategies and the therefore necessary data in an overall goal-orientated planning process will enable an efficient use of the data collected.
3.1.3 WP3 HOW to Collect
3.1.3.1 Description of the work
Work package 3 “How to collect” deals with the production of a detailed inventory of relevant systems and devices for collecting the data that provides with contents the

© SENSOR Consortium -10- Final Technical Report
assessment parameters defined in WP2. It also defines guidelines for identifying the optimum data collection method according to the site context.
The work package was lead by ETRA I+D and its results were described comprehensively in deliverable 3.1 and 3.2.
First of all, the data collection (detection and communication) means are described systematically. In a second step, the data collection means are assessed. For this, the range of identified assessment parameters from WHAT to collect is used.
In addition to the traditional devices for traffic data collection in secondary road networks, there is analysed the impact and usability of other approaches that are being used in other contexts such as Floating Car Data or plate recognition by artificial vision for estimating travel times of OD matrices. For those technologies recommendations for using them and for further assessments and developments (especially with focus on significant technologies e.g. UMTS, GALILEO) are formulated.
The work package was divided into five tasks: Task 3.1. Inventory of data collection tools and systems:
• Review of the state of the art on traffic data collection systems. There were considered the outputs of other relevant related projects.
• Survey on the tools/systems and infrastructures in secondary road networks in Europe.
• Advanced traffic data collection approaches and technologies used in other contexts such as urban traffic or toll systems were reviewed and analysed (e.g use of floating cars, use of artificial vision, tags, GPS, UMTS, GALILEO, etc…)
• Task 3.2. Analysis and classification of the data collection tools:
• Analysis of the elements of the inventory to determine when and where are most effective.
• Legal, organisational, social, environmental and economical aspects were also considered.
• A classified inventory of the different data collection tools was produced.
• Task 3.3. How to use the data collection tools:
• Definition of guidelines on how to use each of the defined tools, to obtain the expected data. These guidelines include the identification of the legal, organisational, social, environmental, economical and technological issues that are considered when planning the use a given data collection tool (or device).
Task 3.4. Management of the data collected:
This task defines the procedures for storing the collected in a database. Data structures as generic possible are defined for enabling their optimum further use Here the work done in previous EU projects (such as DATEX and ETIS related projects: ASEMBLING, BRIDGES, CONCERTO, MESUDEMO and MYSTIC) and existing standards was considered.
Task 3.5. Assessment Tool Task

© SENSOR Consortium -11- Final Technical Report
This task implemented a tool for assessing the data collection tools that can be used for optimising the cost-efficiency of this process, according to the conditions (technological, organizational, economical, etc) of the section of the road network subject of study.
3.1.3.2 Results
The main output of the workpackage is deliverable 3.1. In detail, specific milestones concerning this WP3 and covered by the deliverable 3.1 and the internal report D3.2 (“Guidelines for data collection and organisation”) include:
• Inventory of data collection tools and systems, which reviews the state of the art on traffic data collection systems, and the advance traffic data collection approaches and technologies in other context such as urban traffic or toll systems.
• Analysis and classification of the data collection tools. Once, inventory of data collection was completed, an analysis of the elements was carried out to determine when and where are most effective. To achieve this mean, legal, organisational, social, environmental, and economical aspects were considered to provide a more accurate perspective. Finally, inventory elements were classified.
• Guidelines definition on how to use each of the defined tools. This segment defines the guidelines on how to use each of the defined tools in order to obtain the expected data. As mentioned previously, these guidelines include the legal, organisational, social, environmental, economical, and technological issues that were considered when planning the use of a given data collection tool or device.
• Management of the data collection defines the procedures for storing the collected data into a database for optimum use and future expansion.
• Assessment data collection tool. This milestone implements a tool for assessing the data collection tools used for optimising cost-efficiency relationship, according to the conditions of the road network subjected to study.
3.1.3.3 Conclusions
The work carried out in this WP3 has identified and classified methods and approaches of traffic data collection systems to provide the basis for WP4, “where to collect”, where the optimisation of data acquisition points are studied and a definition of assessment parameters for cost effective data collection and data transmission is provided.
3.1.4 WP4 WHERE to Collect
3.1.4.1 Description of the work
The overview on the traffic flow within the network strongly depends on the density of the network of real-time data acquisition points. Basically it has to be stated that excessive implementation of data acquisition points is expensive in terms of equipment, installation, maintenance, transmission and exploitation.
Therefore, the decision on where to locate data acquisition points is a constant weighing of the two issues:
- requirements for quality and degree of detail in terms of measurement results and
- cost-effectiveness

© SENSOR Consortium -12- Final Technical Report
Within this framework it is vital to find possibilities of reducing the number of data acquisition points without essentially deteriorating the quality of the measurements. The emphasis hereby is laid on “essentially” since naturally the quality will be lower. Each data acquisition point dropped reduces the quality of the data basis and hence the assessment of the actual traffic situation. Under the aspect of economy it is always the discussion on whether the loss of quality or the saving potential is more important.
Following this argumentation WP4 has been structured as follows:
In a first step recommendations were given on how the location of data acquisition points can be determined in the network. The assumption here is that on each single link observed a different traffic situation is prevailing. Therefore, the location of data acquisition points has to be chosen in such manner that the traffic situation of the entire stretch can be estimated by the data acquired on few directional links only. To achieve this goal two possibilities are drawn up:
- For simple networks a manual approach to determine the location of data acquisition points - in view of circumstances like bottlenecks and other critical sites in the network limiting the throughput .
- In complex networks it is necessary to choose first of all those links that should be equipped with data acquisition points in any case. Therefore, a methodology is introduced that offers software support for the determination of such links.
Then the impact of the selected locations on the costs of the data acquisition is demonstrated
In the following step it is explained how the data can be processed on site and plausibility and reliability checks can be carried through. Generally not every single traffic parameter acquired is transmitted to a central unit but the traffic data is pre-processed and aggregated on site, and as macroscopic traffic parameters - like traffic volume q in veh/h and vPCU as an average traffic speed in the observed time interval - are finally transmitted.
Due to budget restrictions it is often impossible to equip each single link with local data acquisition points. Therefore, necessity grows to ways how the traffic situation in the entire network can be estimated by using only a few data acquisition points without having to accept too great loss in quality. Here, the possibilities to bridge the gaps resulting from dropped data acquisition points by the application of intelligent solutions (so-called data refinement) are described. In other words, how can the quality of the traffic flow be assessed at a location where no data acquisition point has been established?
Two different methods seem to be worthwhile considering:
1. Intelligent models implemented on decentralised systems with data evaluation on site.
2. Intelligent models implemented at a control centre receiving aggregated data from a detector unit and developing the required estimations.
Another possibility of saving data acquisition points is the fusion of traffic data from other sources. Such other, additional data can complete and bridge gaps of the locally

© SENSOR Consortium -13- Final Technical Report
acquired data. In this respect data from mobile sources like floating car data as well as data acquired manually by the police or other persons, so-called “Staumelder” should be considered. Data fusion takes place in a central location where data from various sources are brought together, combined and completed in such way that the best possible assessment of the currently prevailing traffic situation in the network can be made.
3.1.4.2 Results
Following the structure of work package 4 the subjects mentioned below had been elaborated in detail:
Planning Identification of data acquisition points
done manually with software support
Operation Data editing
Further planning Measures to reduce the number of data acquisition points
decentralised approach centralised approach
Data fusion
Figure 3-1 Results from Worpackage 4
3.1.4.3 Conclusions
The question of where to collect can only be answered in the context of existing infrastructure, chosen strategy and geometrical constraints. In order to structure the work flow when placing detectors several flow charts had been set up summarising all different aspects being worth considering. Still it became obvious that detectors can only be placed manually in simple and clearly structured networks. In more complex systems software support is required to help finding the link on which data has to be collected. This kind of software support is expected to be implemented into the DSS in order to provide to the user a tool for sensor placement.
However, the proposed software can only determine which links in the network have to be chosen for data acquisition. To find the best possible location of a sensor on the chosen links will still be subject of a manual approach. The choice of the location of the data acquisition point is additionally determined by the available cabling of power supply and data transmission facilities. In WP 4 it has been developped an extra tool of the DSS that helps the user estimating the costs of implementation, power supply and data transmission for a planned measurement system.

© SENSOR Consortium -14- Final Technical Report
Basically it has to be stated, that apart from choosing a suitable location there are other possibilities of working with a lower number of detectors:
On the one hand models have been drawn up which can be applied for estimating the traffic situation of the entire network by exploiting locally acquired data.
On the other hand a possibility has been introduced where software systems have to be provided in a central unit to organise and carry through data completion. In this respect the traffic situation can be estimated on links which are not equipped with data acquisition points.
Both approaches are suitable to save data acquisition points, respectively to lower the density of the local acquisition points and therefore to save costs.
Finally the work package gives a first overview on questions of and approaches to data fusion. Fusion of data from different sources (e.g. static and mobile data) is difficult since the measurement units have to be combined in terms of time and space. But data fusion will be of major interest since the data base and the size of the sample can be improved and broadened by opening up all available sources of data. A detailed description of data fusion has been subject of WP 6.
3.1.5 WP5 Organisational Aspects
3.1.5.1 Description of the work
Besides the technical issues dealt with in the previous work packages the importance of organisational aspects with regard to traffic management in the secondary road network must not be underestimated for a reasonable and efficient course of action. Therefore, in a first step the practices and procedures currently applied in various European countries to traffic data management on secondary roads were identified by means of a comprehensive questionnaire. It inquired details on traffic data acquisition and management, including issues of road operators involved, responsibilities for the various activities related herewith, applicable legal regulations etc.. Distributed among road operators and experts at national, regional and local level, its evaluation was to give an overview on how traffic data acquisition and management is being handled by the different road operators of the secondary road network.
On that basis it was attempted to describe an ideal and efficient data management system and to outline its characteristics in terms of logical and physical architectural requirements. Furthermore, the role of the authorities of the different administrative levels was pointed out. Besides the technical preconditions of a well-functioning data management system other aspects, e.g. legal aspects, were considered which may impede the development of an efficient data management and therefore demand modification or improvement to reach the aspired objective.
Finally recommendations were given how develop or to reach efficient data management. However, in the course of the work it turned out that for each organisational structure or environment an individual, tailor-made solution has to be worked out, whereby all responsible institutions or administrative bodies involved have to reach a consensus on joint strategies, reporting chains and actions to be taken in case of an incident disturbing traffic flow.

© SENSOR Consortium -15- Final Technical Report
3.1.5.2 Results Various possibilities for development, modification or improvement have been pointed out to achieve best practice of data management, which may be selected according to the respective organisational structure prevailing in each case. Recommendations and general principles have been formulated which should be followed in order to increase the efficiency and cost-effectiveness of traffic data management in the secondary road network:
Traffic management objectives should be described clearly and detailed enough to come to a common understanding and approach within different hierarchies of one organisation as well as between different organisations. Where necessary - especially between organisations of different authorities (countries, states, regions etc.) - contracts and agreements should be drawn up, too.
A catalogue of possible data sources should be compiled to be able to take all data available at different organisations into account. Moreover, the data collected should be used for various purposes. For example, traffic data can be used for traffic management as well as – in an aggregated form – for planning, design, construction, maintenance or statistical purposes.
Existing information and knowledge of the persons and organisations involved have to be used as its best. Therefore, persons with specific knowledge of the local situation are as required as persons with specific knowledge of traffic and data management.
Generally it can be said that for a rapid information, decision-making and implementation process it seems reasonable to assign as much responsibility to the authority with the best specific local knowledge and to provide as much information as necessary for the authority performing overall traffic management.
Partly or fully automated traffic management operation requires a fair amount of hard- and software for data detection and strategy implementation. It may be best and most efficiently used centrally in a traffic control centre. However, the information provision and therefore the decision-making process may take more time. But it may help to avoid individual, local traffic management decisions which may be counterproductive if non-coordinated. The more automated traffic management operation can be applied, the more centralised it can be (but does not necessarily has to be).
Furthermore, for an efficient traffic management it is absolutely essential to interconnect the control centres where control decisions are taken with neighbouring traffic control centres. A European-wide standard has already been agreed for this kind of data exchange. However, it is only a technical definition. If a control decision is actually taken and which decision for a currently prevailing traffic situation, will remain a political/operational decision lying in the hands of regional decision-makers.
3.1.5.3 Conclusions
Between the two extremes of a totally centralised and a totally decentralised organisation there is a variety of intermediate stages which usually have grown historically. Therefore, a carefully developed organisational concept is required which provides a tailor-made solution has to be worked out for each individual case. The authorities or bodies involved
© SENSOR Consortium -16- Final Technical Report
have to be identified and the responsibilities and procedures to be followed regarding information flow, decision-making process and implementation of traffic management strategies have to be defined clearly. Hereby, changing responsibilities for different parts of the secondary road network as well as geographical aspects, e.g. the vicinity to agglomerations, may have to be taken into account. Finally a general, common approach and understanding of how to tackle traffic management has to be agreed upon between the parties concerned.
In any case, organisational aspects are a very important element of the overall concept. A well-functioning organisational structure is not the only ingredient required for efficient traffic management, but traffic management will never be efficient without a carefully elaborated organisational structure.
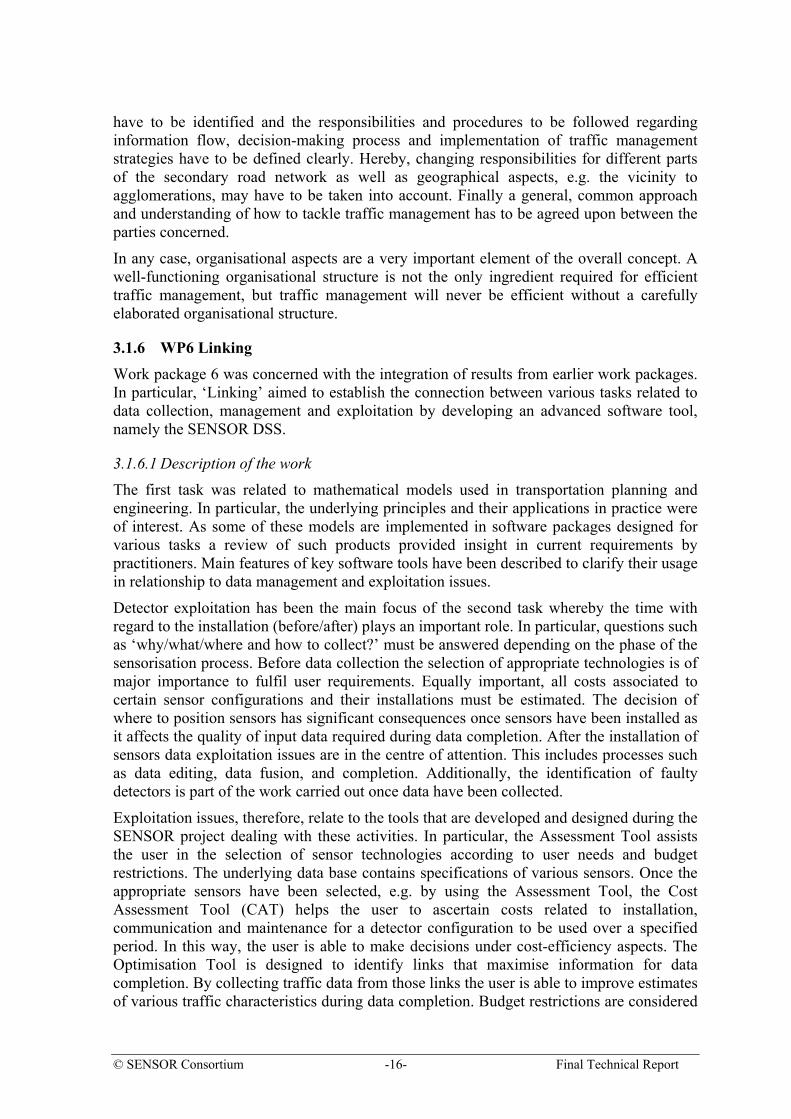
3.1.6 WP6 Linking Work package 6 was concerned with the integration of results from earlier work packages. In particular, ‘Linking’ aimed to establish the connection between various tasks related to data collection, management and exploitation by developing an advanced software tool, namely the SENSOR DSS.
3.1.6.1 Description of the work
The first task was related to mathematical models used in transportation planning and engineering. In particular, the underlying principles and their applications in practice were of interest. As some of these models are implemented in software packages designed for various tasks a review of such products provided insight in current requirements by practitioners. Main features of key software tools have been described to clarify their usage in relationship to data management and exploitation issues.
Detector exploitation has been the main focus of the second task whereby the time with regard to the installation (before/after) plays an important role. In particular, questions such as ‘why/what/where and how to collect?’ must be answered depending on the phase of the sensorisation process. Before data collection the selection of appropriate technologies is of major importance to fulfil user requirements. Equally important, all costs associated to certain sensor configurations and their installations must be estimated. The decision of where to position sensors has significant consequences once sensors have been installed as it affects the quality of input data required during data completion. After the installation of sensors data exploitation issues are in the centre of attention. This includes processes such as data editing, data fusion, and completion. Additionally, the identification of faulty detectors is part of the work carried out once data have been collected.
Exploitation issues, therefore, relate to the tools that are developed and designed during the SENSOR project dealing with these activities. In particular, the Assessment Tool assists the user in the selection of sensor technologies according to user needs and budget restrictions. The underlying data base contains specifications of various sensors. Once the appropriate sensors have been selected, e.g. by using the Assessment Tool, the Cost Assessment Tool (CAT) helps the user to ascertain costs related to installation, communication and maintenance for a detector configuration to be used over a specified period. In this way, the user is able to make decisions under cost-efficiency aspects. The Optimisation Tool is designed to identify links that maximise information for data completion. By collecting traffic data from those links the user is able to improve estimates of various traffic characteristics during data completion. Budget restrictions are considered

© SENSOR Consortium -17- Final Technical Report
because the user can specify the number of detectors to be placed in the network. The Path Flow Estimator (PFE) has been developed to estimate a number of traffic variables given local measurements of flows from some links in the network. Additional information such as a prior OD matrix, trip length distributions, data from road side interviews can be used to improve the accuracy of estimates. This process, referred to as data completion, adds information to an incomplete data base and, simultaneously, contributes to an efficient use of existing (detector) data. Potentially faulty detectors can be identified by the PFE. Given such a case, the restrictions set by the confidence intervals for counts will not be met pointing to inconsistent measurements and potentially faulty detectors.
Besides the development of new software tools and improvements of already existing tools, the underlying algorithms and methods for all software tools have been described in detail.
3.1.6.2 Results
The main outcome of the work package is the SENSOR DSS including the user manual. The software tools dealing with different tasks of data collection, management, and exploitation have been integrated into one software tool, the DSS.
The DSS provides an user-friendly and integrated interface that allows the user interactions between the tools and various tasks. For example, once the user has selected the appropriate technology (Assessment Tools) his choice can directly be used when estimating all relevant costs using the CAT. Also, the close connection between data completion by the PFE and the Optimisation Tool has to be stressed because the information collected at particular locations affects the quality of the estimation process. On the other side, output from the PFE is required to identify optimal detector locations in the network.
The DSS user manual describes the workability of the tools in detail. Various examples illustrate how to apply the tools and to obtain relevant results.
Other results of the work package include:
- the development of the optimisation tool for positioning of detectors in the road network subject to budget restrictions
- improvements to the Path Flow Estimator (PFE) as the data completion tool to estimate various traffic characteristics such as link flows, travel times, delays, congestion levels
- the development of converters that allow the translation of networks between VISUM and the PFE, and consequently the visualisation of results in VISUM
- the development of the Cost Assessment Tool enabling the user to ascertain costs related to installation, communication and maintenance of sensors
3.1.6.3 Conclusions
WP 6 ‘Linking’ has combined successfully results of previous work packages. The connection has been established by developing an advanced software tool enabling the user to deal with various tasks related to data collection, management and exploitation. The DSS allows the user to base the decision process upon specific requirements and budget restrictions. It is expected that this approach can result in significant cost savings at all stages of the sensorisation process. It allows the user to systematically position sensors in

© SENSOR Consortium -18- Final Technical Report
the road network and to exploit traffic data. In particular, as data collection requires expensive equipment the issues of data exploitation becomes an essential part of tasks related to data collection. This fact was stressed by the review of software tools used in transportation planning and their underlying algorithms. These products play an important role as their increasing usage at different levels shows.
However, to the knowledge of the consortium members the DSS is the first software tool that combines decisions about data collection with exploitation issues. Therefore, it can be concluded that the objectives of the work package have been met.
Concise conclusions about benefits of DSS applications can be drawn from pilot sites and case studies when a variety of specific problems across European countries is addressed.
3.1.7 WP7 Pilot Test Sites and Case Studies
3.1.7.1 Description of the work
Work package 7 “Pilot Test Sites and Case Studies” dealt with the application of the SENSOR results (namely Handbook and Decision Support System (DSS)) at measurement sites and with a more theoretical application of the Handbook in different case studies.
The overall objectives were to test and evaluate the usability and workability of the DSS and the Handbook in three pilot sites and to validate the Handbook workability in three case studies.
This work package was based on the results of the previous work packages 1 to 6, especially of course on the results of WP 6 “Linking”. In addition, the results of work package 8 (task 8.1, preparation of the first draft of the Handbook and task 8.2, testing the first draft of the Handbook) were necessary to test the Handbook at the pilot sites as well as at the case studies.
Work package 7 was lead by Darmstadt University of Technology (TUD).
The work package was scheduled to run from October 2003 to end of July 2004. Due to the fact that the DSS and the Handbook took more time to be finalized, the start of the British and Spanish pilot sites had to be postponed as well as the start of the case studies. The measurements at the German pilot site could be started and finished earlier.
The work done and its results of work package 7 were described comprehensively in deliverable 7.1 (Results from the German pilot), deliverable D 7.2 (Results from the British pilot), deliverable 7.3 (results from the Spanish pilot) and in deliverable 7.4 (results from best practice at pilot sites and case studies).
The whole consortium was involved in this work package and each partner of the consortium contributed its specific knowledge and abilities to it. The work package was divided into five tasks. Task 7.1 comprised the German pilot site and was lead by PTV. TORG worked on the British pilot site (task 7.2). ETRA was task leader of the Spanish pilot site (task 7.3) and worked together with DIPVAL. TUD as leader of task 7.4 had to coordinate the three case studies. The German case study was applied by the Aachen local authority (Stadt Aachen), the Hungarian case study by the Hungarian Ministry of Traffic and Water Management (MWTM) and the Italian case study by FIT. Further partners involved were in the German case study the Hessian road authority, in the British pilot site the Gateshead Council and by ANAS, the road authority responsible for the roads in the Italian case study. They provided their knowledge, support and necessary data.

© SENSOR Consortium -19- Final Technical Report
The data from the German pilot site, which were gained by local measurements as well as by measurements with Floating car data (FCD), were analysed and compared to the results which can be gained by the Handbook on the one hand and the DSS on the other hand. For a secondary road which runs almost parallel to a neighboured motorway and which serves temporarily as alternative in case of congestion on the motorway the number and location of sensors, which were selected according to the approach described in the Handbook, showed good corresponding results compared to the measurements.
The Spanish pilot site comprised a small network of secondary roads. Here, mainly the DSS was tested and analysed. Different numbers and locations of sensors were investigated by the DSS tool in order to find a solution which takes into account accuracy and reliability on the one hand and cost-effectiveness on the other hand.
The British pilot site comprised a whole region with a big secondary road network. In this case, an exclusive manual approach as it is provided by the Handbook is not sufficient. Here, the DSS with the Sensor optimisation tool was tested.
All pilot sites were different concerning network size and network structure. So it can be concluded that the Handbook and the DSS are applicable for a great variety of possible network sizes and structures, although not all possible network sizes and structures could be tested. For smaller and simpler structured networks, the recommendations given by the Handbook should be sufficient to gain accurate and reliable results. If the secondary road network which has to be analysed is getting more complex, the use of one or of all DSS tools may be necessary. To get to know which data are necessary and for which purpose they shall be collected, it is in both cases useful to start with the Handbook approach, even if not all chapters are applied in the same detailed way. For application of the optimisation tool, it is recommended that the user is familiar with traffic assignment programmes in order to check the plausibility and reliability of the results gained from these tools.
The administration tool to select an appropriate sensor technology as well as the costing tool can be applied independently from network size and structure. The optimisation tool can show its special advantages in bigger and complex networks, whereas in smaller and simple networks the effort to create a network model may be not appropriate. This has to be checked in every specific case taking into account the existence of a network model, the pre-existing knowledge and data as well as the ability and willingness of the user to get familiar with this tool.
For more detailed results of the pilots sites, please refer to Deliverable 7.1 (German pilot site), Deliverable 7.2 (British pilot site) and Deliverable 7.3 (Spanish pilot site).
Three case studies have been carried out, which were – similar to the pilot sites – different in size, structure and traffic situation. All case studies had in common that a diversion of traffic was examined due too overload, safety problems or other negative impacts on the original route. Traffic diversion is one of the most likely traffic management actions in secondary road networks.
The German case study in Aachen at the western border of Germany to Belgium and to the Netherlands comprised a section of a secondary road which is connected to a motorway and runs into the city. Here, especially in the morning peak hour, congestion occurs with negative impact on traffic flow and the surrounding area. In the case study the possible diversion of traffic onto a longer parallel road was analysed. The number and location of additionally necessary detectors could be gained easily. Here, the Handbook approach

© SENSOR Consortium -20- Final Technical Report
could be compared to previous ways of planning using exclusively local experts’ knowledge.
The Hungarian case study was located in the West of the Hungarian capital Budapest and comprised a secondary road which runs parallel to motorway. Due to the introduction of tolls on the motorway, the traffic volume raised on the parallel secondary route with negative impacts on the surrounding areas. Here, the deviation of heavy vehicles onto the motorway, the reduction of speed and the control of driving behaviour and the improvement of safety were in the focus of the case study. The application of the Handbook was easy and the results gained were plausible and usable. The recommendations how to select the specific road links offered a good basis for selection of the appropriate detector location and the identification of additional accident black spots.
The Italian case study in the Lazio region also comprised a secondary road which runs parallel to a motorway. This secondary road gets a lot of traffic load from leisure time users. The problems caused by traffic are overload, lack of safety and negative impact on the surrounding area. The application of the Handbook was understandable and useful. The different steps of the Handbook were tested as logical, effective and reasonable. The analysis of the field investigated as well as of the infrastructure was helpful for the users to collect and to structure the available information about infrastructure, traffic and surrounding area as a basis for traffic management strategy selection and the therefore necessary data collection. The users should have a pre-existing knowledge of sensor technologies and traffic engineering in order to make use of the Handbook’s recommendations as its best. The annotations concerning organisational, safety and security aspects were appreciated by the users. Here, a lot of potentialities for improvement in the cooperation of different road authorities were identified.
For more detailed results of the case studies, please refer to chapter 1 (German case study), chapter 2 (Hungarian case study) and chapter 3 (Italian case study) of this deliverable.
3.1.7.2 Results
From the German pilot site it can be derived that measurement points at secondary road network links every 3 to 5 km may be sufficient in a lot of cases and if the detector has been positioned at a characteristical location or at an incident-prone area.
From the British pilot study it can be concluded that the DSS provides adequate support to a range of tasks that transport planners are required to do. For example, cost savings of significant magnitude are achievable by placing detectors optimally or by making the most of the available detector data.
The Spanish pilot site showed that the SENSOR DSS is a tool capable to facilitate secondary road administrations the process of equipping the road with the most appropriated technologies, considering the different costs attached to them, and minimising the number of detectors necessary to obtain the necessary data according to a determined strategy.
Conclusions
The SENSOR Handbook is useful to guide the users to the first steps of identifying what will be necessary for a efficient data acquisition for traffic management strategies in secondary road networks. For smaller and easier manageable road networks (e. g. for single alternative routes), the Handbook gives the necessary additional information for further steps of planning as selection of sensor type and proposes where to locate the

© SENSOR Consortium -21- Final Technical Report
sensors. For more complex networks, additional software support is recommended and provided by the different tools which are integrated in the Decision Support System (DSS).
The results from the pilot sites and case studies showed that both the Handbook as well as the DSS can help the users to answer their specific questions and to improve the quality and efficiency for data collection, communication and organisation in the secondary road network.
The SENSOR approach has been proven right to take into account the whole context of users’ needs (Why to collect?), the great variety of purposes data are necessary for (What to collect?), the different possible ways how to collect the data (How to collect?), the search for an optimised location for data collection (Where to collect?) as well as the description of the organisational environment (Organisational aspects).
Nevertheless, the specific knowledge and experience of the Handbook users are vital for a meaningful use of the Handbook and the DSS. Without this “local” knowledge it is hardly possible to come to plausible and adequate solutions. Therefore, the Handbook and the DSS cannot – and were not intended to do – replace the local experts’ knowledge. But it is possible to help these experts analysing their needs concerning data for traffic management strategies, to analyse the potentialities of the existing infrastructure and organisation and to come to conclusions where which sensors should be placed best.
3.1.8 WP8 Handbook
3.1.8.1 Description of the work
Work package 8 “Handbook” deals with the development of a Handbook which allows to plan, implement, and manage road traffic data collection (including both detection and communication) in a cost-efficient way
The work package was lead by ETRA I+D and its main results is the Handbook itself, described comprehensively in deliverable 8.1.
In order to carry out the foreseen work matching WP objectives, the activities was split as follows:
Task 8.1: Preparation Draft Handbook: The first draft of the SENSOR Handbook was produced, by incorporating the guidelines and recommendations from previous WPs.
Task 8.2: Testing the first draft Handbook: This task was for piloting the handbook. The handbook was tested by the user forum. This allowed the identification of a first set of procedures and solutions taking into account user need and perspective.
Task 8.3: Validation: This phase foresaw the application of the handbook to the SENSOR Pilot sites. The validation was carried out in terms of applicability to real cases, testing its complexity, functionality and performance criteria once applied by relevant key actors (i.e. road operators).
Task 8.4: Testing the second draft of the Handbook: This task consolidated the real content of suggested approach by a dedicated round table of the user forum in different EU Countries. This allowed, through expert feedback, a proper effectiveness in Handbook both layout and contents
Task 8.5: Editing the Final Handbook: The Handbook was presented in both paper and electronic version. For a proper dissemination activity the Handbook was translated in some others EU languages (i.e. German, Spanish and Italian).

© SENSOR Consortium -22- Final Technical Report
3.1.8.2 Results The SENSOR Handbook for planning and implementing road traffic data collection, addresses the following topics:
• Introduction (i.e. Description of How to develop traffic management strategies; Description of why to manage road traffic data collection),
• What to collect (Guideline for defining necessary data to be collected),
• How to collect (Handbook/Tool for finding the best means of data collection),
• Where to collect (Guideline for finding the optimum number and locations of data collection),
• Organisational aspect (Recommendations for organising efficient data exchange),
• Linking (Guidelines for linking the different aspects of data management in an optimised way),
• User forum,
• Test sites,
• Case studies.
For a proper dissemination activity the Handbook is translated in some others EU languages (i.e. German, Spanish and Italian).
3.1.8.3 Conclusions
This WP tackles the development of a Handbook, which allows to plan, implement, and manage road traffic data collection (including both detection and communication) in a cost-efficient way. The Hand book was successfully tested at the pilot sites and validated at in case studies in two recursive phases to guarantee its quality, consistency and usability.
The main purpose of the Handbook was to close the gap between the advanced knowledge and experience in the field of traffic management and its therefore necessary data collection on motorways on the one hand and on urban roads on the other hand. The roads between these two road categories are the so-called secondary roads.
If following the recommended methodical procedures, as described and explained in the different chapters of the Handbook step by step. the user is systematically guided to create a sufficient data base for developing and applying a regional traffic management system.
All in all, the Handbook is a helpful tool to support the efforts and investigations to solve the complex and difficult problems which may occur in the field of data collection for traffic management purposes in the secondary road network
3.1.9 WP9 Dissemination & Exploitation
Description of the work
The specific objective related to SENSOR dissemination and exploitation is to ensure the maximum exposure and application of project’s results and findings.
SENSOR dissemination activities are aimed at promoting the project, thereby improving access to useful inputs from other relevant projects and organisations, and at improving the

© SENSOR Consortium -23- Final Technical Report
acceptance and subsequent exploitation of the project results (both Handbook and DSS) by end-users.
As planned in Deliverable D9.1 “Dissemination & Use Plan”, different media are used to approach different target groups; the main tools are:
• Internet (SENSOR website – http://www.sensorproject.com)
• print media (brochure, newsletters, papers, articles)
• networking (User Group, professional organisation)
• face-to face contact (national and international conferences, workshops)
After having identified the potential users of the SENSOR results, such as public and private organisations/authorities, road operators, public transport authorities, consultancies, private traffic industries, etc., the objective is to provide them information on the project’s achievements and findings in order to create the basis for a future SENSOR “market”.
3.1.9.1 Results
During the project lifetime the following results were achieved:
• SENSOR website (http://www.sensorproject.com)
• SENSOR mailing lists for Consortium (private) and Forum (public)
• SENSOR brochure
• SENSOR newsletters (Issue Nr.1,2,3)
• Networking with SENSOR User Group members
• Networking activities - spreading information about SENSOR among potential users (Municipalities, Regions, Transport Associations, Road operators, Private traffic industries, etc.).
• Internal document “U.G. Basic procedure”
• Deliverable D9.1 “Dissemination and Use Plan”
• SENSOR paper presented at “10th World Congress and Exhibition on Intelligent Transport Systems and Devices” (16-20 November 2003, Madrid)
• SENSOR international workshop into “10th World Congress and Exhibition on Intelligent Transport Systems and Devices” (16-20 November 2003, Madrid)
• SENSOR project presentation at the IV Spanish Congress on ITS “IV Congreso Espanol de Sistemas Inteligentes de Transporte” (27-30 April 2004, Zamora, Spain).
• SENSOR article publication on the Italian magazine “Le Strade – Aeroporti, Autostrade, Ferrovie”
• Technological Implementation Plan
• Deliverable D9.2 “Exploitation Plan”
• SENSOR CD-ROM
• SENSOR national workshops:

© SENSOR Consortium -24- Final Technical Report
German National Workshop, Frankfurt, 29th April 2003
German National Workshop, Stuttgart, 5th May 2003
Spanish National Workshop, Valencia, 15th May 2003
Italian National Workshop, Naples, 22nd May 2003
British National Workshop, Newcastle, 30th July 2004
Italian National Workshop, Rome, 29th September 2004
Spanish National Workshop, Valencia, 30th September 2004
3.1.9.2 Conclusions
At the beginning of the project, a Use Group was established with representatives of national/local key actors for each site. The User Group supported SENSOR Consortium in the definition of needs and current situation in order to produce an effective and efficient methodology and tools for planning, implementing and managing road traffic data collection tool in the secondary road network. The User Group includes all kinds of organisations involved in the concerned area: transport and/or road authorities, road operators, local authorities, user representatives.
During project lifetime, other potential members have been contacted with both information and updating about project developments. Among them, Ministry of Transport, National road and motorway operators, Association of National road and motorway operators and suppliers, National contractors of road operation infrastructure, private organisations in the field of traffic data collection and management, private industry in telematics and other key actors have been approached in order to create the basis for a future SENSOR “market”.
3.2 Main Exploitable Results
3.2.1 SENSOR DSS GUI The SENSOR DSS GUI is the Windows application that provides the user with a friendly interface for working with the different tools integrated in the SENSOR DSS and get maximum benefit from them.
The SENSOR DSS is the consequence of the integration of several software tools developed within the SENSOR project and oriented to helping the user in taking decisions about secondary road network sensors management. It is a tool developed to optimize the number and locations of sensors with respect to a measure of performance for path flow estimation. Constraints in terms of the “most suitable” technology to be used, cost assessment analysis, and number and location of sensors are included.
The SENSOR GUI provides a user-friendly and integrated interface for those sensor management activities that are assisted by the software tools developed within the SENSOR project.
The tools mentioned are:
• SENSOR Administration Tool: based upon a database storing the state-of-the-art of sensor technologies.

© SENSOR Consortium -25- Final Technical Report
• SENSOR Assessment Tool: helps end-users to decide what sensor technologies fit the best with their requirements.
• SENSOR Cost Assessment Tool: helps the user in the calculation of the cost of installation, maintenance and use of the sensors and the equipment for data transmission.
• SENSOR Optimisation Tool: based upon a road network model and some inputs regarding traffic behaviour, is capable of suggesting the best location for a given number of sensors.
Basically, the SENSOR GUI works as the user interface for the Assessment Tool, and provides some specific functionalities for working with the PFE and Optimisation tools and with the Cost Assessment tool.
Figure 3-2 SENSOR GUI
The main window of DSS GUI program is divided in several parts:
• The Menu Bar and the Main Toolbar contain buttons for the main user actions.
• The results tree, each branch of the tree represents categories and result items.
• The details panel presents details for the branch selected in the results tree.
• The navigation buttons provide help for navigating through the results tree.
The DSS GUI is simple to use: it is possible to perform actions clicking the buttons of the menu and toolbar, or to study the results moving through the branches of the results tree.

© SENSOR Consortium -26- Final Technical Report
3.2.1.1 Administration Database SENSOR strategic goal consists of the development of a Decision Support System (DSS), which will be designed to assist traffic planners in the process of sensorisation of the secondary road network.
As a first stage in the development of the DSS, within workpackage 3 “How to collect” the sensor consortium has developed an administration tool to facilitate the management and exploitation of the technical information collected concerning more than fifty devices of the categories listed below:
• Traffic Sensors
• Weather Sensors
• Environmental Sensors
• Infrastructure Sensors
• Advanced Traffic Data Collection Tools
In this way, SENSOR project offers a global solution for traffic planners and/or managers, which covers all aspects of the sensorisation process concerning the secondary road network.
The administration tool is based on MS Access database to be used by expert users for maintaining the information about sensor technologies, and configure the list of available criteria for decisions. It contains a a set of user-friendly Forms in order to facilitate the task.
An expert user, with good knowledge of the state of the art of sensors technology and skilled in the use of sensors database, is responsible of keeping the content of the database updated, and configuring the list of possible criteria that end-users can use for evaluating sensors.
Thus, given a set of detectors and information on how they perform on a number of counts (this information is usually available in product factsheets), a common problem that practitioners face is to organize the knowledge available in a compact and useful way in order to decide what is the most appropriate choice of detectors for the task in hand. Due to its simplicity, it can implemented in a variety of ways, for example with Microsoft Excel or Access.
The word sensor is used within the administration tool as a synonym of “sensor technology”, because particular device models are not considered by the application.
The sensors database is structured for describing several specifications for each sensor technology: dimensions, technical data, advantages, limitations, measured magnitudes, accuracy of measures, etc.
There is the possibility of widening the scope of specifications, by adding new attributes that were not taken into account when the database was built, and even new concepts generated by the evolution of technology.
These additional specification are called custom specifications The Administration Database provides Forms for defining them. The only restriction of that they must belong to one of the two following kinds of specification:

© SENSOR Consortium -27- Final Technical Report
Quantitative: can be understood as magnitudes, with a numeric value and a unit (for example: length in meters)
Qualitative: its value belongs to a limited set of values, like “High – Medium – Low”, “Excellent - Good – Fair – Bad”, etc.
3.2.1.2 Assessment Tool
The main role of any technique devised to choose among alternatives is to deal with the difficulties that human decision-makers have been shown to have in handling large amounts of complex information in a consistent way. In the case of SENSOR, the problem is to choose among different detectors (or detector technologies) using both physical characteristics (for instance the quality of speed detection) and subjective assessment (for instance the cost of a detector, despite being a fixed quantity, might be seen as ‘expensive’ by some or ‘cheap’ by others) depend on one organization’s experience, budget, etc.
The aim of the Assessment Tool is to blend together:
• sound mathematical principles;
• ‘objective’ analysis of detector technologies;
• ‘subjective’ assessment of the criteria in order to meet user targets.
The Multiple Criteria Decision Making (MCDM) through ‘weighted averages’ has been used to solve the problem of choosing among detector technologies based on non-homogeneous criteria.
Multiple Criteria Decision Making (MCDM) is a formal approach to try and solve problems where imprecise goals are substituted by possibly precise individual criteria.
Essentially, through MCDM a decision maker (DM), needs to choose among a set of decision alternatives (in our case, sensor technologies), using a set of criteria by which the alternatives will be compared. The performance of each alternative for each criteria is represented the concept attribute, and the aid to decision making is provided by means of ranking the alternatives according to the attributes.
Examples of criteria can be the average price of sensors based upon each technology, the maximum accuracy of the obtained in measures, the range of power consumptions, etc.
Mathematically, the process consists of obtaining a global score for each alternative (sensor technology), obtained from the evaluation of each attribute, and according to the importance that the decision maker (DM) assigns to each criterion.
Each sensor technology is associated with a set of attributes that represent its performance for each of the criteria. The MCDM process evaluates the attributes and obtains a score for the attribute, a numeric value between 0 and 100, for which higher values represent a better performance and better preference for the user.
The importance of a criterion is represented within MCDM by the weight assigned by the DM, a value between 0 and 100, with higher values for more important criteria. The assignment of weights to criteria is often called in the literature as swing weighting process.
The global score for a sensor technology is obtained by calculating a weighted average of the scores for each criterion, according to its weight. The result of the decision making process is the sorted list of alternatives sorted by its global score.

© SENSOR Consortium -28- Final Technical Report
The calculation of the score for each attribute is an important matter that can be approached in different ways, according to the nature of the attribute, that can be quantitative, qualitative, subjective, etc.
Within the SENSOR Assessment Tool, the scoring methodology has been implemented with high flexibility, providing the user with automated procedures and also with the possibility of assigning scores by himself/herself according to his/her own preferences for the criterion.
The automated procedures read the attributes from the sensors specifications stored in the sensors data collection database, comparing them and obtaining the score. The choice of a procedure for each criterion depends on its nature, mainly on whether it is quantitative (like weight, price of power consumption) or qualitative (in which case the value belong to a rank of categories like excellent-good-fair-bad, high-medium-low, etc.
Most scoring procedures consist of assigning score 0 to the alternative with the worst attribute (highest price, heaviest components),100 to the one with the best, and a score proportional to the actual value for the rest of them.
The end result is a software tool developed using Microsoft Access which ranks detectors according to criteria such as counting, presence, classification, weather insensitivity, and so on.
The SENSOR Assessment Tool helps end-users to decide what sensor technologies fit the best with their requirements. The tool is based upon the sensors data collection database (administration tool) that contains specifications about many different technologies. Using SQL queries, the Assessment Tool processes the information contained in this database and according to the specific requirements profile that the user can select at any moment produces an ordered list of sensors, sorted by suitability to the given requirements.
End-users
ResultsAssessment Tool
(MCDM)
Requirements
Sensor technologies
Sensors database
Figure 3-3 Assessment Process

© SENSOR Consortium -29- Final Technical Report
3.2.1.3 Cost Assessment Tool The Cost Assessment Tool provides support for the user when calculating the overall costs of the planned measurement points. The indicated prices have to be considered as default values. As they will certainly vary from country to country and also rise over the time, it is recommended to replace the default values by detailed information on the current market prices.
The Cost Assessment Tool is based on 5 different EXCEL sheets, which the user has to go through and complete (may be even repeatedly, depending on the complexity of the network of measurement points he is planning):
1. Step 1: The Introduction sheet shows a flow chart illustrating how to use the Cost Assessment Tool. It explains the proceeding in detail to the user, i.e. how to calculate the costs and which steps to make. Furthermore, the relevant technical terms used by the Cost Assessment Tool are defined here.
2. Step 2: In the General Issues sheet basic information is required for the calculations to be carried out on the following sheets, e.g. the currency in which the cost assessment is to be made, the planned operating period of the detection devices to be installed as well as the estimated costs of cable laying (empirical values or information provided by the user). These figures will repeatedly be needed in the course of the further cost assessment.
3. Step 3: In the Power Supply sheet the costs of providing power supply for an individual measurement point have to be assessed. Generally there are two possibilities to be taken into account: * Electricity * Solar energy. For both types of energy the figures have to be entered by hand. The tool will then calculate the costs for each type of power supply over the whole operating period. The results are illustrated by means of the bar chart on the right. Before proceeding with the cost assessment the user has to tick below which type of power supply he finally wants to select. The relevant information will be transferred automatically to Sheet 5: Final Results.
4. Step 4: The Data Transmission sheet deals with the costs of providing and operating data transmission for one individual measurement point. Four different types of data transmission to the control centre have been distinguished and listed up here: * Telephone network * Mobile phone * Private mobile radio * Own data transmission network. For each type of data transmission the detailed costs to be considered in the cost assessment have to be completed, whereby the boundary conditions (e.g. cabling distances and circumstances) may differ greatly from one measurement point location to the other. When assessing data transmission costs details on transmission intervals and volumes are of major importance. Therefore, decisions on these issues have to be
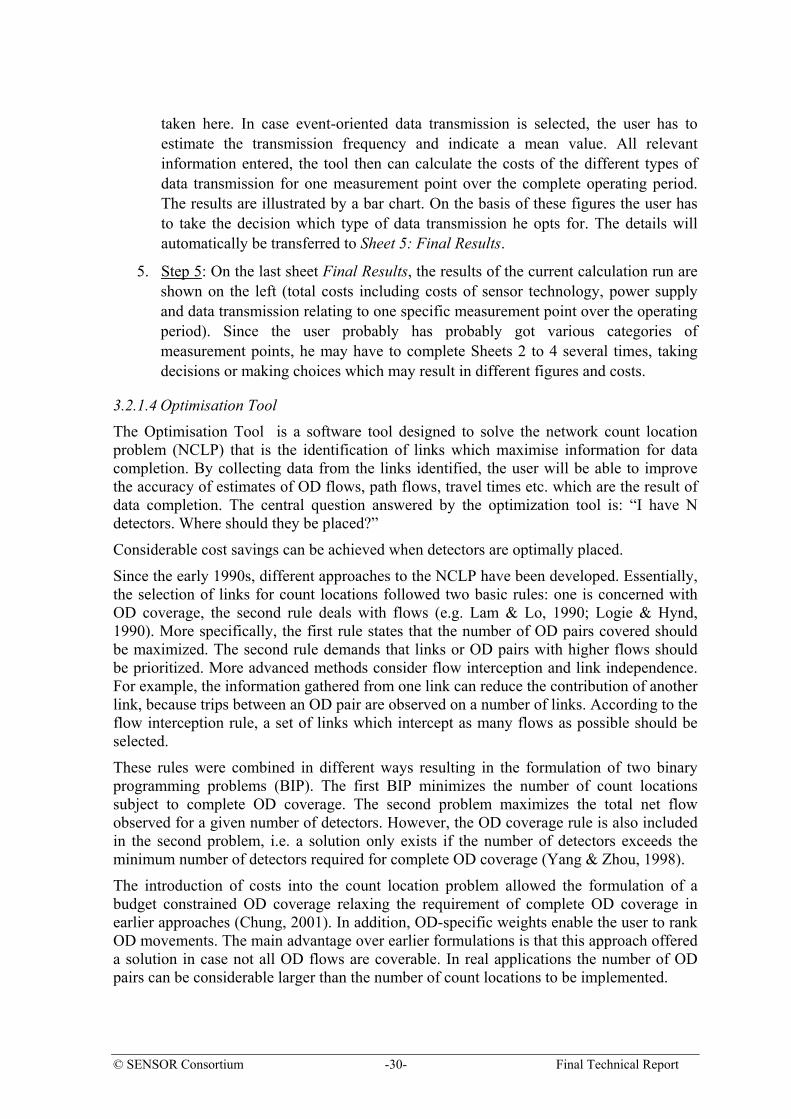
© SENSOR Consortium -30- Final Technical Report
taken here. In case event-oriented data transmission is selected, the user has to estimate the transmission frequency and indicate a mean value. All relevant information entered, the tool then can calculate the costs of the different types of data transmission for one measurement point over the complete operating period. The results are illustrated by a bar chart. On the basis of these figures the user has to take the decision which type of data transmission he opts for. The details will automatically be transferred to Sheet 5: Final Results.
5. Step 5: On the last sheet Final Results, the results of the current calculation run are shown on the left (total costs including costs of sensor technology, power supply and data transmission relating to one specific measurement point over the operating period). Since the user probably has probably got various categories of measurement points, he may have to complete Sheets 2 to 4 several times, taking decisions or making choices which may result in different figures and costs.
3.2.1.4 Optimisation Tool The Optimisation Tool is a software tool designed to solve the network count location problem (NCLP) that is the identification of links which maximise information for data completion. By collecting data from the links identified, the user will be able to improve the accuracy of estimates of OD flows, path flows, travel times etc. which are the result of data completion. The central question answered by the optimization tool is: “I have N detectors. Where should they be placed?”
Considerable cost savings can be achieved when detectors are optimally placed.
Since the early 1990s, different approaches to the NCLP have been developed. Essentially, the selection of links for count locations followed two basic rules: one is concerned with OD coverage, the second rule deals with flows (e.g. Lam & Lo, 1990; Logie & Hynd, 1990). More specifically, the first rule states that the number of OD pairs covered should be maximized. The second rule demands that links or OD pairs with higher flows should be prioritized. More advanced methods consider flow interception and link independence. For example, the information gathered from one link can reduce the contribution of another link, because trips between an OD pair are observed on a number of links. According to the flow interception rule, a set of links which intercept as many flows as possible should be selected.
These rules were combined in different ways resulting in the formulation of two binary programming problems (BIP). The first BIP minimizes the number of count locations subject to complete OD coverage. The second problem maximizes the total net flow observed for a given number of detectors. However, the OD coverage rule is also included in the second problem, i.e. a solution only exists if the number of detectors exceeds the minimum number of detectors required for complete OD coverage (Yang & Zhou, 1998).
The introduction of costs into the count location problem allowed the formulation of a budget constrained OD coverage relaxing the requirement of complete OD coverage in earlier approaches (Chung, 2001). In addition, OD-specific weights enable the user to rank OD movements. The main advantage over earlier formulations is that this approach offered a solution in case not all OD flows are coverable. In real applications the number of OD pairs can be considerable larger than the number of count locations to be implemented.
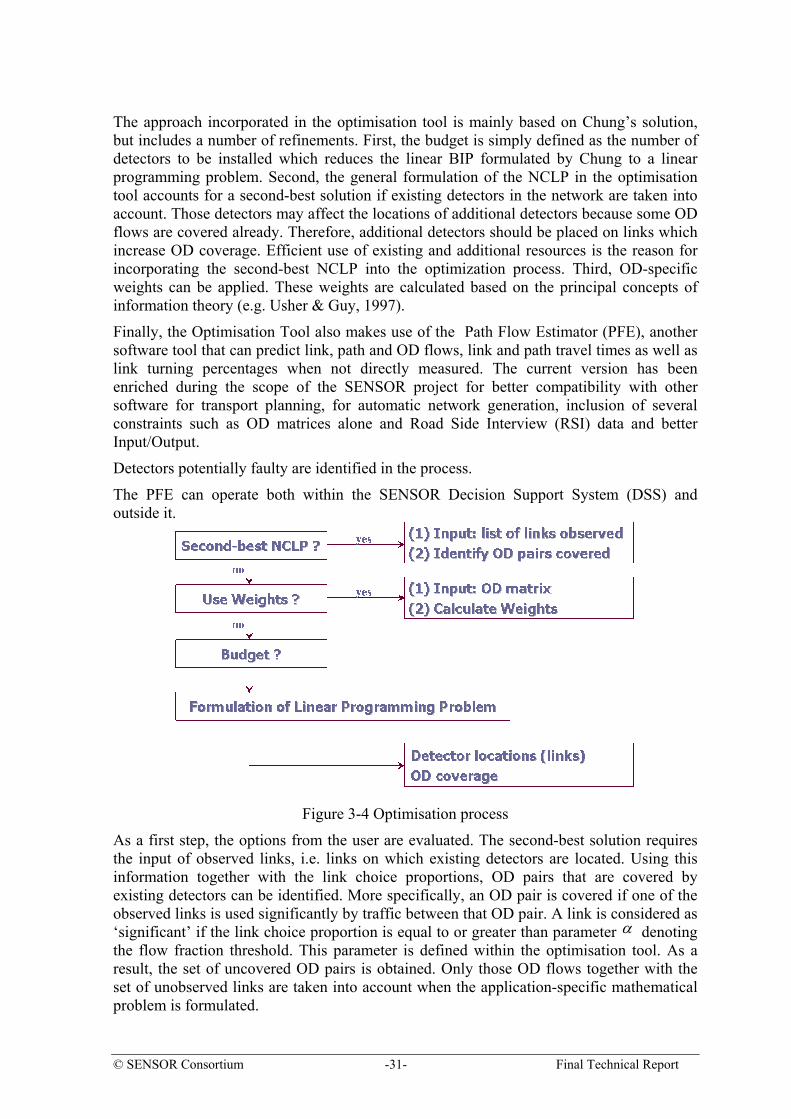
© SENSOR Consortium -31- Final Technical Report
The approach incorporated in the optimisation tool is mainly based on Chung’s solution, but includes a number of refinements. First, the budget is simply defined as the number of detectors to be installed which reduces the linear BIP formulated by Chung to a linear programming problem. Second, the general formulation of the NCLP in the optimisation tool accounts for a second-best solution if existing detectors in the network are taken into account. Those detectors may affect the locations of additional detectors because some OD flows are covered already. Therefore, additional detectors should be placed on links which increase OD coverage. Efficient use of existing and additional resources is the reason for incorporating the second-best NCLP into the optimization process. Third, OD-specific weights can be applied. These weights are calculated based on the principal concepts of information theory (e.g. Usher & Guy, 1997).
Finally, the Optimisation Tool also makes use of the Path Flow Estimator (PFE), another software tool that can predict link, path and OD flows, link and path travel times as well as link turning percentages when not directly measured. The current version has been enriched during the scope of the SENSOR project for better compatibility with other software for transport planning, for automatic network generation, inclusion of several constraints such as OD matrices alone and Road Side Interview (RSI) data and better Input/Output.
Detectors potentially faulty are identified in the process.
The PFE can operate both within the SENSOR Decision Support System (DSS) and outside it.
Figure 3-4 Optimisation process
As a first step, the options from the user are evaluated. The second-best solution requires the input of observed links, i.e. links on which existing detectors are located. Using this information together with the link choice proportions, OD pairs that are covered by existing detectors can be identified. More specifically, an OD pair is covered if one of the observed links is used significantly by traffic between that OD pair. A link is considered as ‘significant’ if the link choice proportion is equal to or greater than parameter α denoting the flow fraction threshold. This parameter is defined within the optimisation tool. As a result, the set of uncovered OD pairs is obtained. Only those OD flows together with the set of unobserved links are taken into account when the application-specific mathematical problem is formulated.

© SENSOR Consortium -32- Final Technical Report
The use of weights requires the input of an OD matrix. The number of trips between OD pairs is used to decide on the relative ranking of OD flows. After evaluating the options, the actual linear programming problem can be established.
As a result of the optimisation process, locations for detectors are obtained. Furthermore, a list of OD pairs that are covered by new detectors is produced.
In the case of the second-best NCLP, OD coverage of existing detectors must be evaluated first. As a result, the coverage of OD flows by existing detectors is determined, and in addition to the two outputs mentioned above written in a file.
The output file containing the location vector of new (additional) detectors can be used to visualize the results in VISUM (by PTV).
3.2.2 SENSOR HANDBOOK The SENSOR Handbook was developed to provide a methodology for planning, implementing and managing road traffic data collection within secondary road network. In order to accomplish this goal, several actions were considered to be necessary such as analyzing why, what, how and where to collect data.
The description of the general planning process for traffic management strategies and the way of traffic data collection and traffic data integration is the basis for the handbook’s structure. The Handbook starts from a more general point of view and leads end-user to more and more detailed questions how to improve the sensorisation in the secondary road network.
The Handbook user is able to equip secondary road network he is responsible for with data collection devices providing the necessary data to take appropriate measures in order to get the traffic-related problems under control. The Handbook may also be helpful who want to acquired further traffic engineering parameters which have not been covered so far by the available sensors as well as who want to complete or intensify the network of data acquisition points.
The Handbook for Data Collection, Communication and Organisation comprises several chapters, each dealing with individual issues. The following topics are treated in the given order:
1. First of all the study area has to be established and its boundaries defined.
2. The second step is the problem analysis and the definition of the political objectives.
3. Then control strategies or measures have to be selected by means of which the user wants to improve the traffic situation.
4. The next step includes the selection of the appropriate technology by which the data have to be acquired. This may be done or alternatively with software support.
5. Then the user has to find out which links in the area considered have to be equipped with sensors and where on the individual links the sensors have to be positioned. For this purpose he is also provided with software support. There is a software tool determining the traffic-related relevance of the link and ranking them. Another software tool assists the user in assessing the incurring costs of the planned data acquisition. So the user can decide how many links he wants to equip with sensors depending on the financial means he has got.
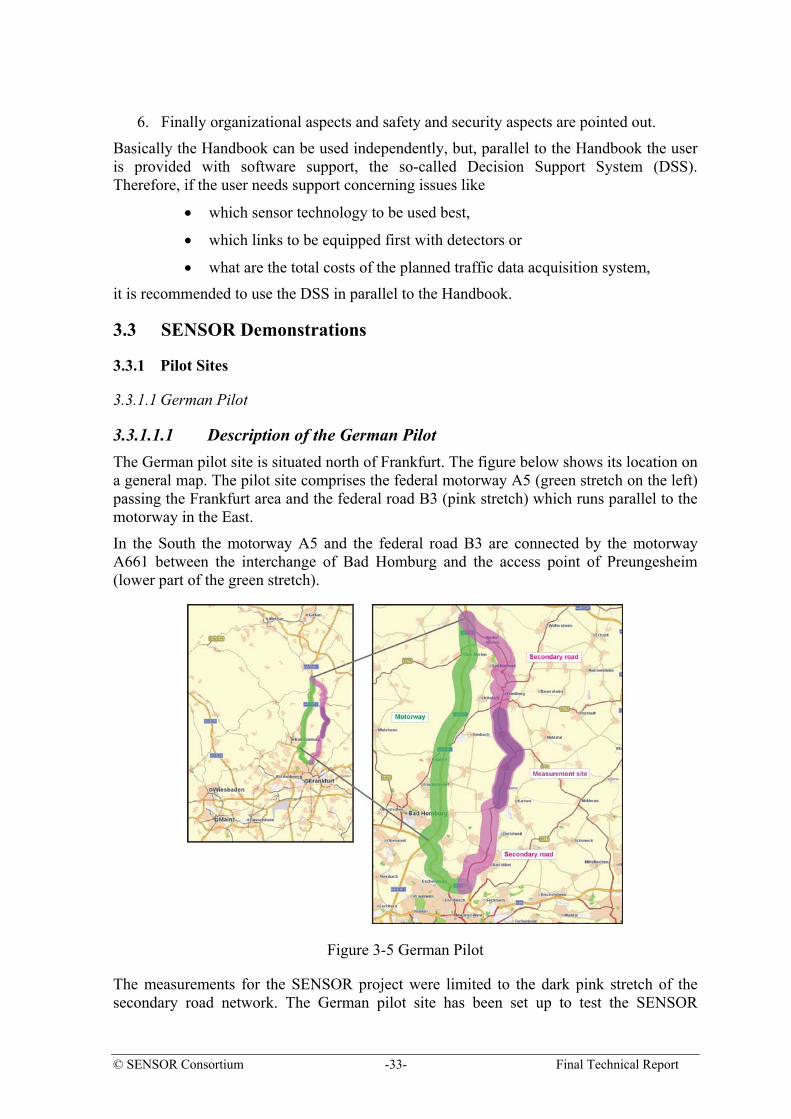
© SENSOR Consortium -33- Final Technical Report
6. Finally organizational aspects and safety and security aspects are pointed out.
Basically the Handbook can be used independently, but, parallel to the Handbook the user is provided with software support, the so-called Decision Support System (DSS). Therefore, if the user needs support concerning issues like
• which sensor technology to be used best,
• which links to be equipped first with detectors or
• what are the total costs of the planned traffic data acquisition system,
it is recommended to use the DSS in parallel to the Handbook.
3.3 SENSOR Demonstrations
3.3.1 Pilot Sites
3.3.1.1 German Pilot
3.3.1.1.1 Description of the German Pilot The German pilot site is situated north of Frankfurt. The figure below shows its location on a general map. The pilot site comprises the federal motorway A5 (green stretch on the left) passing the Frankfurt area and the federal road B3 (pink stretch) which runs parallel to the motorway in the East.
In the South the motorway A5 and the federal road B3 are connected by the motorway A661 between the interchange of Bad Homburg and the access point of Preungesheim (lower part of the green stretch).
Figure 3-5 German Pilot
The measurements for the SENSOR project were limited to the dark pink stretch of the secondary road network. The German pilot site has been set up to test the SENSOR

© SENSOR Consortium -34- Final Technical Report
Handbook and the Decision Support System as well as to gain detailed insight into the break-down of links, the required number of detectors as well as their optimum positioning in the secondary road network.
3.3.1.1.2 Results Regarding the SENSOR Handbook The instructions given in the SENSOR Handbook were applied when selecting the position of the measurement points on the links. However, the choice of the sensor technology based on the Handbook had to be dropped since only provisionally installed detectors could be used on the test site. Therefore, measurement plates and laterally arranged radar sensor which could be removed again after termination of the measurements were installed for that purpose.
As a result the secondary road considered was divided into 8 links per direction, whereby the actual measurement site finally consisted of 3 links per direction. This was due to the fact that the measurement site covered only part of the test site. The break-down into links according to the SENSOR Handbook corresponded with the break-down into links selected for the test site.
In short, it can be said that the measurements carried out on the German pilot site have confirmed that the break-down into links as suggested by the SENSOR Handbook accompanied by the appropriate sensor positioning allows to detect meaningful data on the prevailing traffic situation and therefore provides reasonably good results.
3.3.1.1.3 Results Regarding the DSS The application of the DSS has given a first impression on which possibilities are available for the German pilot site. The suggestion for the appropriate detector technologies by the Assessment Tool have been plausible and have matched the expectations of the user. However, the installations on the actual measurement site were only of temporary nature and therefore could not be covered by the DSS.
The positioning of detectors by means of the Optimisation Tool has offered interesting insight into further possibilities of data evaluation. To summarise the following statements can be made concerning the positioning of detectors by means of the Optimisation Tool:
1. The PFE considers a complete network, whereas the analysis of the German pilot site has been based on a corridor form.
2. The detector locations have altered depending on the number of detectors available for placement. The more detectors to be positioned, the more the PFE detects traffic streams which offer a higher degree of information.
3. The application of the Optimisation Tool presupposes that the user is familiar with traffic assignment programs. Otherwise the plausibility of the results cannot be verified.
4. Generally the detector locations suggested can only be taken over if later a program for network evaluation is available.
5. The Optimisation Tool offers great potential for further evaluations in different fields, e.g. emission calculations, bases for micro-simulations etc.
The Cost Assessment Tool provides the user with a simple opportunity to check the overall costs of several alternatives. The cost estimation undertaken has confirmed the expectations of the user.

© SENSOR Consortium -35- Final Technical Report
3.3.1.1.4 Results of the Measurements The measurements have been carried out in order to find out in how far the quality of local data acquisition depends on the link break-down and the sensor positioning. As reference system hereby serves traffic data acquisition by floating cars.
3.3.1.1.4.1 Link Break-down (Link Length resp. Number of Measurement Points)
Links of similar section characteristics over their whole length can be treated best and provide good results. The measurement quality degrades, the more varied the section characteristics, which naturally tends to vary with growing the link length.
By combining links to form longer links the determined LoS are evened out and therefore minor differences between the actually prevailing traffic situations and the locally determined ones, too. Thus, the question of the required number of detectors cannot be answered so easily (or not clearly). It depends on the expectations to be fulfilled by the results of local data acquisition.
If a spatially more differentiated data acquisition is aimed at, which detects and distinguishes the traffic situations on individual subsections of varying road characteristics, it is necessary to position sensors closely. If the main emphasis lies on the overview on the currently prevailing traffic situation on a longer stretch, there is no necessity to have a great number of detectors. As the study has revealed, even less sensors (approx. 0.2 to 0.3 measurement points per direction km) provide a sufficiently good quality of the acquired data and hence good results.
However, the greater the spacing of the measurement points, the higher the probability that the detector is not positioned near the incident site and that the incident will not be detected. A clever positioning of sensors on the link may help to prevent that.
3.3.1.1.4.2 Positioning of Sensors on the Link
The most important criterion for sensor positioning on a link is the most realistic detection of the prevailing traffic situation. This can be achieved best, if the sensor is positioned in a area representing best the section characteristics of the link.
As already mentioned above, a second criterion which has to be taken into consideration when selecting the sensor location is the probability of exceptional incidents occurring. Therefore, it has to be taken care to place the detector as near as possible upstream an incident-prone area.
3.3.1.2 British Pilot
The British Pilot site, the Metropolitan Borough of Gateshead, is located in the Northeast of England. It is one of five counties in the Tyne and Wear conurbation. The Borough, covering an area of 55 square miles, is divided into 22 wards with an overall population of approximately 200000 inhabitants. Gateshead Council is Highway Authority for the Borough, and takes responsibility over large parts of the road network, including secondary roads. Data collection and installation of appropriate equipment has been part of this task for a long time. To date, more than 140 sites with automatic devices are in operation. In addition, manual counts are carried out on a regular basis. However, despite the high level of sensorisation it is found that the overall knowledge of the traffic situation is limited, e.g. an origin-destination matrix of the area under investigation is not available.

© SENSOR Consortium -36- Final Technical Report
It was expected that the SENSOR DSS (Decision Support System) can provide support for a number of problems related to data collection and exploitation. For the British Pilot site, the main attention was directed towards data exploitation, namely the use of the PFE Tools (Path Flow Estimator & Optimisation Tool) to obtain an area-wide overview of the traffic situation by estimating link flows and travel times. In addition, existing detector locations are assessed with regard to their contributions to the flow estimation process.
Because of the high number of already existing installations the Assessment Tool and the Cost Assessment Tool (CAT) have been used to compare the existing status of data acquisition devices with recommendations provided by the SENSOR DSS. Thus, possible cost savings can be estimated if these tools of the DSS would have been available at the planning stage.
In order to use the PFE Tools input data such as a network file in VISUM format must be prepared by the user. For example, besides network elements such as nodes and links it must include traffic zones, and existing count locations must be associated with the corresponding VISUM links. Deliverable 7.2 for the British Pilot site has set out a number of steps the user should consider when preparing input data.
Additionally, in case of the British Pilot site data of a recent household survey in combination with traffic counts from the boundaries of the area under investigation have been used to estimate a prior origin-destination (OD) matrix. It was confirmed that the additional provision of such a matrix improves the results of the PFE considerably. Essentially, an update of this matrix is obtained during data completion by the PFE when traffic counts are taken into account.
The application of the DSS at the British Pilot site has led to the following results: The total number of trips in the area is approximately 430.000. A more detailed perspective shows that the majority of trips are due to through traffic (42%), only 11% accounts for car trips within the district. Besides the estimation of OD flows, the results include a detailed picture of the traffic situation as flows, travel times, and congestion levels are evaluated for each link in the network. The results underline the extent of traffic problems in key development areas such as the Metro Centre and the Team Valley Estate.
The assessment of existing detector locations has shown that flows between most OD pairs (98%) are already observed. Movements between OD pairs that are not covered only account for 0.5% of the total number of trips. Therefore, it can be concluded that the existing detectors provide a good basis for the data completion process. The installation of additional detectors cannot be recommended. However, it has also been found that for complete OD coverage traffic counts from 79 links must be available as opposed to the currently 173 links observed. This comparison suggests that cost savings of considerable magnitude can be achieved when detectors are optimally placed. The optimal detector configuration has been used as an example to estimate the total costs incurring for such an installation over a predefined operating period. Furthermore, the optimisation process also suggests that fewer detectors on primary roads are required, but more detectors must be placed in the secondary road network.
From the application at the British Pilot site it can be concluded that the DSS Tools provide adequate support for a wide range of tasks. For example, the PFE Tools allow the user to systematically exploit detector data, and to place detectors in the road network according to budget restrictions. The Assessment Tool and the Cost Assessment Tool provide useful help, in particular at the planning stage when long-term decisions are made.

© SENSOR Consortium -37- Final Technical Report
The SENSOR DSS is designed as an integrated software package that assist the user along the process of sensorisation of the road network, but the tools can also be used separately.
Overall, the SENSOR DSS provides a user-friendly and integrated interface. Once familiar with the DSS Tools, the user can easily use them to manage data collection and exploitation in a systematic way. As the preparation of input data, in particular for the PFE Tools, decreases over time the application of the DSS is more and more beneficial when used consistently. However, to ensure long-term success, both the DSS Tools as well as the input data must be maintained in order to account for the latest developments. For example, these include sensor technologies, new or improved methods to estimate traffic characteristics, or changes in the network Some of these tasks fall in the responsibility of the user, for example the maintenance of the network, other should be provided by the consortium which designed the tools.
3.3.1.3 Spanish Pilot
3.3.1.3.1.1 Description
The Spanish pilot was carried out in the valencian region, at the CV336 secondary road, which connects San Antonio Benagéber with Bétera. Main peculiarity of this road is its location, since it is one of the most affluent exits of the freeway connecting Valencia city with the rest of the periurban municipalities.
The Spanish Pilot, road CV-336, is connected to one of the state corridors, CV-35, freeway that links Valencia city centre with the small villages located in the suburbs. This is one of the major roads to enter Valencia from the west; so major efforts have been destined at a regional and national level to equipped adequately. As a result, the adjacent secondary roads such as the CV-336, acquire special importance due to its strategic situation to alleviate the traffic during peak hours.
Next it is provided a satellite view of the pilot site where the Spanish testing took place. Red and white mark is the CV-336 secondary road, yellow mark is the corridor CV-35 linking Valencia with the per urban villages, and finally the red triangles and squares are residential areas.
Urb. e
106,7
101 7
108,5
114,5
112,4
K. 5
K. 14
a
Suai
San Antonio de Benagéber
Figure 3-6 Spanish Pilot

© SENSOR Consortium -38- Final Technical Report
Regarding the Valencian environmental conditions, they are very typical from the Mediterranean region, where the weather is characterised for high temperatures during the summer term and mild winter seasons
3.3.1.3.1.2 Test
The authority in charge of this public road network is the Valencian Diputation. Maximizing the efficiency and capacity of the existing road transportation network is on of its main goals at the valencian network since it has been made necessary by the continued increase in traffic volume and the limited construction of new secondary roads in urban, intercity, and rural areas and the continuous expansion of residential areas.
Thus, smart street systems that contain traffic monitoring detectors, real-time adaptive signal control systems, and corridor intercommunication are being combined with secondary road surveillance and control systems to create smart secondary road networks that increase the effectiveness of the overall transportation network.
However, the infrastructure improvements and new technologies are, in turn, very poor, since secondary road networks at the Valencia region have progressed very slowly due to the priorities provided to the construction and maintenance of freeways and highways.
Vehicle detectors are an integral part of nearly every modern traffic control system. Moreover, detectors and communications media will also be major elements in future traffic monitoring systems, especially at the secondary road systems. The types of traffic flow data, their reliability, consistency, accuracy, and precision and detector response time are some of the critical parameters that should be evaluated when choosing a vehicle detector. These attributes become even more important as the numbers of detectors proliferate and the real-time control aspects become complicated. In this sense, SENSOR DSS puts a premium on both the quantity and quality of traffic flow data used in secondary roads traffic surveillance and control.
Currently, traffic data collection at the valencian region is based predominantly on pneumatic road tubes and inductive loop detectors installed in the roadway subsurface. When properly installed and maintained, they can provide real-time data and a historical database against which to compare and evaluate more advanced detector systems. However, there are other alternative detector technologies that provide direct measurement of a wider variety of traffic parameters, such as density, travel time, and vehicle turning movement.
During the SENSOR study, the testing of the SENSOR DSS application was conducted from two major fronts:
• Theoretical Approach. In this case, several case studies were performed jointly with the Diputation of Valencia members in order to assess the usability and efficiency of the SENSOR DSS.
• Practical Approach. During this second phase of the testing, initial traffic data was collected to compare the actual results with those obtained using the support of the DSS.
Furthermore, during the Spanish pilot major emphasis was dedicated to assess the support provided by SENSOR as part of the Road Maintenance Strategy, significant challenge of the local administration.
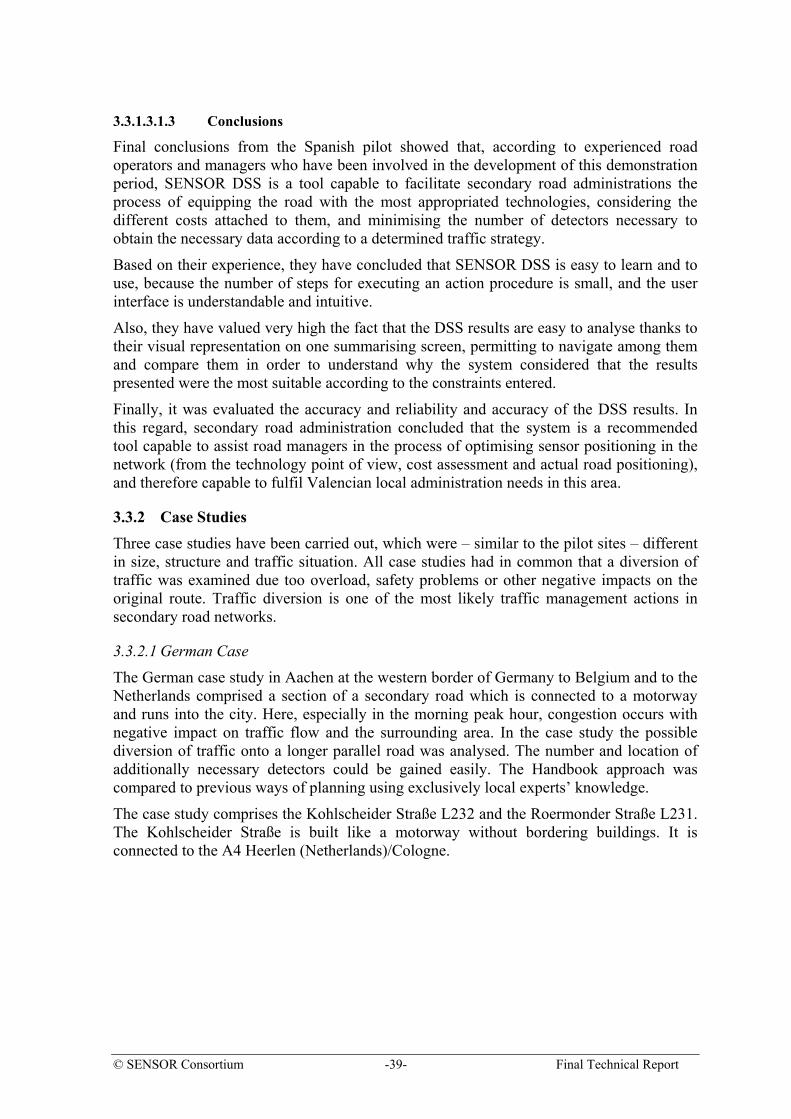
© SENSOR Consortium -39- Final Technical Report
3.3.1.3.1.3 Conclusions
Final conclusions from the Spanish pilot showed that, according to experienced road operators and managers who have been involved in the development of this demonstration period, SENSOR DSS is a tool capable to facilitate secondary road administrations the process of equipping the road with the most appropriated technologies, considering the different costs attached to them, and minimising the number of detectors necessary to obtain the necessary data according to a determined traffic strategy.
Based on their experience, they have concluded that SENSOR DSS is easy to learn and to use, because the number of steps for executing an action procedure is small, and the user interface is understandable and intuitive.
Also, they have valued very high the fact that the DSS results are easy to analyse thanks to their visual representation on one summarising screen, permitting to navigate among them and compare them in order to understand why the system considered that the results presented were the most suitable according to the constraints entered.
Finally, it was evaluated the accuracy and reliability and accuracy of the DSS results. In this regard, secondary road administration concluded that the system is a recommended tool capable to assist road managers in the process of optimising sensor positioning in the network (from the technology point of view, cost assessment and actual road positioning), and therefore capable to fulfil Valencian local administration needs in this area.
3.3.2 Case Studies Three case studies have been carried out, which were – similar to the pilot sites – different in size, structure and traffic situation. All case studies had in common that a diversion of traffic was examined due too overload, safety problems or other negative impacts on the original route. Traffic diversion is one of the most likely traffic management actions in secondary road networks.
3.3.2.1 German Case
The German case study in Aachen at the western border of Germany to Belgium and to the Netherlands comprised a section of a secondary road which is connected to a motorway and runs into the city. Here, especially in the morning peak hour, congestion occurs with negative impact on traffic flow and the surrounding area. In the case study the possible diversion of traffic onto a longer parallel road was analysed. The number and location of additionally necessary detectors could be gained easily. The Handbook approach was compared to previous ways of planning using exclusively local experts’ knowledge.
The case study comprises the Kohlscheider Straße L232 and the Roermonder Straße L231. The Kohlscheider Straße is built like a motorway without bordering buildings. It is connected to the A4 Heerlen (Netherlands)/Cologne.
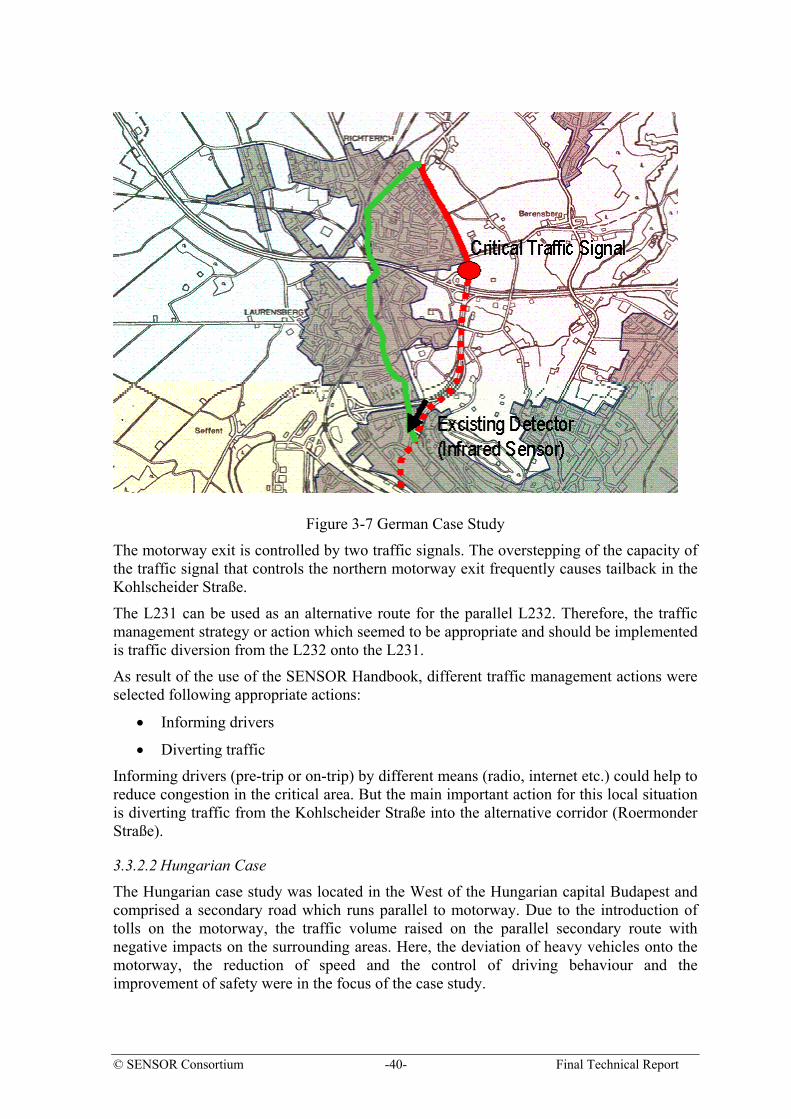
© SENSOR Consortium -40- Final Technical Report
Figure 3-7 German Case Study
The motorway exit is controlled by two traffic signals. The overstepping of the capacity of the traffic signal that controls the northern motorway exit frequently causes tailback in the Kohlscheider Straße.
The L231 can be used as an alternative route for the parallel L232. Therefore, the traffic management strategy or action which seemed to be appropriate and should be implemented is traffic diversion from the L232 onto the L231.
As result of the use of the SENSOR Handbook, different traffic management actions were selected following appropriate actions:
• Informing drivers
• Diverting traffic
Informing drivers (pre-trip or on-trip) by different means (radio, internet etc.) could help to reduce congestion in the critical area. But the main important action for this local situation is diverting traffic from the Kohlscheider Straße into the alternative corridor (Roermonder Straße).
3.3.2.2 Hungarian Case
The Hungarian case study was located in the West of the Hungarian capital Budapest and comprised a secondary road which runs parallel to motorway. Due to the introduction of tolls on the motorway, the traffic volume raised on the parallel secondary route with negative impacts on the surrounding areas. Here, the deviation of heavy vehicles onto the motorway, the reduction of speed and the control of driving behaviour and the improvement of safety were in the focus of the case study.

© SENSOR Consortium -41- Final Technical Report
The case study contains two parallel national roads, motorway M1 and main road No. 1. are connecting motor road M0 (ring road of Budapest) and town Tatabánya-Újváros.
These roads have a mixed traffic, because this is a suburban area of Budapest, and these roads lead the transit-traffic to Western Europe too.
Figure 3-8 Hungarian Case Study
The case study comprises the federal motorway M1 (wide red and green line) passing Budapest at the federal motorway M0 and the main road No. 1. (thin blue line) which runs parallel to the motorway in the West.
The selected main road No.1 shows the typical features of a secondary road section. It runs mostly through non-built-up areas passing two towns and only one small village.
The application of the Handbook was easy and the results gained were plausible and usable. The recommendations how to select the specific road links offered a good basis for selection of the appropriate detector location and the identification of additional accident black spots. Handbook gives precise guidelines to find and analyse local conditions and to clear up prevailing problems. The use of the SENSOR Handbook can give new attitude to Hungarian road operators and managers to analyse and solve safety and traffic problems not only regularly.
3.3.2.3 Italian Case
Italian Case Study has been carried out in the Lazio region including a secondary road which runs parallel to a motorway. The area where the Handbook usability and practicability were tested was north sector of Lazio along the Tirreno Sea coast served by SS1 Aurelia and A12 Rome-Civitavecchia. The section of the SS1 Aurelia selected for the case study connects Rome to Civitavecchia (about 70 kilometres long) identifying the relevant secondary road network where SENSOR traffic management strategy shall be applied. The case study has been carried out with the collaboration of ANAS
© SENSOR Consortium -42- Final Technical Report
(http://www.enteanas.it/) which is the company in charge of the management of Italian primary and secondary state roads (including the SS1 Aurelia).
ANAS followed the step by step approach provided by SENSOR Handbook for planning road traffic data collection on the identified relevant secondary road network. Relevant qualified personnel of ANAS in the field of traffic data collection adopted the Handbook approach following the steps as defined into the Handbook. This allowed testing, evaluating and validating the workability of the Handbook in terms of usability and applicability in a real environment with specific on site conditions.
Through this process, it has been possible to evaluate the responsiveness of the SENSOR Handbook. It emerges that application of the Handbook was understandable and useful. The different steps of the Handbook were tested as logical, effective and reasonable. The analysis of the field investigated as well as of the infrastructure was helpful for the users to collect and to structure the available information about infrastructure, traffic and surrounding area as a basis for traffic management strategy selection and necessary data collection. Users should have a pre-existing knowledge of sensor technologies and traffic engineering in order to make use of the Handbook’s recommendations as its best. The annotations concerning organisational, safety and security aspects were appreciated by the users. Here, a lot of potentialities for improvement in the cooperation of different road authorities were identified. As detailed explained in Deliverable D7.4 “Results from the Best Practice at Pilot Sites and Case Studies”, the results from the Italian Case Study showed that SENSOR Handbook can effectively support users to answer their specific questions thus improving quality and efficiency for data collection, communication and organisation in the secondary road network.
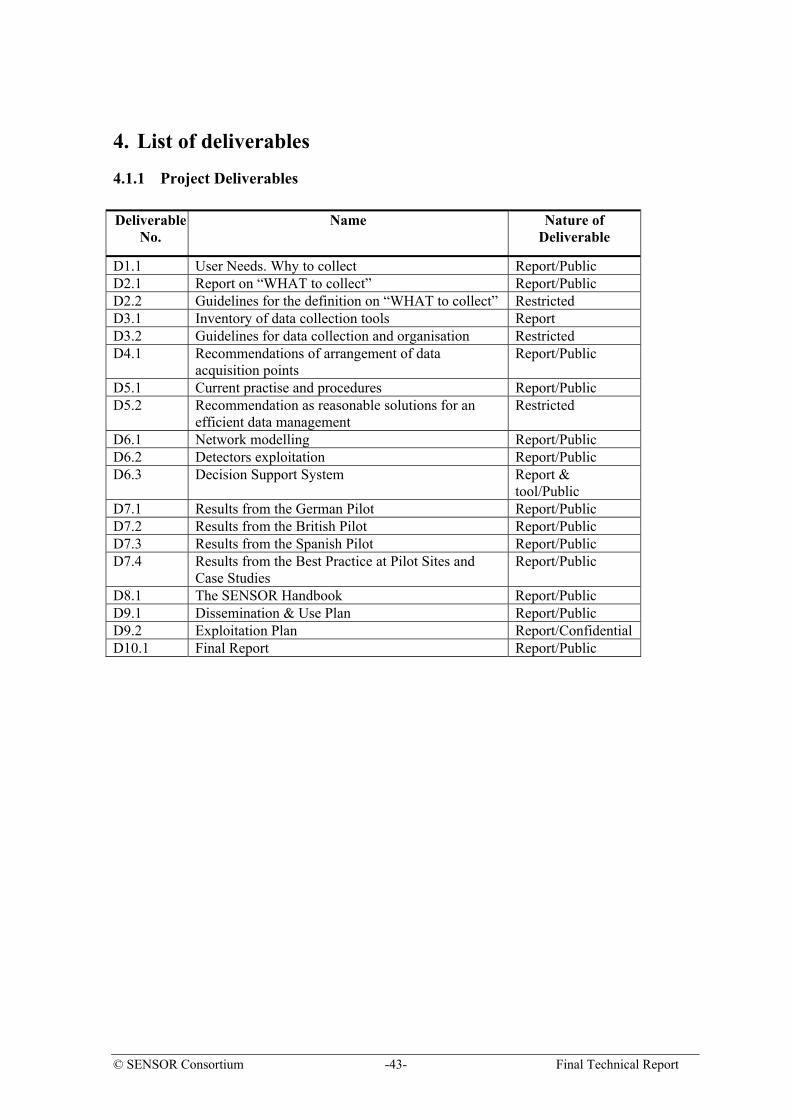
© SENSOR Consortium -43- Final Technical Report
4. List of deliverables
4.1.1 Project Deliverables Deliverable
No. Name Nature of
Deliverable
D1.1 User Needs. Why to collect Report/Public D2.1 Report on “WHAT to collect” Report/Public D2.2 Guidelines for the definition on “WHAT to collect” Restricted D3.1 Inventory of data collection tools Report D3.2 Guidelines for data collection and organisation Restricted D4.1 Recommendations of arrangement of data
acquisition points Report/Public
D5.1 Current practise and procedures Report/Public D5.2 Recommendation as reasonable solutions for an
efficient data management Restricted
D6.1 Network modelling Report/Public D6.2 Detectors exploitation Report/Public D6.3 Decision Support System Report &
tool/Public D7.1 Results from the German Pilot Report/Public D7.2 Results from the British Pilot Report/Public D7.3 Results from the Spanish Pilot Report/Public D7.4 Results from the Best Practice at Pilot Sites and
Case Studies Report/Public
D8.1 The SENSOR Handbook Report/Public D9.1 Dissemination & Use Plan Report/Public D9.2 Exploitation Plan Report/Confidential D10.1 Final Report Report/Public

© SENSOR Consortium -44- Final Technical Report
5. List of SENSOR Contact Persons No modifications have been produced on the contact persons of each one of the organisations involved in SENSOR since the beginning of the project.
(1) ETRA I+D, Mr. Antonio Marqués, Director of New Technologies Dpt, Tres Forques, 147, 46014, Valencia, Spain. Tel: +34 96 313 40 82, Fax: +34 96 350 32 34, e-mail: [email protected]
(2) DIPVAL, Mr. Jose Antonio Aranda Castello, Director of the “Area de Carreteras (Proyectos)”, C/ Hugo de Moncada 9, 46010 Valencia, Spain. Tel: +34 (96) 388.29.80, Fax: +34 (96) 388.35.29 Ext.3529, e-mail: [email protected]
(3) FIT CONSULTING, S.r.l. ., Mr. Massimo Marciani, President of FIT Consulting srl, e-mail: [email protected]; Mr. Luca Lucietti, Researcher of FIT Consulting srl, e-mail: [email protected]; Via Vittorio Emanuele Orlando, 75, 00185, Rome, Italy. Ph: +39 06 4740657, Fax: +39 06 47824352.
(4) PTV AG, Mr. Walter Maibach, Managing Director Stuttgart branch, Kriegerstr. 15, D-70191 Stuttgart, Germany. Tel.: +49 711 16270-30, Fax: +49 711 16720-70, Email: [email protected]
(5) AACHEN, Mr. Thomas Fiedler. Project manager. Stadt Aachen - Der Oberbuergermeister, Germany. Tel: +49 (241) 432 76 25, Fax. +49 (241) 432 76 29, e-mail: [email protected]
(6) MTWM, Mr. Tamas Nagy, head of department, Technical and information services on state roads. Fényes Elek 7-13, Budapest 1024, Hungary. Tel: +36 375-0659, Fax: +36 316-2744, e-mail: [email protected].
(7) TORG (Transport Operations Research Group), Mr. Roger Bird, Lecturer in Highway Engineering, School of Civil Engineering and Geosciences, Cassie Building, University of Newcastle upon Tyne, NE1 7RU, UK. Tel.: +44 191 222 7681, Fax: +44 191 222 5322, email: [email protected]
(8) TUD (Darmstadt University of Technology), Mr. Matthias Bohlinger, Research Associate, Petersenstraße 30, D-64287 Darmstadt, Germany. Tel: +49 61 51 16 53 89, Fax: +49 61 51 16 46 25, e-mail: [email protected]

© SENSOR Consortium -45- Final Technical Report
6. Glossary EU European Union
DSS Decision Support System
GUI Graphical User Interface
UG User Group
RTD Research Technology and Demonstration
UG Users Group
WP Workpackage
PCU Passenger car unit
PFE Path Flow Estimator
OD Origin, destiny
NCLP Network Count Location Problem

© SENSOR Consortium -46- Final Technical Report
7. Results and Conclusions The conclusion at the end of the SENSOR project is that the objectives initially planned have been achieved. The two main results of the project, the DSS and the Handbook, have been appreciated positively. .
The SENSOR Handbook is useful to guide the user to the first steps of identifying what will be necessary for a efficient data acquisition for traffic management strategies in secondary road networks. For smaller and easier manageable road networks (e. g. for single alternative routes), the Handbook gives the necessary additional information for further steps of planning as selection of sensor type and proposes where to locate the sensors. For more complex networks, additional software support is recommended and provided by the different tools which are integrated in the Decision Support System (DSS).
The results from the pilot sites and case studies showed that both the Handbook as well as the DSS can help the users to answer their specific questions and to improve the quality and efficiency for data collection, communication and organisation in the secondary road network.
The SENSOR approach has been proven right to take into account the whole context of users’ needs (Why to collect?), the great variety of purposes data are necessary for (What to collect?), the different possible ways how to collect the data (How to collect?), the search for an optimised location for data collection (Where to collect?) as well as the description of the organisational environment (Organisational aspects).
Nevertheless, the specific knowledge and experience of the Handbook users are vital for a meaningful use of the Handbook and the DSS. Without this “local” knowledge it is hardly possible to come to plausible and adequate solutions. Therefore, the Handbook and the DSS cannot – and were not intended to do – replace the local experts’ knowledge. But it is possible to help these experts analysing their needs concerning data for traffic management strategies, to analyse the potentialities of the existing infrastructure and organisation and to come to conclusions where which sensors should be placed best.

© SENSOR Consortium -47- Final Technical Report
8. References Papers presented at relevant conferences:
1. SENSOR paper presented at 10th World Congress and Exhibition on Intelligent Transport Systems and Devices” (16-20 November 2003, Madrid)
2. SENSOR paper presented at IV Spanish Congress on ITS “IV Congreso Espanol de Sistemas Inteligentes de Transporte” (27-30 April 2004, Zamora, Spain)
3. Ehlert, A., Bell, M.G.H., Grosso, S., Bird, R. (2004) The Optimisation of Detector Locations in Road Networks. 36th Annual UTSG Conference, Newcastle upon Tyne, U.K., 5th – 7th January 2004.
Other references:
4. SENSOR article publication on the Italian magazine “Le Strade – Aeroporti, Autostrade, Ferrovie” (N.7-8 July/August 2004)
5. Bundesanstalt für Straßenwesen (BASt), Richtlinien für Wechselverkehrszeichenanlagen (RWVA), Bergisch Gladbach, 1997
6. Bundesanstalt für Straßenwesen (BASt), Technische Lieferbedingungen für Streckenstationen – TLS, Bergisch Gladbach, 2002
7. Forschungsgesellschaft für das Straßen- und Verkehrswesen, Richtlinien für Lichtsignalanlagen - RiLSA, Köln, 1992
8. Forschungsgesellschaft für das Straßen- und Verkehrswesen, Merkblatt für Detektoren im Straßenverkehr, Köln, 1991