Embed Size (px)
Citation preview
MID-INFRARED LASER DIAGNOSTICS FOR CHEMICAL
KINETICS STUDY OF OXYGENATES
A DISSERTATION
SUBMITTED TO THE DEPARTMENT OF MECHANICAL ENGINEERING
AND THE COMMITTEE ON GRADUATE STUDIES
OF STANFORD UNIVERSITY
IN PARTIAL FULFILLMENT OF THE REQUIREMENTS
FOR THE DEGREE OF
DOCTOR OF PHILOSOPHY
Wei Ren
August 2013

iv
v
Abstract
Biofuels are classified as renewable because the carbon present in the vegetable oil
or animal fat feedstocks originates from carbon dioxide already present in the atmosphere.
Biofuels also offer additional benefits such as reduced carbon monoxide, hydrocarbon
and particulate matter emissions and the potential to reduce the world’s intense
dependence on fossil fuels. One of the current focuses on biofuel-based energy systems is
the design of advanced energy conversion devices using complex reaction
mechanisms. The development of these mechanisms requires a large experimental
database to ensure accuracy of computational predictions.
Infrared laser-absorption diagnostics are widely used in combustion research for fast,
sensitive, and non-intrusive measurements of species concentration, temperature, and
pressure. The combination of shock-heating and species-specific laser absorption
provides a state-of-the-art test platform for studying chemical kinetics. This thesis
explores three new areas of laser diagnostic research: (a) mid-infrared diagnostics, (b)
sensing in multiphase flows, and (c) applications to shock tube chemical kinetics.
Carbon monoxide (CO) and carbon dioxide (CO2) are particularly significant
diagnostic targets for combustion systems, since they are the primary intermediate or
product in combustion, and their concentrations can be interpreted to indicate combustion
efficiency. Previous laser-based absorption sensors were mainly designed to exploit
commercial telecom diode lasers in the 1.3-1.6 m (near-infrared) wavelength region.
Recent developments in quantum-cascade (QC) laser technology, resulting in room-
temperature, high power (mW) and single-mode laser sources, allow access to much
stronger absorption bands of CO and CO2 in the mid-infrared region. The development of
a novel CO diagnostic near 4.7 m using QC laser was demonstrated as part of this thesis
work. Spectroscopic parameters of the selected transitions were determined via
vi
laboratory measurements in a shock tube over the 1100-2000 K range and also at room
temperature. The sensor was then tested in shock tube combustion measurements of
temperature and CO concentration time-histories to validate the sensor performance.
In many practical combustion systems, fuels are injected as liquid spray that quickly
evaporates at elevated temperatures. The interference caused by droplet scattering makes
the direct absorption measurements inaccurate. A tunable diode laser (TDL) sensor with a
detection bandwidth of 40 kHz was developed for measuring time-varying gas
temperature of CO2 during the evaporation of shock-heated hydrocarbon fuel aerosols.
Wavelength-modulation spectroscopy with 1f-normalized second-harmonic detection
(WMS-2f/1f) was used to probe R(28) and P(70) transitions in the v1+v3 combination
band of CO2 near 2.7 m. Application of this sensor for accurate temperature
measurement of evaporating n-dodecane aerosols was performed in an aerosol shock tube.
These recently developed mid-IR laser diagnostics were then applied in studying the
thermal decomposition of oxygenates by measuring species concentration time-histories
behind reflected shock waves. In the study of methanol pyrolysis, experimental
conditions covered temperatures of 1266 to 1707 K, pressures of 1.1 to 2.5 atm, and
initial fuel concentrations of 1% and 0.2% with argon as the bath gas. Pathway and
sensitivity analyses for methanol decomposition were performed, leading to rate constant
recommendations with improved model performance. In the study of methyl formate
pyrolysis, the reaction rate constants of the unimolecular elimination reaction (MF →
CH3OH + CO) were measured using a shock tube/laser diagnostic method over the range
of temperature 1261-1524 K, and pressure 0.3-5.2 atm. Methanol is the major
intermediate during MF pyrolysis, so incorporation of the modified rate constants in the
methanol sub-mechanism leads to improved predictions of the full methanol time-
histories at all temperatures. The kinetic implications of some aspects of the CO time-
histories and suggestions for further improving the predictive capabilities of these
mechanisms are discussed.
Finally, the thermal decomposition of three ethyl esters, ethyl formate (C3H6O2),
ethyl acetate (C4H8O2) and ethyl propanoate (C5H10O2), was studied behind reflected
shock waves using laser absorption of H2O, CO2 and CO. Experimental conditions
covered temperatures of 1301-1636 K, pressures of 1.48-1.72 atm, and reactant
vii
concentrations of 2000 ppm in argon. Recently developed mid-IR laser diagnostics for
H2O (2.5 m), CO2 (4.2 m) and CO (4.6 m) provide orders-of-magnitude greater
detectivity compared to previous near-IR absorption sensors. The experimental results
have highlighted the significant differences among these three ethyl esters: negligible
CO2 production during ethyl formate pyrolysis, very slow CO formation rate during ethyl
acetate pyrolysis, and nearly equal formation rate of all three species during ethyl
propanoate pyrolysis. Detailed kinetic modeling was performed to understand how the
difference in the alkyl length affects the fuel destruction pathways. Rate of production
and sensitivity analyses using the current kinetic models were also performed to interpret
the results. The experiments provide the first laser-based time-history measurements of
CO, CO2 and H2O during the pyrolysis of these potential bio-diesel surrogate fuels in a
shock tube.

viii

ix
Acknowledgements
Looking back at my PhD years at Stanford, there are many people I would like to
thank that have trusted me, helped me, and encouraged me. I owe many thanks to my
advisor Prof. Ronald Hanson for his guidance and support in this work. I enjoyed each
time meeting with him, presenting my research, discussing the results, and solving the
problems. What I learned from him and the world-class research will be remarkably
beneficial for my future career. I would also like to thank my reading committee,
Professor Tom Bowman and Dr. Dave Davidson, for suggestions regarding the content of
this thesis.
It is so fortunate for me to work with many outstanding people in the Hanson Group.
I am especially grateful to Dr. David Davidson for the contributions he has made to this
research and the arrangement of the experimental facilities making the lab a comfortable
place to work in. I am also grateful to Dr. Jay Jeffries for the technical contributions he
has made to this work. I would like to thank Professors Jennifer Wilcox and Reginald
Mitchell for participating in my oral exam committee.
I feel incredibly fortunate to have been surrounded by so many talented and friendly
people in my research group and at Stanford. I enjoyed the ski experience with labmates
to Lake Tahoe. Many thanks to alumni from the lab, Zekai Hong, Aamir Farooq, Xing
Chao and Jason Porter, for helping me start research when I initially joined the lab. I
would also like to thank my fellow students who made my life in lab more meaningful,
joyful, and certainly unforgettable: Brian Lam, Kai Sun, Ritobrata Sur, Mitchell Spearrin,
Shengkai Wang, Sijie Li, Yangye Zhu and coworkers. I am thankful to Haocheng
(Aerospace), Chunjing (Applied Physics), Yuan (Civil), Runzhi (Materials) and Kejie
(Physics), for their friendship and making my PhD life full of joys.

x
Most of all, I would like to thank my wife and family for their endless love and
support. Thank you to my mom, dad, mother-in-law and father-in-law for their never-
ending encouragement that helped me to reach for my dreams. I could not have
completed this work without my wonderful wife Erica, whom I met during this work and
whom I have created the small family. Our first son, Steven, was born in Stanford
Hospital and brought so much joy to our lives.
xi
Table of Contents
Abstract ........................................................................................................................v
Acknowledgements .......................................................................................................... ix
Table of Contents ............................................................................................................. xi
List of Tables ....................................................................................................................xv
List of Figures................................................................................................................ xvii
Chapter 1. Introduction ..................................................................................................1
1.1 Motivation and Background.....................................................................................1
1.2 Overview of Dissertation .........................................................................................4
Chapter 2. Mid-IR Laser Absorption Detection of Carbon Monoxide ......................7
2.1 Introduction ..............................................................................................................7
2.2 Fundamental Spectroscopy ......................................................................................8
2.3 Line Selection...........................................................................................................9
2.4 Spectroscopic Measurement and Verification .......................................................12
2.5 Sensor Validation in Shock Tube Experiments .....................................................18
2.5.1 Scanned-Wavelength CO Sensor Using a Single QC Laser ........................18
2.5.2 Fixed-Wavelength CO Sensor Using Two QC Lasers.................................21
2.6 Temperature and CO Concentration Measurements in Combustion Gases ...........23
Chapter 3. Two-Line Thermometry for Multiphase Combustion Flows .................27
3.1 Introduction ............................................................................................................27
3.2 Wavelength Modulation Spectroscopy Fundamentals...........................................28
3.3 Sensor Design.........................................................................................................32
3.3.1 Line Selection...............................................................................................32
3.3.2 Measurement Uncertainties..........................................................................32

xii
3.4 Temperature Measurement in CO2/Ar Gas ............................................................34
3.4.1 Experimental Setup ......................................................................................34
3.4.2 Experimental Results ...................................................................................35
3.4.3 Comparison of CO and CO2 Thermometry..................................................37
3.5 Sensor Validation in a Aerosol Flow Cell..............................................................38
3.6 Temperature Measurement in Shock-Heated Aerosol ...........................................41
Chapter 4. Thermal Decomposition of Methanol and Methyl Formate ...................45
4.1 Introduction ............................................................................................................45
4.2 Experimental ..........................................................................................................46
4.2.1 QC Laser Absorption of CO at 4.56 m ......................................................46
4.2.2 CO2 Laser Absorption of Methanol and Methyl Formate............................47
4.3 High-Temperature Methanol Pyrolysis ..................................................................47
4.4 High-Temperature Methyl Formate Pyrolysis .......................................................57
Chapter 5. Thermal Decomposition of C3-C5 Ethyl Esters.......................................67
5.1 Introduction ............................................................................................................67
5.2 Experimental ..........................................................................................................69
5.2.1 Shock Tube and Laser Diagnostics ..............................................................69
5.2.2 Experimental Results ...................................................................................70
5.3 Kinetic Modeling ...................................................................................................71
5.4 Discussion ..............................................................................................................74
5.4.1 Ethyl Formate Pyrolysis ...............................................................................74
5.4.2 Ethyl Acetate Pyrolysis ................................................................................79
5.4.3 Ethyl Propanoate Pyrolysis ..........................................................................84
Chapter 6. Summary and Future Directions...............................................................93
6.1 Summary of Results ...............................................................................................93
6.1.1 Mid-IR CO Sensor near 4.7 m...................................................................93
6.1.2 Two-Line Thermometry for Multiphase Flows ...........................................94
6.1.3 Methanol and Methyl Formate Decomposition Study .................................94
6.1.4 Ethyl Ester Decomposition Study ................................................................96
6.2 Recommendations for Future Work.......................................................................96
xiii
6.2.1 Shock Tube Measurements of Reaction Rate Constants ..............................96
6.2.2 Multi-Species Measurements in Large Oxygenates and Blends..................97
6.2.3 Kinetics of Oxygenated Fuel Thrust ............................................................99
Appendix A: Ethylene and Methanol Diagnostics using CO2 Gas Laser .................101
A.1 Ethylene Diagnostic at 10.532 m ......................................................................101
A.1.1 Experimental .............................................................................................101
A.1.2 High-Temperature Ethylene Absorption Cross-Section ...........................102
A.2 Methanol Diagnostic at 9.676 m.......................................................................105
A.2.1 Methanol Absorption Cross-Section .........................................................105
A.2.2 Two-Line Differential Absorption Measurement .....................................107
Reference ....................................................................................................................109

xiv
xv
List of Tables
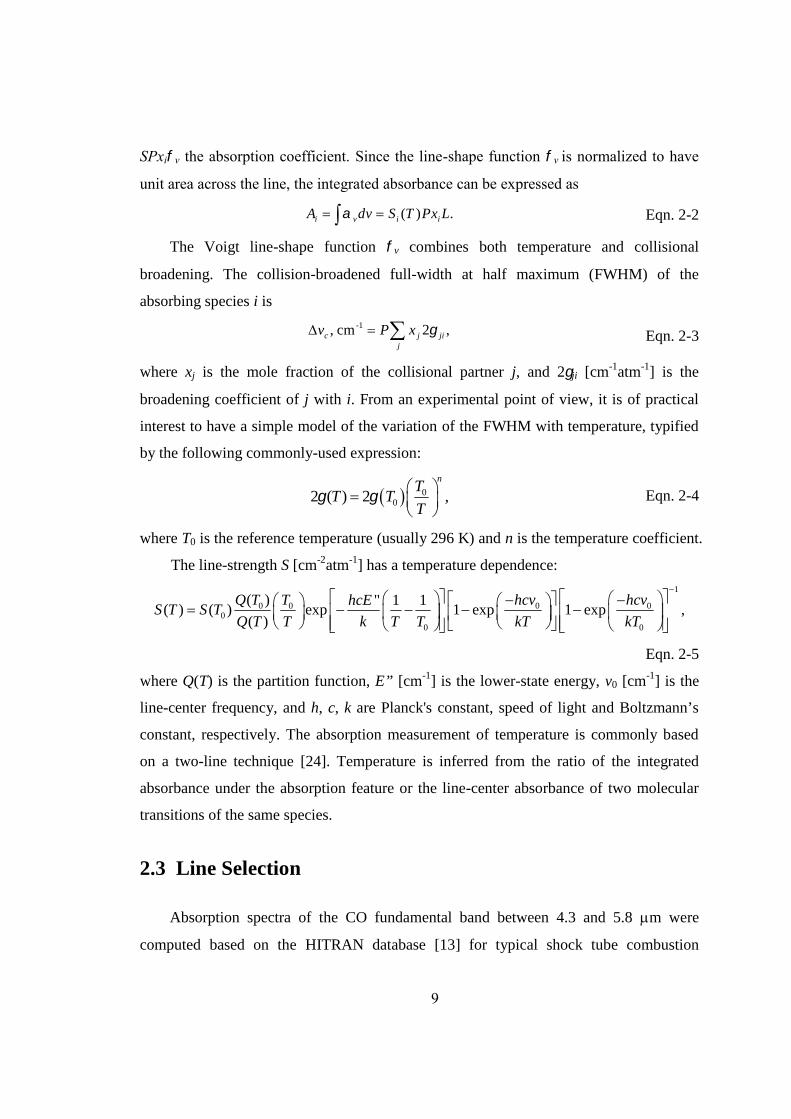
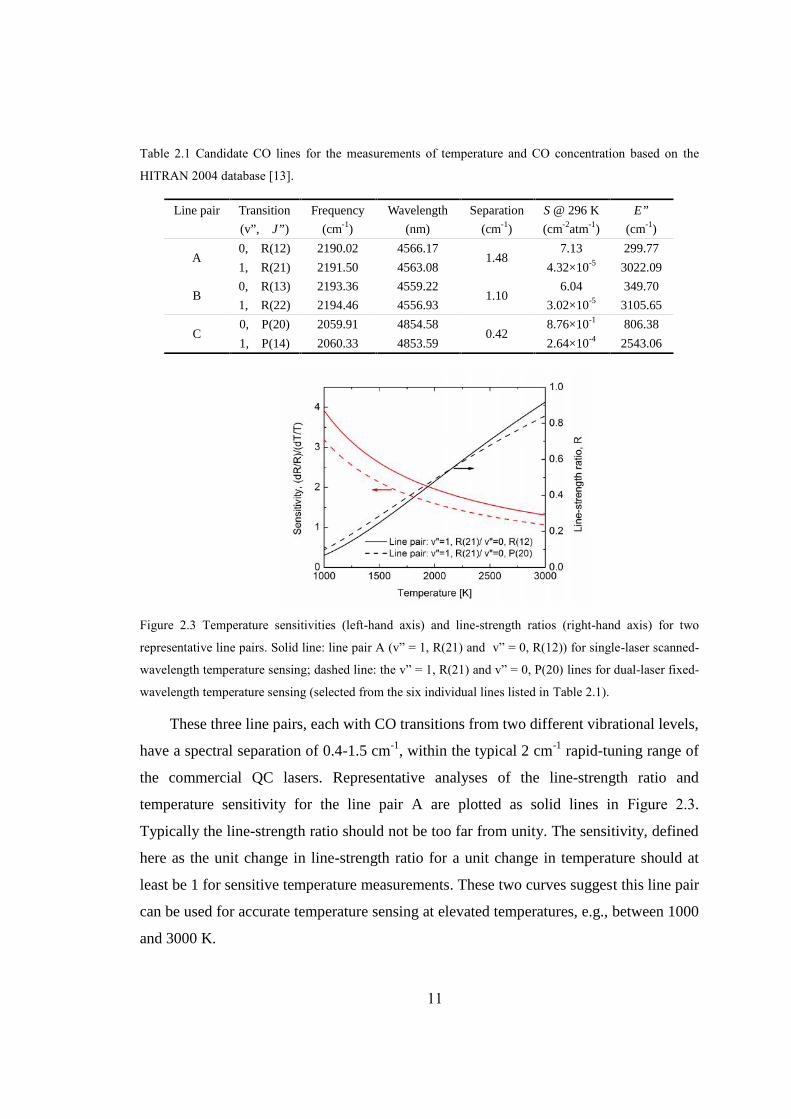
Table 2.1 Candidate CO lines for the measurements of temperature and CO concentration
based on the HITRAN 2004 database [13]. ......................................................11
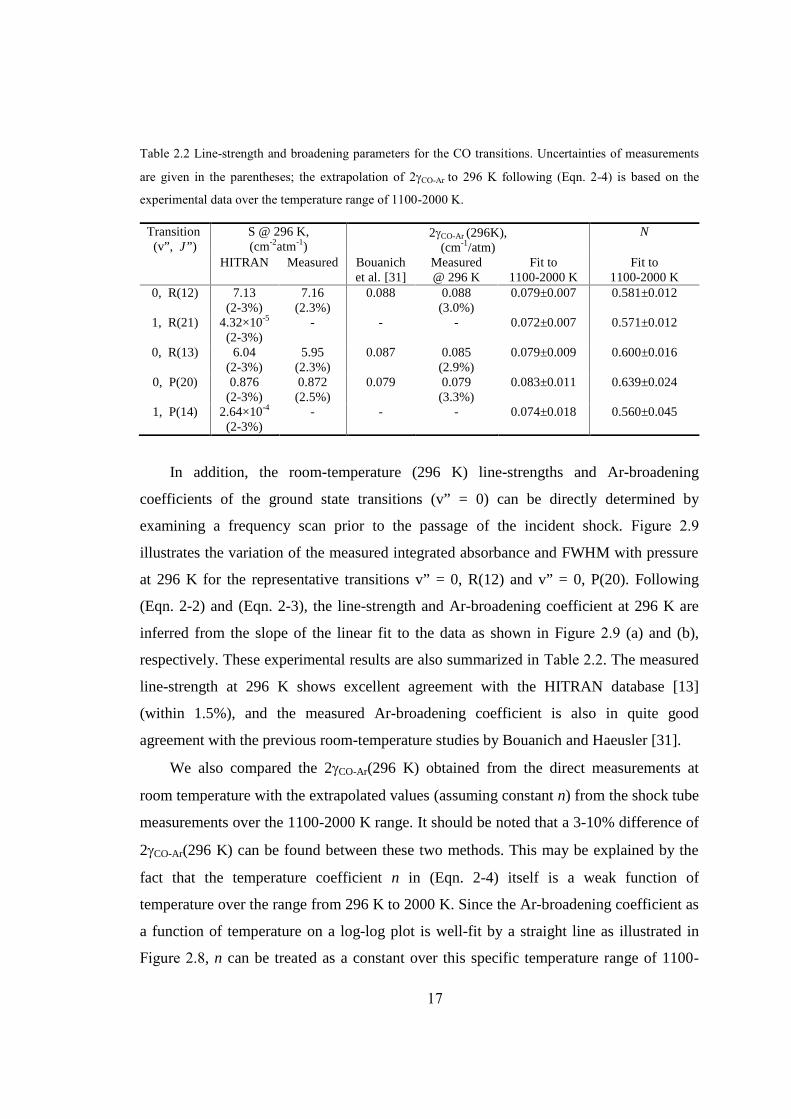
Table 2.2 Line-strength and broadening parameters for the CO transitions. Uncertainties
of measurements are given in the parentheses; the extrapolation of 2CO-Ar to
296 K following (Eqn. 2-4) is based on the experimental data over the
temperature range of 1100-2000 K. ..................................................................17
Table 3.1 Measured spectroscopic data for the selected CO2 line pair (from [40])...........31
Table 4.1 Summary of current methanol and methyl formate pyrolysis experiments. ......48
Table 4.2 Reaction rate constants (near 1 atma) used in the current study: k = ATnexp(-
Ea/RT) ................................................................................................................53
Table 4.3 Test conditions and rate constant data for reaction: CH3OCHO → CH3OH +
CO. ....................................................................................................................62
Table 5.1 Summary of reflected shock conditions for ethyl ester pyrolysis......................71
Table 5.2 EF pyrolysis submechanism; cm3/mol/sec/cal units. .........................................75
Table 5.3 EA pyrolysis submechanism; cm3/mol/sec/cal units. ........................................80
Table 5.4 Reaction rate constants modified in the Metcalfe et al. [83] mechanism;
cm3/mol/sec/cal units.........................................................................................87
Table 6.1 Stanford IR laser diagnostics for combustion gases ..........................................98
Table 6.2 New species and potential diagnostics in future ................................................98
Table A.1 Methanol absorption cross-section (m2/mol) at 1 atm and 297 K. .................106

xvi
xvii
List of Figures
Figure 1.1 World petroleum and other liquid fuel supply in three cases, 1990-2040
(million barrels per day); source: Annual Energy Outlook in 2013 [1].............2
Figure 1.2 Absorption line strengths of CO, H2O and CO2 at 1500 K (from HITRAN
database [13]).....................................................................................................3
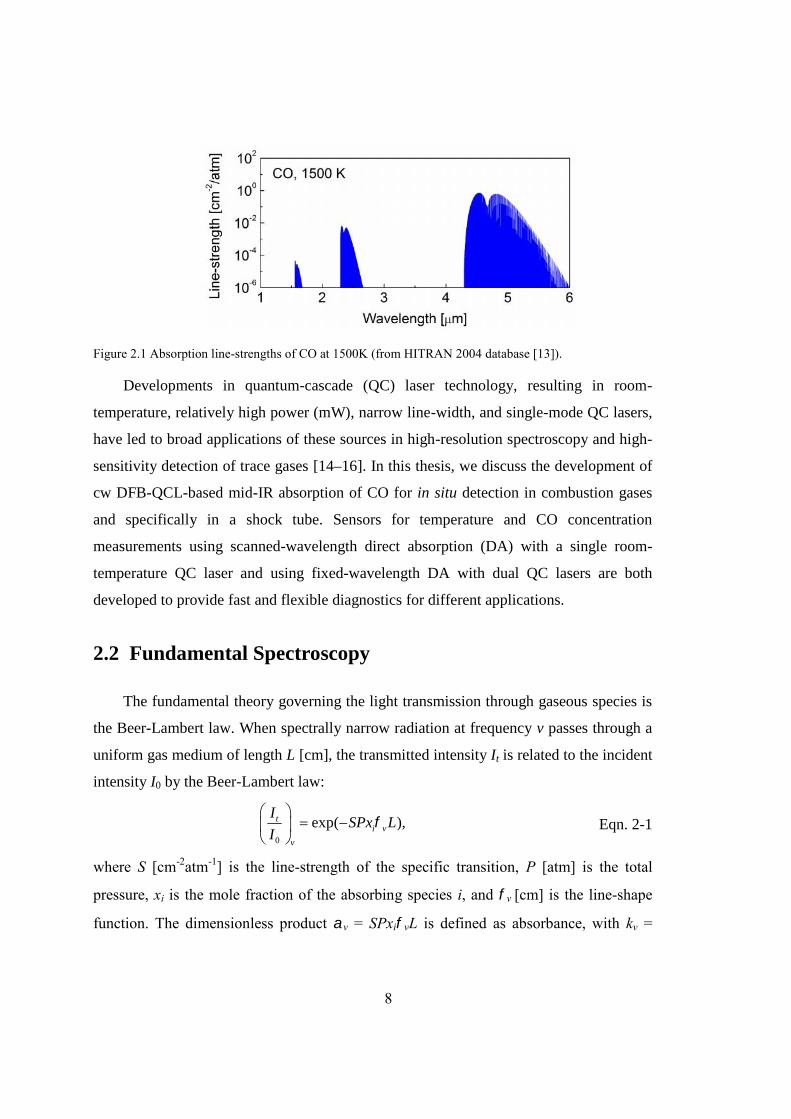
Figure 2.1 Absorption line-strengths of CO at 1500K (from HITRAN 2004 database [13]).
............................................................................................................................8
Figure 2.2 Calculated spectra of 0.1% CO, 1% H2O and 1% CO2 in air under shock tube
combustion conditions: T = 1500 K, P = 1 atm, L = 10 cm.............................10
Figure 2.3 Temperature sensitivities (left-hand axis) and line-strength ratios (right-hand
axis) for two representative line pairs. Solid line: line pair A (v” = 1, R(21)
and v” = 0, R(12)) for single-laser scanned-wavelength temperature sensing;
dashed line: the v” = 1, R(21) and v” = 0, P(20) lines for dual-laser fixed-
wavelength temperature sensing (selected from the six individual lines listed
in Table 2.1). ....................................................................................................11
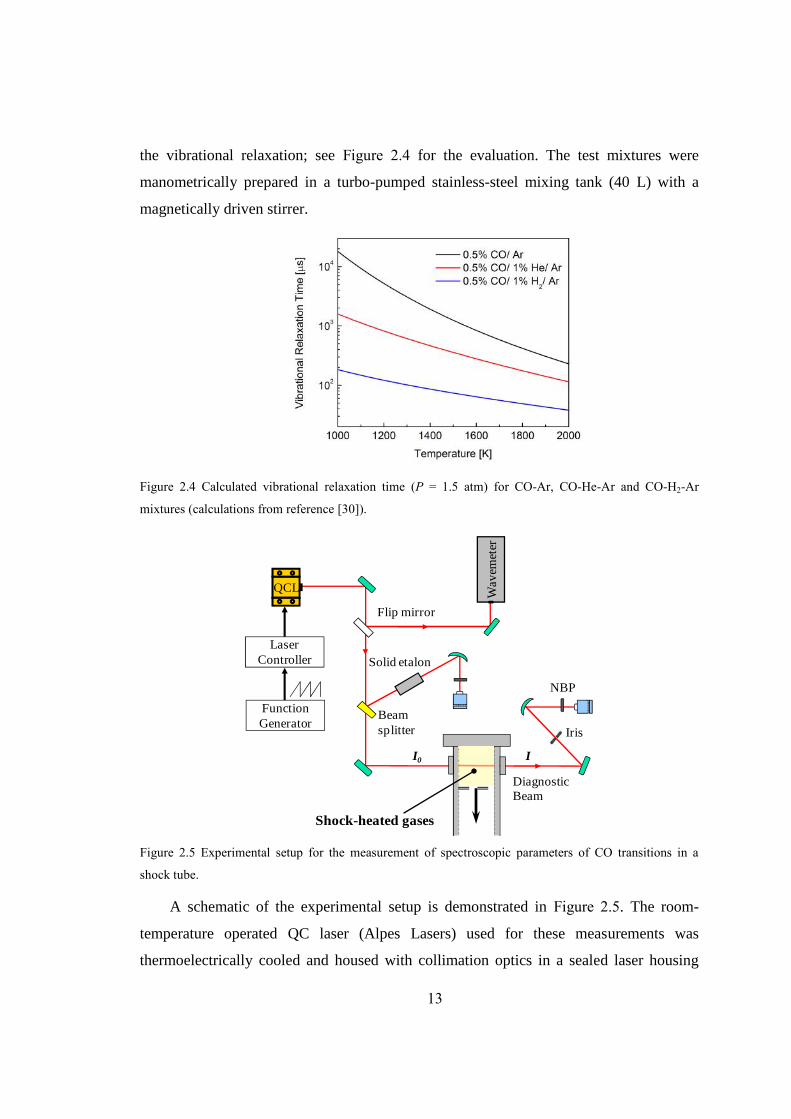
Figure 2.4 Calculated vibrational relaxation time (P = 1.5 atm) for CO-Ar, CO-He-Ar and
CO-H2-Ar mixtures (calculations from reference [30])...................................13
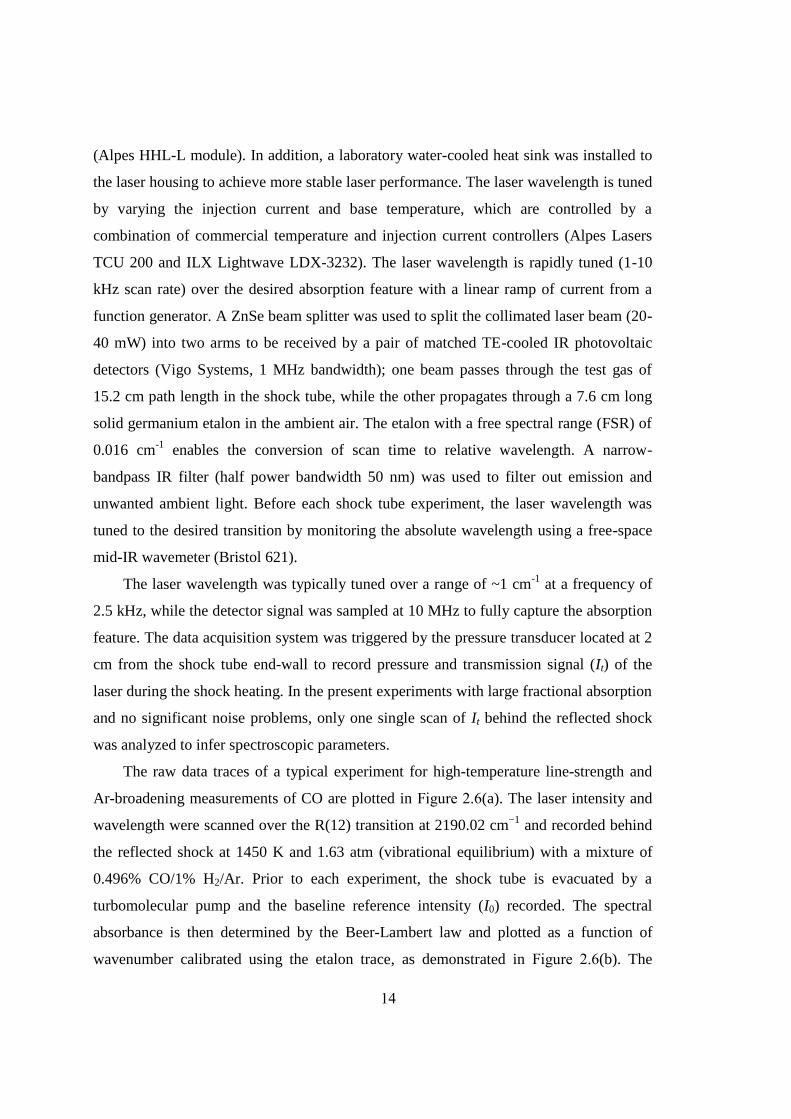
Figure 2.5 Experimental setup for the measurement of spectroscopic parameters of CO
transitions in a shock tube................................................................................13
Figure 2.6 Illustration of (a) the measured raw-data traces (pressure, transmission through
the shock tube and the etalon) of the R(12) transition at 2190.02 cm−1, taken at
2.5 kHz with 0.496% CO/1% H2/Ar mixtures behind the reflected shock
(vibrationally equilibrated reflected shock conditions: 1450 K, 1.63 atm); (b)
the reduced line-shape of the R(12) transition (solid line, top panel), its best-
fit Voigt profile (dashed line, top panel), and the residual (bottom panel). ....15

xviii
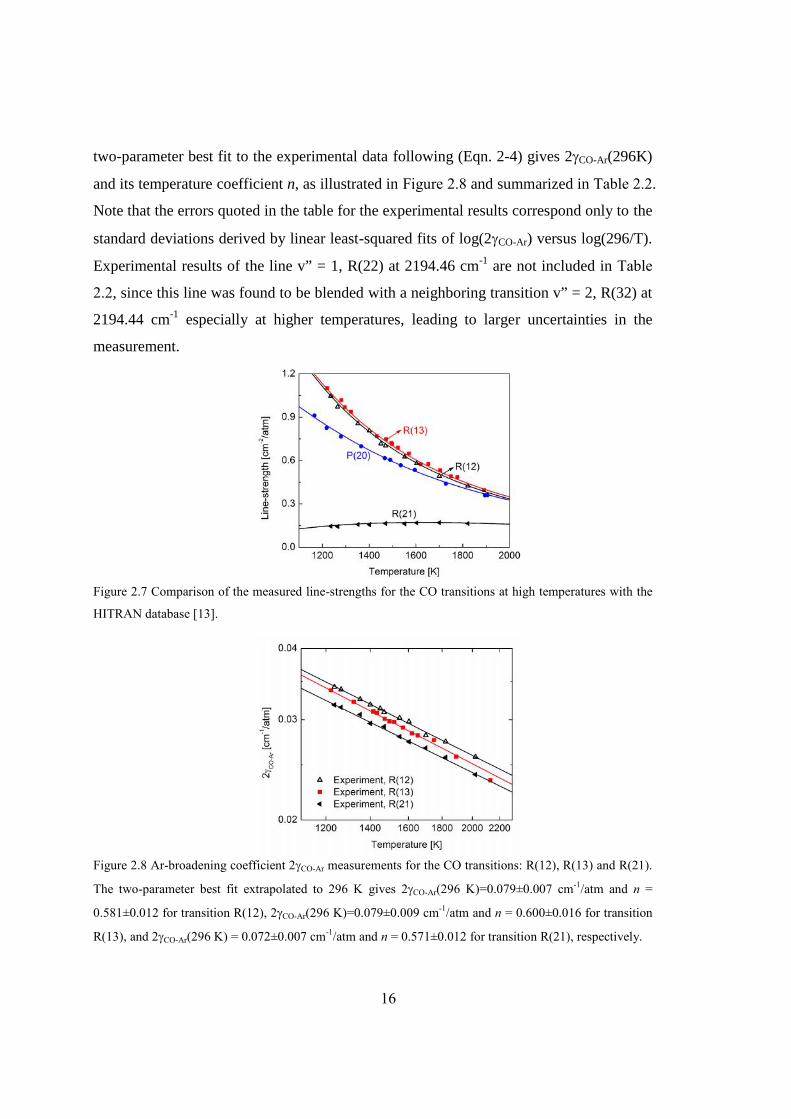
Figure 2.7 Comparison of the measured line-strengths for the CO transitions at high
temperatures with the HITRAN database [13]. ...............................................16
Figure 2.8 Ar-broadening coefficient 2CO-Ar measurements for the CO transitions: R(12),
R(13) and R(21). The two-parameter best fit extrapolated to 296 K gives 2CO-
Ar(296 K)=0.079±0.007 cm-1/atm and n = 0.581±0.012 for transition R(12),
2CO-Ar(296 K)=0.079±0.009 cm-1/atm and n = 0.600±0.016 for transition
R(13), and 2CO-Ar(296 K) = 0.072±0.007 cm-1/atm and n = 0.571±0.012 for
transition R(21), respectively...........................................................................16
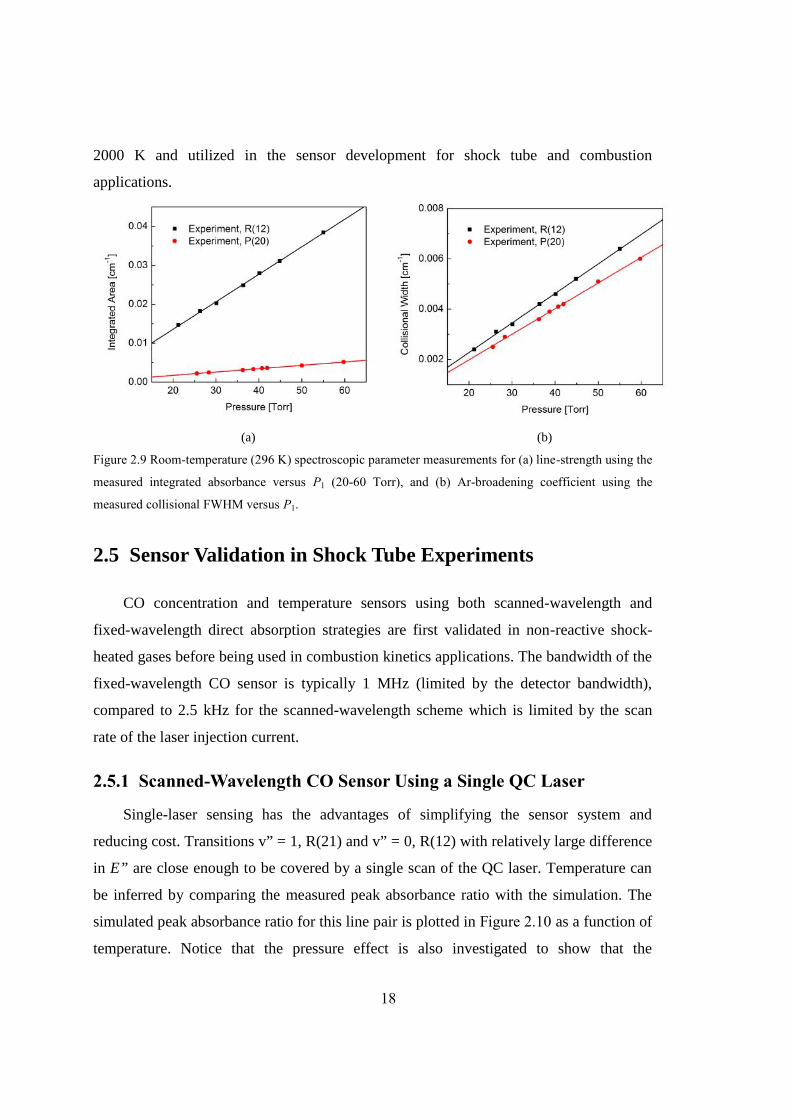
Figure 2.9 Room-temperature (296 K) spectroscopic parameter measurements for (a)
line-strength using the measured integrated absorbance versus P1 (20-60 Torr),
and (b) Ar-broadening coefficient using the measured collisional FWHM
versus P1...........................................................................................................18
Figure 2.10 Simulated peak absorbance ratio for the line pair R(21)/R(12) and R(21)/P(20)
using the spectroscopic parameters listed in Table 2.2....................................19
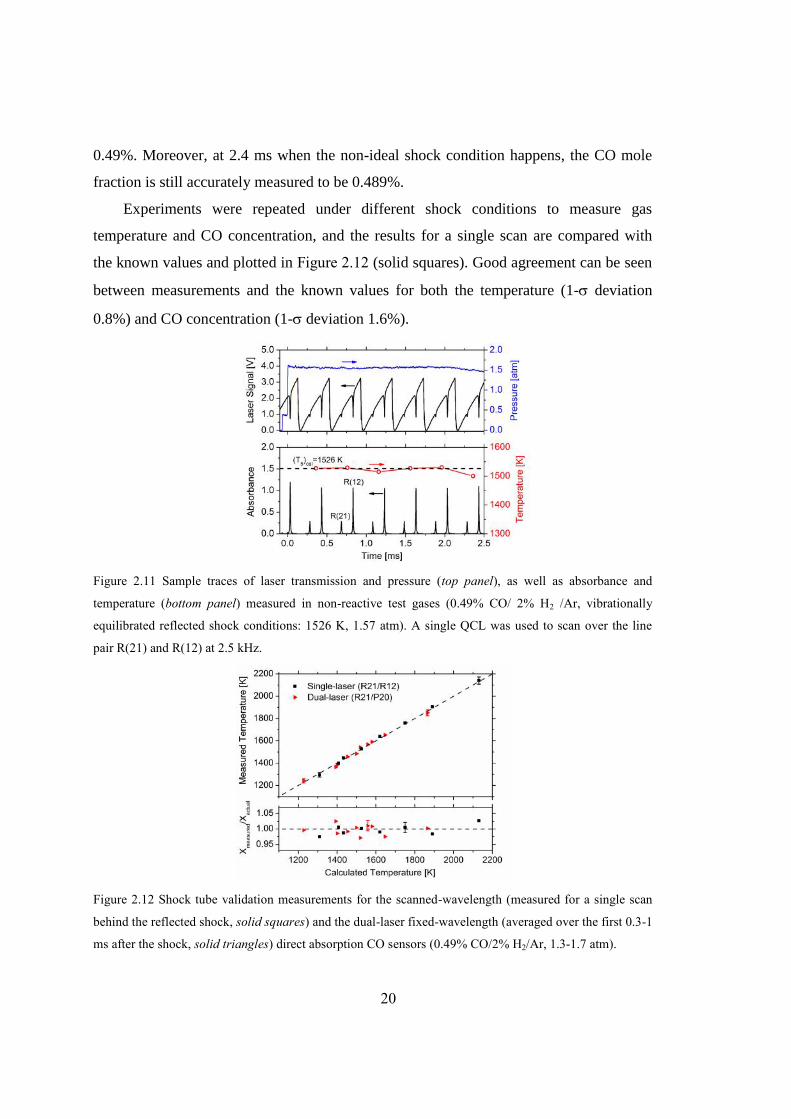
Figure 2.11 Sample traces of laser transmission and pressure (top panel), as well as
absorbance and temperature (bottom panel) measured in non-reactive test
gases (0.49% CO/ 2% H2 /Ar, vibrationally equilibrated reflected shock
conditions: 1526 K, 1.57 atm). A single QCL was used to scan over the line
pair R(21) and R(12) at 2.5 kHz. .....................................................................20
Figure 2.12 Shock tube validation measurements for the scanned-wavelength (measured
for a single scan behind the reflected shock, solid squares) and the dual-laser
fixed-wavelength (averaged over the first 0.3-1 ms after the shock, solid
triangles) direct absorption CO sensors (0.49% CO/2% H2/Ar, 1.3-1.7 atm).20
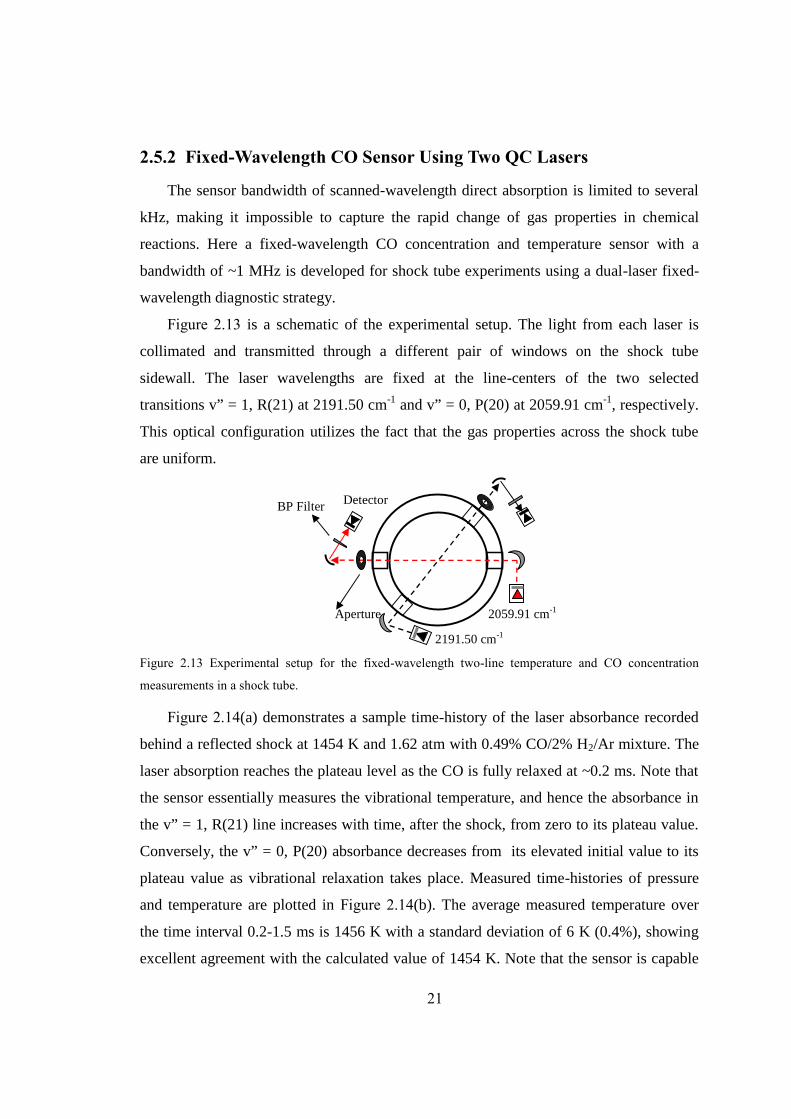
Figure 2.13 Experimental setup for the fixed-wavelength two-line temperature and CO
concentration measurements in a shock tube...................................................21
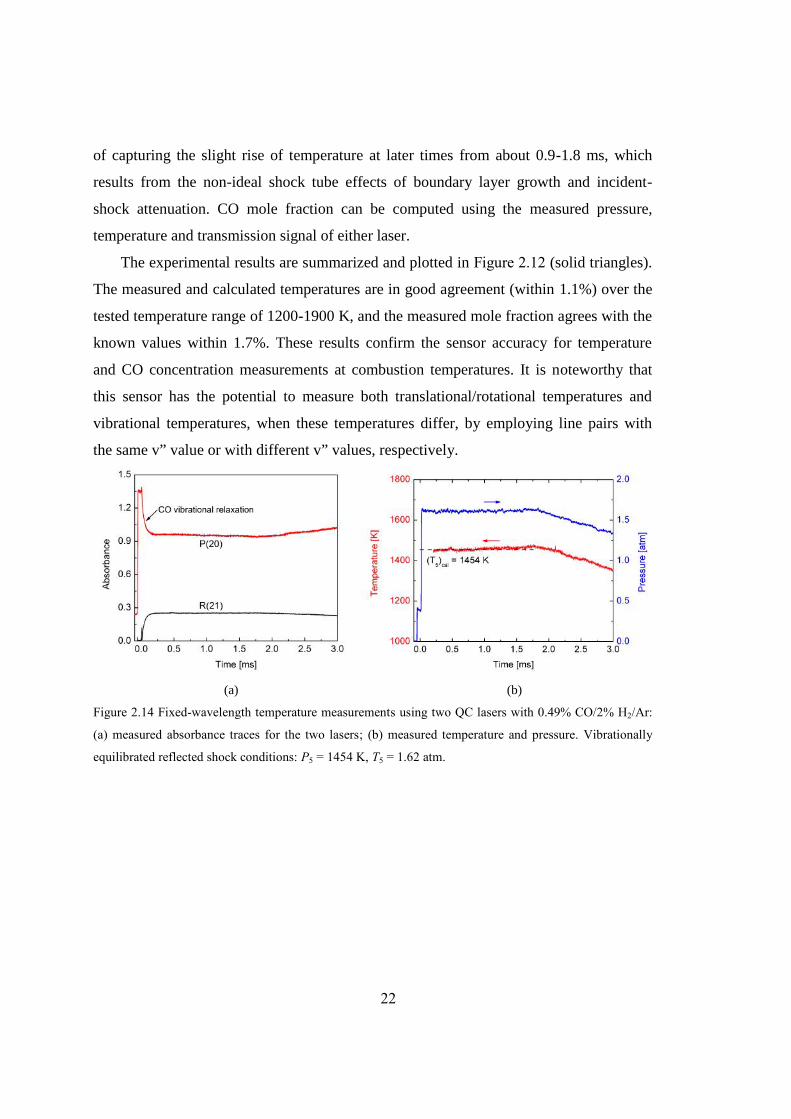
Figure 2.14 Fixed-wavelength temperature measurements using two QC lasers with 0.49%
CO/2% H2/Ar: (a) measured absorbance traces for the two lasers; (b)
measured temperature and pressure. Vibrationally equilibrated reflected shock
conditions: P5 = 1454 K, T5 = 1.62 atm. ..........................................................22

xix
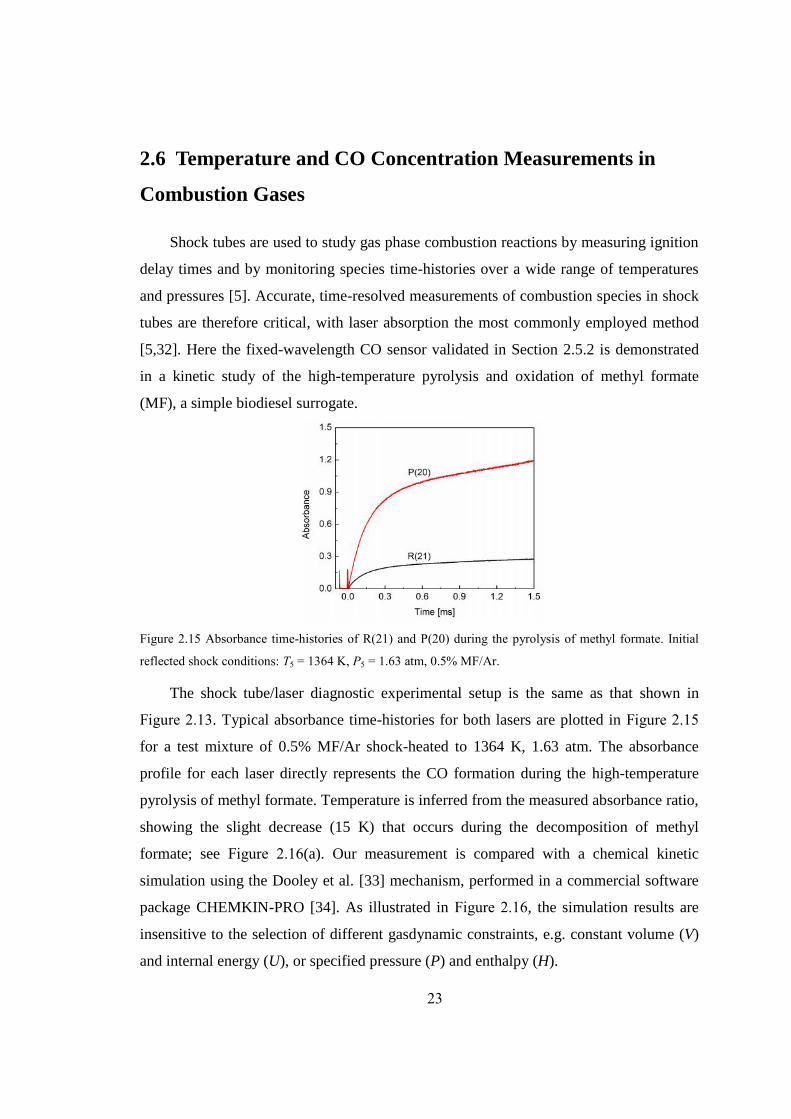
Figure 2.15 Absorbance time-histories of R(21) and P(20) during the pyrolysis of methyl
formate. Initial reflected shock conditions: T5 = 1364 K, P5 = 1.63 atm, 0.5%
MF/Ar. .............................................................................................................23
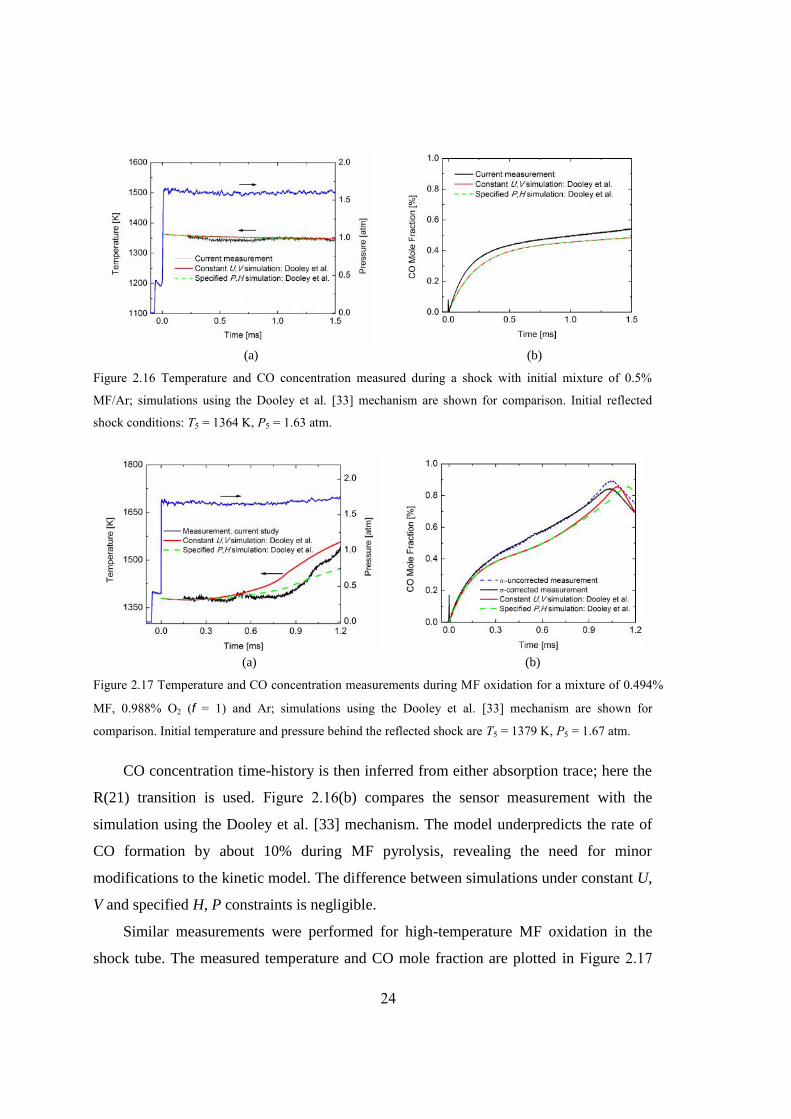
Figure 2.16 Temperature and CO concentration measured during a shock with initial
mixture of 0.5% MF/Ar; simulations using the Dooley et al. [33] mechanism
are shown for comparison. Initial reflected shock conditions: T5 = 1364 K, P5
= 1.63 atm. .......................................................................................................24
Figure 2.17 Temperature and CO concentration measurements during MF oxidation for a
mixture of 0.494% MF, 0.988% O2 (= 1) and Ar; simulations using the
Dooley et al. [33] mechanism are shown for comparison. Initial temperature
and pressure behind the reflected shock are T5 = 1379 K, P5 = 1.67 atm........24
Figure 3.1 Calculated CO2 (1%) absorption spectra for R(28) transition at 3633.08 cm-1
(2752.48 nm) and P(70) transition at 3645.56 cm-1 (2743.06 nm) under typical
shock tube conditions: T2 = 650 K, P2 = 0.5 atm; T5 = 1200 K, P5 = 1.0 atm; L
= 10 cm. ...........................................................................................................31
Figure 3.2 Calculated extinction cross section (Mie scattering code [47]) for liquid n-
dodecane droplets; Dm is the median diameter of aerosol droplet size. ...........31
Figure 3.3 WMS simulation for (a) 2f/1f magnitude of 2752nm line and (b) 2f/1f ratio of
2752nm/2743nm line pair, as a function of temperature for specified pressures
at optimized modulation depths; 2% CO2 in Ar, T = 900-1600 K, L = 10 cm.
..........................................................................................................................33
Figure 3.4 WMS simulation for (a) 2f/1f magnitude of 2752nm line and (b) 2f/1f ratio of
2752/2743 line pair, as a function of temperature for specified CO2
concentrations; P = 0.5 atm, T = 400-900 K, L = 10 cm. ................................33
Figure 3.5 Shock tube experimental setup. ........................................................................34
Figure 3.6 Measured temperature and pressure trace during a shock with CO2/Ar mixture
without aerosol. Initial conditions: P1 = 55.0 Torr, T1 = 298 K; incident shock
(calculated): P2 = 0.43 atm, T2 = 697 K; reflected shock (calculated): P5 =
1.48 atm, T5 = 1199 K......................................................................................36
xx
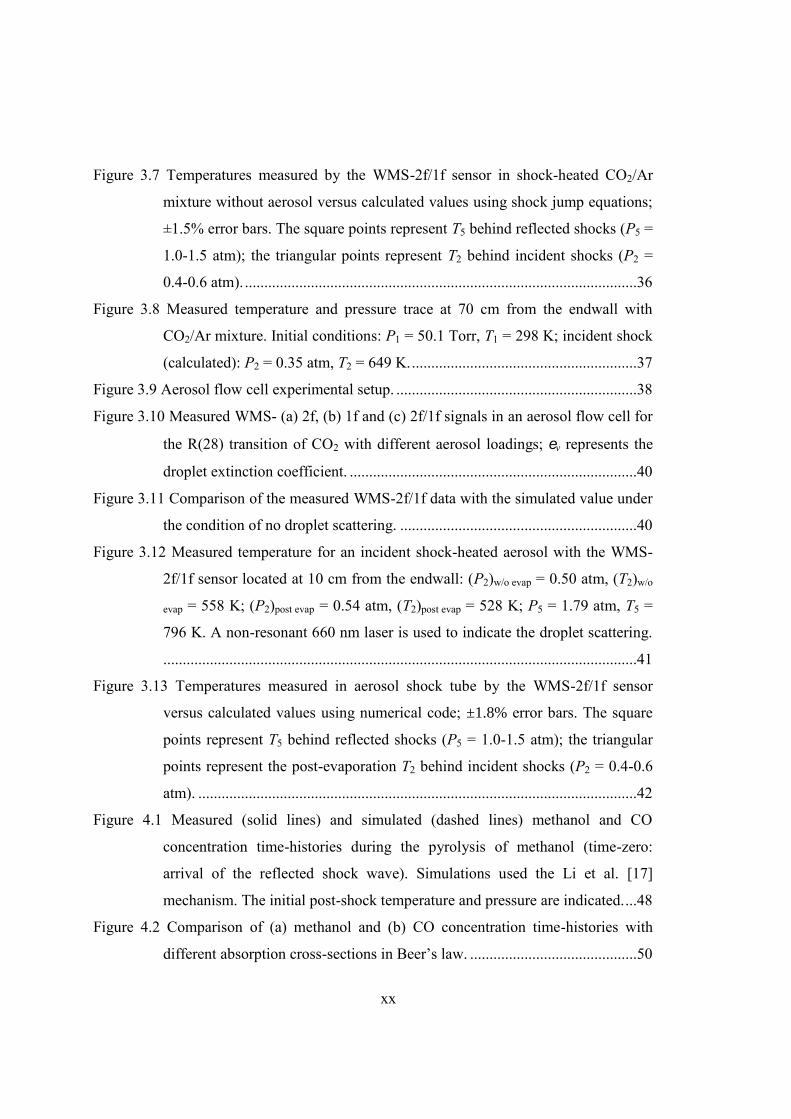
Figure 3.7 Temperatures measured by the WMS-2f/1f sensor in shock-heated CO2/Ar
mixture without aerosol versus calculated values using shock jump equations;
±1.5% error bars. The square points represent T5 behind reflected shocks (P5 =
1.0-1.5 atm); the triangular points represent T2 behind incident shocks (P2 =
0.4-0.6 atm). .....................................................................................................36
Figure 3.8 Measured temperature and pressure trace at 70 cm from the endwall with
CO2/Ar mixture. Initial conditions: P1 = 50.1 Torr, T1 = 298 K; incident shock
(calculated): P2 = 0.35 atm, T2 = 649 K...........................................................37
Figure 3.9 Aerosol flow cell experimental setup. ..............................................................38
Figure 3.10 Measured WMS- (a) 2f, (b) 1f and (c) 2f/1f signals in an aerosol flow cell for
the R(28) transition of CO2 with different aerosol loadings; v represents the
droplet extinction coefficient. ..........................................................................40
Figure 3.11 Comparison of the measured WMS-2f/1f data with the simulated value under
the condition of no droplet scattering. .............................................................40
Figure 3.12 Measured temperature for an incident shock-heated aerosol with the WMS-
2f/1f sensor located at 10 cm from the endwall: (P2)w/o evap = 0.50 atm, (T2)w/o
evap = 558 K; (P2)post evap = 0.54 atm, (T2)post evap = 528 K; P5 = 1.79 atm, T5 =
796 K. A non-resonant 660 nm laser is used to indicate the droplet scattering.
..........................................................................................................................41
Figure 3.13 Temperatures measured in aerosol shock tube by the WMS-2f/1f sensor
versus calculated values using numerical code; ±1.8% error bars. The square
points represent T5 behind reflected shocks (P5 = 1.0-1.5 atm); the triangular
points represent the post-evaporation T2 behind incident shocks (P2 = 0.4-0.6
atm). .................................................................................................................42
Figure 4.1 Measured (solid lines) and simulated (dashed lines) methanol and CO
concentration time-histories during the pyrolysis of methanol (time-zero:
arrival of the reflected shock wave). Simulations used the Li et al. [17]
mechanism. The initial post-shock temperature and pressure are indicated....48
Figure 4.2 Comparison of (a) methanol and (b) CO concentration time-histories with
different absorption cross-sections in Beer’s law. ...........................................50

xxi
Figure 4.3 Comparison of the measured (a) methanol and (b) CO time-histories with a
detailed chemical kinetic model. Long-dashed lines: predictions of the Li et al.
[17] model at the nominal temperature shown; short-dashed lines: computed
uncertainty bounds due to ±15 K uncertainty in the T5 value..........................50
Figure 4.4 Sensitivity analysis (unmodified Li et al. [17] mechanism) of CH3OH at 100
s for 1% methanol in argon at 1458 and 1567 K, respectively......................51
Figure 4.5 Influence of modified k1 (branching ratio from Jasper et al. [53]) on the (a)
CH3OH and (b) CO predictions by the Li et al. [17] mechanism. The spike at t
= 0 is a result of beam steering from the detector during the passage of the
reflected shock and is not kinetic in nature......................................................52
Figure 4.6 Flux analysis of methanol pyrolysis at 800 s for 0.2% CH3OH/Ar at 1623 K
and 1.1 atm.......................................................................................................54
Figure 4.7 Reaction rate constants of CH3OH+H (k2) and branching ratio. ......................55
Figure 4.8 Effect of modifications to the Li et al. [17] mechanism predictions for (a)
CH3OH and (b) CO concentration time-histories during the pyrolysis of
methanol...........................................................................................................56
Figure 4.9 Sensitivity analysis (Li et al. [17] mechanism with k1 modified) of CO
concentration at 100 s for 0.2% CH3OH/Ar at 1507 K and 1623 K..............57
Figure 4.10 Representative CO concentration time-histories measured during the
decomposition of MF at various temperatures under a fixed initial fuel
concentration (0.1% MF/Ar) compared with the predictions of the Dooley et
al. [33] mechanism and that with k3a-k3c revised from Metcalfe et al. [73]. ....58
Figure 4.11 Local sensitivity analysis for CO concentration using the Dooley et al. [33]
mechanism (0.1% MF/Ar, 1376 K, 1.58 atm). ................................................59
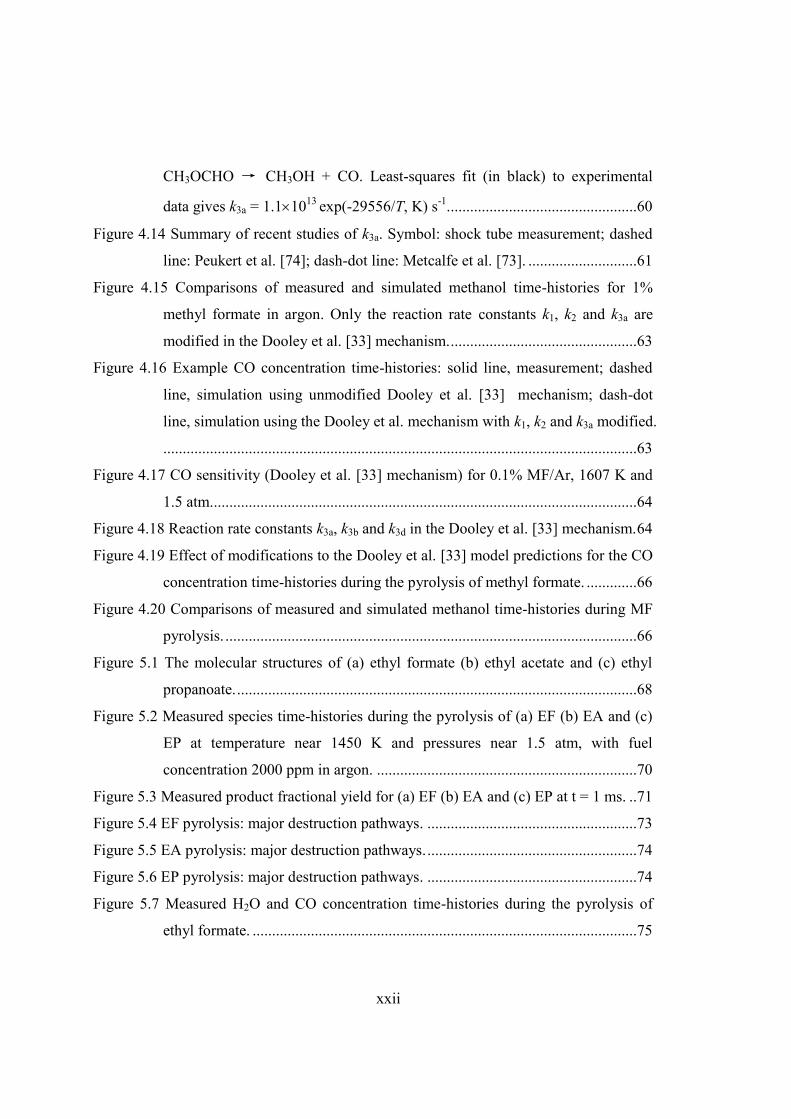
Figure 4.12 Example MF decomposition k3a rate constant determination. Solid black line,
experimental data; solid red line, best fit to the data with the optimal value of
k3a; dashed lines, variation of k3a±50%. ...........................................................60
Figure 4.13 Comparison of measured k3a (1.5-1.7 atm) with previous rate constants
(LLNL [75], Princeton [33], Argonne [74] and NUI [73]) for the reaction
xxii
CH3OCHO → CH3OH + CO. Least-squares fit (in black) to experimental
data gives k3a = 1.11013 exp(-29556/T, K) s-1.................................................60
Figure 4.14 Summary of recent studies of k3a. Symbol: shock tube measurement; dashed
line: Peukert et al. [74]; dash-dot line: Metcalfe et al. [73]. ............................61
Figure 4.15 Comparisons of measured and simulated methanol time-histories for 1%
methyl formate in argon. Only the reaction rate constants k1, k2 and k3a are
modified in the Dooley et al. [33] mechanism.................................................63
Figure 4.16 Example CO concentration time-histories: solid line, measurement; dashed
line, simulation using unmodified Dooley et al. [33] mechanism; dash-dot
line, simulation using the Dooley et al. mechanism with k1, k2 and k3a modified.
..........................................................................................................................63
Figure 4.17 CO sensitivity (Dooley et al. [33] mechanism) for 0.1% MF/Ar, 1607 K and
1.5 atm..............................................................................................................64
Figure 4.18 Reaction rate constants k3a, k3b and k3d in the Dooley et al. [33] mechanism.64
Figure 4.19 Effect of modifications to the Dooley et al. [33] model predictions for the CO
concentration time-histories during the pyrolysis of methyl formate. .............66
Figure 4.20 Comparisons of measured and simulated methanol time-histories during MF
pyrolysis. ..........................................................................................................66
Figure 5.1 The molecular structures of (a) ethyl formate (b) ethyl acetate and (c) ethyl
propanoate........................................................................................................68
Figure 5.2 Measured species time-histories during the pyrolysis of (a) EF (b) EA and (c)
EP at temperature near 1450 K and pressures near 1.5 atm, with fuel
concentration 2000 ppm in argon. ...................................................................70
Figure 5.3 Measured product fractional yield for (a) EF (b) EA and (c) EP at t = 1 ms. ..71
Figure 5.4 EF pyrolysis: major destruction pathways. ......................................................73
Figure 5.5 EA pyrolysis: major destruction pathways.......................................................74
Figure 5.6 EP pyrolysis: major destruction pathways. ......................................................74
Figure 5.7 Measured H2O and CO concentration time-histories during the pyrolysis of
ethyl formate. ...................................................................................................75
xxiii
Figure 5.8 Comparison of the measured (a) CO, (b) H2O and (c) CO2 concentration time-
histories with the model predictions during the pyrolysis of 2000 ppm EF in
argon: solid line, measurement; dashed line, simulation in this study.............77
Figure 5.9 ROP and sensitivity analyses of CO: 2000 ppm EF/Ar, 1500 K and 1.5 atm..77
Figure 5.10 H2O sensitivity: 2000 ppm EF/Ar, 1500 K and 1.5 atm.................................78
Figure 5.11 CO2 sensitivity: 2000 ppm EF/Ar, 1500 K and 1.5 atm.................................78
Figure 5.12 Comparison of the measured CO concentration time-histories during the
pyrolysis of EF, EA and EP; pressure near 1.5 atm, fuel concentration 2000
ppm. .................................................................................................................79
Figure 5.13 Comparison of the measured (a) CO, (b) H2O and (c) CO2 concentration
time-histories with the model predictions for 2000 ppm EA/Ar: solid line,
measurement; dashed line, simulation. ............................................................81
Figure 5.14 (a) ROP and (b) sensitivity analyses (using the current EA mechanism) of CO
during the pyrolysis of 2000 ppm EA/Ar at 1500 K and 1.5 atm. ...................83
Figure 5.15 CO2 sensitivity during the pyrolysis of 2000 ppm EA/Ar at 1500 K and 1.5
atm....................................................................................................................84
Figure 5.16 H2O sensitivity during the pyrolysis of 2000 ppm EA/Ar at 1500 K and 1.5
atm....................................................................................................................84
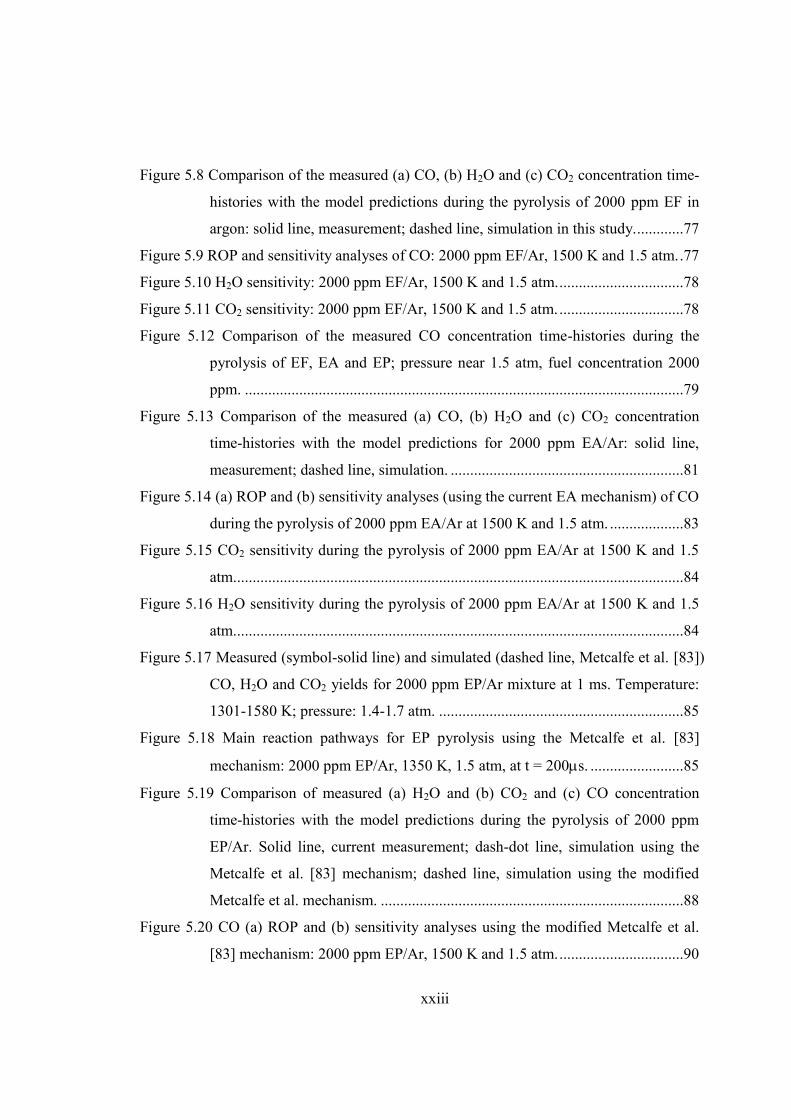
Figure 5.17 Measured (symbol-solid line) and simulated (dashed line, Metcalfe et al. [83])
CO, H2O and CO2 yields for 2000 ppm EP/Ar mixture at 1 ms. Temperature:
1301-1580 K; pressure: 1.4-1.7 atm. ...............................................................85
Figure 5.18 Main reaction pathways for EP pyrolysis using the Metcalfe et al. [83]
mechanism: 2000 ppm EP/Ar, 1350 K, 1.5 atm, at t = 200s. ........................85
Figure 5.19 Comparison of measured (a) H2O and (b) CO2 and (c) CO concentration
time-histories with the model predictions during the pyrolysis of 2000 ppm
EP/Ar. Solid line, current measurement; dash-dot line, simulation using the
Metcalfe et al. [83] mechanism; dashed line, simulation using the modified
Metcalfe et al. mechanism. ..............................................................................88
Figure 5.20 CO (a) ROP and (b) sensitivity analyses using the modified Metcalfe et al.
[83] mechanism: 2000 ppm EP/Ar, 1500 K and 1.5 atm.................................90
xxiv
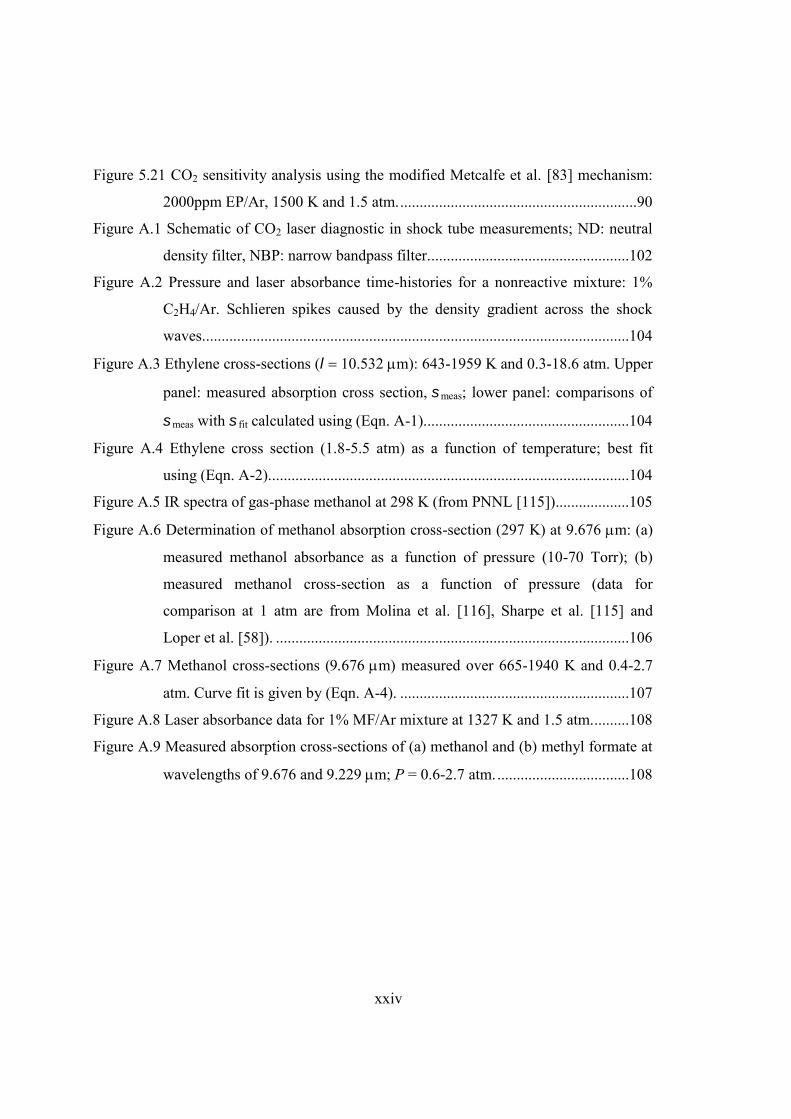
Figure 5.21 CO2 sensitivity analysis using the modified Metcalfe et al. [83] mechanism:
2000ppm EP/Ar, 1500 K and 1.5 atm..............................................................90
Figure A.1 Schematic of CO2 laser diagnostic in shock tube measurements; ND: neutral
density filter, NBP: narrow bandpass filter....................................................102
Figure A.2 Pressure and laser absorbance time-histories for a nonreactive mixture: 1%
C2H4/Ar. Schlieren spikes caused by the density gradient across the shock
waves..............................................................................................................104
Figure A.3 Ethylene cross-sections (10.532m): 643-1959 K and 0.3-18.6 atm. Upper
panel: measured absorption cross section,meas; lower panel: comparisons of
meas with fit calculated using (Eqn. A-1).....................................................104
Figure A.4 Ethylene cross section (1.8-5.5 atm) as a function of temperature; best fit
using (Eqn. A-2).............................................................................................104
Figure A.5 IR spectra of gas-phase methanol at 298 K (from PNNL [115])...................105
Figure A.6 Determination of methanol absorption cross-section (297 K) at 9.676 m: (a)
measured methanol absorbance as a function of pressure (10-70 Torr); (b)
measured methanol cross-section as a function of pressure (data for
comparison at 1 atm are from Molina et al. [116], Sharpe et al. [115] and
Loper et al. [58]). ...........................................................................................106
Figure A.7 Methanol cross-sections (m) measured over 665-1940 K and 0.4-2.7
atm. Curve fit is given by (Eqn. A-4). ...........................................................107
Figure A.8 Laser absorbance data for 1% MF/Ar mixture at 1327 K and 1.5 atm..........108
Figure A.9 Measured absorption cross-sections of (a) methanol and (b) methyl formate at
wavelengths of 9.676 and 9.229 m; P = 0.6-2.7 atm...................................108
1
Chapter 1. Introduction
1.1 Motivation and Background
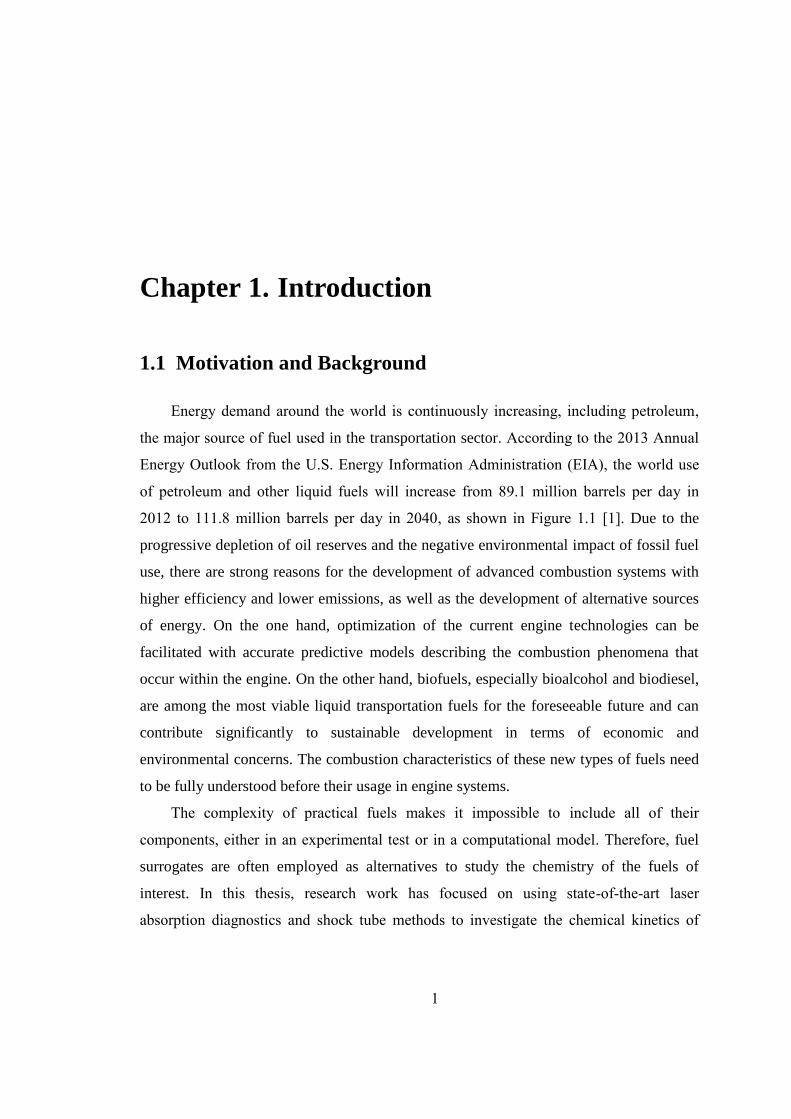
Energy demand around the world is continuously increasing, including petroleum,
the major source of fuel used in the transportation sector. According to the 2013 Annual
Energy Outlook from the U.S. Energy Information Administration (EIA), the world use
of petroleum and other liquid fuels will increase from 89.1 million barrels per day in
2012 to 111.8 million barrels per day in 2040, as shown in Figure 1.1 [1]. Due to the
progressive depletion of oil reserves and the negative environmental impact of fossil fuel
use, there are strong reasons for the development of advanced combustion systems with
higher efficiency and lower emissions, as well as the development of alternative sources
of energy. On the one hand, optimization of the current engine technologies can be
facilitated with accurate predictive models describing the combustion phenomena that
occur within the engine. On the other hand, biofuels, especially bioalcohol and biodiesel,
are among the most viable liquid transportation fuels for the foreseeable future and can
contribute significantly to sustainable development in terms of economic and
environmental concerns. The combustion characteristics of these new types of fuels need
to be fully understood before their usage in engine systems.
The complexity of practical fuels makes it impossible to include all of their
components, either in an experimental test or in a computational model. Therefore, fuel
surrogates are often employed as alternatives to study the chemistry of the fuels of
interest. In this thesis, research work has focused on using state-of-the-art laser
absorption diagnostics and shock tube methods to investigate the chemical kinetics of
2
small oxygenate compounds (methanol, methyl/ethyl ester), which are treated as biofuel
surrogates.
Figure 1.1 World petroleum and other liquid fuel supply in three cases, 1990-2040 (million barrels per day);
source: Annual Energy Outlook in 2013 [1].
Laser absorption spectroscopy techniques play a large and growing role in the
measurement of flow-field parameters such as temperature, gas composition, velocity,
and pressure [2–5]. These sensors are highly attractive for combustion and propulsion
applications due to their non-intrusive, in situ and line-of-sight measurements with fast
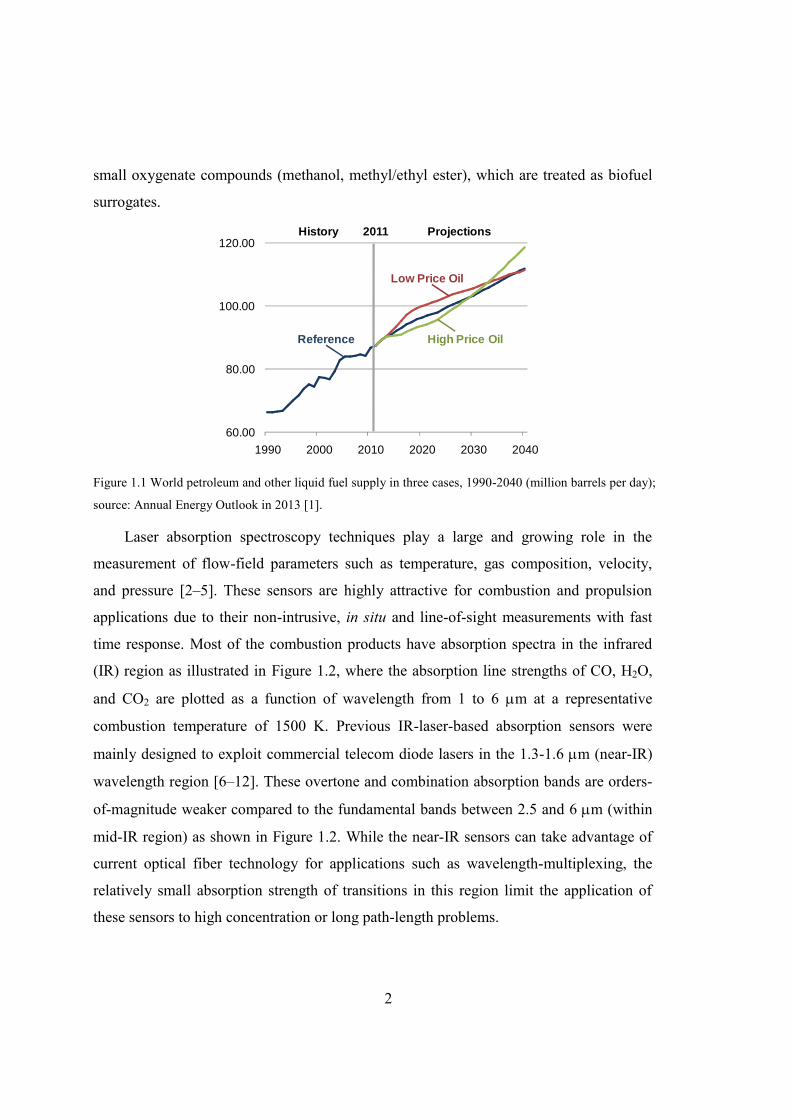
time response. Most of the combustion products have absorption spectra in the infrared
(IR) region as illustrated in Figure 1.2, where the absorption line strengths of CO, H2O,
and CO2 are plotted as a function of wavelength from 1 to 6 m at a representative
combustion temperature of 1500 K. Previous IR-laser-based absorption sensors were
mainly designed to exploit commercial telecom diode lasers in the 1.3-1.6 m (near-IR)
wavelength region [6–12]. These overtone and combination absorption bands are orders-
of-magnitude weaker compared to the fundamental bands between 2.5 and 6 m (within
mid-IR region) as shown in Figure 1.2. While the near-IR sensors can take advantage of
current optical fiber technology for applications such as wavelength-multiplexing, the
relatively small absorption strength of transitions in this region limit the application of
these sensors to high concentration or long path-length problems.
60.00
80.00
100.00
120.00
1990 2000 2010 2020 2030 2040
Low Price Oil
High Price Oil
2011History Projections
Reference
3
Figure 1.2 Absorption line strengths of CO, H2O and CO2 at 1500 K (from HITRAN database [13]).
In recent years, developments in quantum-cascade (QC) laser technology, resulting
in room-temperature, high power (mW) and single-mode laser sources, have enabled
access to these stronger absorption bands of combustion gases in the mid-IR region [14–
16]. Absorption sensors at these longer wavelengths offer greater sensitivity and potential
for more accurate and precise measurements than was possible previously. As part of this
thesis work, we developed the first mid-IR CO and CO2 diagnostics (near 4.6 and 4.3 m)
for high-temperature combustion applications. Combined with a previously developed
H2O sensor (near 2.5 m), these mid-IR laser diagnostics have been applied in studying
shock tube chemical kinetics in this thesis.
High-temperature chemical kinetics experiments, such as measurements of ignition
delay times, rate constants of elementary reactions and species concentration time-
histories, are regularly performed behind reflected shock waves in ultra-clean shock tubes.
Shock tubes are nearly ideal devices for studying chemical kinetics as they provide well-
controlled step changes in temperature and pressure. For moderate or large diameter
tubes, the uniform conditions behind the reflected shock waves are generally not
significantly affected by surface or transport phenomena. The combination of shock-
heating and species-specific laser detection provides a state-of-the-art test platform for
studying chemical kinetics. The experimental results enable one to follow the time
sequence of events occurring in a highly-complex reaction process: from initial fuel

4
breakdown, intermediates/radical build up during and after the induction period, finally to
the formation of the combustion products.
The kinetic target of this thesis is to understand the pyrolysis of oxygenate
compounds, including methanol, methyl formate and C3-C5 ethyl esters (ethyl formate,
ethyl acetate, ethyl propanoate). These oxygenates are either treated as biofuel surrogates
or found to be crucial intermediates during the combustion of other important
hydrocarbon fuels. As discussed before, pyrolysis is the initial step of combustion and
thus the pyrolytic behavior must be well-characterized to accurately describe the
oxidation of a fuel. In this thesis, multi-species concentration time-histories were
measured during the pyrolysis of these oxygenate compounds to provide the rate constant
determination of several important elementary reactions and the validation of the detailed
chemical kinetic mechanisms. Such experimental data obtained using the shock tube/laser
diagnostics will undoubtedly be valuable to guiding future model development.
1.2 Overview of Dissertation
The dissertation is aiming to describe and discuss the key advancements achieved in
the relevant work, which are divided into the next four chapters accordingly:
1) Chapter 2 presents a mid-IR absorption sensor developed for measuring carbon
monoxide and temperature using CO transitions in the fundamental vibrational band near
4.7 m. It includes the introduction of the fundamental theory of laser absorption
spectroscopy and the direct absorption (DA) diagnostic method. Selection of optimal
transitions, measurements of spectroscopic parameters, and validation of the sensor in a
shock tube are discussed in this chapter.
2) Chapter 3 presents the development of a tunable diode laser (TDL) sensor near
2.7 m for measuring gas temperature of CO2 in shock-heated evaporating aerosols. In
many practical combustion processes, fuels are injected as liquid spray which quickly
evaporates at elevated temperatures. A normalized wavelength modulation spectroscopy
with second-harmonic detection (WMS-2f/1f) method is demonstrated to eliminate the
5
interference from droplet scattering. Applications of this sensor for accurate temperature
measurement of evaporating n-dodecane aerosols are performed in an aerosol shock tube.
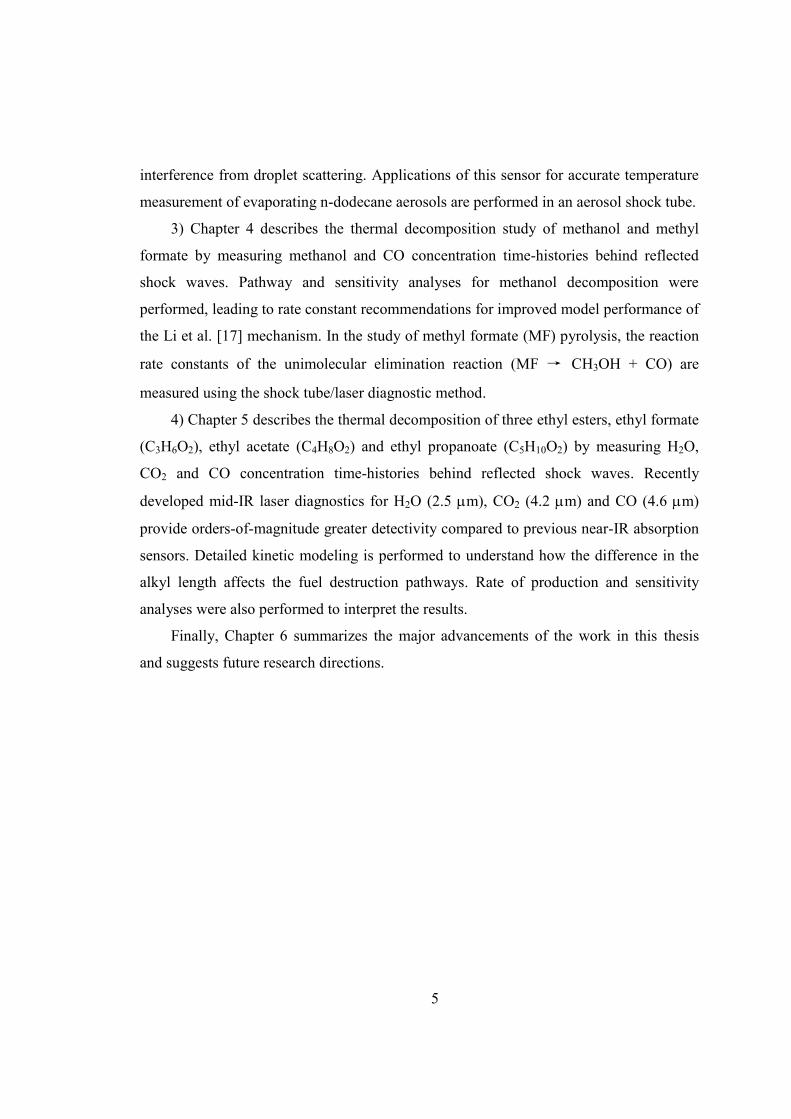
3) Chapter 4 describes the thermal decomposition study of methanol and methyl
formate by measuring methanol and CO concentration time-histories behind reflected
shock waves. Pathway and sensitivity analyses for methanol decomposition were
performed, leading to rate constant recommendations for improved model performance of
the Li et al. [17] mechanism. In the study of methyl formate (MF) pyrolysis, the reaction
rate constants of the unimolecular elimination reaction (MF → CH3OH + CO) are
measured using the shock tube/laser diagnostic method.
4) Chapter 5 describes the thermal decomposition of three ethyl esters, ethyl formate
(C3H6O2), ethyl acetate (C4H8O2) and ethyl propanoate (C5H10O2) by measuring H2O,
CO2 and CO concentration time-histories behind reflected shock waves. Recently
developed mid-IR laser diagnostics for H2O (2.5 m), CO2 (4.2 m) and CO (4.6 m)
provide orders-of-magnitude greater detectivity compared to previous near-IR absorption
sensors. Detailed kinetic modeling is performed to understand how the difference in the
alkyl length affects the fuel destruction pathways. Rate of production and sensitivity
analyses were also performed to interpret the results.
Finally, Chapter 6 summarizes the major advancements of the work in this thesis
and suggests future research directions.

6
7
Chapter 2. Mid-IR Laser Absorption
Detection of Carbon Monoxide
2.1 Introduction
Laser absorption spectroscopy techniques play a large and growing role in the
measurement of flow-field parameters such as temperature, gas composition, velocity,
and pressure [2–5]. These sensors are highly attractive for combustion and propulsion
applications due to their non-intrusive nature, fast time response, and in situ measurement
capability. Carbon monoxide (CO) is a particularly significant target for hydrocarbon-
fueled systems, since it is a toxic pollutant from combustion devices and a primary
product of incomplete combustion, and its concentration can be interpreted to indicate
combustion efficiency.
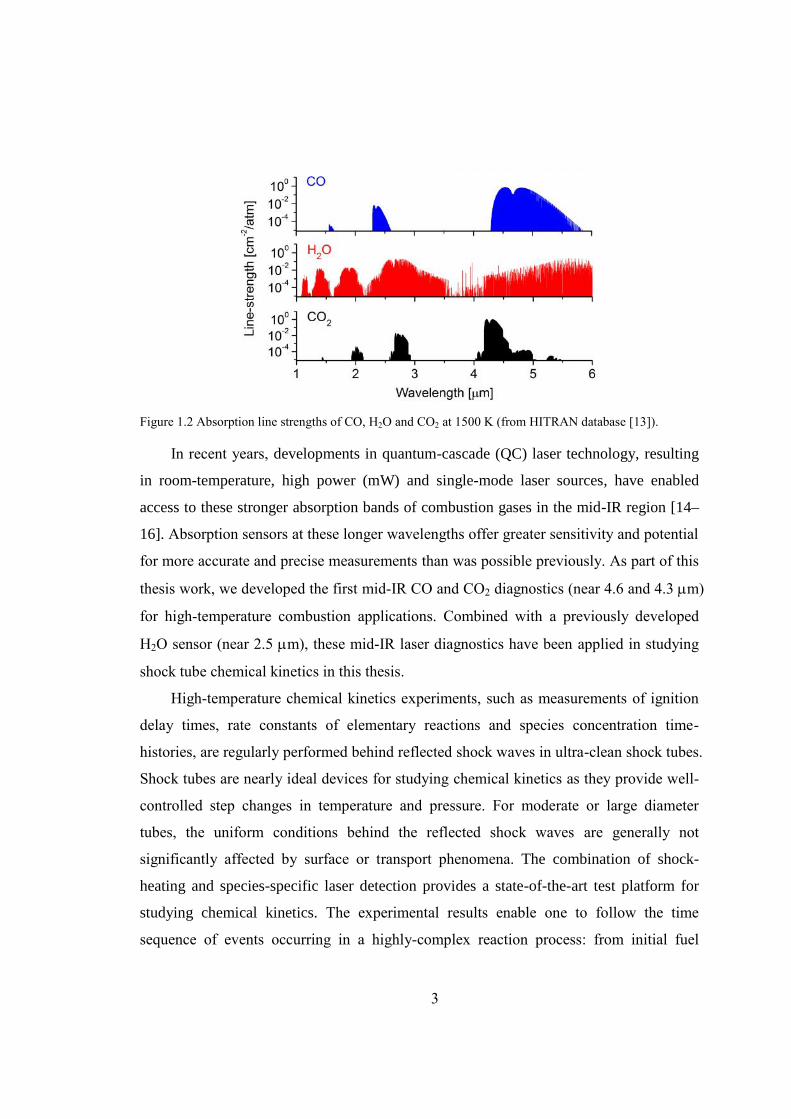
The absorption spectra of CO, H2O and CO2 in the near- to mid-infrared region at
1500 K are illustrated in Figure 2.1, where the absorption line-strengths (from the
HITRAN 2004 database [13]) are plotted as a function of wavelength from 1-6 m. The
fundamental band of CO holds the most promising candidate transitions owing to their
much stronger line-strengths and relatively weaker interference from other combustion
species. Work has been reported using transitions in three different vibrational bands of
CO: the second overtone band (v = 3) near 1.55 m [6,8,18], the first overtone band (v
= 2) near 2.3 m [19–22], and the fundamental band (v = 1) near 4.6 m [23–28]. The
absorption strength of the fundamental band is approximately 104 and 102 times stronger
compared to the overtone bands near 1.55 m and 2.3 m, respectively, making it
promising for sensitive detection with relatively low CO concentration and/or short path
length.
8
Figure 2.1 Absorption line-strengths of CO at 1500K (from HITRAN 2004 database [13]).
Developments in quantum-cascade (QC) laser technology, resulting in room-
temperature, relatively high power (mW), narrow line-width, and single-mode QC lasers,
have led to broad applications of these sources in high-resolution spectroscopy and high-
sensitivity detection of trace gases [14–16]. In this thesis, we discuss the development of
cw DFB-QCL-based mid-IR absorption of CO for in situ detection in combustion gases
and specifically in a shock tube. Sensors for temperature and CO concentration
measurements using scanned-wavelength direct absorption (DA) with a single room-
temperature QC laser and using fixed-wavelength DA with dual QC lasers are both
developed to provide fast and flexible diagnostics for different applications.
2.2 Fundamental Spectroscopy
The fundamental theory governing the light transmission through gaseous species is
the Beer-Lambert law. When spectrally narrow radiation at frequency v passes through a
uniform gas medium of length L [cm], the transmitted intensity It is related to the incident
intensity I0 by the Beer-Lambert law:
0
exp( ),ti v
v
ISPx L
I
Eqn. 2-1
where S [cm-2atm-1] is the line-strength of the specific transition, P [atm] is the total
pressure, xi is the mole fraction of the absorbing species i, and v [cm] is the line-shape
function. The dimensionless product v = SPxivL is defined as absorbance, with kv =
9
SPxiv the absorption coefficient. Since the line-shape function v is normalized to have
unit area across the line, the integrated absorbance can be expressed as
( ) .i v i iA dv S T Px L Eqn. 2-2
The Voigt line-shape function v combines both temperature and collisional
broadening. The collision-broadened full-width at half maximum (FWHM) of the
absorbing species i is
-1, cm 2 ,c j jij
v P x Eqn. 2-3
where xj is the mole fraction of the collisional partner j, and 2ji [cm-1atm-1] is the
broadening coefficient of j with i. From an experimental point of view, it is of practical
interest to have a simple model of the variation of the FWHM with temperature, typified
by the following commonly-used expression:
002 ( ) 2 ,
nT
T TT
Eqn. 2-4
where T0 is the reference temperature (usually 296 K) and n is the temperature coefficient.
The line-strength S [cm-2atm-1] has a temperature dependence:
1
0 0 0 00
0 0
( ) " 1 1( ) ( ) exp 1 exp 1 exp ,
( )
Q T T hcv hcvhcES T S T
Q T T k T T kT kT
Eqn. 2-5
where Q(T) is the partition function, E” [cm-1] is the lower-state energy, v0 [cm-1] is the
line-center frequency, and h, c, k are Planck's constant, speed of light and Boltzmann’s
constant, respectively. The absorption measurement of temperature is commonly based
on a two-line technique [24]. Temperature is inferred from the ratio of the integrated
absorbance under the absorption feature or the line-center absorbance of two molecular
transitions of the same species.
2.3 Line Selection
Absorption spectra of the CO fundamental band between 4.3 and 5.8 m were
computed based on the HITRAN database [13] for typical shock tube combustion

10
conditions (1000-2000 K, 1 atm, 0.1% CO/1% H2O/1% CO2) to find suitable CO
transitions. A systematic line-selection procedure was used to find lines with sufficient
absorption strength, isolation from interfering absorption, temperature sensitivity, and the
availability of the commercial laser sources [29].
Two cw, room-temperature, DFB-QC lasers were subsequently acquired from Alpes
Lasers SA to access the R-branch near 4.6 m and the P-branch near 4.8 m of the
fundamental band of CO, respectively. For the laser frequency ranges of 2048.6 to 2061.3
cm-1 and 2185.8 to 2200.3 cm-1, three sets of closely spaced line pairs were selected for
single-laser, scanned-wavelength temperature sensing: line pair A (v” = 0, R(12) and v” =
1, R(21) near 2190 cm-1), line pair B (v” = 0, R(13) and v” = 1, R(22) near 2194 cm-1),
and line pair C (v” = 0, P(20) and v” = 1, P(14) near 2060 cm-1). Their spectroscopic
parameters (for line pairs A, B and C) from the HITRAN database [13] are summarized
in Table 2.1. A spectral simulation of 0.1% CO in air (T = 1500 K, P = 1 atm, L = 10 cm)
for these three line pairs is illustrated in Figure 2.2, along with the interfering absorption
of 1% H2O and CO2. It should be noted that the interference from H2O and CO2 is mostly
negligible at these wavelengths under the shock tube conditions of interest.
Figure 2.2 Calculated spectra of 0.1% CO, 1% H2O and 1% CO2 in air under shock tube combustion
conditions: T = 1500 K, P = 1 atm, L = 10 cm.
11
Table 2.1 Candidate CO lines for the measurements of temperature and CO concentration based on the
HITRAN 2004 database [13].
Figure 2.3 Temperature sensitivities (left-hand axis) and line-strength ratios (right-hand axis) for two
representative line pairs. Solid line: line pair A (v” = 1, R(21) and v” = 0, R(12)) for single-laser scanned-
wavelength temperature sensing; dashed line: the v” = 1, R(21) and v” = 0, P(20) lines for dual-laser fixed-
wavelength temperature sensing (selected from the six individual lines listed in Table 2.1).
These three line pairs, each with CO transitions from two different vibrational levels,
have a spectral separation of 0.4-1.5 cm-1, within the typical 2 cm-1 rapid-tuning range of
the commercial QC lasers. Representative analyses of the line-strength ratio and
temperature sensitivity for the line pair A are plotted as solid lines in Figure 2.3.
Typically the line-strength ratio should not be too far from unity. The sensitivity, defined
here as the unit change in line-strength ratio for a unit change in temperature should at
least be 1 for sensitive temperature measurements. These two curves suggest this line pair
can be used for accurate temperature sensing at elevated temperatures, e.g., between 1000
and 3000 K.
Line pair Transition
(v”, J”)
Frequency
(cm-1)
Wavelength
(nm)
Separation
(cm-1)
S @ 296 K
(cm-2atm-1)
E”(cm-1)
A0, R(12) 2190.02 4566.17
1.487.13 299.77
1, R(21) 2191.50 4563.08 4.32×10⁻⁵ 3022.09
B0, R(13) 2193.36 4559.22
1.106.04 349.70
1, R(22) 2194.46 4556.93 3.02×10⁻⁵ 3105.65
C0, P(20) 2059.91 4854.58
0.428.76×10-1 806.38
1, P(14) 2060.33 4853.59 2.64×10⁻⁴ 2543.06

12
Two-line thermometry, achieved by scanning two neighboring transitions with a
single laser, enables a relatively simpler system with lower cost. However, the tuning rate
of the QC lasers limited the sensor bandwidth to several kHz. High-temperature chemical
kinetic studies in a shock tube, where chemical reactions happen within milliseconds,
require a faster sensor, with 100 kHz bandwidth or greater. Thus, a dual-laser, fixed-
wavelength method was pursued to provide highly time-resolved measurements. We
selected the v” = 0, P(20) and v” = 1, R(21) lines from the six individual lines listed in
Table 2.1 as the optimum line pair for temperature measurement using two different QC
lasers. The corresponding line-strength ratio and temperature sensitivity for this line pair
are shown as dashed lines in Figure 2.3.
2.4 Spectroscopic Measurement and Verification
The fundamental spectroscopic parameters such as line-strength, self- and air-
broadening coefficients of CO can be found in the HITRAN database [13]. However,
argon instead of air is usually used as the bath gas in shock tube kinetic studies.
Accordingly, there is need to investigate the Ar-broadening coefficient of each line and
its temperature dependence. Moreover, the validation of CO line-strength at high
temperature is essential for the accurate measurements as the measured absorbance is
compared with the simulation to infer gas mole fraction and temperature.
All spectroscopic measurements were performed in a 15.2 cm diameter stainless-
steel high-purity shock tube. The incident shock wave propagates through the tube,
raising the temperature and pressure of the test gas from (T1, P1) to (T2, P2). When the
shock wave reaches the end-wall of the tube, it is reflected and further elevates the
temperature and pressure of the test gas to (T5, P5). The gas temperature and pressure
immediately behind the shock wave can be calculated accurately using standard normal-
shock relations and the measured incident shock speed, with an uncertainty of ~1% in
temperature over the high-quality test time of 2 ms. Research grade gases (argon, helium,
and hydrogen >99.999%; 0.5% CO/Ar mixture with uncertainty <0.1%) were supplied by
Praxair Inc. Due to the significant time for CO to vibrationally relax behind the reflected
shock wave, a small portion of H2 (1%) is added to the 0.5% CO/Ar mixture to accelerate
13
the vibrational relaxation; see Figure 2.4 for the evaluation. The test mixtures were
manometrically prepared in a turbo-pumped stainless-steel mixing tank (40 L) with a
magnetically driven stirrer.
Figure 2.4 Calculated vibrational relaxation time (P = 1.5 atm) for CO-Ar, CO-He-Ar and CO-H2-Ar
mixtures (calculations from reference [30]).
Figure 2.5 Experimental setup for the measurement of spectroscopic parameters of CO transitions in a
shock tube.
A schematic of the experimental setup is demonstrated in Figure 2.5. The room-
temperature operated QC laser (Alpes Lasers) used for these measurements was
thermoelectrically cooled and housed with collimation optics in a sealed laser housing
Shock-heated gases
DiagnosticBeam
Iris
NBP
Wav
emet
er
I0 I
QCL
LaserController
FunctionGenerator
Solid etalon
Flip mirror
Beamsplitter
14
(Alpes HHL-L module). In addition, a laboratory water-cooled heat sink was installed to
the laser housing to achieve more stable laser performance. The laser wavelength is tuned
by varying the injection current and base temperature, which are controlled by a
combination of commercial temperature and injection current controllers (Alpes Lasers
TCU 200 and ILX Lightwave LDX-3232). The laser wavelength is rapidly tuned (1-10
kHz scan rate) over the desired absorption feature with a linear ramp of current from a
function generator. A ZnSe beam splitter was used to split the collimated laser beam (20-
40 mW) into two arms to be received by a pair of matched TE-cooled IR photovoltaic
detectors (Vigo Systems, 1 MHz bandwidth); one beam passes through the test gas of
15.2 cm path length in the shock tube, while the other propagates through a 7.6 cm long
solid germanium etalon in the ambient air. The etalon with a free spectral range (FSR) of
0.016 cm-1 enables the conversion of scan time to relative wavelength. A narrow-
bandpass IR filter (half power bandwidth 50 nm) was used to filter out emission and
unwanted ambient light. Before each shock tube experiment, the laser wavelength was
tuned to the desired transition by monitoring the absolute wavelength using a free-space
mid-IR wavemeter (Bristol 621).
The laser wavelength was typically tuned over a range of ~1 cm-1 at a frequency of
2.5 kHz, while the detector signal was sampled at 10 MHz to fully capture the absorption
feature. The data acquisition system was triggered by the pressure transducer located at 2
cm from the shock tube end-wall to record pressure and transmission signal (It) of the
laser during the shock heating. In the present experiments with large fractional absorption
and no significant noise problems, only one single scan of It behind the reflected shock
was analyzed to infer spectroscopic parameters.
The raw data traces of a typical experiment for high-temperature line-strength and
Ar-broadening measurements of CO are plotted in Figure 2.6(a). The laser intensity and
wavelength were scanned over the R(12) transition at 2190.02 cm−1 and recorded behind
the reflected shock at 1450 K and 1.63 atm (vibrational equilibrium) with a mixture of
0.496% CO/1% H2/Ar. Prior to each experiment, the shock tube is evacuated by a
turbomolecular pump and the baseline reference intensity (I0) recorded. The spectral
absorbance is then determined by the Beer-Lambert law and plotted as a function of
wavenumber calibrated using the etalon trace, as demonstrated in Figure 2.6(b). The
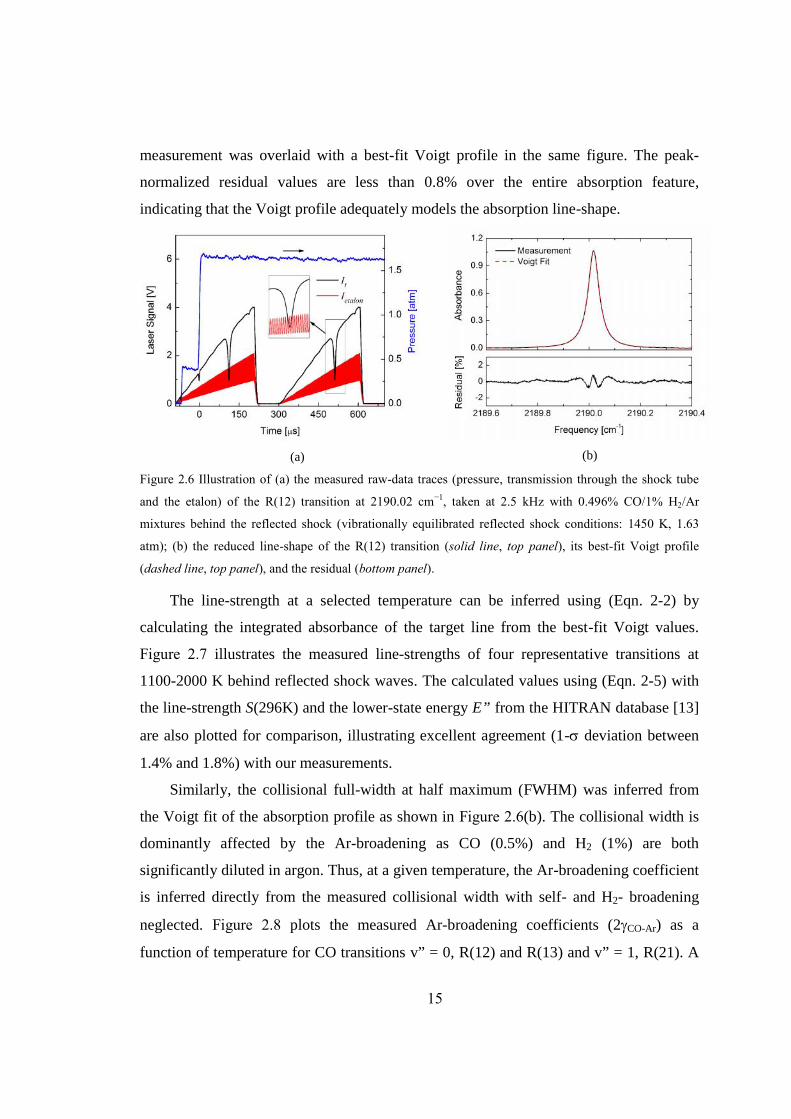
15
measurement was overlaid with a best-fit Voigt profile in the same figure. The peak-
normalized residual values are less than 0.8% over the entire absorption feature,
indicating that the Voigt profile adequately models the absorption line-shape.
(a) (b)
Figure 2.6 Illustration of (a) the measured raw-data traces (pressure, transmission through the shock tube
and the etalon) of the R(12) transition at 2190.02 cm−1, taken at 2.5 kHz with 0.496% CO/1% H2/Ar
mixtures behind the reflected shock (vibrationally equilibrated reflected shock conditions: 1450 K, 1.63
atm); (b) the reduced line-shape of the R(12) transition (solid line, top panel), its best-fit Voigt profile
(dashed line, top panel), and the residual (bottom panel).
The line-strength at a selected temperature can be inferred using (Eqn. 2-2) by
calculating the integrated absorbance of the target line from the best-fit Voigt values.
Figure 2.7 illustrates the measured line-strengths of four representative transitions at
1100-2000 K behind reflected shock waves. The calculated values using (Eqn. 2-5) with
the line-strength S(296K) and the lower-state energy E” from the HITRAN database [13]
are also plotted for comparison, illustrating excellent agreement (1- deviation between
1.4% and 1.8%) with our measurements.
Similarly, the collisional full-width at half maximum (FWHM) was inferred from
the Voigt fit of the absorption profile as shown in Figure 2.6(b). The collisional width is
dominantly affected by the Ar-broadening as CO (0.5%) and H2 (1%) are both
significantly diluted in argon. Thus, at a given temperature, the Ar-broadening coefficient
is inferred directly from the measured collisional width with self- and H2- broadening
neglected. Figure 2.8 plots the measured Ar-broadening coefficients (2CO-Ar) as a
function of temperature for CO transitions v” = 0, R(12) and R(13) and v” = 1, R(21). A
16
two-parameter best fit to the experimental data following (Eqn. 2-4) gives 2CO-Ar(296K)
and its temperature coefficient n, as illustrated in Figure 2.8 and summarized in Table 2.2.
Note that the errors quoted in the table for the experimental results correspond only to the
standard deviations derived by linear least-squared fits of log(2CO-Ar) versus log(296/T).
Experimental results of the line v” = 1, R(22) at 2194.46 cm-1 are not included in Table
2.2, since this line was found to be blended with a neighboring transition v” = 2, R(32) at
2194.44 cm-1 especially at higher temperatures, leading to larger uncertainties in the
measurement.
Figure 2.7 Comparison of the measured line-strengths for the CO transitions at high temperatures with the
HITRAN database [13].
Figure 2.8 Ar-broadening coefficient 2CO-Ar measurements for the CO transitions: R(12), R(13) and R(21).
The two-parameter best fit extrapolated to 296 K gives 2CO-Ar(296 K)=0.079±0.007 cm-1/atm and n =
0.581±0.012 for transition R(12), 2CO-Ar(296 K)=0.079±0.009 cm-1/atm and n = 0.600±0.016 for transition
R(13), and 2CO-Ar(296 K) = 0.072±0.007 cm-1/atm and n = 0.571±0.012 for transition R(21), respectively.
17
Table 2.2 Line-strength and broadening parameters for the CO transitions. Uncertainties of measurements
are given in the parentheses; the extrapolation of 2CO-Ar to 296 K following (Eqn. 2-4) is based on the
experimental data over the temperature range of 1100-2000 K.
Transition(v”, J”)
S @ 296 K,(cm-2atm-1)
2CO-Ar (296K),(cm-1/atm)
N
HITRAN Measured Bouanichet al. [31]
Measured@ 296 K
Fit to1100-2000 K
Fit to1100-2000 K
0, R(12) 7.13(2-3%)
7.16(2.3%)
0.088 0.088(3.0%)
0.079±0.007 0.581±0.012
1, R(21) 4.32×10⁻⁵
(2-3%)- - - 0.072±0.007 0.571±0.012
0, R(13) 6.04(2-3%)
5.95(2.3%)
0.087 0.085(2.9%)
0.079±0.009 0.600±0.016
0, P(20) 0.876(2-3%)
0.872(2.5%)
0.079 0.079(3.3%)
0.083±0.011 0.639±0.024
1, P(14) 2.64×10⁻⁴
(2-3%)- - - 0.074±0.018 0.560±0.045
In addition, the room-temperature (296 K) line-strengths and Ar-broadening
coefficients of the ground state transitions (v” = 0) can be directly determined by
examining a frequency scan prior to the passage of the incident shock. Figure 2.9
illustrates the variation of the measured integrated absorbance and FWHM with pressure
at 296 K for the representative transitions v” = 0, R(12) and v” = 0, P(20). Following
(Eqn. 2-2) and (Eqn. 2-3), the line-strength and Ar-broadening coefficient at 296 K are
inferred from the slope of the linear fit to the data as shown in Figure 2.9 (a) and (b),
respectively. These experimental results are also summarized in Table 2.2. The measured
line-strength at 296 K shows excellent agreement with the HITRAN database [13]
(within 1.5%), and the measured Ar-broadening coefficient is also in quite good
agreement with the previous room-temperature studies by Bouanich and Haeusler [31].
We also compared the 2CO-Ar(296 K) obtained from the direct measurements at
room temperature with the extrapolated values (assuming constant n) from the shock tube
measurements over the 1100-2000 K range. It should be noted that a 3-10% difference of
2CO-Ar(296 K) can be found between these two methods. This may be explained by the
fact that the temperature coefficient n in (Eqn. 2-4) itself is a weak function of
temperature over the range from 296 K to 2000 K. Since the Ar-broadening coefficient as
a function of temperature on a log-log plot is well-fit by a straight line as illustrated in
Figure 2.8, n can be treated as a constant over this specific temperature range of 1100-
18
2000 K and utilized in the sensor development for shock tube and combustion
applications.
(a) (b)
Figure 2.9 Room-temperature (296 K) spectroscopic parameter measurements for (a) line-strength using the
measured integrated absorbance versus P1 (20-60 Torr), and (b) Ar-broadening coefficient using the
measured collisional FWHM versus P1.
2.5 Sensor Validation in Shock Tube Experiments
CO concentration and temperature sensors using both scanned-wavelength and
fixed-wavelength direct absorption strategies are first validated in non-reactive shock-
heated gases before being used in combustion kinetics applications. The bandwidth of the
fixed-wavelength CO sensor is typically 1 MHz (limited by the detector bandwidth),
compared to 2.5 kHz for the scanned-wavelength scheme which is limited by the scan
rate of the laser injection current.
2.5.1 Scanned-Wavelength CO Sensor Using a Single QC Laser
Single-laser sensing has the advantages of simplifying the sensor system and
reducing cost. Transitions v” = 1, R(21) and v” = 0, R(12) with relatively large difference
in E” are close enough to be covered by a single scan of the QC laser. Temperature can
be inferred by comparing the measured peak absorbance ratio with the simulation. The
simulated peak absorbance ratio for this line pair is plotted in Figure 2.10 as a function of
temperature. Notice that the pressure effect is also investigated to show that the

19
uncertainty due to pressure variation is negligible in the pressure range of 1-2 atm. At
1500 K, for example, the temperature uncertainty is ~6 K (0.4%) with a pressure change
from 1 to 2 atm.
Figure 2.10 Simulated peak absorbance ratio for the line pair R(21)/R(12) and R(21)/P(20) using the
spectroscopic parameters listed in Table 2.2.
The experimental setup for the single-laser sensor validation in a shock tube is the
same as that shown in Figure 2.5. The test gas mixture is known to be 0.49% CO/ 2% H2
/Ar; similarly, hydrogen is added to accelerate vibrational relaxation. Figure 2.11
illustrates a representative laser absorption measurement of temperature behind the
reflected shock at 1526 K and 1.57 atm (vibrationally relaxed). The laser intensity and
wavelength were tuned across these two absorption profiles of interest at 2.5 kHz (top
panel in Figure 2.11), along with the corresponding absorbance profile shown in the
bottom panel. Assuming ideal shock conditions, the gas properties were reasonably
regarded to be unchanged within each scan of 0.4 ms. During the test time of 2.5 ms, the
sensor produced six data points of temperature as illustrated in the bottom panel of Figure
2.11, which were in good agreement (1527-1529 K in the first 1 ms, less than 0.2%
difference) with the known value calculated using normal shock equations. Notice that
the measured temperature drops significantly by ~30 K at 2.4 ms, possibly due to a weak
interaction of the reflected shock wave with the contact surface (driven and driver gas).
With the temperature measured, the CO mole fraction is then inferred from either
line of these two transitions. The CO mole fraction is measured to be (0.491±0.003)%
using line R(12), again showing good agreement with the known CO concentration of
20
0.49%. Moreover, at 2.4 ms when the non-ideal shock condition happens, the CO mole
fraction is still accurately measured to be 0.489%.
Experiments were repeated under different shock conditions to measure gas
temperature and CO concentration, and the results for a single scan are compared with
the known values and plotted in Figure 2.12 (solid squares). Good agreement can be seen
between measurements and the known values for both the temperature (1- deviation
0.8%) and CO concentration (1- deviation 1.6%).
Figure 2.11 Sample traces of laser transmission and pressure (top panel), as well as absorbance and
temperature (bottom panel) measured in non-reactive test gases (0.49% CO/ 2% H2 /Ar, vibrationally
equilibrated reflected shock conditions: 1526 K, 1.57 atm). A single QCL was used to scan over the line
pair R(21) and R(12) at 2.5 kHz.
Figure 2.12 Shock tube validation measurements for the scanned-wavelength (measured for a single scan
behind the reflected shock, solid squares) and the dual-laser fixed-wavelength (averaged over the first 0.3-1
ms after the shock, solid triangles) direct absorption CO sensors (0.49% CO/2% H2/Ar, 1.3-1.7 atm).
21
2.5.2 Fixed-Wavelength CO Sensor Using Two QC Lasers
The sensor bandwidth of scanned-wavelength direct absorption is limited to several
kHz, making it impossible to capture the rapid change of gas properties in chemical
reactions. Here a fixed-wavelength CO concentration and temperature sensor with a
bandwidth of ~1 MHz is developed for shock tube experiments using a dual-laser fixed-
wavelength diagnostic strategy.
Figure 2.13 is a schematic of the experimental setup. The light from each laser is
collimated and transmitted through a different pair of windows on the shock tube
sidewall. The laser wavelengths are fixed at the line-centers of the two selected
transitions v” = 1, R(21) at 2191.50 cm-1 and v” = 0, P(20) at 2059.91 cm-1, respectively.
This optical configuration utilizes the fact that the gas properties across the shock tube
are uniform.
Figure 2.13 Experimental setup for the fixed-wavelength two-line temperature and CO concentration
measurements in a shock tube.
Figure 2.14(a) demonstrates a sample time-history of the laser absorbance recorded
behind a reflected shock at 1454 K and 1.62 atm with 0.49% CO/2% H2/Ar mixture. The
laser absorption reaches the plateau level as the CO is fully relaxed at ~0.2 ms. Note that
the sensor essentially measures the vibrational temperature, and hence the absorbance in
the v” = 1, R(21) line increases with time, after the shock, from zero to its plateau value.
Conversely, the v” = 0, P(20) absorbance decreases from its elevated initial value to its
plateau value as vibrational relaxation takes place. Measured time-histories of pressure
and temperature are plotted in Figure 2.14(b). The average measured temperature over
the time interval 0.2-1.5 ms is 1456 K with a standard deviation of 6 K (0.4%), showing
excellent agreement with the calculated value of 1454 K. Note that the sensor is capable
2191.50 cm-1
Aperture
DetectorBP Filter
2059.91 cm-1
22
of capturing the slight rise of temperature at later times from about 0.9-1.8 ms, which
results from the non-ideal shock tube effects of boundary layer growth and incident-
shock attenuation. CO mole fraction can be computed using the measured pressure,
temperature and transmission signal of either laser.
The experimental results are summarized and plotted in Figure 2.12 (solid triangles).
The measured and calculated temperatures are in good agreement (within 1.1%) over the
tested temperature range of 1200-1900 K, and the measured mole fraction agrees with the
known values within 1.7%. These results confirm the sensor accuracy for temperature
and CO concentration measurements at combustion temperatures. It is noteworthy that
this sensor has the potential to measure both translational/rotational temperatures and
vibrational temperatures, when these temperatures differ, by employing line pairs with
the same v” value or with different v” values, respectively.
(a) (b)
Figure 2.14 Fixed-wavelength temperature measurements using two QC lasers with 0.49% CO/2% H2/Ar:
(a) measured absorbance traces for the two lasers; (b) measured temperature and pressure. Vibrationally
equilibrated reflected shock conditions: P5 = 1454 K, T5 = 1.62 atm.
23
2.6 Temperature and CO Concentration Measurements in
Combustion Gases
Shock tubes are used to study gas phase combustion reactions by measuring ignition
delay times and by monitoring species time-histories over a wide range of temperatures
and pressures [5]. Accurate, time-resolved measurements of combustion species in shock
tubes are therefore critical, with laser absorption the most commonly employed method
[5,32]. Here the fixed-wavelength CO sensor validated in Section 2.5.2 is demonstrated
in a kinetic study of the high-temperature pyrolysis and oxidation of methyl formate
(MF), a simple biodiesel surrogate.
Figure 2.15 Absorbance time-histories of R(21) and P(20) during the pyrolysis of methyl formate. Initial
reflected shock conditions: T5 = 1364 K, P5 = 1.63 atm, 0.5% MF/Ar.
The shock tube/laser diagnostic experimental setup is the same as that shown in
Figure 2.13. Typical absorbance time-histories for both lasers are plotted in Figure 2.15
for a test mixture of 0.5% MF/Ar shock-heated to 1364 K, 1.63 atm. The absorbance
profile for each laser directly represents the CO formation during the high-temperature
pyrolysis of methyl formate. Temperature is inferred from the measured absorbance ratio,
showing the slight decrease (15 K) that occurs during the decomposition of methyl
formate; see Figure 2.16(a). Our measurement is compared with a chemical kinetic
simulation using the Dooley et al. [33] mechanism, performed in a commercial software
package CHEMKIN-PRO [34]. As illustrated in Figure 2.16, the simulation results are
insensitive to the selection of different gasdynamic constraints, e.g. constant volume (V)
and internal energy (U), or specified pressure (P) and enthalpy (H).
24
(a) (b)
Figure 2.16 Temperature and CO concentration measured during a shock with initial mixture of 0.5%
MF/Ar; simulations using the Dooley et al. [33] mechanism are shown for comparison. Initial reflected
shock conditions: T5 = 1364 K, P5 = 1.63 atm.
(a) (b)
Figure 2.17 Temperature and CO concentration measurements during MF oxidation for a mixture of 0.494%
MF, 0.988% O2 (= 1) and Ar; simulations using the Dooley et al. [33] mechanism are shown for
comparison. Initial temperature and pressure behind the reflected shock are T5 = 1379 K, P5 = 1.67 atm.
CO concentration time-history is then inferred from either absorption trace; here the
R(21) transition is used. Figure 2.16(b) compares the sensor measurement with the
simulation using the Dooley et al. [33] mechanism. The model underpredicts the rate of
CO formation by about 10% during MF pyrolysis, revealing the need for minor
modifications to the kinetic model. The difference between simulations under constant U,
V and specified H, P constraints is negligible.
Similar measurements were performed for high-temperature MF oxidation in the
shock tube. The measured temperature and CO mole fraction are plotted in Figure 2.17
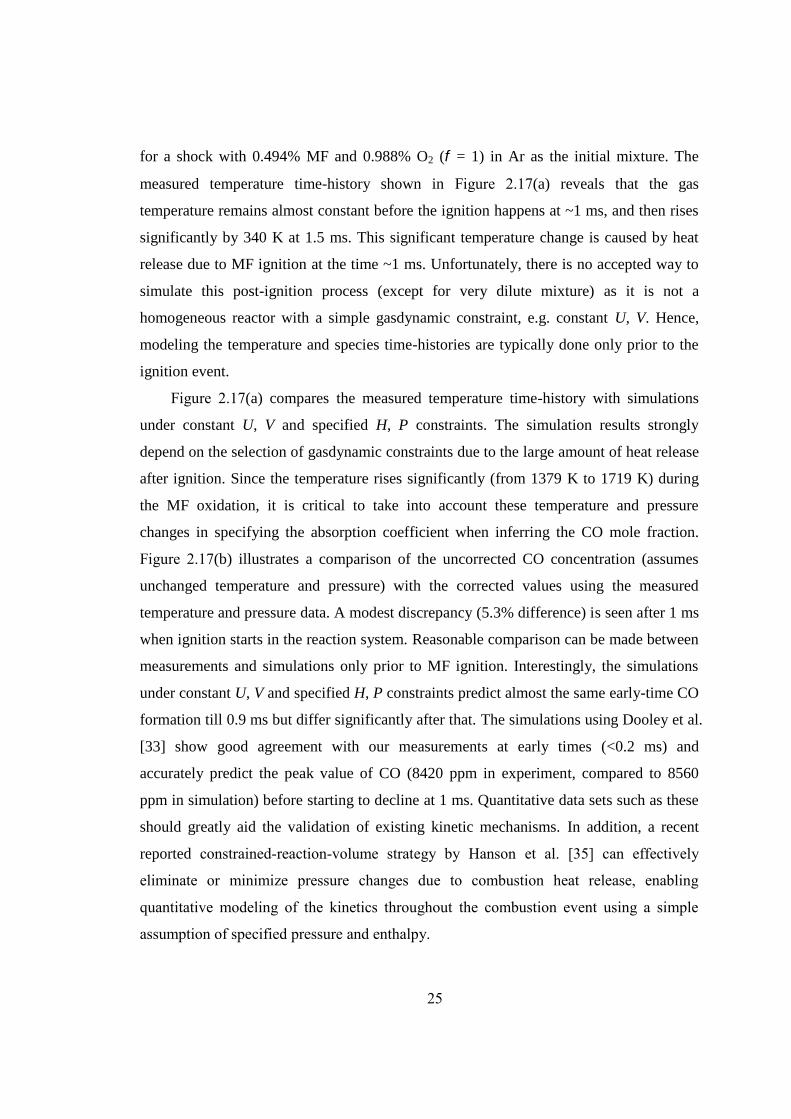
25
for a shock with 0.494% MF and 0.988% O2 (= 1) in Ar as the initial mixture. The
measured temperature time-history shown in Figure 2.17(a) reveals that the gas
temperature remains almost constant before the ignition happens at ~1 ms, and then rises
significantly by 340 K at 1.5 ms. This significant temperature change is caused by heat
release due to MF ignition at the time ~1 ms. Unfortunately, there is no accepted way to
simulate this post-ignition process (except for very dilute mixture) as it is not a
homogeneous reactor with a simple gasdynamic constraint, e.g. constant U, V. Hence,
modeling the temperature and species time-histories are typically done only prior to the
ignition event.
Figure 2.17(a) compares the measured temperature time-history with simulations
under constant U, V and specified H, P constraints. The simulation results strongly
depend on the selection of gasdynamic constraints due to the large amount of heat release
after ignition. Since the temperature rises significantly (from 1379 K to 1719 K) during
the MF oxidation, it is critical to take into account these temperature and pressure
changes in specifying the absorption coefficient when inferring the CO mole fraction.
Figure 2.17(b) illustrates a comparison of the uncorrected CO concentration (assumes
unchanged temperature and pressure) with the corrected values using the measured
temperature and pressure data. A modest discrepancy (5.3% difference) is seen after 1 ms
when ignition starts in the reaction system. Reasonable comparison can be made between
measurements and simulations only prior to MF ignition. Interestingly, the simulations
under constant U, V and specified H, P constraints predict almost the same early-time CO
formation till 0.9 ms but differ significantly after that. The simulations using Dooley et al.
[33] show good agreement with our measurements at early times (<0.2 ms) and
accurately predict the peak value of CO (8420 ppm in experiment, compared to 8560
ppm in simulation) before starting to decline at 1 ms. Quantitative data sets such as these
should greatly aid the validation of existing kinetic mechanisms. In addition, a recent
reported constrained-reaction-volume strategy by Hanson et al. [35] can effectively
eliminate or minimize pressure changes due to combustion heat release, enabling
quantitative modeling of the kinetics throughout the combustion event using a simple
assumption of specified pressure and enthalpy.

26
27
Chapter 3. Two-Line Thermometry for
Multiphase Combustion Flows
3.1 Introduction
Accurate knowledge of temperature is very important in combustion studies of
chemical reaction rates, process efficiency and pollutant emissions [36,37]. Shock tubes
are typically used to study chemical kinetics at elevated temperatures since they provide a
well-controlled pressure and temperature environment. Currently there is a need to
investigate the combustion chemistry of real fuel blends, including diesels, jet fuels and
biodiesels, all of which have low vapor pressures precluding their study in conventional
unheated shock tube kinetics experiments. Thus, we have designed a new type of shock
tube [38], in which a spatially-uniform fuel aerosol is loaded into the shock tube; the
evaporation of this aerosol behind the incident shock wave is used to produce fuel vapor
for the subsequent reaction behind the reflected shock wave. For a better understanding
of the shock tube performance, accurate sensors with rapid time-response are now
required to explore and validate the test conditions in the evaporating fuel aerosol.
CO2 is a particularly attractive target species since it is a primary combustion
product of hydrocarbon fuels and can be added as an inert tracer for the measurements in
both non-reactive and many reactive flow environments. Sensors for CO2 previously used
three different vibrational combination bands, near 1.57 m (2v1+2v2+v3) [9,10,18], 2.0
m (v1+2v2+v3) [7,20,39], and 2.7 m (v1+v3, 2v2+v3) [40,41]. The combination bands
near 2.7 m offer the most promising candidate transitions in terms of their stronger
absorption (approximately 1000 and 50 times stronger, respectively, in contrast to the
combination bands near 1.57 m and 2.0 m). The first CO2 concentration and
28
temperature sensor for combustion gases using diode laser absorption in the v1+v3 band
has recently been reported by Farooq et al. [40].
To our knowledge, few studies of temperature measurements in evaporating aerosol
have been conducted using optical diagnostics, due to the problem of dealing with the
interference of droplet extinction. Beyrau et al. reported an application of pure rotational
coherent anti-Stokes Raman spectroscopy (CARS) in quantitative gas-phase temperature
measurements in the vaporizing spray of an automotive fuel injector [42]. Awtry et al.
developed a TDL spectrometer based on scanned-wavelength direct absorption (DA) for
multi-species measurements in a dense water mist environment [43]. Porter et al. used a
three-wavelength mid-IR absorption/extinction diagnostic to measure the temperature and
concentration of n-decane using transitions in the C-H stretching band near 3.4 m [44].
However, these mid-IR measurements with broad absorption features typically require
precise knowledge of the aerosol droplet properties, together with an additional extinction
measurement with a non-resonant beam.
In this work, we extended the 2.7 m fixed-center-wavelength WMS-2f sensor of
Farooq et al. [40] to the sensitive and accurate temperature measurements of CO2 in an
evaporating aerosol. The sensor was used for temperature measurements in shock-heated
n-dodecane aerosols with CO2 as an inert tracer. The temperature decline immediately
behind the incident shock due to aerosol evaporation was successfully captured,
illustrating a good agreement with modeled values. Measurement uncertainties resulting
from the pressure fluctuation and concentration change were investigated to confirm that
the two-line thermometry was sensitive only to temperature under the conditions studied.
3.2 Wavelength Modulation Spectroscopy Fundamentals
The quantitative measurement of gas properties requires an accurate WMS model.
The model used in this work is based on Li et al. [45], which includes actual laser
performance parameters. In tunable diode laser (TDL) WMS, the laser injection current is
sinusoidally modulated with an angular frequency of = 2f to produce frequency (FM)
and intensity modulation (IM) as
( ) cos( )v t v a t , Eqn. 3-1

29
00 0 1 2 2( ) [1 cos( ) cos(2 )]I t I i t i t , Eqn. 3-2
where v [cm-1] is the center laser frequency; a[cm-1] is the modulation depth; i0 and i2 are
the linear and nonlinear IM amplitudes normalized bythe average laser intensityI0, and
and are the linear and nonlinear FM/IM phase shifts. The transmission coefficient
(v) for the laser light through the absorbing gas medium (assumed uniform) of length
L[cm] is described by Beer’s law
0
exptv
v
Iv
I
, Eqn. 3-3
where It is the transmitted laser intensity. As discussed before, v is known as the spectral
absorbance
v i vP S T L , Eqn. 3-4
where P[atm] is the total gas pressure; i is the mole fraction of the absorbing species,
and S(T)[cm-2/atm] and v[cm] are the line-strength at temperature T[K] and the line-
shape function of the absorption feature, respectively.
The time-dependent transmission coefficient (v) can be expanded in terms of a
Fourier series with ,kH v a the kth-order Fourier component as discussed in [45]. The
case of k = 2 is generally of highest interest in WMS, since it is closely related to the
absorption. The 2f signal can be experimentally demodulated from the detector signal
using a lock-in amplifier, and the X and Y components can be expressed as
0 0 42 2 1 3 1 2 0 2cos cos
2 2 2f
i HGIX H H H i H
, Eqn. 3-5
0 0 42 1 3 1 2 0 2sin sin
2 2 2f
i HGIY H H i H
, Eqn. 3-6
where the magnitude of WMS-2f signal is given by = + . G accounts for
the optical-electrical gain of the detection system, and also transmission losses other than
absorption. This factor can be removed by normalization with the 1f signal, which can be
calculated:
30
20 2 2
1 1 0 0 1 1 3 2
1/ 22
2 20 0 1 1 3 2
cos cos2 2 2
sin sin .2 2
f
H iGIR H i H H H
H ii H H H
Eqn. 3-7
Gas temperature is inferred from the ratio of the two 1f-normalized WMS-2f signals/ / , and is closely related to the ratio of absorption line-
strengths.
In many practical combustion processes, fuels are injected as a liquid spray which
quickly evaporates at elevated temperatures. Expanding Beer’s law by incorporating
extinction due to scattering by aerosol particles, the laser light extinction coefficient can
be expressed as [46]:
0
lnv v v
v
IExt k L
I
,Eqn. 3-8
where kv[cm-1] is the spectral absorption coefficientof the gas and v[cm-1] is known as
the droplet extinction coefficient. From models of Mie scattering [46], the extinction
coefficient v is an integration of droplet parameters over the full range of droplet
diameter, D, given by
max
min
2
, ,4
D
v ext v
D
DN f D Q D m dD
,Eqn. 3-9
where N[cm-3] is the droplet loading; f(D)[cm-1] is the droplet size distribution function;
Qext,v is the normalized extinction cross section, and m is the complex refractive index.
In the aerosol shock tube experiments described later, the performance of the WMS
temperature sensor was evaluated in the presence of evaporating n-dodecane aerosols.
Since the two wavelengths selected for the temperature sensing of CO2 are both near 2.7
m, the absorber CO2 has sharp absorption structures as illustrated in Figure 3.1. Using a
readily available Mie scattering code [47], the droplet extinction cross section Qext,v was
calculated and shown in Figure 3.2 for two different median droplet diameters. For the
two selected sensor wavelengths, the droplet extinction term can be treated as constant.
Hence, the droplet extinction reduces the magnitudes of the 2f and 1f signals equally and

31
1f-normalization of the 2f signal provides an effective means of excluding the effects of
droplet scattering on accurate temperature measurements.
Figure 3.1 Calculated CO2 (1%) absorption spectra for the R(28) transition at 3633.08 cm-1 (2752.48 nm)
and the P(70) transition at 3645.56 cm-1 (2743.06 nm) under typical shock tube conditions: T2 = 650 K, P2
= 0.5 atm; T5 = 1200 K, P5 = 1.0 atm; L = 10 cm.
Figure 3.2 Calculated extinction cross section (Mie scattering code [47]) for liquid n-dodecane droplets; Dm
is the median diameter of aerosol droplet size.
Table 3.1 Measured spectroscopic data for the selected CO2 line pair (from [40]).
2600 2800 3000 3200 3400 3600 38001.0
2.0
3.0
4.0
5.0
Frequency [cm-1]
Qex
t
Dm= 1.5 m Dm= 2.5m
v0
[cm-1]
E”[cm-1]
S(296K)
[cm-2/atm]
self(296K)
[cm-1/atm]
nself Ar(296K)
[cm-1/atm]
nAr
3633.08 316.77 6.13E-01 0.171 0.654 0.112 0.658
3645.56 1936.09 7.04E-04 0.130 0.695 0.091 0.694
32
3.3 Sensor Design
3.3.1 Line Selection
The selection of an optimum CO2 line pair was the first step in the TDL sensor
design. Two CO2 absorption transitions in the v1+v3 combination band were selected for
the WMS-2f/1f sensor under the conditions studied. The selected transitions R(28) and
P(70) have line-centers near 3633.08 cm-1 (E" = 316.77 cm-1) and 3645.56 cm-1 (E" =
1936.09 cm-1), respectively. The well-separated values for lower-state-energy E’’ enable
high temperature sensitivity in the range 600-1600 K. Spectroscopic parameters for the
two transitions have been measured previously in a heated static cell [40] and compared
to the HITRAN database [13]. Figure 3.1 depicts the simulated absorption spectra for 1%
CO2 in argon and the two lines selected, using the spectroscopic data in Table 3.1. These
simulations were performed with Voigt line-shape functions for typical shock tube
conditions: incident shock (T2 ~650 K, P2 ~0.5 atm) and reflected shock (T5 ~1200 K, P5
~1.0 atm).
3.3.2 Measurement Uncertainties
Gas temperature was determined by comparing the measured WMS-2f/1f signal
ratio to the simulation at the specified pressure and gas concentration. Note that the 2f
peak height ratio is not strictly a function of temperature alone, but also includes
contributions from pressure and gas composition through the line-shape function [48].
This signal variation was considered in evaluating measurement errors.
The influence of pressure variation on the 2f ratio is illustrated in Figure 3.3 for
representative reflected shock conditions. Although the 2f signal magnitude for each
individual line varies with the pressure, the 2f/1f ratio of the line pair is nearly
independent of pressure as shown in Figure 3.3(b). At 1200 K, a pressure change from
1.0 to 1.5 atm would result in 1% change in the peak ratio, corresponding to a
temperature change of only ~4 K (within 0.3%).
The influence of gas composition on the inferred temperature was also investigated.
For the non-reactive shock-heated CO2/Ar mixtures studied, the mole fraction of CO2
was known to be 2%. However, when fuel aerosol was also introduced, the CO2/Ar gas
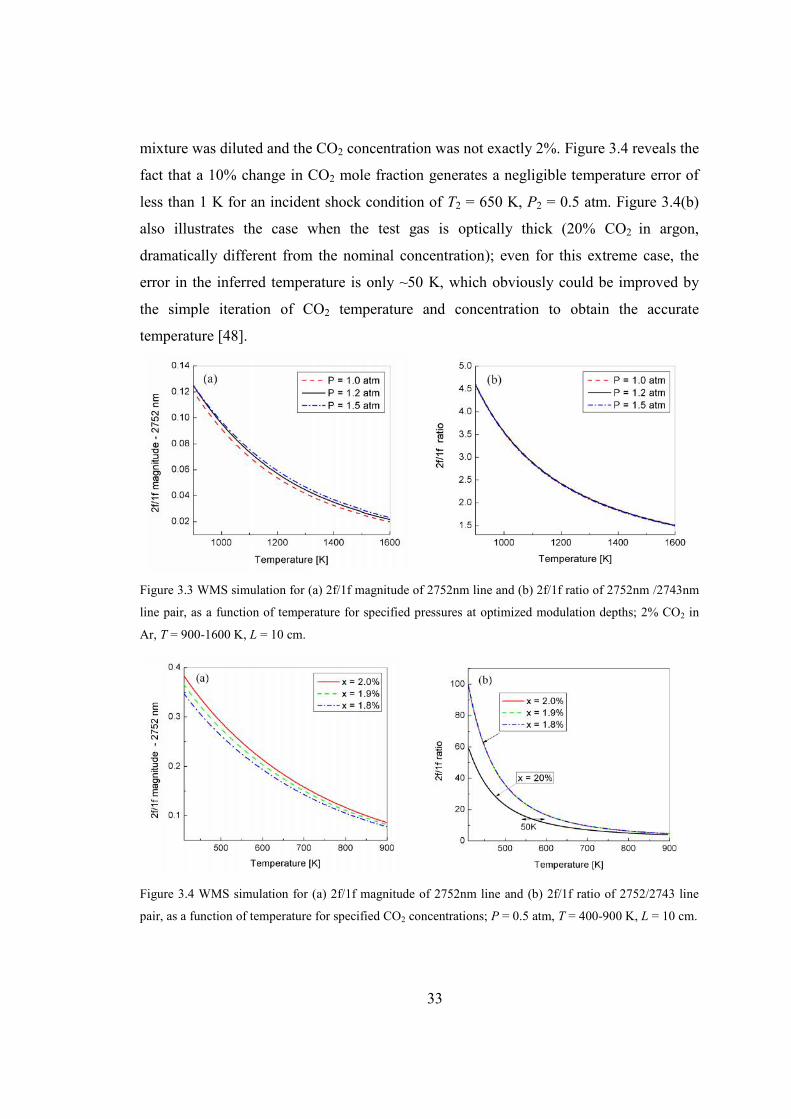
33
mixture was diluted and the CO2 concentration was not exactly 2%. Figure 3.4 reveals the
fact that a 10% change in CO2 mole fraction generates a negligible temperature error of
less than 1 K for an incident shock condition of T2 = 650 K, P2 = 0.5 atm. Figure 3.4(b)
also illustrates the case when the test gas is optically thick (20% CO2 in argon,
dramatically different from the nominal concentration); even for this extreme case, the
error in the inferred temperature is only ~50 K, which obviously could be improved by
the simple iteration of CO2 temperature and concentration to obtain the accurate
temperature [48].
Figure 3.3 WMS simulation for (a) 2f/1f magnitude of 2752nm line and (b) 2f/1f ratio of 2752nm /2743nm
line pair, as a function of temperature for specified pressures at optimized modulation depths; 2% CO2 in
Ar, T = 900-1600 K, L = 10 cm.
Figure 3.4 WMS simulation for (a) 2f/1f magnitude of 2752nm line and (b) 2f/1f ratio of 2752/2743 line
pair, as a function of temperature for specified CO2 concentrations; P = 0.5 atm, T = 400-900 K, L = 10 cm.

34
3.4 Temperature Measurement in CO2/Ar Gas
3.4.1 Experimental Setup
(a) Top view
(b) Side view
Figure 3.5 Shock tube experimental setup.
Experiments were first performed in a pressure-driven shock tube with a purely
gaseous system; see reference [49] for further details of the 14.1 cm diameter shock tube.
A schematic of the experimental setup for two-wavelength measurements on the shock
tube is described in Figure 3.5. Two diode lasers from Nanoplus were sinusoidally
modulated by 100 kHz digital waveforms, for the selected transitions R(28) near 3633.08
2752nm 2743n
m
Shock tube
Wave
meter
Laser
controllers
DA
Q
Detector
Pressure transducer
100kHz
2752 nm 2743 nm
Trigger
Filter
2 cm
70 cm
Different test locations for
incident and reflected shocks
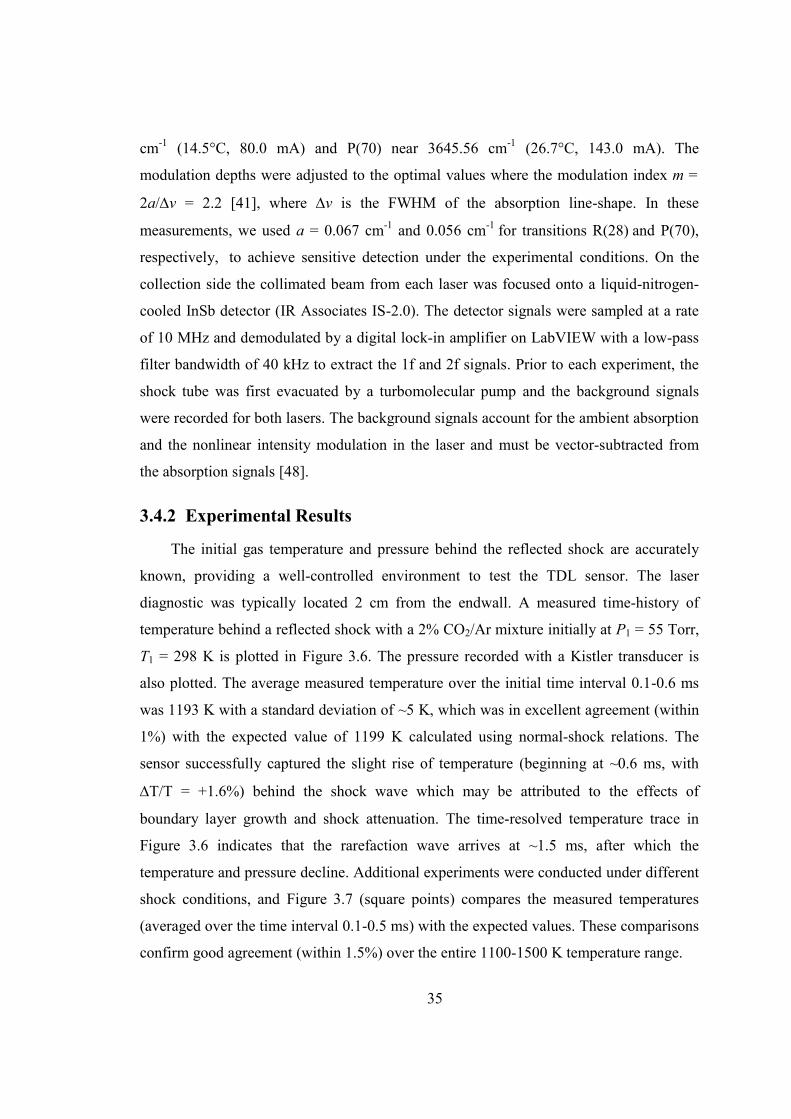
35
cm-1 (14.5°C, 80.0 mA) and P(70) near 3645.56 cm-1 (26.7°C, 143.0 mA). The
modulation depths were adjusted to the optimal values where the modulation index m =
2a/v = 2.2 [41], where v is the FWHM of the absorption line-shape. In these
measurements, we used a = 0.067 cm-1 and 0.056 cm-1 for transitions R(28) and P(70),
respectively, to achieve sensitive detection under the experimental conditions. On the
collection side the collimated beam from each laser was focused onto a liquid-nitrogen-
cooled InSb detector (IR Associates IS-2.0). The detector signals were sampled at a rate
of 10 MHz and demodulated by a digital lock-in amplifier on LabVIEW with a low-pass
filter bandwidth of 40 kHz to extract the 1f and 2f signals. Prior to each experiment, the
shock tube was first evacuated by a turbomolecular pump and the background signals
were recorded for both lasers. The background signals account for the ambient absorption
and the nonlinear intensity modulation in the laser and must be vector-subtracted from
the absorption signals [48].
3.4.2 Experimental Results
The initial gas temperature and pressure behind the reflected shock are accurately
known, providing a well-controlled environment to test the TDL sensor. The laser
diagnostic was typically located 2 cm from the endwall. A measured time-history of
temperature behind a reflected shock with a 2% CO2/Ar mixture initially at P1 = 55 Torr,
T1 = 298 K is plotted in Figure 3.6. The pressure recorded with a Kistler transducer is
also plotted. The average measured temperature over the initial time interval 0.1-0.6 ms
was 1193 K with a standard deviation of ~5 K, which was in excellent agreement (within
1%) with the expected value of 1199 K calculated using normal-shock relations. The
sensor successfully captured the slight rise of temperature (beginning at ~0.6 ms, with
T/T = +1.6%) behind the shock wave which may be attributed to the effects of
boundary layer growth and shock attenuation. The time-resolved temperature trace in
Figure 3.6 indicates that the rarefaction wave arrives at ~1.5 ms, after which the
temperature and pressure decline. Additional experiments were conducted under different
shock conditions, and Figure 3.7 (square points) compares the measured temperatures
(averaged over the time interval 0.1-0.5 ms) with the expected values. These comparisons
confirm good agreement (within 1.5%) over the entire 1100-1500 K temperature range.
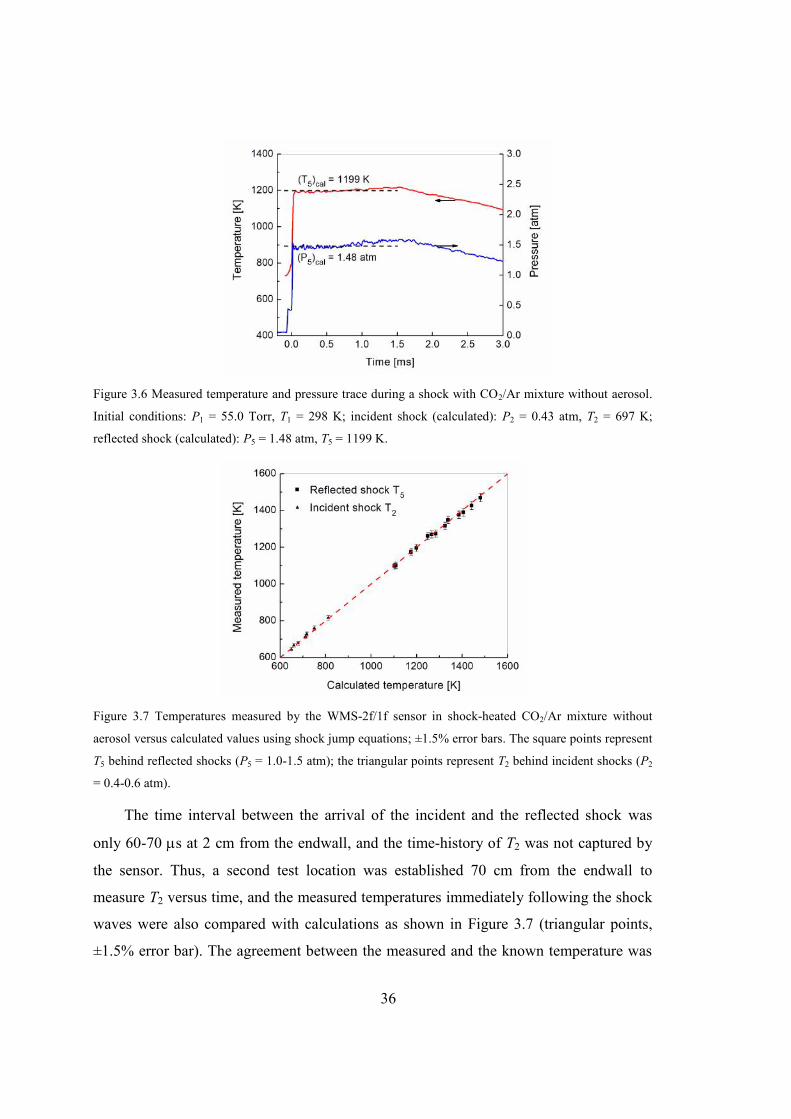
36
Figure 3.6 Measured temperature and pressure trace during a shock with CO2/Ar mixture without aerosol.
Initial conditions: P1 = 55.0 Torr, T1 = 298 K; incident shock (calculated): P2 = 0.43 atm, T2 = 697 K;
reflected shock (calculated): P5 = 1.48 atm, T5 = 1199 K.
Figure 3.7 Temperatures measured by the WMS-2f/1f sensor in shock-heated CO2/Ar mixture without
aerosol versus calculated values using shock jump equations; ±1.5% error bars. The square points represent
T5 behind reflected shocks (P5 = 1.0-1.5 atm); the triangular points represent T2 behind incident shocks (P2
= 0.4-0.6 atm).
The time interval between the arrival of the incident and the reflected shock was
only 60-70 s at 2 cm from the endwall, and the time-history of T2 was not captured by
the sensor. Thus, a second test location was established 70 cm from the endwall to
measure T2 versus time, and the measured temperatures immediately following the shock
waves were also compared with calculations as shown in Figure 3.7 (triangular points,
±1.5% error bar). The agreement between the measured and the known temperature was
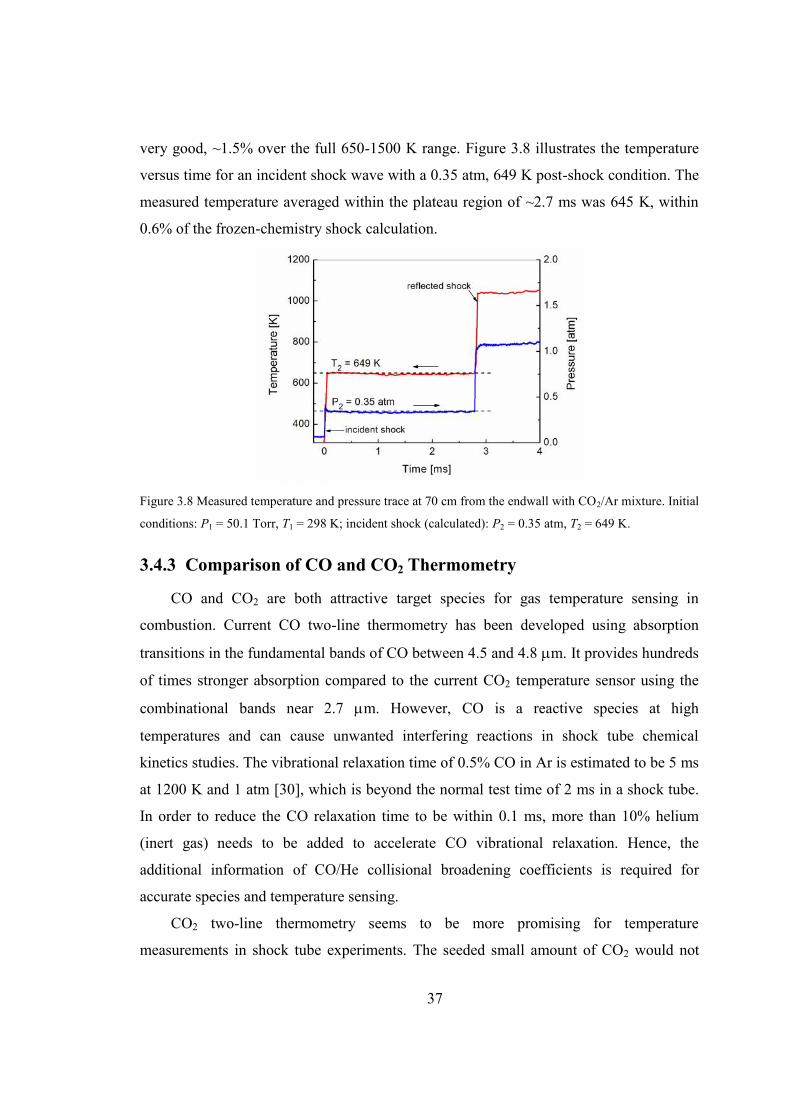
37
very good, ~1.5% over the full 650-1500 K range. Figure 3.8 illustrates the temperature
versus time for an incident shock wave with a 0.35 atm, 649 K post-shock condition. The
measured temperature averaged within the plateau region of ~2.7 ms was 645 K, within
0.6% of the frozen-chemistry shock calculation.
Figure 3.8 Measured temperature and pressure trace at 70 cm from the endwall with CO2/Ar mixture. Initial
conditions: P1 = 50.1 Torr, T1 = 298 K; incident shock (calculated): P2 = 0.35 atm, T2 = 649 K.
3.4.3 Comparison of CO and CO2 Thermometry
CO and CO2 are both attractive target species for gas temperature sensing in
combustion. Current CO two-line thermometry has been developed using absorption
transitions in the fundamental bands of CO between 4.5 and 4.8 m. It provides hundreds
of times stronger absorption compared to the current CO2 temperature sensor using the
combinational bands near 2.7 m. However, CO is a reactive species at high
temperatures and can cause unwanted interfering reactions in shock tube chemical
kinetics studies. The vibrational relaxation time of 0.5% CO in Ar is estimated to be 5 ms
at 1200 K and 1 atm [30], which is beyond the normal test time of 2 ms in a shock tube.
In order to reduce the CO relaxation time to be within 0.1 ms, more than 10% helium
(inert gas) needs to be added to accelerate CO vibrational relaxation. Hence, the
additional information of CO/He collisional broadening coefficients is required for
accurate species and temperature sensing.
CO2 two-line thermometry seems to be more promising for temperature
measurements in shock tube experiments. The seeded small amount of CO2 would not

38
significantly affect the chemical kinetics and the CO2 vibrational relaxation happens
within tens of microseconds behind reflected shock waves. In order to increase the CO2
detectivity, much stronger absorption transitions in the fundamental bands near 4.3 m
are suggested for future work.
3.5 Sensor Validation in a Aerosol Flow Cell
After the temperature sensor was validated for gas-phase measurement, we
investigated its performance in the presence of aerosol scattering. A series of
measurements with different aerosol loadings were made in a flow cell described in
Figure 3.9. The n-dodecane aerosol (approximately log-normal droplet size distribution
with median diameter of ~3 m) was produced by an ultrasonic nebulizer, entrained in a
flow of CO2/Ar mixture, and passed through the 5.8 cm path-length cell. Aerosol loading
was varied by altering the flow rate over the nebulizer, and the pressure inside the cell
was monitored by a pressure transducer and maintained at 1 atm during the measurement.
Since the aerosol loading is proportional to the droplet extinction coefficient v [46], we
use off-line extinction to indicate the level of aerosol loading, by tuning the laser
wavelength off the CO2 absorption transition.
Figure 3.9 Aerosol flow cell experimental setup.
The P(70) transition near 3645.56 cm-1 (E’’ = 1936.09 cm-1) was too weak to be
detected in the flow cell designed for experiments at room temperature. Therefore, only
the individual line R(28) of the line pair was studied to demonstrate that the WMS-2f/1f
signal with droplets present in the gas flow was the same as that in the gas-phase mixture.
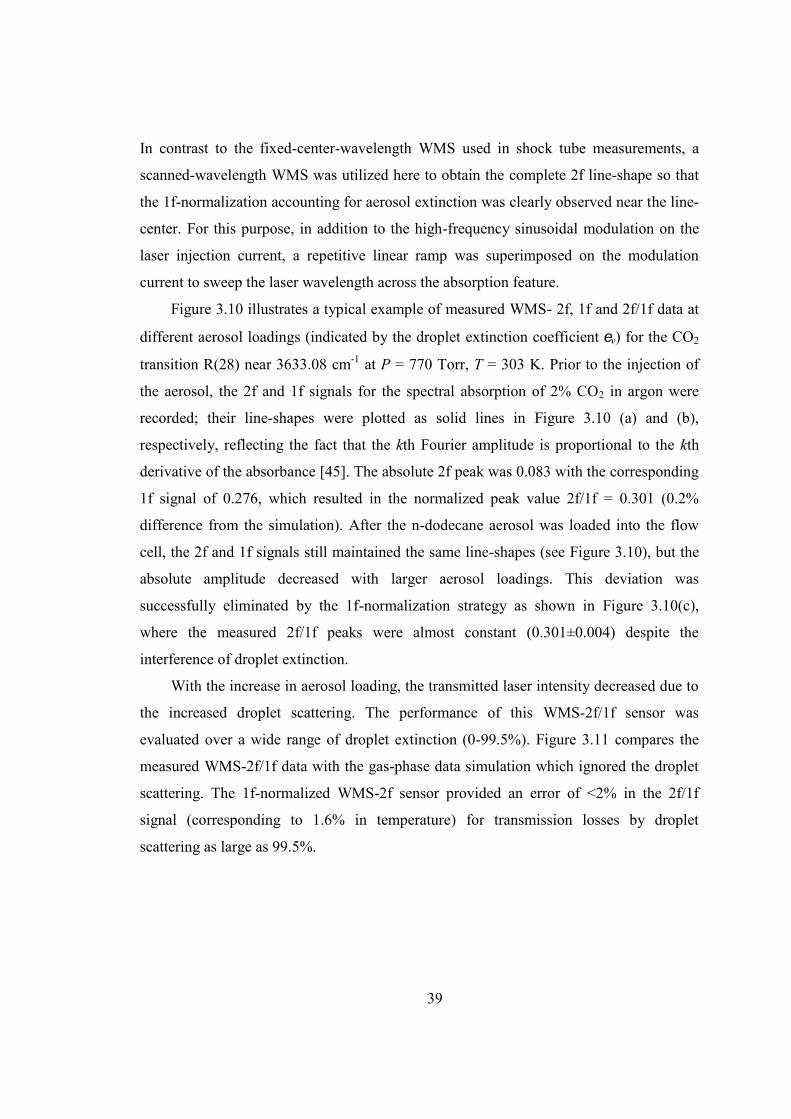
39
In contrast to the fixed-center-wavelength WMS used in shock tube measurements, a
scanned-wavelength WMS was utilized here to obtain the complete 2f line-shape so that
the 1f-normalization accounting for aerosol extinction was clearly observed near the line-
center. For this purpose, in addition to the high-frequency sinusoidal modulation on the
laser injection current, a repetitive linear ramp was superimposed on the modulation
current to sweep the laser wavelength across the absorption feature.
Figure 3.10 illustrates a typical example of measured WMS- 2f, 1f and 2f/1f data at
different aerosol loadings (indicated by the droplet extinction coefficient v) for the CO2
transition R(28) near 3633.08 cm-1 at P = 770 Torr, T = 303 K. Prior to the injection of
the aerosol, the 2f and 1f signals for the spectral absorption of 2% CO2 in argon were
recorded; their line-shapes were plotted as solid lines in Figure 3.10 (a) and (b),
respectively, reflecting the fact that the kth Fourier amplitude is proportional to the kth
derivative of the absorbance [45]. The absolute 2f peak was 0.083 with the corresponding
1f signal of 0.276, which resulted in the normalized peak value 2f/1f = 0.301 (0.2%
difference from the simulation). After the n-dodecane aerosol was loaded into the flow
cell, the 2f and 1f signals still maintained the same line-shapes (see Figure 3.10), but the
absolute amplitude decreased with larger aerosol loadings. This deviation was
successfully eliminated by the 1f-normalization strategy as shown in Figure 3.10(c),
where the measured 2f/1f peaks were almost constant (0.301±0.004) despite the
interference of droplet extinction.
With the increase in aerosol loading, the transmitted laser intensity decreased due to
the increased droplet scattering. The performance of this WMS-2f/1f sensor was
evaluated over a wide range of droplet extinction (0-99.5%). Figure 3.11 compares the
measured WMS-2f/1f data with the gas-phase data simulation which ignored the droplet
scattering. The 1f-normalized WMS-2f sensor provided an error of <2% in the 2f/1f
signal (corresponding to 1.6% in temperature) for transmission losses by droplet
scattering as large as 99.5%.
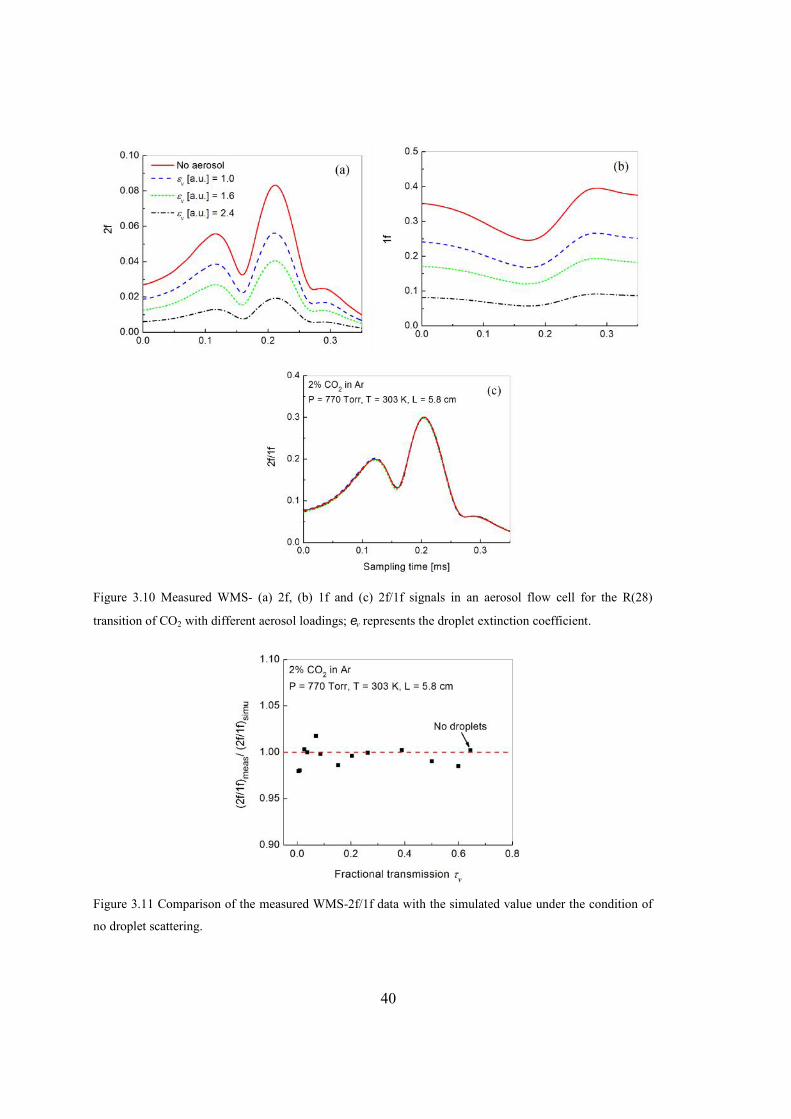
40
Figure 3.10 Measured WMS- (a) 2f, (b) 1f and (c) 2f/1f signals in an aerosol flow cell for the R(28)
transition of CO2 with different aerosol loadings; v represents the droplet extinction coefficient.
Figure 3.11 Comparison of the measured WMS-2f/1f data with the simulated value under the condition of
no droplet scattering.

41
3.6 Temperature Measurement in Shock-Heated Aerosol
Next, the sensor was demonstrated for accurate temperature measurements in the
aerosol shock tube. This facility was developed in our laboratory to conduct studies of
droplet evaporation kinetics and subsequent chemical reactions of the fuel vapor [38].
The gas/aerosol mixture was prepared in a separate holding tank and then carefully drawn
into the shock tube (with an inner diameter of 10 cm) by a slightly under-pressure dump
tank. The aerosol was rapidly evaporated by the incident shock-heating, and the resulting
vapor-phase mixture was shock-heated a second time by the reflected shock wave. In the
present experiments, the incident shock heated the aerosol in the test gas mixture to 520-
700 K, vaporizing the fuel droplets, and the WMS-2f/1f sensor was used to capture the
transient temperature variation during droplet evaporation.
As discussed in Section 3.4.1, all of the experimental procedures were nearly
identical, except for the fact that the micron-sized aerosol of n-dodecane liquids was
produced by a nebulizer and mixed with the CO2/Ar test gas. The test location was set at
10 cm from the endwall to obtain adequate test time to observe evaporation behind the
incident shock as well as to obtain an accurate estimation of the temperature behind the
reflected shock.
Figure 3.12 Measured temperature for an incident shock-heated aerosol with the WMS-2f/1f sensor located
at 10 cm from the endwall: (P2)w/o evap = 0.50 atm, (T2)w/o evap = 558 K; (P2)post evap = 0.54 atm, (T2)post evap =
528 K; P5 = 1.79 atm, T5 = 796 K. A non-resonant 660 nm laser is used to indicate the droplet scattering.
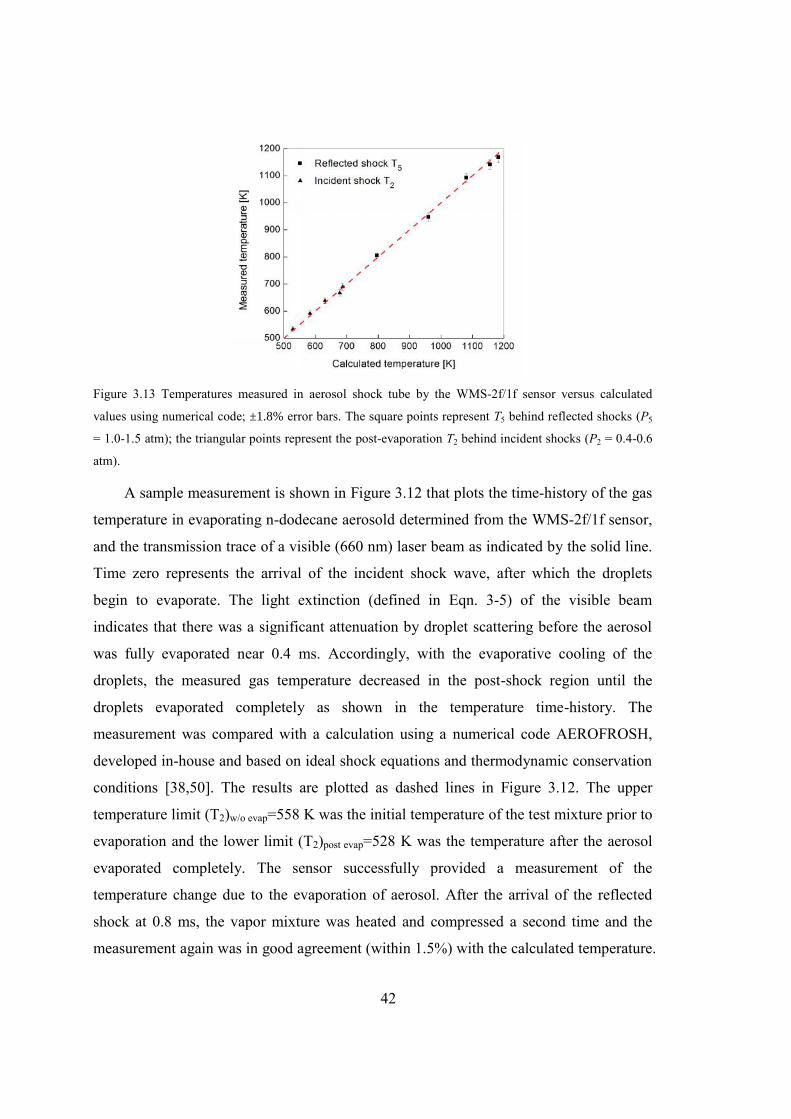
42
Figure 3.13 Temperatures measured in aerosol shock tube by the WMS-2f/1f sensor versus calculated
values using numerical code; ±1.8% error bars. The square points represent T5 behind reflected shocks (P5
= 1.0-1.5 atm); the triangular points represent the post-evaporation T2 behind incident shocks (P2 = 0.4-0.6
atm).
A sample measurement is shown in Figure 3.12 that plots the time-history of the gas
temperature in evaporating n-dodecane aerosold determined from the WMS-2f/1f sensor,
and the transmission trace of a visible (660 nm) laser beam as indicated by the solid line.
Time zero represents the arrival of the incident shock wave, after which the droplets
begin to evaporate. The light extinction (defined in Eqn. 3-5) of the visible beam
indicates that there was a significant attenuation by droplet scattering before the aerosol
was fully evaporated near 0.4 ms. Accordingly, with the evaporative cooling of the
droplets, the measured gas temperature decreased in the post-shock region until the
droplets evaporated completely as shown in the temperature time-history. The
measurement was compared with a calculation using a numerical code AEROFROSH,
developed in-house and based on ideal shock equations and thermodynamic conservation
conditions [38,50]. The results are plotted as dashed lines in Figure 3.12. The upper
temperature limit (T2)w/o evap=558 K was the initial temperature of the test mixture prior to
evaporation and the lower limit (T2)post evap=528 K was the temperature after the aerosol
evaporated completely. The sensor successfully provided a measurement of the
temperature change due to the evaporation of aerosol. After the arrival of the reflected
shock at 0.8 ms, the vapor mixture was heated and compressed a second time and the
measurement again was in good agreement (within 1.5%) with the calculated temperature.
43
Similar measurements were repeated with different shock conditions, as illustrated in
Figure 3.13, and the measured temperatures were within 1.8% of the calculated values
over the 520-1200 K range.
Calculations of the gas pressure and temperature behind shock waves assumed
vibrational equilibrium. Vibrational relaxation in the lower energy levels of CO2 occurs
rapidly behind these shock waves in CO2/Ar hydrocarbon mixtures; in fact, measured
vibrational relaxation time under our experimental conditions have been shown to be less
than 20 s [51]. It is possible that the cold boundary layers at each shock tube wall may
influence the path-integrated temperature along the beam path, causing measurement
uncertainties. We estimated the maximum possible thickness of the boundary layer at ~1
mm at the typical pressure and temperature in this work [52]. Assuming a 2 mm path in a
cold boundary at 300 K, we calculated the change in the absorbance ratio to be <1%,
implying a maximum temperature uncertainty of 3 K for T2 = 600 K and 3.9 K for T5 =
1000 K. Thus, the boundary layers are expected to have a negligible impact on
temperature measurements in the current shock tube, and the measured temperature time-
histories accurately describe the core flow behavior.

44
45
Chapter 4. Thermal Decomposition of
Methanol and Methyl Formate
4.1 Introduction
Alcohol fuels are recognized as promising renewable energy resources and are also
used as additives in gasoline to reduce the formation of poly-aromatic hydrocarbon
compounds, particulates, and soot [53,54]. Combustion studies of methanol, which shares
many chemical kinetic characteristics with higher alcohols, can shed light on the
combustion chemistry of alcohols in general.
Biodiesel, typically derived from a variety of vegetable oils, animal fats, and algae, is
one of the sustainable alternatives to fossil fuels [54,55]. It is an oxygenated, diesel-like
fuel consisting primarily of fatty acid methyl esters (FAMEs). Methyl formate (MF,
CH3OCHO) is the simplest methyl ester, and its study assists in understanding the effects
of oxygenated chemical structure that are characteristic of biodiesel fuels on reactivity
and pollutant formation. A fundamental study of MF kinetics is thus of immediate
interest to fuel modelers. Equally important, the reactions of methanol and methyl
formate comprise important and fundamental subsets of detailed hydrocarbon combustion
mechanisms [56,57]. Therefore, a thorough understanding of the combustion chemistry
of these basic fuels is relevant for constructing kinetic models of larger oxygenated and
hydrocarbon fuels.
Experimental investigations providing species time-history data describing methanol
and methyl formate combustion chemistry are particularly needed. Laser absorption
diagnostics, due to their fast time response and non-intrusive, in situ capability, are being
utilized increasingly in chemical kinetic studies [5], and can be used to directly measure
46
species concentration time-histories in shock tube experiments. These species data are
critically important to efforts aimed at validating large reaction mechanisms and refining
their component sub-mechanisms. The main purpose of this work is to improve
understanding of the pyrolysis of methanol and methyl formate through multiple species
time-history measurements and to identify areas within the kinetic models where
improvements are necessary.
4.2 Experimental
All experiments were performed in the same shock tube with a 15.24 cm inner
diameter as discussed before. Between experiments, the shock tube driven section and
mixing manifold were turbo-pumped at least 30 minutes, down to ~6 torr to remove
residual impurities. Research grade high-purity argon (99.999% pure, Praxair Inc.) was
used without further purification. Methanol and methyl formate (>99% pure, Sigma-
Aldrich) were frozen and degassed three times to remove dissolved volatiles before
making the mixtures. All the test mixtures were manometrically prepared in a stainless-
steel mixing tank (40 L) heated uniformly to 50°C with an internal magnetically driven
stirrer. Laser absorption and side-wall pressure measurements (Kistler 601B1 PZT) were
located 2 cm from the shock tube end wall. In this study, two laser absorption diagnostics
are utilized for accurate, time-resolved measurements of CH3OH and CO concentration
time-histories.
4.2.1 QC Laser Absorption of CO at 4.56 m
Absorption measurements of CO were made using the same quantum cascade laser
(QCL) as introduced in Chapter 2. A fixed-wavelength direct-absorption strategy was
employed in the present study to monitor the peak intensity of the R(13) absorption line
at 2193.36 cm-1. The spectroscopic parameters for the R(13) transition, including the line-
strength and self-broadening coefficient, were taken directly from the HITRAN database.
The collisional broadening coefficient for CO with argon (not available in HITRAN) was
measured in shock tube experiments over the temperature range of 1000–1800 K; results
can be found in Chapter 2.
47
4.2.2 CO2 Laser Absorption of Methanol and Methyl Formate
Methanol is monitored in shock tube experiments using continuous wave (cw) CO2
laser absorption at 9.676 m (1033.5 cm-1). This absorption diagnostic takes advantage of
the strong overlap of the P34 CO2 laser line, associated with the (0 0 1) to (0 2 0)
vibrational transition, with the strong Q-branch of the v8 methanol band [58]. We utilized
a grating-tuned CO2 gas laser (Model Lasy-4G, Access Laser Co.) with ~100 mW output;
a schematic of the typical shock tube experimental setup is described in Appendix A. The
methanol cross-section data were measured at 665-1014 K and 0.4-0.8 atm behind the
incident shock waves and at 1126-1940 K and 1.4-2.7 atm behind the reflected shock
waves; see Appendix A for details of the diagnostic scheme.
Methanol is one of the main products during MF decomposition, but interfering
absorption from MF at the early times exists at this wavelength. To separate these two
signals, absorption measurements were made at two different wavelengths, 9.67 m and
9.23 m, in repeated shock wave experiments at near-identical conditions. With separate
calibrations of the different absorption cross-sections for the two species at the two
wavelengths, the time histories for both MF and methanol can be inferred from the two
measured absorbance time-histories; see Appendix A. Uncertainties in the absolute
methanol or methyl formate concentration are typically 5%, dominated by uncertainties
in the absorption cross-section measurements.
4.3 High-Temperature Methanol Pyrolysis
All the exact experimental conditions are summarized in Table 4.1. Methanol
pyrolysis was studied behind reflected shock waves using methanol and CO absorption
diagnostics at 9.676 m and 4.56 m, respectively. Figure 4.1 compares measured
methanol and CO concentration time-histories at different temperatures with those
predicted from the Li et al. [17] mechanism under the standard constant energy (U) and
volume (V) constraints using CHEMKIN PRO [34] software package. Here we have
chosen the Li et al. [17] mechanism as the base mechanism in the following analysis,
which is a detailed kinetic model optimized for methanol combustion.

48
Table 4.1 Summary of current methanol and methyl formate pyrolysis experiments.
Methanol PyrolysisXmethanol = 1% Xmethanol = 0.2%
T5 (K) P5 (atm) T5 (K) P5 (atm)1266 2.5 1403 1.21368 2.4 1507 1.11458 2.3 1623 1.11567 2.1 1707 1.31610 2.2
Methyl Formate PyrolysisXmethyl formate = 1% Xmethyl formate = 0.1%
T5 (K) P5 (atm) T5 (K) P5 (atm)1261 1.5 1488 1.51327 1.5 1548 1.51524 1.4 1607 1.5
(a) (b)
Figure 4.1 Measured (solid lines) and simulated (dashed lines) methanol and CO concentration time-
histories during the pyrolysis of methanol (time-zero: arrival of the reflected shock wave). Simulations used
the Princeton model (Li et al. [17]).
As shown in Figure 4.1(a), the simulated profiles from the model consistently
underpredict the methanol removal rates over the entire temperature range of the current
experiments, e.g., at 1 ms, the predicted methanol at 1458 K is 53% higher than that
measured. Similar underpredictions are observed in the CO concentration profiles shown
in Figure 4.1(b), which were measured during the pyrolysis of 0.2% methanol/Ar at
temperatures between 1403 and 1707 K and pressures between 1.1 and 1.4 atm. At 1 ms,
the Li et al. [17] mechanism underpredicted the CO concentration by 47% at 1507 K.
Separate experiments (for methanol and CO time-histories) were made using
different fuel concentrations in order to obtain high signal-to-noise ratio or to prevent
49
undesirably strong absorbance. In Figure 4.1, the methanol time-history data were
obtained using a 1% methanol/Ar mixture. Due to the endothermic nature of the
decomposition reaction, there is a small temperature drop in the reacting system,
perturbing the absorption cross-section coefficient methanol with time. By taking this
effect into account instead of assuming a constant methanol evaluated at the initial
temperature, more accurate species concentration time-histories are obtained. In this
study, the temperature profiles were calculated using the Li et al. [17] mechanism under
either constant enthalpy (H) and pressure (P) or constant energy (U) and volume (V). A
sample evaluation of methanol mole fraction time-history for 1% methanol/Ar mixture
initially at 1567 K and 2.1 atm was performed using three different approaches: constant
methanol (1567 K, 2.1 atm), T-dependent methanol based on constant (H, P) gasdynamic
model, and T-dependent methanol based on constant (U, V) gasdynamic model. As
demonstrated in Figure 4.2, the difference among these three calculated methanol
concentration time-histories is negligible; hereafter the constant methanol model, based on
the initial pressure and temperature behind the reflected shock is always employed for
methanol mole fraction conversion.
Among all contributing factors to the uncertainty in the experimental measurements,
the uncertainty in the post-shock temperature T5 most strongly affects the precision of the
measurements. Figure 4.3 illustrates the nominal predictions of methanol and CO
concentration profiles using the Li et al. [17] mechanism. The long-dashed lines
designate calculations at the nominal temperature of the experiments, whereas the short-
dashed lines represent those calculated with ±15 K uncertainty (1% uncertainty in T5).
The temperature uncertainty propagates to an uncertainty in species concentration
especially at the later times; i.e. at 1 ms, a 13% difference for methanol concentration and
20% for CO. It is also immediately clear from the comparisons in Figure 4.3 that the
model and experimental data cannot be reconciled through solely changing the simulated
T5 within its uncertainty bounds. Further discussion on uncertainty analysis of shock tube
datasets, which are shown to be a strong constraint on the kinetic model parameters, can
be found in [59].
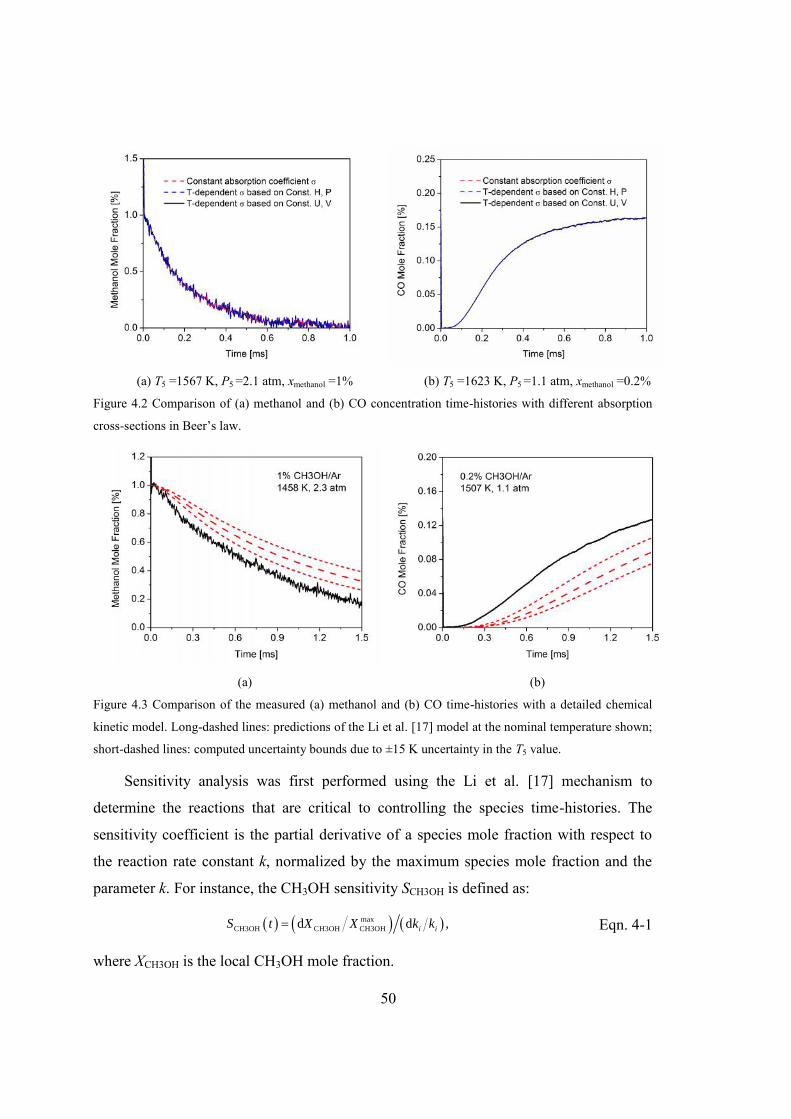
50
(a) T5 =1567 K, P5 =2.1 atm, xmethanol =1% (b) T5 =1623 K, P5 =1.1 atm, xmethanol =0.2%
Figure 4.2 Comparison of (a) methanol and (b) CO concentration time-histories with different absorption
cross-sections in Beer’s law.
(a) (b)
Figure 4.3 Comparison of the measured (a) methanol and (b) CO time-histories with a detailed chemical
kinetic model. Long-dashed lines: predictions of the Li et al. [17] model at the nominal temperature shown;
short-dashed lines: computed uncertainty bounds due to ±15 K uncertainty in the T5 value.
Sensitivity analysis was first performed using the Li et al. [17] mechanism to
determine the reactions that are critical to controlling the species time-histories. The
sensitivity coefficient is the partial derivative of a species mole fraction with respect to
the reaction rate constant k, normalized by the maximum species mole fraction and the
parameter k. For instance, the CH3OH sensitivity SCH3OH is defined as:
maxCH3OH CH3OH CH3OHd d ,i iS t X X k k Eqn. 4-1
where XCH3OH is the local CH3OH mole fraction.
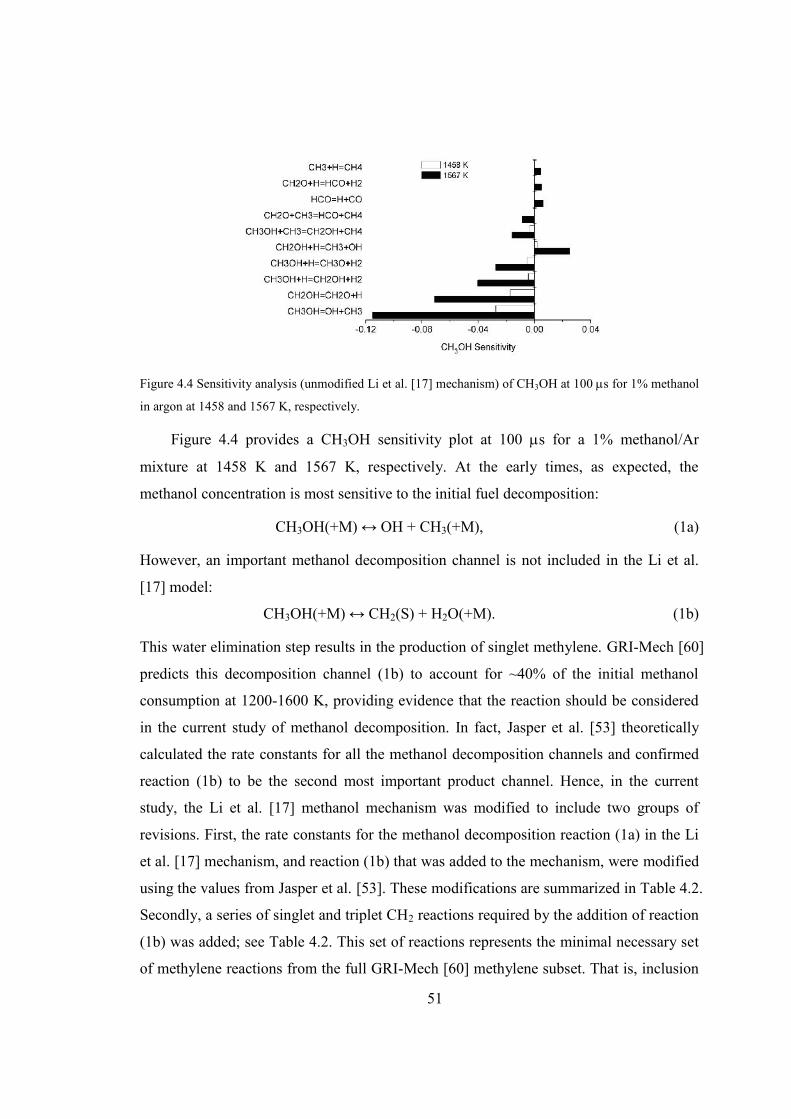
51
Figure 4.4 Sensitivity analysis (unmodified Li et al. [17] mechanism) of CH3OH at 100 s for 1% methanol
in argon at 1458 and 1567 K, respectively.
Figure 4.4 provides a CH3OH sensitivity plot at 100 s for a 1% methanol/Ar
mixture at 1458 K and 1567 K, respectively. At the early times, as expected, the
methanol concentration is most sensitive to the initial fuel decomposition:
CH3OH(+M) ↔ OH + CH3(+M), (1a)
However, an important methanol decomposition channel is not included in the Li et al.
[17] model:
CH3OH(+M) ↔ CH2(S) + H2O(+M). (1b)
This water elimination step results in the production of singlet methylene. GRI-Mech [60]
predicts this decomposition channel (1b) to account for ~40% of the initial methanol
consumption at 1200-1600 K, providing evidence that the reaction should be considered
in the current study of methanol decomposition. In fact, Jasper et al. [53] theoretically
calculated the rate constants for all the methanol decomposition channels and confirmed
reaction (1b) to be the second most important product channel. Hence, in the current
study, the Li et al. [17] methanol mechanism was modified to include two groups of
revisions. First, the rate constants for the methanol decomposition reaction (1a) in the Li
et al. [17] mechanism, and reaction (1b) that was added to the mechanism, were modified
using the values from Jasper et al. [53]. These modifications are summarized in Table 4.2.
Secondly, a series of singlet and triplet CH2 reactions required by the addition of reaction
(1b) was added; see Table 4.2. This set of reactions represents the minimal necessary set
of methylene reactions from the full GRI-Mech [60] methylene subset. That is, inclusion
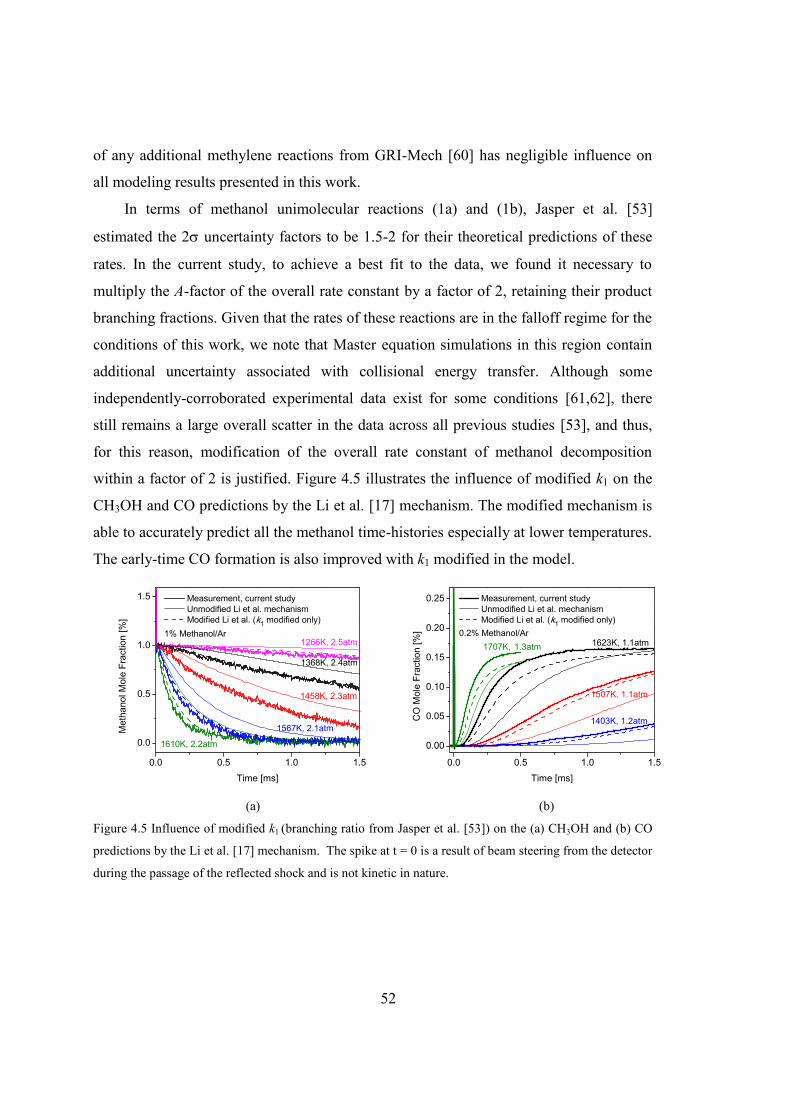
52
of any additional methylene reactions from GRI-Mech [60] has negligible influence on
all modeling results presented in this work.
In terms of methanol unimolecular reactions (1a) and (1b), Jasper et al. [53]
estimated the 2 uncertainty factors to be 1.5-2 for their theoretical predictions of these
rates. In the current study, to achieve a best fit to the data, we found it necessary to
multiply the A-factor of the overall rate constant by a factor of 2, retaining their product
branching fractions. Given that the rates of these reactions are in the falloff regime for the
conditions of this work, we note that Master equation simulations in this region contain
additional uncertainty associated with collisional energy transfer. Although some
independently-corroborated experimental data exist for some conditions [61,62], there
still remains a large overall scatter in the data across all previous studies [53], and thus,
for this reason, modification of the overall rate constant of methanol decomposition
within a factor of 2 is justified. Figure 4.5 illustrates the influence of modified k1 on the
CH3OH and CO predictions by the Li et al. [17] mechanism. The modified mechanism is
able to accurately predict all the methanol time-histories especially at lower temperatures.
The early-time CO formation is also improved with k1 modified in the model.
0.0 0.5 1.0 1.5
0.0
0.5
1.0
1.5
1% Methanol/Ar
Measurement, current study Unmodified Li et al. mechanism Modified Li et al. (k1 modified only)
1610K, 2.2atm
1567K, 2.1atm
1368K, 2.4atm
1458K, 2.3atm
Time [ms]
Met
hano
l Mol
e Fr
actio
n [%
]
1266K, 2.5atm
(a)
0.0 0.5 1.0 1.5
0.00
0.05
0.10
0.15
0.20
0.25
0.2% Methanol/Ar
1403K, 1.2atm
1507K, 1.1atm
1707K, 1.3atm
Time [ms]
1623K, 1.1atm
CO
Mol
e Fr
actio
n [%
]
Measurement, current study Unmodified Li et al. mechanism Modified Li et al. (k1 modified only)
(b)
Figure 4.5 Influence of modified k1 (branching ratio from Jasper et al. [53]) on the (a) CH3OH and (b) CO
predictions by the Li et al. [17] mechanism. The spike at t = 0 is a result of beam steering from the detector
during the passage of the reflected shock and is not kinetic in nature.
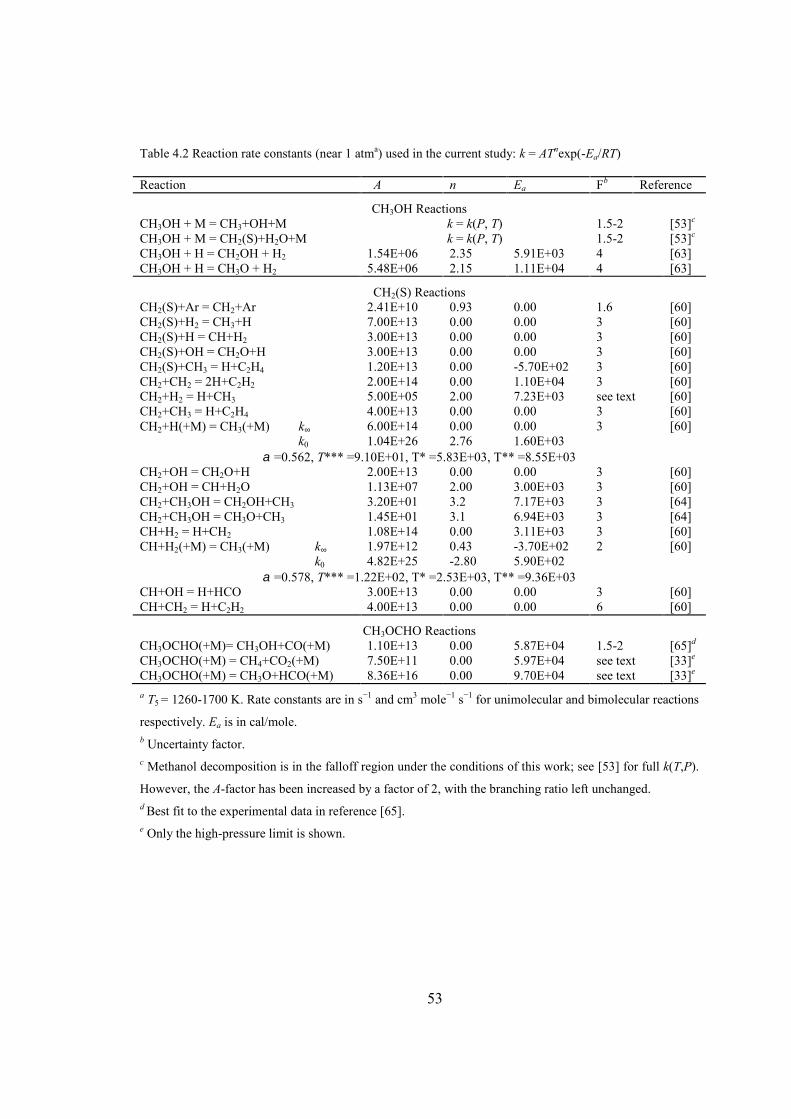
53
Table 4.2 Reaction rate constants (near 1 atma) used in the current study: k = ATnexp(-Ea/RT)
Reaction A n Ea Fb Reference
CH3OH ReactionsCH3OH + M = CH3+OH+M k = k(P, T) 1.5-2 [53]c
CH3OH + M = CH2(S)+H2O+M k = k(P, T) 1.5-2 [53]c
CH3OH + H = CH2OH + H2 1.54E+06 2.35 5.91E+03 4 [63]CH3OH + H = CH3O + H2 5.48E+06 2.15 1.11E+04 4 [63]
CH2(S) ReactionsCH2(S)+Ar = CH2+Ar 2.41E+10 0.93 0.00 1.6 [60]CH2(S)+H2 = CH3+H 7.00E+13 0.00 0.00 3 [60]CH2(S)+H = CH+H2 3.00E+13 0.00 0.00 3 [60]CH2(S)+OH = CH2O+H 3.00E+13 0.00 0.00 3 [60]CH2(S)+CH3 = H+C2H4 1.20E+13 0.00 -5.70E+02 3 [60]CH2+CH2 = 2H+C2H2 2.00E+14 0.00 1.10E+04 3 [60]CH2+H2 = H+CH3 5.00E+05 2.00 7.23E+03 see text [60]CH2+CH3 = H+C2H4 4.00E+13 0.00 0.00 3 [60]CH2+H(+M) = CH3(+M) k∞
k0
6.00E+141.04E+26
0.002.76
0.001.60E+03
3 [60]
=0.562, T*** =9.10E+01, T* =5.83E+03, T** =8.55E+03CH2+OH = CH2O+H 2.00E+13 0.00 0.00 3 [60]CH2+OH = CH+H2O 1.13E+07 2.00 3.00E+03 3 [60]CH2+CH3OH = CH2OH+CH3 3.20E+01 3.2 7.17E+03 3 [64]CH2+CH3OH = CH3O+CH3 1.45E+01 3.1 6.94E+03 3 [64]CH+H2 = H+CH2 1.08E+14 0.00 3.11E+03 3 [60]CH+H2(+M) = CH3(+M) k∞
k0
1.97E+124.82E+25
0.43-2.80
-3.70E+025.90E+02
2 [60]
=0.578, T*** =1.22E+02, T* =2.53E+03, T** =9.36E+03CH+OH = H+HCO 3.00E+13 0.00 0.00 3 [60]CH+CH2 = H+C2H2 4.00E+13 0.00 0.00 6 [60]
CH3OCHO ReactionsCH3OCHO(+M)= CH3OH+CO(+M) 1.10E+13 0.00 5.87E+04 1.5-2 [65]d
CH3OCHO(+M) = CH4+CO2(+M) 7.50E+11 0.00 5.97E+04 see text [33]e
CH3OCHO(+M) = CH3O+HCO(+M) 8.36E+16 0.00 9.70E+04 see text [33]e
a T5 = 1260-1700 K. Rate constants are in s−1 and cm3 mole−1 s−1 for unimolecular and bimolecular reactions
respectively. Ea is in cal/mole.b Uncertainty factor.c Methanol decomposition is in the falloff region under the conditions of this work; see [53] for full k(T,P).
However, the A-factor has been increased by a factor of 2, with the branching ratio left unchanged.d Best fit to the experimental data in reference [65].e Only the high-pressure limit is shown.

54
Figure 4.6 Flux analysis of methanol pyrolysis at 800 s for 0.2% CH3OH/Ar at 1623 K and 1.1 atm.
However, as shown in Figure 4.5(b), the modified Li et al. [17] mechanism (k1
modified only) still underpredicts the CO concentration time-histories, especially at
higher temperatures. In addition, the final CO plateau (see the case at 1623 K) is about 5%
lower than the measurement and the unmodified Li et al. [17] mechanism. Flux analysis
shown in Figure 4.6 reveals that most methanol (>80%) is consumed through H-
abstraction reactions by atomic hydrogen:
CH3OH + H ↔ CH2OH + H2, (2a)
↔ CH3O + H2, (2b)
where k2a is the dominant reaction. The oxygen atoms in reaction (2a) and (2b) finally
form CO primarily through subsequent H-abstraction reactions. With methanol
unimolecular decomposition rate constants modified in the Li et al. [17] mechanism,
more oxygen atoms go on to form H2O since channel (1b) forms H2O directly and
channel (1a) produces the OH radical, which subsequently consumes methanol to
produce H2O through H-abstraction reactions. Therefore, we conclude that the H-
abstraction reactions of methanol by atomic hydrogen in the Li et al. [17] mechanism
may need revision to achieve accurate CO production.
In the Li et al. [17] mechanism, the overall rate constant k2 used the value
recommended by Warnatz [66], which is a factor of 2.6-5 times lower than that in GRI-
Mech [60] over the temperature range of 1200-1800 K. Meana-Pañeda et al. [63] recently
performed direct-dynamics variational transition state theory calculations of CH3OH+H

55
reactions using the microcanonically optimized multidimensional tunneling transmission
coefficient, showing good agreement with the theoretical study by Jodkowski et al. [67].
These studies of the rate constant k2 and the corresponding branching ratio are plotted in
Figure 4.7 for comparison. At temperatures between 1200 and 1800 K, a temperature-
dependent branching ratio (0.84-0.91) is recommended by Meana-Pañeda et al. [63]
instead of the constant value of 0.8 used in the Li et al. [17] mechanism and GRI-Mech
[60]. Therefore, we modified k2 in the Li et al. [17] mechanism using the values
calculated by Meana-Pañeda et al. [63], with recognition that the uncertainty for this
reaction remains high (F = 4 at 2500 K for both 2a and 2b) because neither uncertainty
analysis nor estimation was performed by the authors. Furthermore, there remains a large
spread between many rate determinations under the temperature range of this study.
Specifically, the discrepancies between the data of Cribb et al 1992 [68] and Vandooren
et al. 1981 [69] were not critically reviewed or discussed. Thus, the assigned uncertainty
here reflects that recommended by Baulch at 2500 K [70]. The uncertainty in the
branching ratio, however, is smaller than the absolute overall rate constant and likely less
than 15% of the temperature-dependent values computed by Meana-Paneda et al. [63].
Figure 4.7 Reaction rate constants of CH3OH+H (k2) and branching ratio.
The complete revisions to the Li et al. [17] mechanism, including the revisions
associated with the methanol decomposition reactions (k1) and the H-abstraction reactions
(k2), are shown in Table 4.2. Figure 4.8 compares the measured CH3OH and CO time-
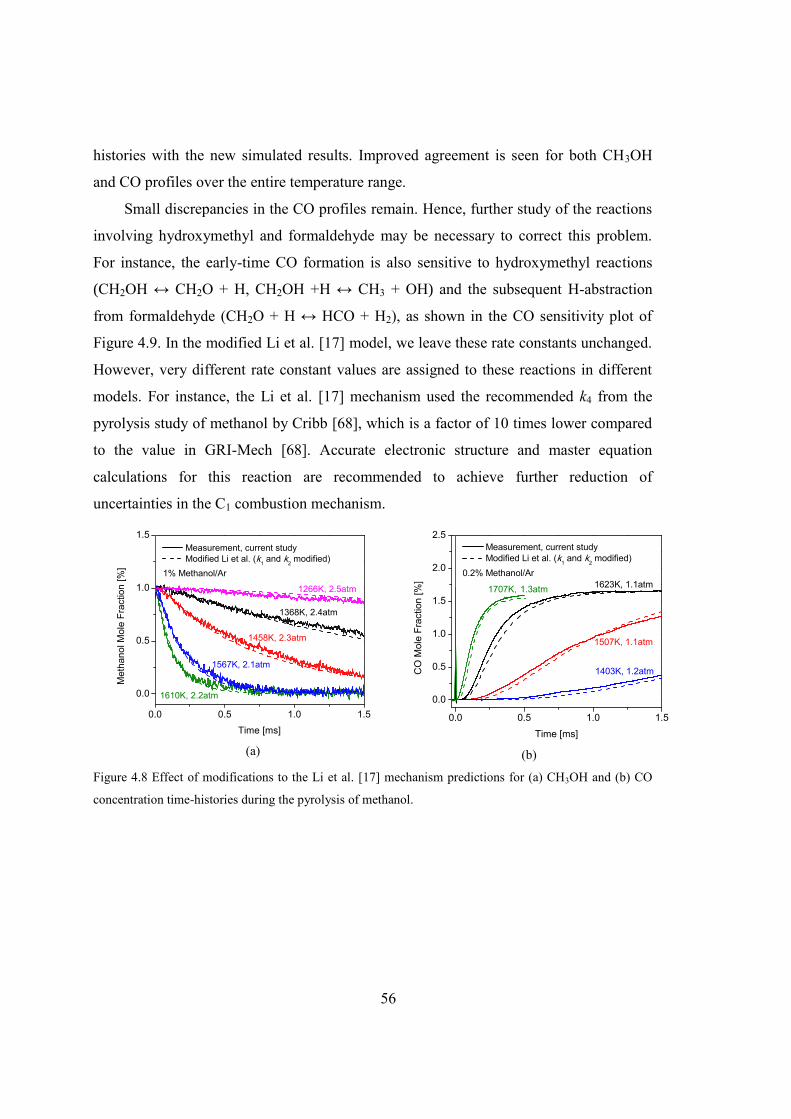
56
histories with the new simulated results. Improved agreement is seen for both CH3OH
and CO profiles over the entire temperature range.
Small discrepancies in the CO profiles remain. Hence, further study of the reactions
involving hydroxymethyl and formaldehyde may be necessary to correct this problem.
For instance, the early-time CO formation is also sensitive to hydroxymethyl reactions
(CH2OH ↔ CH2O + H, CH2OH +H ↔ CH3 + OH) and the subsequent H-abstraction
from formaldehyde (CH2O + H ↔ HCO + H2), as shown in the CO sensitivity plot of
Figure 4.9. In the modified Li et al. [17] model, we leave these rate constants unchanged.
However, very different rate constant values are assigned to these reactions in different
models. For instance, the Li et al. [17] mechanism used the recommended k4 from the
pyrolysis study of methanol by Cribb [68], which is a factor of 10 times lower compared
to the value in GRI-Mech [68]. Accurate electronic structure and master equation
calculations for this reaction are recommended to achieve further reduction of
uncertainties in the C1 combustion mechanism.
0.0 0.5 1.0 1.5
0.0
0.5
1.0
1.5
1610K, 2.2atm
Measurement, current study Modified Li et al. (k1 and k2 modified)
1567K, 2.1atm
1368K, 2.4atm
1458K, 2.3atm
Time [ms]
Met
hano
l Mol
e Fr
actio
n [%
]
1266K, 2.5atm
1% Methanol/Ar
(a)
0.0 0.5 1.0 1.5
0.0
0.5
1.0
1.5
2.0
2.5
1403K, 1.2atm
1507K, 1.1atm
1707K, 1.3atm
Time [ms]
1623K, 1.1atm
CO
Mol
e Fr
actio
n [%
]
Measurement, current study Modified Li et al. (k1 and k2 modified)
0.2% Methanol/Ar
(b)
Figure 4.8 Effect of modifications to the Li et al. [17] mechanism predictions for (a) CH3OH and (b) CO
concentration time-histories during the pyrolysis of methanol.
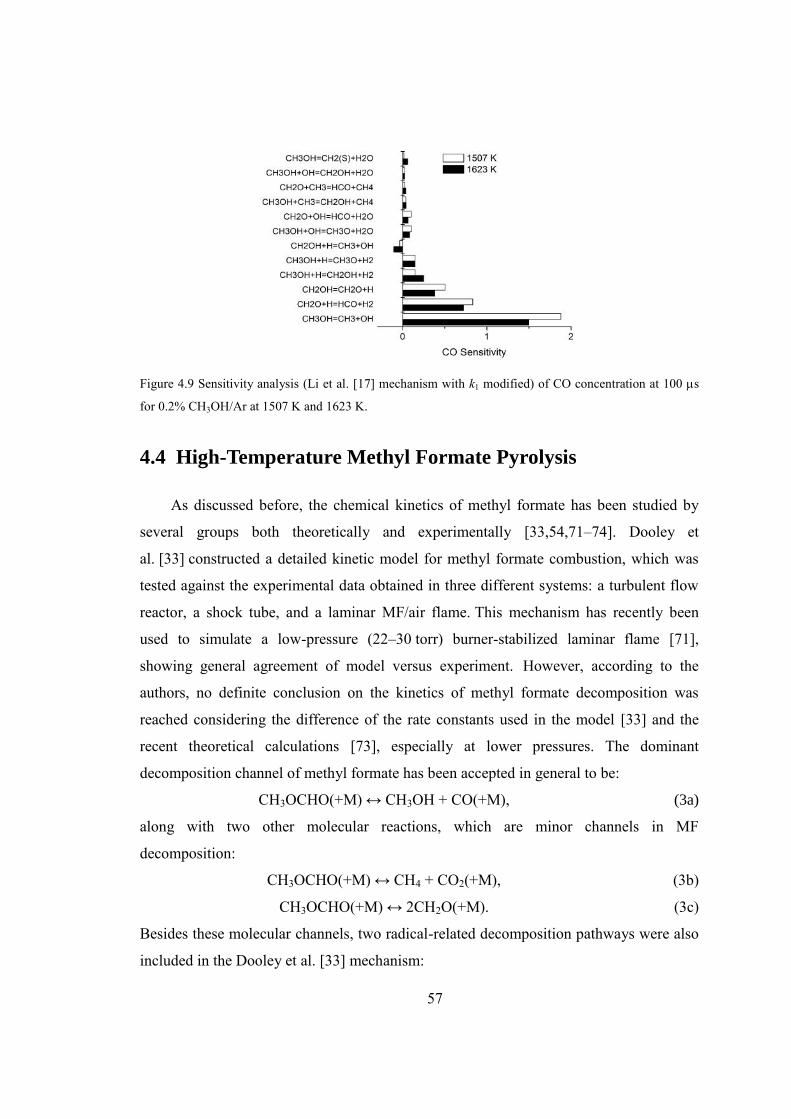
57
Figure 4.9 Sensitivity analysis (Li et al. [17] mechanism with k1 modified) of CO concentration at 100 s
for 0.2% CH3OH/Ar at 1507 K and 1623 K.
4.4 High-Temperature Methyl Formate Pyrolysis
As discussed before, the chemical kinetics of methyl formate has been studied by
several groups both theoretically and experimentally [33,54,71–74]. Dooley et
al. [33] constructed a detailed kinetic model for methyl formate combustion, which was
tested against the experimental data obtained in three different systems: a turbulent flow
reactor, a shock tube, and a laminar MF/air flame. This mechanism has recently been
used to simulate a low-pressure (22–30 torr) burner-stabilized laminar flame [71],
showing general agreement of model versus experiment. However, according to the
authors, no definite conclusion on the kinetics of methyl formate decomposition was
reached considering the difference of the rate constants used in the model [33] and the
recent theoretical calculations [73], especially at lower pressures. The dominant
decomposition channel of methyl formate has been accepted in general to be:
CH3OCHO(+M) ↔ CH3OH + CO(+M), (3a)
along with two other molecular reactions, which are minor channels in MF
decomposition:
CH3OCHO(+M) ↔ CH4 + CO2(+M), (3b)
CH3OCHO(+M) ↔ 2CH2O(+M). (3c)
Besides these molecular channels, two radical-related decomposition pathways were also
included in the Dooley et al. [33] mechanism:
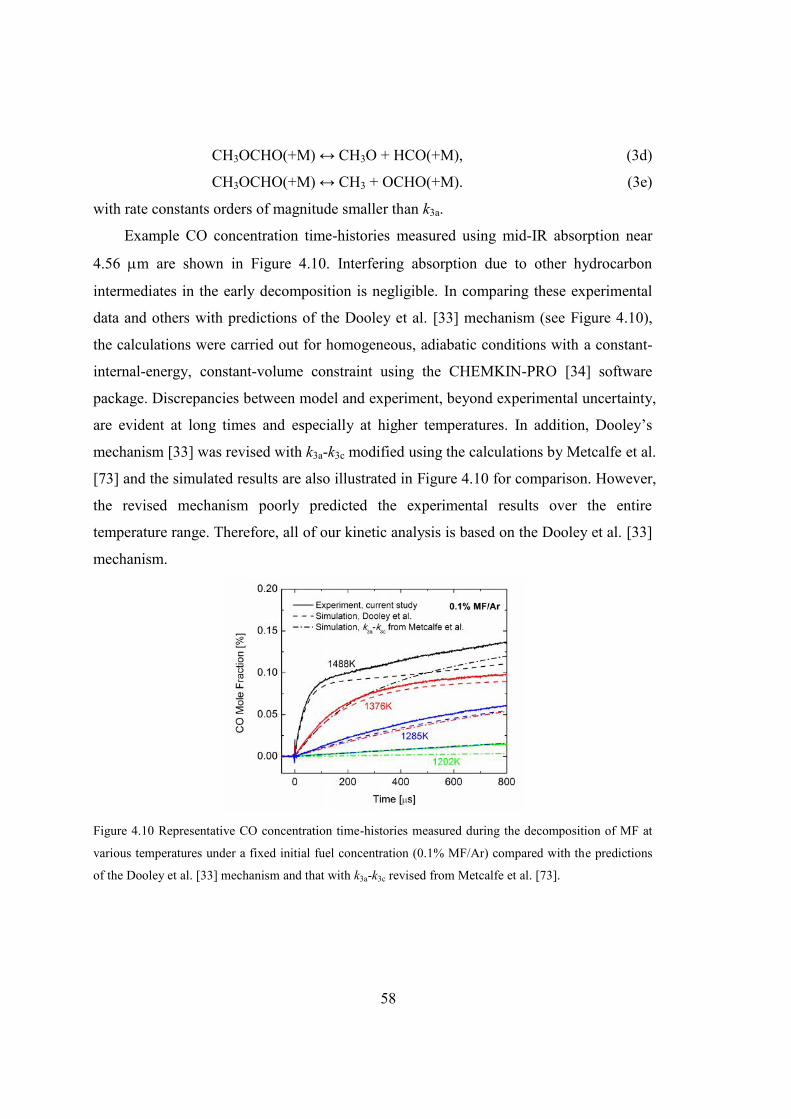
58
CH3OCHO(+M) ↔ CH3O + HCO(+M), (3d)
CH3OCHO(+M) ↔ CH3 + OCHO(+M). (3e)
with rate constants orders of magnitude smaller than k3a.
Example CO concentration time-histories measured using mid-IR absorption near
4.56 m are shown in Figure 4.10. Interfering absorption due to other hydrocarbon
intermediates in the early decomposition is negligible. In comparing these experimental
data and others with predictions of the Dooley et al. [33] mechanism (see Figure 4.10),
the calculations were carried out for homogeneous, adiabatic conditions with a constant-
internal-energy, constant-volume constraint using the CHEMKIN-PRO [34] software
package. Discrepancies between model and experiment, beyond experimental uncertainty,
are evident at long times and especially at higher temperatures. In addition, Dooley’s
mechanism [33] was revised with k3a-k3c modified using the calculations by Metcalfe et al.
[73] and the simulated results are also illustrated in Figure 4.10 for comparison. However,
the revised mechanism poorly predicted the experimental results over the entire
temperature range. Therefore, all of our kinetic analysis is based on the Dooley et al. [33]
mechanism.
Figure 4.10 Representative CO concentration time-histories measured during the decomposition of MF at
various temperatures under a fixed initial fuel concentration (0.1% MF/Ar) compared with the predictions
of the Dooley et al. [33] mechanism and that with k3a-k3c revised from Metcalfe et al. [73].
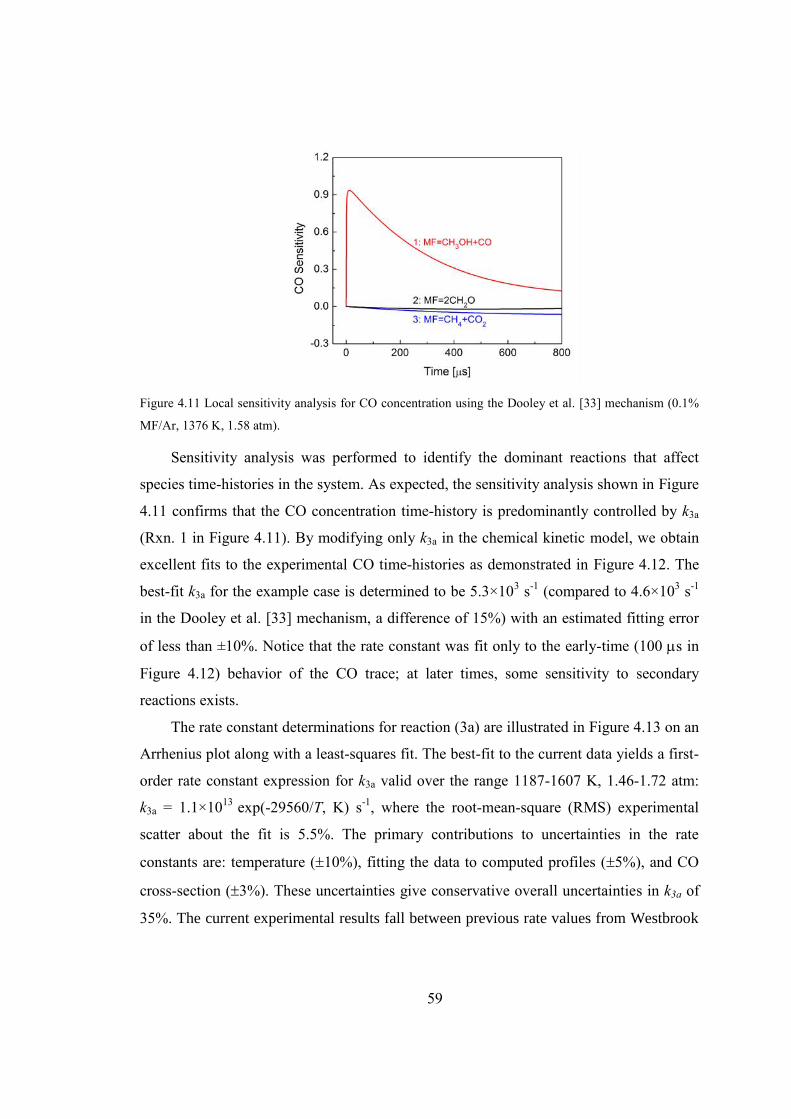
59
Figure 4.11 Local sensitivity analysis for CO concentration using the Dooley et al. [33] mechanism (0.1%
MF/Ar, 1376 K, 1.58 atm).
Sensitivity analysis was performed to identify the dominant reactions that affect
species time-histories in the system. As expected, the sensitivity analysis shown in Figure
4.11 confirms that the CO concentration time-history is predominantly controlled by k3a
(Rxn. 1 in Figure 4.11). By modifying only k3a in the chemical kinetic model, we obtain
excellent fits to the experimental CO time-histories as demonstrated in Figure 4.12. The
best-fit k3a for the example case is determined to be 5.3×10³ s-1 (compared to 4.6×10³ s-1
in the Dooley et al. [33] mechanism, a difference of 15%) with an estimated fitting error
of less than ±10%. Notice that the rate constant was fit only to the early-time (100 s in
Figure 4.12) behavior of the CO trace; at later times, some sensitivity to secondary
reactions exists.
The rate constant determinations for reaction (3a) are illustrated in Figure 4.13 on an
Arrhenius plot along with a least-squares fit. The best-fit to the current data yields a first-
order rate constant expression for k3a valid over the range 1187-1607 K, 1.46-1.72 atm:
k3a = 1.1×10¹³ exp(-29560/T, K) s-1, where the root-mean-square (RMS) experimental
scatter about the fit is 5.5%. The primary contributions to uncertainties in the rate
constants are: temperature (10%), fitting the data to computed profiles (5%), and CO
cross-section (3%). These uncertainties give conservative overall uncertainties in k3a of
35%. The current experimental results fall between previous rate values from Westbrook
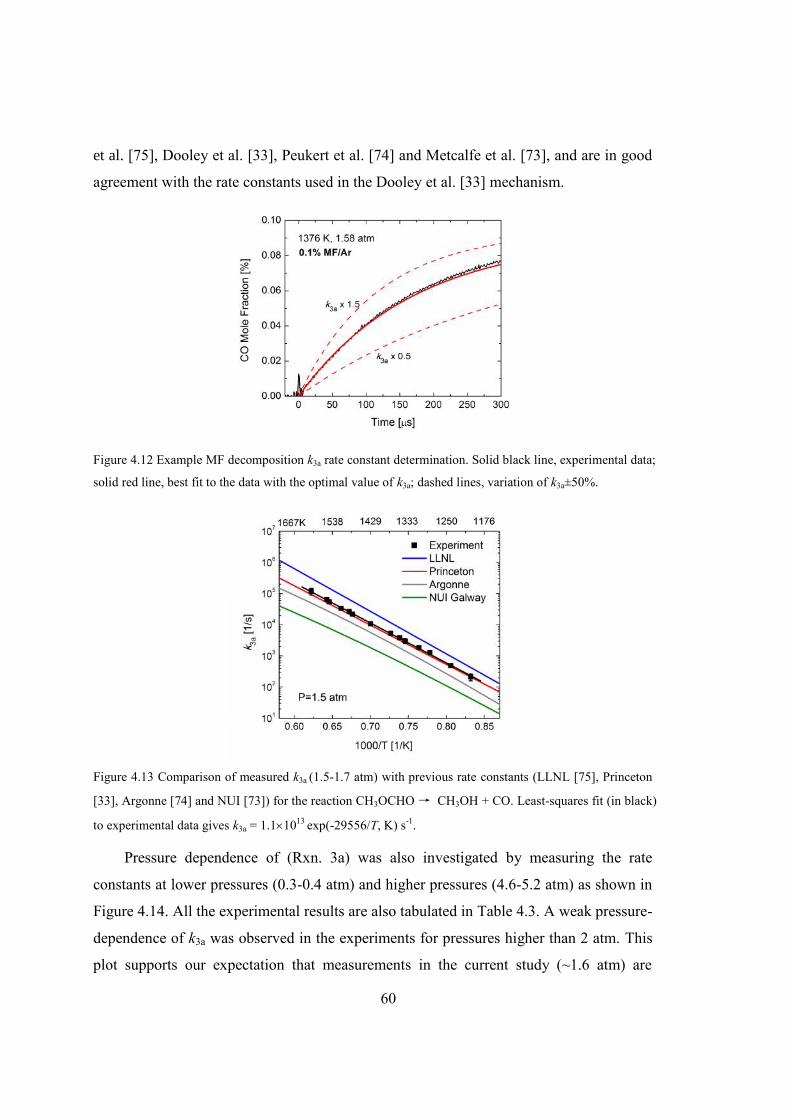
60
et al. [75], Dooley et al. [33], Peukert et al. [74] and Metcalfe et al. [73], and are in good
agreement with the rate constants used in the Dooley et al. [33] mechanism.
Figure 4.12 Example MF decomposition k3a rate constant determination. Solid black line, experimental data;
solid red line, best fit to the data with the optimal value of k3a; dashed lines, variation of k3a±50%.
Figure 4.13 Comparison of measured k3a (1.5-1.7 atm) with previous rate constants (LLNL [75], Princeton
[33], Argonne [74] and NUI [73]) for the reaction CH3OCHO→ CH3OH + CO. Least-squares fit (in black)
to experimental data gives k3a = 1.11013 exp(-29556/T, K) s-1.
Pressure dependence of (Rxn. 3a) was also investigated by measuring the rate
constants at lower pressures (0.3-0.4 atm) and higher pressures (4.6-5.2 atm) as shown in
Figure 4.14. All the experimental results are also tabulated in Table 4.3. A weak pressure-
dependence of k3a was observed in the experiments for pressures higher than 2 atm. This
plot supports our expectation that measurements in the current study (~1.6 atm) are
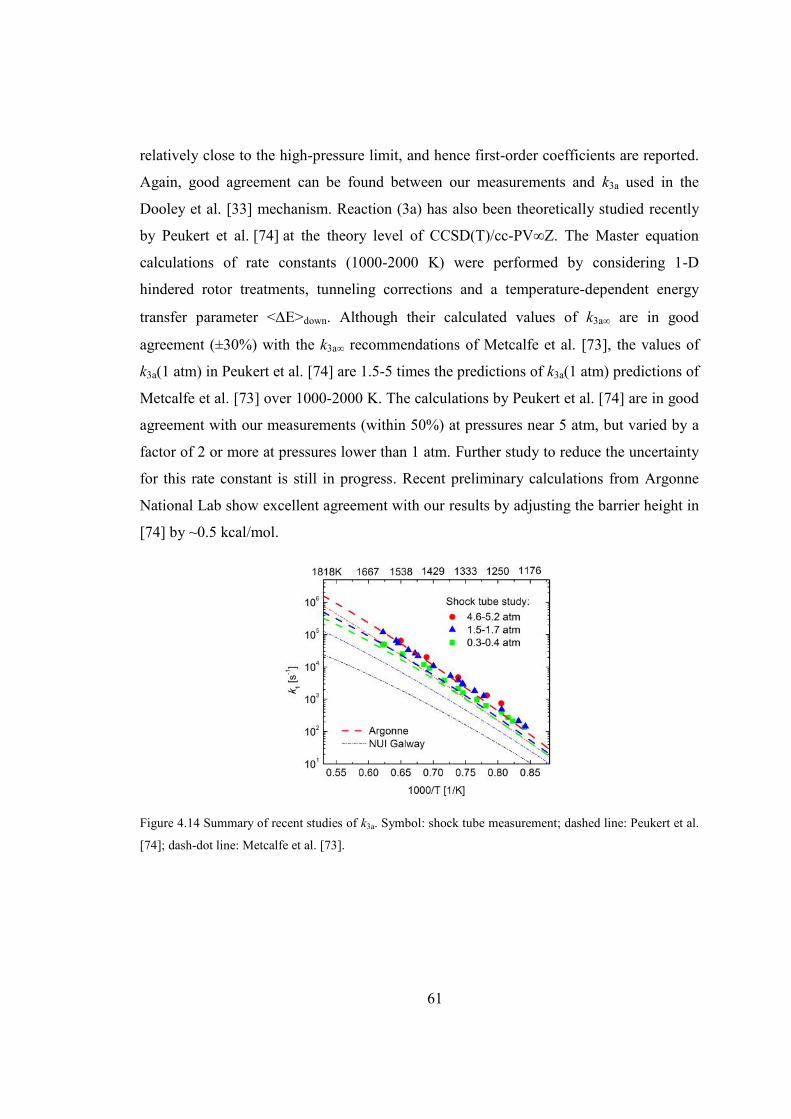
61
relatively close to the high-pressure limit, and hence first-order coefficients are reported.
Again, good agreement can be found between our measurements and k3a used in the
Dooley et al. [33] mechanism. Reaction (3a) has also been theoretically studied recently
by Peukert et al. [74] at the theory level of CCSD(T)/cc-PV∞Z. The Master equation
calculations of rate constants (1000-2000 K) were performed by considering 1-D
hindered rotor treatments, tunneling corrections and a temperature-dependent energy
transfer parameter <E>down. Although their calculated values of k3a∞ are in good
agreement (±30%) with the k3a∞ recommendations of Metcalfe et al. [73], the values of
k3a(1 atm) in Peukert et al. [74] are 1.5-5 times the predictions of k3a(1 atm) predictions of
Metcalfe et al. [73] over 1000-2000 K. The calculations by Peukert et al. [74] are in good
agreement with our measurements (within 50%) at pressures near 5 atm, but varied by a
factor of 2 or more at pressures lower than 1 atm. Further study to reduce the uncertainty
for this rate constant is still in progress. Recent preliminary calculations from Argonne
National Lab show excellent agreement with our results by adjusting the barrier height in
[74] by ~0.5 kcal/mol.
Figure 4.14 Summary of recent studies of k3a. Symbol: shock tube measurement; dashed line: Peukert et al.
[74]; dash-dot line: Metcalfe et al. [73].
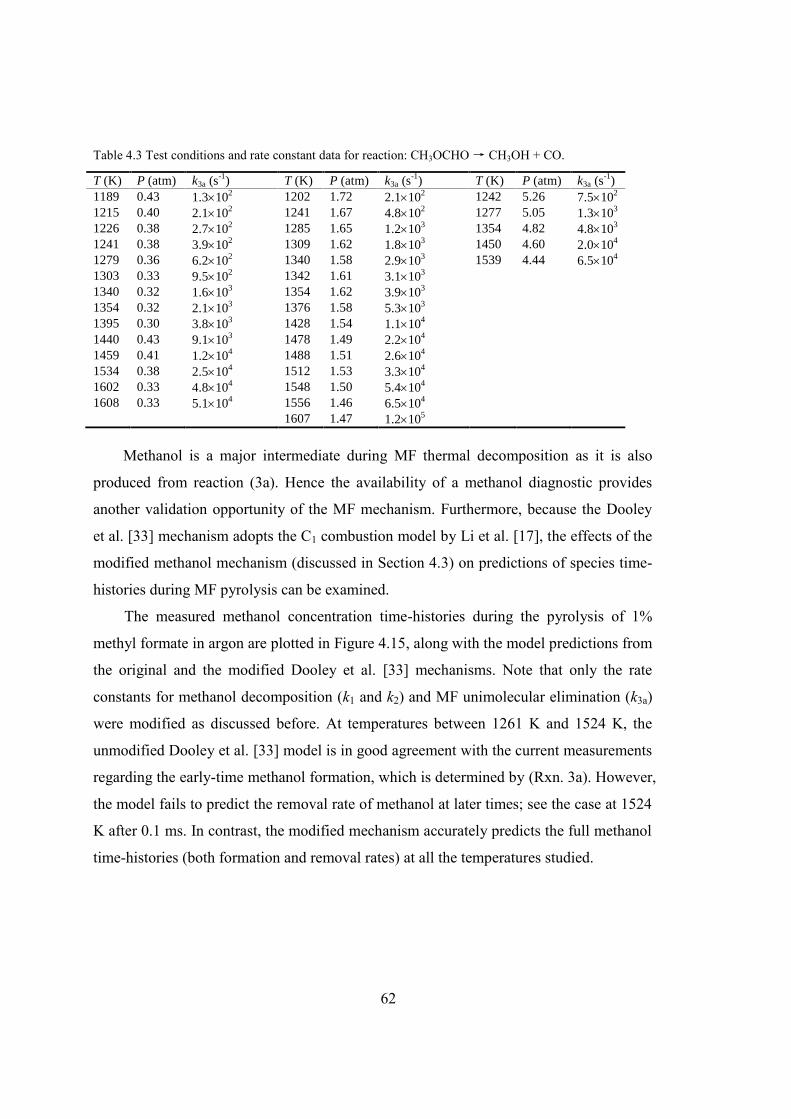
62
Table 4.3 Test conditions and rate constant data for reaction: CH3OCHO→ CH3OH + CO.
T (K) P (atm) k3a (s-1) T (K) P (atm) k3a (s-1) T (K) P (atm) k3a (s-1)1189 0.43 1.3102 1202 1.72 2.1102 1242 5.26 7.5102
1215 0.40 2.1102 1241 1.67 4.8102 1277 5.05 1.3103
1226 0.38 2.7102 1285 1.65 1.2103 1354 4.82 4.8103
1241 0.38 3.9102 1309 1.62 1.8103 1450 4.60 2.0104
1279 0.36 6.2102 1340 1.58 2.9103 1539 4.44 6.5104
1303 0.33 9.5102 1342 1.61 3.1103
1340 0.32 1.6103 1354 1.62 3.9103
1354 0.32 2.1103 1376 1.58 5.3103
1395 0.30 3.8103 1428 1.54 1.1104
1440 0.43 9.1103 1478 1.49 2.2104
1459 0.41 1.2104 1488 1.51 2.6104
1534 0.38 2.5104 1512 1.53 3.3104
1602 0.33 4.8104 1548 1.50 5.4104
1608 0.33 5.1104 1556 1.46 6.5104
1607 1.47 1.2105
Methanol is a major intermediate during MF thermal decomposition as it is also
produced from reaction (3a). Hence the availability of a methanol diagnostic provides
another validation opportunity of the MF mechanism. Furthermore, because the Dooley
et al. [33] mechanism adopts the C1 combustion model by Li et al. [17], the effects of the
modified methanol mechanism (discussed in Section 4.3) on predictions of species time-
histories during MF pyrolysis can be examined.
The measured methanol concentration time-histories during the pyrolysis of 1%
methyl formate in argon are plotted in Figure 4.15, along with the model predictions from
the original and the modified Dooley et al. [33] mechanisms. Note that only the rate
constants for methanol decomposition (k1 and k2) and MF unimolecular elimination (k3a)
were modified as discussed before. At temperatures between 1261 K and 1524 K, the
unmodified Dooley et al. [33] model is in good agreement with the current measurements
regarding the early-time methanol formation, which is determined by (Rxn. 3a). However,
the model fails to predict the removal rate of methanol at later times; see the case at 1524
K after 0.1 ms. In contrast, the modified mechanism accurately predicts the full methanol
time-histories (both formation and removal rates) at all the temperatures studied.

63
(a) Original Dooley et al. mechanism
0.0 0.2 0.4 0.6 0.8 1.00.0
0.2
0.4
0.6
0.8
1.0
Met
hano
l Mol
e Fr
actio
n [%
]
1261K, 1.5atm
1327K, 1.5atm
1524K, 1.4atm
Time [ms]
Measurement, current study Modified Dooley et al. (k1+k2 modified)
1% MF/Ar
(b) Modified Dooley et al. mechanism
Figure 4.15 Comparisons of measured and simulated methanol time-histories for 1% methyl formate in
argon. Only the reaction rate constants k1, k2 and k3a are modified in the Dooley et al. [33] mechanism.
Figure 4.16 Example CO concentration time-histories: solid line, measurement; dashed line, simulation
using unmodified Dooley et al. [33] mechanism; dash-dot line, simulation using the Dooley et al.
mechanism with k1, k2 and k3a modified.
Similarly, an obvious discrepancy still exists at long times of CO time-histories
despite the good agreement in the early-time CO formation. A sample CO profile during
the pyrolysis of 0.1% MF/Ar at 1607 K and 1.5 atm is shown in Figure 4.16. Two-stage
CO formation is observed during the thermal decomposition of methyl formate. The rapid
early-time (prior to approximately 50 s) CO formation is directly from the initial fuel
decomposition (Rxn. 3a), which is well captured by the Dooley et al. [33] mechanism. At
long times, however, the simulated CO profile from the Dooley et al. [33] mechanism is
inconsistent with the measurement. At 1 ms, for instance, the model significantly
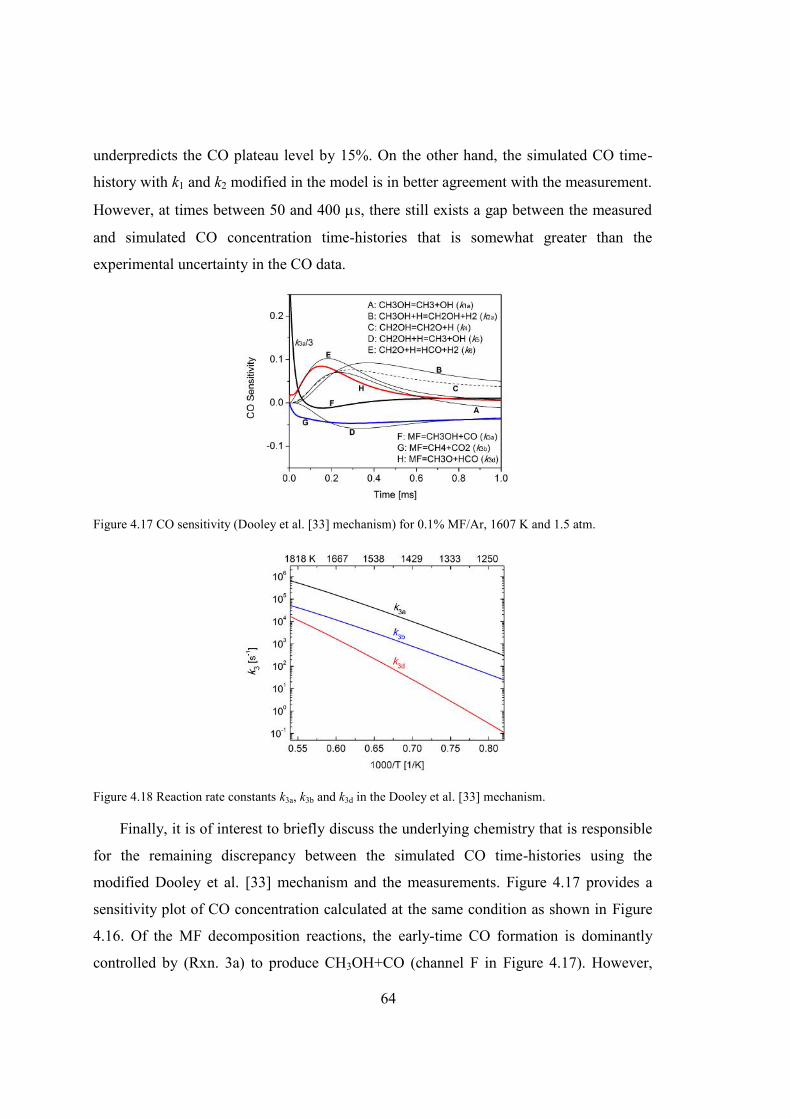
64
underpredicts the CO plateau level by 15%. On the other hand, the simulated CO time-
history with k1 and k2 modified in the model is in better agreement with the measurement.
However, at times between 50 and 400 s, there still exists a gap between the measured
and simulated CO concentration time-histories that is somewhat greater than the
experimental uncertainty in the CO data.
Figure 4.17 CO sensitivity (Dooley et al. [33] mechanism) for 0.1% MF/Ar, 1607 K and 1.5 atm.
Figure 4.18 Reaction rate constants k3a, k3b and k3d in the Dooley et al. [33] mechanism.
Finally, it is of interest to briefly discuss the underlying chemistry that is responsible
for the remaining discrepancy between the simulated CO time-histories using the
modified Dooley et al. [33] mechanism and the measurements. Figure 4.17 provides a
sensitivity plot of CO concentration calculated at the same condition as shown in Figure
4.16. Of the MF decomposition reactions, the early-time CO formation is dominantly
controlled by (Rxn. 3a) to produce CH3OH+CO (channel F in Figure 4.17). However,
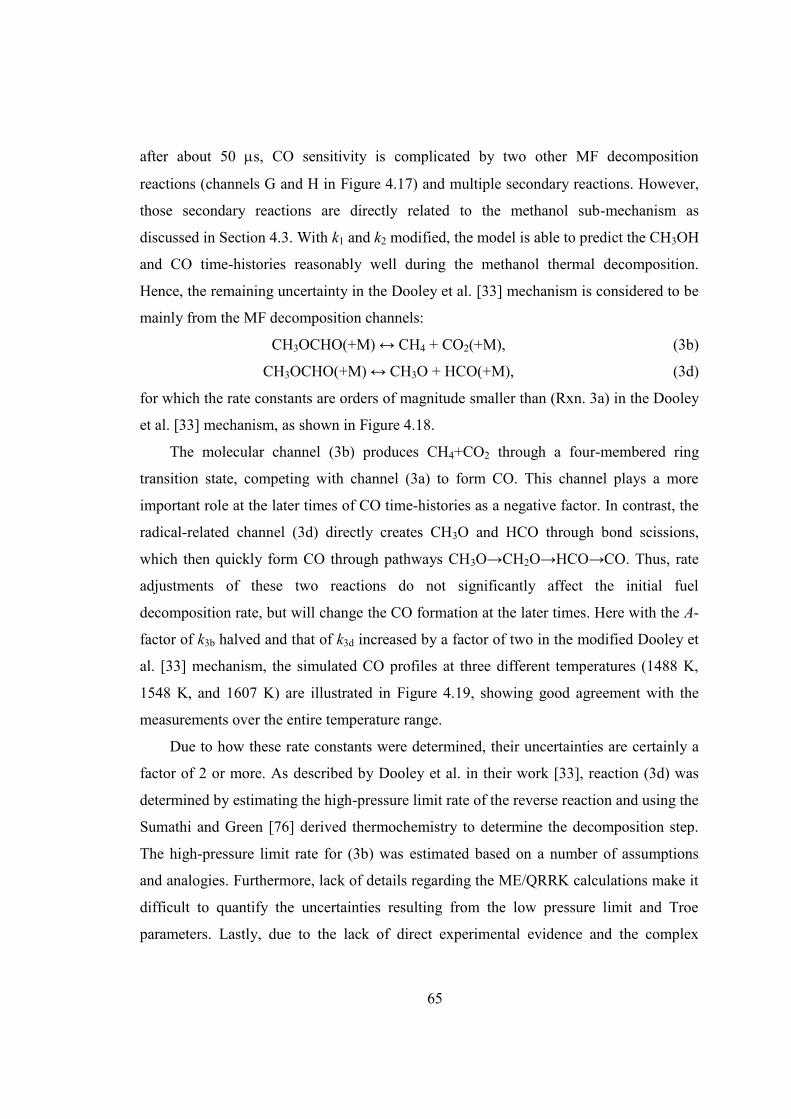
65
after about 50 s, CO sensitivity is complicated by two other MF decomposition
reactions (channels G and H in Figure 4.17) and multiple secondary reactions. However,
those secondary reactions are directly related to the methanol sub-mechanism as
discussed in Section 4.3. With k1 and k2 modified, the model is able to predict the CH3OH
and CO time-histories reasonably well during the methanol thermal decomposition.
Hence, the remaining uncertainty in the Dooley et al. [33] mechanism is considered to be
mainly from the MF decomposition channels:
CH3OCHO(+M) ↔ CH4 + CO2(+M), (3b)
CH3OCHO(+M) ↔ CH3O + HCO(+M), (3d)
for which the rate constants are orders of magnitude smaller than (Rxn. 3a) in the Dooley
et al. [33] mechanism, as shown in Figure 4.18.
The molecular channel (3b) produces CH4+CO2 through a four-membered ring
transition state, competing with channel (3a) to form CO. This channel plays a more
important role at the later times of CO time-histories as a negative factor. In contrast, the
radical-related channel (3d) directly creates CH3O and HCO through bond scissions,
which then quickly form CO through pathways CH3O→CH2O→HCO→CO. Thus, rate
adjustments of these two reactions do not significantly affect the initial fuel
decomposition rate, but will change the CO formation at the later times. Here with the A-
factor of k3b halved and that of k3d increased by a factor of two in the modified Dooley et
al. [33] mechanism, the simulated CO profiles at three different temperatures (1488 K,
1548 K, and 1607 K) are illustrated in Figure 4.19, showing good agreement with the
measurements over the entire temperature range.
Due to how these rate constants were determined, their uncertainties are certainly a
factor of 2 or more. As described by Dooley et al. in their work [33], reaction (3d) was
determined by estimating the high-pressure limit rate of the reverse reaction and using the
Sumathi and Green [76] derived thermochemistry to determine the decomposition step.
The high-pressure limit rate for (3b) was estimated based on a number of assumptions
and analogies. Furthermore, lack of details regarding the ME/QRRK calculations make it
difficult to quantify the uncertainties resulting from the low pressure limit and Troe
parameters. Lastly, due to the lack of direct experimental evidence and the complex
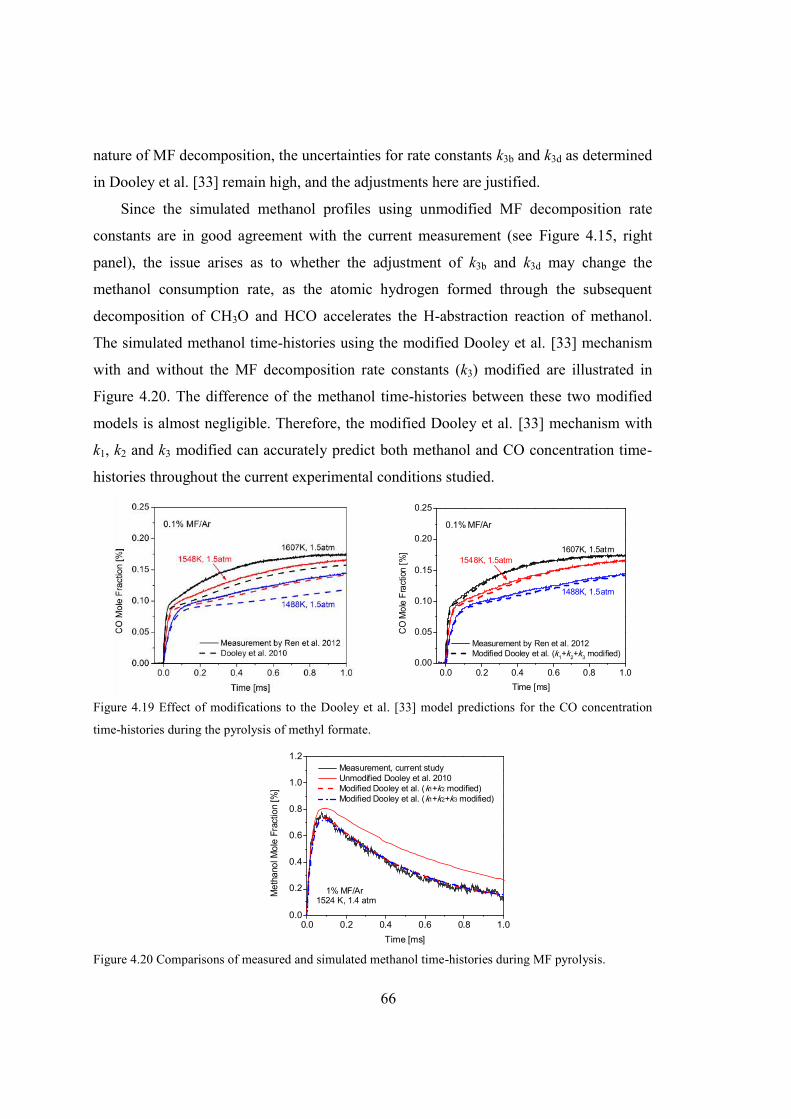
66
nature of MF decomposition, the uncertainties for rate constants k3b and k3d as determined
in Dooley et al. [33] remain high, and the adjustments here are justified.
Since the simulated methanol profiles using unmodified MF decomposition rate
constants are in good agreement with the current measurement (see Figure 4.15, right
panel), the issue arises as to whether the adjustment of k3b and k3d may change the
methanol consumption rate, as the atomic hydrogen formed through the subsequent
decomposition of CH3O and HCO accelerates the H-abstraction reaction of methanol.
The simulated methanol time-histories using the modified Dooley et al. [33] mechanism
with and without the MF decomposition rate constants (k3) modified are illustrated in
Figure 4.20. The difference of the methanol time-histories between these two modified
models is almost negligible. Therefore, the modified Dooley et al. [33] mechanism with
k1, k2 and k3 modified can accurately predict both methanol and CO concentration time-
histories throughout the current experimental conditions studied.
Figure 4.19 Effect of modifications to the Dooley et al. [33] model predictions for the CO concentration
time-histories during the pyrolysis of methyl formate.
Figure 4.20 Comparisons of measured and simulated methanol time-histories during MF pyrolysis.
0.0 0.2 0.4 0.6 0.8 1.00.00
0.05
0.10
0.15
0.20
0.25
1488K, 1.5atm
1548K, 1.5atm1607K, 1.5atm
CO
Mol
e Fr
actio
n [%
]
Time [ms]
0.1% MF/Ar
Measurement by Ren et al. 2012 Modified Dooley et al. (k1+k2+k3 modified)
0.0 0.2 0.4 0.6 0.8 1.00.0
0.2
0.4
0.6
0.8
1.0
1.2
Met
hano
l Mol
e Fr
actio
n [%
]
Time [ms]
Measurement, current study Unmodified Dooley et al. 2010 Modified Dooley et al. (k1+k2 modified) Modified Dooley et al. (k1+k2+k3 modified)
1% MF/Ar1524 K, 1.4 atm
67
Chapter 5. Thermal Decomposition of C3-C5
Ethyl Esters
5.1 Introduction
As discussed previously, biodiesel is typically produced through the
transesterification of vegetable oils or animal fats with methanol yielding fatty acid
methyl esters (FAMEs) [77,78]. These methyl esters can be blended with petroleum
diesel and used in diesel engines without major modifications. Methanol instead of
ethanol has been preferred in industrial application to produce biodiesel mostly due to its
lower cost. However, ethanol is less toxic, less volatile and less corrosive than methanol,
and therefore provides a safer work environment during the transesterification process.
Additionally, some countries like Brazil have started to produce ethanol in large
quantities [79]. Hence, biodiesel in the form of fatty acid ethyl esters (FAEEs) produced
through the conversion of biolipids with ethanol would further enhance the sustainability
and commercialization of biofuels [80].
Previous kinetic studies on ethyl esters have aimed to compare the small methyl and
ethyl esters with the same chemical formula (isomers) while varying the length of the
alkyl chains to investigate the effect of the molecular structure on the combustion
chemistry. In 2009, Westbrook et al. [75] developed a detailed chemical kinetic
mechanism describing the laminar premixed flames of four small alkyl ester fuels: methyl
formate, methyl acetate, ethyl formate and ethyl acetate. The model development
employed a principle of similarity of functional groups in constraining the H-atom
abstraction and unimolecular decomposition reactions for each of these esters. Akih-
Kumgeh and Bergthorson [81] investigated the ignition behavior of three pairs of
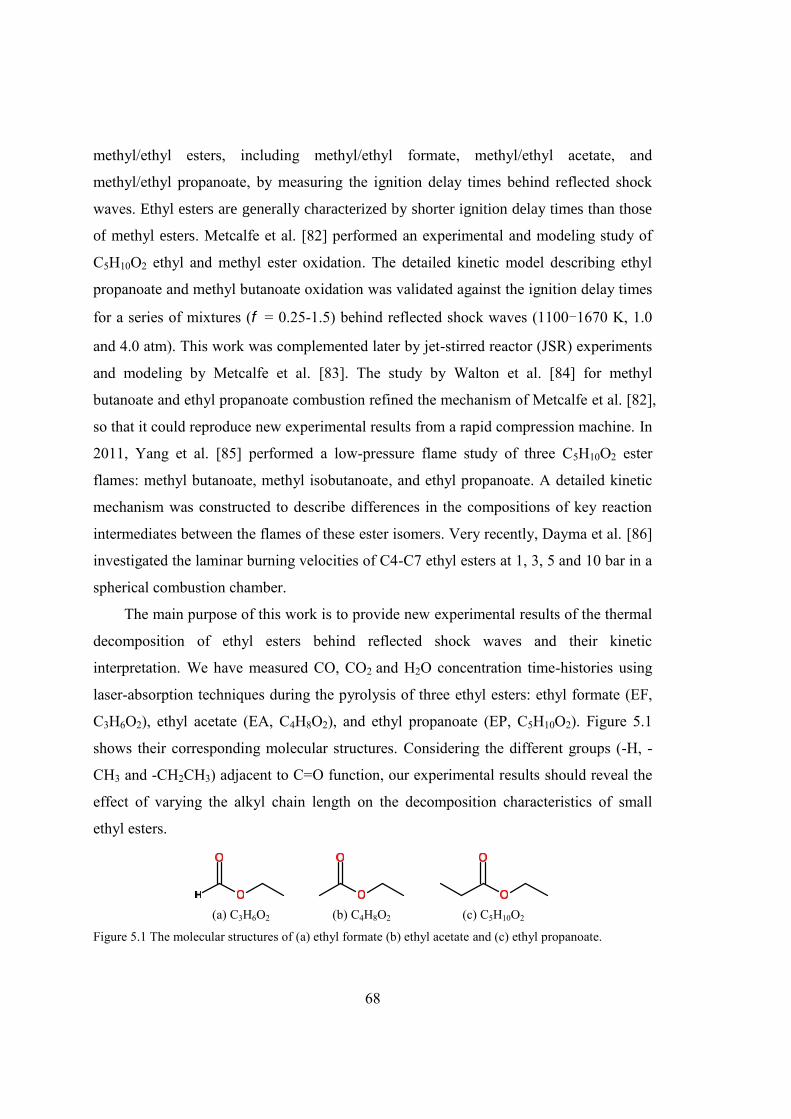
68
methyl/ethyl esters, including methyl/ethyl formate, methyl/ethyl acetate, and
methyl/ethyl propanoate, by measuring the ignition delay times behind reflected shock
waves. Ethyl esters are generally characterized by shorter ignition delay times than those
of methyl esters. Metcalfe et al. [82] performed an experimental and modeling study of
C5H10O2 ethyl and methyl ester oxidation. The detailed kinetic model describing ethyl
propanoate and methyl butanoate oxidation was validated against the ignition delay times
for a series of mixtures ( = 0.25-1.5) behind reflected shock waves (1100-1670 K, 1.0
and 4.0 atm). This work was complemented later by jet-stirred reactor (JSR) experiments
and modeling by Metcalfe et al. [83]. The study by Walton et al. [84] for methyl
butanoate and ethyl propanoate combustion refined the mechanism of Metcalfe et al. [82],
so that it could reproduce new experimental results from a rapid compression machine. In
2011, Yang et al. [85] performed a low-pressure flame study of three C5H10O2 ester
flames: methyl butanoate, methyl isobutanoate, and ethyl propanoate. A detailed kinetic
mechanism was constructed to describe differences in the compositions of key reaction
intermediates between the flames of these ester isomers. Very recently, Dayma et al. [86]
investigated the laminar burning velocities of C4-C7 ethyl esters at 1, 3, 5 and 10 bar in a
spherical combustion chamber.
The main purpose of this work is to provide new experimental results of the thermal
decomposition of ethyl esters behind reflected shock waves and their kinetic
interpretation. We have measured CO, CO2 and H2O concentration time-histories using
laser-absorption techniques during the pyrolysis of three ethyl esters: ethyl formate (EF,
C3H6O2), ethyl acetate (EA, C4H8O2), and ethyl propanoate (EP, C5H10O2). Figure 5.1
shows their corresponding molecular structures. Considering the different groups (-H, -
CH3 and -CH2CH3) adjacent to C=O function, our experimental results should reveal the
effect of varying the alkyl chain length on the decomposition characteristics of small
ethyl esters.
(a) C3H6O2 (b) C4H8O2 (c) C5H10O2
Figure 5.1 The molecular structures of (a) ethyl formate (b) ethyl acetate and (c) ethyl propanoate.

69
5.2 Experimental
5.2.1 Shock Tube and Laser Diagnostics
All the experiments were performed in the same shock tube (15.24 cm inner
diameter) as introduced in Chapter 2 and Chapter 4. All fuels (>99% pure, Sigma-Aldrich)
were frozen and degassed three times to remove dissolved volatiles before making the
mixtures. All the test mixtures were manometrically prepared in a stainless-steel mixing
tank (40 L) heated uniformly to 50°C with an internal magnetically driven stirrer. Laser
absorption and side-wall pressure measurements (Kistler 601B1 PZT) were located 2 cm
from the shock tube end wall.
In this study, three laser absorption diagnostics were utilized for the time-resolved
measurements of CO, H2O and CO2 concentration time-histories. CO concentration was
measured using a DFB-QC laser, detecting the peak intensity of the CO R(13) absorption
line at 2193.36 cm-1. Absorption measurements of H2O were performed using a
distributed feedback (DFB) diode laser at 2550.96 nm within the ν3-fundamental
vibrational band, achieving a minimum H2O detection sensitivity of 25 ppm at 1400 K
and 1.5 atm for a path length of 15 cm [37].
A new mid-IR CO2 diagnostic was developed in this work by incorporating an
external cavity quantum cascade laser (ECQCL), to provide sensitive and quantitative
measurements of carbon dioxide. The R(76) transition line in the CO2 fundamental band
near 4.3 m was selected due to its high absorption strength and negligible interference
from other combustion products. The Ar-broadening coefficient (2CO2-Ar) for this
transition was measured behind reflected shock waves using the same method as
described in reference [37]. The Ar-broadening coefficient over the temperature range of
1200-1900 K was measured to be 0.0762±0.0012 cm-1/atm with a temperature exponent
of n=0.57±0.02. Compared to previous CO2 sensors detecting the overtone and
combinational bands near 2.7 m [40,87], this new diagnostic scheme provides orders-of-
magnitude greater sensitivity for shock tube experiments.

70
5.2.2 Experimental Results
The exact experimental conditions behind reflected shock waves are summarized in
Table 5.1. The measurements covered the temperature range of 1301-1636 K and
pressure range of 1.48-1.72 atm with fuel concentration of 2000 ppm. Such dilute
mixtures result in negligible temperature variation during fuel pyrolysis. Hence, no
correction is needed for laser absorption coefficients.
The representative H2O, CO and CO2 concentration time-histories during EF, EA
and EP pyrolysis are presented in Figure 5.2 at temperatures near 1450 K and pressures
near 1.5 atm. In general, the species time-histories for these ethyl esters differ
significantly from each other. EF shows the highest yield of CO and H2O (with nearly
equal formation rate) among these three esters, but produces a negligible amount of CO2.
The CO profile during EA pyrolysis exhibits the slowest formation rate among all these
esters. Additionally, CO, H2O and CO2 are observed to have almost the same formation
rate during the pyrolysis of EP.
The product fractional yields (defined by xproduct/xfuel, here xfuel = 2000 ppm) at t = 1
ms for the C3-C5 ethyl esters are plotted as a function of temperature in Figure 5.3. It is
obvious that these esters demonstrate completely distinct product yield behaviors, but the
final O-atom carrying products are mainly found to be CO, H2O and CO2. At the highest
temperature when the product time-histories reached the plateau level within the test time
of 2 ms, the O-atom balance in the measured CO, H2O, and CO2 profiles were counted to
be 98%, 93% and 95% for EF, EA and EP, respectively. Note that all the detailed species
time-history data will be presented and discussed in Section 5.4.
(a) (b) (c)
Figure 5.2 Measured species time-histories during the pyrolysis of (a) EF (b) EA and (c) EP at temperature
near 1450 K and pressures near 1.5 atm, with fuel concentration 2000 ppm in argon.
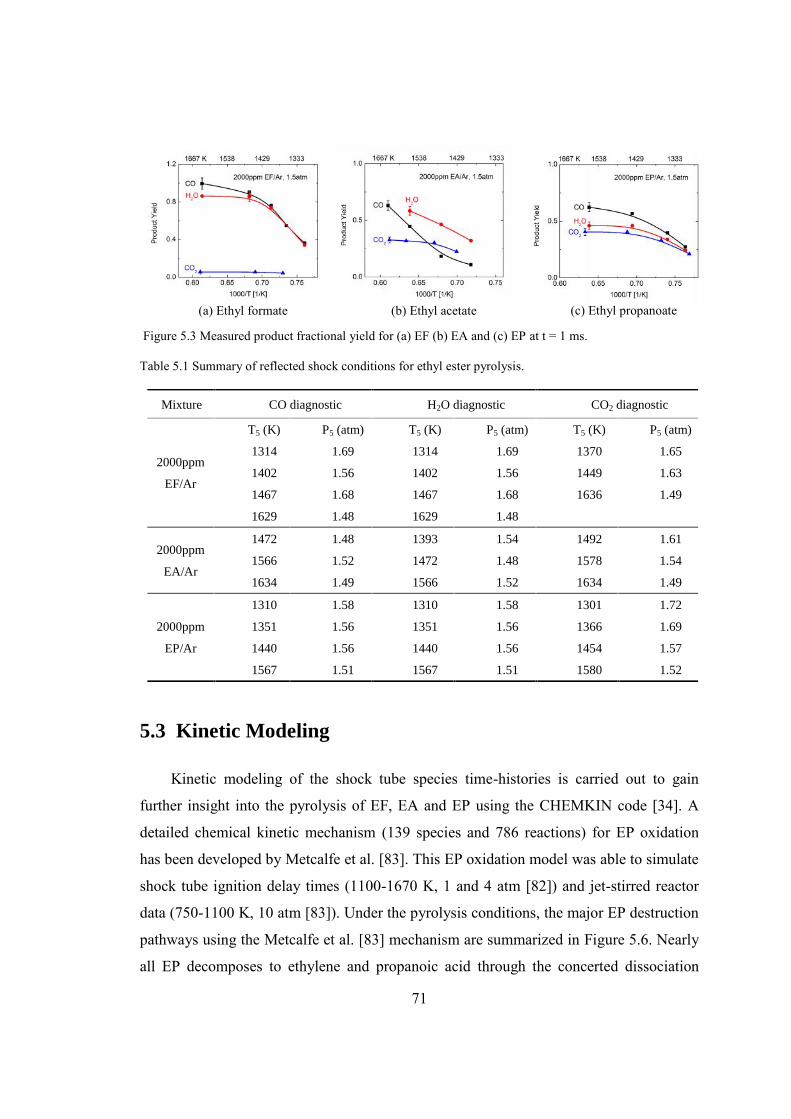
71
(a) Ethyl formate (b) Ethyl acetate (c) Ethyl propanoate
Figure 5.3 Measured product fractional yield for (a) EF (b) EA and (c) EP at t = 1 ms.
Table 5.1 Summary of reflected shock conditions for ethyl ester pyrolysis.
5.3 Kinetic Modeling
Kinetic modeling of the shock tube species time-histories is carried out to gain
further insight into the pyrolysis of EF, EA and EP using the CHEMKIN code [34]. A
detailed chemical kinetic mechanism (139 species and 786 reactions) for EP oxidation
has been developed by Metcalfe et al. [83]. This EP oxidation model was able to simulate
shock tube ignition delay times (1100-1670 K, 1 and 4 atm [82]) and jet-stirred reactor
data (750-1100 K, 10 atm [83]). Under the pyrolysis conditions, the major EP destruction
pathways using the Metcalfe et al. [83] mechanism are summarized in Figure 5.6. Nearly
all EP decomposes to ethylene and propanoic acid through the concerted dissociation
Mixture CO diagnostic H2O diagnostic CO2 diagnostic
2000ppm
EF/Ar
T5 (K) P5 (atm) T5 (K) P5 (atm) T5 (K) P5 (atm)
1314 1.69 1314 1.69 1370 1.65
1402 1.56 1402 1.56 1449 1.63
1467 1.68 1467 1.68 1636 1.49
1629 1.48 1629 1.48
2000ppm
EA/Ar
1472 1.48 1393 1.54 1492 1.61
1566 1.52 1472 1.48 1578 1.54
1634 1.49 1566 1.52 1634 1.49
2000ppm
EP/Ar
1310 1.58 1310 1.58 1301 1.72
1351 1.56 1351 1.56 1366 1.69
1440 1.56 1440 1.56 1454 1.57
1567 1.51 1567 1.51 1580 1.52
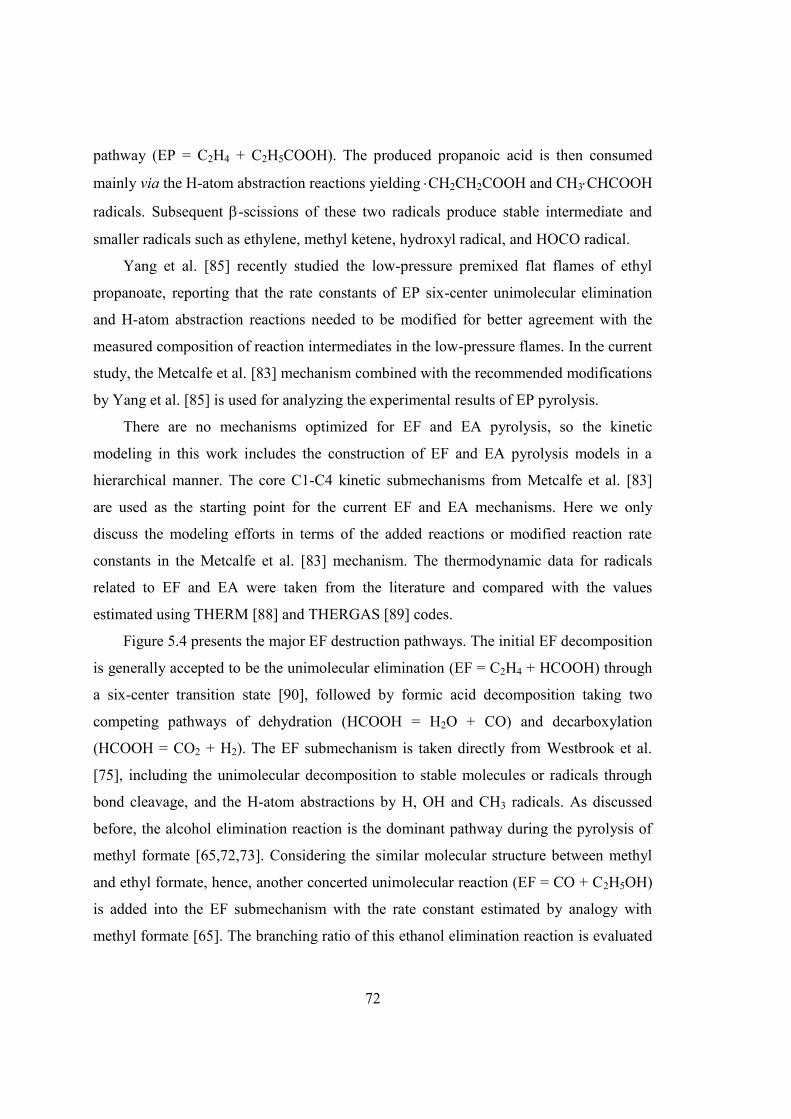
72
pathway (EP = C2H4 + C2H5COOH). The produced propanoic acid is then consumed
mainly via the H-atom abstraction reactions yielding CH2CH2COOH and CH3CHCOOH
radicals. Subsequent -scissions of these two radicals produce stable intermediate and
smaller radicals such as ethylene, methyl ketene, hydroxyl radical, and HOCO radical.
Yang et al. [85] recently studied the low-pressure premixed flat flames of ethyl
propanoate, reporting that the rate constants of EP six-center unimolecular elimination
and H-atom abstraction reactions needed to be modified for better agreement with the
measured composition of reaction intermediates in the low-pressure flames. In the current
study, the Metcalfe et al. [83] mechanism combined with the recommended modifications
by Yang et al. [85] is used for analyzing the experimental results of EP pyrolysis.
There are no mechanisms optimized for EF and EA pyrolysis, so the kinetic
modeling in this work includes the construction of EF and EA pyrolysis models in a
hierarchical manner. The core C1-C4 kinetic submechanisms from Metcalfe et al. [83]
are used as the starting point for the current EF and EA mechanisms. Here we only
discuss the modeling efforts in terms of the added reactions or modified reaction rate
constants in the Metcalfe et al. [83] mechanism. The thermodynamic data for radicals
related to EF and EA were taken from the literature and compared with the values
estimated using THERM [88] and THERGAS [89] codes.
Figure 5.4 presents the major EF destruction pathways. The initial EF decomposition
is generally accepted to be the unimolecular elimination (EF = C2H4 + HCOOH) through
a six-center transition state [90], followed by formic acid decomposition taking two
competing pathways of dehydration (HCOOH = H2O + CO) and decarboxylation
(HCOOH = CO2 + H2). The EF submechanism is taken directly from Westbrook et al.
[75], including the unimolecular decomposition to stable molecules or radicals through
bond cleavage, and the H-atom abstractions by H, OH and CH3 radicals. As discussed
before, the alcohol elimination reaction is the dominant pathway during the pyrolysis of
methyl formate [65,72,73]. Considering the similar molecular structure between methyl
and ethyl formate, hence, another concerted unimolecular reaction (EF = CO + C2H5OH)
is added into the EF submechanism with the rate constant estimated by analogy with
methyl formate [65]. The branching ratio of this ethanol elimination reaction is evaluated

73
to be 0.03 and 0.1 at 1200 K and 1800 K, respectively, proving to be a minor channel
during EF pyrolysis.
Formic acid is the major intermediate during EF pyrolysis, and its decomposition
has been the subject of several research groups [91–93]. Our current shock tube
measurements result in CO2/H2O ratios between 0.05 and 0.07, which is in excellent
agreement with the experimental observation reported by Saito et al. [93]. Hence, the rate
expressions recommended by Saito et al. [93] were used in the current EF submechanism.
The H-atom abstraction reactions are also the possible consumption pathways for formic
acid, with rate constants taken from [94]. The entire EF submechanism is summarized in
Table 5.2.
In the case of EA pyrolysis, the unimolecular decomposition of EA produces one
ethylene molecule and one acetic acid molecule via a six-center transition state, followed
by the subsequent decomposition of acetic acid to the final products of H2O, CO, CO2
and methane. The major destruction pathways for EA are described in Figure 5.5.
Similarly, the EA submechanism is taken directly from Westbrook et al. [75], including
EA unimolecular decomposition reactions and the H-atom abstraction by H, OH and CH3
radicals. Acetic acid is the major intermediate species during EA pyrolysis. Leplat and
Vandooren [95] recently performed numerical and experimental study of the combustion
of acetic acid in three CH3COOH/O2/Ar flat premixed flames burning at low pressure (50
mbar) and with equivalence ratios equal to 0.77, 0.9 and 1.05, respectively. Therefore, in
this work, the CH3COOH submechanism from Leplat and Vandooren [95] has been
added to the current EA pyrolysis model; see Table 5.3 for all the added reactions.
C2H4 +
H2O + CO
CO2 + H2
H
HO
CO
H
O
O HO
O
H
CH2
CH2
Figure 5.4 EF pyrolysis: major destruction pathways.

74
C2H4 +
H2O +
CO2 + CH4
CO
Figure 5.5 EA pyrolysis: major destruction pathways.
+OH
C2H4 +HOCO + C2H4-H
-H
Figure 5.6 EP pyrolysis: major destruction pathways.
5.4 Discussion
5.4.1 Ethyl Formate Pyrolysis
Simultaneous measurements of H2O and CO concentration time-histories are plotted
together in Figure 5.7 at temperatures between 1314 and 1629 K, pressures between 1.48
and 1.69 atm. Nearly equal formation rate (CO is slightly faster) is observed for H2O and
CO during EF pyrolysis over the entire temperature range, except for the case at the
highest temperature (1629 K). As EF decomposition is dominated by the concerted
unimolecular elimination to produce ethylene and formic acid, the measured 1:1 of
H2O/CO ratio is good evidence for the dehydration reaction of formic acid (HCOOH =
H2O + CO). Note that the H2O/CO ratio is less than 1 (actually 0.87) at the highest
temperature (1629 K) when these species time-histories reach their plateau levels at long
times. Such over-production of CO relative to H2O can be attributed to the added
competing EF decomposition channel (EF = CO + C2H5OH), which is more pronounced
at higher temperatures. Additionally, the product fractional yield shown in Figure 5.3(a)
reveals that CO2 is a minor product during EF pyrolysis with the CO2/H2O ratio between
0.05-0.07.
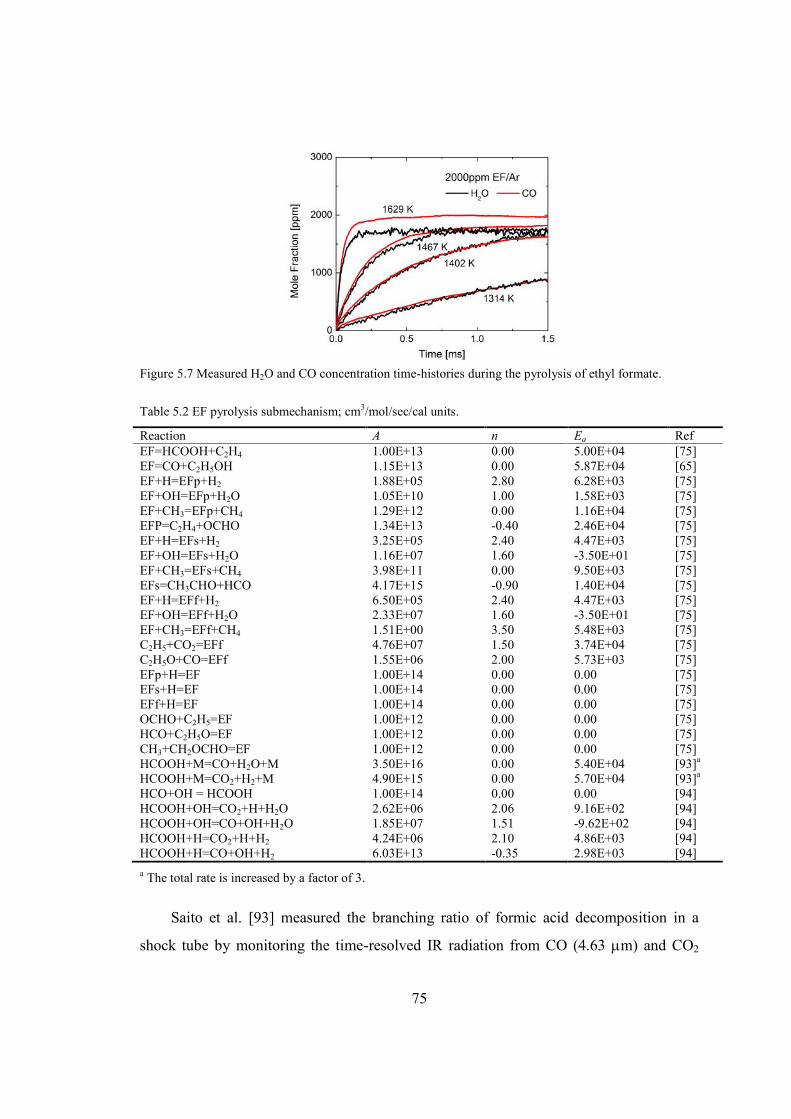
75
Figure 5.7 Measured H2O and CO concentration time-histories during the pyrolysis of ethyl formate.
Table 5.2 EF pyrolysis submechanism; cm3/mol/sec/cal units.
Reaction A n Ea RefEF=HCOOH+C2H4 1.00E+13 0.00 5.00E+04 [75]EF=CO+C2H5OH 1.15E+13 0.00 5.87E+04 [65]EF+H=EFp+H2 1.88E+05 2.80 6.28E+03 [75]EF+OH=EFp+H2O 1.05E+10 1.00 1.58E+03 [75]EF+CH3=EFp+CH4 1.29E+12 0.00 1.16E+04 [75]EFP=C2H4+OCHO 1.34E+13 -0.40 2.46E+04 [75]EF+H=EFs+H2 3.25E+05 2.40 4.47E+03 [75]EF+OH=EFs+H2O 1.16E+07 1.60 -3.50E+01 [75]EF+CH3=EFs+CH4 3.98E+11 0.00 9.50E+03 [75]EFs=CH3CHO+HCO 4.17E+15 -0.90 1.40E+04 [75]EF+H=EFf+H2 6.50E+05 2.40 4.47E+03 [75]EF+OH=EFf+H2O 2.33E+07 1.60 -3.50E+01 [75]EF+CH3=EFf+CH4 1.51E+00 3.50 5.48E+03 [75]C2H5+CO2=EFf 4.76E+07 1.50 3.74E+04 [75]C2H5O+CO=EFf 1.55E+06 2.00 5.73E+03 [75]EFp+H=EF 1.00E+14 0.00 0.00 [75]EFs+H=EF 1.00E+14 0.00 0.00 [75]EFf+H=EF 1.00E+14 0.00 0.00 [75]OCHO+C2H5=EF 1.00E+12 0.00 0.00 [75]HCO+C2H5O=EF 1.00E+12 0.00 0.00 [75]CH3+CH2OCHO=EF 1.00E+12 0.00 0.00 [75]HCOOH+M=CO+H2O+M 3.50E+16 0.00 5.40E+04 [93]a
HCOOH+M=CO2+H2+M 4.90E+15 0.00 5.70E+04 [93]a
HCO+OH = HCOOH 1.00E+14 0.00 0.00 [94]HCOOH+OH=CO2+H+H2O 2.62E+06 2.06 9.16E+02 [94]HCOOH+OH=CO+OH+H2O 1.85E+07 1.51 -9.62E+02 [94]HCOOH+H=CO2+H+H2 4.24E+06 2.10 4.86E+03 [94]HCOOH+H=CO+OH+H2 6.03E+13 -0.35 2.98E+03 [94]a The total rate is increased by a factor of 3.
Saito et al. [93] measured the branching ratio of formic acid decomposition in a
shock tube by monitoring the time-resolved IR radiation from CO (4.63 m) and CO2
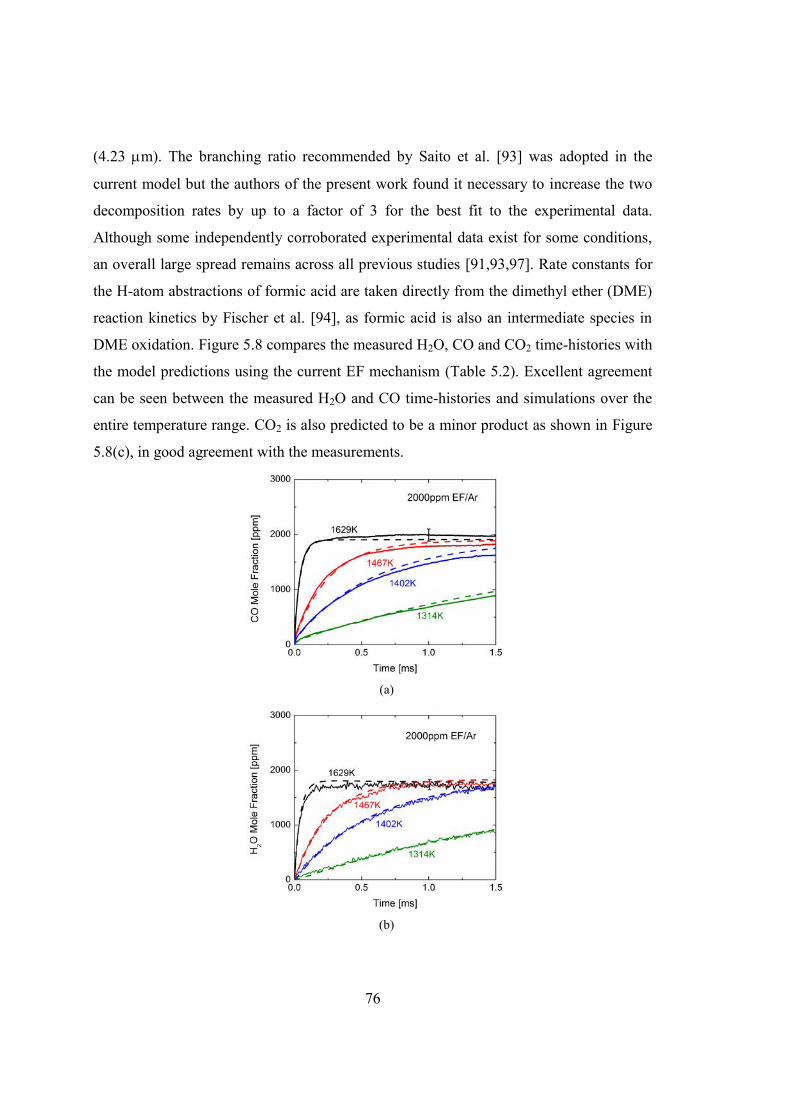
76
(4.23 m). The branching ratio recommended by Saito et al. [93] was adopted in the
current model but the authors of the present work found it necessary to increase the two
decomposition rates by up to a factor of 3 for the best fit to the experimental data.
Although some independently corroborated experimental data exist for some conditions,
an overall large spread remains across all previous studies [91,93,97]. Rate constants for
the H-atom abstractions of formic acid are taken directly from the dimethyl ether (DME)
reaction kinetics by Fischer et al. [94], as formic acid is also an intermediate species in
DME oxidation. Figure 5.8 compares the measured H2O, CO and CO2 time-histories with
the model predictions using the current EF mechanism (Table 5.2). Excellent agreement
can be seen between the measured H2O and CO time-histories and simulations over the
entire temperature range. CO2 is also predicted to be a minor product as shown in Figure
5.8(c), in good agreement with the measurements.
(a)
(b)
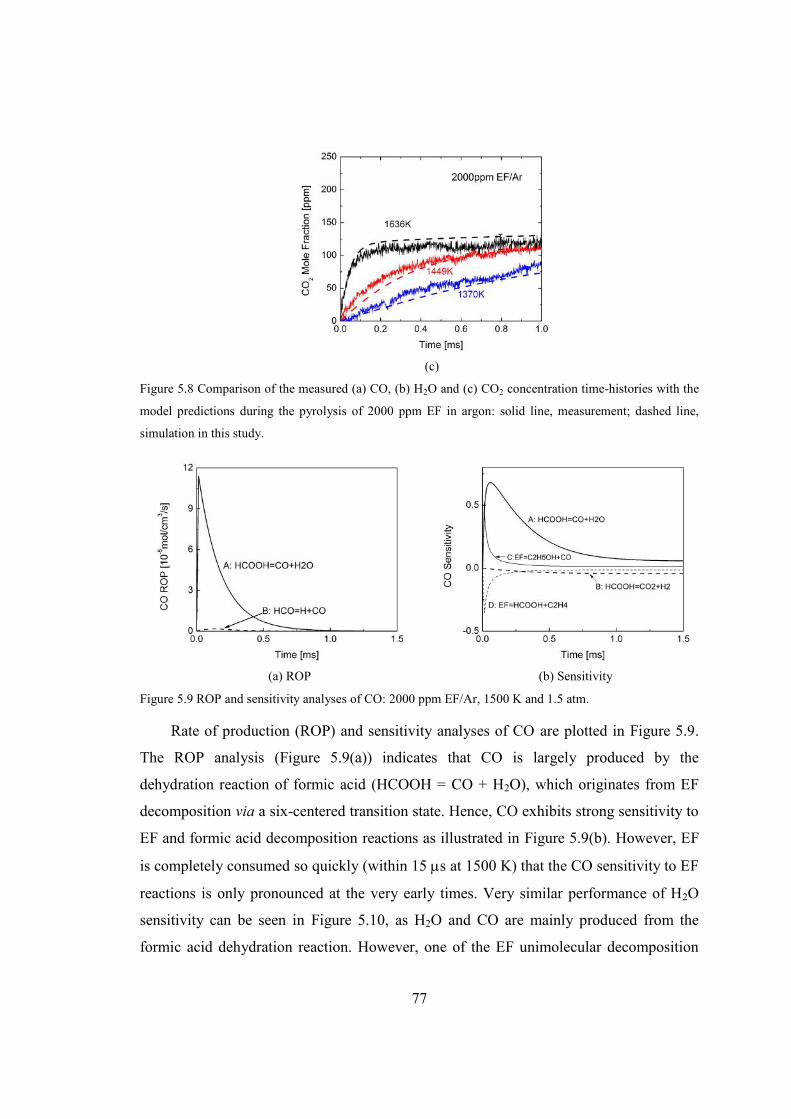
77
(c)
Figure 5.8 Comparison of the measured (a) CO, (b) H2O and (c) CO2 concentration time-histories with the
model predictions during the pyrolysis of 2000 ppm EF in argon: solid line, measurement; dashed line,
simulation in this study.
(a) ROP (b) Sensitivity
Figure 5.9 ROP and sensitivity analyses of CO: 2000 ppm EF/Ar, 1500 K and 1.5 atm.
Rate of production (ROP) and sensitivity analyses of CO are plotted in Figure 5.9.
The ROP analysis (Figure 5.9(a)) indicates that CO is largely produced by the
dehydration reaction of formic acid (HCOOH = CO + H2O), which originates from EF
decomposition via a six-centered transition state. Hence, CO exhibits strong sensitivity to
EF and formic acid decomposition reactions as illustrated in Figure 5.9(b). However, EF
is completely consumed so quickly (within 15 s at 1500 K) that the CO sensitivity to EF
reactions is only pronounced at the very early times. Very similar performance of H2O
sensitivity can be seen in Figure 5.10, as H2O and CO are mainly produced from the
formic acid dehydration reaction. However, one of the EF unimolecular decomposition
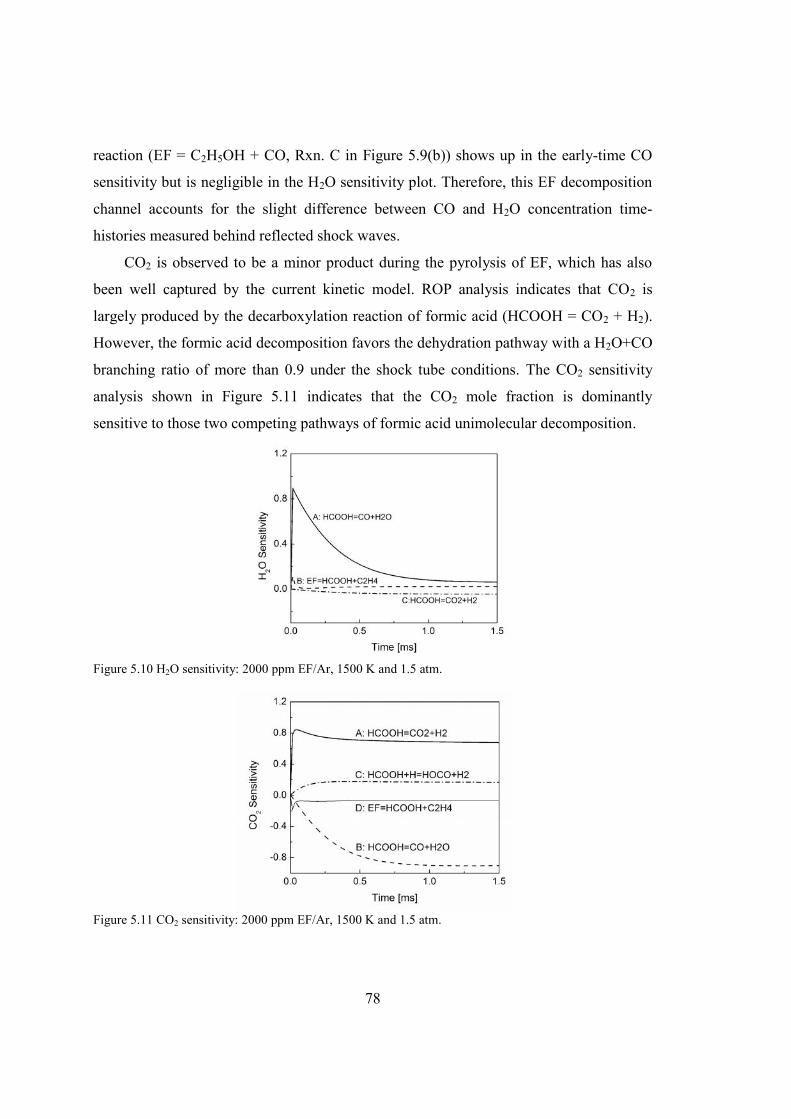
78
reaction (EF = C2H5OH + CO, Rxn. C in Figure 5.9(b)) shows up in the early-time CO
sensitivity but is negligible in the H2O sensitivity plot. Therefore, this EF decomposition
channel accounts for the slight difference between CO and H2O concentration time-
histories measured behind reflected shock waves.
CO2 is observed to be a minor product during the pyrolysis of EF, which has also
been well captured by the current kinetic model. ROP analysis indicates that CO2 is
largely produced by the decarboxylation reaction of formic acid (HCOOH = CO2 + H2).
However, the formic acid decomposition favors the dehydration pathway with a H2O+CO
branching ratio of more than 0.9 under the shock tube conditions. The CO2 sensitivity
analysis shown in Figure 5.11 indicates that the CO2 mole fraction is dominantly
sensitive to those two competing pathways of formic acid unimolecular decomposition.
Figure 5.10 H2O sensitivity: 2000 ppm EF/Ar, 1500 K and 1.5 atm.
Figure 5.11 CO2 sensitivity: 2000 ppm EF/Ar, 1500 K and 1.5 atm.
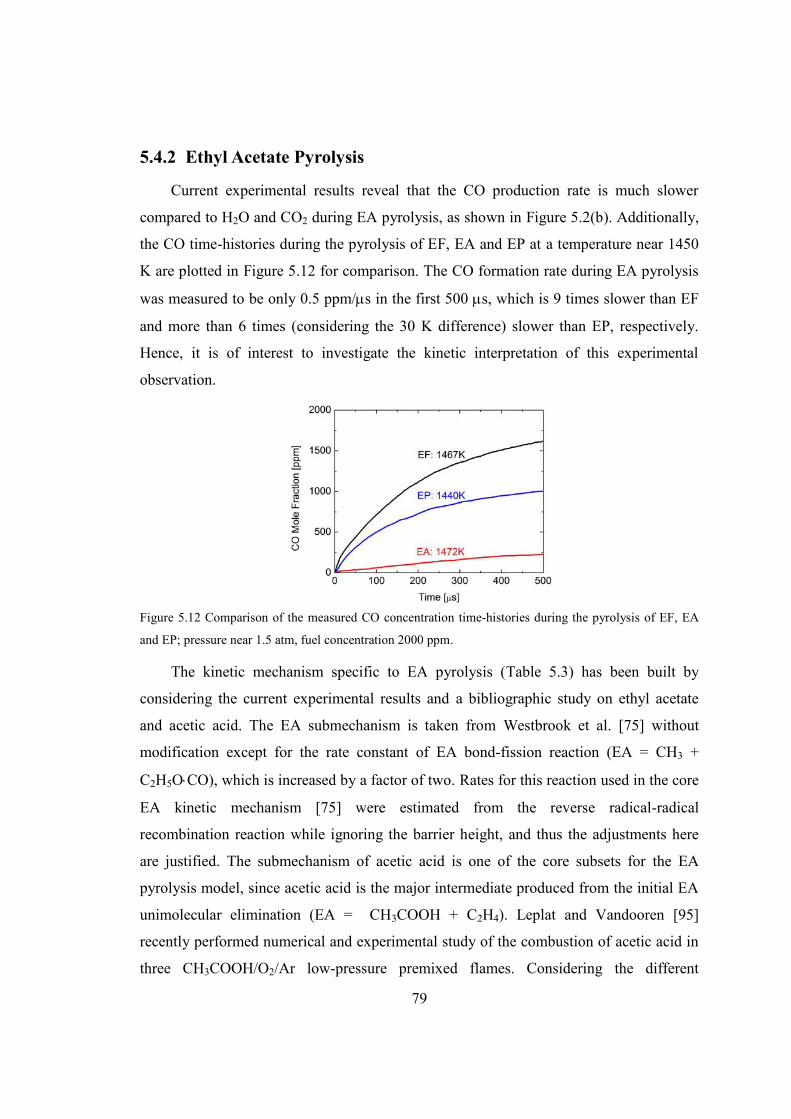
79
5.4.2 Ethyl Acetate Pyrolysis
Current experimental results reveal that the CO production rate is much slower
compared to H2O and CO2 during EA pyrolysis, as shown in Figure 5.2(b). Additionally,
the CO time-histories during the pyrolysis of EF, EA and EP at a temperature near 1450
K are plotted in Figure 5.12 for comparison. The CO formation rate during EA pyrolysis
was measured to be only 0.5 ppm/s in the first 500 s, which is 9 times slower than EF
and more than 6 times (considering the 30 K difference) slower than EP, respectively.
Hence, it is of interest to investigate the kinetic interpretation of this experimental
observation.
Figure 5.12 Comparison of the measured CO concentration time-histories during the pyrolysis of EF, EA
and EP; pressure near 1.5 atm, fuel concentration 2000 ppm.
The kinetic mechanism specific to EA pyrolysis (Table 5.3) has been built by
considering the current experimental results and a bibliographic study on ethyl acetate
and acetic acid. The EA submechanism is taken from Westbrook et al. [75] without
modification except for the rate constant of EA bond-fission reaction (EA = CH3 +
C2H5OCO), which is increased by a factor of two. Rates for this reaction used in the core
EA kinetic mechanism [75] were estimated from the reverse radical-radical
recombination reaction while ignoring the barrier height, and thus the adjustments here
are justified. The submechanism of acetic acid is one of the core subsets for the EA
pyrolysis model, since acetic acid is the major intermediate produced from the initial EA
unimolecular elimination (EA = CH3COOH + C2H4). Leplat and Vandooren [95]
recently performed numerical and experimental study of the combustion of acetic acid in
three CH3COOH/O2/Ar low-pressure premixed flames. Considering the different
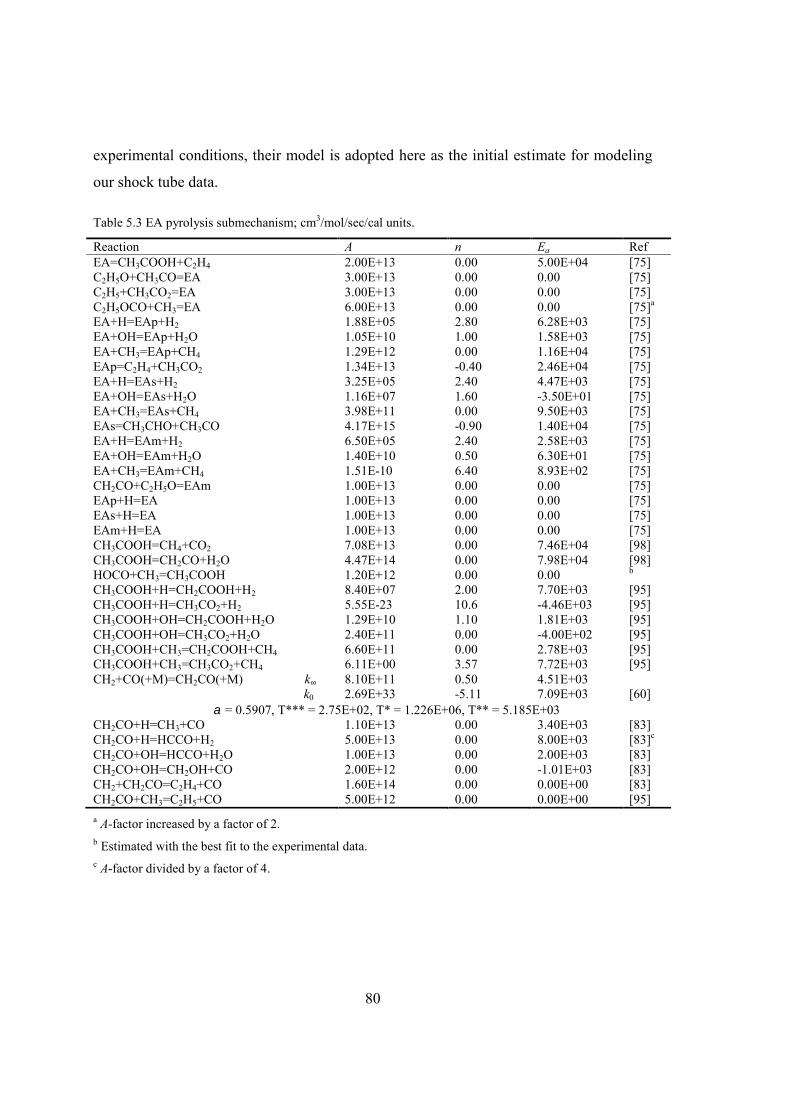
80
experimental conditions, their model is adopted here as the initial estimate for modeling
our shock tube data.
Table 5.3 EA pyrolysis submechanism; cm3/mol/sec/cal units.
Reaction A n Ea RefEA=CH3COOH+C2H4 2.00E+13 0.00 5.00E+04 [75]C2H5O+CH3CO=EA 3.00E+13 0.00 0.00 [75]C2H5+CH3CO2=EA 3.00E+13 0.00 0.00 [75]C2H5OCO+CH3=EA 6.00E+13 0.00 0.00 [75]a
EA+H=EAp+H2 1.88E+05 2.80 6.28E+03 [75]EA+OH=EAp+H2O 1.05E+10 1.00 1.58E+03 [75]EA+CH3=EAp+CH4 1.29E+12 0.00 1.16E+04 [75]EAp=C2H4+CH3CO2 1.34E+13 -0.40 2.46E+04 [75]EA+H=EAs+H2 3.25E+05 2.40 4.47E+03 [75]EA+OH=EAs+H2O 1.16E+07 1.60 -3.50E+01 [75]EA+CH3=EAs+CH4 3.98E+11 0.00 9.50E+03 [75]EAs=CH3CHO+CH3CO 4.17E+15 -0.90 1.40E+04 [75]EA+H=EAm+H2 6.50E+05 2.40 2.58E+03 [75]EA+OH=EAm+H2O 1.40E+10 0.50 6.30E+01 [75]EA+CH3=EAm+CH4 1.51E-10 6.40 8.93E+02 [75]CH2CO+C2H5O=EAm 1.00E+13 0.00 0.00 [75]EAp+H=EA 1.00E+13 0.00 0.00 [75]EAs+H=EA 1.00E+13 0.00 0.00 [75]EAm+H=EA 1.00E+13 0.00 0.00 [75]CH3COOH=CH4+CO2 7.08E+13 0.00 7.46E+04 [98]CH3COOH=CH2CO+H2O 4.47E+14 0.00 7.98E+04 [98]HOCO+CH3=CH3COOH 1.20E+12 0.00 0.00 b
CH3COOH+H=CH2COOH+H2 8.40E+07 2.00 7.70E+03 [95]CH3COOH+H=CH3CO2+H2 5.55E-23 10.6 -4.46E+03 [95]CH3COOH+OH=CH2COOH+H2O 1.29E+10 1.10 1.81E+03 [95]CH3COOH+OH=CH3CO2+H2O 2.40E+11 0.00 -4.00E+02 [95]CH3COOH+CH3=CH2COOH+CH4 6.60E+11 0.00 2.78E+03 [95]CH3COOH+CH3=CH3CO2+CH4 6.11E+00 3.57 7.72E+03 [95]CH2+CO(+M)=CH2CO(+M) k∞
k0
8.10E+112.69E+33
0.50-5.11
4.51E+037.09E+03 [60]
= 0.5907, T*** = 2.75E+02, T* = 1.226E+06, T** = 5.185E+03CH2CO+H=CH3+CO 1.10E+13 0.00 3.40E+03 [83]CH2CO+H=HCCO+H2 5.00E+13 0.00 8.00E+03 [83]c
CH2CO+OH=HCCO+H2O 1.00E+13 0.00 2.00E+03 [83]CH2CO+OH=CH2OH+CO 2.00E+12 0.00 -1.01E+03 [83]CH2+CH2CO=C2H4+CO 1.60E+14 0.00 0.00E+00 [83]CH2CO+CH3=C2H5+CO 5.00E+12 0.00 0.00E+00 [95]a A-factor increased by a factor of 2.b Estimated with the best fit to the experimental data.c A-factor divided by a factor of 4.
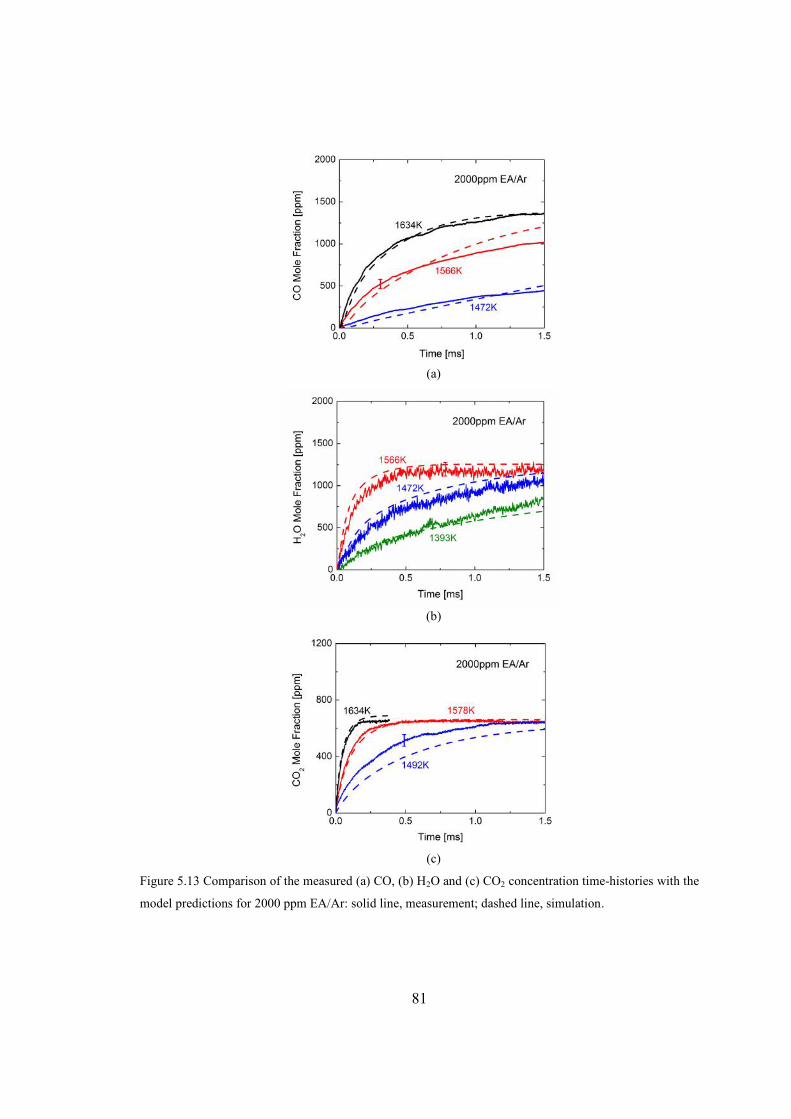
81
(a)
(b)
(c)
Figure 5.13 Comparison of the measured (a) CO, (b) H2O and (c) CO2 concentration time-histories with the
model predictions for 2000 ppm EA/Ar: solid line, measurement; dashed line, simulation.
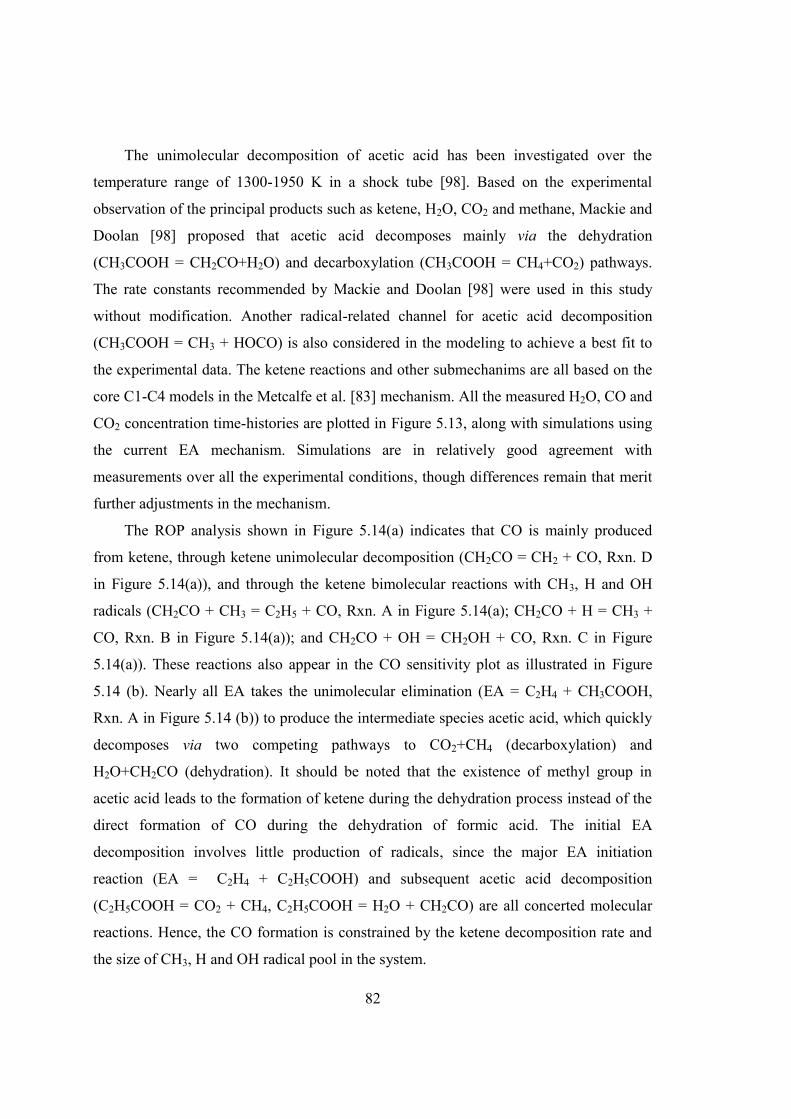
82
The unimolecular decomposition of acetic acid has been investigated over the
temperature range of 1300-1950 K in a shock tube [98]. Based on the experimental
observation of the principal products such as ketene, H2O, CO2 and methane, Mackie and
Doolan [98] proposed that acetic acid decomposes mainly via the dehydration
(CH3COOH = CH2CO+H2O) and decarboxylation (CH3COOH = CH4+CO2) pathways.
The rate constants recommended by Mackie and Doolan [98] were used in this study
without modification. Another radical-related channel for acetic acid decomposition
(CH3COOH = CH3 + HOCO) is also considered in the modeling to achieve a best fit to
the experimental data. The ketene reactions and other submechanims are all based on the
core C1-C4 models in the Metcalfe et al. [83] mechanism. All the measured H2O, CO and
CO2 concentration time-histories are plotted in Figure 5.13, along with simulations using
the current EA mechanism. Simulations are in relatively good agreement with
measurements over all the experimental conditions, though differences remain that merit
further adjustments in the mechanism.
The ROP analysis shown in Figure 5.14(a) indicates that CO is mainly produced
from ketene, through ketene unimolecular decomposition (CH2CO = CH2 + CO, Rxn. D
in Figure 5.14(a)), and through the ketene bimolecular reactions with CH3, H and OH
radicals (CH2CO + CH3 = C2H5 + CO, Rxn. A in Figure 5.14(a); CH2CO + H = CH3 +
CO, Rxn. B in Figure 5.14(a)); and CH2CO + OH = CH2OH + CO, Rxn. C in Figure
5.14(a)). These reactions also appear in the CO sensitivity plot as illustrated in Figure
5.14 (b). Nearly all EA takes the unimolecular elimination (EA = C2H4 + CH3COOH,
Rxn. A in Figure 5.14 (b)) to produce the intermediate species acetic acid, which quickly
decomposes via two competing pathways to CO2+CH4 (decarboxylation) and
H2O+CH2CO (dehydration). It should be noted that the existence of methyl group in
acetic acid leads to the formation of ketene during the dehydration process instead of the
direct formation of CO during the dehydration of formic acid. The initial EA
decomposition involves little production of radicals, since the major EA initiation
reaction (EA = C2H4 + C2H5COOH) and subsequent acetic acid decomposition
(C2H5COOH = CO2 + CH4, C2H5COOH = H2O + CH2CO) are all concerted molecular
reactions. Hence, the CO formation is constrained by the ketene decomposition rate and
the size of CH3, H and OH radical pool in the system.
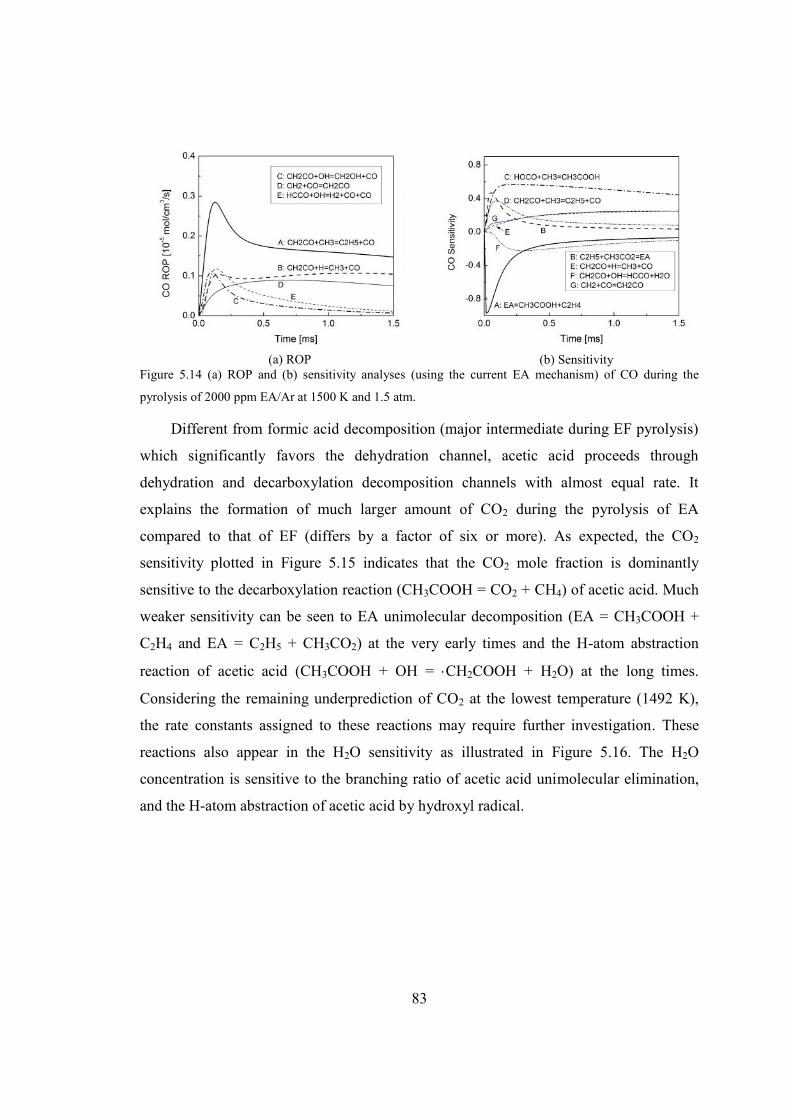
83
(a) ROP (b) SensitivityFigure 5.14 (a) ROP and (b) sensitivity analyses (using the current EA mechanism) of CO during the
pyrolysis of 2000 ppm EA/Ar at 1500 K and 1.5 atm.
Different from formic acid decomposition (major intermediate during EF pyrolysis)
which significantly favors the dehydration channel, acetic acid proceeds through
dehydration and decarboxylation decomposition channels with almost equal rate. It
explains the formation of much larger amount of CO2 during the pyrolysis of EA
compared to that of EF (differs by a factor of six or more). As expected, the CO2
sensitivity plotted in Figure 5.15 indicates that the CO2 mole fraction is dominantly
sensitive to the decarboxylation reaction (CH3COOH = CO2 + CH4) of acetic acid. Much
weaker sensitivity can be seen to EA unimolecular decomposition (EA = CH3COOH +
C2H4 and EA = C2H5 + CH3CO2) at the very early times and the H-atom abstraction
reaction of acetic acid (CH3COOH + OH = CH2COOH + H2O) at the long times.
Considering the remaining underprediction of CO2 at the lowest temperature (1492 K),
the rate constants assigned to these reactions may require further investigation. These
reactions also appear in the H2O sensitivity as illustrated in Figure 5.16. The H2O
concentration is sensitive to the branching ratio of acetic acid unimolecular elimination,
and the H-atom abstraction of acetic acid by hydroxyl radical.
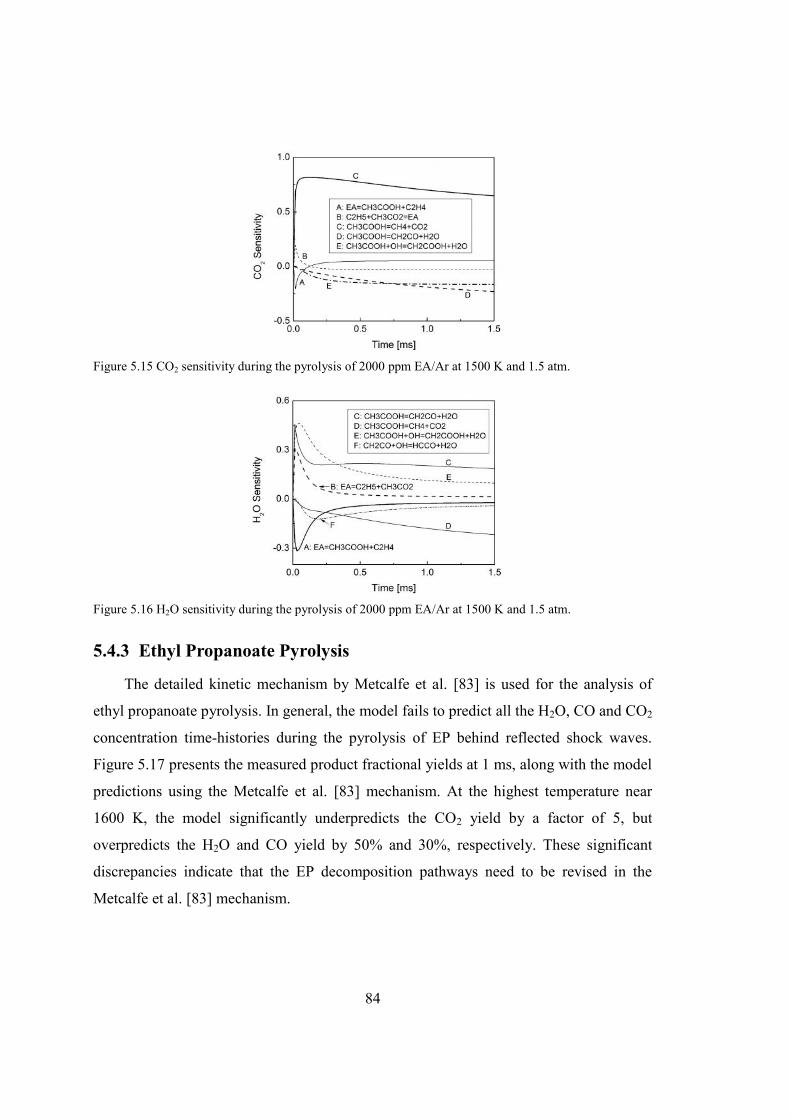
84
Figure 5.15 CO2 sensitivity during the pyrolysis of 2000 ppm EA/Ar at 1500 K and 1.5 atm.
Figure 5.16 H2O sensitivity during the pyrolysis of 2000 ppm EA/Ar at 1500 K and 1.5 atm.
5.4.3 Ethyl Propanoate Pyrolysis
The detailed kinetic mechanism by Metcalfe et al. [83] is used for the analysis of
ethyl propanoate pyrolysis. In general, the model fails to predict all the H2O, CO and CO2
concentration time-histories during the pyrolysis of EP behind reflected shock waves.
Figure 5.17 presents the measured product fractional yields at 1 ms, along with the model
predictions using the Metcalfe et al. [83] mechanism. At the highest temperature near
1600 K, the model significantly underpredicts the CO2 yield by a factor of 5, but
overpredicts the H2O and CO yield by 50% and 30%, respectively. These significant
discrepancies indicate that the EP decomposition pathways need to be revised in the
Metcalfe et al. [83] mechanism.
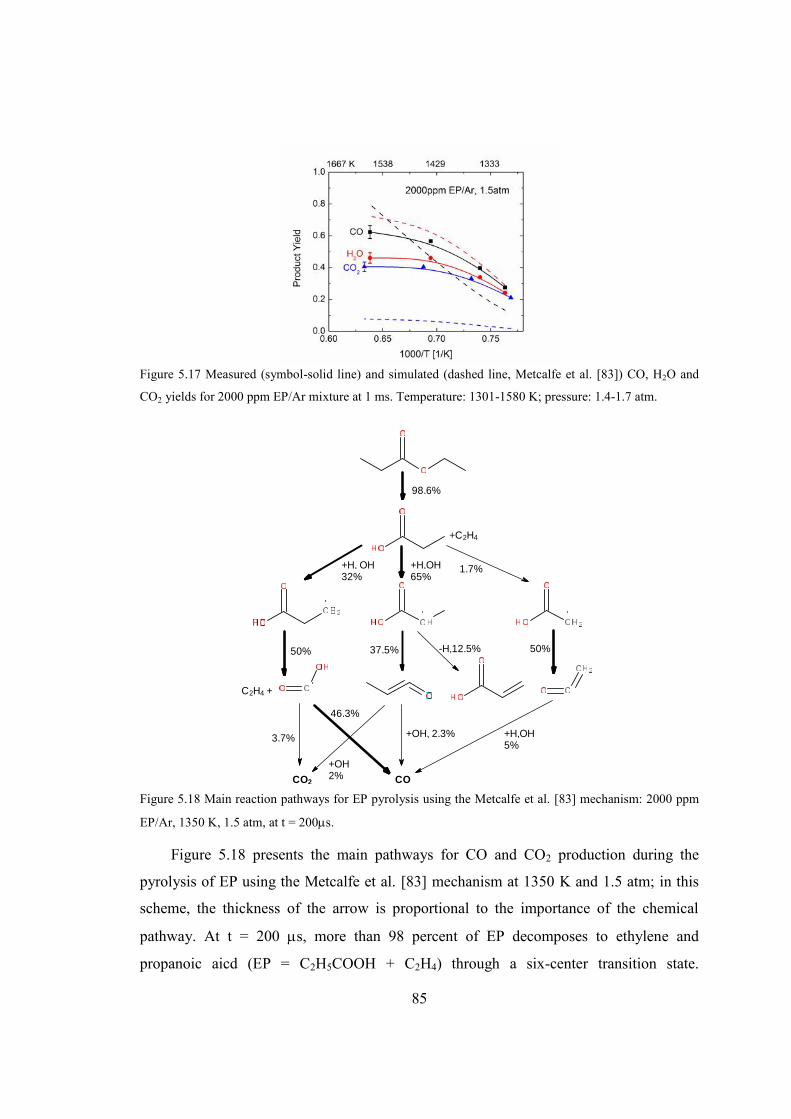
85
Figure 5.17 Measured (symbol-solid line) and simulated (dashed line, Metcalfe et al. [83]) CO, H2O and
CO2 yields for 2000 ppm EP/Ar mixture at 1 ms. Temperature: 1301-1580 K; pressure: 1.4-1.7 atm.
98.6%
50%
+C2H4
COCO2
46.3%
+H, OH32%
+H,OH65%
1.7%
37.5% -H,12.5% 50%
3.7% +H,OH5%
+OH2%
+OH, 2.3%
C2H4 +
Figure 5.18 Main reaction pathways for EP pyrolysis using the Metcalfe et al. [83] mechanism: 2000 ppm
EP/Ar, 1350 K, 1.5 atm, at t = 200s.
Figure 5.18 presents the main pathways for CO and CO2 production during the
pyrolysis of EP using the Metcalfe et al. [83] mechanism at 1350 K and 1.5 atm; in this
scheme, the thickness of the arrow is proportional to the importance of the chemical
pathway. At t = 200 s, more than 98 percent of EP decomposes to ethylene and
propanoic aicd (EP = C2H5COOH + C2H4) through a six-center transition state.
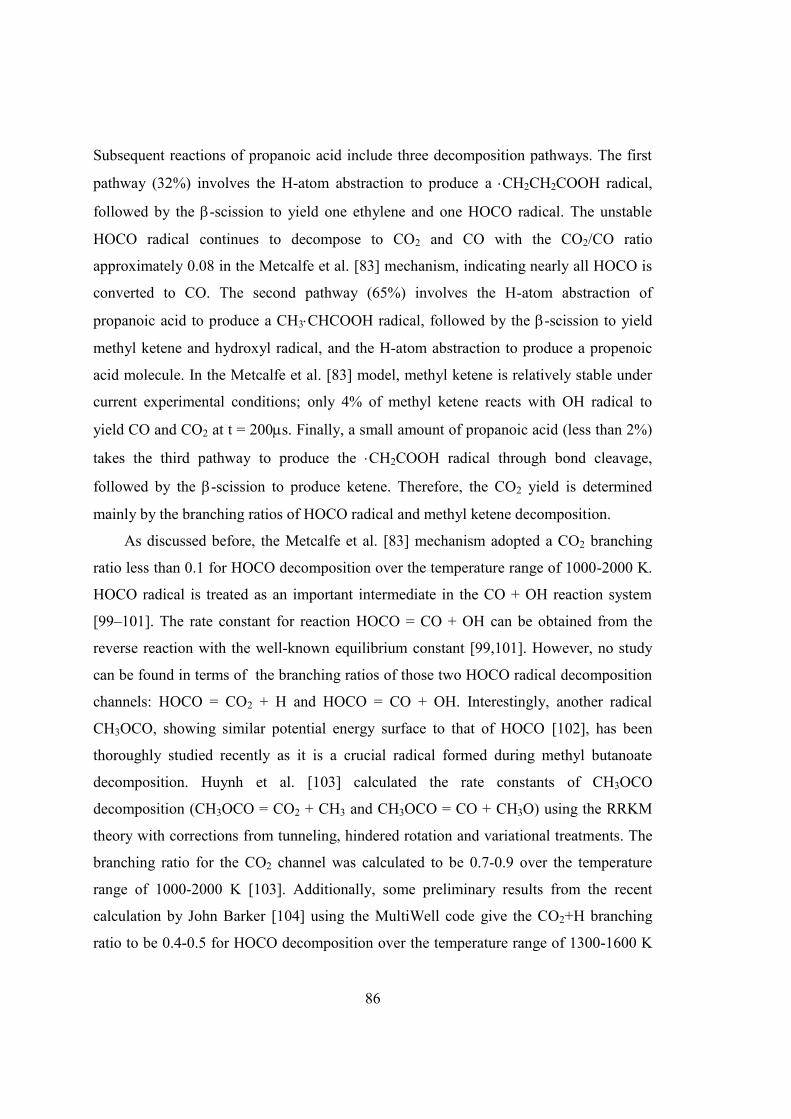
86
Subsequent reactions of propanoic acid include three decomposition pathways. The first
pathway (32%) involves the H-atom abstraction to produce a CH2CH2COOH radical,
followed by the -scission to yield one ethylene and one HOCO radical. The unstable
HOCO radical continues to decompose to CO2 and CO with the CO2/CO ratio
approximately 0.08 in the Metcalfe et al. [83] mechanism, indicating nearly all HOCO is
converted to CO. The second pathway (65%) involves the H-atom abstraction of
propanoic acid to produce a CH3CHCOOH radical, followed by the -scission to yield
methyl ketene and hydroxyl radical, and the H-atom abstraction to produce a propenoic
acid molecule. In the Metcalfe et al. [83] model, methyl ketene is relatively stable under
current experimental conditions; only 4% of methyl ketene reacts with OH radical to
yield CO and CO2 at t = 200s. Finally, a small amount of propanoic acid (less than 2%)
takes the third pathway to produce the CH2COOH radical through bond cleavage,
followed by the -scission to produce ketene. Therefore, the CO2 yield is determined
mainly by the branching ratios of HOCO radical and methyl ketene decomposition.
As discussed before, the Metcalfe et al. [83] mechanism adopted a CO2 branching
ratio less than 0.1 for HOCO decomposition over the temperature range of 1000-2000 K.
HOCO radical is treated as an important intermediate in the CO + OH reaction system
[99–101]. The rate constant for reaction HOCO = CO + OH can be obtained from the
reverse reaction with the well-known equilibrium constant [99,101]. However, no study
can be found in terms of the branching ratios of those two HOCO radical decomposition
channels: HOCO = CO2 + H and HOCO = CO + OH. Interestingly, another radical
CH3OCO, showing similar potential energy surface to that of HOCO [102], has been
thoroughly studied recently as it is a crucial radical formed during methyl butanoate
decomposition. Huynh et al. [103] calculated the rate constants of CH3OCO
decomposition (CH3OCO = CO2 + CH3 and CH3OCO = CO + CH3O) using the RRKM
theory with corrections from tunneling, hindered rotation and variational treatments. The
branching ratio for the CO2 channel was calculated to be 0.7-0.9 over the temperature
range of 1000-2000 K [103]. Additionally, some preliminary results from the recent
calculation by John Barker [104] using the MultiWell code give the CO2+H branching
ratio to be 0.4-0.5 for HOCO decomposition over the temperature range of 1300-1600 K
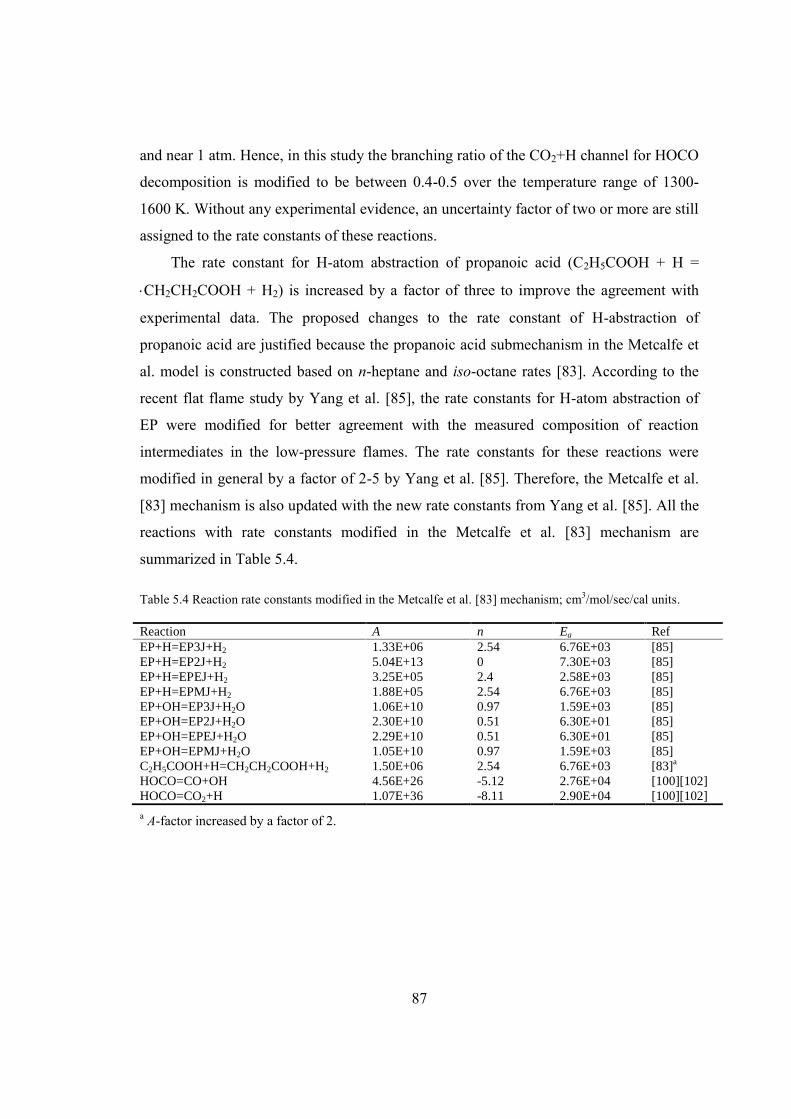
87
and near 1 atm. Hence, in this study the branching ratio of the CO2+H channel for HOCO
decomposition is modified to be between 0.4-0.5 over the temperature range of 1300-
1600 K. Without any experimental evidence, an uncertainty factor of two or more are still
assigned to the rate constants of these reactions.
The rate constant for H-atom abstraction of propanoic acid (C2H5COOH + H =
CH2CH2COOH + H2) is increased by a factor of three to improve the agreement with
experimental data. The proposed changes to the rate constant of H-abstraction of
propanoic acid are justified because the propanoic acid submechanism in the Metcalfe et
al. model is constructed based on n-heptane and iso-octane rates [83]. According to the
recent flat flame study by Yang et al. [85], the rate constants for H-atom abstraction of
EP were modified for better agreement with the measured composition of reaction
intermediates in the low-pressure flames. The rate constants for these reactions were
modified in general by a factor of 2-5 by Yang et al. [85]. Therefore, the Metcalfe et al.
[83] mechanism is also updated with the new rate constants from Yang et al. [85]. All the
reactions with rate constants modified in the Metcalfe et al. [83] mechanism are
summarized in Table 5.4.
Table 5.4 Reaction rate constants modified in the Metcalfe et al. [83] mechanism; cm3/mol/sec/cal units.
Reaction A n Ea RefEP+H=EP3J+H2 1.33E+06 2.54 6.76E+03 [85]EP+H=EP2J+H2 5.04E+13 0 7.30E+03 [85]EP+H=EPEJ+H2 3.25E+05 2.4 2.58E+03 [85]EP+H=EPMJ+H2 1.88E+05 2.54 6.76E+03 [85]EP+OH=EP3J+H2O 1.06E+10 0.97 1.59E+03 [85]EP+OH=EP2J+H2O 2.30E+10 0.51 6.30E+01 [85]EP+OH=EPEJ+H2O 2.29E+10 0.51 6.30E+01 [85]EP+OH=EPMJ+H2O 1.05E+10 0.97 1.59E+03 [85]C2H5COOH+H=CH2CH2COOH+H2 1.50E+06 2.54 6.76E+03 [83]a
HOCO=CO+OH 4.56E+26 -5.12 2.76E+04 [100][102]HOCO=CO2+H 1.07E+36 -8.11 2.90E+04 [100][102]
a A-factor increased by a factor of 2.
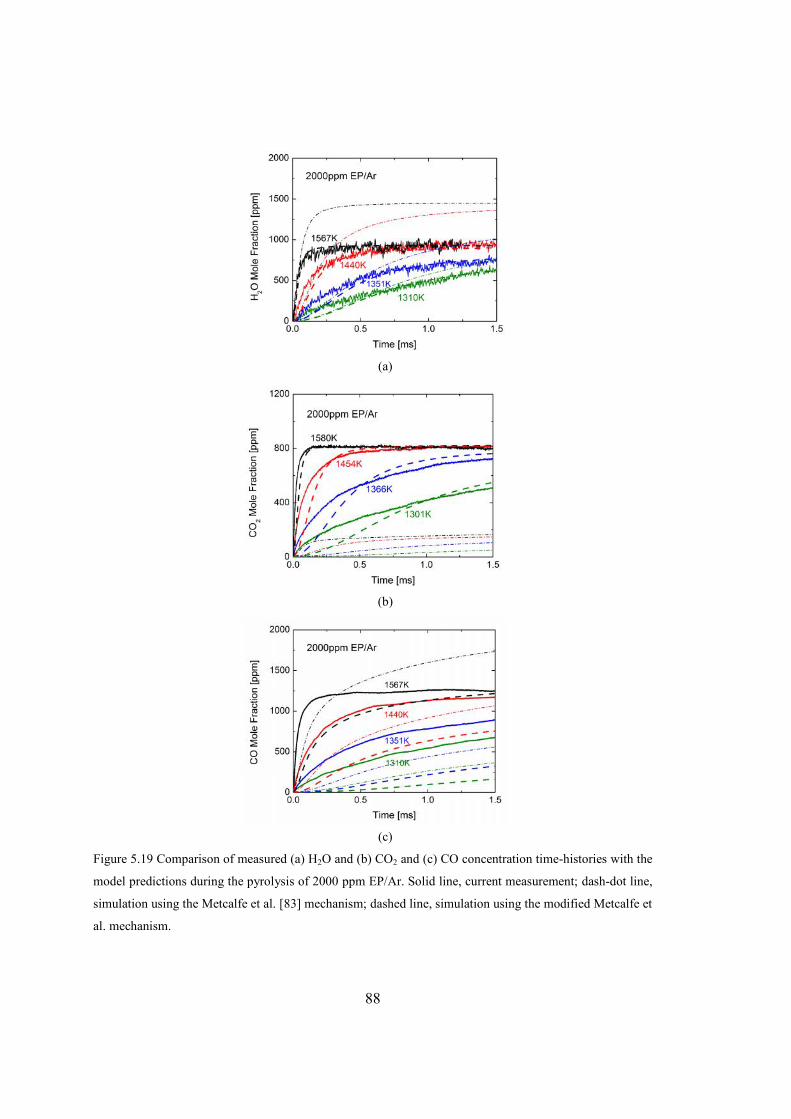
88
(a)
(b)
(c)
Figure 5.19 Comparison of measured (a) H2O and (b) CO2 and (c) CO concentration time-histories with the
model predictions during the pyrolysis of 2000 ppm EP/Ar. Solid line, current measurement; dash-dot line,
simulation using the Metcalfe et al. [83] mechanism; dashed line, simulation using the modified Metcalfe et
al. mechanism.
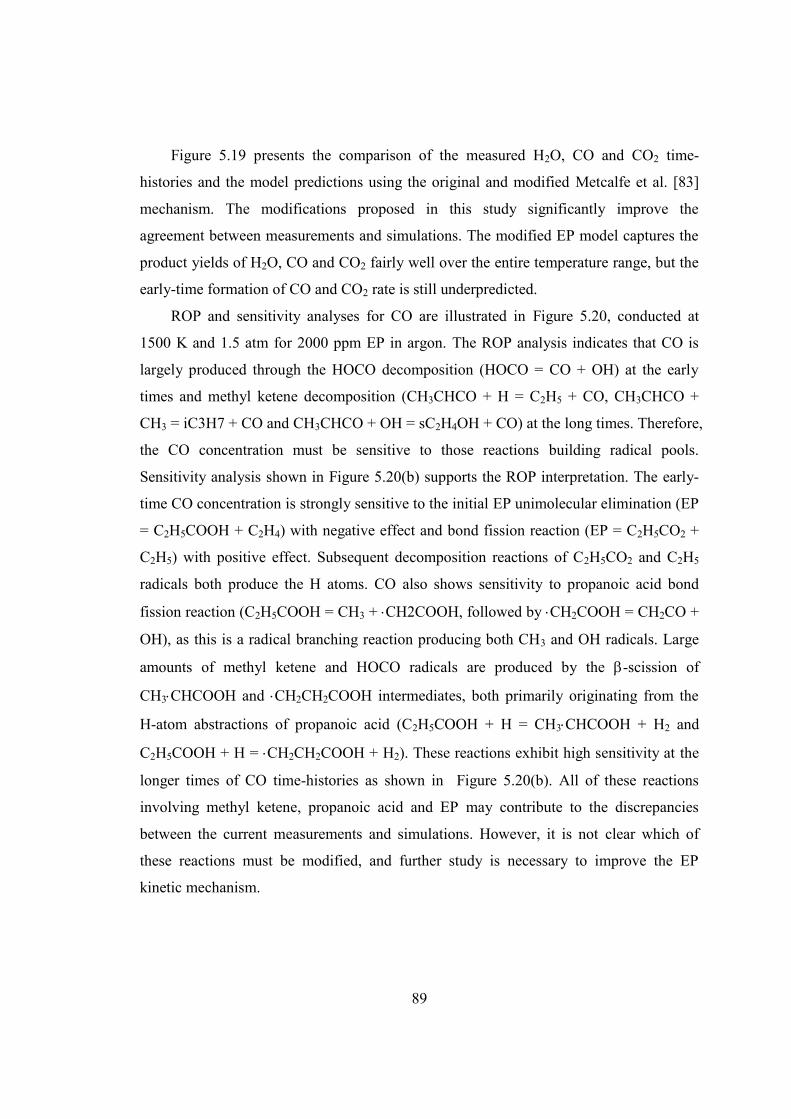
89
Figure 5.19 presents the comparison of the measured H2O, CO and CO2 time-
histories and the model predictions using the original and modified Metcalfe et al. [83]
mechanism. The modifications proposed in this study significantly improve the
agreement between measurements and simulations. The modified EP model captures the
product yields of H2O, CO and CO2 fairly well over the entire temperature range, but the
early-time formation of CO and CO2 rate is still underpredicted.
ROP and sensitivity analyses for CO are illustrated in Figure 5.20, conducted at
1500 K and 1.5 atm for 2000 ppm EP in argon. The ROP analysis indicates that CO is
largely produced through the HOCO decomposition (HOCO = CO + OH) at the early
times and methyl ketene decomposition (CH3CHCO + H = C2H5 + CO, CH3CHCO +
CH3 = iC3H7 + CO and CH3CHCO + OH = sC2H4OH + CO) at the long times. Therefore,
the CO concentration must be sensitive to those reactions building radical pools.
Sensitivity analysis shown in Figure 5.20(b) supports the ROP interpretation. The early-
time CO concentration is strongly sensitive to the initial EP unimolecular elimination (EP
= C2H5COOH + C2H4) with negative effect and bond fission reaction (EP = C2H5CO2 +
C2H5) with positive effect. Subsequent decomposition reactions of C2H5CO2 and C2H5
radicals both produce the H atoms. CO also shows sensitivity to propanoic acid bond
fission reaction (C2H5COOH = CH3 + CH2COOH, followed by CH2COOH = CH2CO +
OH), as this is a radical branching reaction producing both CH3 and OH radicals. Large
amounts of methyl ketene and HOCO radicals are produced by the -scission of
CH3CHCOOH and CH2CH2COOH intermediates, both primarily originating from the
H-atom abstractions of propanoic acid (C2H5COOH + H = CH3CHCOOH + H2 and
C2H5COOH + H = CH2CH2COOH + H2). These reactions exhibit high sensitivity at the
longer times of CO time-histories as shown in Figure 5.20(b). All of these reactions
involving methyl ketene, propanoic acid and EP may contribute to the discrepancies
between the current measurements and simulations. However, it is not clear which of
these reactions must be modified, and further study is necessary to improve the EP
kinetic mechanism.
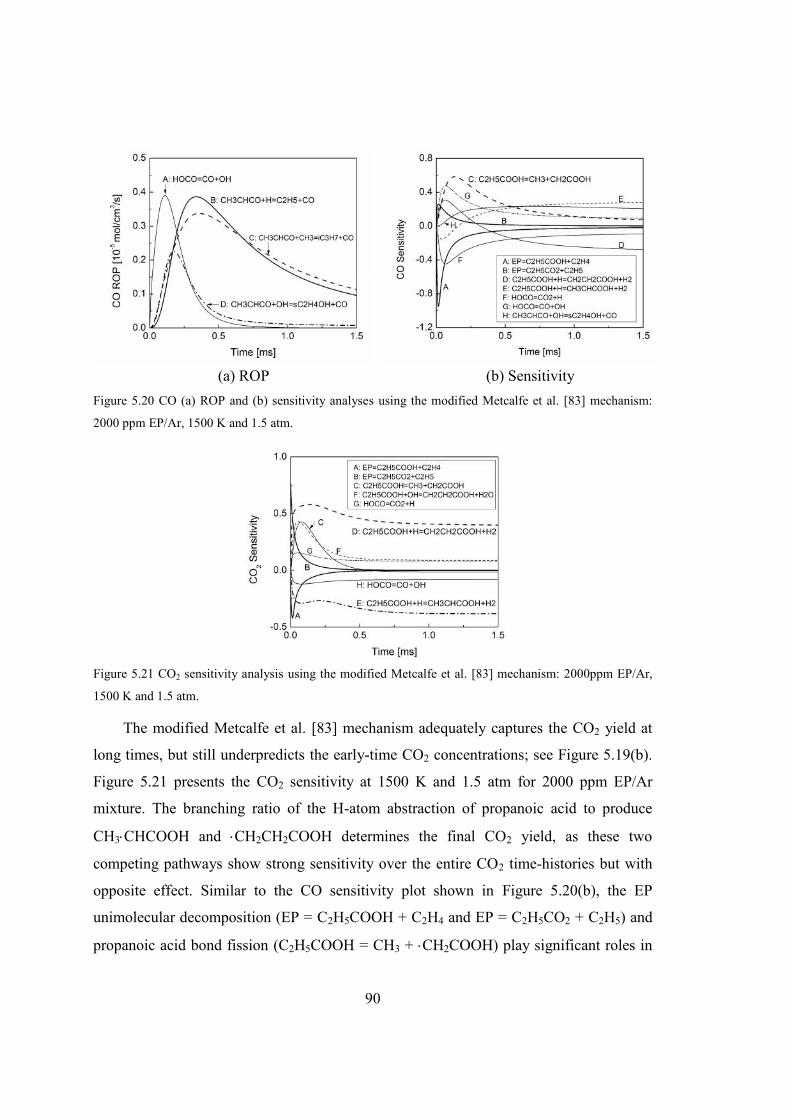
90
(a) ROP (b) SensitivityFigure 5.20 CO (a) ROP and (b) sensitivity analyses using the modified Metcalfe et al. [83] mechanism:
2000 ppm EP/Ar, 1500 K and 1.5 atm.
Figure 5.21 CO2 sensitivity analysis using the modified Metcalfe et al. [83] mechanism: 2000ppm EP/Ar,
1500 K and 1.5 atm.
The modified Metcalfe et al. [83] mechanism adequately captures the CO2 yield at
long times, but still underpredicts the early-time CO2 concentrations; see Figure 5.19(b).
Figure 5.21 presents the CO2 sensitivity at 1500 K and 1.5 atm for 2000 ppm EP/Ar
mixture. The branching ratio of the H-atom abstraction of propanoic acid to produce
CH3CHCOOH and CH2CH2COOH determines the final CO2 yield, as these two
competing pathways show strong sensitivity over the entire CO2 time-histories but with
opposite effect. Similar to the CO sensitivity plot shown in Figure 5.20(b), the EP
unimolecular decomposition (EP = C2H5COOH + C2H4 and EP = C2H5CO2 + C2H5) and
propanoic acid bond fission (C2H5COOH = CH3 + CH2COOH) play significant roles in
91
determining the early-time CO2 concentration. As evident from the discrepancies
between simulations and experimental data, further refinements to the Metcalfe et al. [83]
mechanism are needed. Because of the large number of reaction pathways, a final
recommendation for all the key individual reaction rates in the EP decomposition
mechanism cannot yet be made. The direct measurement of certain reaction rates,
however, is feasible and may provide a worthwhile research path. High-level ab initio
calculations are also recommended to reduce the uncertainties in the rate constants for EP
and propanoic bond fission, and methyl ketene decomposition reactions.
In summary, extensive high-quality, multi-species time-history data are presented
for EP pyrolysis, providing unique evaluation and refinement of the existing kinetic
mechanism [83]. Sensitivity and ROP analyses indicate that species time-histories are
dependent on a complicated network of chemical reactions, many of which have not been
well studied. Strong evidence is presented indicating that reactions related to methyl
ketene bimolecular decomposition, propanoic acid and EP unimolecular elimination
significantly affect the CO and CO2 production. Further studies for modifications to these
rate constants are required to improve performance of the EP kinetic mechanism.

92
93
Chapter 6. Summary and Future Directions
6.1 Summary of Results
6.1.1 Mid-IR CO Sensor near 4.7 m
A QC-laser-based absorption sensor for CO and temperature in high-temperature
shock-heated gases was reported using the fundamental band of CO near 4.7 m. The
selected transitions, v” = 0, R(12), R(13), P(20) and v” = 1, R(21), R(22), P(14) were
successfully accessed by two different QC lasers. The spectroscopic parameters including
line-strengths and broadening coefficients 2Ar-CO were determined at room-temperature
(296 K) and high temperatures (1100-2000 K) and compared with literature values.
A scanned-wavelength direct absorption CO sensor using a single QC laser was first
validated for accurate measurements of temperature and CO concentration in a shock
tube. The sensor measured temperature at a scan rate of 2.5 kHz by comparing the
measured peak absorbance ratio of the line pair R(21) and R(12) with spectral
simulations, showing very good agreement (within 0.8%) with the calculated
temperatures at 1300-2200 K. A fixed-wavelength CO temperature sensor based on
transitions R(21) and P(20), accessed by two different lasers centered at 2194.46 cm-1 and
2059.91 cm-1, was also developed to provide in situ detection with faster time response.
Sensor validation was first demonstrated in a shock tube by measuring temperatures
(1200-1900 K) and CO concentrations of CO/H2/Ar mixtures with 1 MHz bandwidth.
The sensor was then applied to the shock tube study of the pyrolysis and oxidation of
methyl formate by measuring CO concentration and temperature time-histories to
illustrate its capability in chemical kinetic studies. The increased absorption strength in
94
this wavelength region provides opportunities for more sensitive and accurate combustion
measurements with shorter optical path length and lower CO concentration than was
possible using overtone band absorption.
6.1.2 Two-Line Thermometry for Multiphase Flows
A TDL absorption sensor with a time-response of 40 kHz has been presented for
accurate temperature measurements in pure gases and in an environment with significant
attenuation of incident light by aerosol scattering. The current sensor probes the R(28)
and P(70) absorption transitions of the v1+v3 band of CO2 near 2.7 m, which were
selected for sensitive temperature measurements over a wide range of temperatures (600-
1500 K). The fixed-center-wavelength WMS with 2f detection was used for calibration-
free measurements by normalization using the 1f signal. Experiments conducted in an
aerosol flow cell demonstrate that the sensor has the potential to measure gas temperature
accurately, even when the droplet scattering attenuates more than 99% of the incident
intensity.
The temperature sensor was first validated in non-reactive CO2/Ar gas mixtures in a
shock tube. Excellent agreement (within 1.5%) was found between the measured
temperatures (incident shock: 650-850 K, reflected shock: 1100-1500 K) and the
calculated values using shock jump equations. The sensor was then applied in successful
measurements of CO2 temperature in evaporating n-dodecane aerosols in an aerosol
shock tube. The temperature measured prior to the complete evaporation of the droplets
reflected the true temperature of the shock-heated test gas/aerosol mixture. Temperatures
were measured over the 520-1200 K range and varied less than 1.8% from the expected
values calculated using a laboratory-developed code. The WMS-2f/1f CO2 sensor
described in this study shows good potential for applications in a wide variety of rapidly-
varying, multi-phase environments.
6.1.3 Methanol and Methyl Formate Decomposition Study
Methanol and methyl formate thermal decomposition was studied experimentally by
measuring CH3OH and CO concentration time-histories behind reflected shock waves. A
95
quantitative absorption diagnostic was developed for measuring methanol concentration
at high temperatures using CO2 laser absorption spectroscopy at 9.676 m. The CO
measurement was made using a QC laser to access the R(13) transition line of the CO
fundamental band near 4.56 m. These two laser absorption diagnostics provided time-
resolved species concentration data with high signal-to-noise ratio even with a highly
diluted mixture (1000 ppm).
In the study of methanol decomposition, a comparison of the current measurements
with the model predictions from the Li et al. [17] mechanism, combined with the
sensitivity analysis, identified the need to include another methanol decomposition
channel CH2(S)+H2O (and associated CH2(S) reactions), in direct competition with the
CH3+OH channel. With the rate constants of methanol unimolecular elimination and H-
atom abstraction reactions modified with recent theoretical values from Jasper et al. [53]
and Meana-Pañeda et al. [63], good agreement was found between the modified Li et al.
[17] mechanism and the measured methanol and CO time-histories. However, in light of
the remaining small discrepancy in CO time-histories, we recommend further scrutiny of
the reactions involving hydroxymethyl and formaldehyde, especially the decomposition
reaction CH2OH → CH2O + H and the H-elimination reaction CH2OH +H → CH3 + OH.
In the study of methyl formate decomposition, the reaction rate constants for the
dominant MF decomposition channel (MF → CH3OH + CO) were studied behind
reflected shock waves by fitting the measured CO time-histories to the simulations using
the Dooley et al. mechanism [33]. Our measurement is in fairly good agreement with the
estimations from Dooley et al. [33] and the theoretical calculations by Peukert et al. [74].
These are the first high-temperature rate measurements in this kinetically-simple system.
Considering the remaining discrepancies between measurements and model predictions
especially at long times of the CO and methanol time-histories, we believe the model
uncertainties propagate to the secondary reactions such as methanol submechanism
and/or methyl formate H-abstraction reactions. Several model modifications were
recommended to further improve the agreement of the model predictions with the current
experimental results.
96
6.1.4 Ethyl Ester Decomposition Study
Quantitative measurements of CO, CO2 and H2O concentration time-histories were
carried out for ethyl formate, ethyl acetate, and ethyl propanoate pyrolysis using mid-IR
laser absorption techniques in a shock tube. More than 90% of oxygen balance was
achieved for all these esters when CO, CO2 and H2O time-histories reached the plateau
within the test time of 2 ms. These C3-C5 ethyl esters mainly take the unimolecular
elimination reaction to produce ethylene and the corresponding acid, i.e., formic acid for
EF, acetic acid for EA, propanoic acid for EP. Hence, the final product yields are mainly
determined by the submechanisms of these carboxylic acids. Detailed kinetic modeling
was performed to understand the experimental results. The EF and EA pyrolysis models
proposed in the current study can simulate the corresponding species time-histories fairly
well, while the detailed EP mechanism by Metcalfe et al. [83] needs to be further
modified to match our experimental data. Reaction pathway and sensitivity analyses
indicate that the branching ratios of HOCO radical decomposition and H-abstraction of
propanoic acid need to be modified, as the CO2 yield was significantly underpredicted in
the Metcalfe et al. [83] mechanism. Further experimental and theoretical studies of
certain reaction rates such as HOCO, ketene and methyl ketene decomposition are
recommended to reduce the uncertainties in the current kinetic models.
6.2 Recommendations for Future Work
6.2.1 Shock Tube Measurements of Reaction Rate Constants
The shock tube/laser diagnostic tool has been demonstrated to be powerful in
determining the rate constants of elementary reactions. Based on the conclusions in this
study, there are quite a few reactions playing important roles in the current kinetic
mechanisms but with rate constants not very well known. Taking HOCO chemistry as an
example, there are two competing pathways (HOCO = CO + OH, HOCO = CO2 + H) for
HOCO radical thermal decomposition. The branching ratio of HOCO decomposition is
the key to a lot of the modeling efforts on alkyl ester pyrolysis and possibly affecting

97
butanol combustion chemistry also. Large uncertainties (a factor of 2 or more) exist in the
theoretical calculations of these rate constants, and unfortunately no experimental data
can be found till now.
Current shock tube and mid-IR laser absorption provide the promising opportunity
to study these important reactions. First of all, benzoic acid can be used as a HOCO
radical precursor. At relatively high temperatures, benzoic acid dominantly takes the
following unimolecular decomposition to produce HOCO radical:
C6H5COOH ↔ C6H5 + HOCO, (1)
followed by the subsequent HOCO radical decomposition:
HOCO ↔ CO + OH, (2a)
and
HOCO ↔ CO2 + H. (2b)
Therefore, rate constants for reactions (2a) and (2b) can be determined by monitoring CO
and CO2 concentration time-histories behind reflected shock waves. Due to the high
sensitivity of the current mid-IR laser absorption diagnostics, very dilute fuel
concentration can be used to eliminate the interference from secondary reactions.
6.2.2 Multi-Species Measurements in Large Oxygenates and Blends
Most of the previous shock tube studies have been performed on small biodiesel
surrogates due to their simpler chemical structure and experimental availability for
conventional gas-phase shock tubes. However, the real biodiesel blends are usually
composed of large FAMEs, such as methyl oleate (C19H36O2), methyl linoleate
(C19H34O2), methyl linolenate (C19H32O2), methyl palmitate (C17H34O2), and methyl
stearate (C19H38O2). Experimental data for these large oxygenate compounds would be
extraordinarily important for the kinetic modeler in terms of model validation and
refinement. Hence, it is natural to come up with the idea of extending the multi-species
diagnostic strategy to these large methyl esters in future.
Studying larger surrogates in conventional gas-phase shock tubes has proven
extremely difficult due to these fuels' low vapor pressures and associated decomposition
issues in preparing gaseous reactant mixtures. The aerosol shock tube technique at
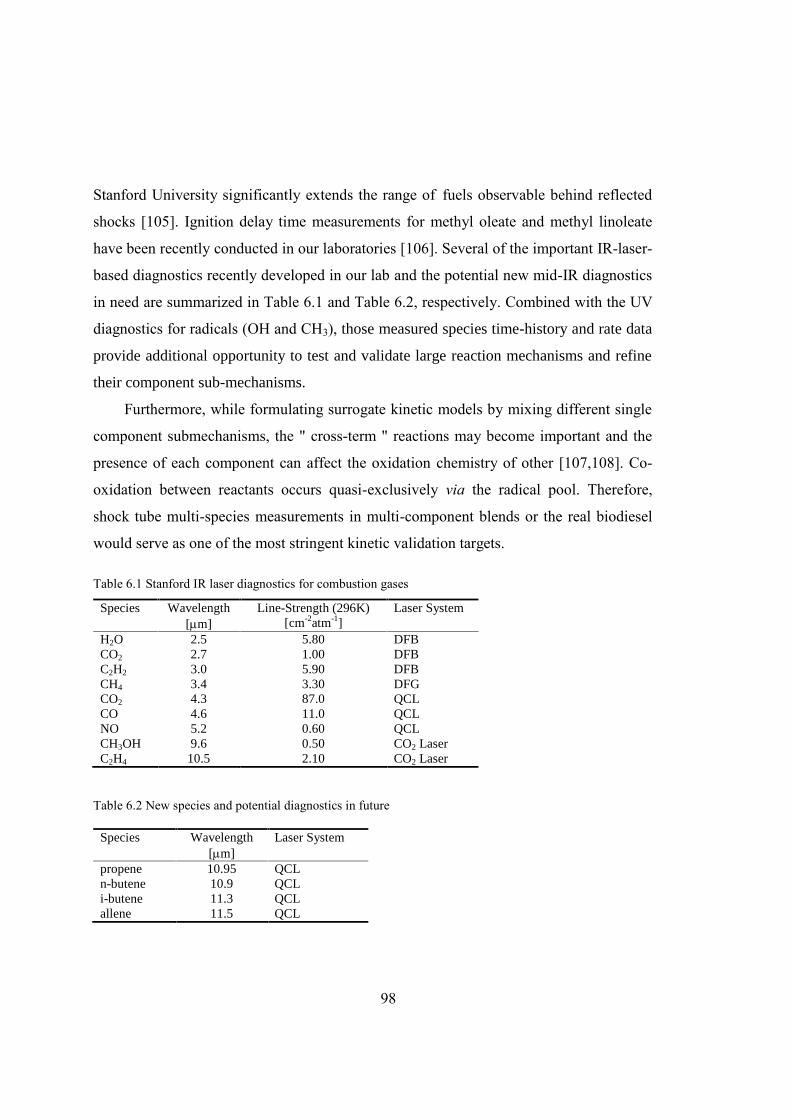
98
Stanford University significantly extends the range of fuels observable behind reflected
shocks [105]. Ignition delay time measurements for methyl oleate and methyl linoleate
have been recently conducted in our laboratories [106]. Several of the important IR-laser-
based diagnostics recently developed in our lab and the potential new mid-IR diagnostics
in need are summarized in Table 6.1 and Table 6.2, respectively. Combined with the UV
diagnostics for radicals (OH and CH3), those measured species time-history and rate data
provide additional opportunity to test and validate large reaction mechanisms and refine
their component sub-mechanisms.
Furthermore, while formulating surrogate kinetic models by mixing different single
component submechanisms, the " cross-term " reactions may become important and the
presence of each component can affect the oxidation chemistry of other [107,108]. Co-
oxidation between reactants occurs quasi-exclusively via the radical pool. Therefore,
shock tube multi-species measurements in multi-component blends or the real biodiesel
would serve as one of the most stringent kinetic validation targets.
Table 6.1 Stanford IR laser diagnostics for combustion gases
Species Wavelength[m]
Line-Strength (296K)[cm-2atm-1]
Laser System
H2O 2.5 5.80 DFBCO2 2.7 1.00 DFBC2H2 3.0 5.90 DFBCH4 3.4 3.30 DFGCO2 4.3 87.0 QCLCO 4.6 11.0 QCLNO 5.2 0.60 QCLCH3OH 9.6 0.50 CO2 LaserC2H4 10.5 2.10 CO2 Laser
Table 6.2 New species and potential diagnostics in future
Species Wavelength[m]
Laser System
propene 10.95 QCLn-butene 10.9 QCLi-butene 11.3 QCLallene 11.5 QCL

99
6.2.3 Kinetics of Oxygenated Fuel Thrust
Nowadays chemical kinetic models are often developed in a hierarchical manner
starting with small molecules with only a few atoms, and this approach has proved to be
effective and powerful for the modeling of large hydrocarbon fuels [57,109–111]. The
global model performance heavily relies on the accuracy of these mechanism thrusts. The
kinetic studies carried out in this thesis on the thermal decomposition of oxygenates have
elucidated many areas relating to the thrusts (C1-C4) of the oxygenated fuels. Some of
these foundational submechanisms have received little kinetic attention due to their weak
sensitivity in hydrocarbon fuels, but may serve as essential model components in
oxygenated fuels.
In the current work, the thermal decomposition of ethyl esters is a representative
example showing the need for further refinements of the model thrusts. During the
pyrolysis of ethyl acetate and ethyl propanoate, the composition of the final products
depends highly on the reaction pathways of intermediates such as HOCO radical, ketene
and methyl ketene. However, the large uncertainties existing in the current
submechanisms for these oxygenates result in poor model predictions. In the case of
methanol pyrolysis, methanol is consumed mainly through H-atom abstraction to produce
CH2OH radical, which subsequently decomposes to formaldehyde via -scission or
reacts with H-atom to produce CH3 and OH. The current submechanisms involving
CH2OH and formaldehyde need further scrutiny due to the discrepancy between the
experimental results and the model predictions. When extended to the oxidation case, one
of the major consumption pathway for the oxygenates with the ester moiety is the
abstraction of the H atom from the CH2 group adjacent to the C=O function [112]. The
H-atom abstraction from these oxygenates produces radical species that react primarily
via -scission, leading to stable intermediates (ketenes, R'R"C=C=O) and smaller radicals
(methoxy/ethoxy). Very few experimental and theoretical studies on these species can be
found in the literature. Therefore, kinetics of these oxygenate thrusts would be of
immediate future interest and several important reactions can be measured using the
shock tube/laser diagnostic strategy.

100

101
Appendix A: Ethylene and Methanol
Diagnostics using CO2 Gas Laser
A.1 Ethylene Diagnostic at 10.532 m
Ethylene is a stable intermediate species and dominant alkene formed by fuel
fragmentation processes during the oxidation and pyrolysis of large alkanes [32,113].
Formation of ethylene and its subsequent reactions to acetylenic derivatives are also
involved in the formation and growth of polycyclic aromatic hydrocarbons (PAHs), the
most likely precursors to soot [114]. It follows that analysis of a wide variety of
hydrocarbon kinetic mechanisms would benefit from a sensitive and quantitative
diagnostic for ethylene concentration time-histories in shock tube experiments.
A.1.1 Experimental
Ethylene was monitored in shock tube measurements using CO2 laser absorption at
10.532 m. Absorption is due to the strong Q-branch of the v7 ethylene band, which has a
strong overlap with the P14 line of the CO2 laser transitions associated with the (0 0 1) to
(1 0 0) vibrational levels. We utilized a grating-tuned CO2 gas laser (Model Lasy-4G,
Access Laser Co.) with 230 mW output. The CO2 transition is primarily Doppler
broadened with a full width at half maximum (FWHM) of less than 100 kHz (i.e. 3×10⁻⁶
cm-1). The CO2 emission line was well-identified by passing a portion of the laser output
(through a beam splitter) into a mid-IR wavemeter (Bristol 721) and observed to be stable
over hours. The HITRAN database indicates that the absorption features of ethylene near
10.5 m have broadening coefficients on the order of ~0.1 cm-1atm-1 [13]. Thus, the CO2
laser emission at the P14 line can be considered monochromatic. New TE-cooled IR
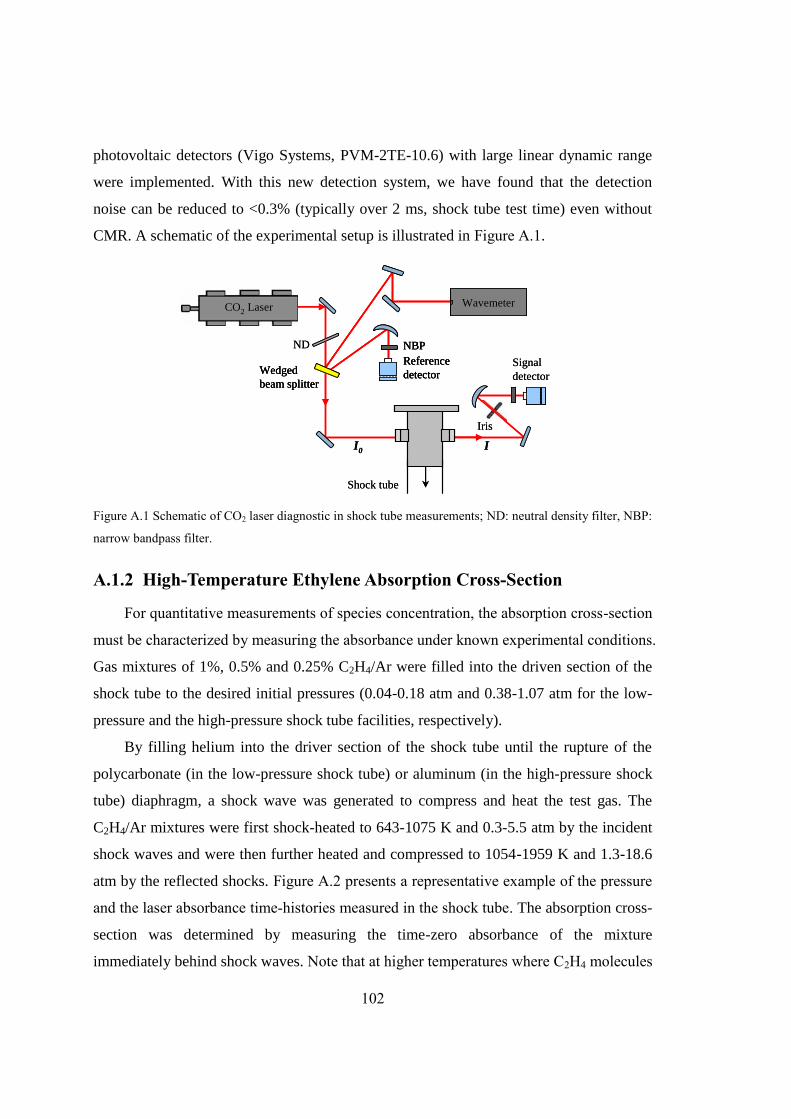
102
photovoltaic detectors (Vigo Systems, PVM-2TE-10.6) with large linear dynamic range
were implemented. With this new detection system, we have found that the detection
noise can be reduced to <0.3% (typically over 2 ms, shock tube test time) even without
CMR. A schematic of the experimental setup is illustrated in Figure A.1.
Figure A.1 Schematic of CO2 laser diagnostic in shock tube measurements; ND: neutral density filter, NBP:
narrow bandpass filter.
A.1.2 High-Temperature Ethylene Absorption Cross-Section
For quantitative measurements of species concentration, the absorption cross-section
must be characterized by measuring the absorbance under known experimental conditions.
Gas mixtures of 1%, 0.5% and 0.25% C2H4/Ar were filled into the driven section of the
shock tube to the desired initial pressures (0.04-0.18 atm and 0.38-1.07 atm for the low-
pressure and the high-pressure shock tube facilities, respectively).
By filling helium into the driver section of the shock tube until the rupture of the
polycarbonate (in the low-pressure shock tube) or aluminum (in the high-pressure shock
tube) diaphragm, a shock wave was generated to compress and heat the test gas. The
C2H4/Ar mixtures were first shock-heated to 643-1075 K and 0.3-5.5 atm by the incident
shock waves and were then further heated and compressed to 1054-1959 K and 1.3-18.6
atm by the reflected shocks. Figure A.2 presents a representative example of the pressure
and the laser absorbance time-histories measured in the shock tube. The absorption cross-
section was determined by measuring the time-zero absorbance of the mixture
immediately behind shock waves. Note that at higher temperatures where C2H4 molecules
Signaldetector
ND
Shock tube
Iris
Referencedetector
NBP
Wavemeter
Wedgedbeam splitter
CO2 Laser
I0 I
Signaldetector
ND
Shock tube
Iris
Referencedetector
NBP
Wavemeter
Wedgedbeam splitter
Referencedetector
NBP
WavemeterWavemeter
Wedgedbeam splitter
CO2 LaserCO2 Laser
I0 I
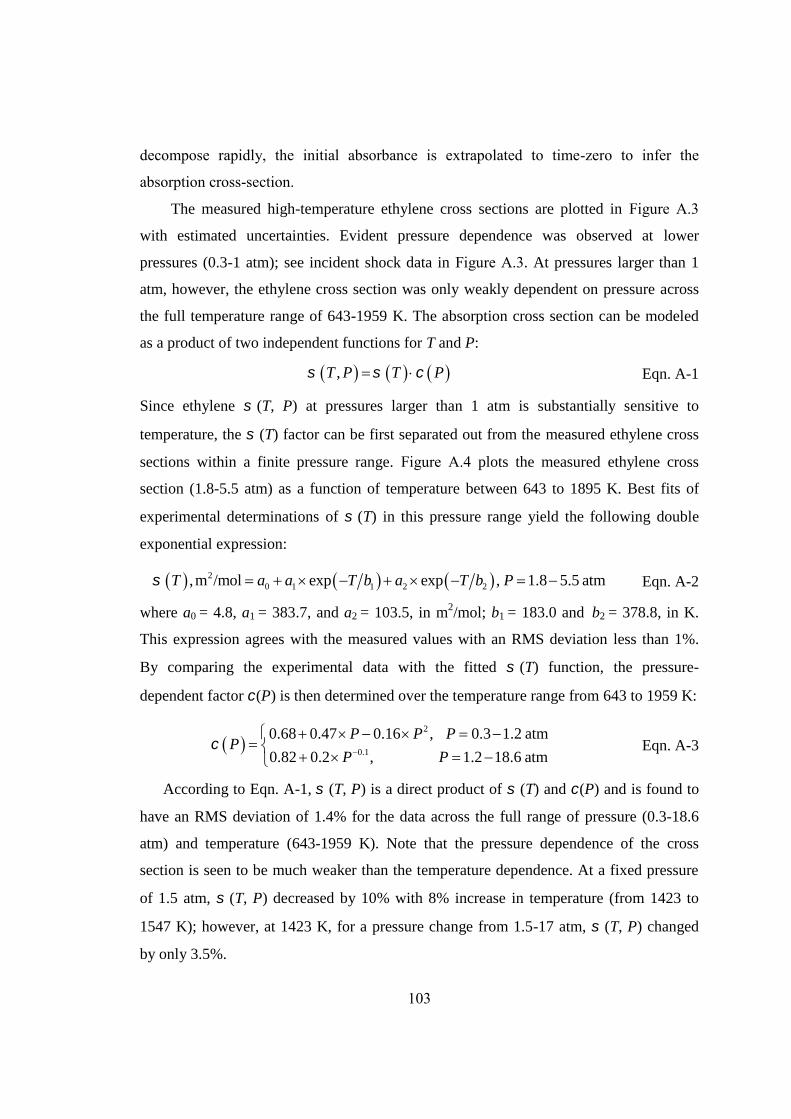
103
decompose rapidly, the initial absorbance is extrapolated to time-zero to infer the
absorption cross-section.
The measured high-temperature ethylene cross sections are plotted in Figure A.3
with estimated uncertainties. Evident pressure dependence was observed at lower
pressures (0.3-1 atm); see incident shock data in Figure A.3. At pressures larger than 1
atm, however, the ethylene cross section was only weakly dependent on pressure across
the full temperature range of 643-1959 K. The absorption cross section can be modeled
as a product of two independent functions for T and P:
,T P T P Eqn. A-1
Since ethylene (T, P) at pressures larger than 1 atm is substantially sensitive to
temperature, the (T) factor can be first separated out from the measured ethylene cross
sections within a finite pressure range. Figure A.4 plots the measured ethylene cross
section (1.8-5.5 atm) as a function of temperature between 643 to 1895 K. Best fits of
experimental determinations of (T) in this pressure range yield the following double
exponential expression:
20 1 1 2 2,m /mol exp exp , 1.8 5.5 atmT a a T b a T b P Eqn. A-2
where a0 = 4.8, a1 = 383.7, and a2 = 103.5, in m2/mol; b1 = 183.0 and b2 = 378.8, in K.
This expression agrees with the measured values with an RMS deviation less than 1%.
By comparing the experimental data with the fitted (T) function, the pressure-
dependent factor (P) is then determined over the temperature range from 643 to 1959 K:
2
0.1
0.68 0.47 0.16 , 0.3 1.2 atm
0.82 0.2 , 1.2 18.6 atm
P P PP
P P
Eqn. A-3
According to Eqn. A-1,(T, P) is a direct product of (T) and (P) and is found to
have an RMS deviation of 1.4% for the data across the full range of pressure (0.3-18.6
atm) and temperature (643-1959 K). Note that the pressure dependence of the cross
section is seen to be much weaker than the temperature dependence. At a fixed pressure
of 1.5 atm, (T, P) decreased by 10% with 8% increase in temperature (from 1423 to
1547 K); however, at 1423 K, for a pressure change from 1.5-17 atm, (T, P) changed
by only 3.5%.

104
Figure A.2 Pressure and laser absorbance time-histories for a nonreactive mixture: 1% C2H4/Ar. Schlieren
spikes caused by the density gradient across the shock waves.
Figure A.3 Ethylene cross-sections (10.532m): 643-1959 K and 0.3-18.6 atm. Upper panel: measured
absorption cross section,meas; lower panel: comparisons of meas with fit calculated using (Eqn. A-1).
Figure A.4 Ethylene cross section (1.8-5.5 atm) as a function of temperature; best fit using (Eqn. A-2).
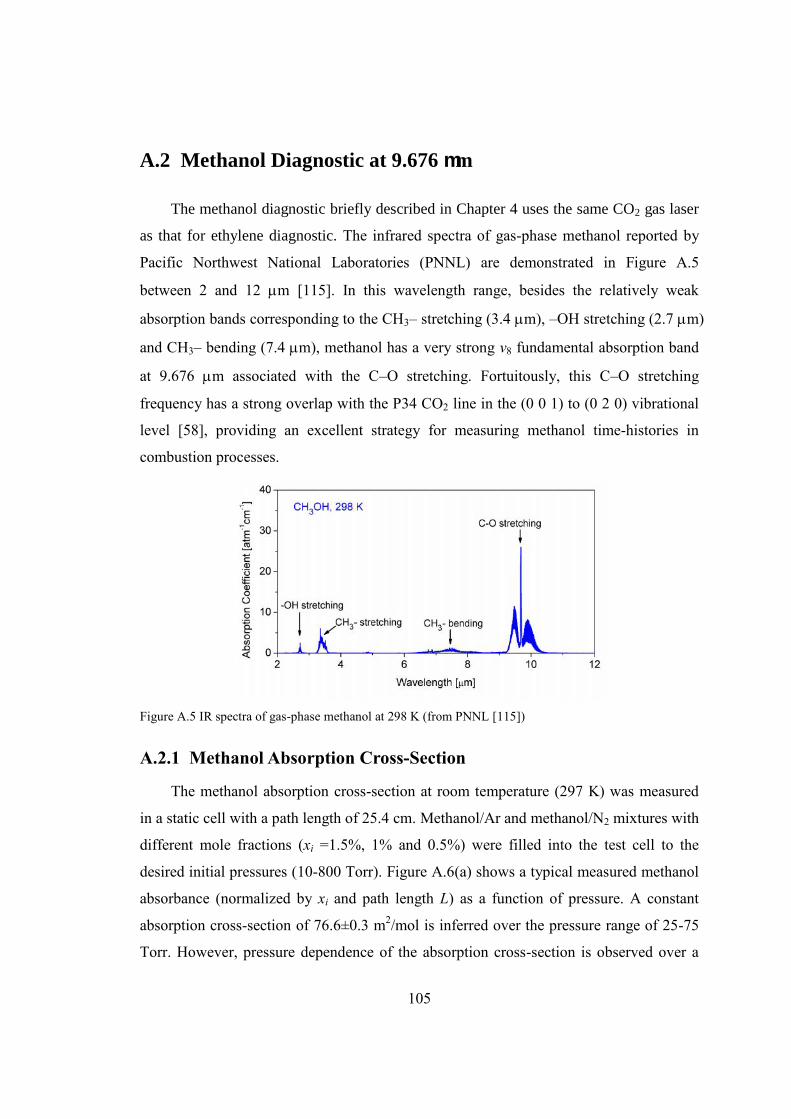
105
A.2 Methanol Diagnostic at 9.676 m
The methanol diagnostic briefly described in Chapter 4 uses the same CO2 gas laser
as that for ethylene diagnostic. The infrared spectra of gas-phase methanol reported by
Pacific Northwest National Laboratories (PNNL) are demonstrated in Figure A.5
between 2 and 12 m [115]. In this wavelength range, besides the relatively weak
absorption bands corresponding to the CH3‒ stretching (3.4 m), ‒OH stretching (2.7 m)
and CH3‒ bending (7.4 m), methanol has a very strong v8 fundamental absorption band
at 9.676 m associated with the C‒O stretching. Fortuitously, this C‒O stretching
frequency has a strong overlap with the P34 CO2 line in the (0 0 1) to (0 2 0) vibrational
level [58], providing an excellent strategy for measuring methanol time-histories in
combustion processes.
Figure A.5 IR spectra of gas-phase methanol at 298 K (from PNNL [115])
A.2.1 Methanol Absorption Cross-Section
The methanol absorption cross-section at room temperature (297 K) was measured
in a static cell with a path length of 25.4 cm. Methanol/Ar and methanol/N2 mixtures with
different mole fractions (xi =1.5%, 1% and 0.5%) were filled into the test cell to the
desired initial pressures (10-800 Torr). Figure A.6(a) shows a typical measured methanol
absorbance (normalized by xi and path length L) as a function of pressure. A constant
absorption cross-section of 76.6±0.3 m2/mol is inferred over the pressure range of 25-75
Torr. However, pressure dependence of the absorption cross-section is observed over a
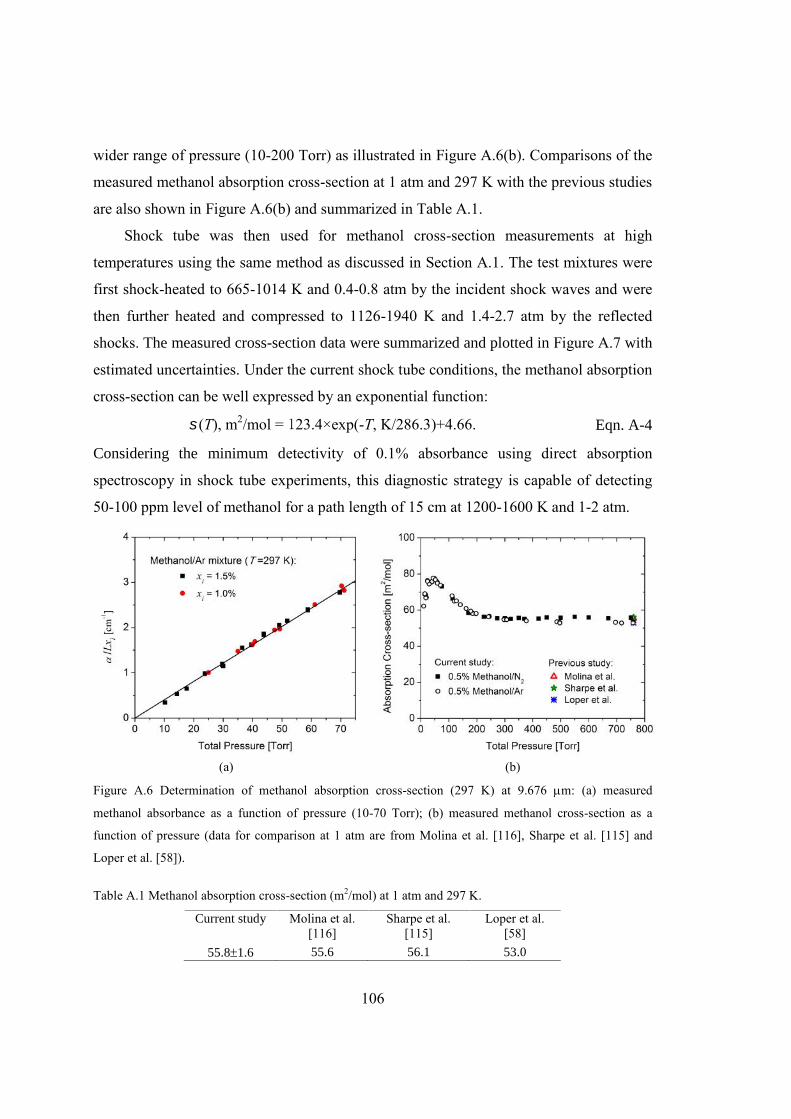
106
wider range of pressure (10-200 Torr) as illustrated in Figure A.6(b). Comparisons of the
measured methanol absorption cross-section at 1 atm and 297 K with the previous studies
are also shown in Figure A.6(b) and summarized in Table A.1.
Shock tube was then used for methanol cross-section measurements at high
temperatures using the same method as discussed in Section A.1. The test mixtures were
first shock-heated to 665-1014 K and 0.4-0.8 atm by the incident shock waves and were
then further heated and compressed to 1126-1940 K and 1.4-2.7 atm by the reflected
shocks. The measured cross-section data were summarized and plotted in Figure A.7 with
estimated uncertainties. Under the current shock tube conditions, the methanol absorption
cross-section can be well expressed by an exponential function:
(T), m2/mol = 123.4×exp(-T, K/286.3)+4.66. Eqn. A-4
Considering the minimum detectivity of 0.1% absorbance using direct absorption
spectroscopy in shock tube experiments, this diagnostic strategy is capable of detecting
50-100 ppm level of methanol for a path length of 15 cm at 1200-1600 K and 1-2 atm.
(a) (b)
Figure A.6 Determination of methanol absorption cross-section (297 K) at 9.676 m: (a) measured
methanol absorbance as a function of pressure (10-70 Torr); (b) measured methanol cross-section as a
function of pressure (data for comparison at 1 atm are from Molina et al. [116], Sharpe et al. [115] and
Loper et al. [58]).
Table A.1 Methanol absorption cross-section (m2/mol) at 1 atm and 297 K.
Current study Molina et al.[116]
Sharpe et al.[115]
Loper et al.[58]
55.81.6 55.6 56.1 53.0
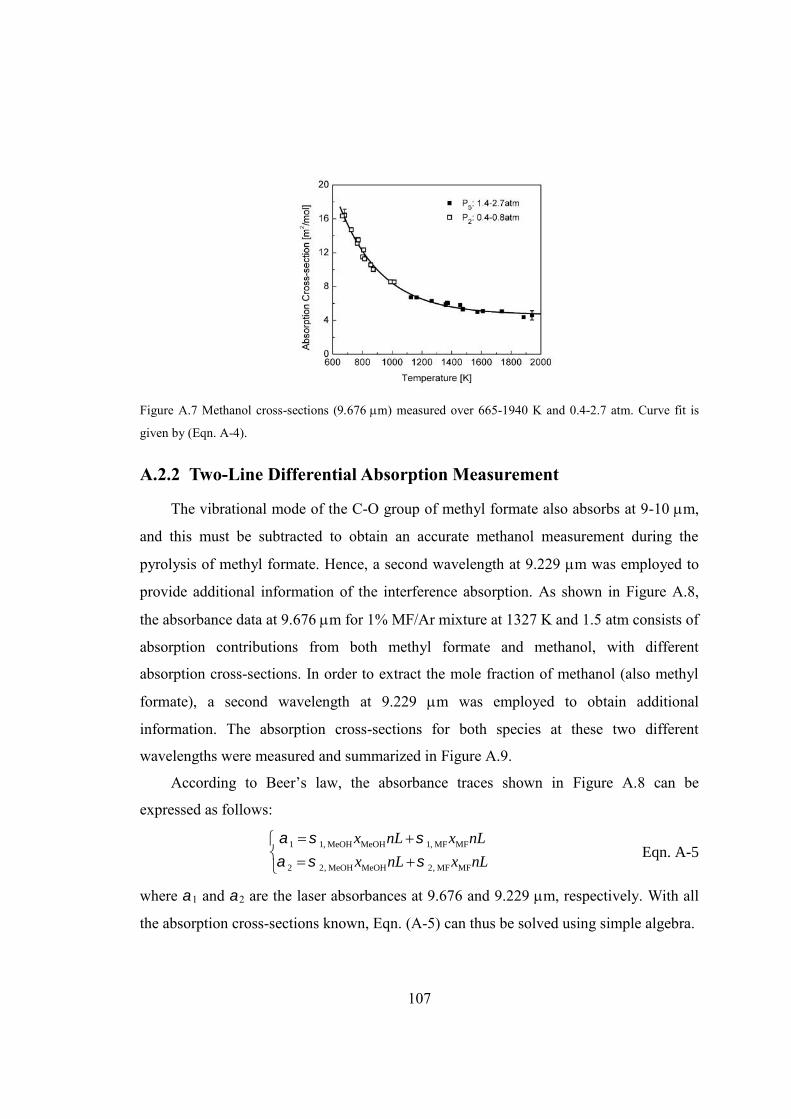
107
Figure A.7 Methanol cross-sections (m) measured over 665-1940 K and 0.4-2.7 atm. Curve fit is
given by (Eqn. A-4).
A.2.2 Two-Line Differential Absorption Measurement
The vibrational mode of the C-O group of methyl formate also absorbs at 9-10 m,
and this must be subtracted to obtain an accurate methanol measurement during the
pyrolysis of methyl formate. Hence, a second wavelength at 9.229 m was employed to
provide additional information of the interference absorption. As shown in Figure A.8,
the absorbance data at 9.676 m for 1% MF/Ar mixture at 1327 K and 1.5 atm consists of
absorption contributions from both methyl formate and methanol, with different
absorption cross-sections. In order to extract the mole fraction of methanol (also methyl
formate), a second wavelength at 9.229 m was employed to obtain additional
information. The absorption cross-sections for both species at these two different
wavelengths were measured and summarized in Figure A.9.
According to Beer’s law, the absorbance traces shown in Figure A.8 can be
expressed as follows:
1 1, MeOH MeOH 1, MF MF
2 2, MeOH MeOH 2, MF MF
x nL x nL
x nL x nL
Eqn. A-5
where 1 and 2 are the laser absorbances at 9.676 and 9.229 m, respectively. With all
the absorption cross-sections known, Eqn. (A-5) can thus be solved using simple algebra.

108
Figure A.8 Laser absorbance data for 1% MF/Ar mixture at 1327 K and 1.5 atm.
600 800 1000 1200 1400 16000
3
6
9
12
15
18
Methanol Methyl Formate
Abso
rptio
n C
ross
-sec
tion
[m2 /m
ol]
Temperature [K]
Wavelength = 9.676 m
(a)
600 800 1000 1200 1400 16000
3
6
9
12
15
18Ab
sorp
tion
Cro
ss-s
ectio
n [m
2 /mol
]
Temperature [K]
Methanol Methyl Formate
Wavelength = 9.229 m
(b)
Figure A.9 Measured absorption cross-sections of (a) methanol and (b) methyl formate at wavelengths of
9.676 and 9.229 m; P = 0.6-2.7 atm.

109
Reference
[1] International Energy Outlook 2013, Us Energy Information Administration, DOE (2003).
[2] M.G. Allen, Meas. Sci. Technol. 9 (1998) 545.
[3] H. Teichert, T. Fernholz, V. Ebert, Appl. Opt. 42 (2003) 2043.
[4] K. Kohse-Höinghaus, R.S. Barlow, M. Aldén, J. Wolfrum, Proc. Combust. Inst. 30 (2005)
89.
[5] R.K. Hanson, Proc. Combust. Inst. 33 (2011) 1.
[6] D.T. Cassidy, L.J. Bonnell, Appl. Opt. 27 (1988) 2688.
[7] R.M. Mihalcea, D.S. Baer, R.K. Hanson, Appl. Opt. 36 (1997) 8745.
[8] B.L. Upschulte, D.M. Sonnenfroh, M.G. Allen, Appl. Opt. 38 (1999) 1506.
[9] V. Weldon, J. O’Gorman, P. Phelan, J. Hegarty, T. Tanbun-Ek, Sensors Actuators B Chem.
29 (1995) 101.
[10] D.M. Sonnenfroh, M.G. Allen, Appl. Opt. 36 (1997) 3298.
[11] M.P. Arroyo, S. Langlois, R.K. Hanson, Appl. Opt. 33 (1994) 3296.
[12] J.T.C. Liu, G.B. Rieker, J.B. Jeffries, M.R. Gruber, C.D. Carter, T. Mathur, R.K. Hanson,
Appl. Opt. 44 (2005) 6701.
[13] HITRAN, http://www.cfa.harvard.edu/hitran/.
[14] F. Capasso, R. Paiella, R. Martini, R. Colombelli, C. Gmachl, T.L. Myers, M.S. Taubman,
R.M. Williams, C.G. Bethea, K. Unterrainer, H.Y. Hwang, D.L. Sivco, A.Y. Cho, A.M.
Sergent, H.C. Liu, E.A. Whittaker, Ieee J. Quantum Electron. 38 (2002) 511.
[15] A. Kosterev, G. Wysocki, Y. Bakhirkin, S. So, R. Lewicki, M. Fraser, F. Tittel, R.F. Curl,
Appl. Phys. B 90 (2008) 165.
[16] R.F. Curl, F. Capasso, C. Gmachl, A.A. Kosterev, B. McManus, R. Lewicki, M. Pusharsky,
G. Wysocki, F.K. Tittel, Chem. Phys. Lett. 487 (2010) 1.
[17] J. Li, Z. Zhao, A. Kazakov, M. Chaos, F.L. Dryer, J.J. Scire, Int. J. Chem. Kinet. 39 (2007)
109.
110
[18] R.M. Mihalcea, D.S. Baer, R.K. Hanson, Meas. Sci. Technol. 9 (1998) 327.
[19] M.E. Webber, J. Wang, S.T. Sanders, D.S. Baer, R.K. Hanson, Proc. Combust. Inst. 28
(2000) 407.
[20] J. Wang, M. Maiorov, D.S. Baer, D.Z. Garbuzov, J.C. Connolly, R.K. Hanson, Appl. Opt.
39 (2000) 5579.
[21] V. Ebert, H. Teichert, P. Strauch, T. Kolb, H. Seifert, J. Wolfrum, Proc. Combust. Inst. 30
(2005) 1611.
[22] X. Chao, J.B. Jeffries, R.K. Hanson, Meas. Sci. Technol. 20 (2009) 115201.
[23] R.K. Hanson, P.K. Falcone, Appl. Opt. 17 (1978) 2477.
[24] M. Schoenung, R.K. Hanson, Combust. Sci. Technol. 24 (1980) 227.
[25] J. Houston Miller, S. Elreedy, B. Ahvazi, F. Woldu, P. Hassanzadeh, Appl. Opt. 32 (1993)
6082.
[26] R. Barron-Jimenez, J.A. Caton, T.N. Anderson, R.P. Lucht, T. Walther, S. Roy, M.S.
Brown, J.R. Gord, Appl. Phys. B 85 (2006) 185.
[27] A.A. Kosterev, F.K. Tittel, R. Köhler, C. Gmachl, F. Capasso, D.L. Sivco, A.Y. Cho, S.
Wehe, M.G. Allen, Appl. Opt. 41 (2002) 1169.
[28] J. Vanderover, M.A. Oehlschlaeger, Appl. Phys. B 99 (2010) 353.
[29] X. Zhou, J.B. Jeffries, R.K. Hanson, Appl. Phys. B 81 (2005) 711.
[30] R.C. Millikan, D.R. White, J. Chem. Phys. 39 (1963) 3209.
[31] J.-P. Bouanich, C. Haeusler, J. Quant. Spectrosc. Radiat. Transf. 12 (1972) 695.
[32] D.F. Davidson, Z. Hong, G.L. Pilla, A. Farooq, R.D. Cook, R.K. Hanson, Proc. Combust.
Inst. 33 (2011) 151.
[33] S. Dooley, M.P. Burke, M. Chaos, Y. Stein, F.L. Dryer, V.P. Zhukov, O. Finch, J.M.
Simmie, H.J. Curran, Int. J. Chem. Kinet. 42 (2010) 527.
[34] R.J. Kee, F.M. Ruply, J.A. Miller, Chemkin- React. Des. Inc San Diego Ca (2012).
[35] R.K. Hanson, G.A. Pang, S. Chakraborty, W. Ren, S. Wang, D.F. Davidson, Combust.
Flame 160 (2013) 1550.
[36] J.T. Herbon, R.K. Hanson, D.M. Golden, C.T. Bowman, Proc. Combust. Inst. 29 (2002)
1201.
[37] Z. Hong, A. Farooq, E.A. Barbour, D.F. Davidson, R.K. Hanson, J. Phys. Chem. A 113
(2009) 12919.
[38] D.F. Davidson, D.R. Haylett, R.K. Hanson, Combust. Flame 155 (2008) 108.
111
[39] G.B. Rieker, J.B. Jeffries, R.K. Hanson, Appl. Phys. B 94 (2009) 51.
[40] A. Farooq, J.B. Jeffries, R.K. Hanson, Appl. Phys. B 90 (2008) 619.
[41] A. Farooq, J.B. Jeffries, R.K. Hanson, Appl. Phys. B 96 (2009) 161.
[42] F. Beyrau, A. Brauer, T. Seeger, A. Leipertz, Opt. Lett. 29 (2004) 247.
[43] A.R. Awtry, B.T. Fisher, R.A. Moffatt, V. Ebert, J.W. Fleming, Proc. Combust. Inst. 31
(2007) 799.
[44] J.M. Porter, J.B. Jeffries, R.K. Hanson, Appl. Phys. B 102 (2011) 345.
[45] H. Li, G.B. Rieker, X. Liu, J.B. Jeffries, R.K. Hanson, Appl. Opt. 45 (2006) 1052.
[46] C.F. Bohren, D.R. Huffman, Absorption and Scattering of Light by Small Particles, Wiley-
VCH, 1998.
[47] A.G. Thomas, Scatmech Polarized Light Scattering C++ Class Library. URL:
physics.nist.gov/Divisions/Div844/facilities/scatmech/html/index.htm.
[48] G.B. Rieker, J.B. Jeffries, R.K. Hanson, Appl. Opt. 48 (2009) 5546.
[49] M.A. Oehlschlaeger, D.F. Davidson, R.K. Hanson, J. Phys. Chem. A 108 (2004) 4247.
[50] A.E. Klingbeil, J.B. Jeffries, D.F. Davidson, R.K. Hanson, Appl. Phys. B 93 (2008) 627.
[51] R.G. Gordon, W. Klemperer, J.I. Steinfeld, Annu. Rev. Phys. Chem. 19 (1968) 215.
[52] E. L.Petersen, R. K.Hanson, (2012).
[53] A.W. Jasper, S.J. Klippenstein, L.B. Harding, B. Ruscic, J. Phys. Chem. A 111 (2007)
3932.
[54] A. Frassoldati, A. Cuoci, T. Faravelli, U. Niemann, E. Ranzi, R. Seiser, K. Seshadri,
Combust. Flame 157 (2010) 2.
[55] A. Demirbas, Energy Policy 35 (2007) 4661.
[56] E. Zervas, S. Poulopoulos, C. Philippopoulos, Fuel 85 (2006) 333.
[57] H.J. Curran, P. Gaffuri, W.J. Pitz, C.K. Westbrook, Combust. Flame 114 (1998) 149.
[58] G.L. Loper, A.R. Calloway, M.A. Stamps, J.A. Gelbwachs, Appl. Opt. 19 (1980) 2726.
[59] D.A. Sheen, H. Wang, Combust. Flame 158 (2011) 645.
[60] G.P. Smith, D.M. Golden, M. Frenklach, N.W. Moriarty, B. Eiteneer, M. Goldenberg, C.T.
Bowman, R.K. Hanson, S. Song, W.C. Gardiner, V. Lissianski, Z. Qin, GRI 3.0, URL:
http://www.me.berkeley.edu/gri_mech/.
[61] K. Spindler, H. Gg. Wagner, Berichte Bunsenges. Für Phys. Chem. 86 (1982) 2.
[62] T. Koike, M. Kudo, I. Maeda, H. Yamada, Int. J. Chem. Kinet. 32 (2000) 1.
[63] R. Meana-Pañeda, D.G. Truhlar, A. Fernández-Ramos, J. Chem. Phys. 134 (2011) 094302.
112
[64] W. Tsang, R.F. Hampson, J. Phys. Chem. Ref. Data 15 (1986) 1087.
[65] W. Ren, K.-Y. Lam, S.H. Pyun, A. Farooq, D.F. Davidson, R.K. Hanson, Proc. Combust.
Inst. 34 (2013) 453.
[66] J. Warnatz, in:, W.C.G. Jr (Ed.), Combust. Chem., Springer US, 1984, pp. 197–360.
[67] J.T. Jodkowski, M.-T. Rayez, J.-C. Rayez, T. Bérces, S. Dóbé, J. Phys. Chem. A 103 (1999)
3750.
[68] P.H. Cribb, J.E. Dove, S. Yamazaki, Combust. Flame 88 (1992) 169.
[69] J. Vandooren, P.J. Van Tiggelen, Symp. Int. Combust. 18 (1981) 473.
[70] D.L. Baulch, C.T. Bowman, C.J. Cobos, R.A. Cox, T. Just, J.A. Kerr, M.J. Pilling, D.
Stocker, J. Troe, W. Tsang, R.W. Walker, J. Warnatz, J. Phys. Chem. Ref. Data 34 (2005)
757.
[71] S. Dooley, F.L. Dryer, B. Yang, J. Wang, T.A. Cool, T. Kasper, N. Hansen, Combust.
Flame 158 (2011) 732.
[72] J.S. Francisco, J. Am. Chem. Soc. 125 (2003) 10475.
[73] W.K. Metcalfe, J.M. Simmie, H.J. Curran, J. Phys. Chem. A 114 (2010) 5478.
[74] S.L. Peukert, R. Sivaramakrishnan, M.-C. Su, J.V. Michael, Combust. Flame 159 (2012)
2312.
[75] C.K. Westbrook, W.J. Pitz, P.R. Westmoreland, F.L. Dryer, M. Chaos, P. Osswald, K.
Kohse-Höinghaus, T.A. Cool, J. Wang, B. Yang, N. Hansen, T. Kasper, Proc. Combust. Inst.
32 (2009) 221.
[76] R. Sumathi, J. William H. Green, Phys. Chem. Chem. Phys. 5 (2003) 3402.
[77] J.Y.W. Lai, K.C. Lin, A. Violi, Prog. Energy Combust. Sci. 37 (2011) 1.
[78] P.S. Nigam, A. Singh, Prog. Energy Combust. Sci. 37 (2011) 52.
[79] J.Q.A. Brito, C.S. Silva, J.S. Almeida, M.G.A. Korn, M. Korn, L.S.G. Teixeira, Fuel
Process. Technol. 95 (2012) 33.
[80] L. Coniglio, H. Bennadji, P.A. Glaude, O. Herbinet, F. Billaud, Prog. Energy Combust. Sci.
39 (2013) 340.
[81] B. Akih-Kumgeh, J.M. Bergthorson, Energy Fuels 25 (2011) 4345.
[82] W.K. Metcalfe, S. Dooley, H.J. Curran, J.M. Simmie, A.M. El-Nahas, M.V. Navarro, J.
Phys. Chem. A 111 (2007) 4001.
[83] W.K. Metcalfe, C. Togbé, P. Dagaut, H.J. Curran, J.M. Simmie, Combust. Flame 156
(2009) 250.

113
[84] S.M. Walton, M.S. Wooldridge, C.K. Westbrook, Proc. Combust. Inst. 32 (2009) 255.
[85] B. Yang, C.K. Westbrook, T.A. Cool, N. Hansen, K. Kohse-Höinghaus, Phys. Chem.
Chem. Phys. 13 (2011) 6901.
[86] G. Dayma, F. Halter, F. Foucher, C. Mounaim-Rousselle, P. Dagaut, Energy Fuels 26
(2012) 6669.
[87] W. Ren, J.B. Jeffries, R.K. Hanson, Meas. Sci. Technol. 21 (2010) 105603.
[88] E.R. Ritter, J.W. Bozzelli, Int. J. Chem. Kinet. 23 (1991) 767.
[89] C. Muller, V. Michel, G. Scacchi, G.M. Come, J Chim Phys 92 (1995) 1154.
[90] A.T. Blades, Can. J. Chem. 32 (1954) 366.
[91] J.-G. Chang, H.-T. Chen, S. Xu, M.C. Lin, J. Phys. Chem. A 111 (2007) 6789.
[92] N. Akiya, P.E. Savage, Aiche J. 44 (1998) 405.
[93] K. Saito, T. Shiose, O. Takahashi, Y. Hidaka, F. Aiba, K. Tabayashi, J. Phys. Chem. A 109
(2005) 5352.
[94] S.L. Fischer, F.L. Dryer, H.J. Curran, Int. J. Chem. Kinet. 32 (2000) 713.
[95] N. Leplat, J. Vandooren, Combust. Flame 159 (2012) 493.
[96] A. Galano, J.R. Alvarez-Idaboy, M.E. Ruiz-Santoyo, A. Vivier-Bunge, J. Phys. Chem. A
106 (2002) 9520.
[97] K. Saito, T. Sasaki, I. Yoshinobu, A. Imamura, Chem. Phys. Lett. 170 (1990) 385.
[98] J.C. Mackie, K.R. Doolan, Int. J. Chem. Kinet. 16 (1984) 525.
[99] A.V. Joshi, H. Wang, Int. J. Chem. Kinet. 38 (2006) 57.
[100] T.L. Nguyen, B.C. Xue, R.E. Weston, J.R. Barker, J.F. Stanton, J. Phys. Chem. Lett. 3
(2012) 1549.
[101] J.P. Senosiain, C.B. Musgrave, D.M. Golden, Int. J. Chem. Kinet. 35 (2003) 464.
[102] L.R. McCunn, K.-C. Lau, M.J. Krisch, L.J. Butler, J.-W. Tsung, J.J. Lin, J. Phys. Chem. A
110 (2006) 1625.
[103] L.K. Huynh, K.C. Lin, A. Violi, J. Phys. Chem. A 112 (2008) 13470.
[104] J.R. Barker, private communication (2013).
[105] D.R. Haylett, D.F. Davidson, R.K. Hanson, Combust. Flame 159 (2012) 552.
[106] M.F. Campbell, D.F. Davidson, R.K. Hanson, C.K. Westbrook, Proc. Combust. Inst. 34
(2013) 419.
[107] J. Herzler, M. Fikri, K. Hitzbleck, R. Starke, C. Schulz, P. Roth, G.T. Kalghatgi, Combust.
Flame 149 (2007) 25.
114
[108] Y. Sakai, A. Miyoshi, M. Koshi, W.J. Pitz, Proc. Combust. Inst. 32 (2009) 411.
[109] H. Wang, E. Dames, B. Sirjean, D.A. Sheen, R. Tangko, A. Violi, J.Y.W. Lai, F.N.
Egolfopoulos, D.F. Davidson, R.K. Hanson, C.T. Bowman, C.K. Law, W. Tsang, N.P.
Cernansky, D.L. Miller, R.P. Lindstedt, Jetsurf 20 (2010) http://melchior.usc.edu/JetSurF.
[110] S. Dooley, S.H. Won, M. Chaos, J. Heyne, Y. Ju, F.L. Dryer, K. Kumar, C.-J. Sung, H.
Wang, M.A. Oehlschlaeger, R.J. Santoro, T.A. Litzinger, Combust. Flame 157 (2010) 2333.
[111] E. Ranzi, A. Frassoldati, R. Grana, A. Cuoci, T. Faravelli, A.P. Kelley, C.K. Law, Prog.
Energy Combust. Sci. 38 (2012) 468.
[112] S. Gaïl, S.M. Sarathy, M.J. Thomson, P. Diévart, P. Dagaut, Combust. Flame 155 (2008)
635.
[113] H.J. Curran, P. Gaffuri, W.J. Pitz, C.K. Westbrook, Combust. Flame 129 (2002) 253.
[114] H. Wang, M. Frenklach, Combust. Flame 110 (1997) 173.
[115] S.W. Sharpe, T.J. Johnson, R.L. Sams, P.M. Chu, G.C. Rhoderick, P.A. Johnson, Appl.
Spectrosc. 58 (2004) 1452.
[116] L.T. Molina, W.B. Grant, Appl. Opt. 23 (1984) 3893.