Embed Size (px)
Citation preview
JOURNAL OF ENVIRONMENTAL SCIENCE AND HEALTH
Part A—Toxic/Hazardous Substances & Environmental Engineering
Vol. A38, No. 6, pp. 1073–1085, 2003
Removal of Total Suspended Solids from Wastewater in
Constructed Horizontal Flow Subsurface Wetlands
T. Manios,1,* E. I. Stentiford,2 and P. Millner3
1School of Agricultural Technology, Technological and Education
Institute of Crete, Heraklion, Crete, Greece2School of Civil Engineering and 3School of Biochemistry and
Molecular Biology, Leeds University, Leeds, UK
ABSTRACT
Subsurface horizontal flow experimental wetlands (reed beds), were designed and
built based on a combination of two design methodologies, that of the WRc and
Severn Trent Water plc (1996) and that of the USA, EPA (1988). Four different
growing media were used with a combination of top soil, gravel, river sand, and
mature sewage sludge compost, to determine the best substrate for total sus-
pended solids (TSS) removal. Eight units were constructed, two for each growing
media. One bed for each pair was planted with Typha latifolia plants commonly
known as cattails. Primary treated domestic wastewater, was continuously fed to
the beds for more than six months. All eight beds performed very well. The best
performance was achieved by the gravel reed beds with an almost constant
removal rate above 95% and an average effluent concentration of less than
10mg/L. Soil based beds containing top soil and sand, managed to reach
values of removal around 90%. The wetlands containing compost in their sub-
strate, produced an effluent with average concentration of less than 30mg/L and a
percentage removal between 80% and 90%. As expected, there was no significant
difference in the performance of planted and unplanted wetlands.
AQ1*Correspondence: T. Manios, School of Agricultural Technology, Technological and
Education Institute of Crete, Heraklion, 71500, Crete, Greece; E-mail: [email protected].
1
2
3
4
5
6
7
8
9
10
11
12
13
14
15
16
17
18
19
20
21
22
23
24
25
26
27
28
29
30
31
32
33
34
35
36
37
38
39
40
41
42
43
44
45
46
47
120019865_ESE38_06_R1_032403
1073
DOI: 10.1081/ESE-120019865 1093-4529 (Print); 1532-4117 (Online)
Copyright & 2003 by Marcel Dekker, Inc. www.dekker.com
+ [24.3.2003–8:33am] [1073–1086] [Page No. 1073] I:/Mdi/Ese/38(6)/120019865_ESE_038_006_R1.3d Journal of Environmental Health and Science (ESE)
Key Words: Total suspended solids; Wetlands; Reed beds; Sewage sludge;
Compost; Gravel; Sand; Wastewater; Typha latifolia.
INTRODUCTION
Constructed wetlands or reed beds are claimed to be low cost, low technologysystems able to treat a variety of wastewaters. In Europe, such systems have beensuccessfully used for treating domestic sewage for small communities, of less than2,000 people equivalent.[1,2] The main parameters affecting total suspended solids(TSS) removal in a subsurface flow reed bed (SF) are the hydraulic (structural) andmicrobiological characteristics of the substrate. Organic solids removal is achievedmainly through filtration, followed by either aerobic or anaerobic microbial degra-dation on the surface or within the media respectively. According to Davies andCottingham[3] the majority of the solids, almost 75% of the original concentration,existing in wastewater are retained in the first third of a SF bed. Similarly, Zachritzand Fuller[4] suggested that 60% of the TSS were removed in the first one third of aSF reed bed. In SF systems the microorganisms responsible for the degradation oforganic matter (whether soluble or suspended), are generally associated with slimesor films that develop on the surfaces of soil particles, vegetation and litter.[5,6]
Originally the use of soil that had been extracted from the site during the bedconstruction was proposed as a substrate, to reduce the cost of construction. However,solids in the wastewater easily block soil’s pore spaces reducing the hydraulicconductivity.[7,8] Plant roots failed to increase or stabilize the hydraulic conductivityof the soil as expected.[9–11] As a result, the flow in a significant number of SF systemsis over the surface which negates many of the perceived design advantages.
In order to avoid clogging when using fine media, many engineers started to uselarger rock sizes (10–15 cm) with larger void spaces which would also offer lessresistance to flow over long distances. This approach did not solve the problem.The vegetation, which was used in these systems, normally grows in soil and theroot network could not develop properly in the large void spaces. In addition, thelarger rocks provided a smaller surface area for the support of microbial growthcompared to the smaller rock sizes. Considering all these factors it was proposed thatsmaller size rocks (<5 cm) should be used and the hydraulic design of the systemshould be adjusted to provide the necessary hydraulic gradient to ensure subsurfaceflow.[12] Problems with blocking of gravel media have occurred in some systemsmainly as a consequence of insufficient mechanical pretreatment of the waste-water.[13]
Green and Upton[1] presented TSS removal data from five different gravel basedSF reed beds, used for tertiary treatment in the UK. The average TSS removalachieved by the beds in a two years period was above 82% with an average effluentvalue of less than 5mg/L. Two experimental gravel based SF reed beds also, in theUK, were used for secondary and tertiary treatment of domestic wastewater. Thesecondary system achieved suspended solids removal rates by up to 78%, with aneffluent value of 20mg/L and an influent value of 90.6mg/L. The tertiary treatmentsystem achieved a removal of up to 61% with an effluent value of 10mg/L andinfluent value of 25.8mg/L.[14] A gravel based reed bed in Northern Ireland was
1074 Manios, Stentiford, and Millner
48
49
50
51
52
53
54
55
56
57
58
59
60
61
62
63
64
65
66
67
68
69
70
71
72
73
74
75
76
77
78
79
80
81
82
83
84
85
86
87
88
89
90
91
92
93
94
+ [24.3.2003–8:33am] [1073–1086] [Page No. 1074] I:/Mdi/Ese/38(6)/120019865_ESE_038_006_R1.3d Journal of Environmental Health and Science (ESE)
120019865_ESE38_06_R1_032403
specifically designed in order to produce a final effluent with less than 20mg/L ofsuspended solids. The bed failed to reach such a level of performance achieving just57% reduction and an average effluent TSS concentration of 41.4mg/L.[15]
The variation of the above results corresponds to a similar variation in both thesize of the gravel used and the way the substrate was build. In 1996, WRc and SevernTrent Water plc[2] in the first reed bed design and construction manual, for the UKwater industry, suggested the use of gravel with size varying from 3 to 12mm.However, no specific guidance was given for the way the substrate should be putin place or what would happen if a mixture of different sized gravel was used. Incontrast to horizontal flow SF, for the vertical systems a placement methodology wassuggested the use of successive layers of gravel and sand in order to achieve max-imum performance. Those layers would be as follows, from top to bottom: 8 cm ofsharp river sand, 15 cm of 6mm washed pea gravel, 10 cm of 12mm round washedgravel and 15 cm of 30–60mm round washed gravel. The main purpose of the sandlayer was to provide a suitable rooting medium for the plants on the bed. Differentdiameter gravels were used in other layers, in an effort to provide the substrate with avariety of matrices. These matrices would allow the wastewater to be treated by‘‘different’’ filters each one with different characteristics and abilities. It was hopedthat this variety of materials would be able to create a system which would beoperational from the first day of installment and the pores of which would not beeasily blocked with time. The first part of this research was aimed at evaluating theperformance (through the removal of TSS) of this mixed substrate in subsurfacehorizontal flow reed beds treating domestic sewage, specially in comparison torelevant soil based systems.
The use of gravel and sand, materials that often have to be transported somedistance, can increase considerably the cost of construction. It was considered impor-tant to study the possible use of alternative materials that would provide the cheapersoil based substrates with additional mechanical support in order to sustain theiroriginal hydraulic characteristics. A number of researchers used compost as part ofSF systems in order to remove heavy metals from the water and this met withconsiderable success.[16,17] However, none of them studied the possible use of suchmaterials in SF beds treating municipal wastewater. Composted materials have beenused in agriculture for a long period of time as a soil improver. Their main advan-tages are that they provide nutrients to the soil, increase the content of organicmatter, and improving the soil structure.[18] Such structural effects could supportthe soil based wetlands and avoid the creation of short cuts and overflows. Theevaluation (again through the TSS removal) of the use of compost in horizontalSF beds soil based substrate formed the second part of our research. At the sametime the presence of plants, in one of the two beds of each substrate, would allow toestimate their significance in the treating process.
MATERIALS AND METHODS
Eight experimental horizontal flow wetlands, were set up containing fourdifferent mixtures of gravel, river sand, top soil, and mature sewage sludge compost.For each mixture two beds were constructed, one of them was planted with
Removal of Solids from Wastewater 1075
95
96
97
98
99
100
101
102
103
104
105
106
107
108
109
110
111
112
113
114
115
116
117
118
119
120
121
122
123
124
125
126
127
128
129
130
131
132
133
134
135
136
137
138
139
140
141
+ [24.3.2003–8:33am] [1073–1086] [Page No. 1075] I:/Mdi/Ese/38(6)/120019865_ESE_038_006_R1.3d Journal of Environmental Health and Science (ESE)
120019865_ESE38_06_R1_032403
Typha latifolia commonly known as cattails, where the other remain free of anyvegetation. In the results the symbol (þ) is used to identify these beds plantedwith cattails. The ratios (by volume) of each of the materials for each growingmedia were as follows:
Material A: (beds A and Aþ) 25% compost, 25% river sand, and 50% top soilper volume (mixed).
Material B: (beds B and Bþ) 50% compost, 10% river sand, and 40% soil pervolume (mixed).
Material C: (beds C and Cþ) 50% river sand and 50% soil per volume (mixed).Material D: (beds D and Dþ) was constructed in layers; the bottom 15 cm was a30mm washed gravel layer, the next 10 cm was a 12mm washed gravel.The final two layers were 10 cm of 6mm gravel and 5 cm of river sand(layered).
There were a large variety of composts that could have been used for this study,however it was decided to use sewage sludge and straw compost for the followingreasons: (i) the research group had extensive experience in the use of such materialsfor a variety of purposes, (ii) large quantities of high quality, mature sewage sludgebased compost were available, (iii) the contamination of such materials with heavymetals decreases their potential use in agriculture, increasing the need for alternativeuses, (iv) the inclusion of straw would improve the structural characteristics of thecompost, and (v) such materials contain a large variety of micro-organisms which itwas thought would contribute to the performance.
PVC tanks were used, each 65 cm long by 45 cm wide and 60 cm deep. The mediadepth was 40 cm, occupying a total volume of 117L and giving a surface area ofapproximately 0.29m2 and a cross sectional area of 0.18m2. The sewage sludgecompost used was produced by Thames Water, using an initial mix of sludge andstraw 1:1 by volume.
The feeding of the bed was continuous. The design of the beds was based oncombination of the methodologies developed by the WRc and Severn Trent Waterplc[2] and the US EPA.[19] The required surface area and the relevant flow rate werecalculated using the following equation:
As ¼ ½QðlnCo� lnCeÞ�=kBOD ð1Þ
where:
As¼ surface area of the system (m2)Q¼ average flow rate through the system (m3 d�1)Co¼ influent value of BOD5 (mg/L)Ce¼ effluent value of BOD5 (mg/L)
kBOD¼ rate constant (md�1)
The rate constant kBOD would normally be expected to be between 0.067 and0.1md�1. The WRc and Severn Trent Water plc[2] manual recommends a value forthe UK of 0.1md�1 and this was used in the design of the experimental beds.
1076 Manios, Stentiford, and Millner
142
143
144
145
146
147
148
149
150
151
152
153
154
155
156
157
158
159
160
161
162
163
164
165
166
167
168
169
170
171
172
173
174
175
176
177
178
179
180
181
182
183
184
185
186
187
188
+ [24.3.2003–8:33am] [1073–1086] [Page No. 1076] I:/Mdi/Ese/38(6)/120019865_ESE_038_006_R1.3d Journal of Environmental Health and Science (ESE)
120019865_ESE38_06_R1_032403
If the following values are used with Eq. (1): Ce¼ 150mg/L, Co¼ 20mg/L,kBOD¼ 0.1md�1, and As¼ 0.29m2 then the permissible flow would be 14.5 L d�1
(approximately 15Ld�1). This flow would give the soil based beds a designedretention time of 72 h and 42 h for the gravel bed. Despite the efforts made indesigning and constructing the beds to ensure that all the beds volume would beavailable to the flowing wastewater, their hydraulic performance was checked. Thiswas done by measuring the retention time of the beds, to give an estimate of thedegree of channelled flow taking place. A tracer study using rhodamine dye wascarried out, a month after installation when the beds were matured. The rhodaminetest is based on adding a ‘‘spike’’ to the inlet and then measuring the concentrationof the rhodamine in the effluent using a fluorometer. Based on the literature, it wasexpected that there would be a considerable difference between the designed and thereal retention time for both soil and gravel based beds.[20,21]
The TSS values were measured in the influent and the effluent of each bed. Themethod for TSS analyzes was based in the Standard Methods for the Analyses ofWater and Wastewater.[22] The significance of the effect of cattails in the TSSremoval was measured by using the t-test for paired samples as presented bySnedecor and Cochran.[23]
RESULTS
The ambient temperature during the experimental period ranged from 8 to 21�Cproviding good growing conditions for the microorganisms and the plants in thebeds. The pH value for materials A, B, and C was near neutral, and the gravel andsand used for material D were well washed. The flow of wastewater to each bed wasconstant (15Ld�1 per bed) for the 196 days of the experiment. The cattails (Typhalatifolia) were well developed in the planted beds, where no vegetation was allowedto grow in any of the un-planted beds. Approximately, two months into the experi-ment, the hydraulic retention time (HRT) was estimated using the rhodamine tracertest. For beds Aþ, A, Bþ, B, Cþ, C, Dþ, and D, the estimated HRT was 10, 8, 12,14, 11, 14, 24, and 18 h respectively.
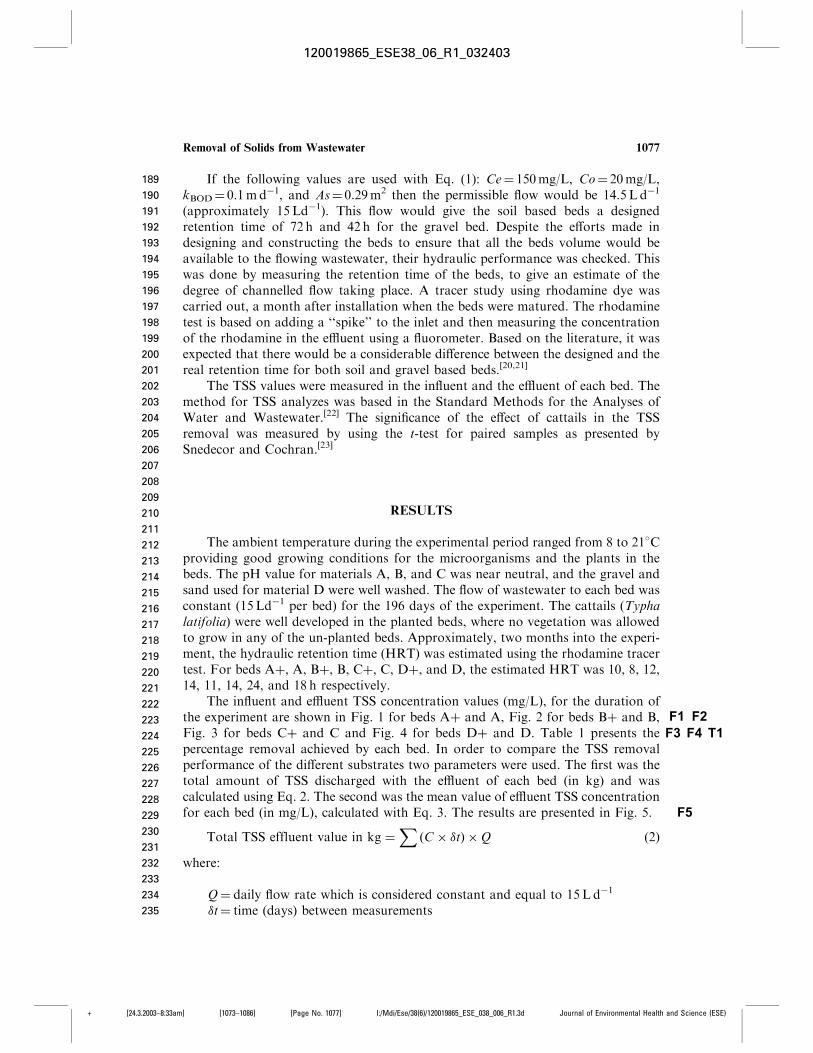
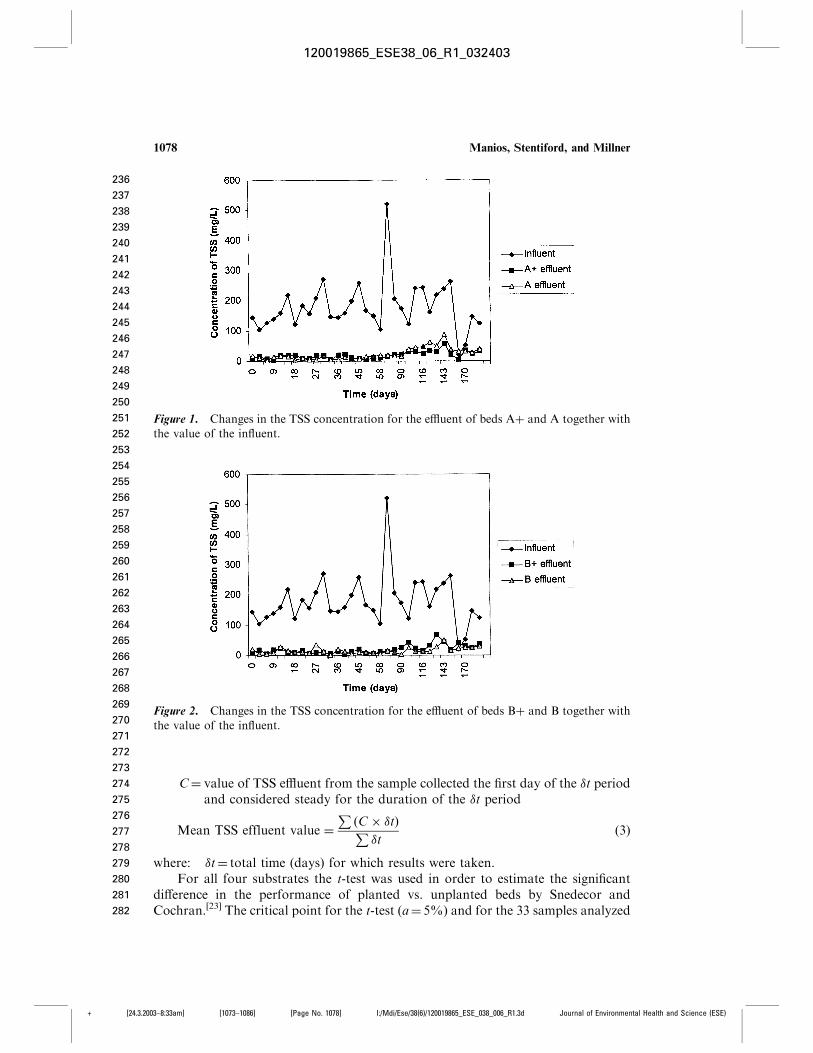
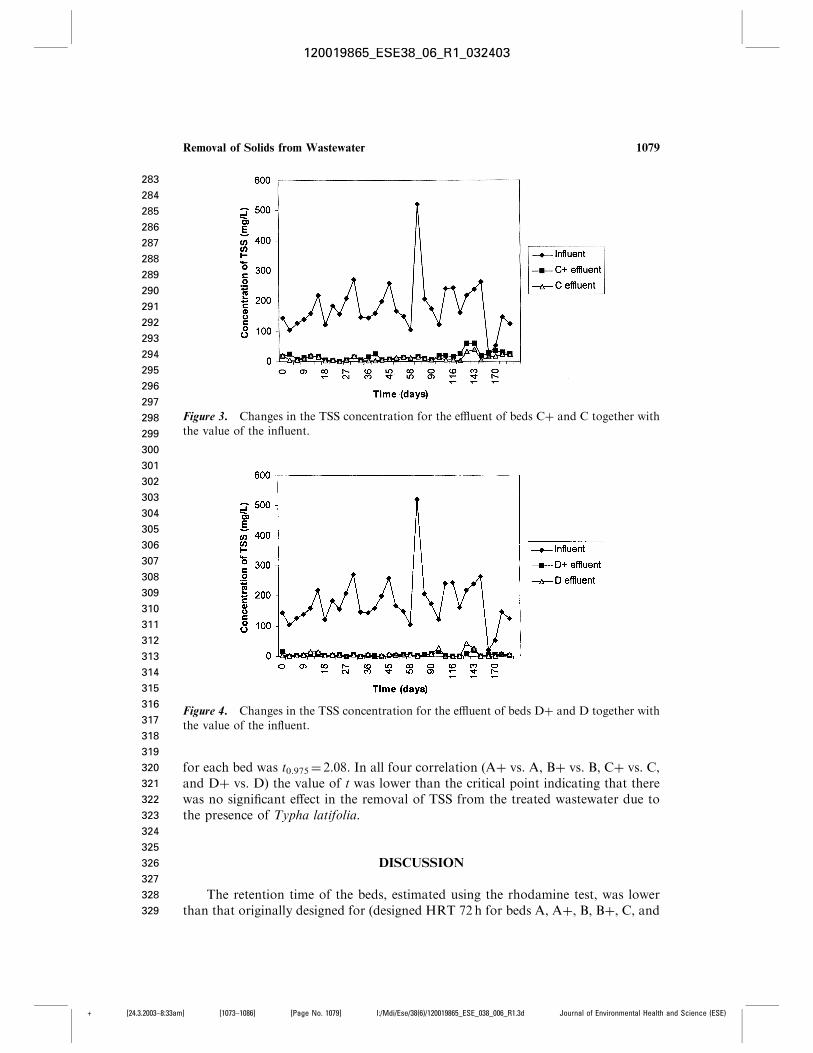
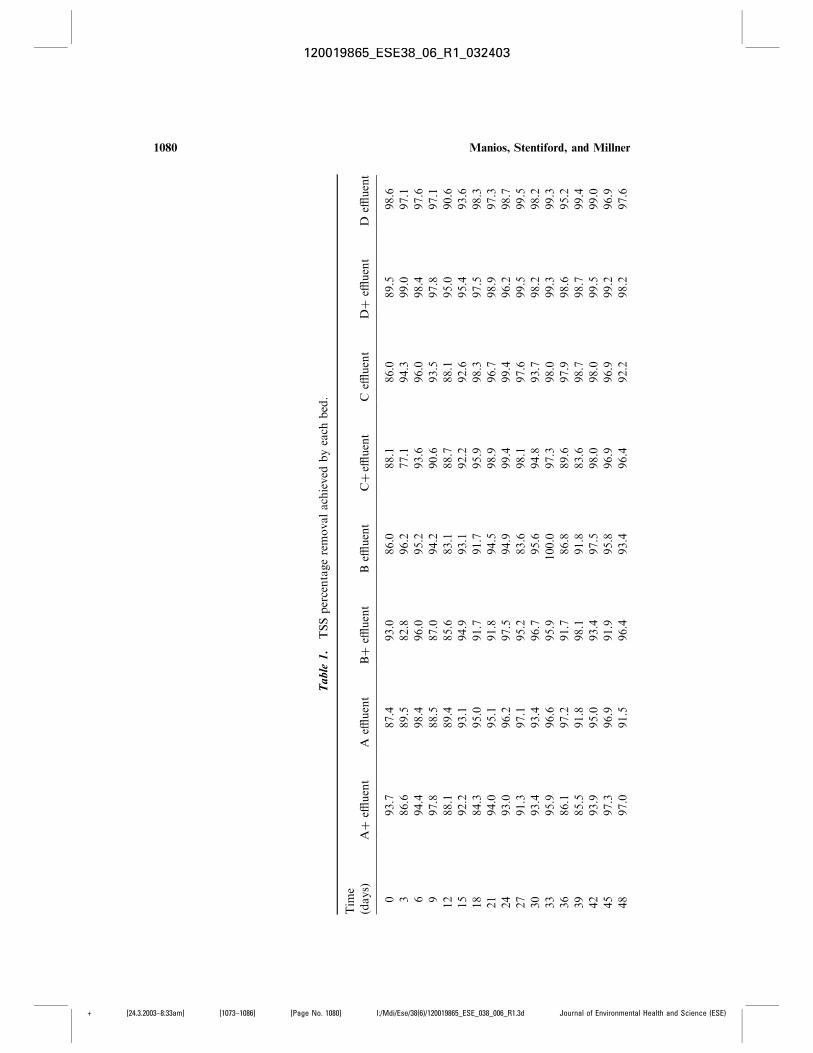
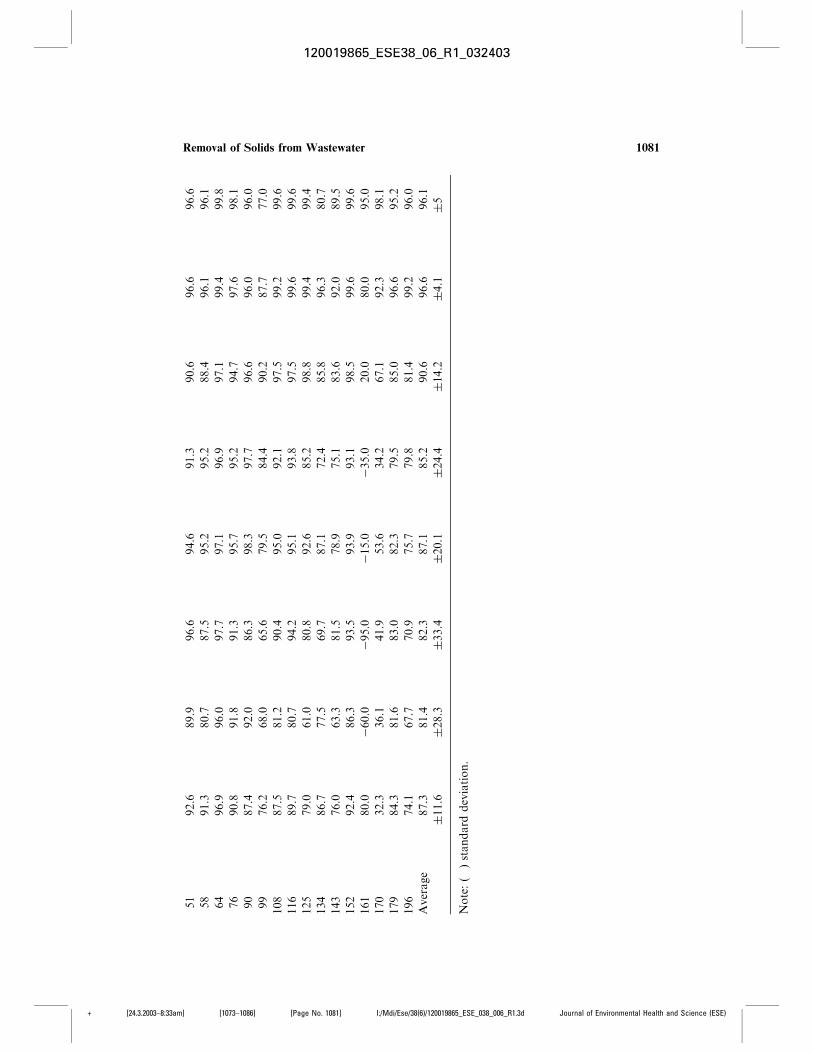
The influent and effluent TSS concentration values (mg/L), for the duration ofthe experiment are shown in Fig. 1 for beds Aþ and A, Fig. 2 for beds Bþ and B,Fig. 3 for beds Cþ and C and Fig. 4 for beds Dþ and D. Table 1 presents thepercentage removal achieved by each bed. In order to compare the TSS removalperformance of the different substrates two parameters were used. The first was thetotal amount of TSS discharged with the effluent of each bed (in kg) and wascalculated using Eq. 2. The second was the mean value of effluent TSS concentrationfor each bed (in mg/L), calculated with Eq. 3. The results are presented in Fig. 5.
Total TSS effluent value in kg ¼X
ðC �tÞ Q ð2Þ
where:
Q¼ daily flow rate which is considered constant and equal to 15L d�1
�t¼ time (days) between measurements
F1 F2
F3 F4 T1
F5
Removal of Solids from Wastewater 1077
189
190
191
192
193
194
195
196
197
198
199
200
201
202
203
204
205
206
207
208
209
210
211
212
213
214
215
216
217
218
219
220
221
222
223
224
225
226
227
228
229
230
231
232
233
234
235
+ [24.3.2003–8:33am] [1073–1086] [Page No. 1077] I:/Mdi/Ese/38(6)/120019865_ESE_038_006_R1.3d Journal of Environmental Health and Science (ESE)
120019865_ESE38_06_R1_032403
C¼ value of TSS effluent from the sample collected the first day of the �t periodand considered steady for the duration of the �t period
Mean TSS effluent value ¼
PðC �tÞP
�tð3Þ
where: ��t¼ total time (days) for which results were taken.For all four substrates the t-test was used in order to estimate the significant
difference in the performance of planted vs. unplanted beds by Snedecor andCochran.[23] The critical point for the t-test (a¼ 5%) and for the 33 samples analyzed
Figure 2. Changes in the TSS concentration for the effluent of beds Bþ and B together with
the value of the influent.
Figure 1. Changes in the TSS concentration for the effluent of beds Aþ and A together with
the value of the influent.
1078 Manios, Stentiford, and Millner
236
237
238
239
240
241
242
243
244
245
246
247
248
249
250
251
252
253
254
255
256
257
258
259
260
261
262
263
264
265
266
267
268
269
270
271
272
273
274
275
276
277
278
279
280
281
282
+ [24.3.2003–8:33am] [1073–1086] [Page No. 1078] I:/Mdi/Ese/38(6)/120019865_ESE_038_006_R1.3d Journal of Environmental Health and Science (ESE)
120019865_ESE38_06_R1_032403
for each bed was t0.975¼ 2.08. In all four correlation (Aþ vs. A, Bþ vs. B, Cþ vs. C,and Dþ vs. D) the value of t was lower than the critical point indicating that therewas no significant effect in the removal of TSS from the treated wastewater due tothe presence of Typha latifolia.
DISCUSSION
The retention time of the beds, estimated using the rhodamine test, was lowerthan that originally designed for (designed HRT 72 h for beds A, Aþ, B, Bþ, C, and
Figure 3. Changes in the TSS concentration for the effluent of beds Cþ and C together with
the value of the influent.
Figure 4. Changes in the TSS concentration for the effluent of beds Dþ and D together with
the value of the influent.
Removal of Solids from Wastewater 1079
283
284
285
286
287
288
289
290
291
292
293
294
295
296
297
298
299
300
301
302
303
304
305
306
307
308
309
310
311
312
313
314
315
316
317
318
319
320
321
322
323
324
325
326
327
328
329
+ [24.3.2003–8:33am] [1073–1086] [Page No. 1079] I:/Mdi/Ese/38(6)/120019865_ESE_038_006_R1.3d Journal of Environmental Health and Science (ESE)
120019865_ESE38_06_R1_032403
Table
1.
TSSpercentageremovalachieved
byeach
bed.
Time
(days)
Aþeffl
uent
Aeffl
uent
Bþeffl
uent
Beffl
uent
Cþeffl
uent
Ceffl
uent
Dþ
effluent
Deffl
uent
093.7
87.4
93.0
86.0
88.1
86.0
89.5
98.6
386.6
89.5
82.8
96.2
77.1
94.3
99.0
97.1
694.4
98.4
96.0
95.2
93.6
96.0
98.4
97.6
997.8
88.5
87.0
94.2
90.6
93.5
97.8
97.1
12
88.1
89.4
85.6
83.1
88.7
88.1
95.0
90.6
15
92.2
93.1
94.9
93.1
92.2
92.6
95.4
93.6
18
84.3
95.0
91.7
91.7
95.9
98.3
97.5
98.3
21
94.0
95.1
91.8
94.5
98.9
96.7
98.9
97.3
24
93.0
96.2
97.5
94.9
99.4
99.4
96.2
98.7
27
91.3
97.1
95.2
83.6
98.1
97.6
99.5
99.5
30
93.4
93.4
96.7
95.6
94.8
93.7
98.2
98.2
33
95.9
96.6
95.9
100.0
97.3
98.0
99.3
99.3
36
86.1
97.2
91.7
86.8
89.6
97.9
98.6
95.2
39
85.5
91.8
98.1
91.8
83.6
98.7
98.7
99.4
42
93.9
95.0
93.4
97.5
98.0
98.0
99.5
99.0
45
97.3
96.9
91.9
95.8
96.9
96.9
99.2
96.9
48
97.0
91.5
96.4
93.4
96.4
92.2
98.2
97.6
1080 Manios, Stentiford, and Millner
+ [24.3.2003–8:33am] [1073–1086] [Page No. 1080] I:/Mdi/Ese/38(6)/120019865_ESE_038_006_R1.3d Journal of Environmental Health and Science (ESE)
120019865_ESE38_06_R1_032403
51
92.6
89.9
96.6
94.6
91.3
90.6
96.6
96.6
58
91.3
80.7
87.5
95.2
95.2
88.4
96.1
96.1
64
96.9
96.0
97.7
97.1
96.9
97.1
99.4
99.8
76
90.8
91.8
91.3
95.7
95.2
94.7
97.6
98.1
90
87.4
92.0
86.3
98.3
97.7
96.6
96.0
96.0
99
76.2
68.0
65.6
79.5
84.4
90.2
87.7
77.0
108
87.5
81.2
90.4
95.0
92.1
97.5
99.2
99.6
116
89.7
80.7
94.2
95.1
93.8
97.5
99.6
99.6
125
79.0
61.0
80.8
92.6
85.2
98.8
99.4
99.4
134
86.7
77.5
69.7
87.1
72.4
85.8
96.3
80.7
143
76.0
63.3
81.5
78.9
75.1
83.6
92.0
89.5
152
92.4
86.3
93.5
93.9
93.1
98.5
99.6
99.6
161
80.0
�60.0
�95.0
�15.0
�35.0
20.0
80.0
95.0
170
32.3
36.1
41.9
53.6
34.2
67.1
92.3
98.1
179
84.3
81.6
83.0
82.3
79.5
85.0
96.6
95.2
196
74.1
67.7
70.9
75.7
79.8
81.4
99.2
96.0
Average
87.3
81.4
82.3
87.1
85.2
90.6
96.6
96.1
11.6
28.3
33.4
20.1
24.4
14.2
4.1
5
Note:(�
)standard
deviation.
Removal of Solids from Wastewater 1081
+ [24.3.2003–8:33am] [1073–1086] [Page No. 1081] I:/Mdi/Ese/38(6)/120019865_ESE_038_006_R1.3d Journal of Environmental Health and Science (ESE)
120019865_ESE38_06_R1_032403
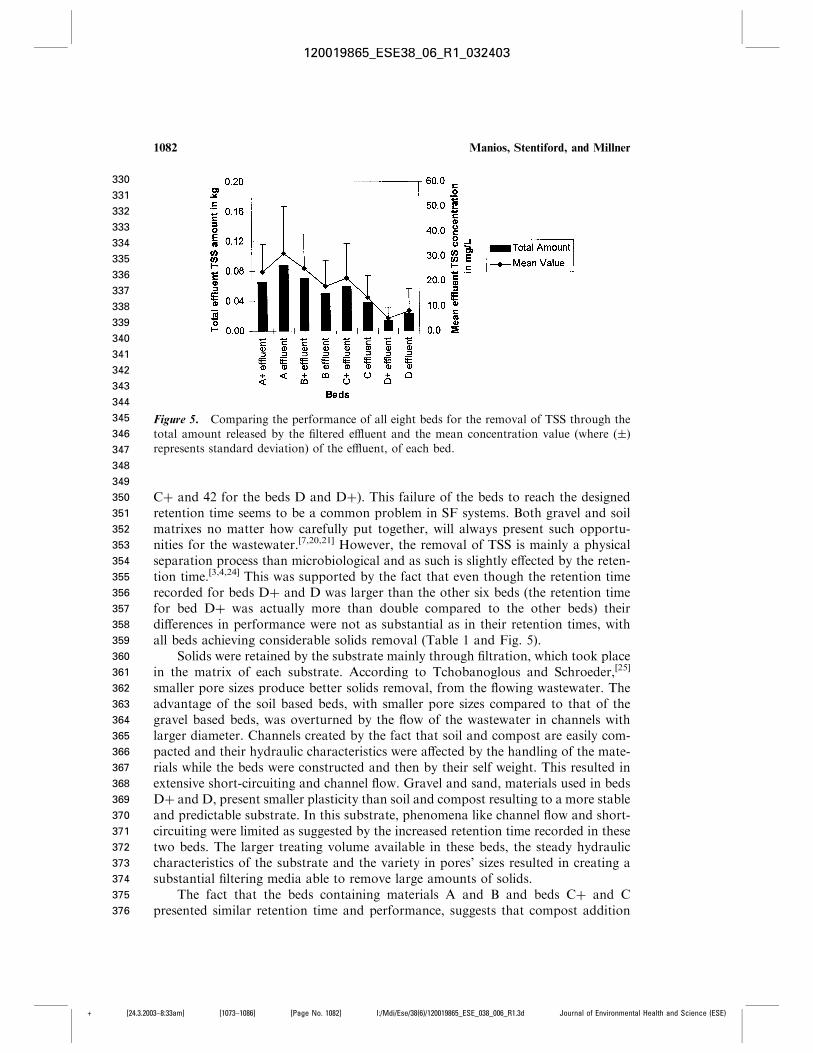
Cþ and 42 for the beds D and Dþ). This failure of the beds to reach the designedretention time seems to be a common problem in SF systems. Both gravel and soilmatrixes no matter how carefully put together, will always present such opportu-nities for the wastewater.[7,20,21] However, the removal of TSS is mainly a physicalseparation process than microbiological and as such is slightly effected by the reten-tion time.[3,4,24] This was supported by the fact that even though the retention timerecorded for beds Dþ and D was larger than the other six beds (the retention timefor bed Dþ was actually more than double compared to the other beds) theirdifferences in performance were not as substantial as in their retention times, withall beds achieving considerable solids removal (Table 1 and Fig. 5).
Solids were retained by the substrate mainly through filtration, which took placein the matrix of each substrate. According to Tchobanoglous and Schroeder,[25]
smaller pore sizes produce better solids removal, from the flowing wastewater. Theadvantage of the soil based beds, with smaller pore sizes compared to that of thegravel based beds, was overturned by the flow of the wastewater in channels withlarger diameter. Channels created by the fact that soil and compost are easily com-pacted and their hydraulic characteristics were affected by the handling of the mate-rials while the beds were constructed and then by their self weight. This resulted inextensive short-circuiting and channel flow. Gravel and sand, materials used in bedsDþ and D, present smaller plasticity than soil and compost resulting to a more stableand predictable substrate. In this substrate, phenomena like channel flow and short-circuiting were limited as suggested by the increased retention time recorded in thesetwo beds. The larger treating volume available in these beds, the steady hydrauliccharacteristics of the substrate and the variety in pores’ sizes resulted in creating asubstantial filtering media able to remove large amounts of solids.
The fact that the beds containing materials A and B and beds Cþ and Cpresented similar retention time and performance, suggests that compost addition
Figure 5. Comparing the performance of all eight beds for the removal of TSS through the
total amount released by the filtered effluent and the mean concentration value (where ()
represents standard deviation) of the effluent, of each bed.
1082 Manios, Stentiford, and Millner
330
331
332
333
334
335
336
337
338
339
340
341
342
343
344
345
346
347
348
349
350
351
352
353
354
355
356
357
358
359
360
361
362
363
364
365
366
367
368
369
370
371
372
373
374
375
376
+ [24.3.2003–8:33am] [1073–1086] [Page No. 1082] I:/Mdi/Ese/38(6)/120019865_ESE_038_006_R1.3d Journal of Environmental Health and Science (ESE)
120019865_ESE38_06_R1_032403
had little or no effect on the mechanical characteristics of the substrate’s matrix.Compost failed to increase the volume of the beds used for the treatment of thewastewater. Approximately 18% of the available volume was used in beds Bþ and B,where this amount was even smaller for beds Aþ and A (13% approximately). Theextensive channelling and short circuiting which took place in the soil based beds,responsible for their smaller ability to remove solids, was also responsible for theirreduced retention times.
As presented in Table 1 and Fig. 5, beds achieved considerable solids removal.For beds Dþ and D, the average value of TSS in the effluent was 5.2 and 8.1mg/Lrespectively giving an average percentage removal above 95% for both beds. Forbeds Cþ and C, the average value in the effluent was less than 22mg/L, with bed Cperforming better than bed Cþ. The percentage removal was above 85 and 90%respectively. Beds Bþ and B recorded an average percentage removal of 82%, forbed Bþ and 87% for bed B. The average effluent concentration for both beds wasbetween 18 and 2mg/L. Bed A was the only one which presented an average TSSconcentration in the effluent of 31mg/L, with bed Aþ recording the third worstperformance after beds A and Bþ with 23.5mg/L. The percentage removal for bedAþ was on average 87% where as for bed A it was the lowest from all beds at81.4%. The slight increase in the effluent value of TSS after day 125 and for aperiod of few weeks can be explained through the break down of biofilmcreated by the slow flow of effluent in the outlet pipes as also suggested byWorral et al.[15]
The performance of the Dþ and D beds is one of the highest recorded in relevantpublications for SF systems either with soil or gravel based substrate.[3,7,14,15,26] Theabove results combined with the COD removing performance[27] of the gravel basedbeds do indicate that the use of different size gravel in layers might be an appropriatesolution to the problem of the design and construction of such substrates.
The presence of cattails (Typha latifolia) did not produce a significant differ-ence between the vegetated beds’ performance and their twin unplanted beds. Thisis explained by the fact that the root system of the plants did not improve thehydraulic conductivity of the soil based substrates as indicated by the low retentiontimes recorded in beds Aþ, A, Bþ, B, Cþ, and C. The t-test used in all fourcouples suggested that. The t value for couple Aþ and A, couple Bþ and B, coupleCþ and C, and couple Dþ and D was 0.14, 0.13, 0.17, and 0.11 respectively,with the critical point (a¼ 5%) t0.975¼ 2.08. It is a common belief that the roleof plants in the removal of TSS is small or even non-existent in a constructed SFreed bed.[7,26,28]
CONCLUSIONS
All eight beds performed very well in removing TSS from primary treated waste-water recording some of the highest removal percentages in relevant literature. Thetwo beds containing gravel performed better than any of the other six beds. Themain reason for such good performance of the gravel based beds was the betterphysical–mechanical structure of the substrate as also indicated by their longestretention times. The soil and sand beds performance was not improved by the
AQ2
Removal of Solids from Wastewater 1083
377
378
379
380
381
382
383
384
385
386
387
388
389
390
391
392
393
394
395
396
397
398
399
400
401
402
403
404
405
406
407
408
409
410
411
412
413
414
415
416
417
418
419
420
421
422
423
+ [24.3.2003–8:33am] [1073–1086] [Page No. 1083] I:/Mdi/Ese/38(6)/120019865_ESE_038_006_R1.3d Journal of Environmental Health and Science (ESE)
120019865_ESE38_06_R1_032403
addition of the sewage sludge compost, presenting extensive short circuiting andchannelled flow, a greater problem with the soil-based systems. In our experimentsthis resulted in a decrease in the actual volume of the bed used by the flowing influentto less than one third. This was a result of the characteristics of the materials used inthe bed construction. Soil, sand, and compost are compactable materials with aninitial large porosity, which can be easily changed when pressure is applied to them.Gravel is far less compactible, and gives a more steady and predictable result. Itrequires less careful handling and according to the literature, provides the systemwith a longer lifetime by minimizing blocking of the pores.
In summary, the gravel based beds performed better than any other substrate,whereas the sewage sludge compost failed to provide an improvement over the soilbased substrate in this short term trial. There was no significant effect in the removalof TSS due to the presence of plants.
REFERENCES
1. Green, M.B.; Upton, J. Constructed wetlands: a cost-effective way to polishwastewater effluents for small communities. Water Environ. Res. 1994, 66,188–192.
2. WRc.; Severn Trent Water Plc. Reed Beds and Constructed Wetlands for WasteWater Treatment; WRc: Swindon, UK, 1996.
3. Davies, T.H.; Cottingham, P.D. The use of constructed wetlands for treatingindustrial effluent (textile dyes). Water Sci. Technol. 1994, 29, 227–232.
4. Zachritz, W.H.; Fuller, J.W. Performance of an artificial wetlands filter treatingfaculative lagoon effluent at Carville, Lousiana. Water Environ. Res. 1993, 65,46–52.
5. Reddy, K.R.; D’Angelo, E.M. Biogeochemical indicators to evaluate pollutantsremoval efficiency in constructed wetlands. Water Sci. Technol. 1997, 35, 1–10.
6. Wittgren, H.B.; Maehlum, T. Wastewater treatment wetlands in cold climates.Water Sci. Technonol. 1997, 35, 45–53.
7. Tanner, C.C.; Clayton, J.S.; Upsdell, M.P. Effect of loading rate and plantingon treatment of dairy farm wastewater in constructed wetland-I. Removal ofoxygen demand, suspended solids, and Faecal Coliforms. Water Res. 1995, 29,17–26.
8. Blazewejewski, R.; Blazewejewska, S.M. Soil clogging phenomena in con-structed wetland with subsurface flow. Water Sci. Technol. 1997, 35, 183–188.
9. Brix, H. Do macrophytes play a role in constructed treatment wetlands. WaterSci. Technol. 1997, 35, 11–17.
10. Sanford, W.E.; Steenhuis, T.S.; Parlange, J.Y.; Surface, J.M.; Peverly, J.H.Hydraulic conductivity of gravel and sand as substrates in rock-reed filters,Ecol. Eng. 1995, 4, 321–336.
11. Zalidis, G.; Katsavouni, S.; Takavakoglou, V.; Gerakis, A. Reduction ofNutrients and Organics Using Constructed Wetlands, Proceedings of the 7thPanhellenic Soil Sience Symposium, Agrinio 27–30 of May, Greece, 1998.
12. Reed, S.C.; Brown, D.S. Constructed wetland design—the first generation.Water Environ. Res. 1992, 64, 776–781.
1084 Manios, Stentiford, and Millner
424
425
426
427
428
429
430
431
432
433
434
435
436
437
438
439
440
441
442
443
444
445
446
447
448
449
450
451
452
453
454
455
456
457
458
459
460
461
462
463
464
465
466
467
468
469
470
+ [24.3.2003–8:33am] [1073–1086] [Page No. 1084] I:/Mdi/Ese/38(6)/120019865_ESE_038_006_R1.3d Journal of Environmental Health and Science (ESE)
120019865_ESE38_06_R1_032403
13. Brix, H. Macrophyte-mediated oxygen transfer in wetlands: transportmechanisms and rates. In Constructed Wetlands for Water QualityImprovement; Moshiri, G.A., Ed.; Lewis Publishers, CRC Press: USA, 1993.
14. Williams, J.; Bhgat, M.; May, E.; Ford, M.; Butler, J. Mineralization andpathogen removals in gravel bed hydroponic constructed wetlands forwastewater treatment. Water Sci. Technol. 1995, 32, 49–58.
15. Worrall, P.; Peberdy, K.; McGinn, J. Construction and priliminaryperformance of reed bed treatment systems for castle Espie Wildlife andWetlands Trust Centre, Northern Ireland. J. Chart. Inst. Water Environ.Manage. 1998, 12, 86–91.
16. Eger, P. Wetland treatment for trace metal removal from mine drainage: theimportance of aerobic and anaerobic processes. Water Sci. Technol. 1994, 29,249–256.
17. Mitchel, L.K.; Karathanasis, A.D. Treatment of metal-chloride-enrichedwastewater by simulated constructed wetlands. Environ. Geochem. Hlth.1995, 17, 119–126.
18. Diaz, L.F.; Savage, G.M.; Eggerth, L.L.; Golueke, C.G. Composting andRecycling Municipal Solid Waste; Lewis Publishers: Boca Raton, Florida,USA, 1993.
19. EPA. Constructed Wetlands and Aquatic Plant Systems for MunicipalWastewater Treatment, Design Manual, EPA/625/1-88/022/, USA, 1988.
20. Breen, P.F.; Chick, A.J. Rootzone dynamics in constructed wetlands receivingwastewater: a comparison of vertical and horizontal flow systems. Water Sci.Technol. 1995, 32, 281–290.
21. Batchelor, A.; Loots, P. A critical evaluation of a pilot scale subsurface flowwetland 10 years after commissioning. Water Sci. Technol. 1997, 35, 337–343.
22. AHPA, Standard Methods: for the Examination of Water and Wastewater.Published jointly by: American Public Health Association, American WaterWorks Association, Water Environment Federation, 19th Ed.; WashingtonDC, USA, 1995.
23. Snedecor, G.W.; Cochran, W.G. Statistical Methods, 7th Ed.; Iowa StateUniversity: Iowa, USA, 1980.
24. Shutes, R.B.E.; Revitt, D.M.; Mungur, A.S.; Scholes, L.N.L. Design of wetlandsystems for the treatment of urban runoff. Water Qual. Int. 1997, March/April,35–38.
25. Tchobanoglous, G.; Schroeder, E.D.Water Quality: Characteristics,Modelling,Modification; Addison–Wesley: Reading, Massachusetts, USA, 1985.
26. Srinivasan, N.; Weaver, R.W.; Lesikar, B.J.; Persyn, R.A. Improvement ofdomestic wastewater quality by subsurface flow constructed wetlands.Bioresource Technol. 2000, 75, 19–25.
27. Manios, T.; Stentiford, E.I.; Millner, P.A. The removal of COD from primarytreated domestic wastewater in subsurface reed beds using different substrates.Submitted to Water Environ. Res. 2002.
28. Hiley, P.D. The reality of sewage treatment using wetlands. Water Sci. Technol.1995, 32, 329–338.
Received October 3, 2002
Removal of Solids from Wastewater 1085
471
472
473
474
475
476
477
478
479
480
481
482
483
484
485
486
487
488
489
490
491
492
493
494
495
496
497
498
499
500
501
502
503
504
505
506
507
508
509
510
511
512
513
514
515
516
517
+ [24.3.2003–8:33am] [1073–1086] [Page No. 1085] I:/Mdi/Ese/38(6)/120019865_ESE_038_006_R1.3d Journal of Environmental Health and Science (ESE)
120019865_ESE38_06_R1_032403

+ [24.3.2003–8:34am] [1073–1086] [Page No. 1086] I:/Mdi/Ese/38(6)/120019865_ESE_038_006_R1.3d Journal of Environmental Health and Science (ESE)