Embed Size (px)
Citation preview

This is a version of a publication
in
Please cite the publication as follows:
DOI:
Copyright of the original publication:
This is a parallel published version of an original publication.This version can differ from the original published article.
published by
Removal and recovery of arsenic from concentrated sulfuric acid by solventextraction
Jantunen Niklas, Virolainen Sami, Latostenmaa Petri, Salminen Justin,Haapalainen Mika, Sainio Tuomo
Jantunen, N., Virolainen, S., Latostenmaa, P., Salminen, J., Haapalainen, M., Sainio, T. (2019).Removal and recovery of arsenic from concentrated sulfuric acid by solvent extraction.Hydrometallurgy, 187, 101–112. https://doi.org/10.1016/j.hydromet.2019.05.008
Author's accepted manuscript (AAM)
Elsevier
Hydrometallurgy
10.1016/j.hydromet.2019.05.008
© 2019 Elsevier B.V.

Removal and recovery of arsenic from concentrated sulfuric acid by solvent extraction
Niklas Jantunen1), Sami Virolainen*,1), Petri Latostenmaa2), Justin Salminen3), Mika
Haapalainen4), and Tuomo Sainio1)
1) LUT University, School of Engineering Science, Yliopistonkatu 34, 53850 Lappeenranta,
Finland, * Corresponding author2) Boliden Harjavalta Oy, Teollisuuskatu 1, 29200 Harjavalta, Finland3) Boliden Kokkola Oy, Sinkkiaukio 1, 67900 Kokkola, Finland4) Outotec Oyj, Pori Research Center, Kuparitie 10, 28100 Pori, Finland
Abstract
Arsenic-contaminated sulfuric acid solutions are produced in large quantities as by-product during
pyrometallurgical processing of sulfide minerals. Options for re-using such acid solutions are
increased if the arsenic is removed and recovered as a product. The performances of tributyl
phosphate and a mixture of 6 wt-% 1,2-octanediol in 2-ethylhexanol were studied in liquid-liquid
extraction of arsenic from an industrial solution containing 10.4 M H2SO4. It was found that, due
to the complex phase equilibria, a process design based on conventional batch equilibrium data
did not describe the countercurrent processes accurately. A countercurrent flowsheet utilizing
undiluted tributyl phosphate was investigated by pseudo-countercurrent extractions. 83.7 %
extraction of arsenic and 31.4 % coextraction of H2SO4 was obtained in three-stage countercurrent
extraction operated at a solvent-to-feed ratio of 0.79. Two-stage countercurrent scrubbing with
pure water at O/A = 4.03 back-extracted 83.6 % of H2SO4 and 24.9 % of arsenic. 100 % and
89.7 % back-extraction was achieved in four-stage stripping at O/A = 2.01 for H2SO4 and arsenic,
respectively. The effects of varying the flowsheet and operating parameters on separation
efficiency are discussed.
Keywords
Liquid-liquid extraction; Solvent extraction; Arsenic; Sulfuric acid; Pseudo-countercurrent
method; Recycling

1
1 Introduction
Utilization of sulfide minerals in the metals refining industry produces by-product H2SO4 solutions
that contain arsenic and other impurities. In copper production, for instance, pyrometallurgical
treatments do not remove the impurities completely, and they thus end up in cast copper anodes.
During electrolytic purification of copper, arsenic dissolves in the H2SO4 electrolyte from the
anodes with other impurities. These impurities decrease the quality of the product cathodes and
lower the efficiency of the electrolysis cell. Furthermore, extremely toxic and lethal arsine gas,
AsH3, may form if levels of arsenic get sufficiently high in the electrolyte [1].
Partial replacement of the electrolyte with fresh sulfuric acid solution can alleviate the problems
caused by impurities. The electrolyte bleed is then directed to separation processes where the
impurities or by-products can be treated and recovered. Copper electrolyte bleeds contain
significant amounts of nickel, which can be removed by evaporative crystallization to produce
crude nickel sulfate. Evaporation concentrates both H2SO4 and arsenic, and the resulting
concentrated H2SO4 solution can be recycled back to electrolysis or sent for effluent treatment and
disposal [1].
Flue gases from copper smelters contain volatilized arsenic. During gas cleaning, the arsenic ends
up in electrostatic precipitator (ESP) dust and also into the H2SO4 solutions that circulate in wet
gas scrubbers. Use of relatively concentrated H2SO4 in washing towers is encouraged by the high
solubility of arsenic in H2SO4 [2]. Most of the ESP dust is circulated back to the smelter for a more
complete recovery of raw materials but a fraction of the dust is leached with H2SO4 to prevent
accumulation of impurities in the copper refining process [3–6]. The origins of arsenic-
contaminated H2SO4 solutions are summarized in Fig. 1, which is simplified from the publications
by Szymanowski (1998) [1], Dalewski (1999) [2] and Nazari et al. (2017) [3]. It should be noted
that potential sources of arsenic-contaminated acids are not limited to copper refineries.

2
Wet scrubbing
Flue gas
Cleaned gas
Copper smelter
Copper electrolysis
H2SO4
Evaporative crystallization of NiSO4
Electrolytebleed
ESPFlue gas
ESP dust
H2SO4 leaching
H2SO4 circulation
H2SO4
H2SO4 + As
Solid-liquid separation
H2SO4 + As
Crude NiSO4
b)
a)
Figure 1 Schematic diagrams of the formation of arsenic-bearing concentrated H2SO4solutions in copper refineries. a) Copper electrolyte bleed [1] b) Flue gas treatmentin a copper smelter [2,6].
Arsenic was recently listed in the ‘Final List of Critical Minerals 2018’ by the US Department of
the Interior (DOI) [7]. To promote a circular economy, the recovery of arsenic as a product should
be considered instead of precipitating arsenic as impure arsenites or arsenates. Concentrated H2SO4
solutions, in particular, offer the possibility for producing H2SO4 intermediate with significantly
less or no arsenic and an arsenic-rich aqueous stream that is suitable for crystallization of As2O3.
The applicability of liquid-liquid extraction (LLE) for removal of arsenic from H2SO4 solutions
has been examined by several authors (Table I). In purification of copper electrolytes, an arsenic
extraction process can be located: 1) directly after copper electrolysis; 2) after decopperizing
treatment for the bleed (e.g. liberator electrolysis); or 3) after evaporation crystallization of crude
NiSO4. If the extraction is done before evaporation, the size of the required extraction equipment

3
will be larger than if the extraction is done after evaporation. On the other hand, highly
concentrated H2SO4 solutions demand more corrosion-resistant materials [15].
Table I Literature on liquid-liquid extraction of arsenic from H2SO4 solutions.
Extractant(s) [As]0[g dm 3]
[Ni]0[g dm 3]
[Cu]0[g dm 3]
[H2SO4]0[g dm 3] Reference
Cyanex 301, 923, 925Hydroxamic acids2-ethylhexane-1,3-diol
2.5 – – 50–200 [8,9]
Cyanex 923 0.63–5 – – 50–200 [10,11]DBBP+D2EHPA 3–7.6 4.6–8.4 30–31.3 160–200 [12]TBP 28 34.7 16.6 600 [13]TBP 10 16 65 200–600 [14]TBP 15 0.4 8.7 200–600 [15]TBP, D2EHPA, TAPO,HBPTA, D2EHMP 6.2 21.7 42.3 < 400 [16]
HBPTA, TBP 4–5 – – 300 [17]Aliphatic alcohols 6–10.5 6–10 40–50 150–300 [18,19]Alkylated polyphenols 5.9 – 45 200 [20,21]NMPL 0.075 – – 137–196 [22]Trioctylphosphine oxide 2.3 18 28.3 187.2 [23]Hydroxamic acids 10.4–21.5 9.6–21.5 32–54.3 153–225 [24,25]Mixtures of NOPCs andaliphatic alcohols 90–120 – 30 110–145 [26]
NOPCs, mainly TBP 3.9–11.5 12.3–14.5 8.7–33.1 100–400 [27]TBP, DBBP, DPPP, TAPOs 1.4–15.5 – 35–45 140–220 [28,29]D2EHMP = bis(2-ethylhexyl) methylphosphonateDBBP = dibutyl butylphosphonateDPPP = dipentyl pentylphosphonateHBPTA = hexabutylphosphoric triamideNMPL = 1-(2,6-dimethylheptyl-4-oxy)-3 methyl-1-oxo- 3-phospholenNOPC = neutral organophosphorus compoundTAPO = trialkylphosphine oxide
In previous research, most authors have focused on extracting arsenic from non-concentrated
copper electrolyte bleeds (Table I). Published results for pre-concentrated copper electrolytes are
limited to work reported by De Schepper & Van Peteghem [13] and Navarro & Alguacil [14].

4
Demirkiran & Rice [15] studied extraction at 600 g dm 3 H2SO4 feed concentration with synthetic
solutions but countercurrent results were reported for non-concentrated copper electrolyte.
Concentrating the solution before extraction to H2SO4 levels higher than 6 M aims to reduce
equipment size further, yield high concentration of arsenic in the stripping raffinate, and enable
small volumetric throughput of water and tributyl phosphate (TBP) in the extraction process.
Precise mechanisms and stoichiometry of solvation in extraction of arsenic are not very well
known. Travkin et al. [16] have described the extraction of arsenic(V) with Eq. (1)
H AsO + H O + S H AsO H O S + ( )H O (1)
where S denotes an extractant molecule, and n, h, h0 and q are stoichiometric constants that depend
on the reaction conditions and extractant. When the feed solution contains H2SO4, it is co-extracted
and associated in the complex [16]. TBP is known to extract only arsenic(V) in significant amounts
[30] but alcohols and glycols extract also arsenic(III) [1, 18–21]. D(As) is known to decrease with
several solvating extractants when temperature is increased [16].
It is generally agreed that increasing H2SO4 concentration in the feed enhances the extraction of
arsenic [1, 8–12, 14–17, 27]. Also, the more H2SO4 in the feed, the more aggressive becomes the
co-extraction of H2SO4. Co-extraction of H2SO4 and water causes expansion of the organic phase
and simultaneous shrinkage of the aqueous phase, i.e. phase ratio changes during extraction. This
phenomenon is not significant in extractions with 2–3 M H2SO4 solutions, since the absolute
amount of co-extracted H2SO4 and water are relatively low. Another limitation caused by very
high H2SO4 concentration in the feed is that neutral organophosphorus compounds (NOPCs) must
be used without kerosene-based diluents. Otherwise the system will split into three phases. Third
phase formation was also experimentally verified in current study.
To the best of our knowledge, results on extraction of arsenic from extremely concentrated (i.e.
10 M or higher) H2SO4 solutions have not been published previously and comparisons of TBP and
aliphatic alcohols in extraction of arsenic from the same feed solution are missing. Moreover, the
performance of alcohols has been reported only for the non-concentrated H2SO4 solutions, perhaps

5
due to their reactivity. According to speciation calculations by MEDUSA [31], the fraction of
H3AsO4 in aqueous H2SO4 solution is sensitive to changes in redox-potential (see section 3,
Fig. 10). Design methods and process parameters that are suitable for non-concentrated copper
electrolytes are not necessarily applicable with highly concentrated H2SO4 solutions.
Inconsistencies between McCabe–Thiele analyses and batch countercurrent simulations were
reported already at 2 mol dm 3 H2SO4 [15]. Process design by McCabe–Thiele or Hunter–Nash
methods is challenging, since the apparent D(As) values change with the speciation.
In this work, the separation of arsenic and H2SO4 from an industrial 10 M H2SO4 solution using
undiluted TBP is studied. A flowsheet involving countercurrent extraction, H2SO4 scrubbing and
arsenic stripping steps [13] is investigated by pseudo-countercurrent (pseudo-cc) method [32,33].
Pseudo-cc results are compared with the conventional McCabe-Thiele or Hunter-Nash –type
graphical designs that utilize conventionally determined equilibrium curves. Differences in
performance of TBP and the mixture of 1,2-octanediol and 2-ethylhexanol are discussed.
2 Experimental
Two shipments of 10.4 M H2SO4 solution were received from industry for the extraction studies.
Compositions of these acid batches are given in Table II, and theoretical speciation analysis is
shown in Fig. 2, where speciation at log([H+]tot) 1.3 should approximately represent the feed
solution. Only arsenic and nickel were considered in speciation calculation in Fig. 2, and the metals
at ppm-levels were neglected. Ionic strength was approximated iteratively in all speciation
calculations.

6
Table II Compositions of the feed solutions.
Shipment #1 Shipment #2
c(H2SO4) [g dm 3] 1022.2 963.3c(As) [g dm 3] 23.9 32.5c(As3+) [%] 9.2 7.1c(Ni) [g dm 3] 2.1 2.6c(Cu) [ppm] 2.5 18.9c(Zn) [ppm] 0.8 < LODc(Cd) [ppm] < LOD 0.1c(Sb) [ppm] 117.3 187.0c(Hg) [ppm] 0.7 2.0c(Pb) [ppm] 1.1 2.0c(Bi) [ppm] 4.9 43.3LOD = Limit of detection
Figure 2 Effect of proton concentration on speciation of: a) arsenic and H2SO4; and b) nickelin the feed solution. Constructed with MEDUSA [31] using following parameters:c(SO4 )tot = 10 M, c(Ni2+)tot = 0.036 M, c(AsO4 )tot = 0.32 M, Eh = +0.71 V andT = 25 °C.
2.1 Chemicals
97 % tributyl phosphate (TBP) (M = 266.31 g mol 1), 90 % dibutyl butyl phosphonate (DBBP)
(M = 250.31 g mol 1), 99 % 2-ethyl-1-hexanol (M = 130.23 g mol 1) and 98 % 1,2-octanediol
(M = 146.23 g mol 1) were obtained from Merck KGaA (Sigma-Aldrich). A commercial mixture
of trialkylphosphine oxides (Cyanex 923) containing mainly n-octyl- and n-hexyl hydrocarbon

7
chains was supplied by Cytec (now Solvay). Aliphatic hydrocarbon mixture Exxsol D80 (supplied
by Exxon Mobil) was used in preliminary tests with the NOPCs. All chemicals were used as
received.
Dilution of TBP, DBBP and Cyanex 923 in Exxsol D80 resulted in third phase formation when
extraction from 10.4 M H2SO4 solution was attempted. After the observed problem of third phase
formations with diluted NOPCs, 97 vol-% TBP was used in the experiments without dilution and
it is referred to as undiluted TBP in this text. Cyanex 923 was too viscous in room temperature
(21 ± 1 °C) to be used without dilution, and DBBP was not available in sufficient quantities. 6 wt-
% solution of 1,2-octanediol in 2-ethylhexanol was prepared for the experiments. The composition
of the alcohol mixture was based on works by Baradel & Guerriero [19] and Szymanowski [1].
Deionized and RO-filtered water was used for back-extractions from the loaded extractants.
2.2 Analytical methods
Total concentration of arsenic and metal concentrations were measured from aqueous samples
using ICP-MS (Agilent 7900). Samples from the organic phases were back-extracted with pure
water at A/O = 30, and concentrations in the back-extraction raffinates were measured to obtain
the organic phase equilibrium concentrations. As(III) concentrations in the feed solution were
analyzed in an external accredited laboratory. H2SO4 concentrations in raffinate samples were
determined by acid-base titration with NaOH, and concentrations of H2SO4 in the organic phases
were calculated from mass balance. Parallel determination of total sulfur with ICP-MS was in good
agreement with mass balance calculations in conventional batch extraction experiments.
Deviations between the determination by NaOH-titration and ICP-MS analysis were found for
samples from scrubbing and stripping experiments. Simultaneous neutralization of H3AsO4
became significant as acidity was adequately low in these samples, which affected NaOH
consumption in titration. Therefore, ICP-MS data was used in calculation of the pseudo-
countercurrent results. Phase densities were measured at 23 °C using an Anton Paar DMA4500
density meter. A Mettler-Toledo LE-150 ORP Ag/AgCl electrode was used for redox potential
measurements.

8
2.3 Experiments
All extraction experiments were performed in glass separation funnels at 21 ± 1 °C. Phases were
mixed by using an orbital shaker. Equilibration time of 20 minutes and shaking rate of 300 min 1
were used. The phases were separated by gravity and samples were taken after both phases were
considered clear by visual observation. As phase separation problems occurred in certain
experiments with the alcohol mixture, phase disengagement was aided by centrifugation for 10
minutes at 4000 min 1. Loading and stripping isotherms were determined by carrying out several
batch extractions with different O/A ratios. In order to quantify the change in phase weights and
volumes, separation funnels were weighed before and after each addition or removal of a phase.
2.3.1 Pseudo-countercurrent extractions
Separation of arsenic and sulfuric acid in countercurrent liquid-liquid extraction cascades was
experimentally studied by batch extractions according to a pseudo-countercurrent (pseudo-cc)
scheme (Fig. 3) described by Haghighi et al. [32]. After several consecutive cycles, the system
approaches conditions similar to an actual countercurrent cascade (Fig. 4). Blocks in Fig. 3
represent one batch extraction experiment, and approach to the steady state was monitored by
analyzing the cascade outlet streams as reported by Matveev et al. (2018) [34]. Steady-state was
assumed when concentrations in the outlet streams, i.e. E1,n and R3,n in Fig. 3, remained constant
in consecutive cycles. Table III summarizes the pseudo-cc extractions done in this work.
Table III Pseudo-countercurrent extractions.
Run 1 Run 2 Run 3 Run 4 Run 5O/A 0.8 4 0.5 2 2Type extraction scrubbing stripping stripping strippingStages 3 2 2 2 4Cycles 9 6 6 6 13Extractions 24 11 11 11 46

9
Figure 3 Pseudo-countercurrent scheme for three extraction stages. n is the number ofcycles. E = extract, F = feed, R = raffinate, and S = solvent.

10
Figure 4 Schematic diagram of continuous three-stage countercurrent extraction.E = extract, F = feed, R = raffinate, S = solvent.
3 Results and discussion
Speciation calculations (Fig. 5) showed that fractions of H3AsO4, As(OH)3 and As(OH)2+ in
concentrated H2SO4 solutions are sensitive to changes in redox potential. The fraction of
extractable H3AsO4 should remain high also in very concentrated H2SO4 providing that the redox
potential of the solution is +0.65 V or above (Fig. 5a). The fraction of H2AsO4 in mildly acidic
solutions seems to be unaffected by changes in redox potential (Fig. 5d). The same observation
was made for HAsO4 (plot not shown).

11
Figure 5 Effect of redox potential, Eh, on speciation of arsenic in H2SO4 solutions at 25 °C.Calculated with MEDUSA [31] using iterated ionic strength;c(AsO4 )tot = 0.31 M; c(SO4 )tot = 10 M.
3.1 Extraction of arsenic and H2SO4
97 vol-% TBP and the mixture of 6 wt-% 1,2-octanediol in 2-ethylhexanol behaved quite similarly
in extraction (Table IV, Fig. 6). Percentages of arsenic and H2SO4 extracted by TBP and the
alcohol mixture were practically the same for both extractants (Fig. 7). However, 22.5 g dm 3 peak
loading concentration of arsenic in the alcohol mixture is slightly lower than the 26.4 g dm 3
measured for TBP (Fig. 6).
Mass balance calculations showed a 1:2:1 ratio of H2SO4:H2O:TBP in the loaded organic phase,
when c(H2SO4)org was 200–300 g dm 3. When c(H2SO4)org decreased below 15 g dm 3 in
stripping, the stoichiometric ratio H2O:TBP was 7:1. Respectively, H2O:alcohol ratio was 1:1
12
when there was 200–370 g dm 3 H2SO4 in the loaded alcohol phase, but H2SO4:alcohol ratio varied
between 0.4–0.9. Loading isotherms for H2SO4 (Fig. 6b) are linear, and the slopes of the isotherms
are quite similar to those reported by Gromov et al. for 2-ethyl-1-hexanol [35].
Arsenic was more selectively extracted by TBP at O/A between 0.1–1, whereas at O/A ratios 2
and 3.5 the alcohol mixture was more selective to arsenic. D(As) of approximately 2.7 published
by Navarro & Alguacil [14] is probably the highest reported for undiluted TBP. It was obtained
with a feed containing 18 g dm 3 arsenic and 600 g dm 3 H2SO4 [14]. Typical D(As) values for
TBP have ranged between 0.4–1.7 for feed solutions with 1–3 M H2SO4 [14–17, 29]. For 10.4 M
H2SO4 solution containing 23.9 g dm 3 arsenic, the highest D(As) in the current experiments was
1.31 (Table IV). The probable reason for lower D(As) compared with Navarro’s & Alguacil’s [14]
results is that the feed in current study contained higher amount of undissociated H2SO4 (Fig. 2a).
The higher amount of undissociated H2SO4 makes competition between H2SO4 and H3AsO4 more
aggressive. Together with possible differences in redox potential, the greater amount of
undissociated H2SO4 explains the lower D(As) in the current study (Fig. 5).
D(As) values of aliphatic alcohols are available in the literature only for 150–200 g dm 3 H2SO4
solutions [1,8,21]. Iberhan & Wísniewski [8] published a D(As(V)) value of approximately 0.4 for
2-ethylhexane-1,3-diol with 150 g dm 3 H2SO4. In the current study D(As) ranged from 0.9 to 1.5
for 6 wt-% 1,2-octanediol in 2-ethylhexanol. As with TBP, the overall distribution coefficients of
arsenic are very dependent on the feed composition.

13
Table IV Comparison of TBP and alcohol mixture in extraction of arsenic and H2SO4 fromfeed solution containing 23.9 g dm 3 of arsenic and 1022.2 g dm 3 of H2SO4.
O/ATBP 6 wt-% 1,2-octanediol in
2-ethylhexanol
D(As) D(H2SO4) ß(As/H2SO4) D(As) D(H2SO4) ß(As/H2SO4)0.1 1.22 0.34 3.54 1.01 0.37 2.74
0.125 1.27 0.36 3.50 1.07 0.38 2.790.25 1.24 0.34 3.68 1.02 0.37 2.720.5 1.28 0.33 3.92 1.03 0.36 2.880.8 1.31 0.32 4.07 0.93 0.35 2.641 1.22 0.31 3.92 1.14 0.35 3.262 1.04 0.30 3.41 1.31 0.31 4.20
3.5 0.74 0.30 2.46 1.52 0.29 5.19ß(As/H2SO4) = D(As)/D(H2SO4)
Figure 6 Loading isotherms for extraction of arsenic (a) and H2SO4 (b) from feed solutioncontaining 23.9 g dm 3 arsenic and 1022.2 g dm 3 H2SO4. Undiluted TBP(circles), undiluted TBP in pseudo-cc extraction (filled squares), 6 wt-% 1,2-octanediol in 2-ethylhexanol (crosses), undiluted TBP & 600 g dm 3 H2SO4 in thefeed [14] (hollow squares), 2-ethylhexanol [35] (triangles).
0
5
10
15
20
25
30
0 5 10 15 20 25
c(As
) org
[gdm
3 ]
c(As)aq [g dm 3]
a
0
100
200
300
400
500
0 250 500 750 1000 1250
c(H 2
SO4) o
rg[g
dm3 ]
c(H2SO4)aq [g dm 3]
b
14
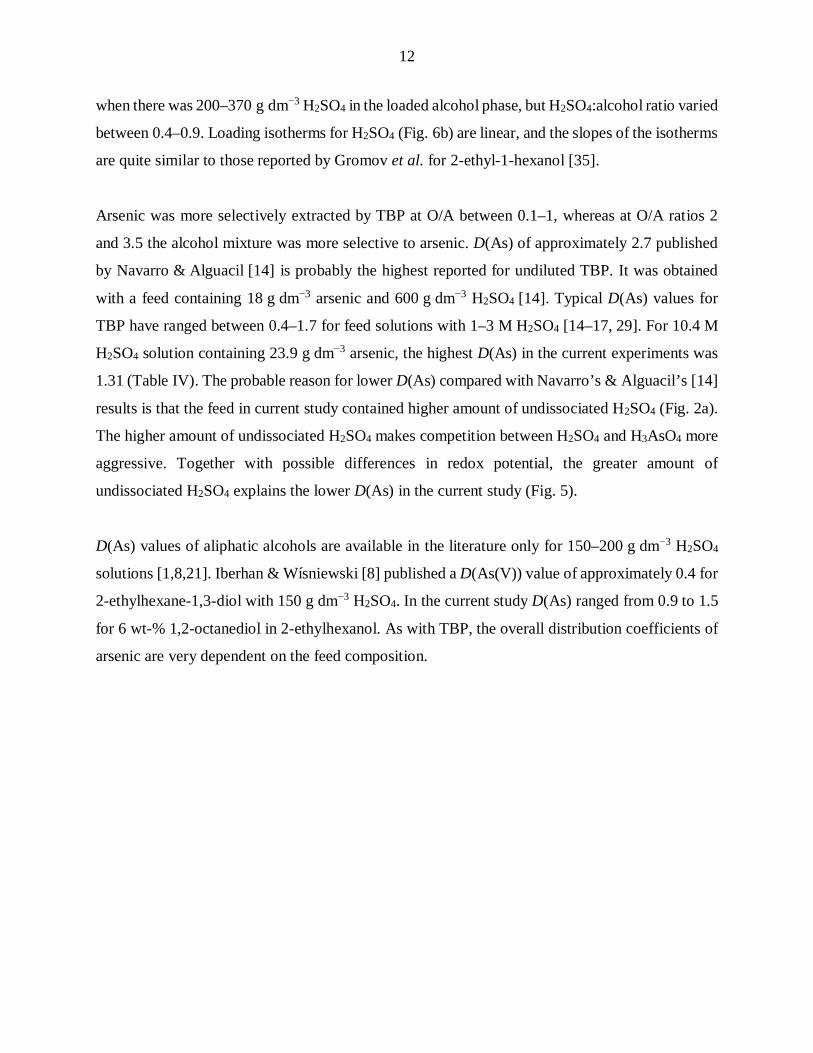
Figure 7 Percentages of arsenic and H2SO4 extracted from feed solution containing23.9 g dm 3 of arsenic and 1022.2 g dm 3 of H2SO4: a) 97 vol-% TBP; b) 6 wt-%1,2-octanediol in 2-ethylhexanol.
3.1.1 Phase behavior
Change in phase ratio, (O/A), with alcohol mixture at initial O/A ratios between 0.1–1.5 is
slightly more extensive than (O/A) for TBP (Fig. 8a). The more extensive (O/A) can explain
the slightly more gradual loading isotherm (Fig. 6a). Because of the changes in phase ratios,
percentages of extraction are not precisely deducible from distribution coefficients alone.
The feed acid became completely miscible with TBP at initial O/A = 6.5. With complete or near-
complete uptake of feed acid into the organic phase there would be little or no raffinate stream
coming from the extraction stages. Therefore, O/A ratios above 4 were not tested with the alcohol
mixture after miscibility observations with TBP. In general, phase behavior at room temperature
favors the use of TBP. Samples from backextraction analyses (A/O = 30) of the alcohol mixture
had to be centrifuged, since the backextracted samples were still hazy four days after shaking. In
the case of TBP, backextracted organic samples were separated by gravity and no centrifugation
was required. Baradel et al. [20] reported that raising the temperature provides faster phase
separation, which could improve phase behavior of the alcohol mixture. On the other hand,
increasing the temperature would also increase the reactivity of the alcohols (see section 3.2.1).

15
Figure 8 Changes in O/A ratios in extraction (a) and scrubbing (b) of arsenic and H2SO4from feed solution Shipment #1. 97 vol-% TBP (circles), 6 wt-% 1,2-octanediol in2-ethylhexanol (crosses). Dash-dot line represents constant phase ratio.
3.1.2 Extraction performance in countercurrent operation
McCabe–Thiele interpolation with linear operating lines has been used by several authors
[11, 14, 15] in evaluation and development of LLE flowsheets for separating arsenic and H2SO4
from dilute to moderately concentrated H2SO4. The requirement for a linear operating line would
be that O/A ratios remain constant between the stages and no speciation changes take place in the
system [36]. Demirkiran & Rice [15] have already reported inconsistencies between McCabe–
Thiele constructions and experimental results. Therefore, pseudo-cc extractions by TBP were used
to study the distributions in countercurrent cascades. Due to the unpredictable phase behavior of
1,2-octanediol and 2-ethylhexanol in back-extraction and better phase separation observed with
TBP, the alcohol mixture was not investigated by pseudo-cc method.
Three stages with O/A = 0.8 (higher ß(As/H2SO4) for TBP, see Table IV) was selected to study
countercurrent extraction, since 95 % extraction of arsenic with three countercurrent extraction
stages operating at O/A = 1.17 was reported earlier by Navarro & Alguacil [14]. Even such a low
number of stages is enough to reveal possible curvature in an operating line. Initial O/A = 0.8
produced an equilibrium O/A of 1.38 in conventional batch experiments (Fig. 8a), and thus using
O/A = 0.8 does not lower the volume of the raffinate too much.
yTBP = 0,82x3 - 1,63x2 + 2,87x - 0,22R² = 1,00
yALC = 0,94x2 + 1,02x + 0,08R² = 1,00
0
5
10
15
20
25
30
0 1 2 3 4
(O/A
) eq
(O/A)0
a
yALC = 0,51x + 1,59R² = 1,00
yTBP = 0,61x + 0,19R² = 1,00
0
1
2
3
4
5
6
7
0 2 4 6 8 10
(O/A
) eq
(O/A)0
b

16
Concentration profiles for arsenic and H2SO4 in three-stage pseudo-cc extraction are given in
Table V and Fig. 9b. In Table V the feed solution entered at stage 1, and TBP at stage 3,
respectively. V0 values indicate the initial phase volumes of the stages and Vt is used to describe
the volumes at equilibrium. 83.7 % of the arsenic and 31.4 % of the H2SO4 were extracted at
O/A = 0.79. The percentage of arsenic extracted is somewhat lower than reported in [14] for
O/A = 1.17. Arsenic is significantly extracted in all stages, but the concentration profiles of the
cascade show that most of the H2SO4 extraction occurs in stage 3 where TBP is fed (Table V).
Additional extraction stages should therefore enhance the separation and increase E(As), since
cumulative E(H2SO4) remains practically constant in the stages that follow the TBP feeding stage.
Enhancement in separation is seen also from the increase in ß(As/H2SO4) and D(As) from stage 3
to stage 1. After three-stage extraction, TBP contained 19.24 g dm 3 arsenic and 292 g dm 3
H2SO4. Respectively, the raffinate composition was 5.14 g dm 3 arsenic and 905 g dm 3 H2SO4.
Table V Results of three-stage pseudo-cc extraction. The feed solution contained23.9 g dm 3 arsenic and 1022.2 g dm 3 H2SO4. O/A = 0.79 (in); E/R = 1.43 (out).
Stage 1 2 3
V0,aq [cm3] 124.7 121.8 111.5
V0,org [cm3] 124.7 125.3 99.0
V0,tot [cm3] 249.5 244.8 213.6O/A 1.00 1.03 0.89Vt,aq [cm3] 123.6 118.2 87.6
Vt,org [cm3] 125.7 129.0 121.3
Vt,tot [cm3] 249.6 245.2 214.3E/R 1.02 1.09 1.38D(As) 1.31 1.20 0.93D(H2SO4) 0.29 0.29 0.28
ß(As/H2SO4) 4.56 4.09 3.31c(As)aq [g dm 3] 14.65 9.26 5.14c(As)org [g dm 3] 19.24 11.14 4.78c(H2SO4)aq [g dm 3] 1015.0 994.4 904.9c(H2SO4)org [g dm 3] 292.1 292.9 254.2

17
Simplified McCabe–Thiele analysis suggests that five stages are required to extract 83.7 % of the
arsenic at O/A = 0.79 (Fig. 9a). The pseudo-cc steady-state compositions indicate that such
extraction results could be achieved in only three countercurrent stages (Fig. 9b). The McCabe–
Thiele analysis in Fig. 9a was constructed by utilizing conventional batch experiment data and
assuming constant phase ratio. The percentage of extraction was set to 83.7 %, which was achieved
in real pseudo-cc experiments. There were probably no significant changes in the aqueous
speciation during extraction, as the equilibrium line remained fixed in the pseudo-cc experiments
(Fig. 6a and Fig. 9). Theoretical McCabe–Thiele diagram (Fig. 9a) predicted a higher number of
stages because curvature in the operating line was not considered.
Figure 9 Comparison of theoretical McCabe-Thiele analysis (a) with the experimentalresults (b). O/A = 0.79 and 83.7 % removal of arsenic. c0(As)aq = 23.9 g dm 3 andc0(As)org = 0.
3.2 Back-extraction
Separation of arsenic and H2SO4 in back-extraction is based on the different strength of the acids.
As a stronger acid H2SO4 dissociates at higher proton concentration than H3AsO4 (Fig. 10).
Protons and anions which are formed by dissociation have much stronger affinity to water, and
they are back-extracted more aggressively than the undissociated acids. According to theoretical
calculations (Fig. 10), the first dissociation of H3AsO4 starts approximately when log([H+]) = 0.5
in the raffinate. At this proton concentration there is no undissociated H2SO4 in the aqueous
solution.
0
5
10
15
20
25
30
0 5 10 15 20 25 30
c(As
) org
[gdm
3 ]
c(As)aq [g dm 3]
a
0
5
10
15
20
25
30
0 5 10 15 20 25 30
c(As
) org
[gdm
3 ]
c(As)aq [g dm 3]
b

18
Theoretically it would be favorable to increase O/A ratio stage by stage in H2SO4 scrubbing so that
0.5 log([H+]) 1 in the back-extraction raffinates. This type of fractional extraction could be
attempted to separate the acids completely. If the fractional extraction approach turns out to be
non-feasible in practice, at least bulk separation can be done by solvent extraction to produce a
relatively low volume of arsenic-rich solution whose total concentration of SO4 is significantly
lower. It can be concluded from Fig. 5a and Fig. 10 that co-extraction of H2SO4 does not lower the
separation efficiency as long as the redox potential is sufficiently high in the initial feed solution.
Figure 10 Effect of proton concentration on speciation of H3AsO4 and H2SO4. Calculated byMEDUSA [31]. Input parameters for MEDUSA are the same as were measured forstripping raffinate in the pseudo-cc experiments (section 3.2.2): Eh = +649 mV;c(AsO4 )tot = 0.536 M; c(SO4 )tot = 0.653 M; T = 25 °C; iterated ionic strength.
3.2.1 Scrubbing
Organic phases were prepared for the batch scrubbing experiments by loading both extractants
with the feed solution from Shipment #1 at O/A = 0.1. Water scrubbing of loaded TBP exhibited

19
very similar behavior to that reported by Navarro & Alguacil [14]. 17.2 % of arsenic and 59.3 %
of H2SO4 were back-extracted at O/A = 3.77 (Fig. 11). Selectivity towards H2SO4 with O/A 4
and above was maintained in consecutive scrubbing treatment. Back-extraction with water is more
selective to H2SO4 until the acidity of the system gets sufficiently low (Fig. 10). Separation of
arsenic and H2SO4 by TBP is clearly better than by the mixture of 1,2-octanediol and 2-
ethylhexanol. Moreover, phase separation times were longer for the alcohol mixture.
Another issue with using the mixture of 1,2-octanediol in 2-ethylhexanol is the reactivity of the
alcohols. Etherification of 2-ethylhexanol is likely to occur, especially at slightly elevated
temperatures [37]. The redox potential of the feed solution was approximately +710 mV vs. SHE
at +21 °C and it is questionable whether the oxidation reactions of alcohols are negligible under
such conditions. Coupled with possible reactions of the diol, the resulting mixture has practically
an unknown composition. The reaction products themselves probably have extractive properties
but their mutual solubilities with water are likely different compared with the original alcohol
constituents [38]. Water-miscible reaction products would explain the observed difficulties in
back-extraction of the organic samples (section 3.1.1).
Figure 11 Back-extraction percentages in scrubbing of the loaded extractants. a) 97 vol-%TBP with 25.3 g dm 3 arsenic and 330 g dm 3 H2SO4. b) 6 wt-% 1,2-octanediol in2-ethylhexanol with 21.9 g dm 3 arsenic and 390 g dm 3 H2SO4.
In scrubbing of the loaded TBP, O/A ratios decreased as expected, due to back-extraction of
H2SO4 (Fig. 8b). However, in scrubbing of the loaded alcohol mixture with initial O/A ratios of 1

20
and 2, the O/A ratios increased, suggesting that some H2O was still extracted to the organic phase.
The scrubbing raffinates were quite concentrated H2SO4 solutions up to 750 g dm 3 but they also
contained significant amounts of arsenic, especially the raffinates from scrubbing of the alcohol
mixture (Table VI). Scrubbing raffinates can be recycled back to extraction stages.
As the literature [1,8,15,16] suggests, if the As(V) species are predominant and in an extractable
form of H3AsO4 in the solution, arsenic can be extracted to the organic phase with co-extraction
of H2SO4. More complete separation can be achieved in subsequent scrubbing and stripping stages
(Fig. 10). However, if extraction is performed from H2SO4 solutions in which As(III) species are
dominant, in principle H2SO4 should be more selectively extracted by TBP. SO2 absorption can be
used to reduce As(V) species to As(III) [1,15,27], which is what happens in certain types of gas
scrubbing.
Table VI Distribution of arsenic and H2SO4 in water scrubbing of loaded TBP (25.3 g dm 3
arsenic and 330 g dm 3 H2SO4) and a mixture of 1,2-octanediol and 2-ethylhexanol (21.9 g dm 3 arsenic and 390 g dm 3 H2SO4).
O/ATBP 6 wt-% 1,2-octanediol in 2-ethylhexanol
[As]aq
[g dm 3][As]org
[g dm 3][H2SO4]aq
[g dm 3][H2SO4]org
[g dm 3][As]aq
[g dm 3][As]org
[g dm 3][H2SO4]aq
[g dm 3][H2SO4]org
[g dm 3]1 13.08 12.2 253.7 43.8 19.3 6.6 196.8 174.92 12.58 20.0 393.5 88.8 29.8 8.3 331.8 204.74 12.38 23.4 555.3 150.3 33.3 13.2 521.0 231.48 13.81 24.4 710.3 209.4 28.5 17.9 688.0 260.810 14.71 24.5 752.4 224.4 27.3 18.8 730.8 270.7
TBP was loaded for the pseudo-cc scrubbing and stripping experiments by contacting it with the
feed acid from Shipment #2 at O/A = 0.1. TBP prepared in this way contained initially 35.3 g dm 3
of arsenic and 284.2 g dm 3 of H2SO4 (Table VII). Two-stage scrubbing with an O/A ratio of 4.03
back-extracted 24.9 % of arsenic and 83.6 % of H2SO4. Concentrations in the scrubbed TBP were
30.5 g dm 3 and 53.5 g dm 3 for arsenic and H2SO4, respectively. The composition of the scrubbed
TBP is promising for producing an arsenic-rich stripping raffinate, although the scrubbing could
be optimized further. The addition of a third scrubbing stage would enhance the separation. With
three scrubbing stages, there could also be room for increasing the O/A while maintaining near-
complete scrubbing of H2SO4. In the two-stage scrubbing, the volume of the aqueous phase

21
expanded from 19.6 cm3 to 29.2 cm3, and it contained 21.6 g dm 3 of arsenic and 670.4 g dm 3 of
H2SO4. Increase in O/A would result in a smaller volume of more concentrated scrubbing raffinate,
which would make smaller change to the extraction stage feed when recycled.
3.2.2 Pseudo-countercurrent stripping of loaded and scrubbed TBP
The organic phase for the stripping experiments was prepared by scrubbing loaded TBP twice with
an aliquot of pure water equivalent to O/A = 4 in single contact. TBP produced by this method
contained 25 g dm-3 and 35 g dm 3 of arsenic and H2SO4, respectively.
Results from pseudo-cc back-extraction experiments are summarized in Table VII. 89.7 % of
arsenic was stripped in four countercurrent stages at O/A = 2, yielding a raffinate with 40 g dm 3
arsenic and 64 g dm 3 H2SO4. Total sulfur in stripped TBP was below the detection limit of the
back-extraction-ICP-MS determination (Table VII), and hence it was assumed that all H2SO4 was
stripped. Arsenic concentration in stripped TBP was 2.7 g dm 3.
Two-stage stripping with pure water is enough to back-extract arsenic almost completely (98.6 %)
at O/A = 0.5. The resulting stripping raffinate at O/A = 0.5 contained 11.7 g dm 3 of arsenic and
14.1 g dm 3 of H2SO4, whereas with O/A = 2 the concentrations in stripping raffinate were
32.3 g dm 3 and 66 g dm 3 for arsenic and H2SO4, respectively. However, with O/A = 2, back-
extraction of arsenic was lowered to 75 %. Complete stripping of arsenic requires either the
deployment of a sufficient number of stages or decreasing O/A, but a decrease in O/A dilutes the
raffinate.
Stripping efficiency and phase separation could be further improved by increasing temperature.
Travkin et al. [16] reported a significant decrease in D(As(V)) from over 0.9 at 20 °C to
approximately 0.4 at 65 °C. In this work, phase separation by gravity was successful in the
experiments at room temperature but overnight settling was required to get rid of haziness in the
aqueous phase. Instead of using pure water, dilute saline solution containing e.g. Na2SO4, Na2CO3
or dilute H2SO4 can be used for stripping to facilitate phase separation [1,15].

22
Table VII Results from pseudo-countercurrent back-extraction experiments.
Target Scrubbing Stripping Stripping Strippingc0(H2SO4)org [g dm 3] 284.2 35.0 35.0 35.0c0(As)org [g dm 3] 35.3 25.0 25.0 25.0O/A (in) 4.03 0.5 2.01 2.01E/R 2.33 0.45 1.87 1.83E(As) [%] 24.9 98.6 75.0 89.7E(H2SO4) [%] 83.6 100 99.6 100Stage 1 2 1 2 1 2 1 2 3 4
V0,aq [cm3] 19.6 24.4 99.7 97.5 29.6 30.6 29.8 30.0 29.9 30.3
V0,org [cm3] 72.8 79.2 47.4 49.4 58.1 59.7 57.4 58.2 58.2 59.8
V0,tot [cm3] 92.4 103.6 147.0 146.9 87.7 90.3 87.1 88.1 88.1 90.1
O/A (stagewise) 3.71 3.24 0.48 0.51 1.96 1.95 1.93 1.94 1.95 1.98
Veq,aq [cm3] 24.1 29.2 97.5 103.9 30.1 31.6 30.2 30.4 30.2 31.2
Veq,org [cm3] 68.1 73.5 46.9 47.5 59.1 56.3 57.0 57.7 57.9 58.8
Veq,tot [cm3] 92.2 102.8 144.3 151.4 89.2 87.9 87.1 88.1 88.1 90.0
E/R (stagewise) 2.83 2.52 0.48 0.46 1.96 1.78 1.89 1.89 1.91 1.88
D(As) 1.31 1.64 0.21 0.34 0.37 0.57 0.27 0.35 0.43 0.58
D(H2SO4) 0.16 0.25 – – – – – – – 0.03
ß(As/H2SO4) 8.23 6.68 – – – – – – – 17.35
c(As)aq [g dm 3] 23.33 21.59 1.79 11.72 17.74 32.28 9.84 23.22 35.67 40.13
c(As)org [g dm 3] 30.47 35.43 0.37 4.03 6.51 18.42 2.68 8.20 15.18 23.19
c(H2SO4)aq [g dm 3] 337.2 670.4 < 1.7* 14.1 3.2 66.0 < 1.3* < 1.3* 3.1 64.0
c(H2SO4)org [g dm 3] 53.5 164.8 < 5* < 5* < 5* < 5* < 2* < 2* < 2* 2.1*Limit of detection

23
3.2.3 Comparison of batch equilibrium data with pseudo-countercurrent data
Concentration of arsenic peaked 29 g dm 3 in the conventional stripping isotherm, which was
determined by batch stripping by pure water and varying the O/A ratio (Fig. 12a). This stripping
isotherm did not reveal the possibility of producing an aqueous stripping raffinate with over
30 g dm 3 of arsenic. A linear operating line drawn on the basis of 89 % back-extraction for arsenic
and O/A = 2 intersects with both equilibrium lines. However, over-the-isotherm performance was
observed in four-stage stripping at O/A = 2 as both the isotherm and operating line relocated in the
c(As)aq vs. c(As)org plot. (Fig. 12c & Fig. 12d).
Two-dimensional graphical constructions (e.g. McCabe–Thiele and Hunter–Nash) based on the
measured c(As) values fail to describe the separation cascades accurately. The deviations are
highlighted especially at back-extraction stages, which can be explained by dissociation of H3AsO4
at low acidity (Fig. 10). Sharply decreasing D(As) in the back-extraction stages (Table VI) is in
agreement with this explanation.
No established model describes the chemical equilibria of the system, and thus rigorous mass
balance iterations are currently impossible. Furthermore, McCabe–Thiele and Hunter–Nash
diagrams or mass balance iterations as such provide only theoretical prediction and can only serve
as tools to give initial estimates for piloting studies. Pseudo-cc extraction provides information
also about the practical feasibility of a process, and the equilibrium compositions of the streams
can be experimentally verified. Drawbacks of the pseudo-cc method are that completing the
schemes requires a lot of manual labor and recycle streams are hard to embed in the design by
pseudo-cc method. The number of extractions increases rapidly when the number of countercurrent
stages increases and the schemes must be replicated in order to carry out sensitivity analyses for
process parameters. Despite these weaknesses it is a cost-effective intermediate design method for
continuous processes involving hazardous materials or processes that require instrumentation with
expensive materials.

24
Figure 12 Arsenic distributions in batch and pseudo-cc experiments: a) influence of H2SO4concentration on batch stripping isotherms; b) comparison of two-stage pseudo-ccequilibrium lines with batch isotherm; c) comparison of four-stage pseudo-ccequilibrium line with batch isotherm; d) McCabe–Thiele plot based on data fromfour-stage pseudo-cc stripping.
3.3 Process scheme
Pseudo-cc experiments showed that with certain adjustments and considerations, a similar
flowsheet to the one patented by De Schepper & Van Peteghem [13] is suitable also for treating
10 M H2SO4 solutions. Calculation of the flowsheet in Fig. 13 was based on percentages of
extraction and phase volume changes that were determined by pseudo-cc experiments. Recycling
of expanded TBP, scrubbing raffinate and stripping raffinate bleed was not taken into account.
Recycling water-containing stripped TBP and scrubbing raffinate back to extraction might lower
E(As) slightly. 261.4 liters per time unit less water would be required if scrubbing was carried out
by stripping raffinate. Use of stripping raffinate in scrubbing would also help with back-extraction

25
loss of arsenic during scrubbing. If only 5 % loss of arsenic is assumed in scrubbing, stripping
raffinate would contain 47.6 g dm 3 of arsenic, which is close to the 50 g dm 3 presented by
De Schepper & Van Peteghem [13]. However, the back-extraction percentage of H2SO4 would
then be lower in scrubbing and it would end in the stripping raffinate without a third scrubbing
stage. Treating 1000 l/t of feed acid with 790 l/t of undiluted TBP and 720 l/t of water yielded
737 l/t of raffinate with significantly lowered arsenic concentration, and 487 l/t of arsenic-rich
stripping raffinate. Flow rates of stripping raffinate, inlet water and feed acid will be reduced once
the recycle streams are connected.
Figure 13 Flowsheet for separating arsenic and H2SO4 as investigated by pseudo-countercurrent experiments.
Increasing O/A in extraction would provide higher E(As) assuming the same number of stages but
it would also decrease the throughput of the process and the c(H2SO4) in the raffinate, as the larger
amount of fed TBP would extract more H2SO4 and H2O. The throughput would be lower also
because higher volume of scrubbing liquor should be recycled to the extraction stages. If higher

26
loading of H2SO4 was compensated by decreasing O/A in scrubbing, the throughput of the process
would again be decreased due to increased circulation to the feed.
The solvent extraction circuit discussed here aims at bulk recovery of arsenic. Raffinates of the
process are classified as hazardous waste not only because of the arsenic but also because of other
heavy metals [39]. The environmental limits for heavy metals in aqueous waste in the European
Union are 0.15 ppm, 0.03 ppm and 0.2 ppm for arsenic, mercury and lead, respectively. For copper
and nickel the limit is 0.5 ppm [39].
TBP extracts arsenic and H2SO4 in significant amounts but partial extraction of mercury was also
noticeable in the ICP-MS results. The concentration of mercury was 4.5–8 ppm in the extracts,
and it was partially back-extracted in stripping, resulting in 2–3 ppm of mercury in the stripping
raffinate. Stripping raffinate requires further SO4 removal if As2O3 crystallization at high purity
is intended, and the mercury must be removed in possible plant operation. Raffinate from the
extraction stages could be re-used in applications where the impurities can be tolerated at the levels
found, e.g. in leaching.
4 Conclusions
Liquid-liquid extraction of arsenic and H2SO4 by undiluted TBP (97 vol-%) and mixture of 1,2-
octanediol and 2-ethylhexanol was investigated experimentally for treating a 10.4 M industrial
H2SO4 solution containing 32.5 g dm 3 arsenic. If neutral organophosphorus extractants are used,
they must be used in undiluted form for such concentrated H2SO4 to maintain the system in two
phases. Phase behavior of TBP was superior to the mixture of 1,2-octanediol and 2-ethylhexanol
in back-extraction of the loaded extractants at room temperature. Moreover, TBP offered better
separation of arsenic and H2SO4, and the difference in separation efficiency was highlighted in
scrubbing.
McCabe–Thiele analyses were shown to be inaccurate in design of liquid-liquid extraction
cascades for the system at hand. The Hunter–Nash method could predict H2SO4 transfer with
reasonable accuracy but the distribution of arsenic is more complicated to describe. Performances
27
of the countercurrent cascades were experimentally determined by a pseudo-countercurrent batch
extraction scheme. It was shown that significantly better performance can be achieved in the
stripping cascade than could be predicted from a stripping isotherm determined by conventional
methods, most probably due to significant changes in aqueous speciation.
A conventional solvent extraction flowsheet utilizing TBP can also be used for very concentrated
H2SO4 solutions. 83.7 % of arsenic was removed by undiluted TBP in three countercurrent stages
with a solvent-to-feed ratio of 0.79 from a 10.4 M (1022.2 g dm 3) H2SO4 solution containing
initially 23.9 g dm 3 arsenic. The results show that arsenic concentrations of 40–50 g dm 3 in the
stripping raffinate can be obtained with the proposed non-optimized flowsheet.
Acknowledgements
Russian-English translations given by Mr. Fedor Vasilyev and experimental assistance provided
by Mr. Tommi Huhtanen are gratefully acknowledged.
Funding: This work was supported by Business Finland and industrial partners of the Circular
Metal Ecosystems (CMEco) project consortium.
REFERENCES
[1] Szymanowski, J., Removal of toxic elements from copper electrolyte by solvent
extraction. Min. Proc. Ext. Met. Rev. 18 (1998), 389–418.
https://doi.org/10.1080/08827509808914162.
[2] Dalewski, F., Removing arsenic from copper smelter gases. JOM. 51:9 (1999), 24–26.
https://doi.org/10.1007/s11837-999-0153-0.
[3] Piret, N.L., Removal and safe disposal of arsenic in copper processing. JOM. 51:9
(1999), 16–17. https://doi.org/10.1007/s11837-999-0150-3.
[4] Riveros, P.A., Dutrizac, J.E., Spencer, P, Arsenic disposal practices in the metallurgical
industry. Can. Metall. Quart. 40 (2001), 395–420.
https://doi.org/10.1179/cmq.2001.40.4.395.
[5] Opio, F.K., 2013. Investigation of Fe(III)–As(III) phases and their potential for arsenic
28
disposal. Queen's University, Kingston, Canada.
[6] Nazari, A.M., Radzinski, R., Ghahreman, A., Review of arsenic metallurgy: Treatment of
arsenical minerals and immobilization of arsenic. Hydrometallurgy 174 (2017), 258–281.
https://doi.org/10.1016/j.hydromet.2016.10.011.
[7] US. Department of the Interior, Final List of Critical Minerals 2018.
https://www.federalregister.gov/documents/2018/05/18/2018-10667/final-list-of-critical-
minerals-2018, Accessed: 5 October 2018.
[8] Iberhan, L., Wi niewski, M., Removal of arsenic(III) and arsenic(V) from sulfuric acid
solution by liquid–liquid extraction, J. Chem. Technol. Biotechnol., 78 (2003) 659-665.
https://doi.org/10.1002/jctb.843.
[9] Iberhan, L., Wi niewski, M., Removal of arsenic(III) and arsenic(V) with Cyanex 925,
Cyanex 301 and their mixtures. Hydrometallurgy 63 (2002) 23–30.
https://doi.org/10.1016/S0304-386X(01)00198-0.
[10] Wi niewski, M., Extraction of arsenic from sulphuric acid solutions by Cyanex 923,
Hydrometallurgy 46 (1997) 235–241. https://doi.org/10.1016/S0304-386X(97)90003-7.
[11] Wi niewski, M., Removal of arsenic from sulphuric acid solutions. J. Radioanal. Nucl.
Chem. 228 (1998) 105–108. https://doi.org/10.1007/BF02387308.
[12] Ballinas, M. L., San Miguel, E. R., Muños, M., Gyves, J., Arsenic(V) extraction from
sulfuric acid media using DBBP-D2EHPA organic mixtures. Ind. Eng. Chem. Res. 42
(2003) 574–581. https://doi.org/10.1021/ie020402a.
[13] De Schepper, A., Van Peteghem, A., Treatment of solutions containing impure metals,
US Patent No. 4061564, December 6, 1977.
[14] Navarro, P., Alguacil, F. J., Removal of arsenic from copper electrolytes by solvent
extraction with tributylphosphate. Can. Metall. Quart. 35 (1996) 133–141.
https://doi.org/10.1016/0008-4433(95)00044-5.
[15] Dermirkiran, A., Rice, N.M., The extraction of arsenic (V) from copper refinery
electrolytes with tri-n-butyl phosphate: II – Flowsheet development, in: K. C. Sole,
P. M. Cole, J. S. Preston, D. J. Robinson (Eds.), Proceedings of the International Solvent
Extraction Conference, ISEC 2002, SAIMM, Johannesburg, 2002, 890–895.
[16] Travkin, V. F., Kravchenko, A. N., Miroevsky, G. P., Extraction of arsenic and antimony
from sulfate solutions with organophosphorus reagents, Tsvet. Met. 4 (1993) 14–18.

29
[17] Travkin, V.F., Glubokov, Y.M., Mironova, E.V., Yakshin, V.V., Extraction of arsenic(V)
with hexabutylphosphoric triamide, Russ. J. Appl. Chem. 74 (2001) 1664–1667.
https://doi.org/10.1023/A:1014801117889.
[18] Baradel, A., Guerriero, R., Meregalli, L., Vittadini, I., Extraction of As from from copper
refining electrolyte, JOM 38:32 (1986) 32–37. https://doi.org/10.1007/BF03257918.
[19] Baradel, A., Guerriero, R., Process for separating arsenic from acid solutions which
contain it, US Patent No. 4737350, April 12, 1988.
[20] Baradel, A., Guerriero, R., Meregalli, L., Vittadini, I., New extractant for arsenic
separation from industrial solutions, in ISEC ’86 International Solvent Extraction
Conference: Preprints, Volume II, Dechema, Frankfurt, 1986, 401–407.
[21] Baradel, A., Guerriero, R., Veronese, G., Process for separating arsenic from acid
solutions containing it, US Patent No. 4701311, October 20, 1987.
[22] Avila-Rodriguez, M., Barron-Zambrano, J.A., Navarro-Mendoza, R., Saucedo-
Medina, T.I., Thermodynamic study of liquid-liquid extraction of arsenic(V) by NMPL
from H2SO4 medium, Solvent Extr. Ion Exc. 19:3 (2001) 457–472.
https://doi.org/10.1081/SEI-100103280.
[23] Marr, R., Bart, H-J., Wachter, R., Method of removing arsenic from copper electrolyte,
US Patent No. 4503015, March 5, 1985.
[24] Schwab, W., Kehl, R., Common separation of contaminating elements from electrolyte
solutions of valuable metals, US Patent No. 4834951, May 30, 1989.
[25] Kehl, R., Schwab, W., Sudderth, R.B., Korkosky, G.A., Process for selective extraction
of contaminant elements from mixtures of electrolytes in solution, US Patent No.
5039496, August 13, 1991.
[26] Hiemeleers, J., De Schepper, A., Van Peteghem, A., Treatment of ores and metallic by-
products containing arsenic and antimony, US Patent No. 4102976, July 25, 1978.
[27] Totsuka, T., Sasaki, K., Nagai, K., Fundamental studies on purification of copper
electrolyte, Metallurgical Review MMIJ 3:2 (1986) 146–154.
[28] Dreisinger, D. B., Leong, B. J. Y., Balint, B. J., Beyad, M. H., The solvent extraction of
As, Sb and Bi from copper refining electrolytes using organophosphorus reagents, in
D. H. Logsdail, M. J. Slater (Eds.), Solvent Extraction in the Process Industries Volume 3

30
– Proceedings of ISEC ’93, Elsevier Science Publishers Ltd., Barking, 1993, pp. 1271–
1278.
[29] Dreisinger, D. B., Leong, B. J. Y., Saito, B. R., West-Sells, P. G., The solvent extraction
and ion-exchange removal of As, Sb and Bi from copper sulphate-sulphuric acid
solutions, in J. B. Hiskey, G. Warren (Eds.), Hydrometallurgy: Fundamentals,
Technology and Innovations, Society for Mining, Metallurgy and Exploration, 1993,
801–815.
[30] Giganov, G.P., Travkin, V.F., Ankina, N.P., Extraction of arsenic from acidic solutions
with tributylphosphate. Tsvet. Met. 8 (1978) 27–29.
[31] KTH, Kungliga Tekniska Högskolan, School of Chemical Science and Engineering,
MEDUSA, Chemical Equilibrium Diagrams, https://www.kth.se/che/medusa/, Updated:
26.04.2013, Accessed: 1 February 2019.
[32] Haghighi, H.K., Moradkhani, D, Salarirad, M.M., Separation of zinc from manganese,
magnesium, calcium and cadmium using batch countercurrent extraction simulation
followed by scrubbing and stripping, Hydrometallurgy 154 (2015) 9–16.
http://dx.doi.org/10.1016/j.hydromet.2015.03.007.
[33] Thornton, J.D. Science and practice of liquid-liquid extraction Vol. 1., Oxford University
Press, New York, 1992.
[34] Matveev, P.I., Petrov, V.G., Egorova, B.V., Senik, N.N., Semenkova, A.S.,
Dubovava, O.V., Valkov, A.V., Kalmkov, S.N., Solvent extraction of rare earth elements
by tri-n-butyl phosphate and tri-iso-amyl phosphate in the presence of Ca(NO3)2,
Hydrometallurgy 175 (2018) 218–223. https://doi.org/10.1016/j.hydromet.2017.12.007.
[35] Gromov, P.B., Kasikov, A.G., Shchelokova, E.A., Petrova, A.M., Regeneration of
sulfuric acid from electrolyte waste of the copper - smelting plant using solvent
extraction, Hydrometallurgy 175 (2018) 187–192.
https://doi.org/10.1016/j.hydromet.2017.11.008.
[36] Wankat, P.C., Separation Process Engineering, second ed., Prentice Hall, Westford, 2009.
[37] Hendrickson, J.B., Cram, D.J., Hammond, G.S., Organic Chemistry, third ed., McGraw-
Hill, New York, 1970.
[38] Kislik, V.S, Solvent Extraction – Classical and Novel Approaches, first ed., Elsevier,
Oxford, 2012.

31
[39] EUR-Lex, Directive 2010/75/EU of the European Parliament and of the Council of
24 November 2010 on industrial emissions (integrated pollution prevention and control),
https://eur-lex.europa.eu/eli/dir/2010/75/oj, Accessed: 1 February 2019.